Embed Size (px)
Citation preview
Chapter 14
MRP and ERPMRP and ERP
Pr du t Stru tur TrIndependent Demand(Chapter 12)
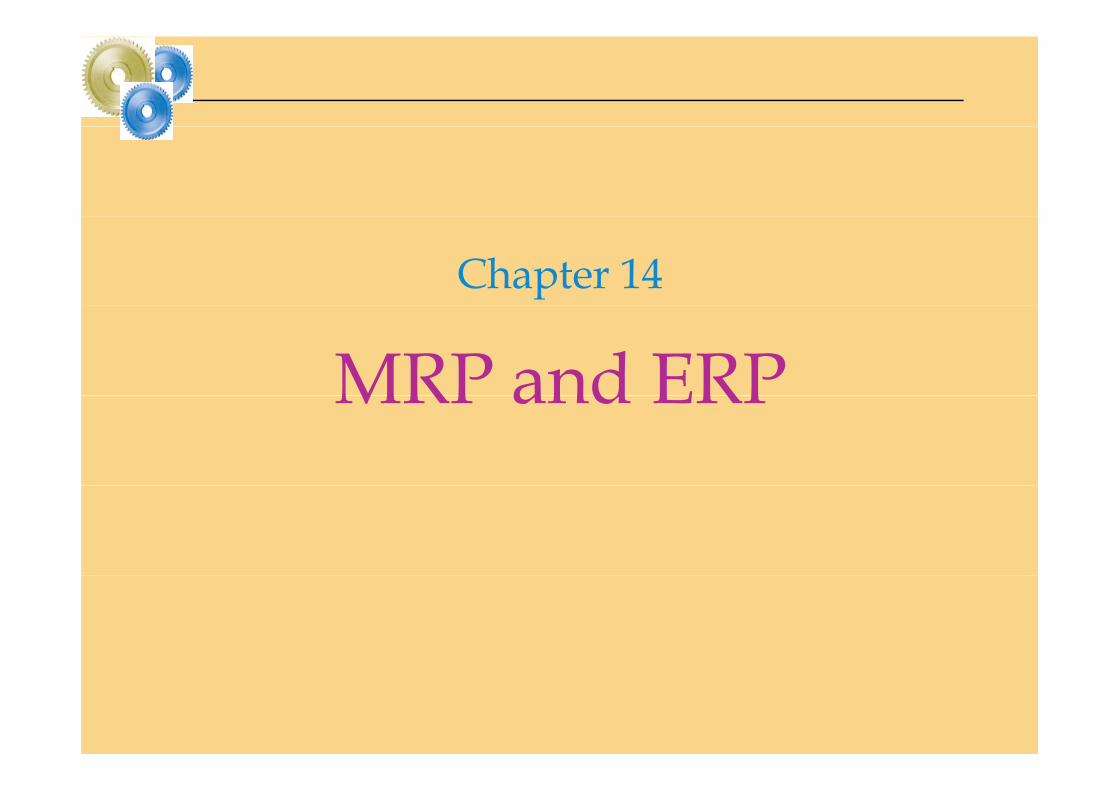
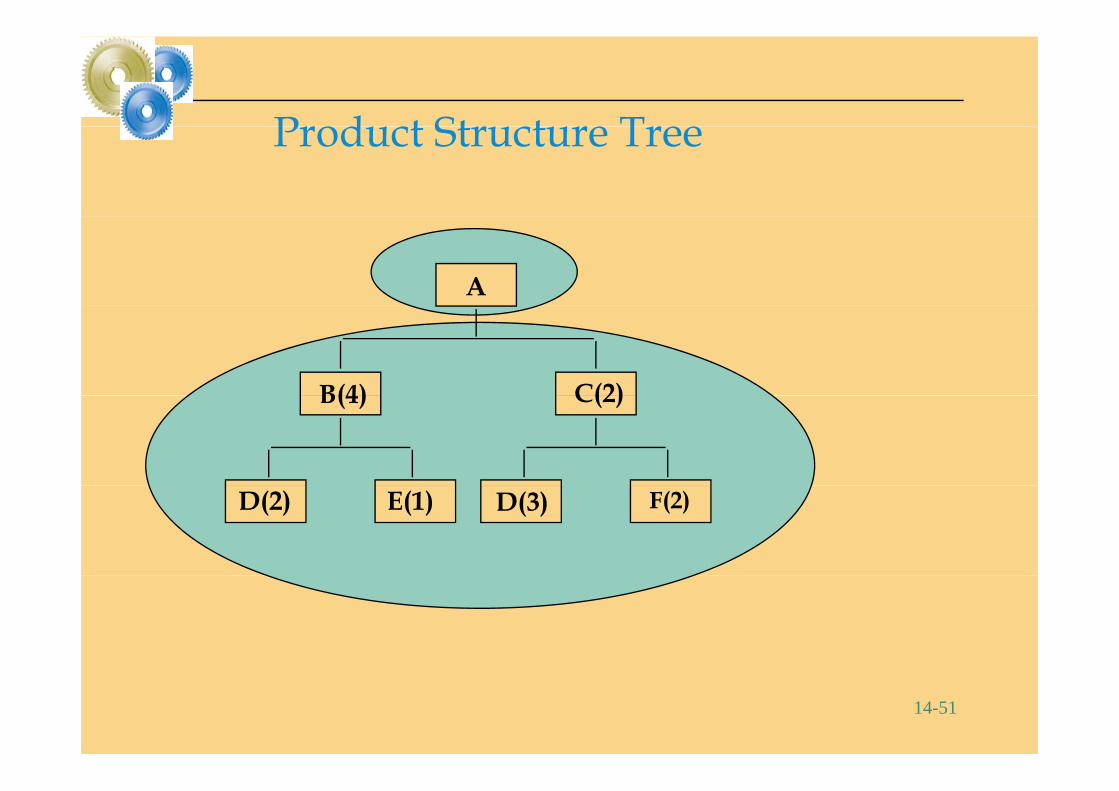
Product Structure Tree
A Dependent Demand(Ch )
B(4) C(2)
(Chapter 14)
B(4) C(2)
D(2) E(1) D(3) F(2)
Independent demand is uncertain. Dependent demand is certain.14-2
p p

Planning S u nPlanning SequenceAggregate PlanningAggregate Planning
Disaggregation
Maser Schedule
Maser Production Schedule
MRP Explosion
Material Requirement Schedule (MRP)
14-3
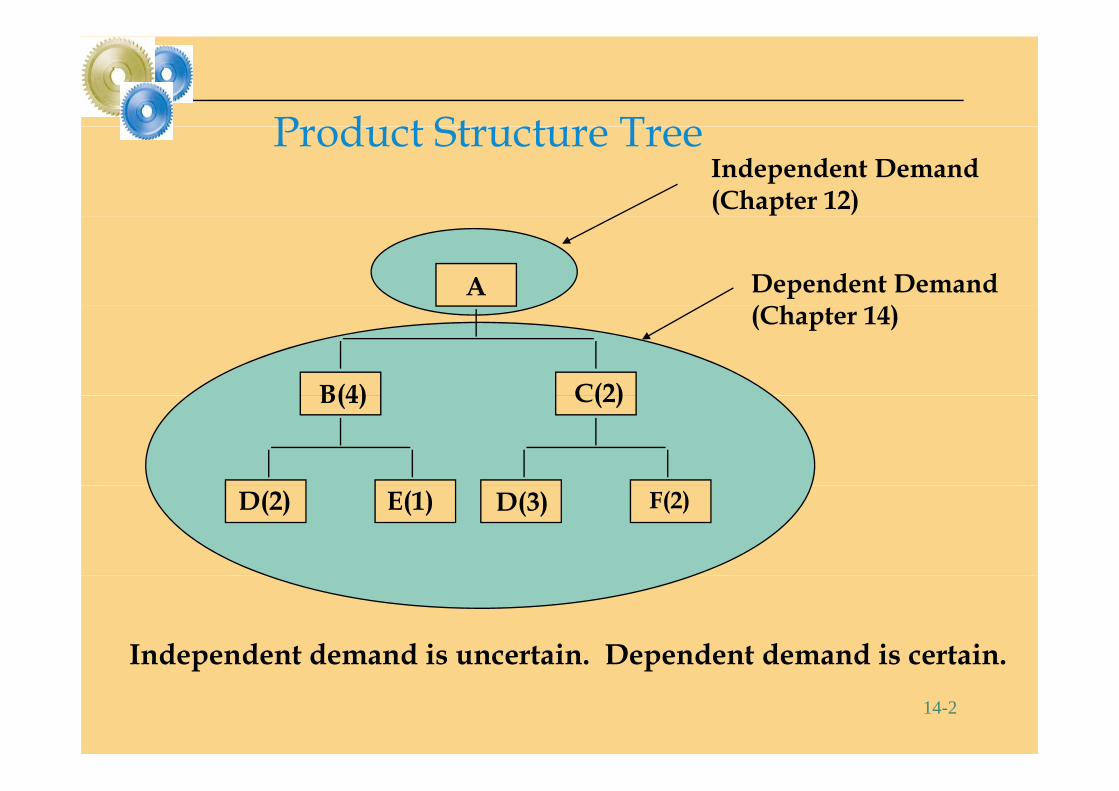
M i i f MRPMotivation for MRP• Suppose that you produce cars, and have demand Suppose that you produce cars, and have demand
of 100 in next month. There are about 20,000 parts and components that go into a car. You have to p gprepare the exact quantities of all of parts but don’t want to procure them too early since then they will i i t h ldi tincur inventory holding costs.
• How can you prepare an inventory procurement schedule for parts and components that deals with
tit d ti i t f t?quantity and timing aspects of procurement?
14-4
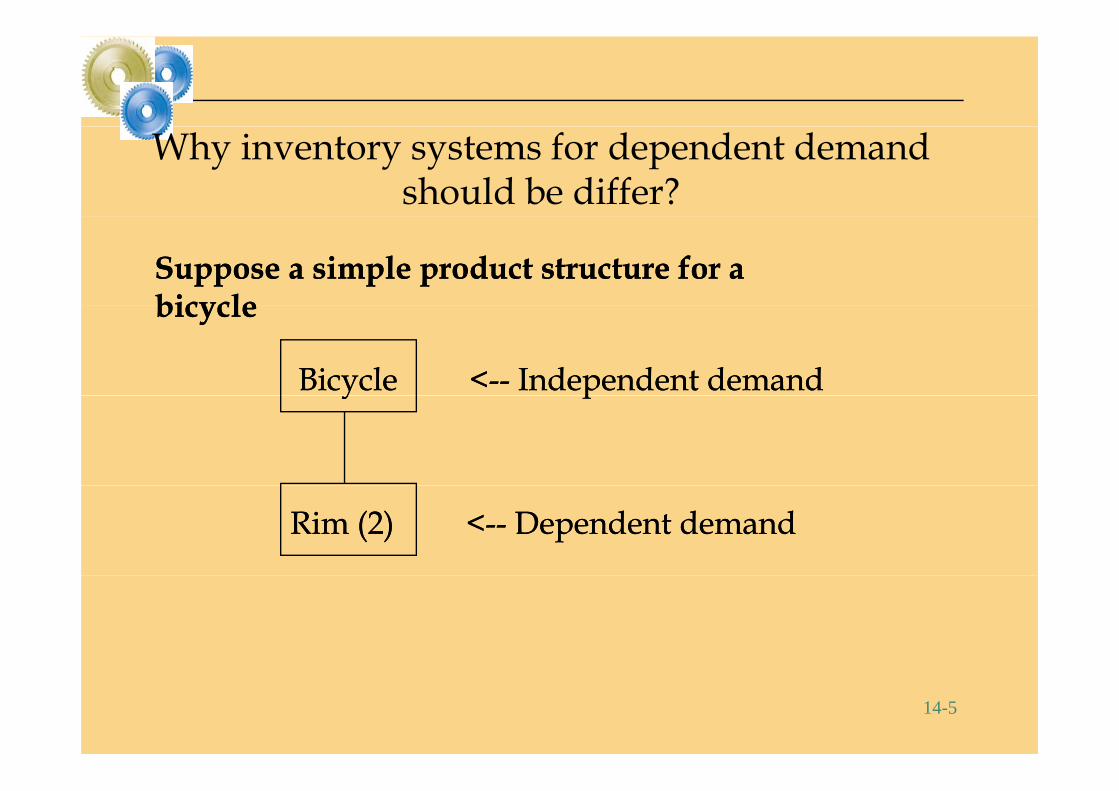
Why inventory systems for dependent demand should be differ?
Suppose a simple product structure for a Suppose a simple product structure for a bicyclebicyclebicyclebicycle
Bicycle <Bicycle <---- Independent demandIndependent demandyy pp
Rim (2) <Rim (2) <---- Dependent demandDependent demand
14-5
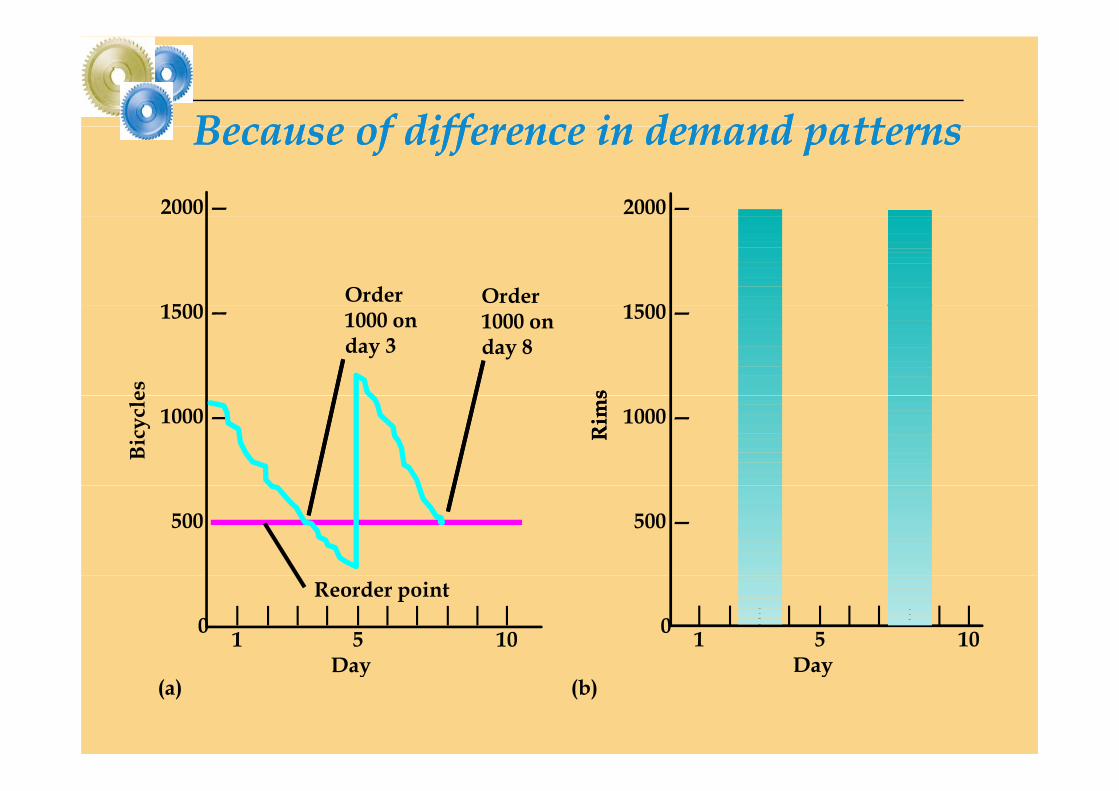
Because of difference in demand patternsBecause of difference in demand patterns2000 — 2000 —
Because of difference in demand patternsBecause of difference in demand patterns
1500 1500 Order Order
1500 — 1500 —1000 onday 3
1000 onday 8
es ss
1000 — 1000 —
Bicy
cle
Rim
sR
ims
500 — 500 —
0 0 | | | | | | | | | |1 5 10
Day
Reorder point| | | | | | | | | |1 5 10
Day(a) (b)
Day Day
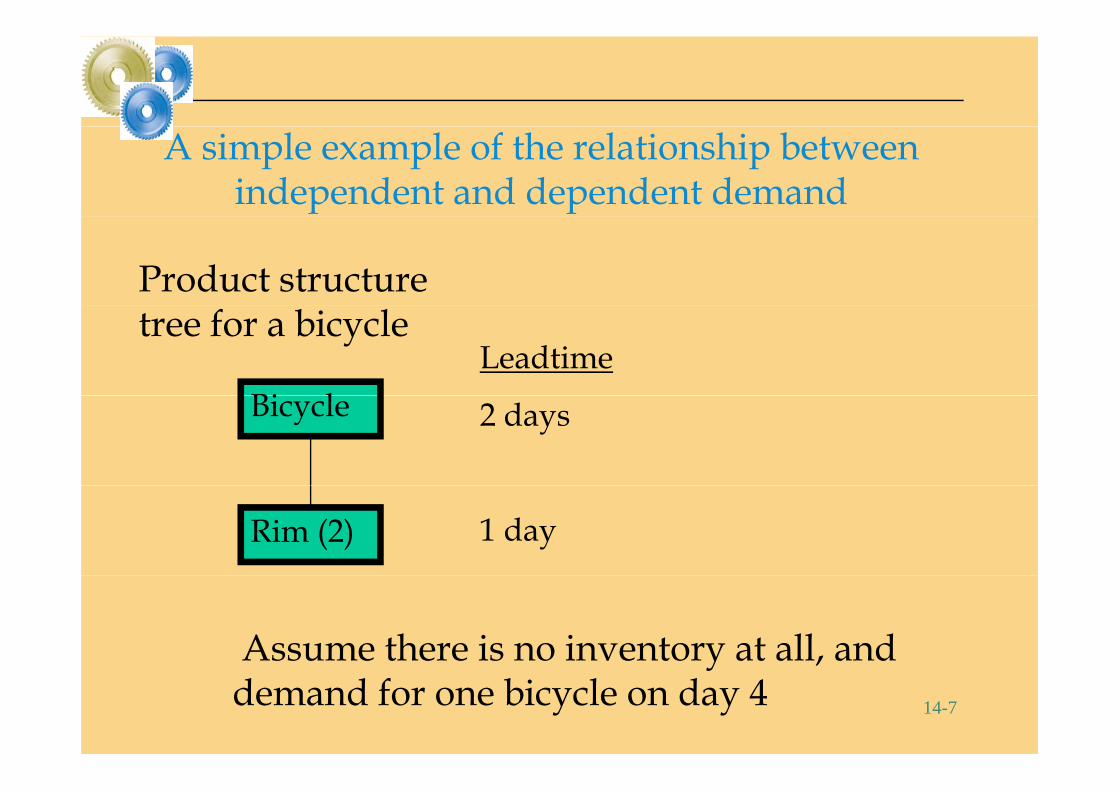
A simple example of the relationship between independent and dependent demand
Product structure tree for a bicycle
Bi lLeadtime
Bicycle 2 days
Rim (2) 1 day
Assume there is no inventory at all, and 14-7
y ,demand for one bicycle on day 4
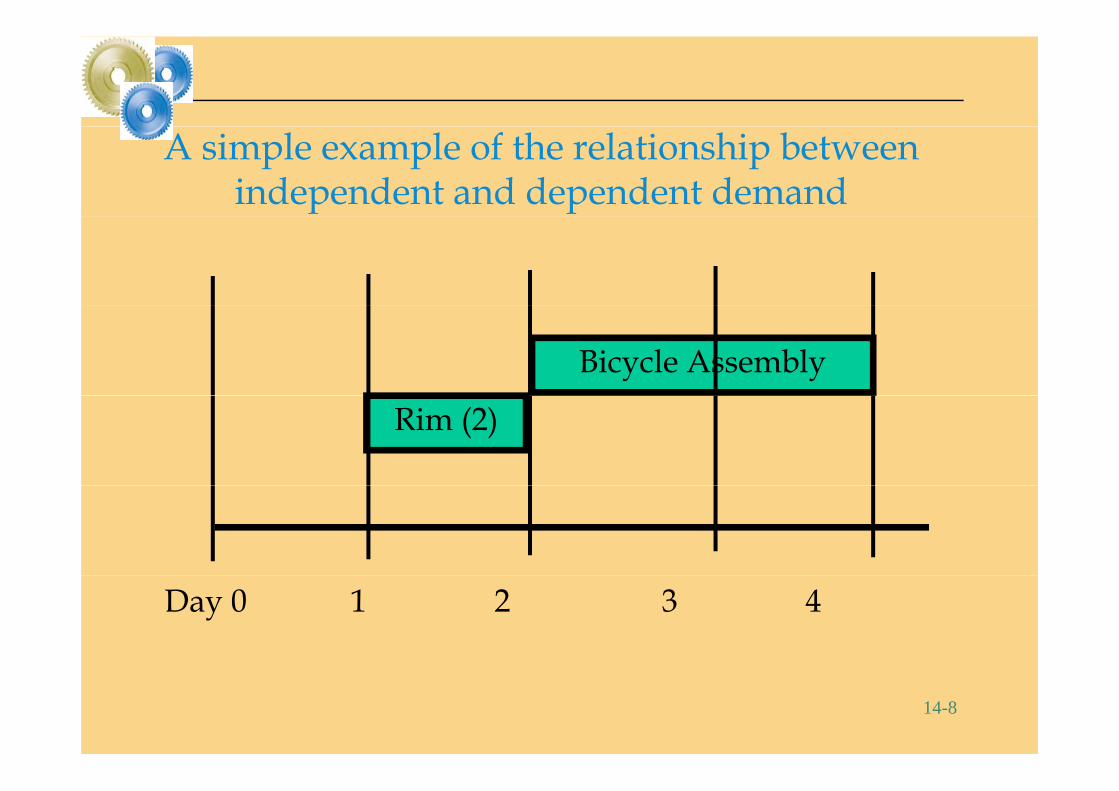
A simple example of the relationship between independent and dependent demand
Bicycle Assembly
Rim (2)
Day 0 1 2 3 4
14-8

MRP Inputs MRP Processing MRP Outputs
Ch
Master
Changes
Order releases
Planned orderschedule Planned-orderschedules
Primaryt
Bill ofmaterials MRP computer
Exception reports
Planning reports
P f
reports
Secondarymaterialsfile
pprograms Performance-
controlreports
yreports
Inventoryrecords
filInventorytransaction
14-9
file transaction
Master Schedule (MRP input #1)
• States which end items (finished goods) are to be produced when these are are to be produced, when these are needed, and in what quantities
14-10
Bill-of-Materials (MRP input #2)
• A listing of all of the raw materials, parts subassemblies and assemblies parts, subassemblies, and assemblies needed to produce one unit of a finished productproduct
• Typically shown a product tree structure where all components and their where all components and their relationships are listed by levels
14-11
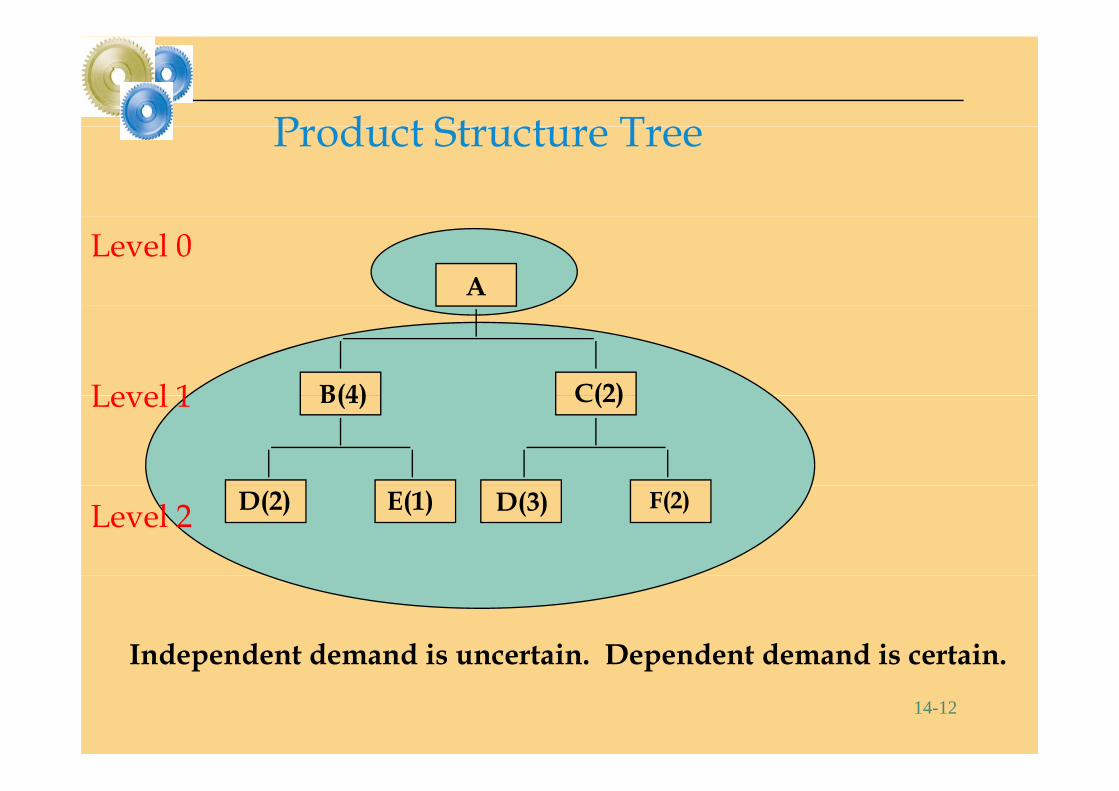
Pr du t Stru tur TrProduct Structure Tree
ALevel 0
B(4) C(2)Level 1 B(4) C(2)Level 1
D(2) E(1) D(3) F(2)Level 2
Independent demand is uncertain. Dependent demand is certain.14-12
p p
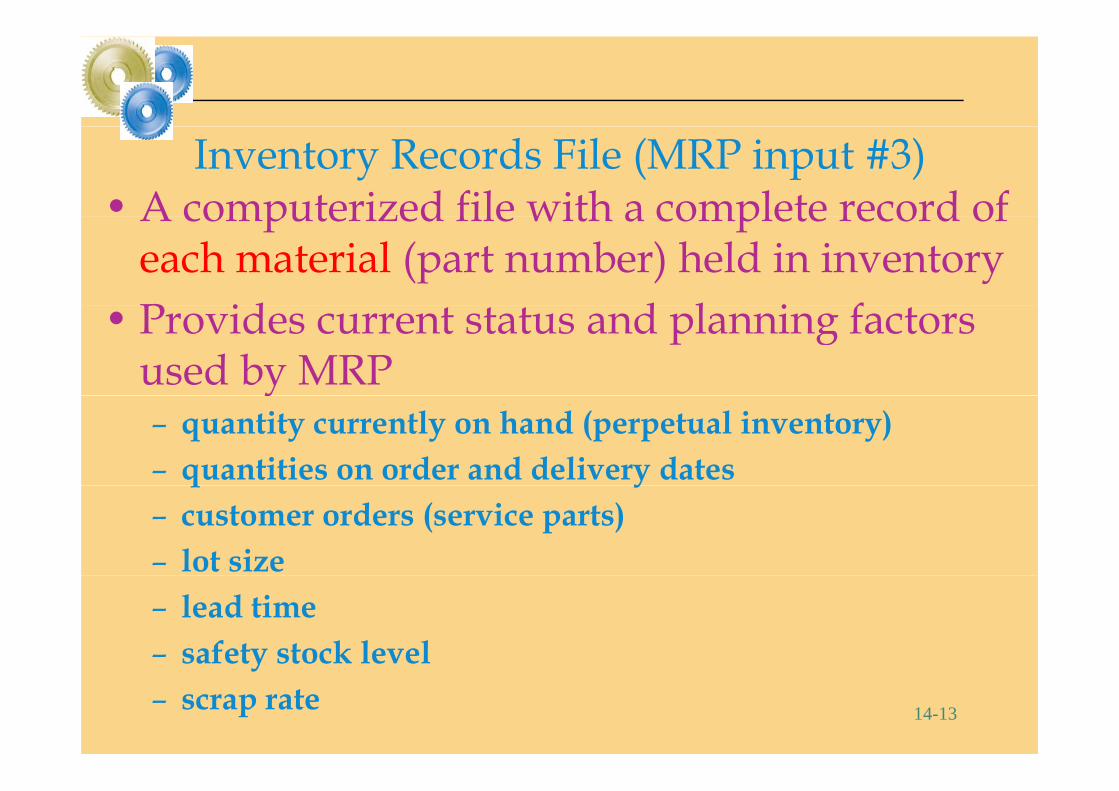
Inventory Records File (MRP input #3)• A computerized file with a complete record of A computerized file with a complete record of
each material (part number) held in inventoryP id d l i f • Provides current status and planning factors used by MRPy– quantity currently on hand (perpetual inventory)– quantities on order and delivery datesq y– customer orders (service parts)– lot size– lead time– safety stock level
14-13
y– scrap rate
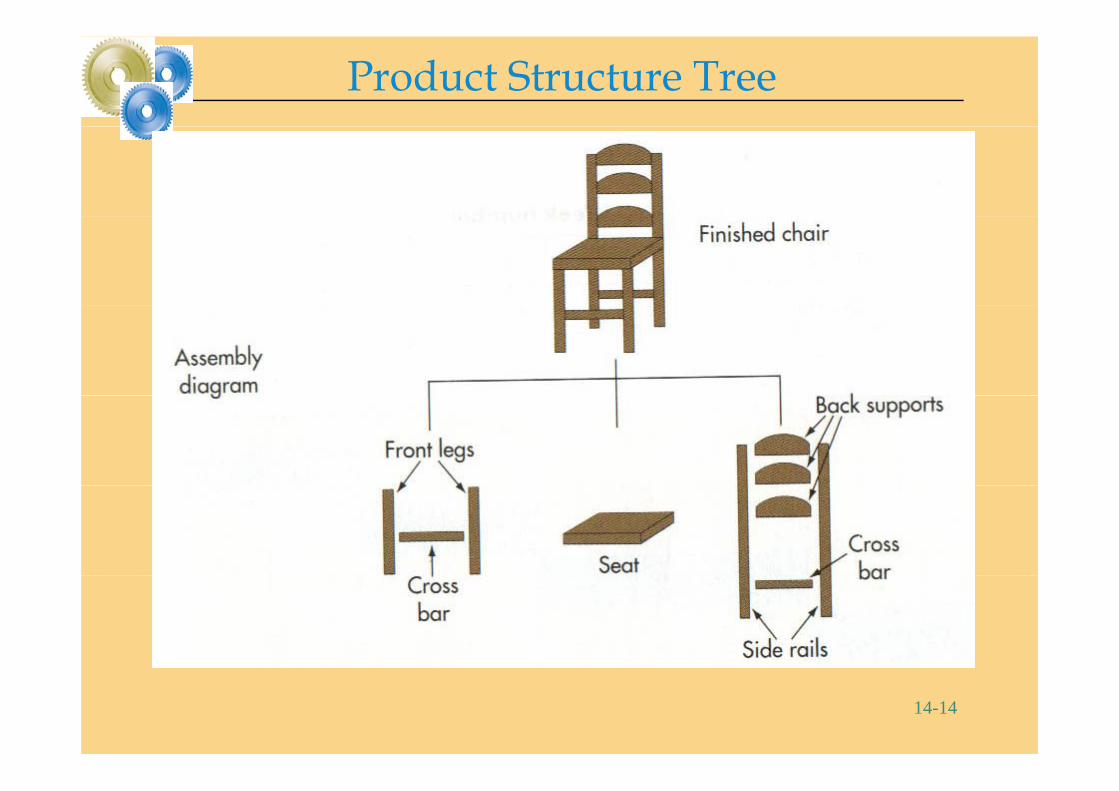
Product Structure Tree
14-14
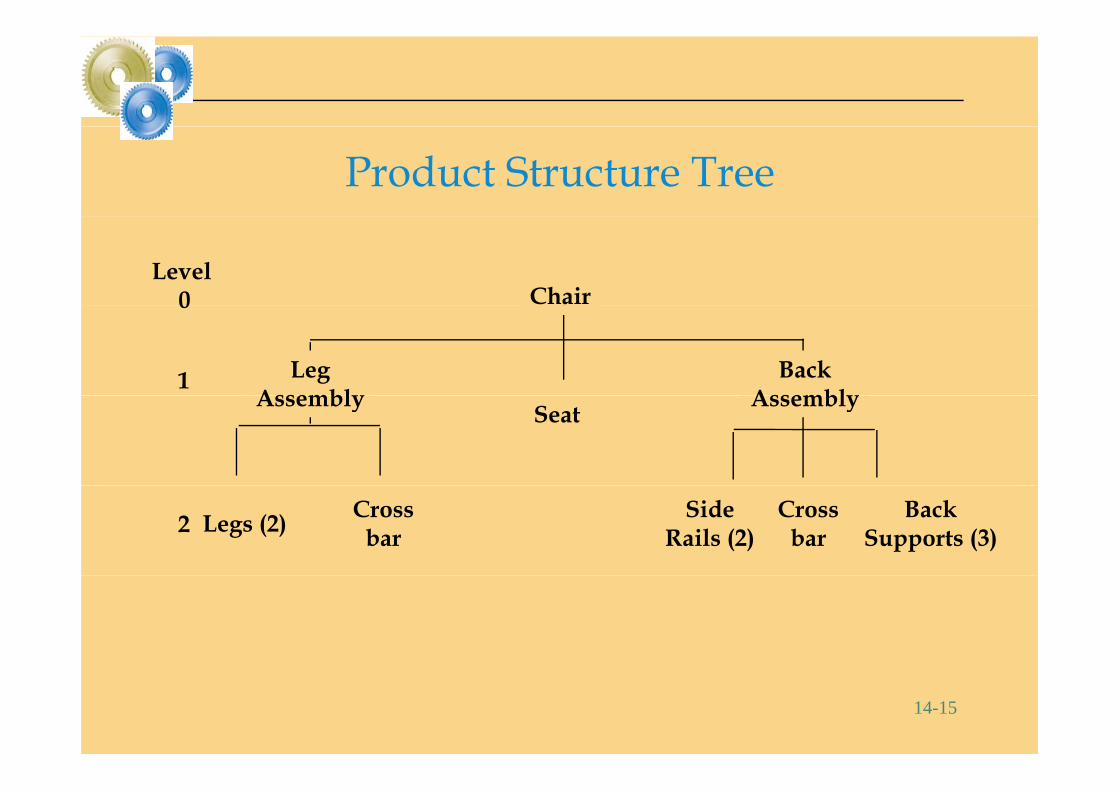
Product Structure Tree
ChairLevel
0
LegAssembly
BackAssembly
0
1SeatAssembly Assembly
Legs (2) Crossbar
SideRails (2)
Crossbar
BackSupports (3)2
14-15
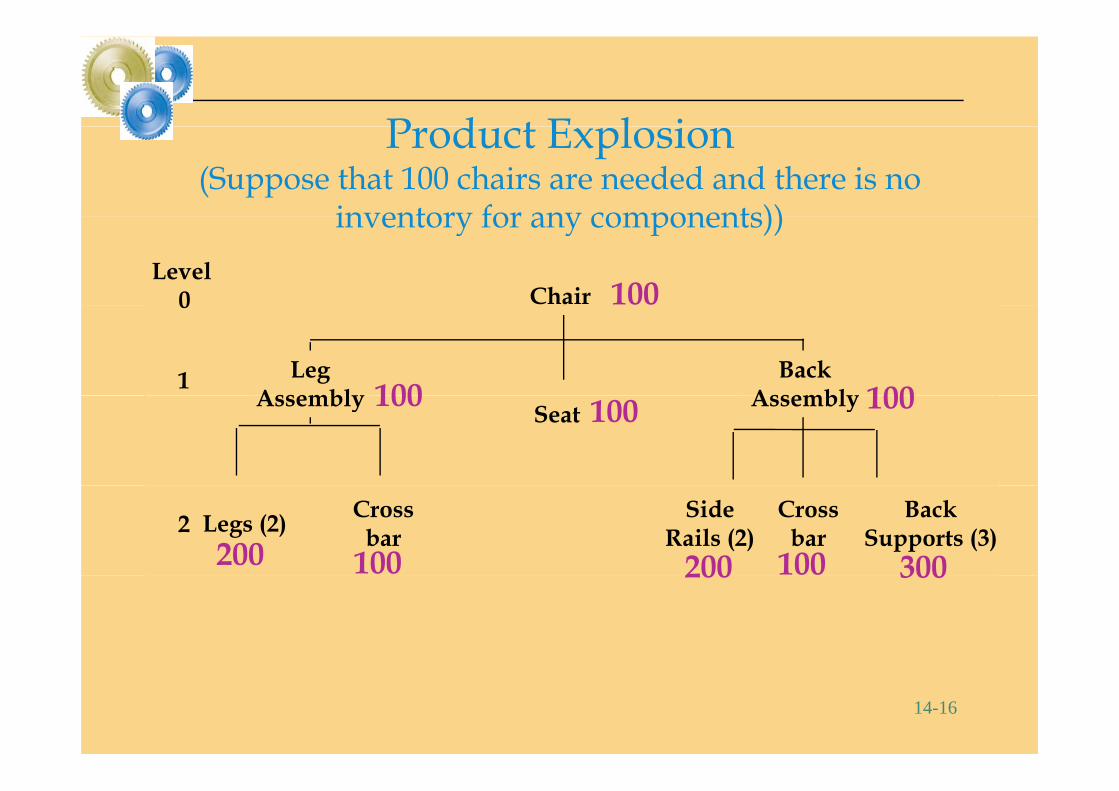
P d t E l iProduct Explosion(Suppose that 100 chairs are needed and there is no
inventory for any components))
ChairLevel
0 100
inventory for any components))
LegAssembly
BackAssembly
0
1 100 100SeatAssembly Assembly100 100 100
Legs (2) Crossbar
SideRails (2)
Crossbar
BackSupports (3)2
200 200100 100 300200 300
14-16
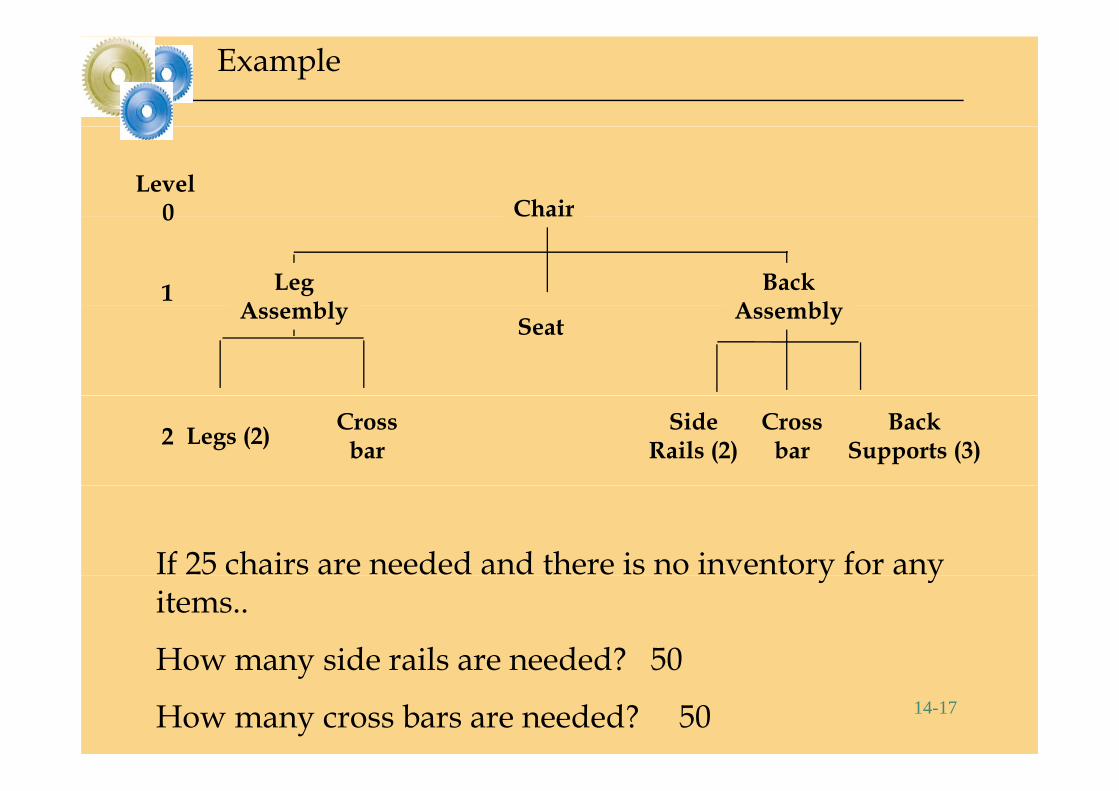
Example
ChairLevel
0 Chair
LegA bl
BackA bl
0
1SeatAssembly Assembly
Legs (2) Crossbar
SideRails (2)
Crossbar
BackSupports (3)2
If 25 chairs are needed and there is no inventory for any y yitems..
How many side rails are needed? 5014-17
How many side rails are needed? 50
How many cross bars are needed? 50
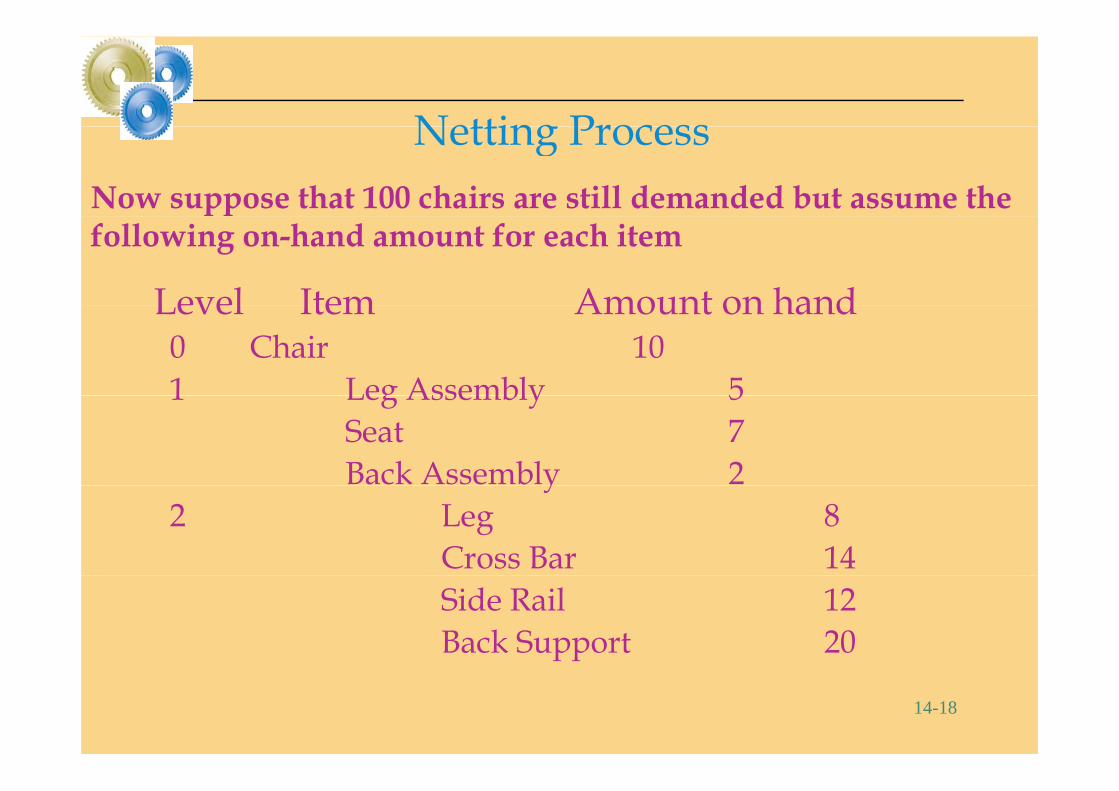
Netting ProcessNetting ProcessNow suppose that 100 chairs are still demanded but assume the
Level Item Amount on hand
ppfollowing on-hand amount for each item
Level Item Amount on hand0 Chair 101 Leg Assembly 51 Leg Assembly 5
Seat 7Back Assembly 2y
2 Leg 8Cross Bar 14Side Rail 12Back Support 20
14-18
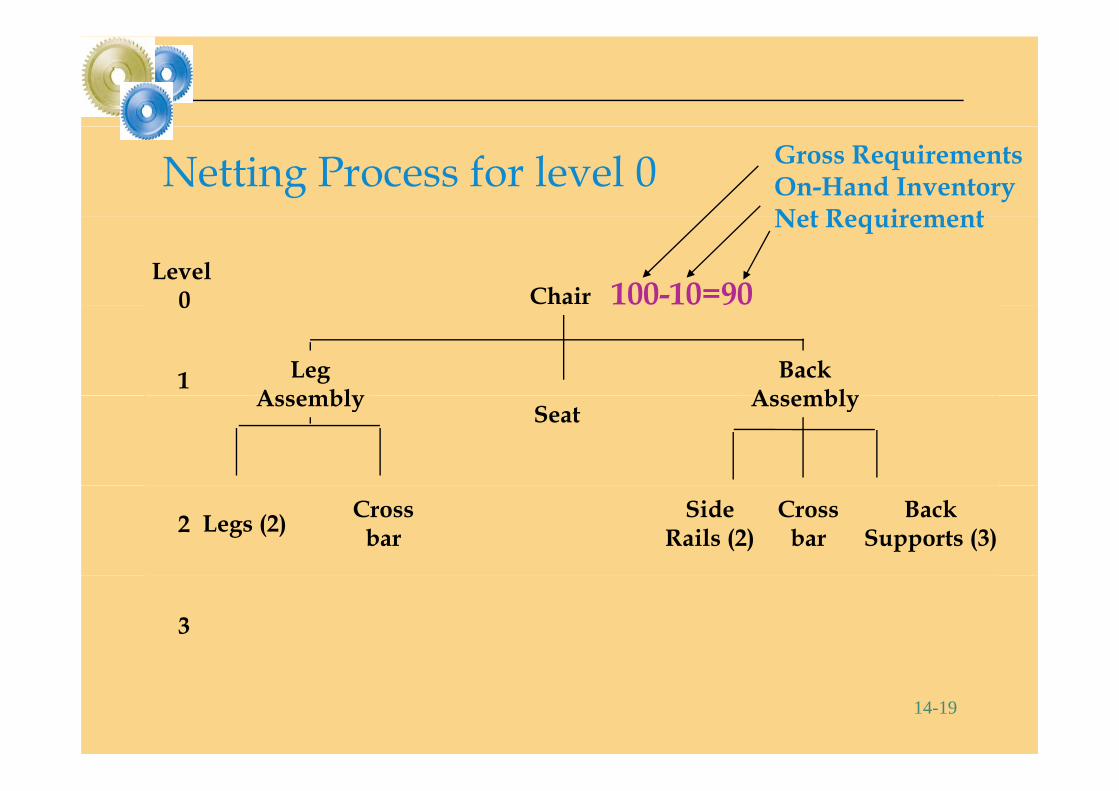
Netting Process for level 0 Gross RequirementsOn-Hand InventoryNet Requirement
ChairLevel
0 100-10=90
Net Requirement
LegAssembly
BackAssembly
0
1SeatAssembly Assembly
Legs (2) Crossbar
SideRails (2)
Crossbar
BackSupports (3)2
3
14-19
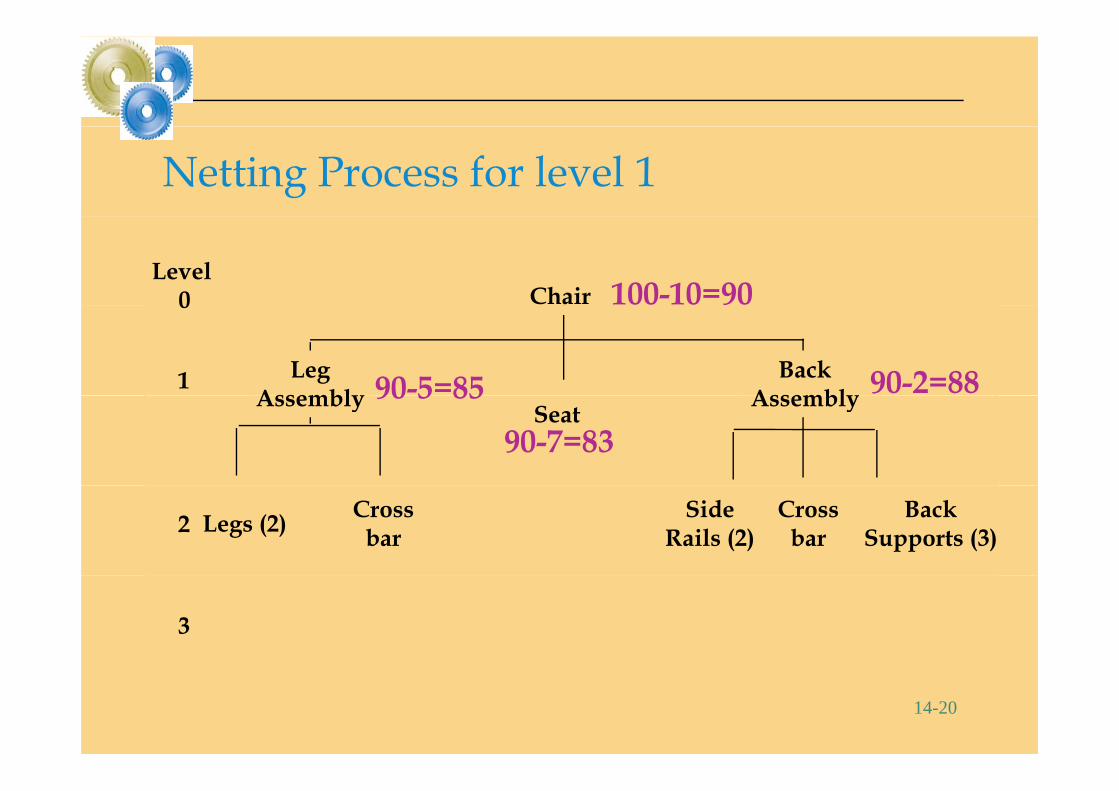
Netting Process for level 1
ChairLevel
0 100-10=90
LegAssembly
BackAssembly
0
1 90-5=85 90-2=88SeatAssembly Assembly90 5 85
90-7=83
Legs (2) Crossbar
SideRails (2)
Crossbar
BackSupports (3)2
3
14-20
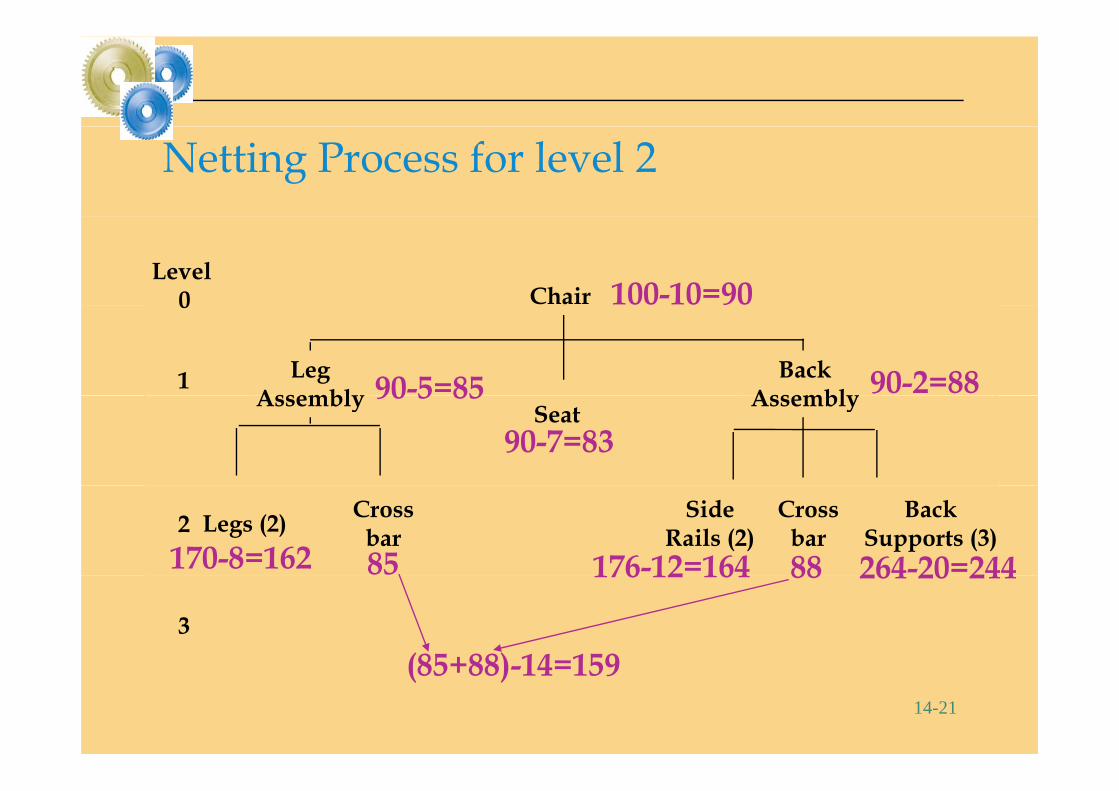
Netting Process for level 2
ChairLevel
0 100-10=90
LegAssembly
BackAssembly
0
1 90-5=85 90-2=88SeatAssembly Assembly90 5 85
90-7=83
Legs (2) Crossbar
SideRails (2)
Crossbar
BackSupports (3)2
170-8=162 176-12=164 264-20=2448885
3
176 12 164 264 20 24488
(85+88) 14=15914-21
(85+88)-14=159

Lead Time Aspect of Netting Process
Assume the following lead times for each itemAssume the following lead times for each item
Level Item Lead Time0 Chair 11 Leg Assembly 1
Seat 1B k A bl 2Back Assembly 2
2 Leg 1Cross Bar 1Cross Bar 1Side Rail 1Back Support 2
14-22
Back Support 2
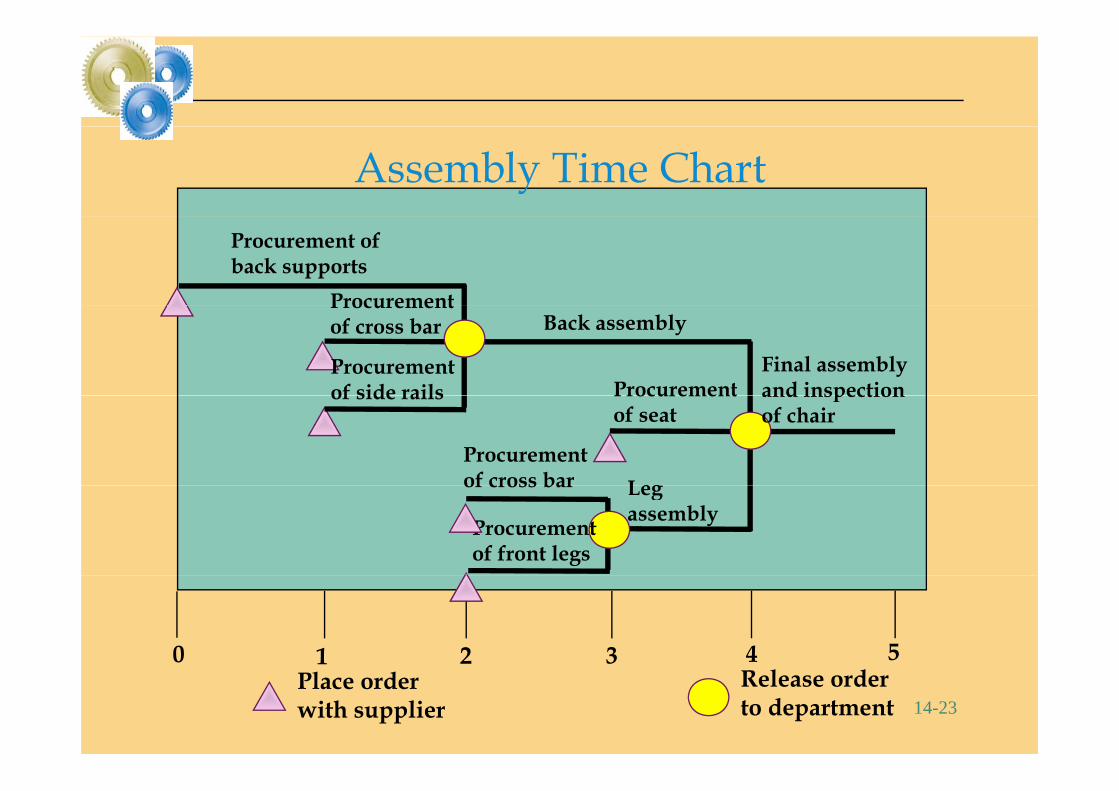
Assembly Time ChartProcurement ofback supports
Procurement
Procurement
Back assembly
Procurementof side rails
Procurementof cross bar
Final assemblyand inspectionProcurement
of seat
LegProcurementof cross bar
of side rails and inspectionof chair
Legassembly
of cross bar
Procurementof front legs
1 2 3 4 50
14-23Place orderwith supplier
Release orderto department
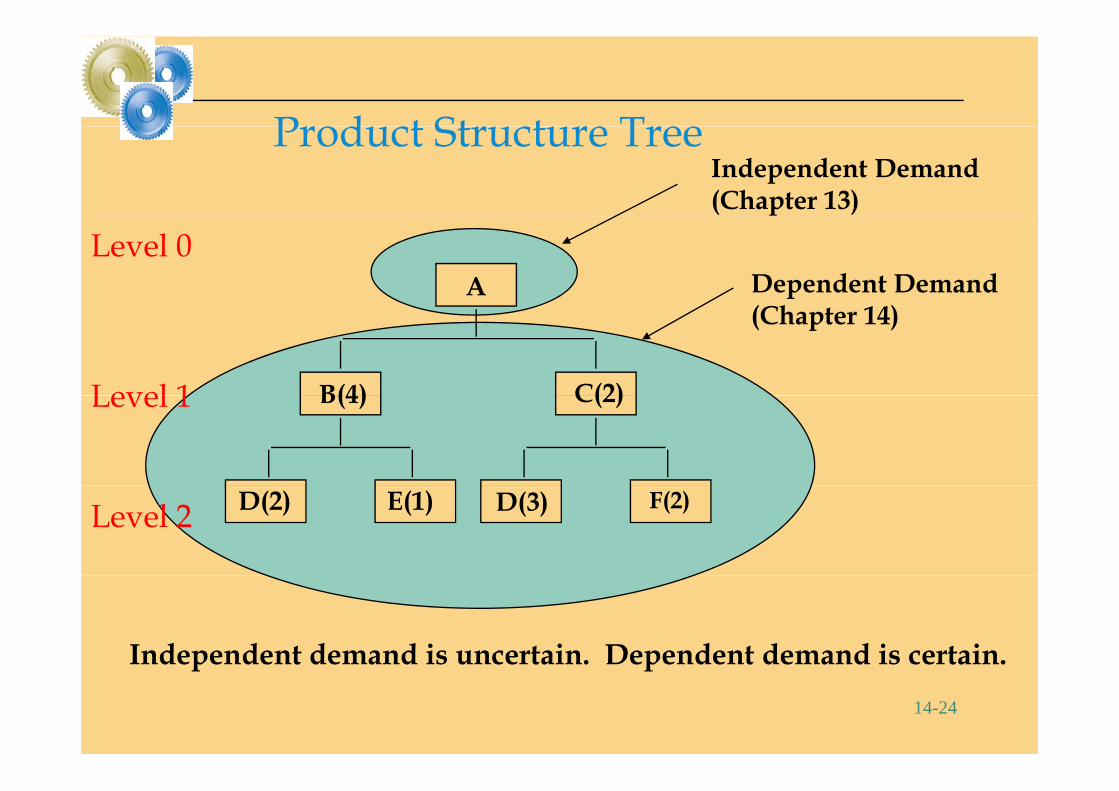
Pr du t Stru tur TrIndependent Demand(Chapter 13)
Product Structure Tree
A Dependent Demand(Ch )
Level 0
B(4) C(2)
(Chapter 14)
Level 1 B(4) C(2)Level 1
D(2) E(1) D(3) F(2)Level 2
Independent demand is uncertain. Dependent demand is certain.14-24
p p
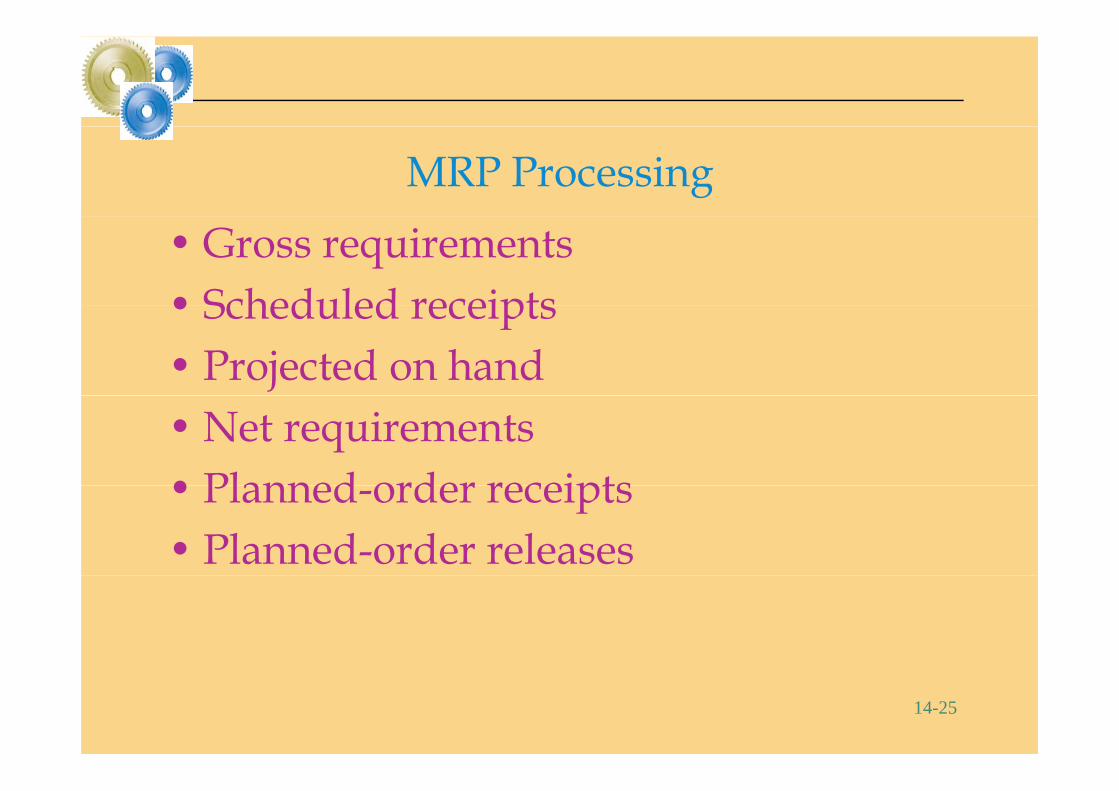
MRP Processing• Gross requirements• Scheduled receipts• Scheduled receipts• Projected on hand• Net requirements• Planned order receipts• Planned-order receipts• Planned-order releases
14-25
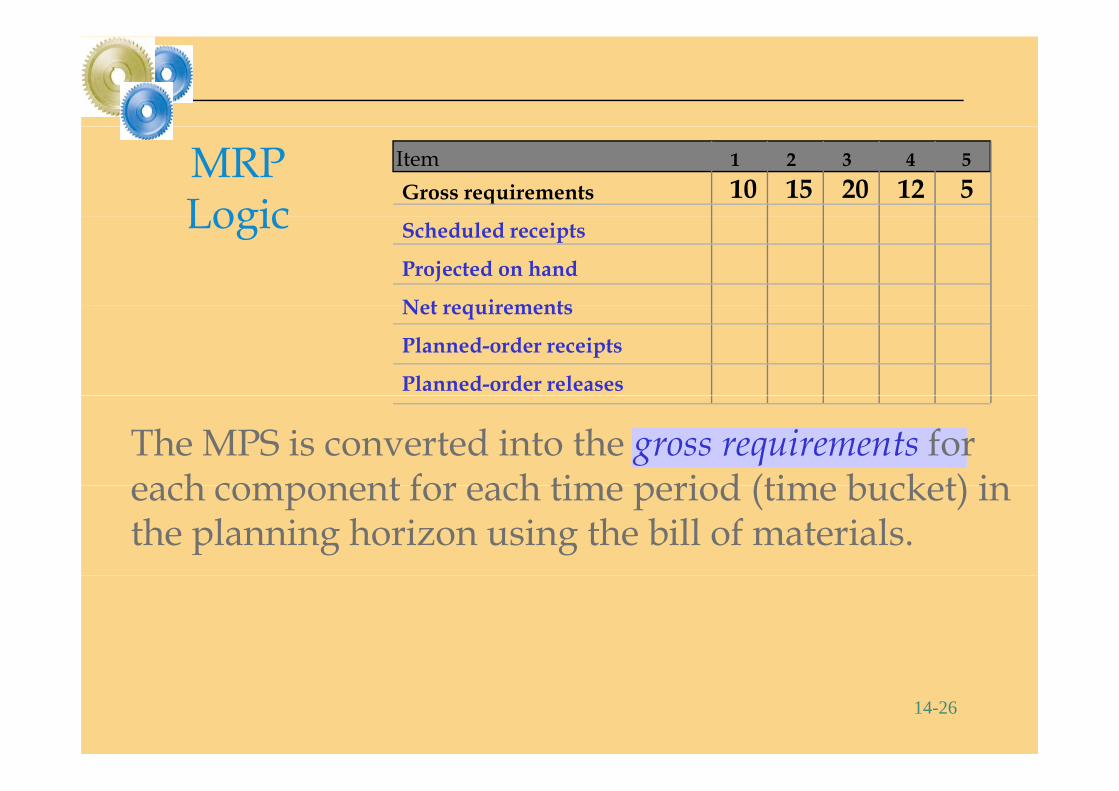
MRP Logic
1 2 3 4 5
Gross requirementsItem
10 15 20 12 5Logic Scheduled receipts
Projected on hand
Net requirementsNet requirements
Planned-order receipts
Planned-order releases
The MPS is converted into the gross requirements for each component for each time period (time bucket) in each component for each time period (time bucket) in the planning horizon using the bill of materials.
14-26
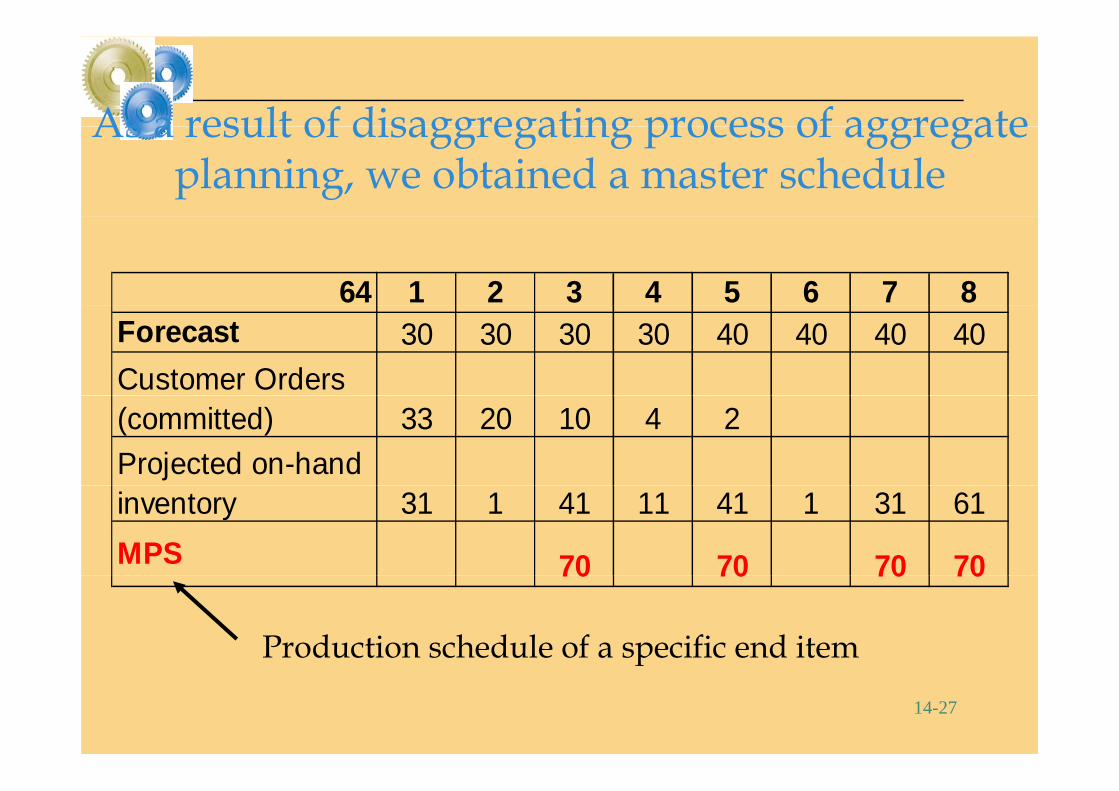
As a result of disaggregating process of aggregate As a result of disaggregating process of aggregate planning, we obtained a master schedule
64 1 2 3 4 5 6 7 8Forecast 30 30 30 30 40 40 40 40Customer Orders (committed) 33 20 10 4 2Projected on-hand inventory 31 1 41 11 41 1 31 61MPS 70 70 70 7070 70 70 70
Production schedule of a specific end item
14-27
p
1 2 3 4 5
Gross requirementsItem
10 15 20 12 5Scheduled receipts
Projected on hand
Net requirements
7 9
Net requirements
Planned-order receipts
Planned-order releases
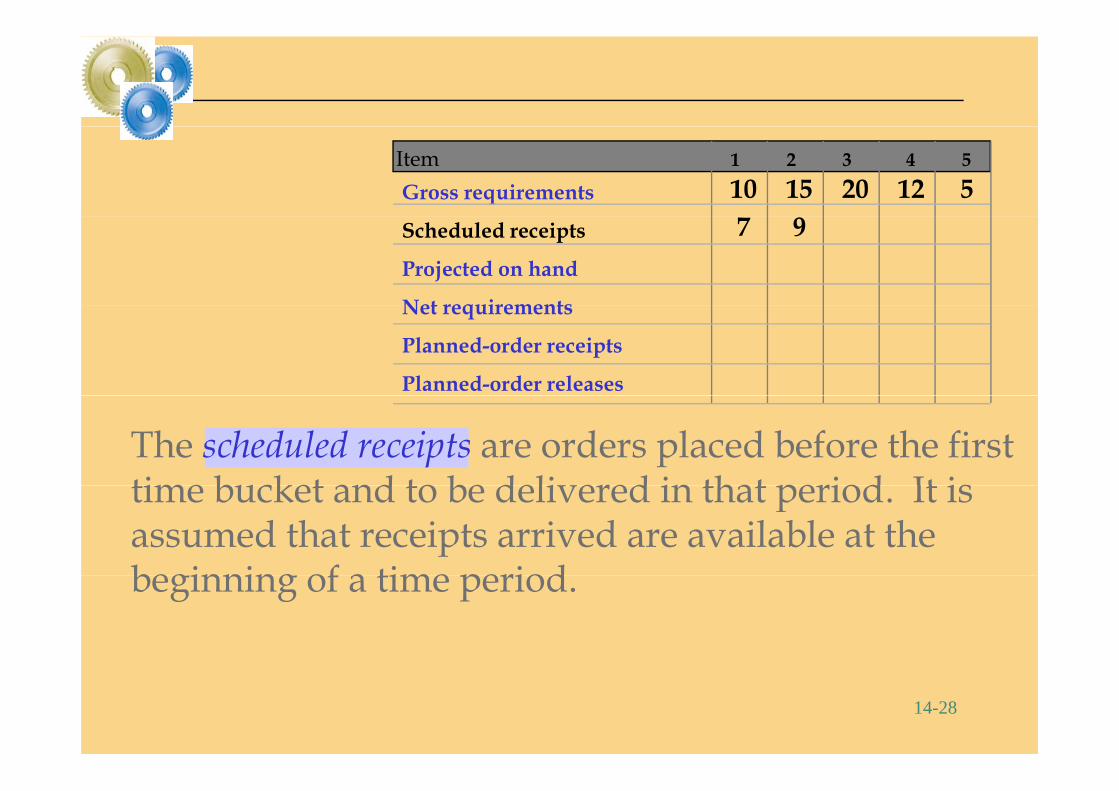
The scheduled receipts are orders placed before the first time bucket and to be delivered in that period It is time bucket and to be delivered in that period. It is assumed that receipts arrived are available at the beginning of a time periodbeginning of a time period.
14-28
1 2 3 4 5
Gross requirementsItem
10 15 20 12 5Scheduled receipts
Projected on hand
Net requirements
7 92316
Net requirements
Planned-order receipts
Planned-order releases
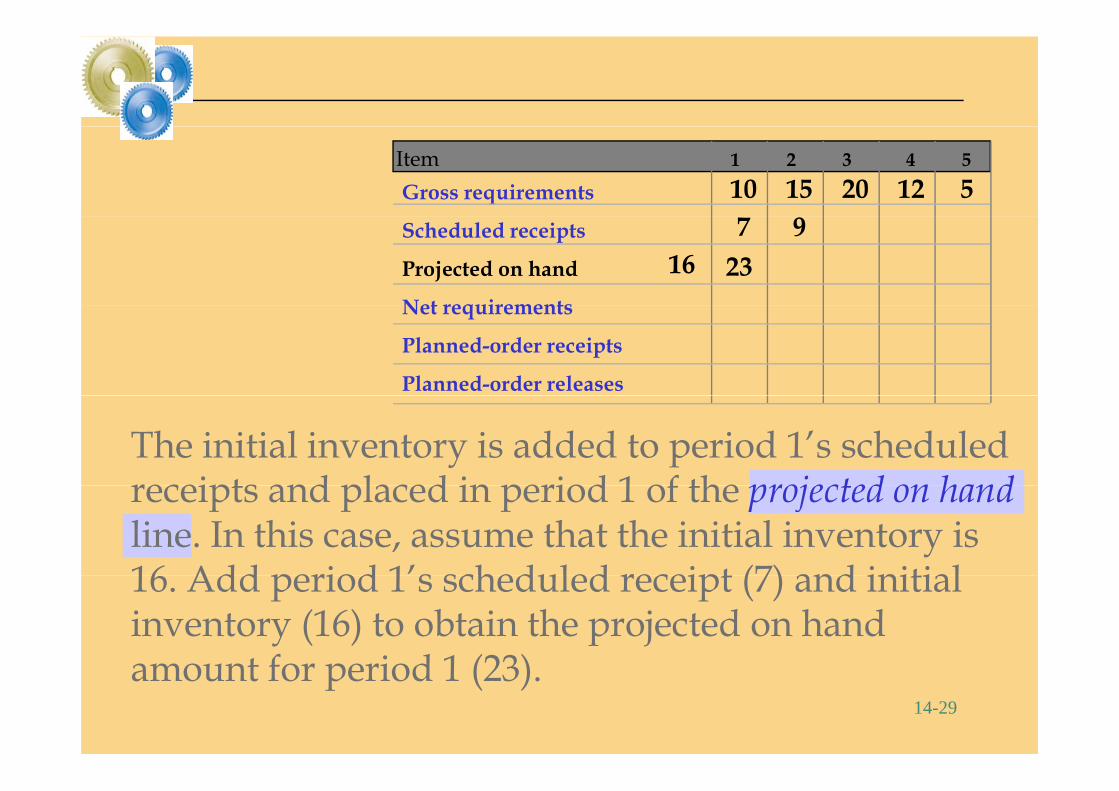
The initial inventory is added to period 1’s scheduled receipts and placed in period 1 of the projected on handreceipts and placed in period 1 of the projected on handline. In this case, assume that the initial inventory is 16 Add period 1’s scheduled receipt (7) and initial 16. Add period 1 s scheduled receipt (7) and initial inventory (16) to obtain the projected on handamount for period 1 (23)
14-29
amount for period 1 (23).
1 2 3 4 5
Gross requirementsItem
10 15 20 12 5Scheduled receipts
Projected on hand
Net requirements
7 92313Net requirements
Planned-order receipts
Planned-order releases
-13
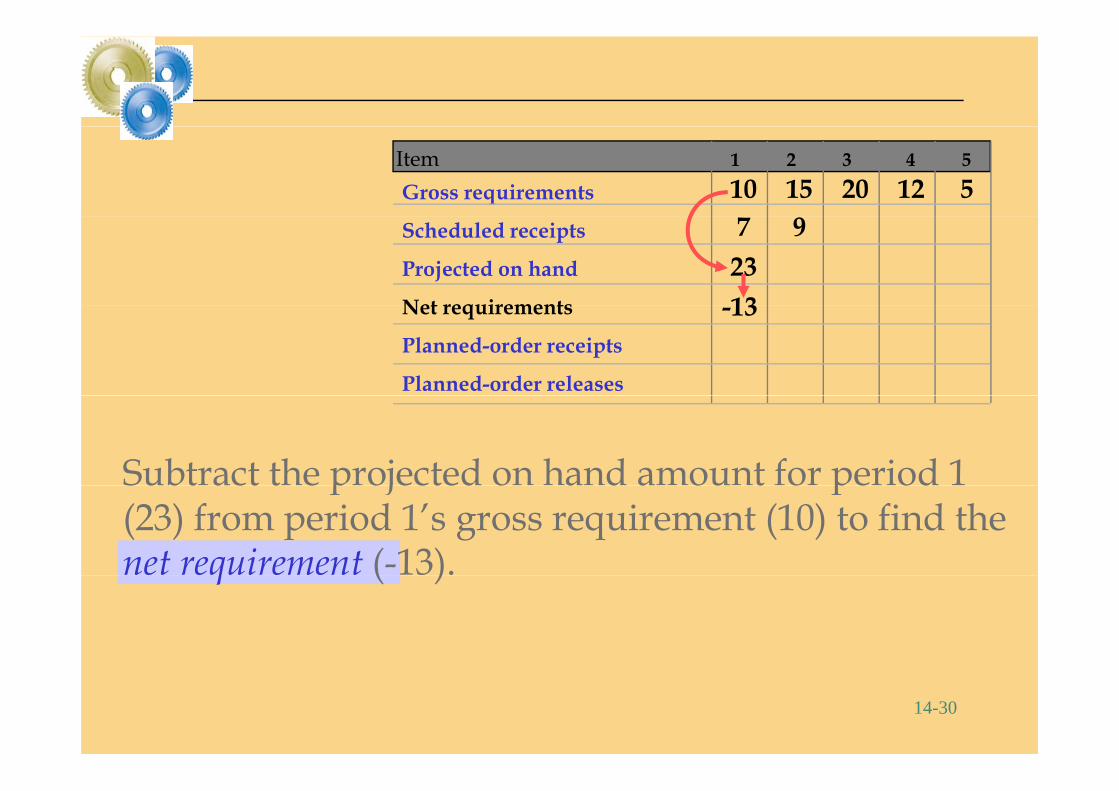
Subtract the projected on hand amount for period 1 Subt act t e p ojected o a d a ou t o pe od (23) from period 1’s gross requirement (10) to find the net requirement (-13). q ( )
14-30

1 2 3 4 5
Gross requirementsItem
10 15 20 12 5Scheduled receipts
Projected on hand
Net requirements
7 92313
22Net requirements
Planned-order receipts
Planned-order releases
-13
If the net requirement is negative or zero, that q gamount (13) is added to the period 2’s scheduled receipt (9) to find the period 2’s projected on hand p ( ) p p jamount (22).
14-31
1 2 3 4 5
Gross requirementsItem
10 15 20 12 5Scheduled receipts
Projected on hand
Net requirements
7 92313
227Net requirements
Planned-order receipts
Planned-order releases
-13 -7
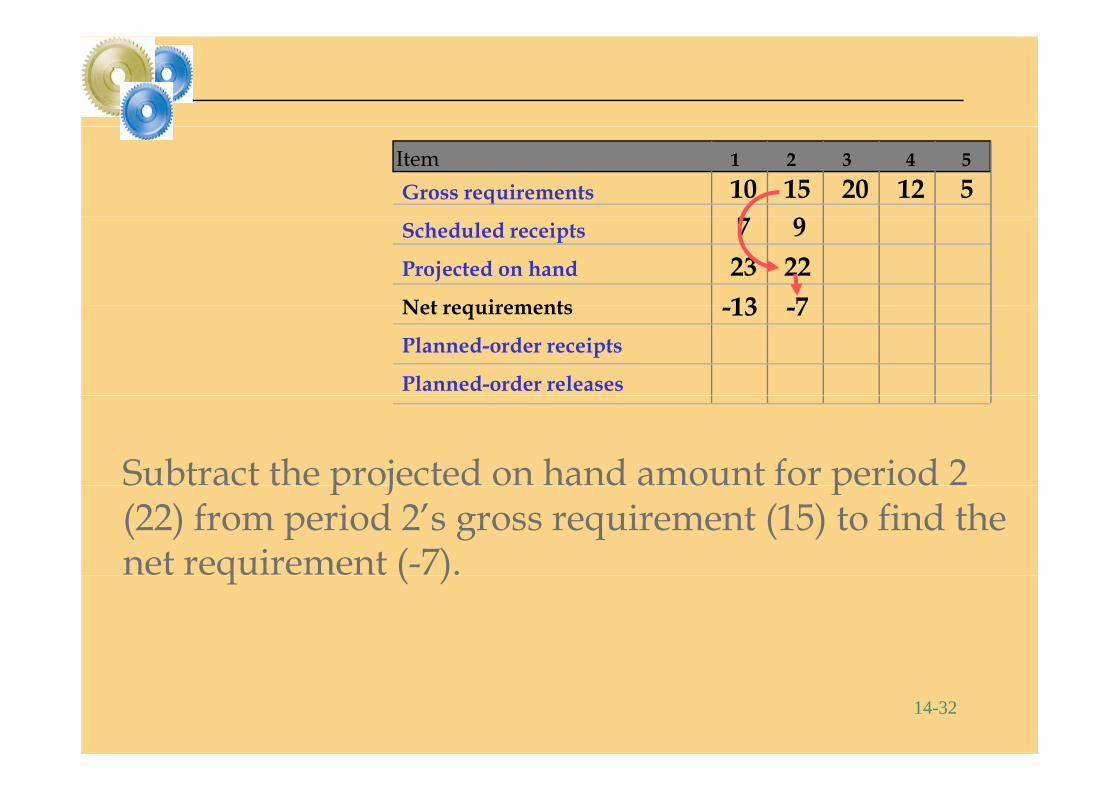
Subtract the projected on hand amount for period 2 Subt act t e p ojected o a d a ou t o pe od (22) from period 2’s gross requirement (15) to find the net requirement (-7).q ( )
14-32
1 2 3 4 5
Gross requirementsItem
10 15 20 12 5Scheduled receipts
Projected on hand
Net requirements
7 92313
227
7Net requirements
Planned-order receipts
Planned-order releases
-13 -7
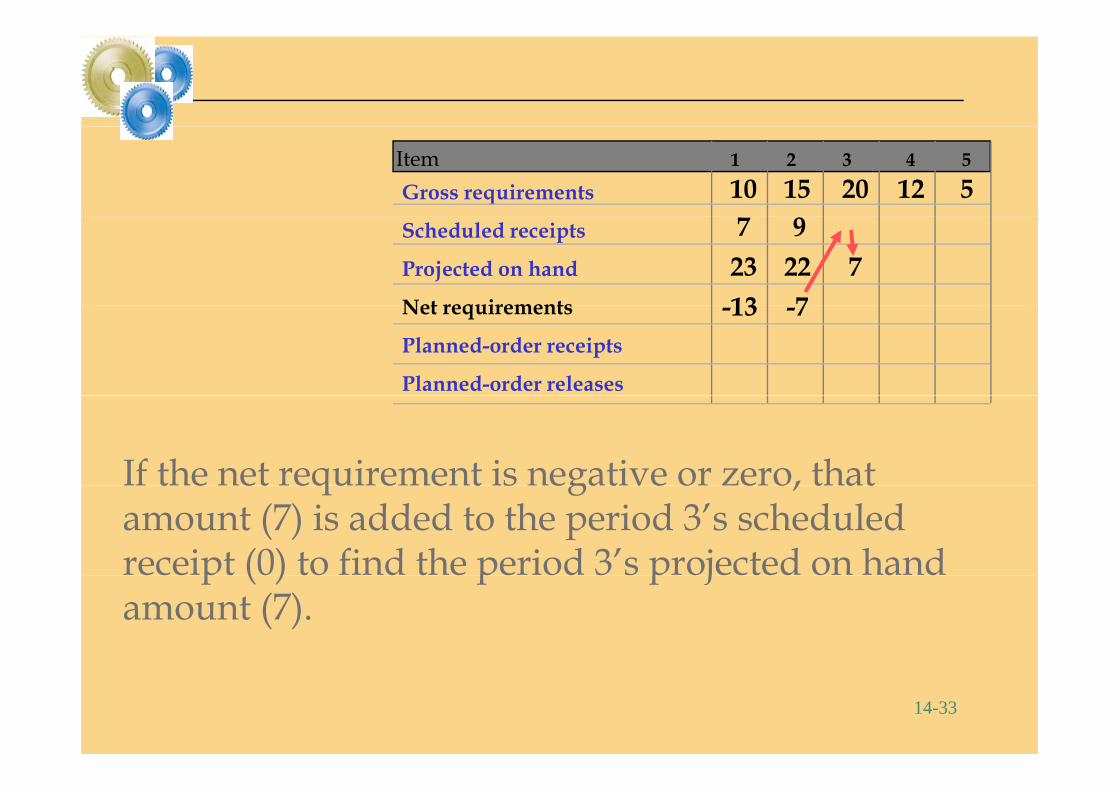
If the net requirement is negative or zero, that If the net requirement is negative or zero, that amount (7) is added to the period 3’s scheduled receipt (0) to find the period 3’s projected on hand ece pt (0) to d t e pe od 3 s p ojected o a d amount (7).
14-33

1 2 3 4 5
Gross requirementsItem
10 15 20 12 5Scheduled receipts
Projected on hand
Net requirements
7 92313
227
713Net requirements
Planned-order receipts
Planned-order releases
-13 -7 13
Subtract the projected on hand amount for period 3 (7) from period 3’s gross requirement (20) to find the (7) from period 3 s gross requirement (20) to find the net requirement (13). If the net requirement is positive an order receipt must be planned to cover positive, an order receipt must be planned to cover that amount.
14-34
1 2 3 4 5
Gross requirementsItem
10 15 20 12 5Scheduled receipts
Projected on hand
Net requirements
7 92313
227
713Net requirements
Planned-order receipts
Planned-order releases
-13 -7 1313
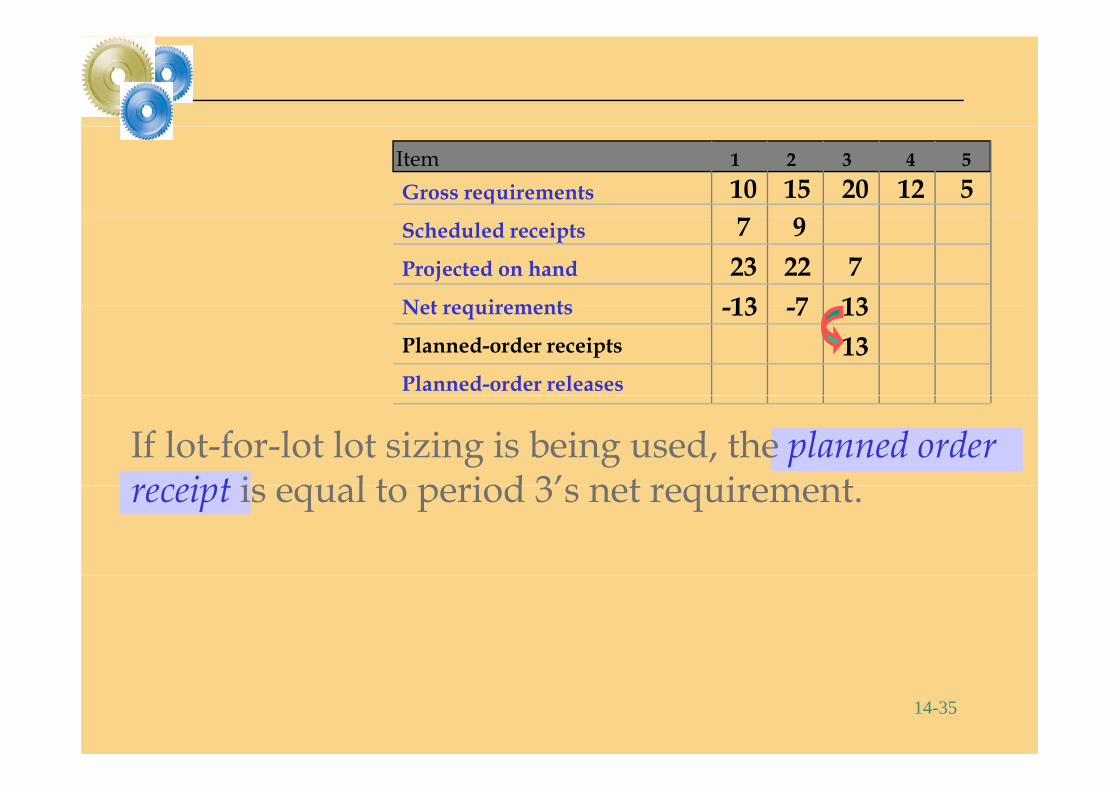
If lot-for-lot lot sizing is being used, the planned order receipt is equal to period 3’s net requirementreceipt is equal to period 3 s net requirement.
14-35
1 2 3 4 5
Gross requirementsItem
10 15 20 12 5Scheduled receipts
Projected on hand
Net requirements
7 92313
227
713Net requirements
Planned-order receipts
Planned-order releases
-13 -7 1313
13
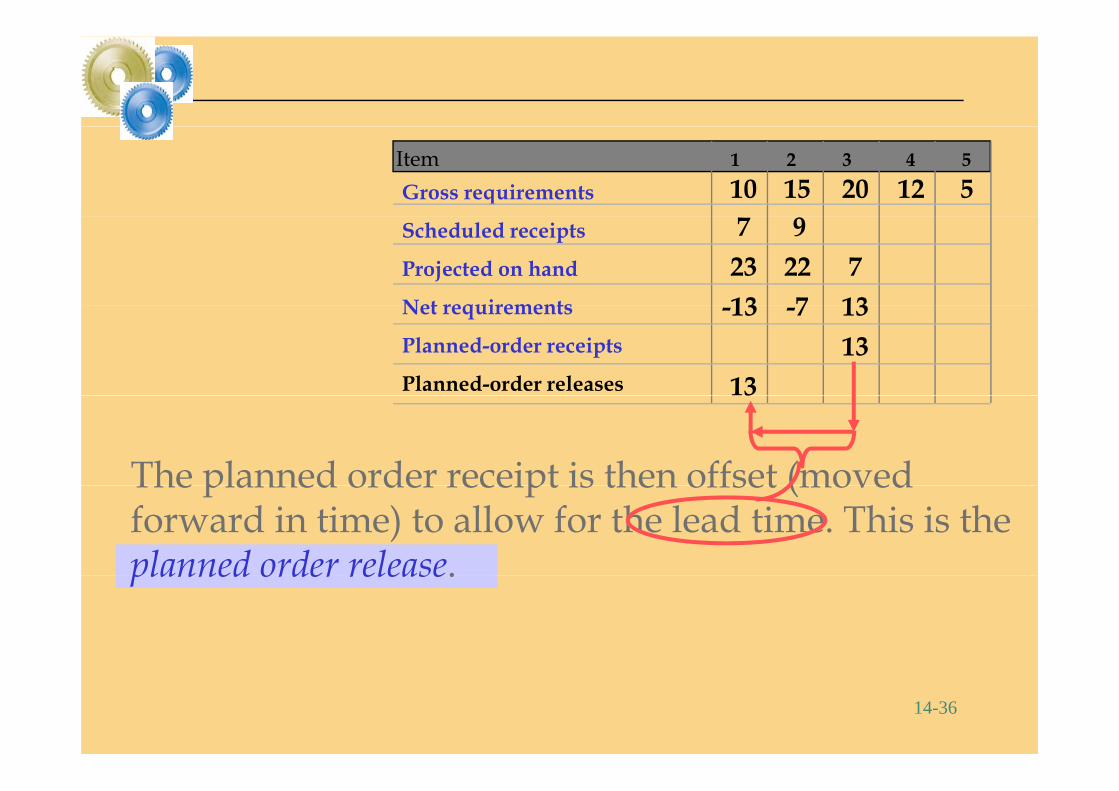
The planned order receipt is then offset (moved
3
The planned order receipt is then offset (moved forward in time) to allow for the lead time. This is the planned order release.planned order release.
14-36
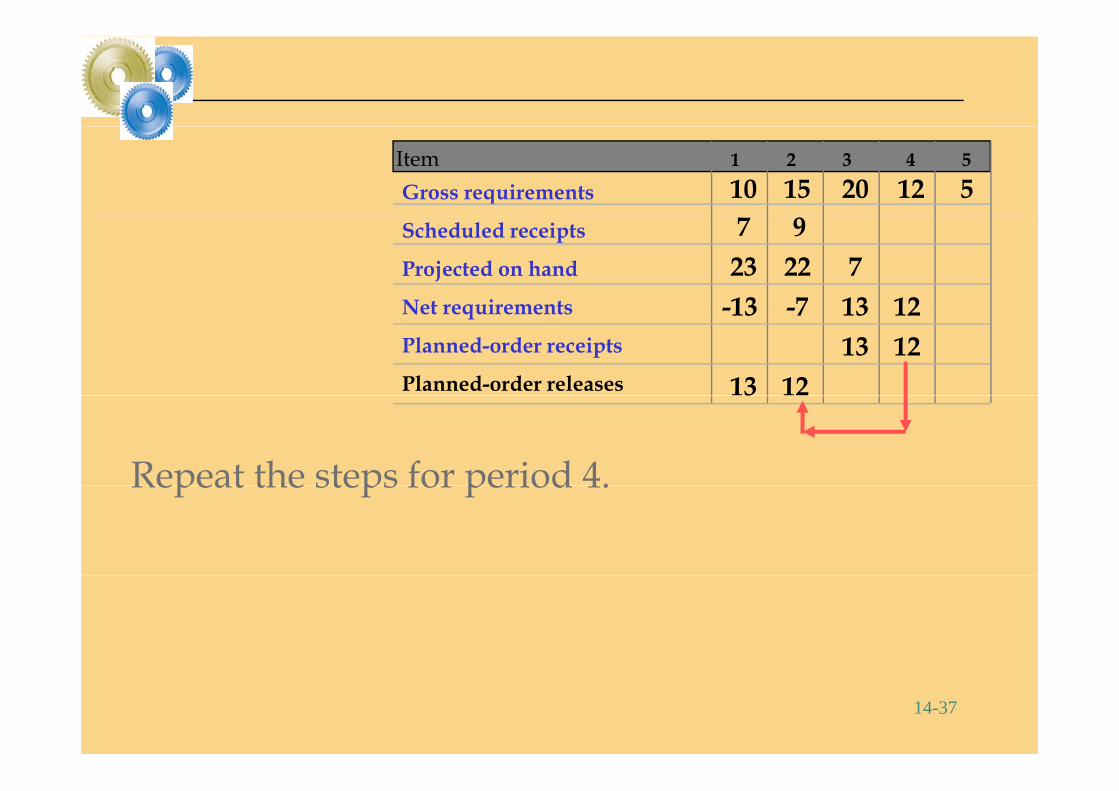
1 2 3 4 5
Gross requirementsItem
10 15 20 12 5Scheduled receipts
Projected on hand
Net requirements
7 92313
227
713 12Net requirements
Planned-order receipts
Planned-order releases
-13 -7 1313
13
1212
12
Repeat the steps for period 4.
3
Repeat the steps for period 4.
14-37
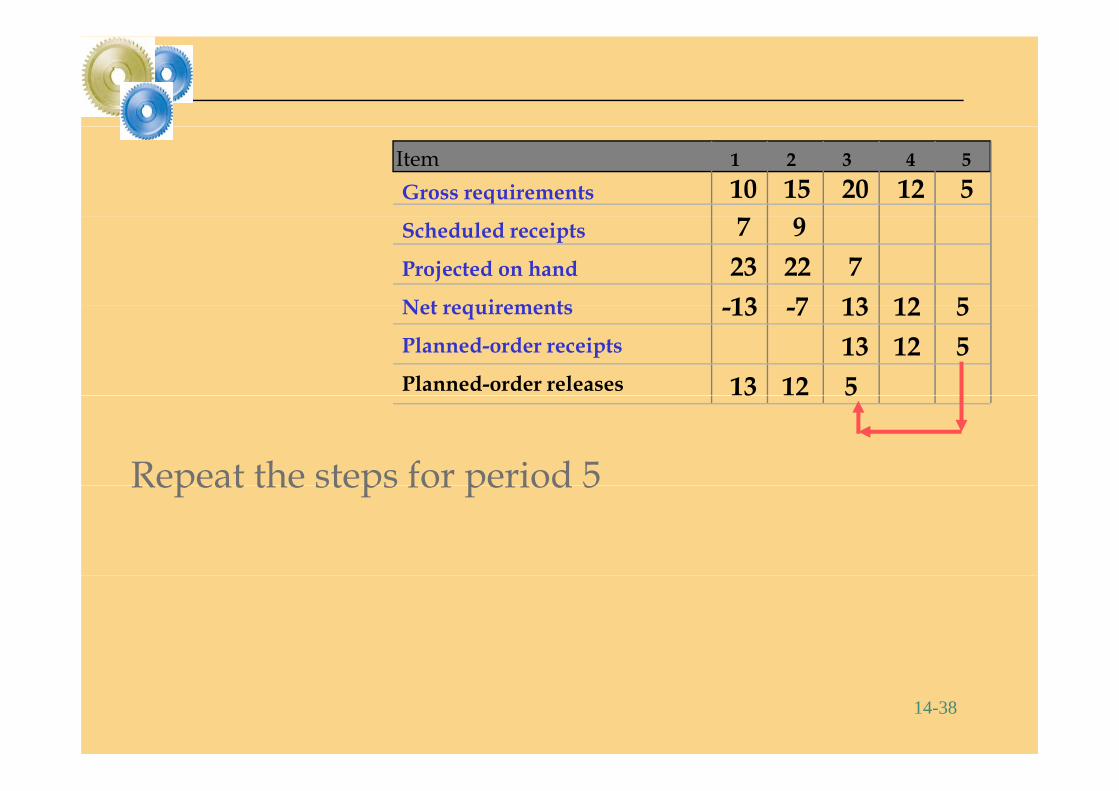
1 2 3 4 5
Gross requirementsItem
10 15 20 12 5Scheduled receipts
Projected on hand
Net requirements
7 92313
227
713 12 5Net requirements
Planned-order receipts
Planned-order releases
-13 -7 1313
13
1212
12
55
5
Repeat the steps for period 5
3 5
Repeat the steps for period 5
14-38
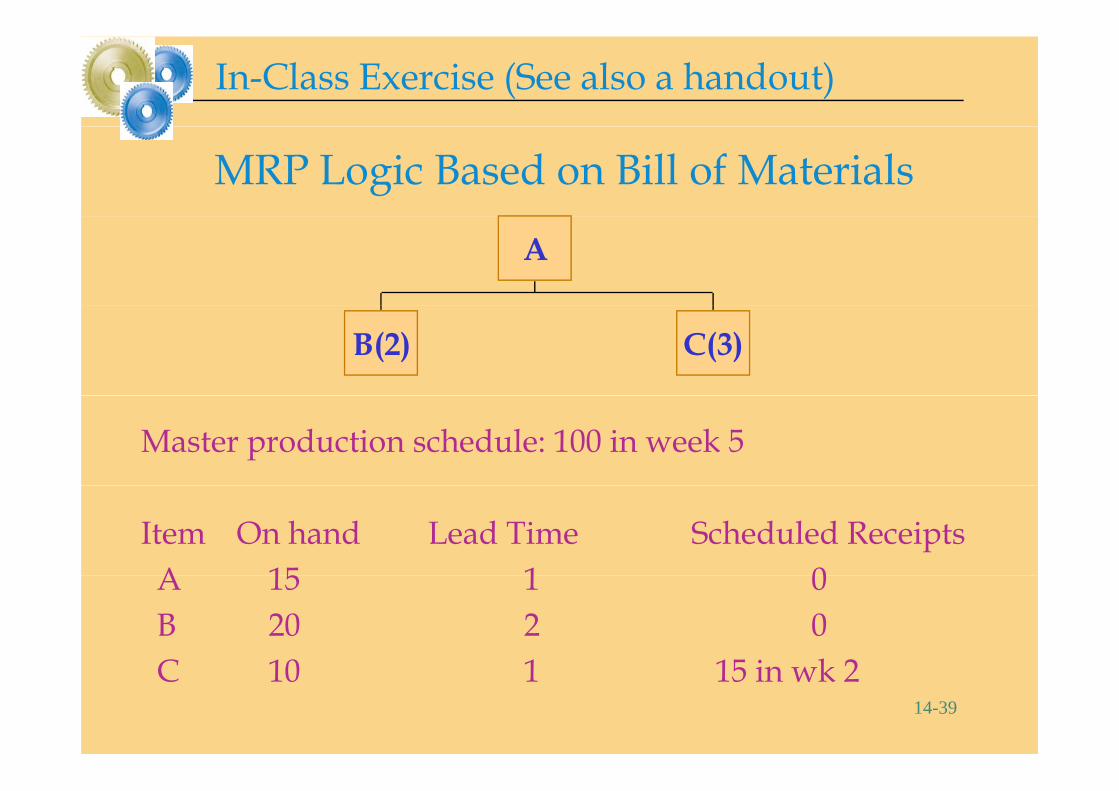
In-Class Exercise (See also a handout)
MRP Logic Based on Bill of Materials
A
B(2) C(3)
Master production schedule: 100 in week 5
Item On hand Lead Time Scheduled ReceiptsA 15 1 0A 15 1 0B 20 2 0C 10 1 15 i k 2
14-39
C 10 1 15 in wk 2

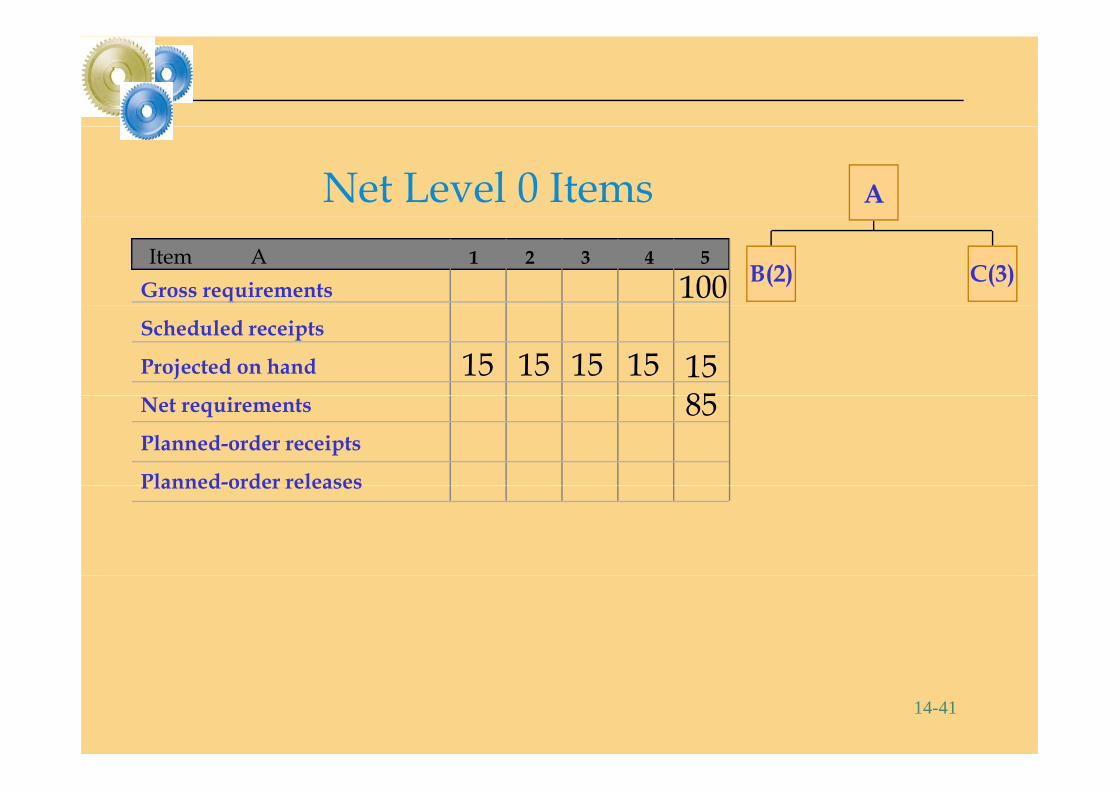
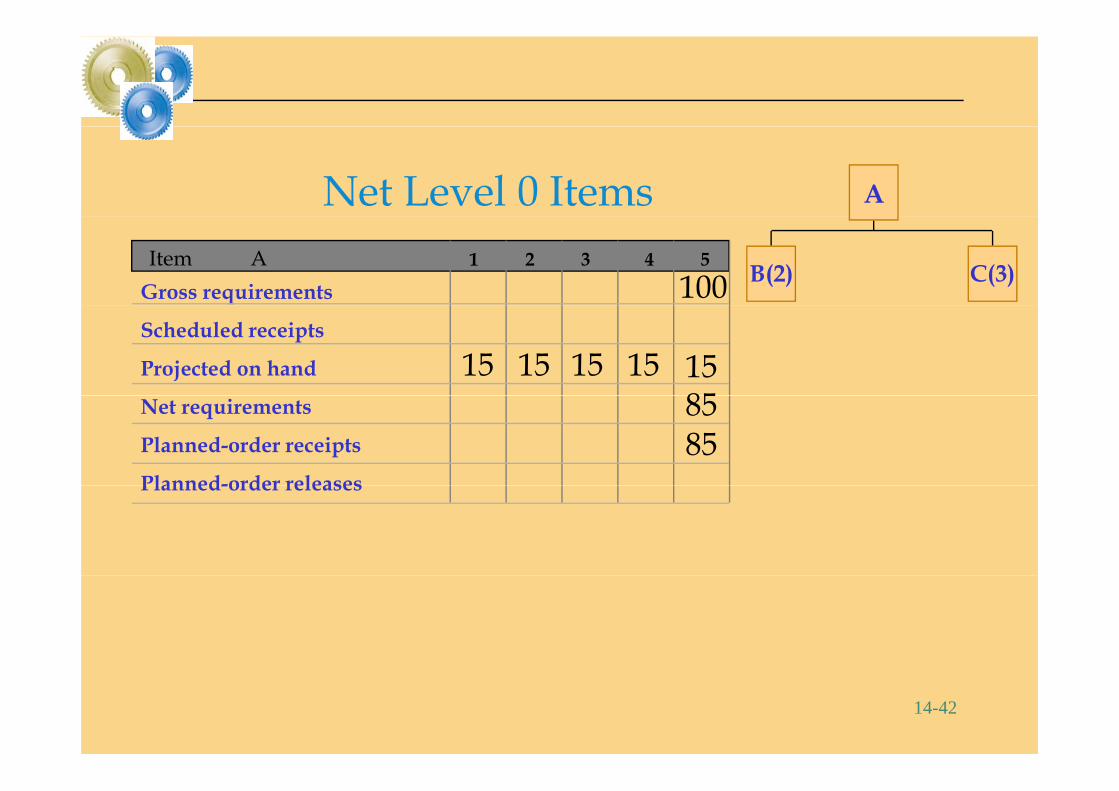
Net Level 0 Items A
1 2 3 4 5
Gross requirementsItem A
B(2) C(3)100Scheduled receipts
Projected on hand 15Net requirements
Planned-order receipts
Planned-order releasesPlanned order releases
14-40
Net Level 0 Items A
1 2 3 4 5
Gross requirementsItem A
B(2) C(3)100Scheduled receipts
Projected on hand 15 1515 151585Net requirements
Planned-order receipts
Planned-order releases
85
Planned order releases
14-41
Net Level 0 Items A
B(2) C(3)1 2 3 4 5
Gross requirementsItem A
100Scheduled receipts
Projected on hand 15 1515 151585Net requirements
Planned-order receipts
Planned-order releases
8585
Planned-order releases
14-42
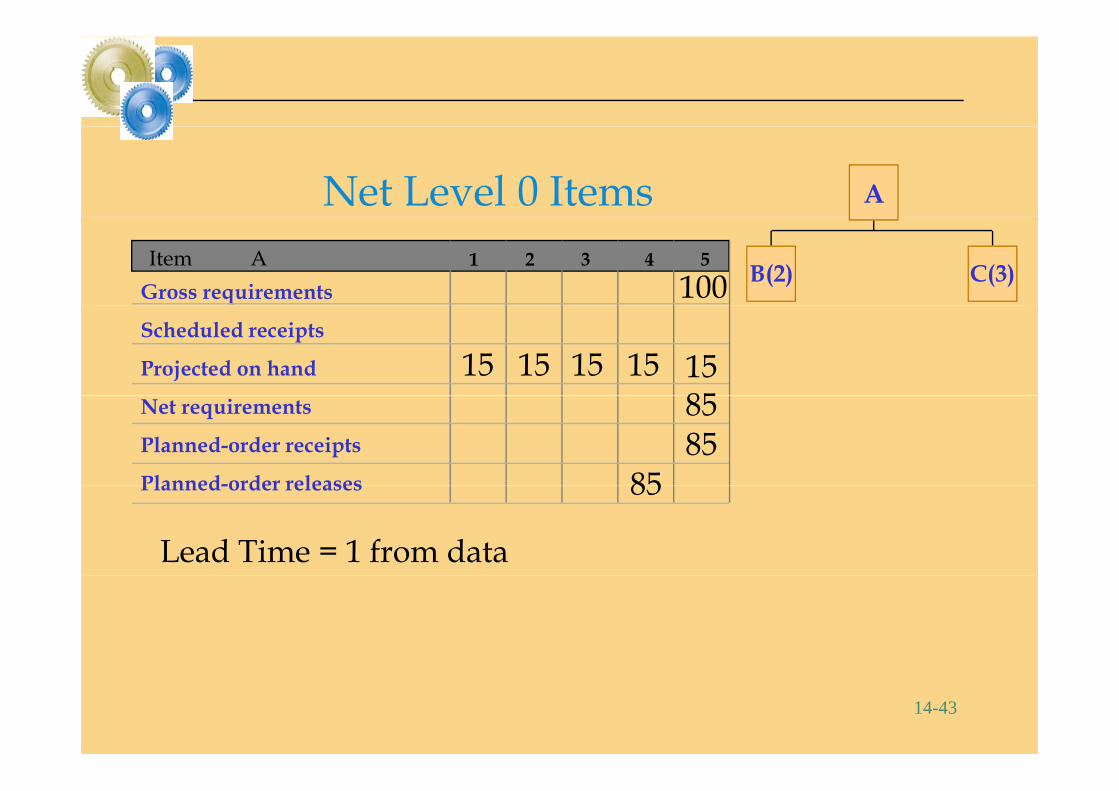
Net Level 0 Items A
B(2) C(3)1 2 3 4 5
Gross requirementsItem A
100Scheduled receipts
Projected on hand 15 1515 151585Net requirements
Planned-order receipts
Planned-order releases
8585
85Planned-order releases 85
Lead Time = 1 from data
14-43
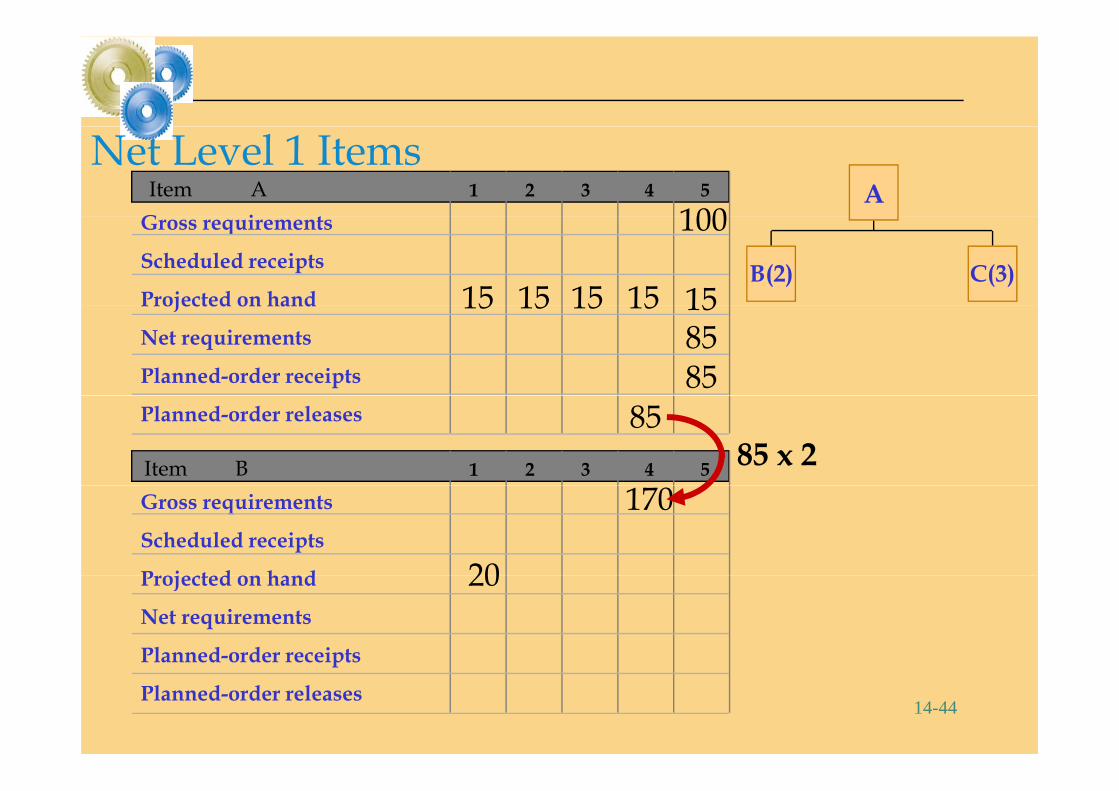
Net Level 1 ItemsA1 2 3 4 5
G iItem A
100B(2) C(3)
Gross requirements
Scheduled receipts
Projected on hand
100
15 1515 1515Projected on hand
Net requirements
Planned-order receipts
15 1515 15158585
Planned-order releases 851 2 3 4 5Item B 85 x 2
Gross requirements
Scheduled receipts
P j t d h d
170
20Projected on hand
Net requirements
Planned-order receipts
20
14-44
p
Planned-order releases
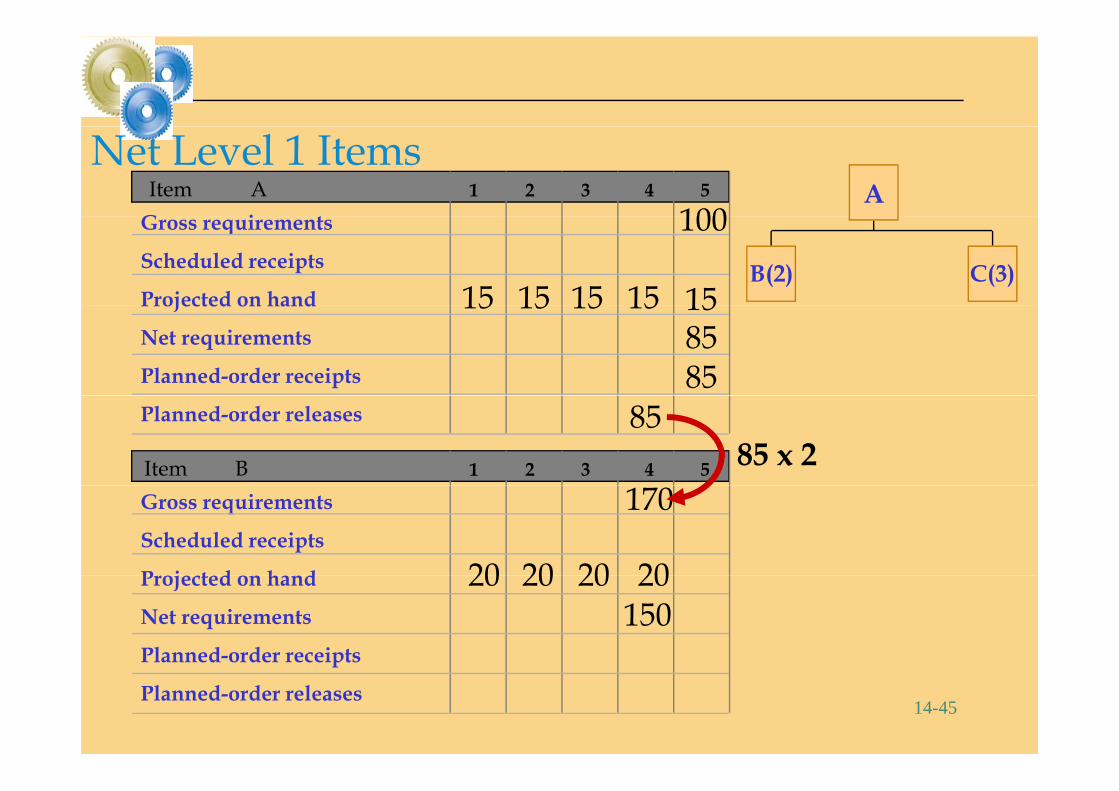
Net Level 1 ItemsA1 2 3 4 5
G iItem A
100B(2) C(3)
Gross requirements
Scheduled receipts
Projected on hand
100
15 1515 1515Projected on hand
Net requirements
Planned-order receipts
15 1515 15158585
Planned-order releases 851 2 3 4 5Item B 85 x 2
Gross requirements
Scheduled receipts
P j t d h d
170
20 20 20 20Projected on hand
Net requirements
Planned-order receipts
20 20 20 20150
14-45
p
Planned-order releases
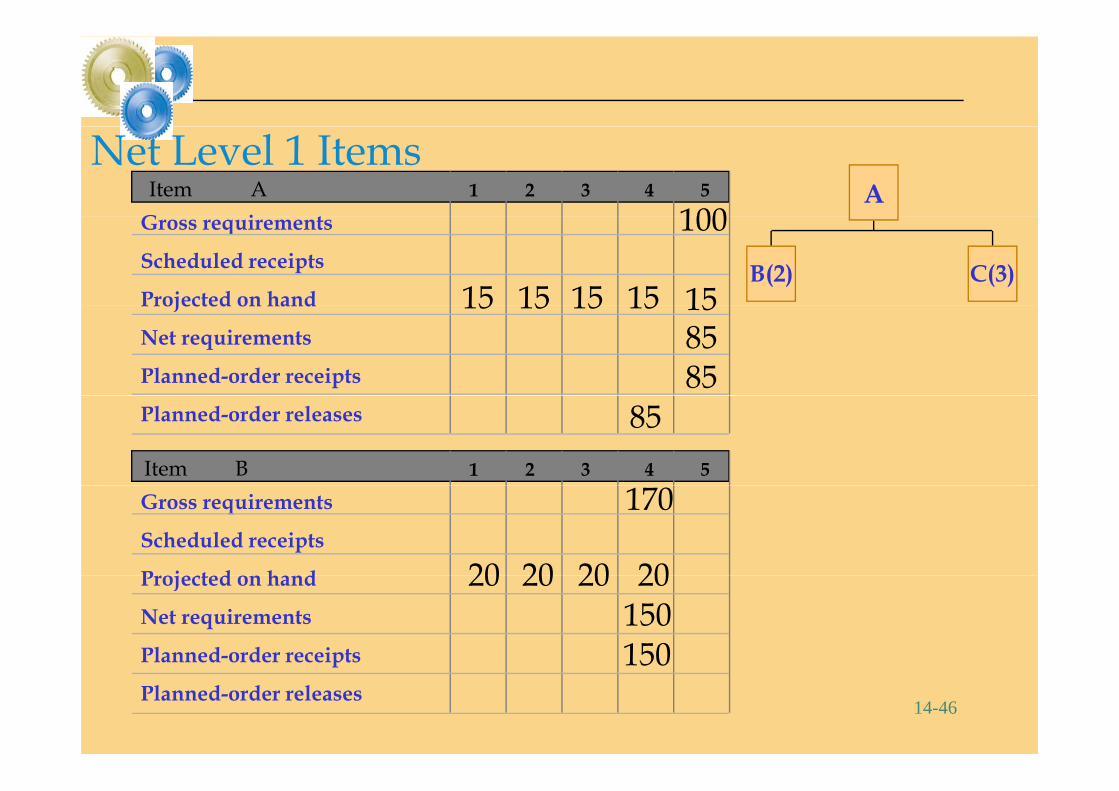
Net Level 1 ItemsA1 2 3 4 5
G iItem A
100B(2) C(3)
Gross requirements
Scheduled receipts
Projected on hand
100
15 1515 1515Projected on hand
Net requirements
Planned-order receipts
15 1515 15158585
Planned-order releases 851 2 3 4 5Item B
Gross requirements
Scheduled receipts
P j t d h d
170
20 20 20 20Projected on hand
Net requirements
Planned-order receipts
20 20 20 20150150
14-46
p
Planned-order releases150
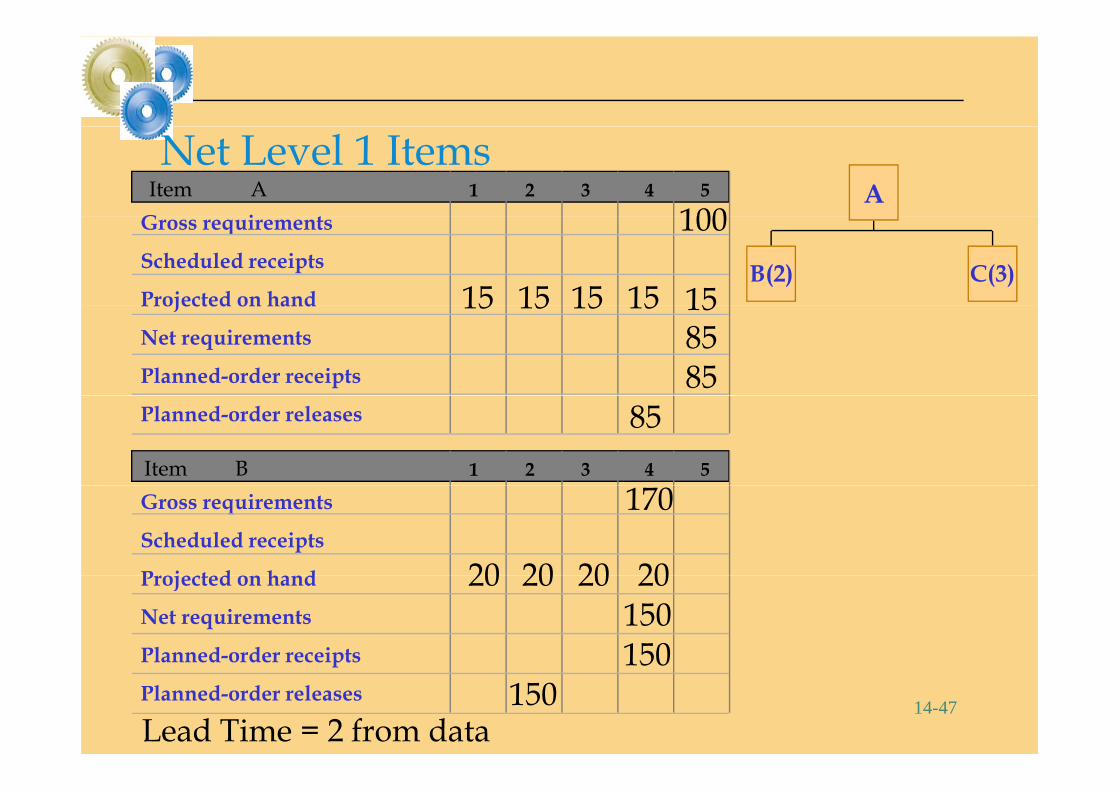
Net Level 1 ItemsA1 2 3 4 5
G iItem A
100B(2) C(3)
Gross requirements
Scheduled receipts
Projected on hand
100
15 1515 1515Projected on hand
Net requirements
Planned-order receipts
15 1515 15158585
Planned-order releases 851 2 3 4 5Item B
Gross requirements
Scheduled receipts
P j t d h d
170
20 20 20 20Projected on hand
Net requirements
Planned-order receipts
20 20 20 20150150
14-47
p
Planned-order releases150
150Lead Time = 2 from data

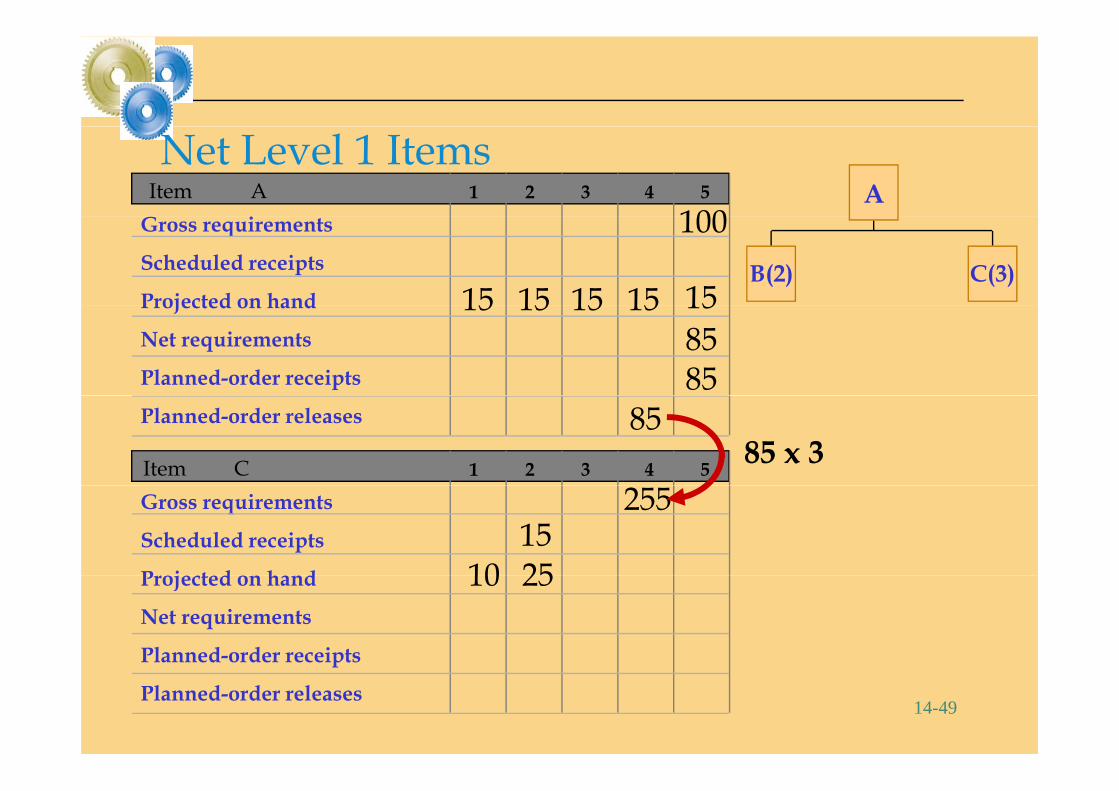
Net Level 1 ItemsA1 2 3 4 5Item A
100B(2) C(3)
Gross requirements
Scheduled receipts
Projected on hand
100
15 1515 1515Projected on hand
Net requirements
Planned-order receipts
15 1515 15158585
Planned-order releases 851 2 3 4 5Item C 85 x 3
Gross requirements
Scheduled receipts
P j t d h d
15255
10Projected on hand
Net requirements
Planned-order receipts
10
14-48
p
Planned-order releases
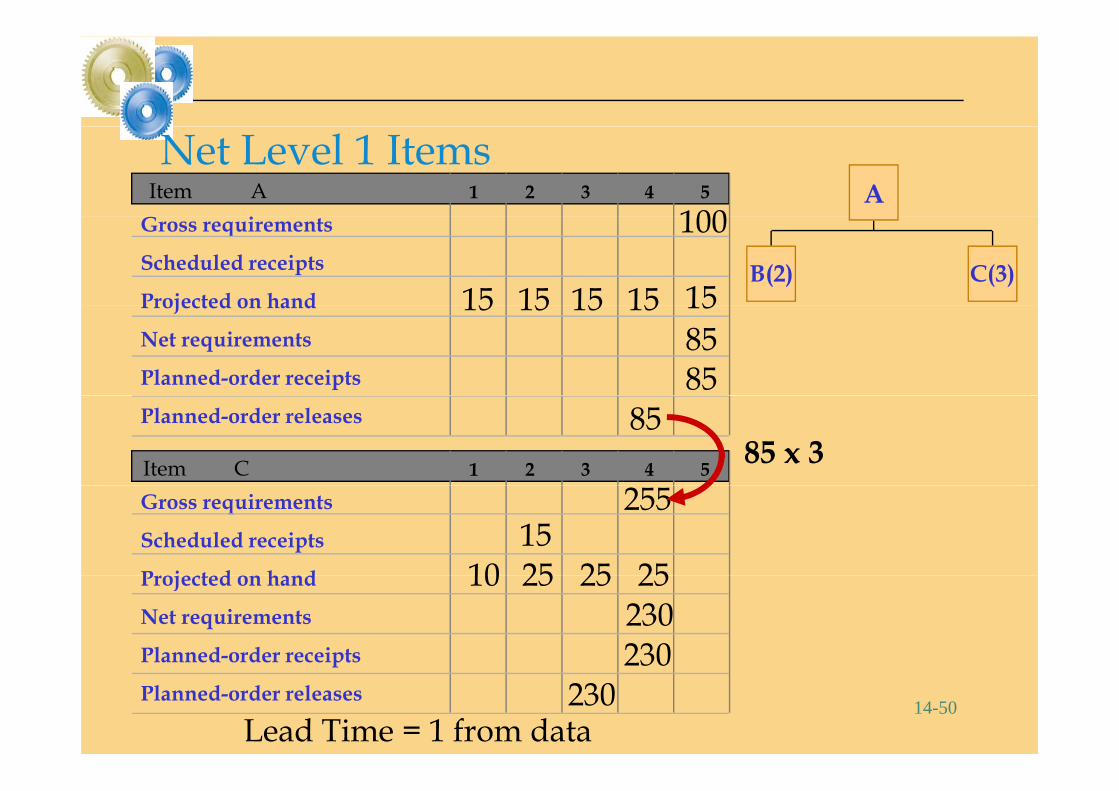
Net Level 1 ItemsA1 2 3 4 5Item A
100B(2) C(3)
Gross requirements
Scheduled receipts
Projected on hand
100
15 1515 1515Projected on hand
Net requirements
Planned-order receipts
15 1515 15158585
Planned-order releases 851 2 3 4 5Item C 85 x 3
Gross requirements
Scheduled receipts
P j t d h d
15255
10 25Projected on hand
Net requirements
Planned-order receipts
10 25
14-49
p
Planned-order releases
Net Level 1 ItemsA1 2 3 4 5Item A
100B(2) C(3)
Gross requirements
Scheduled receipts
Projected on hand
100
15 1515 1515Projected on hand
Net requirements
Planned-order receipts
15 1515 15158585
Planned-order releases 851 2 3 4 5Item C 85 x 3
Gross requirements
Scheduled receipts
P j t d h d
15255
10 25 25 25Projected on hand
Net requirements
Planned-order receipts
10 25 25 25230230
14-50
p
Planned-order releases230
230Lead Time = 1 from data
Pr du t Stru tur TrProduct Structure Tree
A
B(4) C(2)B(4) C(2)
D(2) E(1) D(3) F(2)
14-51
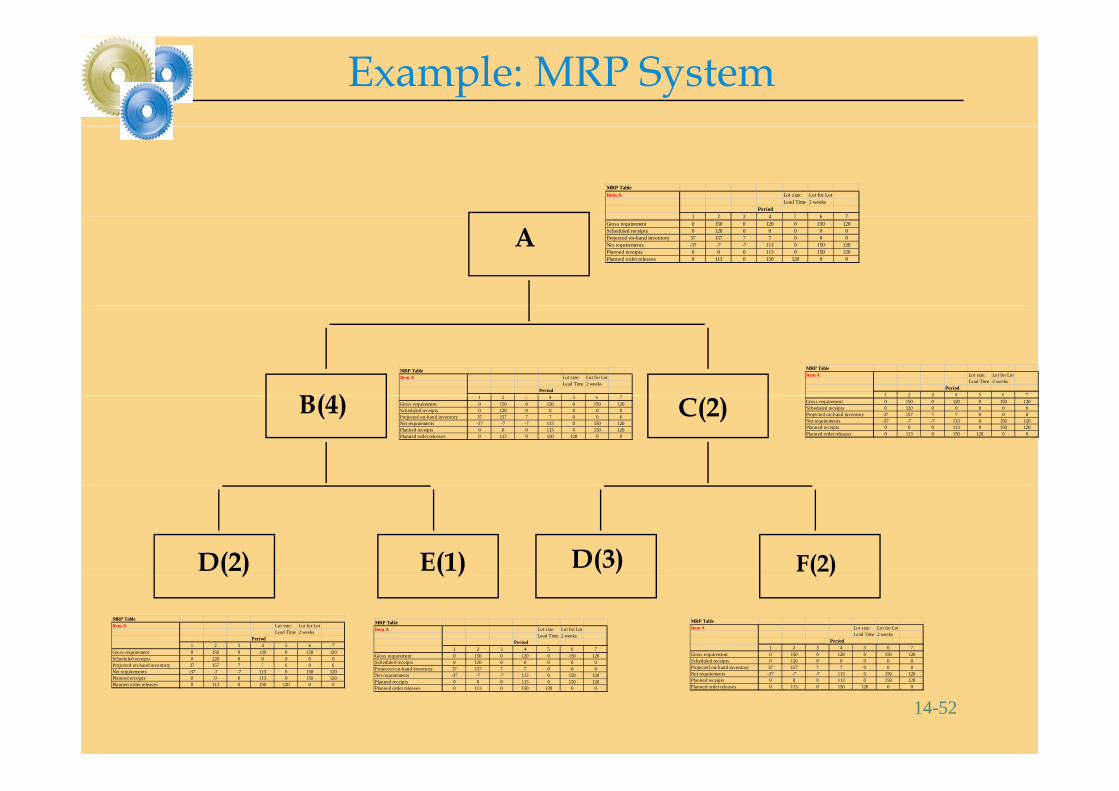
Example: MRP System
MRP TableItem A Lot size: Lot for Lot
Lead Time 2 weeksPeriod
1 2 3 4 5 6 7
A1 2 3 4 5 6 7
Gross requirement 0 150 0 120 0 150 120Scheduled receipts 0 120 0 0 0 0 0Projected on-hand inventory 37 157 7 7 0 0 0Net requirements -37 -7 -7 113 0 150 120Planned receipts 0 0 0 113 0 150 120Planned order releases 0 113 0 150 120 0 0
B(4)MRP TableItem A Lot size: Lot for Lot
Lead Time 2 weeksPeriod
1 2 3 4 5 6 7
MRP TableItem A Lot size: Lot for Lot
Lead Time 2 weeksPeriod
1 2 3 4 5 6 7B(4) C(2)1 2 3 4 5 6 7Gross requirement 0 150 0 120 0 150 120Scheduled receipts 0 120 0 0 0 0 0Projected on-hand inventory 37 157 7 7 0 0 0Net requirements -37 -7 -7 113 0 150 120Planned receipts 0 0 0 113 0 150 120Planned order releases 0 113 0 150 120 0 0
1 2 3 4 5 6 7Gross requirement 0 150 0 120 0 150 120Scheduled receipts 0 120 0 0 0 0 0Projected on-hand inventory 37 157 7 7 0 0 0Net requirements -37 -7 -7 113 0 150 120Planned receipts 0 0 0 113 0 150 120Planned order releases 0 113 0 150 120 0 0
D(2) E(1) D(3) F(2)( ) ( ) ( )
MRP TableItem A Lot size: Lot for Lot
Lead Time 2 weeksPeriod
1 2 3 4 5 6 7Gross requirement 0 150 0 120 0 150 120Scheduled receipts 0 120 0 0 0 0 0
MRP TableItem A Lot size: Lot for Lot
Lead Time 2 weeksPeriod
1 2 3 4 5 6 7Gross requirement 0 150 0 120 0 150 120Scheduled receipts 0 120 0 0 0 0 0Projected on hand inventory 37 157 7 7 0 0 0
MRP TableItem A Lot size: Lot for Lot
Lead Time 2 weeksPeriod
1 2 3 4 5 6 7Gross requirement 0 150 0 120 0 150 120Scheduled receipts 0 120 0 0 0 0 0
14-52
Projected on-hand inventory 37 157 7 7 0 0 0Net requirements -37 -7 -7 113 0 150 120Planned receipts 0 0 0 113 0 150 120Planned order releases 0 113 0 150 120 0 0
Projected on-hand inventory 37 157 7 7 0 0 0Net requirements -37 -7 -7 113 0 150 120Planned receipts 0 0 0 113 0 150 120Planned order releases 0 113 0 150 120 0 0
pProjected on-hand inventory 37 157 7 7 0 0 0Net requirements -37 -7 -7 113 0 150 120Planned receipts 0 0 0 113 0 150 120Planned order releases 0 113 0 150 120 0 0

MRP Dynamics• Modes of operation
– regenerative - batch mode– net change - on-line, real time mode
• System nervousness - frequent changes of y q ginputs to a net change in MRP system
• Pegging - tracing upward in the BOM (Bill of Pegging tracing upward in the BOM (Bill of material) from the component to all of the parent itemsparent items
14-53
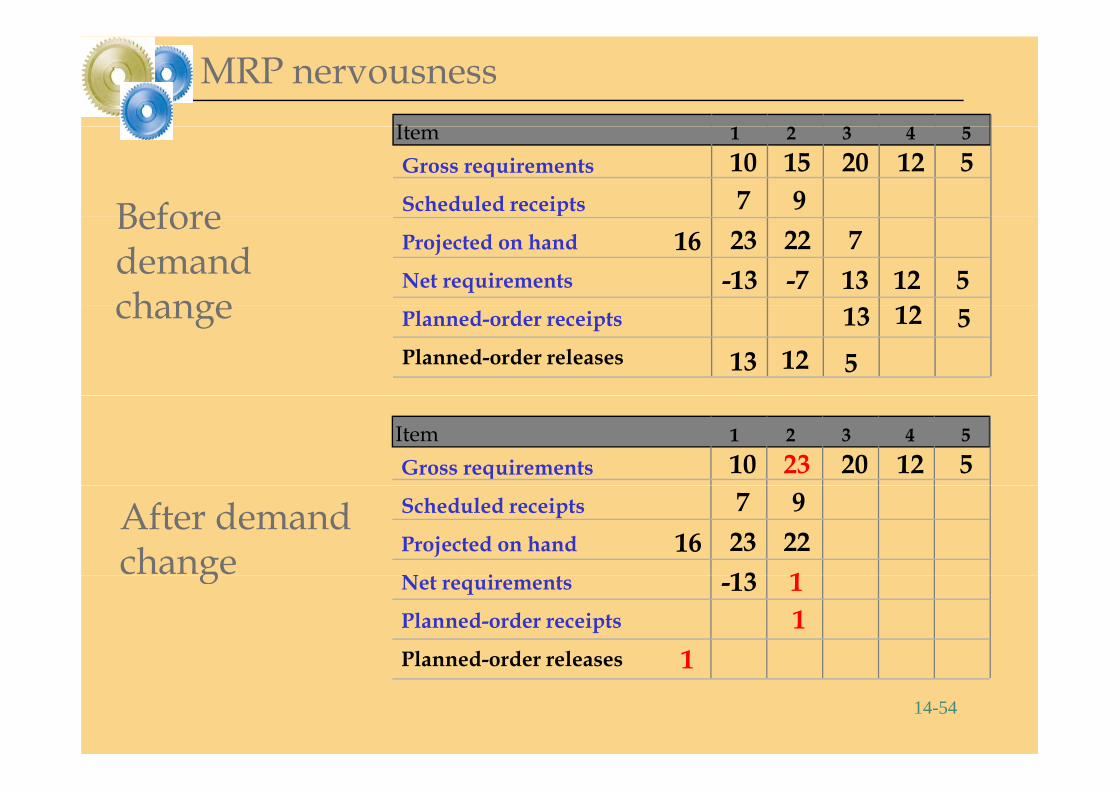
MRP nervousnessIt
Before
1 2 3 4 5
Gross requirements
Scheduled receipts
Item10 15 20 12 57 9Before
demand change
p
Projected on hand
Net requirements
23-13
22-7
713 12 5
12
16
change Planned-order receipts
Planned-order releases 13 12 5
13 12 5
1 2 3 4 5
Gross requirementsItem
10 23 20 12 5
After demand change
Scheduled receipts
Projected on hand
N i
7 92313
221
16gNet requirements
Planned-order receipts
Planned-order releases
-13 11
1
14-54
Planned order releases 1
Other Considerations
• Safety Stock• L t i i• Lot sizing
– Lot-for-lot ordering– Economic order quantity– Fixed-period orderingFixed period ordering– Part-period model
14-55
MRP Outputs
• Planned orders - schedule indicating the amount and timing of future orders.amount and timing of future orders.
• Order releases - authorization for the i f l d dexecution of planned orders.
• Changes - revisions of due dates or gorder quantities, or cancellations of ordersorders.
14-56
Benefits of MRP
• Low levels of in-process inventories• Abilit t t k t i l i t• Ability to track material requirements• Ability to evaluate capacity requirementsy p y q• Means of allocating production time
14-57
Desirable Characteristics for MRPImplementationImplementation
• An effective computer system/Accurate An effective computer system/Accurate computerized bills of material (BOM) and inventory status filesinventory status files
• Manufactures discrete products that are processed through many production stepsthrough many production steps
• Processes requiring long processing ti /R l ti l li bl d t bl l d titimes/Relatively reliable and stable lead times
• Master schedule frozen for a period of time sufficient to procure materials without expediting and confusion
14-58• Top management support and commitment
MRP II
• Expanded MRP with an emphasis placed on integrating
– Financial planningp g– Marketing– Engineering– Purchasing– Manufacturing
14-59
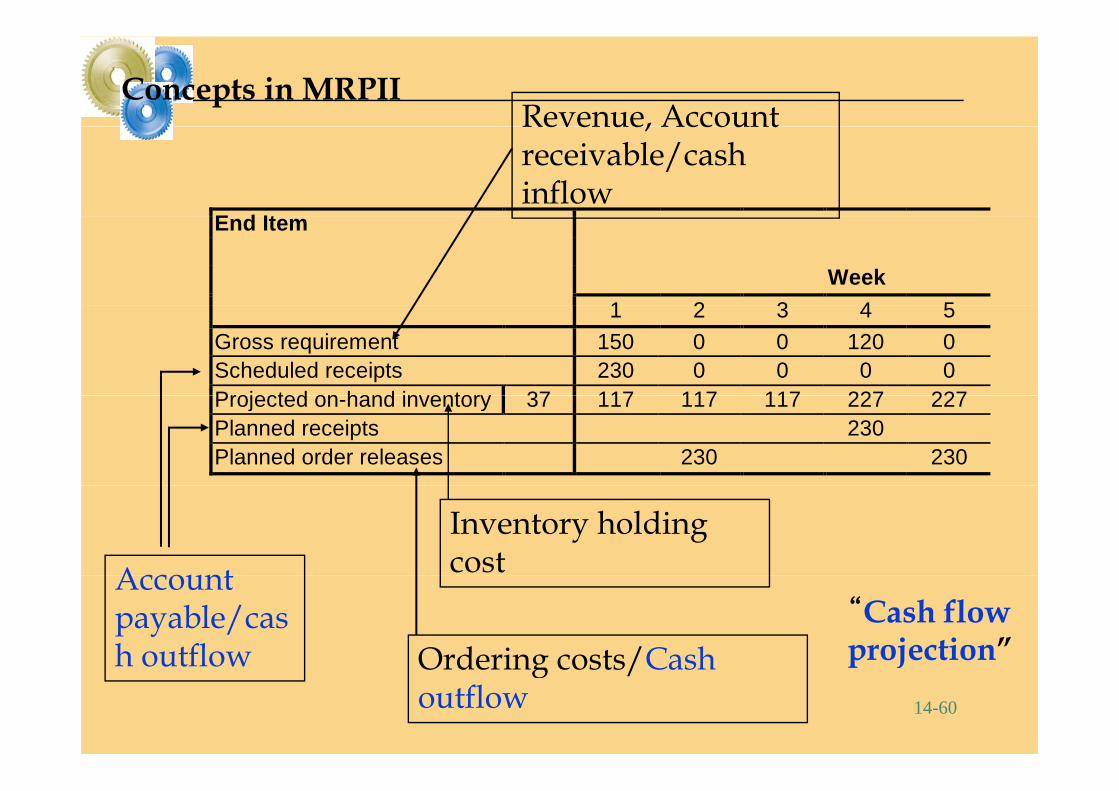
Revenue, Account Concepts in MRPII
E d It
Revenue, Account receivable/cash inflow
End Item
Week 1 2 3 4 51 2 3 4 5
Gross requirement 150 0 0 120 0 Scheduled receipts 230 0 0 0 0 Projected on hand inventory 37 117 117 117 227 227Projected on-hand inventory 37 117 117 117 227 227Planned receipts 230 Planned order releases 230 230
Inventory holding costAccount Account
payable/cash outflow Ordering costs/Cash
“Cash flow projection”
14-60
h outflow Ordering costs/Cash outflow
p j
ERP (Enterprise Resource Planning)
• ERP represents an expanded effort to integrate standardized record-keeping that will permit information sharing among different areas of an organization in order to manage the whole
t ff ti lsystem more effectively.
• Refer to “The ABCs of ERP” in your textbook.
14-61

Ch 14 Chapter 14 MRP & ERP
• Discussion questions– 1, 2, 3, 8, 13
• Solved problemSo ed p ob e– 1, 2
A i d bl• Assigned problems- 1, 2 (Also review Example 2 in your Textbook)
14-62

O !!!WOW!!!
14-63