Embed Size (px)
Citation preview

MRP Methodology, Tables and Figures
Prepared for YouGov on 27 November 2019 by
• Benjamin Lauderdale (University College London)
• Jack Blumenau (University College London)
This report summarises the current electoral situation in the United Kingdom in advance of the general election that
is due to be held on 12 December 2019. The estimates provided here are based on updated versions of the modelling
techniques that we used in the YouGov 2017 UK General Election Model, which correctly predicted the hung parliament and
93% of individual seats. This approach allows us to not just calculate national vote shares, but also to use demographic,
geographic and political patterns in support for different parties across the UK to assess their relative performance in each
parliamentary constituency.
1

Contents
METHODS 3
Data Collection . . . . . . . . . . . . . . . . . . . . . . . . . . . . . . . . . . . . . . . . . . . . . . . . . . . . . 3
Model . . . . . . . . . . . . . . . . . . . . . . . . . . . . . . . . . . . . . . . . . . . . . . . . . . . . . . . . . . 3
Turnout Assumptions . . . . . . . . . . . . . . . . . . . . . . . . . . . . . . . . . . . . . . . . . . . . . . . . . . 4
Survey Questions . . . . . . . . . . . . . . . . . . . . . . . . . . . . . . . . . . . . . . . . . . . . . . . . . . . . 4
Uncertainty . . . . . . . . . . . . . . . . . . . . . . . . . . . . . . . . . . . . . . . . . . . . . . . . . . . . . . . 4
THE CURRENT ELECTORAL SITUATION 5
National Vote and Seat Estimates . . . . . . . . . . . . . . . . . . . . . . . . . . . . . . . . . . . . . . . . . . . . 5
Seat Gains/Losses by Party . . . . . . . . . . . . . . . . . . . . . . . . . . . . . . . . . . . . . . . . . . . . . . . 9
Interval Estimates . . . . . . . . . . . . . . . . . . . . . . . . . . . . . . . . . . . . . . . . . . . . . . . . . . . . 9
DEMOGRAPHIC VOTE TABLES 10
Vote by 2017 vote . . . . . . . . . . . . . . . . . . . . . . . . . . . . . . . . . . . . . . . . . . . . . . . . . . . . 10
Vote by 2017 vote (Scotland) . . . . . . . . . . . . . . . . . . . . . . . . . . . . . . . . . . . . . . . . . . . . . . 11
Vote by 2017 vote (Wales) . . . . . . . . . . . . . . . . . . . . . . . . . . . . . . . . . . . . . . . . . . . . . . . . 11
Vote by 2016 EU referendum vote . . . . . . . . . . . . . . . . . . . . . . . . . . . . . . . . . . . . . . . . . . . 12
Vote by 2016 x 2017 vote . . . . . . . . . . . . . . . . . . . . . . . . . . . . . . . . . . . . . . . . . . . . . . . . 13
Vote by 2019 EU parliament election vote . . . . . . . . . . . . . . . . . . . . . . . . . . . . . . . . . . . . . . . 15
Vote by age . . . . . . . . . . . . . . . . . . . . . . . . . . . . . . . . . . . . . . . . . . . . . . . . . . . . . . . 16
Vote by gender . . . . . . . . . . . . . . . . . . . . . . . . . . . . . . . . . . . . . . . . . . . . . . . . . . . . . . 17
Vote by qualifications . . . . . . . . . . . . . . . . . . . . . . . . . . . . . . . . . . . . . . . . . . . . . . . . . . 17
Vote by (self-reported) attention to politics . . . . . . . . . . . . . . . . . . . . . . . . . . . . . . . . . . . . . . . 18
Vote by ethnicity . . . . . . . . . . . . . . . . . . . . . . . . . . . . . . . . . . . . . . . . . . . . . . . . . . . . . 19
Vote by marital status . . . . . . . . . . . . . . . . . . . . . . . . . . . . . . . . . . . . . . . . . . . . . . . . . . 19
Vote by region . . . . . . . . . . . . . . . . . . . . . . . . . . . . . . . . . . . . . . . . . . . . . . . . . . . . . . 20
CONSTITUENCY ESTIMATES 21
SEAT GAINS/LOSSES 36
Conservative gains/losses . . . . . . . . . . . . . . . . . . . . . . . . . . . . . . . . . . . . . . . . . . . . . . . . 36
Labour gains/losses . . . . . . . . . . . . . . . . . . . . . . . . . . . . . . . . . . . . . . . . . . . . . . . . . . . 39
Liberal Democrat gains/losses . . . . . . . . . . . . . . . . . . . . . . . . . . . . . . . . . . . . . . . . . . . . . 42
Scottish National Party gains/losses . . . . . . . . . . . . . . . . . . . . . . . . . . . . . . . . . . . . . . . . . . 43
Brexit Party gains/losses . . . . . . . . . . . . . . . . . . . . . . . . . . . . . . . . . . . . . . . . . . . . . . . . 44
Plaid Cymru gains/losses . . . . . . . . . . . . . . . . . . . . . . . . . . . . . . . . . . . . . . . . . . . . . . . . 44
FIGURES 45
Constituency Vote Share by 2017 Constituency Vote Share . . . . . . . . . . . . . . . . . . . . . . . . . . . . . . 45
Constituency Vote Share by 2015 Constituency Vote Share . . . . . . . . . . . . . . . . . . . . . . . . . . . . . . 45
Constituency Vote Share by 2010 Constituency Vote Share . . . . . . . . . . . . . . . . . . . . . . . . . . . . . . 46
Vote by age and 2017 vote . . . . . . . . . . . . . . . . . . . . . . . . . . . . . . . . . . . . . . . . . . . . . . . 47
Vote by referendum vote and 2017 vote . . . . . . . . . . . . . . . . . . . . . . . . . . . . . . . . . . . . . . . . . 48
Vote by qualifications and 2017 vote . . . . . . . . . . . . . . . . . . . . . . . . . . . . . . . . . . . . . . . . . . 49
2

METHODS
Data Collection
A sample of 13525 politically and demographically representative respondents was taken covering the entire UK (excluding
Northern Ireland). An additional top-up sample of 86794 respondents was taken from across the YouGov panel. All the
analyses below use both samples combined, but adjusting the latter data to match the national levels of the former. The
period of data collection used in this report was 2019-11-20 to 2019-11-26. We have an average of 159 observations for the
average constituency.
Model
There are not enough observations in individual constituencies to treat the data as separate constituency polls, but we can
look for patterns in responses across constituencies that have similar characteristics, and then work out the implications
of those patterns for each constituency. This strategy of “multilevel regression and post-stratification” or MRP is the same
approach we used in the 2017 YouGov election model that correctly predicted the hung parliament and 93% of individual
constituency winners.
Our modelling approach proceeds in two steps. First, we build a detailed description of which kinds of people live
where in the UK. This “population model” tells us how many people we think voted in different ways in recent elections, are
of each age, gender, level of educational qualifications, etc, and all the combinations of these, in each UK parliamentary
constituency. The population model is constructed from a number of sources, including past election results, a variety of
types of survey data and UK census data.
Second, we use the YouGov survey data described above to build a survey response model of current voting intention
(or of responses to any of the questions listed below). This is a model of how voting intention is associated with the individual
level characteristics that are in our description of the population plus characteristics of parliamentary constituencies. The
survey data might indicate that people with different educational qualifications are giving different patterns of responses,
or that different parts of the UK are giving different responses, or other similar patterns. The model describes all of these
patterns, and allows us to make predictions about how individuals with any combination of characteristics would respond to
the survey question.
Once we have these two things, we can systematically go through all the types of people that our population model says
exist and use the survey response model to predict vote intention (or any other survey measure) for individuals of each type.
For example, our population model tells us that there are some number of women who are 31-35 year-old, with a university
degree, who voted Remain in 2016 and Liberal Democrat in 2017, and who live in the Twickenham constituency in London.
Our survey response model then gives us a prediction of their survey response (whether vote intention or something else).
We can then tally up these predictions for all the individuals that our population model says exist in the UK population, which
gives us an estimate for the UK as a whole. Alternatively, we can tally up those predictions for each constituency separately,
yielding estimates for every constituency, or by any other characteristic that we have used in the population model (age,
gender, qualifications, etc). The survey response model captures the demographic patterns in how people are responding,
and then this “post-stratification” step works out the implications given the variable demographic composition of different
places (or groups) in the UK.
The models we have developed for this project look for patterns as a function of a number of variables, including individual
2017 vote, referendum vote, sex, age, qualifications, housing tenure, marital status and ethnicity. At the level of constituen-
cies, we look for patterns as a function of the electoral history of the constituency, EU referendum vote, region/country, and
several other variables. We also use interactions of these that ensure we are sensitive to local political context. For example,
at the 2017 election, young Remain-voting 2015 Conservative voters were more likely to defect to Labour in seats where
Labour was stronger and to the Liberal Democrats in seats where the Liberal Democrats were stronger.
3
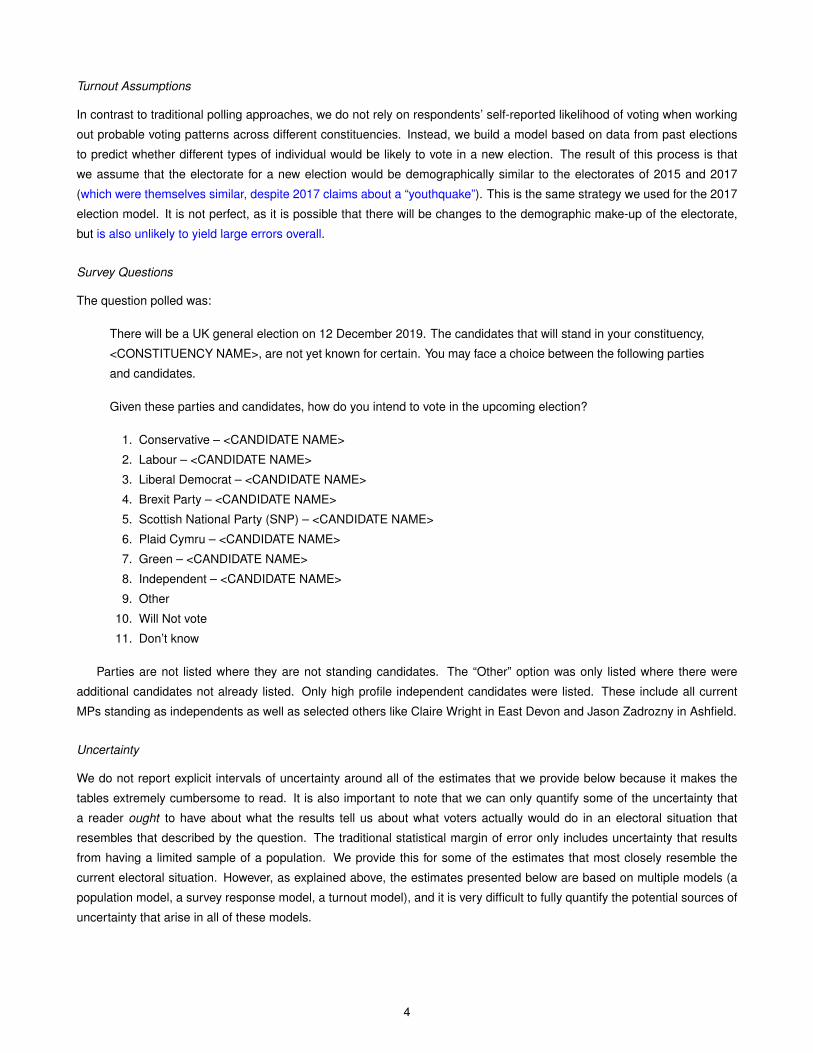
Turnout Assumptions
In contrast to traditional polling approaches, we do not rely on respondents’ self-reported likelihood of voting when working
out probable voting patterns across different constituencies. Instead, we build a model based on data from past elections
to predict whether different types of individual would be likely to vote in a new election. The result of this process is that
we assume that the electorate for a new election would be demographically similar to the electorates of 2015 and 2017
(which were themselves similar, despite 2017 claims about a “youthquake”). This is the same strategy we used for the 2017
election model. It is not perfect, as it is possible that there will be changes to the demographic make-up of the electorate,
but is also unlikely to yield large errors overall.
Survey Questions
The question polled was:
There will be a UK general election on 12 December 2019. The candidates that will stand in your constituency,
<CONSTITUENCY NAME>, are not yet known for certain. You may face a choice between the following parties
and candidates.
Given these parties and candidates, how do you intend to vote in the upcoming election?
1. Conservative – <CANDIDATE NAME>
2. Labour – <CANDIDATE NAME>
3. Liberal Democrat – <CANDIDATE NAME>
4. Brexit Party – <CANDIDATE NAME>
5. Scottish National Party (SNP) – <CANDIDATE NAME>
6. Plaid Cymru – <CANDIDATE NAME>
7. Green – <CANDIDATE NAME>
8. Independent – <CANDIDATE NAME>
9. Other
10. Will Not vote
11. Don’t know
Parties are not listed where they are not standing candidates. The “Other” option was only listed where there were
additional candidates not already listed. Only high profile independent candidates were listed. These include all current
MPs standing as independents as well as selected others like Claire Wright in East Devon and Jason Zadrozny in Ashfield.
Uncertainty
We do not report explicit intervals of uncertainty around all of the estimates that we provide below because it makes the
tables extremely cumbersome to read. It is also important to note that we can only quantify some of the uncertainty that
a reader ought to have about what the results tell us about what voters actually would do in an electoral situation that
resembles that described by the question. The traditional statistical margin of error only includes uncertainty that results
from having a limited sample of a population. We provide this for some of the estimates that most closely resemble the
current electoral situation. However, as explained above, the estimates presented below are based on multiple models (a
population model, a survey response model, a turnout model), and it is very difficult to fully quantify the potential sources of
uncertainty that arise in all of these models.
4

THE CURRENT ELECTORAL SITUATION
National Vote and Seat Estimates
Table 1: Current estimated seat counts
2017 Result Estimate Interval
Con 317 359 [328 - 385]
Lab 262 211 [187 - 238]
LD 12 13 [9 - 20]
Brexit 0 0 [0 - 0]
Green 1 1 [1 - 1]
SNP 35 43 [29 - 54]
PC 4 4 [2 - 5]
Other 1 1 [1 - 2]
Table 2: Current estimated vote shares
2017 Result Estimate Interval
Con 43.4 42.9 [40.3 - 45.7]
Lab 41.0 31.8 [29.0 - 34.5]
LD 7.6 13.6 [11.7 - 15.8]
Brexit 1.9 3.1 [2.2 - 4.2]
Green 1.7 3.2 [2.3 - 4.2]
SNP 3.1 3.4 [2.5 - 4.5]
PC 0.5 0.5 [0.2 - 0.9]
Other 0.8 1.4 [0.8 - 2.2]
5

The maps below show the predicted winning party (left) and runner up (right) for each constituency:
Con
Green
Lab
LD
Other
PC
SNP
6

Brexit
Con
Green
Lab
LD
Other
PC
SNP
7

4 6 8 10 12 14 16
320
340
360
380
400
Con
GB Con−Lab Margin (% points)
Sea
ts
The plot above shows the “seats-votes” curves for Conservative seats given the Conservative - Labour national vote
margin.
8

Seat Gains/Losses by Party
Table 3: Current seats (column) by 2017 seats (row)
Con Lab LD Brexit Green SNP PC Other
Con17 312 0 3 0 0 2 0 0
Lab17 44 211 1 0 0 5 0 1
LD17 2 0 9 0 0 1 0 0
UKIP17 0 0 0 0 0 0 0 0
Green17 0 0 0 0 1 0 0 0
SNP17 0 0 0 0 0 35 0 0
PC17 0 0 0 0 0 0 4 0
Other17 1 0 0 0 0 0 0 0
Interval Estimates
SNP17 −> Con
PC17 −> Con
Con17 −> Lab
SNP17 −> Lab
SNP17 −> LD
PC17 −> LD
Lab17 −> PC
Con17 −> Other
Other17 −> Con
Lab17 −> LD
LD17 −> SNP
Lab17 −> Other
LD17 −> Con
Con17 −> SNP
Con17 −> LD
Lab17 −> SNP
Lab17 −> Con
0 5 10 15 20 25 30 35 40 45 50 55 60 65 70Seats
9

DEMOGRAPHIC VOTE TABLES
The following tables provide current vote intention by various demographic variables.
Vote by 2017 vote
Table 4: Current vote (column) by 2017 vote (row), row percentages.
Con Lab LD Brexit Green SNP PC Other Turnout Fraction
Con 17 83 4 8 3 1 0 0 1 92 39
Lab 17 11 71 10 2 3 1 0 1 88 35
LD 17 12 16 65 1 3 1 0 1 92 7
UKIP 17 59 7 3 25 2 0 0 4 94 2
Green 17 17 21 16 2 41 0 0 3 89 1
SNP 17 5 5 1 0 1 88 0 0 89 3
PC 17 17 10 4 10 1 0 59 0 92 0
Other 17 37 19 15 6 4 2 0 16 83 1
None 17 42 28 14 5 4 4 0 2 25 11
Ineligible 17 20 50 16 2 8 3 0 1 52 2
Table 5: Current vote (column) by 2017 vote (row), proportions of all
projected voters.
Con Lab LD Brexit Green SNP PC Other Total
Con 17 31.8 1.4 3.3 1.1 0.5 0.1 0.0 0.4 38.5
Lab 17 3.7 24.5 3.6 0.8 1.1 0.4 0.1 0.5 34.8
LD 17 0.8 1.1 4.4 0.1 0.2 0.1 0.0 0.1 6.7
UKIP 17 1.0 0.1 0.0 0.4 0.0 0.0 0.0 0.1 1.7
Green 17 0.2 0.3 0.2 0.0 0.6 0.0 0.0 0.0 1.4
SNP 17 0.1 0.1 0.0 0.0 0.0 2.3 0.0 0.0 2.7
PC 17 0.1 0.0 0.0 0.0 0.0 0.0 0.3 0.0 0.5
Other 17 0.2 0.1 0.1 0.0 0.0 0.0 0.0 0.1 0.5
None 17 4.4 3.0 1.5 0.6 0.5 0.4 0.0 0.3 10.8
Ineligible 17 0.5 1.2 0.4 0.1 0.2 0.1 0.0 0.0 2.5
Total 42.9 31.9 13.6 3.1 3.2 3.4 0.5 1.5 100.0
10

Vote by 2017 vote (Scotland)
Table 6: Current vote (column) by 2017 vote (row), row percentages.
Con Lab LD Brexit Green SNP PC Other Turnout Fraction
Con 17 80 4 10 1 1 3 0 0 92 25
Lab 17 10 54 11 1 2 23 0 1 85 22
LD 17 11 8 67 1 2 11 0 1 88 6
UKIP 17 66 9 4 12 1 5 0 5 96 0
Green 17 7 12 8 1 42 28 0 1 74 0
SNP 17 5 5 1 0 1 88 0 0 89 32
PC 17 NA NA NA NA NA NA NA NA NA NA
Other 17 26 14 8 4 1 46 0 2 95 0
None 17 22 20 13 1 1 42 0 1 24 12
Ineligible 17 17 32 13 1 4 32 0 1 52 2
Vote by 2017 vote (Wales)
Table 7: Current vote (column) by 2017 vote (row), row percentages.
Con Lab LD Brexit Green SNP PC Other Turnout Fraction
Con 17 82 5 5 6 0 0 2 0 94 30
Lab 17 9 77 4 5 1 0 4 0 88 42
LD 17 13 22 51 3 2 0 7 1 93 4
UKIP 17 45 5 1 44 1 0 2 1 96 2
Green 17 12 33 20 3 21 0 9 2 85 0
SNP 17 NA NA NA NA NA NA NA NA NA NA
PC 17 17 10 4 10 1 0 59 0 92 9
Other 17 52 22 4 12 2 0 6 2 89 0
None 17 34 35 9 11 2 0 8 1 24 10
Ineligible 17 16 62 8 3 3 0 7 1 52 3
11

Vote by 2016 EU referendum vote
Table 8: Current vote (column) by EU vote (row), row percentages.
Con Lab LD Brexit Green SNP PC Other Turnout Fraction
Leave 16 66 18 4 6 2 2 0 2 90 46
Remain 16 22 44 23 0 4 5 1 1 93 44
Did not vote 16 29 43 15 2 4 5 0 2 15 6
Ineligible 16 21 52 14 2 6 3 0 1 54 4
Table 9: Current vote (column) by 2016 vote (row), proportions of all
projected voters.
Con Lab LD Brexit Green SNP PC Other Total
Leave 16 30.6 8.3 2.0 2.8 1.0 0.7 0.1 0.8 46.3
Remain 16 9.8 19.3 10.2 0.2 1.7 2.3 0.3 0.5 44.3
Did not vote 16 1.7 2.4 0.8 0.1 0.2 0.3 0.0 0.1 5.7
Ineligible 16 0.8 1.9 0.5 0.1 0.2 0.1 0.0 0.1 3.7
Total 42.9 31.9 13.6 3.1 3.2 3.4 0.5 1.5 100.0
12

Vote by 2016 x 2017 vote
Table 10: Current vote (column) by 2016 and 2017 vote combinations (row), row propor-
tions.
Con Lab LD Brexit Green SNP PC Other Fraction
Leave 16 - Con 17 90 2 2 4 1 0 0 1 25
Leave 16 - Lab 17 25 57 5 7 3 1 0 2 11
Leave 16 - LD 17 42 13 33 5 4 1 0 2 1
Leave 16 - UKIP 17 60 6 2 25 2 0 0 5 2
Leave 16 - Green 17 32 13 8 5 38 0 0 4 1
Leave 16 - SNP 17 14 7 2 1 1 75 0 0 1
Leave 16 - PC 17 31 6 2 22 0 0 38 0 0
Leave 16 - Other 17 51 11 4 12 3 2 0 17 0
Leave 16 - None 17 60 17 6 9 3 1 0 3 5
Leave 16 - Ineligible 17 0 0 0 0 0 0 0 0 0
Remain 16 - Con 17 67 6 21 1 2 1 0 1 12
Remain 16 - Lab 17 3 77 13 0 3 1 0 1 21
Remain 16 - LD 17 5 17 73 0 3 1 0 1 5
Remain 16 - UKIP 17 44 20 19 9 4 0 0 3 0
Remain 16 - Green 17 5 27 22 0 43 0 0 2 1
Remain 16 - SNP 17 1 4 1 0 1 93 0 0 2
Remain 16 - PC 17 6 11 6 1 1 0 74 0 0
Remain 16 - Other 17 22 22 29 2 6 2 0 17 0
Remain 16 - None 17 19 38 27 1 6 7 1 2 3
Remain 16 - Ineligible 17 0 0 0 0 0 0 0 0 0
Did not vote 16 - Con 17 77 7 10 2 2 0 0 1 1
Did not vote 16 - Lab 17 8 73 11 1 4 3 0 2 2
Did not vote 16 - LD 17 14 17 61 2 4 2 0 1 0
Did not vote 16 - UKIP 17 45 19 9 18 3 0 0 5 0
Did not vote 16 - Green 17 13 17 18 2 46 1 0 2 0
Did not vote 16 - SNP 17 3 6 1 0 1 89 0 0 0
Did not vote 16 - PC 17 17 25 7 8 1 0 41 1 0
Did not vote 16 - Other 17 33 36 10 4 4 0 0 13 0
Did not vote 16 - None 17 30 37 17 3 6 4 0 2 2
Did not vote 16 - Ineligible 17 0 0 0 0 0 0 0 0 0
Ineligible 16 - Con 17 65 16 13 1 3 0 1 1 0
Ineligible 16 - Lab 17 6 78 9 1 3 1 0 1 1
Ineligible 16 - LD 17 10 33 49 1 5 2 0 1 0
Ineligible 16 - UKIP 17 33 33 10 16 3 0 1 3 0
Ineligible 16 - Green 17 8 38 12 1 40 0 0 2 0
Ineligible 16 - SNP 17 2 10 2 0 1 84 0 0 0
Ineligible 16 - PC 17 2 34 6 2 0 0 55 1 0
Ineligible 16 - Other 17 25 37 10 2 9 1 0 15 0
Ineligible 16 - None 17 23 52 11 2 4 5 1 2 0
Ineligible 16 - Ineligible 17 20 50 16 2 8 3 0 2 2
13

Table 11: Current vote (column) by 2016 and 2017 vote combinations (row), proportions
of all projected voters.
Con Lab LD Brexit Green SNP PC Other Fraction
Leave 16 - Con 17 22.6 0.5 0.6 1.0 0.2 0.0 0.0 0.2 25.1
Leave 16 - Lab 17 2.8 6.4 0.6 0.7 0.4 0.1 0.0 0.2 11.3
Leave 16 - LD 17 0.5 0.2 0.4 0.1 0.1 0.0 0.0 0.0 1.2
Leave 16 - UKIP 17 1.0 0.1 0.0 0.4 0.0 0.0 0.0 0.1 1.6
Leave 16 - Green 17 0.2 0.1 0.0 0.0 0.2 0.0 0.0 0.0 0.6
Leave 16 - SNP 17 0.1 0.0 0.0 0.0 0.0 0.5 0.0 0.0 0.7
Leave 16 - PC 17 0.1 0.0 0.0 0.0 0.0 0.0 0.1 0.0 0.2
Leave 16 - Other 17 0.1 0.0 0.0 0.0 0.0 0.0 0.0 0.0 0.2
Leave 16 - None 17 3.2 0.9 0.3 0.5 0.2 0.1 0.0 0.2 5.3
Leave 16 - Ineligible 17 0.0 0.0 0.0 0.0 0.0 0.0 0.0 0.0 0.0
Remain 16 - Con 17 8.1 0.8 2.6 0.1 0.3 0.1 0.0 0.1 12.0
Remain 16 - Lab 17 0.7 16.0 2.7 0.1 0.7 0.3 0.1 0.2 20.8
Remain 16 - LD 17 0.2 0.9 3.7 0.0 0.2 0.0 0.0 0.0 5.1
Remain 16 - UKIP 17 0.0 0.0 0.0 0.0 0.0 0.0 0.0 0.0 0.1
Remain 16 - Green 17 0.0 0.2 0.2 0.0 0.3 0.0 0.0 0.0 0.7
Remain 16 - SNP 17 0.0 0.1 0.0 0.0 0.0 1.6 0.0 0.0 1.8
Remain 16 - PC 17 0.0 0.0 0.0 0.0 0.0 0.0 0.2 0.0 0.3
Remain 16 - Other 17 0.0 0.0 0.1 0.0 0.0 0.0 0.0 0.0 0.2
Remain 16 - None 17 0.6 1.2 0.9 0.0 0.2 0.2 0.0 0.1 3.3
Remain 16 - Ineligible 17 0.0 0.0 0.0 0.0 0.0 0.0 0.0 0.0 0.0
Did not vote 16 - Con 17 0.9 0.1 0.1 0.0 0.0 0.0 0.0 0.0 1.1
Did not vote 16 - Lab 17 0.2 1.6 0.2 0.0 0.1 0.1 0.0 0.0 2.2
Did not vote 16 - LD 17 0.0 0.0 0.2 0.0 0.0 0.0 0.0 0.0 0.3
Did not vote 16 - UKIP 17 0.0 0.0 0.0 0.0 0.0 0.0 0.0 0.0 0.0
Did not vote 16 - Green 17 0.0 0.0 0.0 0.0 0.0 0.0 0.0 0.0 0.1
Did not vote 16 - SNP 17 0.0 0.0 0.0 0.0 0.0 0.2 0.0 0.0 0.2
Did not vote 16 - PC 17 0.0 0.0 0.0 0.0 0.0 0.0 0.0 0.0 0.0
Did not vote 16 - Other 17 0.0 0.0 0.0 0.0 0.0 0.0 0.0 0.0 0.1
Did not vote 16 - None 17 0.5 0.6 0.3 0.1 0.1 0.1 0.0 0.0 1.7
Did not vote 16 - Ineligible 17 0.0 0.0 0.0 0.0 0.0 0.0 0.0 0.0 0.0
Ineligible 16 - Con 17 0.2 0.0 0.0 0.0 0.0 0.0 0.0 0.0 0.2
Ineligible 16 - Lab 17 0.0 0.4 0.0 0.0 0.0 0.0 0.0 0.0 0.5
Ineligible 16 - LD 17 0.0 0.0 0.0 0.0 0.0 0.0 0.0 0.0 0.1
Ineligible 16 - UKIP 17 0.0 0.0 0.0 0.0 0.0 0.0 0.0 0.0 0.0
Ineligible 16 - Green 17 0.0 0.0 0.0 0.0 0.0 0.0 0.0 0.0 0.0
Ineligible 16 - SNP 17 0.0 0.0 0.0 0.0 0.0 0.0 0.0 0.0 0.0
Ineligible 16 - PC 17 0.0 0.0 0.0 0.0 0.0 0.0 0.0 0.0 0.0
Ineligible 16 - Other 17 0.0 0.0 0.0 0.0 0.0 0.0 0.0 0.0 0.0
Ineligible 16 - None 17 0.1 0.2 0.0 0.0 0.0 0.0 0.0 0.0 0.4
Ineligible 16 - Ineligible 17 0.5 1.2 0.4 0.1 0.2 0.1 0.0 0.0 2.5
14

Vote by 2019 EU parliament election vote
Table 12: Current vote (column) by EP vote (row), row percentages.
Con Lab LD Brexit Green SNP PC Other Turnout Fraction
Con 19 89 4 5 0 1 0 0 1 92 5
Lab 19 2 92 3 0 1 1 0 0 90 7
LD 19 8 36 51 0 2 1 0 1 90 10
Brexit 19 82 5 1 10 1 0 0 2 93 16
Green 19 7 54 19 0 15 3 0 1 90 6
SNP 19 1 4 1 0 0 94 0 0 89 2
PC 19 4 48 6 1 0 0 40 1 84 0
Other 19 51 23 12 7 3 0 0 4 83 4
None 19 44 33 12 2 3 3 0 1 57 51
Table 13: Current vote (column) by EP turnout (row), row percentages.
Con Lab LD Brexit Green SNP PC Other Turnout Fraction
Voted 19 42 31 15 4 3 4 0 1 91 49
Did not vote 19 44 33 12 2 3 3 0 1 57 51
15

Vote by age
Table 14: Current vote (column) by age (row), row percentages.
Con Lab LD Brexit Green SNP PC Other Turnout Fraction
18-25 22 53 13 2 5 4 0 1 52 8
25-30 26 48 13 2 5 4 0 1 52 6
30-35 30 43 15 2 4 4 0 1 57 7
35-40 36 38 15 2 4 3 0 1 63 7
40-45 39 34 16 3 4 3 0 1 66 7
45-50 42 31 15 3 3 4 0 1 70 9
50-55 44 30 14 3 3 4 1 1 74 10
55-60 45 29 13 4 3 4 1 1 79 9
60-65 48 28 13 4 2 4 1 2 83 8
65-70 53 23 12 4 2 3 1 2 85 8
70-75 59 18 13 3 2 3 0 1 85 7
75-80 60 18 13 3 2 3 0 1 85 5
80-85 62 17 12 3 2 3 0 2 87 4
85+ 63 15 12 4 2 2 0 2 90 2
16

Vote by gender
Table 15: Current vote (column) by gender (row), row percentages.
Con Lab LD Brexit Green SNP PC Other Turnout Fraction
Female 42 34 13 3 3 4 0 1 71 52
Male 44 30 15 4 3 3 0 2 68 48
Vote by qualifications
Table 16: Current vote (column) by qualifications (row), row percent-
ages.
Con Lab LD Brexit Green SNP PC Other Turnout Fraction
Does not apply 60 17 12 3 2 3 0 1 86 19
None 46 34 6 6 2 4 0 2 59 6
Other 42 34 14 4 4 0 0 2 62 4
Level 1 47 33 8 5 2 4 0 1 66 6
Level 2 48 31 9 4 3 2 1 1 60 14
Level 3 38 39 12 3 4 3 0 1 63 15
Level 4+ 33 36 18 2 4 5 1 1 75 36
Please note: the category “Does not apply” includes all voters over age 70, regardless of their actual level of qualifications.
This is because the Annual Population Survey does not record qualifications for retired individuals past the age of 70.
17

Vote by (self-reported) attention to politics
Table 17: Current vote (column) by attention (row), row percentages.
Con Lab LD Brexit Green SNP PC Other Turnout Fraction
0 43 33 11 4 4 3 1 1 43 5
1 43 32 12 4 4 3 1 1 50 3
2 43 32 12 4 4 3 0 1 54 5
3 43 32 12 4 4 3 0 1 59 9
4 44 32 12 4 4 3 1 1 60 7
5 43 32 13 3 3 3 0 1 71 14
6 43 32 14 3 3 3 0 1 77 13
7 43 32 14 3 3 3 0 1 79 17
8 43 32 15 3 3 4 0 1 85 14
9 42 32 15 3 3 4 0 1 86 5
10 41 33 15 3 2 4 0 1 89 7
18
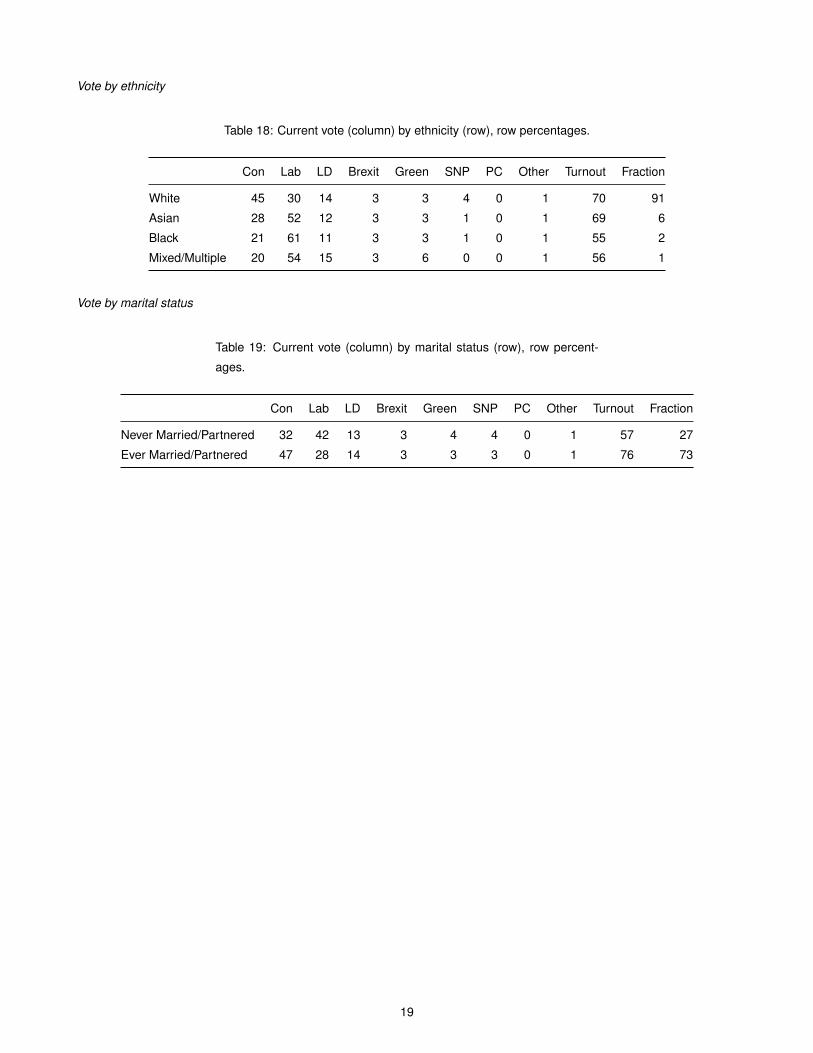
Vote by ethnicity
Table 18: Current vote (column) by ethnicity (row), row percentages.
Con Lab LD Brexit Green SNP PC Other Turnout Fraction
White 45 30 14 3 3 4 0 1 70 91
Asian 28 52 12 3 3 1 0 1 69 6
Black 21 61 11 3 3 1 0 1 55 2
Mixed/Multiple 20 54 15 3 6 0 0 1 56 1
Vote by marital status
Table 19: Current vote (column) by marital status (row), row percent-
ages.
Con Lab LD Brexit Green SNP PC Other Turnout Fraction
Never Married/Partnered 32 42 13 3 4 4 0 1 57 27
Ever Married/Partnered 47 28 14 3 3 3 0 1 76 73
19

Vote by region
Table 20: Current vote (column) by region (row), row percentages.
Con Lab LD Brexit Green SNP PC Other Turnout Fraction
North East 35 44 8 10 3 0 0 1 67 4
North West 37 42 10 6 3 0 0 2 68 11
Yorkshire and The Humber 40 38 10 8 3 0 0 2 68 8
East Midlands 51 33 10 2 3 0 0 2 71 8
West Midlands 50 33 10 3 3 0 0 1 69 9
East of England 54 25 16 1 3 0 0 2 72 10
London 32 44 17 3 4 0 0 1 69 12
South East 52 22 19 1 4 0 0 2 73 15
South West 51 24 20 1 4 0 0 2 73 10
Wales 35 41 7 7 1 0 9 0 69 5
Scotland 28 18 11 1 1 41 0 0 67 8
20

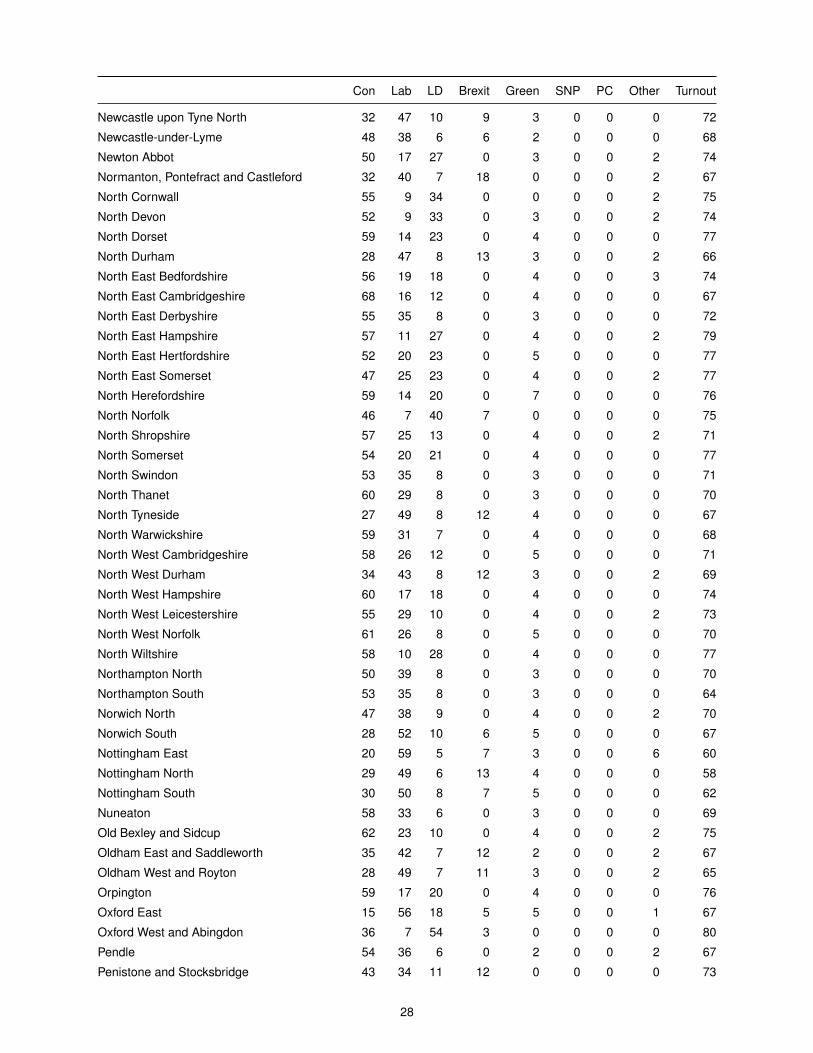
CONSTITUENCY ESTIMATES
Table 21: Current vote (column) by constituency (row), row percentages.
Con Lab LD Brexit Green SNP PC Other Turnout
Aldershot 55 25 16 0 5 0 0 0 70
Aldridge-Brownhills 67 22 6 0 2 0 0 2 68
Altrincham and Sale West 48 33 15 0 3 0 0 1 74
Amber Valley 57 33 6 0 3 0 0 0 70
Arundel and South Downs 55 17 21 0 5 0 0 3 79
Ashfield 43 32 6 11 3 0 0 5 68
Ashford 54 23 11 7 4 0 0 1 72
Ashton-under-Lyne 33 43 5 15 4 0 0 0 64
Aylesbury 50 26 20 0 5 0 0 0 73
Banbury 53 27 16 0 4 0 0 0 73
Barking 25 52 7 12 4 0 0 0 62
Barnsley Central 20 44 6 25 4 0 0 2 64
Barnsley East 27 39 6 24 4 0 0 0 62
Barrow and Furness 50 35 7 5 3 0 0 0 69
Basildon and Billericay 63 22 8 0 3 0 0 3 69
Basingstoke 50 29 14 0 4 0 0 2 72
Bassetlaw 44 38 7 11 0 0 0 0 70
Bath 33 11 52 3 0 0 0 2 74
Batley and Spen 36 44 7 8 3 0 0 2 68
Battersea 33 43 18 2 4 0 0 0 70
Beaconsfield 56 12 0 0 4 0 0 28 75
Beckenham 53 21 22 0 4 0 0 0 77
Bedford 40 39 11 6 4 0 0 0 63
Bermondsey and Old Southwark 13 51 34 3 0 0 0 0 65
Berwick-upon-Tweed 53 20 24 0 4 0 0 0 73
Bethnal Green and Bow 13 61 14 3 7 0 0 3 65
Beverley and Holderness 57 26 12 0 3 0 0 2 73
Bexhill and Battle 54 17 17 9 4 0 0 0 76
Bexleyheath and Crayford 58 30 7 0 3 0 0 2 71
Birkenhead 20 49 9 7 6 0 0 10 67
Birmingham, Edgbaston 37 48 8 5 3 0 0 0 62
Birmingham, Erdington 36 47 6 8 4 0 0 0 58
Birmingham, Hall Green 18 61 11 5 4 0 0 2 67
Birmingham, Hodge Hill 18 62 7 7 4 0 0 2 63
Birmingham, Ladywood 17 64 8 5 5 0 0 0 55
Birmingham, Northfield 40 43 6 7 3 0 0 1 60
Birmingham, Perry Barr 28 53 7 6 4 0 0 1 66
Birmingham, Selly Oak 32 52 7 5 4 0 0 0 62
Birmingham, Yardley 22 48 17 9 4 0 0 0 62
21

Con Lab LD Brexit Green SNP PC Other Turnout
Bishop Auckland 47 39 6 8 0 0 0 0 68
Blackburn 27 54 7 8 3 0 0 2 64
Blackley and Broughton 22 56 9 9 4 0 0 0 56
Blackpool North and Cleveleys 56 35 5 0 3 0 0 2 66
Blackpool South 43 37 5 11 3 0 0 2 62
Blaydon 28 44 10 14 3 0 0 1 70
Blyth Valley 37 43 7 9 3 0 0 0 68
Bognor Regis and Littlehampton 56 21 15 0 4 0 0 4 71
Bolsover 42 38 5 12 2 0 0 2 68
Bolton North East 41 42 6 9 3 0 0 0 68
Bolton South East 28 47 6 16 3 0 0 0 60
Bolton West 54 36 7 0 2 0 0 0 72
Bootle 15 67 6 8 4 0 0 0 66
Boston and Skegness 70 20 7 0 0 0 0 3 69
Bosworth 55 16 25 0 4 0 0 0 72
Bournemouth East 52 30 11 0 5 0 0 2 67
Bournemouth West 51 33 11 0 5 0 0 0 62
Bracknell 55 22 18 0 3 0 0 2 72
Bradford East 23 53 10 10 5 0 0 0 63
Bradford South 37 42 6 12 3 0 0 0 63
Bradford West 21 54 8 9 4 0 0 5 65
Braintree 65 20 12 0 0 0 0 3 72
Brent Central 23 60 12 0 5 0 0 0 61
Brent North 31 52 10 3 3 0 0 1 68
Brentford and Isleworth 36 46 13 3 2 0 0 0 72
Brentwood and Ongar 64 14 19 0 3 0 0 0 74
Bridgwater and West Somerset 56 23 15 0 3 0 0 2 71
Brigg and Goole 62 27 8 0 3 0 0 0 71
Brighton, Kemptown 34 51 9 4 3 0 0 0 71
Brighton, Pavilion 19 13 0 3 63 0 0 2 69
Bristol East 30 53 8 4 4 0 0 0 70
Bristol North West 39 47 11 0 4 0 0 0 72
Bristol South 28 52 9 6 5 0 0 0 68
Bristol West 15 62 0 3 20 0 0 0 73
Broadland 56 22 17 0 3 0 0 2 74
Bromley and Chislehurst 48 29 16 0 4 0 0 2 75
Bromsgrove 58 23 15 0 4 0 0 0 75
Broxbourne 65 21 9 0 4 0 0 0 70
Broxtowe 45 35 0 0 4 0 0 15 77
Buckingham 53 15 24 6 0 0 0 2 76
Burnley 31 39 9 16 3 0 0 2 64
Burton 56 31 8 0 4 0 0 0 70
Bury North 43 43 5 6 2 0 0 0 69
Bury South 43 40 7 5 3 0 0 3 69
22

Con Lab LD Brexit Green SNP PC Other Turnout
Bury St Edmunds 55 23 0 0 18 0 0 3 74
Calder Valley 52 39 7 0 0 0 0 2 72
Camberwell and Peckham 12 63 15 4 5 0 0 1 65
Camborne and Redruth 49 37 9 0 4 0 0 2 72
Cambridge 14 49 28 3 5 0 0 1 69
Cannock Chase 67 27 0 0 5 0 0 0 66
Canterbury 43 47 8 0 0 0 0 2 73
Carlisle 54 37 7 0 0 0 0 2 71
Carshalton and Wallington 40 9 41 5 3 0 0 1 72
Castle Point 72 18 10 0 0 0 0 0 72
Central Devon 55 23 18 0 5 0 0 0 78
Central Suffolk and North Ipswich 60 23 13 0 4 0 0 0 75
Charnwood 59 27 11 0 4 0 0 0 73
Chatham and Aylesford 58 28 8 0 4 0 0 3 67
Cheadle 47 11 42 0 0 0 0 0 77
Chelmsford 51 18 28 0 0 0 0 3 72
Chelsea and Fulham 43 23 32 0 0 0 0 2 66
Cheltenham 45 8 45 0 0 0 0 2 73
Chesham and Amersham 53 13 30 0 4 0 0 0 80
Chesterfield 36 42 8 9 3 0 0 2 68
Chichester 56 13 25 0 4 0 0 2 73
Chingford and Woodford Green 50 41 9 0 0 0 0 0 69
Chippenham 55 12 32 0 0 0 0 0 76
Chipping Barnet 41 41 14 0 3 0 0 1 72
Chorley 0 0 0 0 11 0 0 89 75
Christchurch 64 14 19 0 3 0 0 0 77
Cities of London and Westminster 40 28 27 0 3 0 0 1 64
City of Chester 38 48 7 4 3 0 0 0 75
City of Durham 32 43 12 9 4 0 0 0 68
Clacton 66 19 7 0 4 0 0 4 68
Cleethorpes 64 26 7 0 3 0 0 0 69
Colchester 48 29 19 0 3 0 0 0 68
Colne Valley 44 39 7 6 3 0 0 1 71
Congleton 53 29 13 0 3 0 0 2 76
Copeland 54 38 6 0 2 0 0 0 69
Corby 55 38 7 0 0 0 0 0 72
Coventry North East 33 49 7 8 4 0 0 0 64
Coventry North West 40 42 8 7 3 0 0 0 67
Coventry South 40 43 7 5 4 0 0 1 66
Crawley 50 39 8 0 3 0 0 0 69
Crewe and Nantwich 43 39 8 7 3 0 0 1 71
Croydon Central 39 45 7 4 3 0 0 1 69
Croydon North 22 60 9 4 4 0 0 1 63
Croydon South 51 31 14 0 3 0 0 2 73
23

Con Lab LD Brexit Green SNP PC Other Turnout
Dagenham and Rainham 40 38 7 11 3 0 0 1 66
Darlington 43 41 6 7 2 0 0 1 67
Dartford 61 29 6 0 3 0 0 0 72
Daventry 61 20 15 0 4 0 0 0 75
Denton and Reddish 28 45 8 13 4 0 0 2 63
Derby North 44 36 9 6 3 0 0 2 70
Derby South 34 47 8 11 0 0 0 0 61
Derbyshire Dales 54 26 16 0 4 0 0 0 78
Devizes 58 17 20 0 6 0 0 0 72
Dewsbury 42 41 6 6 3 0 0 1 70
Don Valley 41 33 8 14 2 0 0 2 67
Doncaster Central 33 40 6 15 3 0 0 3 62
Doncaster North 29 43 6 19 0 0 0 3 64
Dover 52 33 8 0 4 0 0 3 72
Dudley North 46 39 5 6 2 0 0 2 66
Dudley South 60 29 8 0 3 0 0 0 66
Dulwich and West Norwood 18 61 0 4 14 0 0 3 71
Ealing Central and Acton 31 49 15 3 3 0 0 0 72
Ealing North 29 54 13 0 4 0 0 0 70
Ealing, Southall 20 56 14 4 4 0 0 1 72
Easington 25 47 7 16 0 0 0 4 61
East Devon 47 6 4 0 2 0 0 41 77
East Ham 17 65 9 4 3 0 0 1 63
East Hampshire 55 12 27 0 4 0 0 2 79
East Surrey 54 14 25 0 4 0 0 4 74
East Worthing and Shoreham 50 34 10 0 4 0 0 2 73
East Yorkshire 57 26 10 0 4 0 0 3 71
Eastbourne 48 8 38 6 0 0 0 1 73
Eastleigh 53 10 33 0 4 0 0 0 72
Eddisbury 54 19 21 0 3 0 0 3 73
Edmonton 25 57 8 4 4 0 0 1 63
Ellesmere Port and Neston 36 47 8 6 3 0 0 0 73
Elmet and Rothwell 51 31 13 0 3 0 0 2 75
Eltham 38 45 9 5 3 0 0 0 71
Enfield North 37 46 9 5 3 0 0 0 67
Enfield, Southgate 40 45 10 3 2 0 0 0 73
Epping Forest 61 20 13 0 4 0 0 3 72
Epsom and Ewell 51 16 27 0 4 0 0 2 77
Erewash 52 37 6 0 3 0 0 2 71
Erith and Thamesmead 38 41 9 8 3 0 0 1 65
Esher and Walton 49 11 38 0 0 0 0 2 76
Exeter 30 56 0 5 8 0 0 2 70
Fareham 59 22 16 0 3 0 0 0 75
Faversham and Mid Kent 63 18 14 0 4 0 0 2 74
24

Con Lab LD Brexit Green SNP PC Other Turnout
Feltham and Heston 30 52 8 7 4 0 0 0 66
Filton and Bradley Stoke 49 36 10 0 3 0 0 2 72
Finchley and Golders Green 45 28 27 0 0 0 0 0 72
Folkestone and Hythe 57 23 12 0 5 0 0 3 72
Forest of Dean 56 35 0 0 7 0 0 2 76
Fylde 57 27 11 0 4 0 0 2 73
Gainsborough 63 22 13 0 0 0 0 2 71
Garston and Halewood 19 62 7 7 4 0 0 2 68
Gateshead 23 49 8 16 4 0 0 0 64
Gedling 41 44 6 6 2 0 0 0 73
Gillingham and Rainham 56 31 8 0 3 0 0 2 69
Gloucester 50 33 8 6 3 0 0 0 68
Gosport 62 22 11 0 4 0 0 0 71
Grantham and Stamford 60 22 14 0 4 0 0 0 73
Gravesham 58 31 7 0 3 0 0 0 70
Great Grimsby 42 37 4 13 3 0 0 1 60
Great Yarmouth 59 28 6 0 3 0 0 3 65
Greenwich and Woolwich 24 53 13 4 4 0 0 1 67
Guildford 44 9 39 0 0 0 0 8 74
Hackney North and Stoke Newington 10 67 14 2 6 0 0 1 66
Hackney South and Shoreditch 10 66 13 3 7 0 0 1 64
Halesowen and Rowley Regis 60 31 5 0 3 0 0 2 70
Halifax 36 43 6 12 3 0 0 0 62
Haltemprice and Howden 60 22 13 0 3 0 0 2 74
Halton 24 55 7 11 3 0 0 0 66
Hammersmith 24 53 17 3 4 0 0 0 70
Hampstead and Kilburn 27 47 21 2 3 0 0 0 68
Harborough 51 25 19 0 3 0 0 2 75
Harlow 60 32 8 0 0 0 0 0 70
Harrogate and Knaresborough 52 10 36 0 0 0 0 2 76
Harrow East 48 39 10 0 2 0 0 0 73
Harrow West 32 49 12 4 3 0 0 0 71
Hartlepool 31 40 5 23 0 0 0 2 62
Harwich and North Essex 59 23 12 0 4 0 0 2 73
Hastings and Rye 49 39 10 0 0 0 0 2 71
Havant 61 18 13 0 4 0 0 3 68
Hayes and Harlington 28 54 8 6 3 0 0 1 63
Hazel Grove 48 13 39 0 0 0 0 0 73
Hemel Hempstead 51 31 14 0 4 0 0 0 73
Hemsworth 33 39 7 16 3 0 0 2 67
Hendon 43 40 14 0 2 0 0 0 72
Henley 52 13 30 0 4 0 0 0 79
Hereford and South Herefordshire 61 20 14 0 4 0 0 0 73
Hertford and Stortford 52 19 21 0 5 0 0 3 74
25

Con Lab LD Brexit Green SNP PC Other Turnout
Hertsmere 58 20 18 0 4 0 0 0 73
Hexham 56 29 12 0 3 0 0 0 77
Heywood and Middleton 38 40 6 14 3 0 0 0 62
High Peak 42 42 9 5 2 0 0 0 73
Hitchin and Harpenden 49 21 28 0 0 0 0 2 78
Holborn and St Pancras 15 57 19 3 5 0 0 2 64
Hornchurch and Upminster 64 21 8 0 4 0 0 2 71
Hornsey and Wood Green 12 55 25 2 4 0 0 1 74
Horsham 54 15 25 0 4 0 0 2 77
Houghton and Sunderland South 28 45 6 16 3 0 0 2 63
Hove 25 56 9 3 5 0 0 1 74
Huddersfield 34 45 8 7 6 0 0 0 65
Huntingdon 54 21 18 0 4 0 0 3 74
Hyndburn 43 39 5 10 2 0 0 0 65
Ilford North 38 47 8 4 2 0 0 1 71
Ilford South 19 59 5 4 2 0 0 10 67
Ipswich 43 39 7 7 3 0 0 1 68
Isle of Wight 53 24 0 0 17 0 0 6 70
Islington North 11 61 16 3 7 0 0 1 69
Islington South and Finsbury 15 53 21 3 6 0 0 2 67
Jarrow 26 49 5 14 4 0 0 2 64
Keighley 43 42 6 7 0 0 0 1 71
Kenilworth and Southam 52 16 26 0 4 0 0 2 77
Kensington 37 26 29 2 4 0 0 1 64
Kettering 54 32 8 0 4 0 0 2 72
Kingston and Surbiton 32 9 51 3 3 0 0 1 76
Kingston upon Hull East 29 40 6 21 4 0 0 0 60
Kingston upon Hull North 25 49 7 15 4 0 0 0 59
Kingston upon Hull West and Hessle 31 43 6 16 4 0 0 0 60
Kingswood 51 35 9 0 3 0 0 2 71
Knowsley 15 64 6 9 4 0 0 2 64
Lancaster and Fleetwood 40 43 7 6 4 0 0 0 68
Leeds Central 22 54 6 9 7 0 0 2 54
Leeds East 31 48 7 11 4 0 0 0 64
Leeds North East 28 51 11 5 4 0 0 1 74
Leeds North West 18 49 24 5 3 0 0 0 68
Leeds West 26 51 7 10 5 0 0 1 64
Leicester East 24 53 9 6 5 0 0 2 68
Leicester South 20 64 6 5 5 0 0 0 66
Leicester West 28 53 6 9 5 0 0 0 58
Leigh 40 39 7 12 0 0 0 2 65
Lewes 47 8 41 0 3 0 0 2 78
Lewisham East 22 55 13 4 5 0 0 1 66
Lewisham West and Penge 24 52 14 4 5 0 0 1 69
26

Con Lab LD Brexit Green SNP PC Other Turnout
Lewisham, Deptford 12 62 15 3 6 0 0 1 62
Leyton and Wanstead 20 59 12 3 4 0 0 1 67
Lichfield 61 21 13 0 4 0 0 2 75
Lincoln 41 44 5 7 2 0 0 1 69
Liverpool, Riverside 14 64 7 6 9 0 0 0 56
Liverpool, Walton 16 70 6 0 5 0 0 3 66
Liverpool, Wavertree 13 62 13 6 5 0 0 2 66
Liverpool, West Derby 16 63 7 8 4 0 0 3 67
Loughborough 47 40 8 0 3 0 0 2 68
Louth and Horncastle 66 22 8 0 0 0 0 3 72
Ludlow 60 15 21 0 4 0 0 0 77
Luton North 34 46 8 7 3 0 0 2 67
Luton South 31 46 0 10 4 0 0 9 66
Macclesfield 50 33 14 0 4 0 0 0 74
Maidenhead 59 13 26 0 3 0 0 0 78
Maidstone and The Weald 55 17 23 0 4 0 0 2 71
Makerfield 33 44 7 13 3 0 0 0 66
Maldon 67 13 15 0 4 0 0 0 74
Manchester Central 16 65 7 5 5 0 0 1 52
Manchester, Gorton 11 67 10 6 6 0 0 0 59
Manchester, Withington 12 60 19 4 5 0 0 0 68
Mansfield 58 34 6 0 0 0 0 3 67
Meon Valley 61 14 21 0 4 0 0 0 76
Meriden 61 21 12 0 5 0 0 0 69
Mid Bedfordshire 56 20 18 0 4 0 0 2 75
Mid Derbyshire 57 29 10 0 4 0 0 0 75
Mid Dorset and North Poole 57 8 32 0 2 0 0 0 78
Mid Norfolk 58 24 15 0 0 0 0 3 72
Mid Sussex 52 16 27 0 4 0 0 2 76
Mid Worcestershire 64 14 15 0 4 0 0 2 75
Middlesbrough 26 49 5 14 4 0 0 2 58
Middlesbrough South and East Cleveland 55 37 5 0 3 0 0 0 68
Milton Keynes North 47 42 9 0 3 0 0 0 71
Milton Keynes South 47 39 8 0 3 0 0 2 68
Mitcham and Morden 23 56 12 4 4 0 0 1 68
Mole Valley 53 8 33 0 4 0 0 2 80
Morecambe and Lunesdale 51 37 7 0 3 0 0 2 71
Morley and Outwood 52 37 6 0 2 0 0 2 71
New Forest East 57 15 22 0 5 0 0 2 75
New Forest West 63 14 20 0 3 0 0 0 76
Newark 61 23 13 0 3 0 0 0 73
Newbury 54 8 32 0 5 0 0 2 75
Newcastle upon Tyne Central 23 55 8 10 4 0 0 0 64
Newcastle upon Tyne East 28 59 8 0 5 0 0 0 62
27
Con Lab LD Brexit Green SNP PC Other Turnout
Newcastle upon Tyne North 32 47 10 9 3 0 0 0 72
Newcastle-under-Lyme 48 38 6 6 2 0 0 0 68
Newton Abbot 50 17 27 0 3 0 0 2 74
Normanton, Pontefract and Castleford 32 40 7 18 0 0 0 2 67
North Cornwall 55 9 34 0 0 0 0 2 75
North Devon 52 9 33 0 3 0 0 2 74
North Dorset 59 14 23 0 4 0 0 0 77
North Durham 28 47 8 13 3 0 0 2 66
North East Bedfordshire 56 19 18 0 4 0 0 3 74
North East Cambridgeshire 68 16 12 0 4 0 0 0 67
North East Derbyshire 55 35 8 0 3 0 0 0 72
North East Hampshire 57 11 27 0 4 0 0 2 79
North East Hertfordshire 52 20 23 0 5 0 0 0 77
North East Somerset 47 25 23 0 4 0 0 2 77
North Herefordshire 59 14 20 0 7 0 0 0 76
North Norfolk 46 7 40 7 0 0 0 0 75
North Shropshire 57 25 13 0 4 0 0 2 71
North Somerset 54 20 21 0 4 0 0 0 77
North Swindon 53 35 8 0 3 0 0 0 71
North Thanet 60 29 8 0 3 0 0 0 70
North Tyneside 27 49 8 12 4 0 0 0 67
North Warwickshire 59 31 7 0 4 0 0 0 68
North West Cambridgeshire 58 26 12 0 5 0 0 0 71
North West Durham 34 43 8 12 3 0 0 2 69
North West Hampshire 60 17 18 0 4 0 0 0 74
North West Leicestershire 55 29 10 0 4 0 0 2 73
North West Norfolk 61 26 8 0 5 0 0 0 70
North Wiltshire 58 10 28 0 4 0 0 0 77
Northampton North 50 39 8 0 3 0 0 0 70
Northampton South 53 35 8 0 3 0 0 0 64
Norwich North 47 38 9 0 4 0 0 2 70
Norwich South 28 52 10 6 5 0 0 0 67
Nottingham East 20 59 5 7 3 0 0 6 60
Nottingham North 29 49 6 13 4 0 0 0 58
Nottingham South 30 50 8 7 5 0 0 0 62
Nuneaton 58 33 6 0 3 0 0 0 69
Old Bexley and Sidcup 62 23 10 0 4 0 0 2 75
Oldham East and Saddleworth 35 42 7 12 2 0 0 2 67
Oldham West and Royton 28 49 7 11 3 0 0 2 65
Orpington 59 17 20 0 4 0 0 0 76
Oxford East 15 56 18 5 5 0 0 1 67
Oxford West and Abingdon 36 7 54 3 0 0 0 0 80
Pendle 54 36 6 0 2 0 0 2 67
Penistone and Stocksbridge 43 34 11 12 0 0 0 0 73
28

Con Lab LD Brexit Green SNP PC Other Turnout
Penrith and The Border 57 22 15 0 4 0 0 2 71
Peterborough 43 39 6 7 3 0 0 1 69
Plymouth, Moor View 57 35 5 0 3 0 0 0 68
Plymouth, Sutton and Devonport 40 45 5 6 3 0 0 0 58
Poole 57 20 17 0 4 0 0 2 71
Poplar and Limehouse 18 52 19 4 6 0 0 2 65
Portsmouth North 59 26 9 0 4 0 0 2 69
Portsmouth South 35 42 16 6 0 0 0 2 64
Preston 25 55 7 10 4 0 0 0 63
Pudsey 51 38 7 0 2 0 0 2 75
Putney 38 34 23 0 4 0 0 0 71
Rayleigh and Wickford 67 16 13 0 4 0 0 0 73
Reading East 39 43 11 2 4 0 0 1 73
Reading West 48 39 10 0 3 0 0 0 71
Redcar 33 41 8 13 3 0 0 2 66
Redditch 58 31 8 0 4 0 0 0 71
Reigate 53 18 22 0 5 0 0 2 75
Ribble Valley 58 25 11 0 4 0 0 2 76
Richmond (Yorks) 60 17 15 0 5 0 0 3 73
Richmond Park 39 6 53 0 0 0 0 1 79
Rochdale 29 47 9 11 4 0 0 0 66
Rochester and Strood 58 28 8 0 4 0 0 3 69
Rochford and Southend East 57 31 9 0 0 0 0 4 66
Romford 64 24 8 0 3 0 0 0 67
Romsey and Southampton North 51 11 35 0 0 0 0 2 75
Rossendale and Darwen 53 37 7 0 3 0 0 0 69
Rother Valley 40 33 6 16 3 0 0 2 69
Rotherham 29 43 7 19 0 0 0 3 64
Rugby 54 33 10 0 3 0 0 0 75
Ruislip, Northwood and Pinner 53 25 17 0 3 0 0 2 74
Runnymede and Weybridge 55 18 20 0 5 0 0 3 72
Rushcliffe 45 30 22 0 0 0 0 2 80
Rutland and Melton 58 14 21 0 4 0 0 2 74
Saffron Walden 59 13 25 0 3 0 0 0 76
Salford and Eccles 27 50 7 11 5 0 0 0 61
Salisbury 54 18 21 0 4 0 0 2 76
Scarborough and Whitby 53 38 6 0 0 0 0 3 71
Scunthorpe 42 40 6 10 2 0 0 0 66
Sedgefield 40 41 5 9 3 0 0 1 67
Sefton Central 31 51 8 7 2 0 0 1 75
Selby and Ainsty 58 26 10 0 3 0 0 2 72
Sevenoaks 58 14 21 0 4 0 0 3 73
Sheffield Central 15 60 7 7 9 0 0 2 60
Sheffield South East 33 45 8 13 0 0 0 2 65
29

Con Lab LD Brexit Green SNP PC Other Turnout
Sheffield, Brightside and Hillsborough 21 51 7 14 6 0 0 2 59
Sheffield, Hallam 23 30 37 5 4 0 0 1 74
Sheffield, Heeley 28 49 7 12 5 0 0 0 65
Sherwood 54 35 7 0 3 0 0 2 72
Shipley 50 37 9 0 3 0 0 2 72
Shrewsbury and Atcham 49 33 12 0 4 0 0 2 74
Sittingbourne and Sheppey 58 24 9 0 4 0 0 5 69
Skipton and Ripon 56 19 16 0 6 0 0 3 76
Sleaford and North Hykeham 62 19 14 0 3 0 0 3 75
Slough 32 50 8 6 3 0 0 0 61
Solihull 55 16 25 0 4 0 0 0 75
Somerton and Frome 57 12 25 0 5 0 0 0 76
South Basildon and East Thurrock 63 26 8 0 0 0 0 3 68
South Cambridgeshire 42 17 40 0 0 0 0 0 78
South Derbyshire 58 28 10 0 5 0 0 0 72
South Dorset 55 29 10 0 5 0 0 2 73
South East Cambridgeshire 49 18 31 0 0 0 0 2 74
South East Cornwall 55 16 23 0 4 0 0 2 78
South Holland and The Deepings 70 14 9 0 4 0 0 2 71
South Leicestershire 63 23 11 0 3 0 0 0 73
South Norfolk 54 23 20 0 4 0 0 0 75
South Northamptonshire 59 20 16 0 4 0 0 2 76
South Ribble 54 35 7 0 3 0 0 0 73
South Shields 27 44 6 16 4 0 0 2 65
South Staffordshire 69 18 8 0 4 0 0 0 73
South Suffolk 58 21 16 0 5 0 0 0 76
South Swindon 52 39 9 0 0 0 0 0 72
South Thanet 57 32 7 0 4 0 0 0 74
South West Bedfordshire 57 26 13 0 4 0 0 0 72
South West Devon 57 25 14 0 4 0 0 0 76
South West Hertfordshire 46 15 16 0 3 0 0 20 77
South West Norfolk 62 22 10 0 3 0 0 3 70
South West Surrey 57 10 33 0 0 0 0 0 78
South West Wiltshire 56 20 20 0 4 0 0 0 74
Southampton, Itchen 49 39 6 0 3 0 0 2 65
Southampton, Test 34 49 7 5 3 0 0 2 66
Southend West 58 28 12 0 0 0 0 2 72
Southport 46 31 23 0 0 0 0 0 68
Spelthorne 57 24 15 0 4 0 0 0 73
St Albans 37 10 49 0 3 0 0 2 78
St Austell and Newquay 53 21 20 0 3 0 0 2 68
St Helens North 27 47 7 15 5 0 0 0 68
St Helens South and Whiston 24 48 8 12 6 0 0 2 66
St Ives 46 10 40 0 2 0 0 2 80
30

Con Lab LD Brexit Green SNP PC Other Turnout
Stafford 55 33 8 0 4 0 0 0 74
Staffordshire Moorlands 60 28 9 0 3 0 0 0 73
Stalybridge and Hyde 39 43 6 7 4 0 0 1 61
Stevenage 51 34 10 0 4 0 0 0 71
Stockport 27 48 11 8 5 0 0 0 67
Stockton North 39 42 6 11 0 0 0 2 65
Stockton South 47 41 6 6 0 0 0 0 71
Stoke-on-Trent Central 40 39 5 13 4 0 0 0 60
Stoke-on-Trent North 42 37 5 11 3 0 0 2 63
Stoke-on-Trent South 56 38 6 0 0 0 0 0 66
Stone 64 20 12 0 4 0 0 0 75
Stourbridge 57 30 7 0 3 0 0 3 70
Stratford-on-Avon 56 12 29 0 3 0 0 0 77
Streatham 14 52 24 3 7 0 0 0 67
Stretford and Urmston 27 55 8 6 4 0 0 0 71
Stroud 47 43 0 3 7 0 0 1 77
Suffolk Coastal 52 23 18 0 4 0 0 2 76
Sunderland Central 31 46 6 12 3 0 0 2 64
Surrey Heath 55 12 27 0 4 0 0 2 77
Sutton and Cheam 52 12 32 0 4 0 0 0 74
Sutton Coldfield 59 24 14 0 3 0 0 0 72
Tamworth 59 28 8 0 3 0 0 3 69
Tatton 56 20 20 0 4 0 0 0 74
Taunton Deane 54 9 34 0 0 0 0 3 74
Telford 55 38 7 0 0 0 0 0 68
Tewkesbury 57 16 23 0 4 0 0 0 75
The Cotswolds 55 13 28 0 4 0 0 0 75
The Wrekin 59 30 8 0 3 0 0 0 72
Thirsk and Malton 60 16 16 0 4 0 0 3 74
Thornbury and Yate 52 8 40 0 0 0 0 0 77
Thurrock 56 32 5 0 3 0 0 4 67
Tiverton and Honiton 57 19 16 0 5 0 0 2 75
Tonbridge and Malling 63 15 17 0 5 0 0 0 76
Tooting 25 51 15 2 4 0 0 1 73
Torbay 58 11 25 0 3 0 0 3 72
Torridge and West Devon 54 16 23 0 5 0 0 2 76
Totnes 50 17 31 0 0 0 0 3 75
Tottenham 12 68 9 3 6 0 0 1 65
Truro and Falmouth 46 33 15 0 3 0 0 2 75
Tunbridge Wells 51 18 29 0 0 0 0 3 74
Twickenham 32 8 58 2 0 0 0 0 79
Tynemouth 39 46 6 6 3 0 0 0 73
Uxbridge and South Ruislip 50 37 7 0 3 0 0 2 68
Vauxhall 14 51 25 3 6 0 0 1 64
31

Con Lab LD Brexit Green SNP PC Other Turnout
Wakefield 47 36 6 9 0 0 0 2 68
Wallasey 26 56 7 7 3 0 0 0 68
Walsall North 57 35 5 0 3 0 0 0 61
Walsall South 39 43 6 8 3 0 0 2 67
Walthamstow 15 67 8 4 5 0 0 1 65
Wansbeck 32 44 9 9 4 0 0 2 69
Wantage 47 19 32 0 0 0 0 3 73
Warley 30 51 5 9 4 0 0 0 64
Warrington North 36 42 9 10 4 0 0 0 68
Warrington South 45 41 9 4 0 0 0 1 73
Warwick and Leamington 42 39 12 3 3 0 0 1 73
Washington and Sunderland West 29 45 6 15 3 0 0 2 62
Watford 48 32 19 0 0 0 0 2 70
Waveney 57 29 7 0 5 0 0 2 69
Wealden 61 14 20 0 5 0 0 0 76
Weaver Vale 42 42 8 5 3 0 0 0 72
Wellingborough 58 30 9 0 4 0 0 0 70
Wells 51 8 40 0 0 0 0 1 75
Welwyn Hatfield 51 32 13 0 4 0 0 0 72
Wentworth and Dearne 33 45 6 14 0 0 0 2 63
West Bromwich East 40 39 7 9 3 0 0 2 61
West Bromwich West 41 38 6 13 3 0 0 0 59
West Dorset 53 12 31 0 4 0 0 0 74
West Ham 18 61 11 5 4 0 0 1 62
West Lancashire 37 47 6 7 3 0 0 0 72
West Suffolk 63 23 10 0 4 0 0 0 70
West Worcestershire 58 16 21 0 5 0 0 0 77
Westminster North 30 49 14 2 3 0 0 1 67
Westmorland and Lonsdale 42 7 47 4 0 0 0 0 78
Weston-Super-Mare 53 28 15 0 4 0 0 0 69
Wigan 30 44 6 16 4 0 0 0 65
Wimbledon 43 26 30 0 0 0 0 2 76
Winchester 47 7 44 0 0 0 0 2 79
Windsor 54 15 25 0 4 0 0 2 76
Wirral South 39 45 8 5 3 0 0 0 76
Wirral West 39 45 8 6 2 0 0 0 76
Witham 63 18 13 0 6 0 0 0 73
Witney 52 17 31 0 0 0 0 0 77
Woking 49 15 31 0 3 0 0 2 74
Wokingham 46 12 36 0 4 0 0 1 78
Wolverhampton North East 43 39 5 10 3 0 0 0 62
Wolverhampton South East 36 45 6 11 3 0 0 0 62
Wolverhampton South West 47 41 7 5 0 0 0 0 70
Worcester 49 34 10 0 4 0 0 2 70
32

Con Lab LD Brexit Green SNP PC Other Turnout
Workington 41 40 6 9 2 0 0 1 70
Worsley and Eccles South 39 42 7 8 4 0 0 0 62
Worthing West 53 28 12 0 4 0 0 3 73
Wycombe 47 34 14 0 3 0 0 2 70
Wyre and Preston North 55 30 10 0 3 0 0 2 75
Wyre Forest 59 27 9 0 4 0 0 0 72
Wythenshawe and Sale East 26 51 8 9 4 0 0 1 62
Yeovil 53 9 31 0 4 0 0 2 74
York Central 27 52 10 5 4 0 0 1 66
York Outer 47 26 25 0 0 0 0 2 76
Aberdeen North 20 19 9 3 3 44 0 0 60
Aberdeen South 39 11 14 0 0 36 0 0 69
Airdrie and Shotts 22 29 7 0 3 40 0 0 59
Angus 44 6 7 0 0 43 0 0 65
Argyll and Bute 34 7 20 0 0 39 0 0 72
Ayr, Carrick and Cumnock 42 13 7 0 0 38 0 0 66
Banff and Buchan 49 6 7 0 0 38 0 0 65
Berwickshire, Roxburgh and Selkirk 49 6 11 0 0 34 0 0 73
Caithness, Sutherland and Easter Ross 25 6 32 5 0 33 0 0 69
Central Ayrshire 36 14 8 0 0 42 0 0 66
Coatbridge, Chryston and Bellshill 16 39 5 0 2 38 0 0 63
Cumbernauld, Kilsyth and Kirkintilloch East 21 24 7 0 0 48 0 0 68
Dumfries and Galloway 45 11 8 0 0 36 0 0 70
Dumfriesshire, Clydesdale and Tweeddale 48 10 9 0 0 33 0 0 72
Dundee East 27 13 10 0 0 48 0 2 66
Dundee West 17 24 8 4 0 46 0 2 60
Dunfermline and West Fife 25 24 11 0 3 38 0 0 67
East Dunbartonshire 17 8 38 0 3 33 0 2 78
East Kilbride, Strathaven and Lesmahagow 23 22 8 0 3 42 0 2 67
East Lothian 26 29 10 0 0 34 0 2 71
East Renfrewshire 38 12 11 0 0 39 0 0 76
Edinburgh East 16 25 10 0 5 45 0 0 66
Edinburgh North and Leith 21 18 12 2 5 41 0 2 70
Edinburgh South 15 49 10 0 3 23 0 0 74
Edinburgh South West 27 12 11 2 4 43 0 1 71
Edinburgh West 20 9 34 0 4 34 0 0 75
Na h-Eileanan an Iar 21 25 6 0 0 48 0 0 69
Falkirk 27 18 8 0 3 44 0 0 68
Glasgow Central 16 27 8 0 4 45 0 0 58
Glasgow East 19 34 6 0 0 41 0 0 52
Glasgow North 13 26 8 2 7 44 0 0 62
Glasgow North East 14 34 5 0 0 47 0 0 52
Glasgow North West 17 25 9 0 0 49 0 0 60
Glasgow South 17 23 8 2 4 47 0 0 64
33

Con Lab LD Brexit Green SNP PC Other Turnout
Glasgow South West 16 29 6 3 0 46 0 0 56
Glenrothes 21 20 9 4 0 46 0 0 61
Gordon 40 7 15 0 0 38 0 0 70
Inverclyde 20 29 7 0 0 44 0 0 66
Inverness, Nairn, Badenoch and Strathspey 27 6 13 4 3 47 0 0 68
Kilmarnock and Loudoun 28 16 7 0 0 46 0 2 63
Kirkcaldy and Cowdenbeath 22 29 7 4 3 36 0 0 65
Lanark and Hamilton East 34 18 9 0 0 38 0 0 66
Linlithgow and East Falkirk 27 18 8 3 3 41 0 1 67
Livingston 25 22 8 0 3 43 0 0 66
Midlothian 24 31 8 0 0 38 0 0 67
Moray 46 6 6 0 0 41 0 1 67
Motherwell and Wishaw 20 29 6 0 0 43 0 2 63
North Ayrshire and Arran 31 14 9 0 3 44 0 0 66
North East Fife 21 6 35 0 0 37 0 0 70
Ochil and South Perthshire 41 9 8 0 0 40 0 2 71
Orkney and Shetland 15 7 42 4 0 31 0 2 69
Paisley and Renfrewshire North 26 20 9 0 0 45 0 0 69
Paisley and Renfrewshire South 20 25 7 0 0 48 0 0 68
Perth and North Perthshire 37 6 9 2 0 46 0 0 75
Ross, Skye and Lochaber 19 6 24 5 0 46 0 2 74
Rutherglen and Hamilton West 20 32 7 0 0 38 0 2 63
Stirling 36 11 8 0 3 42 0 0 73
West Aberdeenshire and Kincardine 47 6 13 0 0 34 0 0 67
West Dunbartonshire 17 29 6 0 3 43 0 2 65
Ynys Mn 35 28 0 9 0 0 28 0 73
Delyn 43 43 5 6 0 0 3 0 73
Alyn and Deeside 42 42 6 7 0 0 3 0 71
Wrexham 42 38 6 7 2 0 4 0 70
Llanelli 27 43 0 14 0 0 16 0 69
Gower 42 43 6 5 0 0 3 0 74
Swansea West 30 53 7 7 0 0 4 0 65
Swansea East 26 49 6 11 3 0 5 0 62
Aberavon 22 48 6 14 3 0 7 2 68
Cardiff Central 19 61 14 4 0 0 0 2 69
Cardiff North 35 47 8 4 2 0 4 1 76
Rhondda 16 46 4 12 2 0 20 0 66
Torfaen 31 45 5 12 2 0 4 0 65
Monmouth 51 35 8 0 2 0 3 1 77
Newport East 35 45 6 8 2 0 3 0 67
Newport West 39 43 6 7 3 0 3 0 69
Arfon 17 29 0 6 0 0 48 0 69
Aberconwy 47 41 6 0 0 0 7 0 71
Clwyd West 51 34 8 0 0 0 7 0 70
34

Con Lab LD Brexit Green SNP PC Other Turnout
Vale of Clwyd 43 41 6 6 0 0 3 0 68
Dwyfor Meirionnydd 28 11 0 10 0 0 52 0 70
Clwyd South 43 41 6 6 0 0 4 0 69
Montgomeryshire 53 15 31 0 0 0 0 2 71
Ceredigion 21 13 22 8 3 0 32 0 73
Preseli Pembrokeshire 49 42 5 0 0 0 4 0 73
Carmarthen West and Pembrokeshire South 51 37 5 0 0 0 6 0 73
Carmarthen East and Dinefwr 29 21 0 10 0 0 40 0 75
Brecon and Radnorshire 49 14 35 0 0 0 0 2 76
Neath 27 45 4 11 2 0 9 1 70
Cynon Valley 23 47 5 14 0 0 9 2 62
Merthyr Tydfil and Rhymney 23 51 5 13 0 0 7 2 64
Blaenau Gwent 19 43 5 15 2 0 17 0 65
Bridgend 41 43 5 5 2 0 4 0 71
Ogmore 25 48 6 13 2 0 6 0 66
Pontypridd 25 48 0 9 0 0 15 3 67
Caerphilly 28 47 0 13 0 0 12 0 67
Islwyn 27 44 5 14 2 0 6 0 67
Vale of Glamorgan 51 39 0 0 7 0 0 2 72
Cardiff West 27 48 8 5 2 0 8 0 69
Cardiff South and Penarth 28 50 8 6 3 0 5 0 65
35

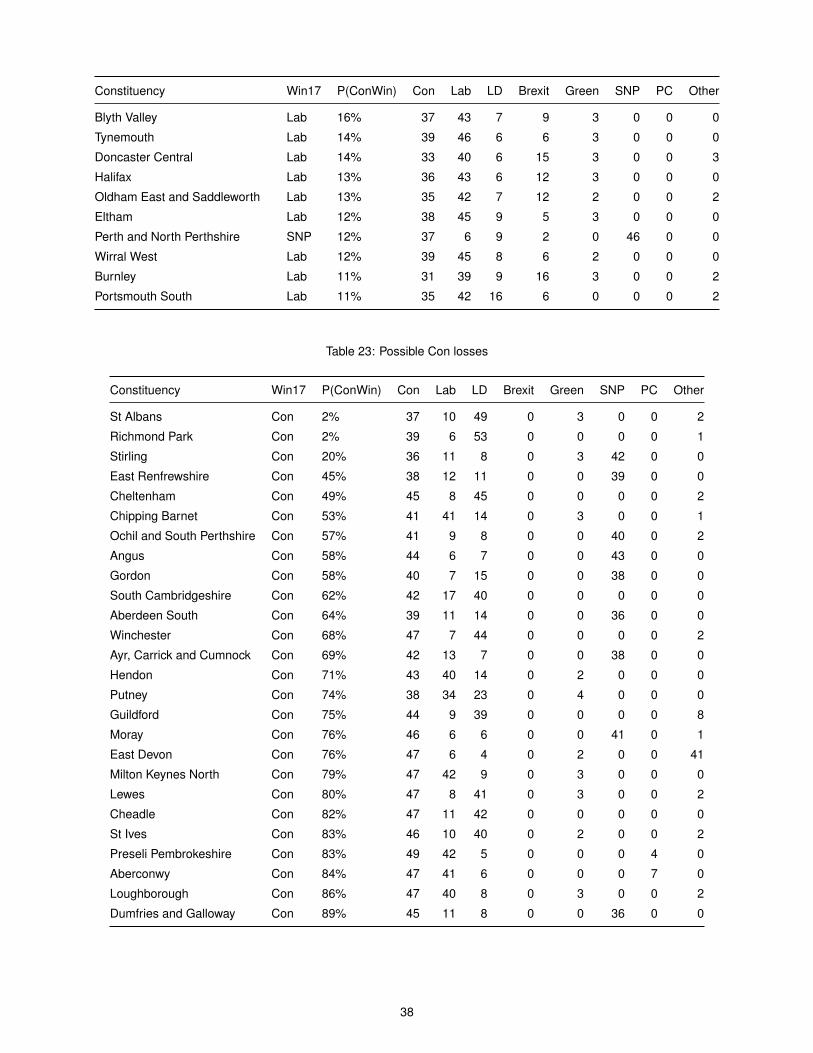
SEAT GAINS/LOSSES
Conservative gains/losses
Table 22: Possible Con gains
Constituency Win17 P(ConWin) Con Lab LD Brexit Green SNP PC Other
Barrow and Furness Lab 99% 50 35 7 5 3 0 0 0
Ashfield Lab 95% 43 32 6 11 3 0 0 5
Wakefield Lab 95% 47 36 6 9 0 0 0 2
Penistone and Stocksbridge Lab 94% 43 34 11 12 0 0 0 0
Eastbourne LD 94% 48 8 38 6 0 0 0 1
Newcastle-under-Lyme Lab 94% 48 38 6 6 2 0 0 0
Rother Valley Lab 89% 40 33 6 16 3 0 0 2
Bishop Auckland Lab 88% 47 39 6 8 0 0 0 0
Don Valley Lab 87% 41 33 8 14 2 0 0 2
Derby North Lab 85% 44 36 9 6 3 0 0 2
Wolverhampton South West Lab 84% 47 41 7 5 0 0 0 0
Blackpool South Lab 84% 43 37 5 11 3 0 0 2
Bassetlaw Lab 83% 44 38 7 11 0 0 0 0
North Norfolk LD 82% 46 7 40 7 0 0 0 0
Kensington Lab 82% 37 26 29 2 4 0 0 1
Dudley North Lab 82% 46 39 5 6 2 0 0 2
Stockton South Lab 81% 47 41 6 6 0 0 0 0
Great Grimsby Lab 80% 42 37 4 13 3 0 0 1
Colne Valley Lab 79% 44 39 7 6 3 0 0 1
Stoke-on-Trent North Lab 78% 42 37 5 11 3 0 0 2
Crewe and Nantwich Lab 75% 43 39 8 7 3 0 0 1
Bolsover Lab 74% 42 38 5 12 2 0 0 2
Peterborough Lab 73% 43 39 6 7 3 0 0 1
Ipswich Lab 72% 43 39 7 7 3 0 0 1
Wrexham Lab 72% 42 38 6 7 2 0 4 0
Stroud Lab 72% 47 43 0 3 7 0 0 1
West Bromwich West Lab 72% 41 38 6 13 3 0 0 0
Wolverhampton North East Lab 71% 43 39 5 10 3 0 0 0
Warrington South Lab 71% 45 41 9 4 0 0 0 1
Warwick and Leamington Lab 69% 42 39 12 3 3 0 0 1
Hyndburn Lab 68% 43 39 5 10 2 0 0 0
Bury South Lab 68% 43 40 7 5 3 0 0 3
Ynys Mn Lab 67% 35 28 0 9 0 0 28 0
Darlington Lab 67% 43 41 6 7 2 0 0 1
Dagenham and Rainham Lab 67% 40 38 7 11 3 0 0 1
Vale of Clwyd Lab 65% 43 41 6 6 0 0 3 0
Scunthorpe Lab 63% 42 40 6 10 2 0 0 0
Clwyd South Lab 61% 43 41 6 6 0 0 4 0
36

Constituency Win17 P(ConWin) Con Lab LD Brexit Green SNP PC Other
Workington Lab 58% 41 40 6 9 2 0 0 1
Bedford Lab 58% 40 39 11 6 4 0 0 0
West Bromwich East Lab 57% 40 39 7 9 3 0 0 2
Keighley Lab 56% 43 42 6 7 0 0 0 1
Dewsbury Lab 55% 42 41 6 6 3 0 0 1
Leigh Lab 55% 40 39 7 12 0 0 0 2
Weaver Vale Lab 53% 42 42 8 5 3 0 0 0
Stoke-on-Trent Central Lab 53% 40 39 5 13 4 0 0 0
High Peak Lab 50% 42 42 9 5 2 0 0 0
Alyn and Deeside Lab 47% 42 42 6 7 0 0 3 0
Bury North Lab 46% 43 43 5 6 2 0 0 0
Delyn Lab 46% 43 43 5 6 0 0 3 0
Carshalton and Wallington LD 46% 40 9 41 5 3 0 0 1
Sedgefield Lab 44% 40 41 5 9 3 0 0 1
Bolton North East Lab 44% 41 42 6 9 3 0 0 0
Gower Lab 40% 42 43 6 5 0 0 3 0
Bridgend Lab 38% 41 43 5 5 2 0 4 0
Coventry North West Lab 38% 40 42 8 7 3 0 0 0
Coventry South Lab 36% 40 43 7 5 4 0 0 1
Heywood and Middleton Lab 36% 38 40 6 14 3 0 0 0
Gedling Lab 36% 41 44 6 6 2 0 0 0
Lincoln Lab 32% 41 44 5 7 2 0 0 1
Canterbury Lab 32% 43 47 8 0 0 0 0 2
Worsley and Eccles South Lab 30% 39 42 7 8 4 0 0 0
Walsall South Lab 29% 39 43 6 8 3 0 0 2
Birmingham, Northfield Lab 28% 40 43 6 7 3 0 0 1
Stockton North Lab 28% 39 42 6 11 0 0 0 2
Erith and Thamesmead Lab 28% 38 41 9 8 3 0 0 1
Lancaster and Fleetwood Lab 28% 40 43 7 6 4 0 0 0
Stalybridge and Hyde Lab 27% 39 43 6 7 4 0 0 1
Lanark and Hamilton East SNP 26% 34 18 9 0 0 38 0 0
Reading East Lab 26% 39 43 11 2 4 0 0 1
Newport West Lab 25% 39 43 6 7 3 0 3 0
Bradford South Lab 24% 37 42 6 12 3 0 0 0
Westmorland and Lonsdale LD 23% 42 7 47 4 0 0 0 0
Central Ayrshire SNP 23% 36 14 8 0 0 42 0 0
Argyll and Bute SNP 20% 34 7 20 0 0 39 0 0
Plymouth, Sutton and Devonport Lab 20% 40 45 5 6 3 0 0 0
Chesterfield Lab 19% 36 42 8 9 3 0 0 2
Hemsworth Lab 19% 33 39 7 16 3 0 0 2
Wirral South Lab 19% 39 45 8 5 3 0 0 0
Warrington North Lab 18% 36 42 9 10 4 0 0 0
Enfield, Southgate Lab 18% 40 45 10 3 2 0 0 0
Croydon Central Lab 18% 39 45 7 4 3 0 0 1
37
Constituency Win17 P(ConWin) Con Lab LD Brexit Green SNP PC Other
Blyth Valley Lab 16% 37 43 7 9 3 0 0 0
Tynemouth Lab 14% 39 46 6 6 3 0 0 0
Doncaster Central Lab 14% 33 40 6 15 3 0 0 3
Halifax Lab 13% 36 43 6 12 3 0 0 0
Oldham East and Saddleworth Lab 13% 35 42 7 12 2 0 0 2
Eltham Lab 12% 38 45 9 5 3 0 0 0
Perth and North Perthshire SNP 12% 37 6 9 2 0 46 0 0
Wirral West Lab 12% 39 45 8 6 2 0 0 0
Burnley Lab 11% 31 39 9 16 3 0 0 2
Portsmouth South Lab 11% 35 42 16 6 0 0 0 2
Table 23: Possible Con losses
Constituency Win17 P(ConWin) Con Lab LD Brexit Green SNP PC Other
St Albans Con 2% 37 10 49 0 3 0 0 2
Richmond Park Con 2% 39 6 53 0 0 0 0 1
Stirling Con 20% 36 11 8 0 3 42 0 0
East Renfrewshire Con 45% 38 12 11 0 0 39 0 0
Cheltenham Con 49% 45 8 45 0 0 0 0 2
Chipping Barnet Con 53% 41 41 14 0 3 0 0 1
Ochil and South Perthshire Con 57% 41 9 8 0 0 40 0 2
Angus Con 58% 44 6 7 0 0 43 0 0
Gordon Con 58% 40 7 15 0 0 38 0 0
South Cambridgeshire Con 62% 42 17 40 0 0 0 0 0
Aberdeen South Con 64% 39 11 14 0 0 36 0 0
Winchester Con 68% 47 7 44 0 0 0 0 2
Ayr, Carrick and Cumnock Con 69% 42 13 7 0 0 38 0 0
Hendon Con 71% 43 40 14 0 2 0 0 0
Putney Con 74% 38 34 23 0 4 0 0 0
Guildford Con 75% 44 9 39 0 0 0 0 8
Moray Con 76% 46 6 6 0 0 41 0 1
East Devon Con 76% 47 6 4 0 2 0 0 41
Milton Keynes North Con 79% 47 42 9 0 3 0 0 0
Lewes Con 80% 47 8 41 0 3 0 0 2
Cheadle Con 82% 47 11 42 0 0 0 0 0
St Ives Con 83% 46 10 40 0 2 0 0 2
Preseli Pembrokeshire Con 83% 49 42 5 0 0 0 4 0
Aberconwy Con 84% 47 41 6 0 0 0 7 0
Loughborough Con 86% 47 40 8 0 3 0 0 2
Dumfries and Galloway Con 89% 45 11 8 0 0 36 0 0
38

Labour gains/losses
Table 24: Possible Lab gains
Constituency Win17 P(LabWin) Con Lab LD Brexit Green SNP PC Other
Chipping Barnet Con 47% 41 41 14 0 3 0 0 1
Hendon Con 29% 43 40 14 0 2 0 0 0
Putney Con 26% 38 34 23 0 4 0 0 0
Glasgow East SNP 22% 19 34 6 0 0 41 0 0
Milton Keynes North Con 21% 47 42 9 0 3 0 0 0
Preseli Pembrokeshire Con 17% 49 42 5 0 0 0 4 0
Aberconwy Con 16% 47 41 6 0 0 0 7 0
Loughborough Con 14% 47 40 8 0 3 0 0 2
Airdrie and Shotts SNP 10% 22 29 7 0 3 40 0 0
Table 25: Possible Lab losses
Constituency Win17 P(LabWin) Con Lab LD Brexit Green SNP PC Other
Chorley Lab 0% 0 0 0 0 11 0 0 89
Barrow and Furness Lab 1% 50 35 7 5 3 0 0 0
Kensington Lab 4% 37 26 29 2 4 0 0 1
Ashfield Lab 5% 43 32 6 11 3 0 0 5
Wakefield Lab 5% 47 36 6 9 0 0 0 2
Penistone and Stocksbridge Lab 6% 43 34 11 12 0 0 0 0
Newcastle-under-Lyme Lab 6% 48 38 6 6 2 0 0 0
Glasgow North East Lab 9% 14 34 5 0 0 47 0 0
Rother Valley Lab 11% 40 33 6 16 3 0 0 2
Bishop Auckland Lab 12% 47 39 6 8 0 0 0 0
Don Valley Lab 13% 41 33 8 14 2 0 0 2
Sheffield, Hallam Lab 13% 23 30 37 5 4 0 0 1
Derby North Lab 15% 44 36 9 6 3 0 0 2
Wolverhampton South West Lab 16% 47 41 7 5 0 0 0 0
Blackpool South Lab 16% 43 37 5 11 3 0 0 2
Ynys Mn Lab 16% 35 28 0 9 0 0 28 0
Midlothian Lab 17% 24 31 8 0 0 38 0 0
Bassetlaw Lab 17% 44 38 7 11 0 0 0 0
Dudley North Lab 18% 46 39 5 6 2 0 0 2
Stockton South Lab 19% 47 41 6 6 0 0 0 0
Great Grimsby Lab 20% 42 37 4 13 3 0 0 1
Kirkcaldy and Cowdenbeath Lab 21% 22 29 7 4 3 36 0 0
Colne Valley Lab 21% 44 39 7 6 3 0 0 1
Rutherglen and Hamilton West Lab 22% 20 32 7 0 0 38 0 2
Stoke-on-Trent North Lab 22% 42 37 5 11 3 0 0 2
East Lothian Lab 23% 26 29 10 0 0 34 0 2
39

Constituency Win17 P(LabWin) Con Lab LD Brexit Green SNP PC Other
Crewe and Nantwich Lab 25% 43 39 8 7 3 0 0 1
Bolsover Lab 26% 42 38 5 12 2 0 0 2
Peterborough Lab 27% 43 39 6 7 3 0 0 1
Ipswich Lab 28% 43 39 7 7 3 0 0 1
Wrexham Lab 28% 42 38 6 7 2 0 4 0
Stroud Lab 28% 47 43 0 3 7 0 0 1
West Bromwich West Lab 28% 41 38 6 13 3 0 0 0
Wolverhampton North East Lab 29% 43 39 5 10 3 0 0 0
Warrington South Lab 29% 45 41 9 4 0 0 0 1
Warwick and Leamington Lab 31% 42 39 12 3 3 0 0 1
Hyndburn Lab 32% 43 39 5 10 2 0 0 0
Bury South Lab 32% 43 40 7 5 3 0 0 3
Darlington Lab 33% 43 41 6 7 2 0 0 1
Dagenham and Rainham Lab 33% 40 38 7 11 3 0 0 1
Vale of Clwyd Lab 35% 43 41 6 6 0 0 3 0
Scunthorpe Lab 37% 42 40 6 10 2 0 0 0
Clwyd South Lab 39% 43 41 6 6 0 0 4 0
Workington Lab 42% 41 40 6 9 2 0 0 1
Bedford Lab 42% 40 39 11 6 4 0 0 0
West Bromwich East Lab 43% 40 39 7 9 3 0 0 2
Keighley Lab 44% 43 42 6 7 0 0 0 1
Dewsbury Lab 45% 42 41 6 6 3 0 0 1
Leigh Lab 45% 40 39 7 12 0 0 0 2
Weaver Vale Lab 47% 42 42 8 5 3 0 0 0
Stoke-on-Trent Central Lab 47% 40 39 5 13 4 0 0 0
High Peak Lab 50% 42 42 9 5 2 0 0 0
Alyn and Deeside Lab 53% 42 42 6 7 0 0 3 0
Bury North Lab 54% 43 43 5 6 2 0 0 0
Delyn Lab 54% 43 43 5 6 0 0 3 0
Coatbridge, Chryston and Bellshill Lab 55% 16 39 5 0 2 38 0 0
Sedgefield Lab 56% 40 41 5 9 3 0 0 1
Bolton North East Lab 56% 41 42 6 9 3 0 0 0
Gower Lab 60% 42 43 6 5 0 0 3 0
Bridgend Lab 62% 41 43 5 5 2 0 4 0
Coventry North West Lab 62% 40 42 8 7 3 0 0 0
Coventry South Lab 64% 40 43 7 5 4 0 0 1
Heywood and Middleton Lab 64% 38 40 6 14 3 0 0 0
Gedling Lab 64% 41 44 6 6 2 0 0 0
Lincoln Lab 68% 41 44 5 7 2 0 0 1
Canterbury Lab 68% 43 47 8 0 0 0 0 2
Worsley and Eccles South Lab 70% 39 42 7 8 4 0 0 0
Walsall South Lab 71% 39 43 6 8 3 0 0 2
Birmingham, Northfield Lab 72% 40 43 6 7 3 0 0 1
Stockton North Lab 72% 39 42 6 11 0 0 0 2
40

Constituency Win17 P(LabWin) Con Lab LD Brexit Green SNP PC Other
Erith and Thamesmead Lab 72% 38 41 9 8 3 0 0 1
Lancaster and Fleetwood Lab 72% 40 43 7 6 4 0 0 0
Stalybridge and Hyde Lab 73% 39 43 6 7 4 0 0 1
Reading East Lab 74% 39 43 11 2 4 0 0 1
Newport West Lab 75% 39 43 6 7 3 0 3 0
Bradford South Lab 76% 37 42 6 12 3 0 0 0
Plymouth, Sutton and Devonport Lab 80% 40 45 5 6 3 0 0 0
Chesterfield Lab 81% 36 42 8 9 3 0 0 2
Hemsworth Lab 81% 33 39 7 16 3 0 0 2
Wirral South Lab 81% 39 45 8 5 3 0 0 0
Warrington North Lab 82% 36 42 9 10 4 0 0 0
Enfield, Southgate Lab 82% 40 45 10 3 2 0 0 0
Croydon Central Lab 82% 39 45 7 4 3 0 0 1
Blyth Valley Lab 84% 37 43 7 9 3 0 0 0
Tynemouth Lab 86% 39 46 6 6 3 0 0 0
Doncaster Central Lab 86% 33 40 6 15 3 0 0 3
Halifax Lab 87% 36 43 6 12 3 0 0 0
Oldham East and Saddleworth Lab 87% 35 42 7 12 2 0 0 2
Eltham Lab 88% 38 45 9 5 3 0 0 0
Wirral West Lab 88% 39 45 8 6 2 0 0 0
Burnley Lab 89% 31 39 9 16 3 0 0 2
Portsmouth South Lab 89% 35 42 16 6 0 0 0 2
41

Liberal Democrat gains/losses
Table 26: Possible LD gains
Constituency Win17 P(LDWin) Con Lab LD Brexit Green SNP PC Other
St Albans Con 98% 37 10 49 0 3 0 0 2
Richmond Park Con 98% 39 6 53 0 0 0 0 1
Sheffield, Hallam Lab 87% 23 30 37 5 4 0 0 1
Cheltenham Con 51% 45 8 45 0 0 0 0 2
North East Fife SNP 40% 21 6 35 0 0 37 0 0
South Cambridgeshire Con 38% 42 17 40 0 0 0 0 0
Winchester Con 32% 47 7 44 0 0 0 0 2
Guildford Con 25% 44 9 39 0 0 0 0 8
Lewes Con 20% 47 8 41 0 3 0 0 2
Cheadle Con 18% 47 11 42 0 0 0 0 0
St Ives Con 17% 46 10 40 0 2 0 0 2
Kensington Lab 14% 37 26 29 2 4 0 0 1
Table 27: Possible LD losses
Constituency Win17 P(LDWin) Con Lab LD Brexit Green SNP PC Other
Eastbourne LD 6% 48 8 38 6 0 0 0 1
North Norfolk LD 18% 46 7 40 7 0 0 0 0
Caithness, Sutherland and Easter Ross LD 41% 25 6 32 5 0 33 0 0
Edinburgh West LD 53% 20 9 34 0 4 34 0 0
Carshalton and Wallington LD 55% 40 9 41 5 3 0 0 1
East Dunbartonshire LD 73% 17 8 38 0 3 33 0 2
Westmorland and Lonsdale LD 77% 42 7 47 4 0 0 0 0
42

Scottish National Party gains/losses
Table 28: Possible SNP gains
Constituency Win17 P(SNPWin) Con Lab LD Brexit Green SNP PC Other
Glasgow North East Lab 91% 14 34 5 0 0 47 0 0
Midlothian Lab 82% 24 31 8 0 0 38 0 0
Stirling Con 80% 36 11 8 0 3 42 0 0
Kirkcaldy and Cowdenbeath Lab 79% 22 29 7 4 3 36 0 0
Rutherglen and Hamilton West Lab 78% 20 32 7 0 0 38 0 2
East Lothian Lab 70% 26 29 10 0 0 34 0 2
Caithness, Sutherland and Easter Ross LD 56% 25 6 32 5 0 33 0 0
East Renfrewshire Con 55% 38 12 11 0 0 39 0 0
Edinburgh West LD 47% 20 9 34 0 4 34 0 0
Coatbridge, Chryston and Bellshill Lab 45% 16 39 5 0 2 38 0 0
Ochil and South Perthshire Con 42% 41 9 8 0 0 40 0 2
Angus Con 42% 44 6 7 0 0 43 0 0
Gordon Con 42% 40 7 15 0 0 38 0 0
Aberdeen South Con 36% 39 11 14 0 0 36 0 0
Ayr, Carrick and Cumnock Con 31% 42 13 7 0 0 38 0 0
East Dunbartonshire LD 27% 17 8 38 0 3 33 0 2
Moray Con 24% 46 6 6 0 0 41 0 1
Dumfries and Galloway Con 11% 45 11 8 0 0 36 0 0
Table 29: Possible SNP losses
Constituency Win17 P(SNPWin) Con Lab LD Brexit Green SNP PC Other
North East Fife SNP 60% 21 6 35 0 0 37 0 0
Lanark and Hamilton East SNP 74% 34 18 9 0 0 38 0 0
Central Ayrshire SNP 77% 36 14 8 0 0 42 0 0
Glasgow East SNP 78% 19 34 6 0 0 41 0 0
Argyll and Bute SNP 80% 34 7 20 0 0 39 0 0
Perth and North Perthshire SNP 88% 37 6 9 2 0 46 0 0
Airdrie and Shotts SNP 89% 22 29 7 0 3 40 0 0
43

Brexit Party gains/losses
Table 30: Possible Brexit gains
Constituency Win17 P(BrexitWin) Con Lab LD Brexit Green SNP PC Other
Table 31: Possible Brexit losses
Constituency Win17 P(BrexitWin) Con Lab LD Brexit Green SNP PC Other
Plaid Cymru gains/losses
Table 32: Possible PC gains
Constituency Win17 P(PCWin) Con Lab LD Brexit Green SNP PC Other
Ynys Mn Lab 17% 35 28 0 9 0 0 28 0
Table 33: Possible PC losses
Constituency Win17 P(PCWin) Con Lab LD Brexit Green SNP PC Other
Ceredigion PC 89% 21 13 22 8 3 0 32 0
44

FIGURES
Constituency Vote Share by 2017 Constituency Vote Share
0 20 40 60 80
020
4060
80
Con
2017 vote share
2019
pre
dict
ed v
ote
shar
e
0 20 40 60 800
2040
6080
Lab
2017 vote share
2019
pre
dict
ed v
ote
shar
e0 20 40 60 80
020
4060
80
LD
2017 vote share
2019
pre
dict
ed v
ote
shar
e
0 20 40 60 80
020
4060
80
Brexit
2017 vote share
2019
pre
dict
ed v
ote
shar
e
0 20 40 60 80
020
4060
80
Green
2017 vote share
2019
pre
dict
ed v
ote
shar
e
0 20 40 60 80
020
4060
80
SNP
2017 vote share
2019
pre
dict
ed v
ote
shar
e
0 20 40 60 800
2040
6080
PC
2017 vote share
2019
pre
dict
ed v
ote
shar
e0 20 40 60 80
020
4060
80
Other
2017 vote share
2019
pre
dict
ed v
ote
shar
e
Constituency Vote Share by 2015 Constituency Vote Share
0 20 40 60 80
020
4060
80
Con
2015 vote share
2019
pre
dict
ed v
ote
shar
e
0 20 40 60 80
020
4060
80
Lab
2015 vote share
2019
pre
dict
ed v
ote
shar
e
0 20 40 60 80
020
4060
80
LD
2015 vote share
2019
pre
dict
ed v
ote
shar
e
0 20 40 60 80
020
4060
80
Brexit
2015 vote share
2019
pre
dict
ed v
ote
shar
e
0 20 40 60 80
020
4060
80
Green
2015 vote share
2019
pre
dict
ed v
ote
shar
e
0 20 40 60 80
020
4060
80
SNP
2015 vote share
2019
pre
dict
ed v
ote
shar
e
0 20 40 60 80
020
4060
80
PC
2015 vote share
2019
pre
dict
ed v
ote
shar
e
0 20 40 60 80
020
4060
80
Other
2015 vote share
2019
pre
dict
ed v
ote
shar
e
45

Constituency Vote Share by 2010 Constituency Vote Share
0 20 40 60 80
020
4060
80Con
2010 vote share
2019
pre
dict
ed v
ote
shar
e
0 20 40 60 80
020
4060
80
Lab
2010 vote share20
19 p
redi
cted
vot
e sh
are
0 20 40 60 80
020
4060
80
LD
2010 vote share
2019
pre
dict
ed v
ote
shar
e
0 20 40 60 80
020
4060
80
Brexit
2010 vote share
2019
pre
dict
ed v
ote
shar
e
0 20 40 60 80
020
4060
80
Green
2010 vote share
2019
pre
dict
ed v
ote
shar
e
0 20 40 60 80
020
4060
80SNP
2010 vote share
2019
pre
dict
ed v
ote
shar
e
0 20 40 60 80
020
4060
80
PC
2010 vote share20
19 p
redi
cted
vot
e sh
are
0 20 40 60 80
020
4060
80
Other
2010 vote share
2019
pre
dict
ed v
ote
shar
e
46
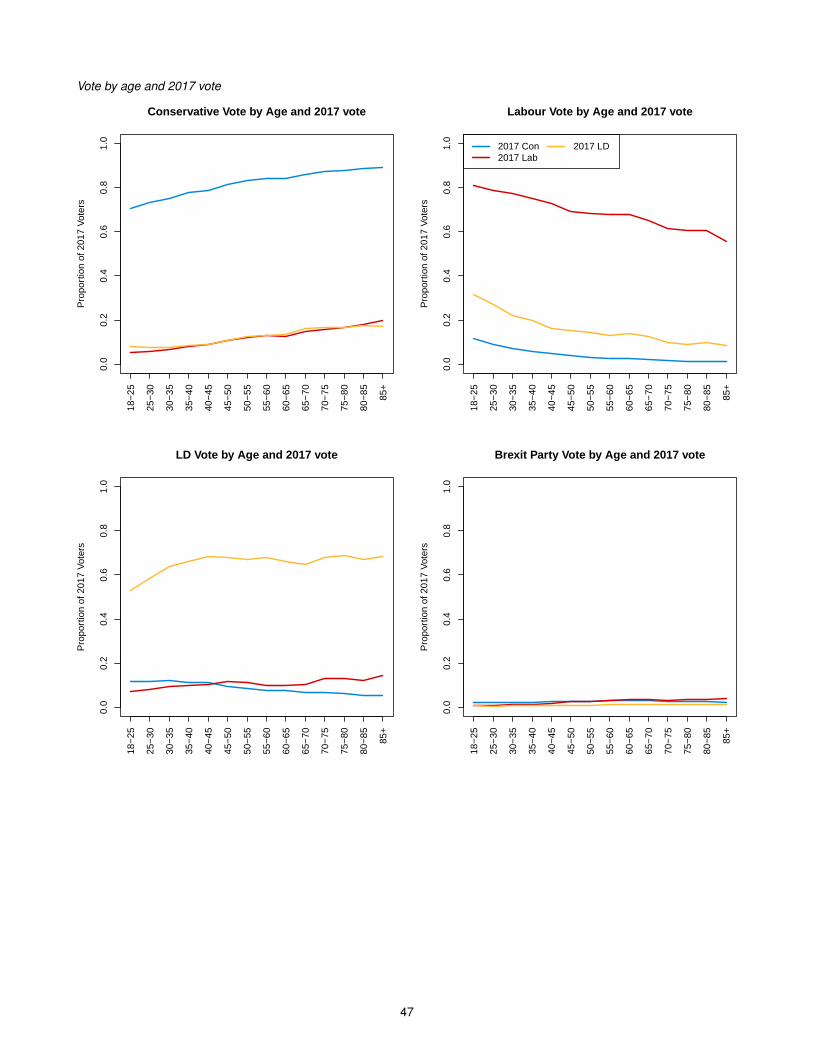
Vote by age and 2017 vote0.
00.
20.
40.
60.
81.
0Conservative Vote by Age and 2017 vote
Pro
port
ion
of 2
017
Vot
ers
18−
25
25−
30
30−
35
35−
40
40−
45
45−
50
50−
55
55−
60
60−
65
65−
70
70−
75
75−
80
80−
85
85+
0.0
0.2
0.4
0.6
0.8
1.0
Labour Vote by Age and 2017 vote
Pro
port
ion
of 2
017
Vot
ers
18−
25
25−
30
30−
35
35−
40
40−
45
45−
50
50−
55
55−
60
60−
65
65−
70
70−
75
75−
80
80−
85
85+
2017 Con2017 Lab
2017 LD
0.0
0.2
0.4
0.6
0.8
1.0
LD Vote by Age and 2017 vote
Pro
port
ion
of 2
017
Vot
ers
18−
25
25−
30
30−
35
35−
40
40−
45
45−
50
50−
55
55−
60
60−
65
65−
70
70−
75
75−
80
80−
85
85+
0.0
0.2
0.4
0.6
0.8
1.0
Brexit Party Vote by Age and 2017 vote
Pro
port
ion
of 2
017
Vot
ers
18−
25
25−
30
30−
35
35−
40
40−
45
45−
50
50−
55
55−
60
60−
65
65−
70
70−
75
75−
80
80−
85
85+
47

Vote by referendum vote and 2017 vote0.
00.
20.
40.
60.
81.
0Conservative Vote by EU vote and 2017 vote
Pro
port
ion
of 2
017
Vot
ers
Leave Remain
0.0
0.2
0.4
0.6
0.8
1.0
Labour Vote by EU vote and 2017 vote
Pro
port
ion
of 2
017
Vot
ers
Leave Remain
0.0
0.2
0.4
0.6
0.8
1.0
LD Vote by EU vote and 2017 vote
Pro
port
ion
of 2
017
Vot
ers
Leave Remain
0.0
0.2
0.4
0.6
0.8
1.0
Brexit party Vote by EU vote and 2017 vote
Pro
port
ion
of 2
017
Vot
ers
Leave Remain
48

Vote by qualifications and 2017 vote0.
00.
20.
40.
60.
81.
0Conservative Vote by Qualifications and 2017 vote
Pro
port
ion
of 2
017
Vot
ers
Non
e
Leve
l 1
Leve
l 2
Leve
l 3
Leve
l 4+
0.0
0.2
0.4
0.6
0.8
1.0
Labour Vote by Qualifications and 2017 vote
Pro
port
ion
of 2
017
Vot
ers
Non
e
Leve
l 1
Leve
l 2
Leve
l 3
Leve
l 4+
0.0
0.2
0.4
0.6
0.8
1.0
LD Vote by Qualifications and 2017 vote
Pro
port
ion
of 2
017
Vot
ers
Non
e
Leve
l 1
Leve
l 2
Leve
l 3
Leve
l 4+
0.0
0.2
0.4
0.6
0.8
1.0
Brexit Party Vote by Qualifications and 2017 vote
Pro
port
ion
of 2
017
Vot
ers
Non
e
Leve
l 1
Leve
l 2
Leve
l 3
Leve
l 4+
Note: the “Does not apply” and “Other” categories are excluded from this plot. “Does not apply” includes all voters over
age 70, regardless of their actual level of qualifications. This is because the Annual Population Survey does not record
qualifications for retired individuals past the age of 70. “Other” includes qualifications that are not included on the Register
of Regulated Qualifications.
## pdf## 2
49