Embed Size (px)
Citation preview
MS - 31August 2005
ISSN 1556-9012
Dependability of New ESL Writing Test Scores:
Evaluating Prototype Tasks and Alternative Rating Schemes
Yong-Won Lee and Robert Kantor
ETS, Princeton, NJ
RR-05-14
ETS is an Equal Opportunity/Affirmative Action Employer.
As part of its educational and social mission and in fulfilling the organization's non-profit Charter and Bylaws, ETS has and continues to learn from and also to lead research that furthers educational and measurement research to advance quality and equity in education and assessment for all users of the organization's products and services.
Copyright © 2005 by ETS. All rights reserved.
No part of this report may be reproduced or transmitted in any form or by any means, electronic or mechanical, including photocopy, recording, or any information storage and retrieval system, without permission in writing from the publisher. Violators will be prosecuted in accordance with both U.S. and international copyright laws.
EDUCATIONAL TESTING SERVICE, ETS, the ETS logos, TOEFL, the TOEFL logo, TSE, and TWE are registered trademarks of Educational Testing Service. The Test of English as a Foreign Language, the Test of Spoken English, and the Test of Written English are trademarks of Educational Testing Service.
To obtain more information about the TOEFL programs and services, use one of the following:
E-mail: [email protected] Web site: www.ets.org/toefl
Foreword
The TOEFL Monograph Series features commissioned papers and reports for TOEFL 2000 and other Test of English as a Foreign Language™ (TOEFL®) test development efforts. As part of the foundation for the development of the next generation TOEFL test, papers and research reports were commissioned from experts within the fields of measurement, language teaching, and testing through the TOEFL 2000 project. The resulting critical reviews, expert opinions, and research results have helped to inform TOEFL program development efforts with respect to test construct, test user needs, and test delivery. Opinions expressed in these papers are those of the authors and do not necessarily reflect the views or intentions of the TOEFL program.
These monographs are also of general scholarly interest, and the TOEFL program is pleased to make them available to colleagues in the fields of language teaching and testing and international student admissions in higher education.
The TOEFL 2000 project was a broad effort under which language testing at Educational Testing Service® (ETS®) would evolve into the 21st century. As a first step, the TOEFL program revised the Test of Spoken English™ (TSE®) and introduced a computer-based version of the TOEFL test. The revised TSE test, introduced in July 1995, is based on an underlying construct of communicative language ability and represents a process approach to test validation. The computer-based TOEFL test, introduced in 1998, took advantage of new forms of assessment and improved services made possible by computer-based testing, while also moving the program toward its longer-range goals, which included:
• the development of a conceptual framework that takes into account models of communicative competence
• a research program that informs and supports this emerging framework • a better understanding of the kinds of information test users need and want from the
TOEFL test • a better understanding of the technological capabilities for delivery of TOEFL tests
into the next century
Monographs 16 through 20 were the working papers that laid out the TOEFL 2000 conceptual frameworks with their accompanying research agendas. The initial framework document, Monograph 16, described the process by which the project was to move from identifying the test domain to building an empirically based interpretation of test scores. The subsequent framework documents, Monographs 17-20, extended the conceptual frameworks to the domains of reading, writing, listening, and speaking (both as independent and interdependent domains). These conceptual frameworks guided the research and prototyping studies described in subsequent monographs that resulted in the final test model. The culmination of the TOEFL 2000 project is the next generation TOEFL test that will be released in September 2005.
As TOEFL 2000 projects are completed, monographs and research reports will continue to be released and public review of project work invited.
TOEFL Program Educational Testing Service
iii
Abstract
Possible integrated and independent tasks were pilot tested for the writing section of a new
generation of TOEFL® (Test of English as a Foreign Language™) examination. This study
examines the impact of various rating designs as well as the impact of the number of tasks and
raters on the reliability of writing scores based on integrated and independent tasks from the
perspective of generalizability theory (G-theory). Both univariate and multivariate G-theory
analyses were conducted. It was found that (a) in terms of maximizing the score reliability, it
would be more efficient to increase the number of tasks rather than the number of ratings per
essay; (b) two particular single-rating designs having different tasks for the same examinee rated
by different raters [p × (R:T), R:(p × T)] achieved relatively higher score reliabilities than other
single-rating designs; and (c) a somewhat larger gain in composite score reliability was achieved
when the number of listening-writing tasks was larger than the number of reading-writing tasks.
Key words: Absolute error, dependability index, ESL (English as a second language),
generalizability coefficient, generalizability theory, integrated task, rating design, relative error,
score dependability, task generalizability, variance components, writing assessment
iv
Acknowledgments
This research project was funded by the Test of English as a Foreign Language (TOEFL)
Program at ETS. Several members of the ETS staff and external reviewers, in addition to the
authors, contributed to this project. Brent Bridgeman, Craig Deville, Phil Everson, Antony
Kunnan, and Don Powers reviewed a preliminary draft of the manuscript and provided helpful
comments for revision. Fred Cline prepared the data set for this analysis, and Youn-Hee Lim also
assisted us in creating tables and graphs. We would like to thank Yigal Attali, Robert Brennan,
Dan Eignor, Mary Enright, Deana Morgan, and Dan Tumposky for their helpful comments about
the earlier manuscripts of this report. We also would like to thank Kim Fryer for editing the final
report. Needless to say, the responsibility for any errors that remain are solely ours, and the ideas
and opinions expressed in the paper are those of the authors, not necessarily of ETS.
v
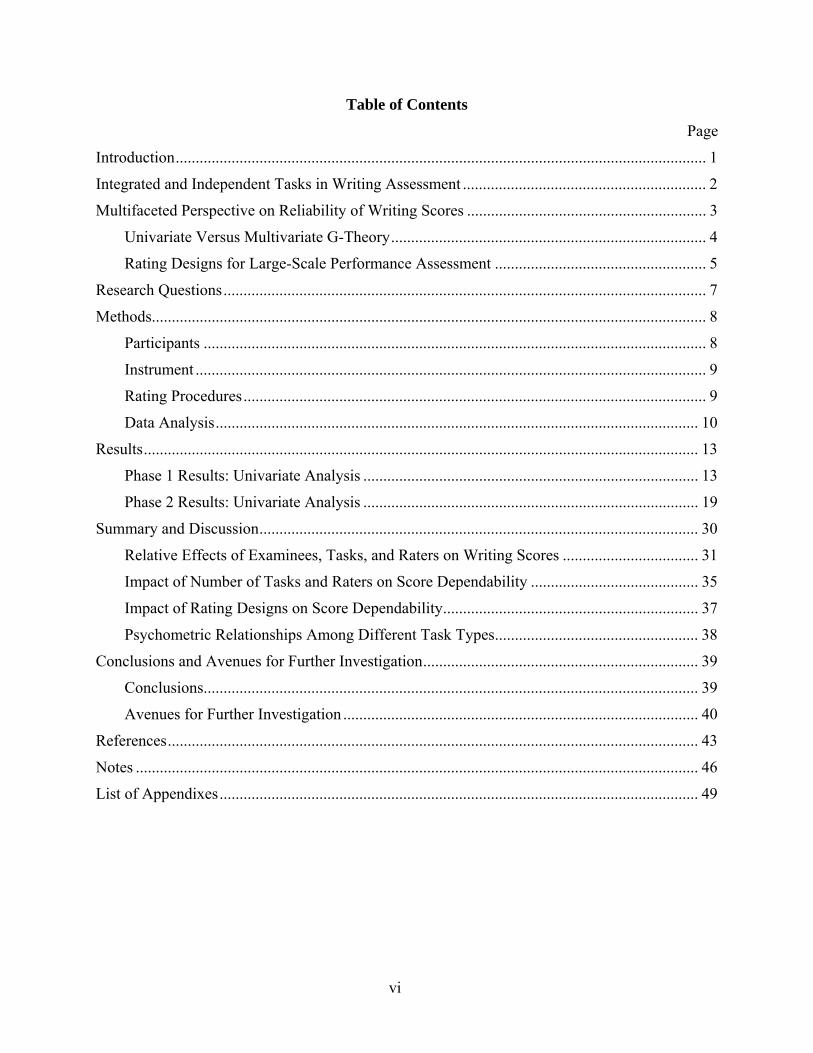
Table of Contents
Page
Introduction..................................................................................................................................... 1
Integrated and Independent Tasks in Writing Assessment ............................................................. 2
Multifaceted Perspective on Reliability of Writing Scores ............................................................ 3
Univariate Versus Multivariate G-Theory............................................................................... 4
Rating Designs for Large-Scale Performance Assessment ..................................................... 5
Research Questions......................................................................................................................... 7
Methods........................................................................................................................................... 8
Participants .............................................................................................................................. 8
Instrument ................................................................................................................................ 9
Rating Procedures.................................................................................................................... 9
Data Analysis......................................................................................................................... 10
Results........................................................................................................................................... 13
Phase 1 Results: Univariate Analysis .................................................................................... 13
Phase 2 Results: Univariate Analysis .................................................................................... 19
Summary and Discussion.............................................................................................................. 30
Relative Effects of Examinees, Tasks, and Raters on Writing Scores .................................. 31
Impact of Number of Tasks and Raters on Score Dependability .......................................... 35
Impact of Rating Designs on Score Dependability................................................................ 37
Psychometric Relationships Among Different Task Types................................................... 38
Conclusions and Avenues for Further Investigation..................................................................... 39
Conclusions............................................................................................................................ 39
Avenues for Further Investigation ......................................................................................... 40
References..................................................................................................................................... 43
Notes ............................................................................................................................................. 46
List of Appendixes........................................................................................................................ 49
vi
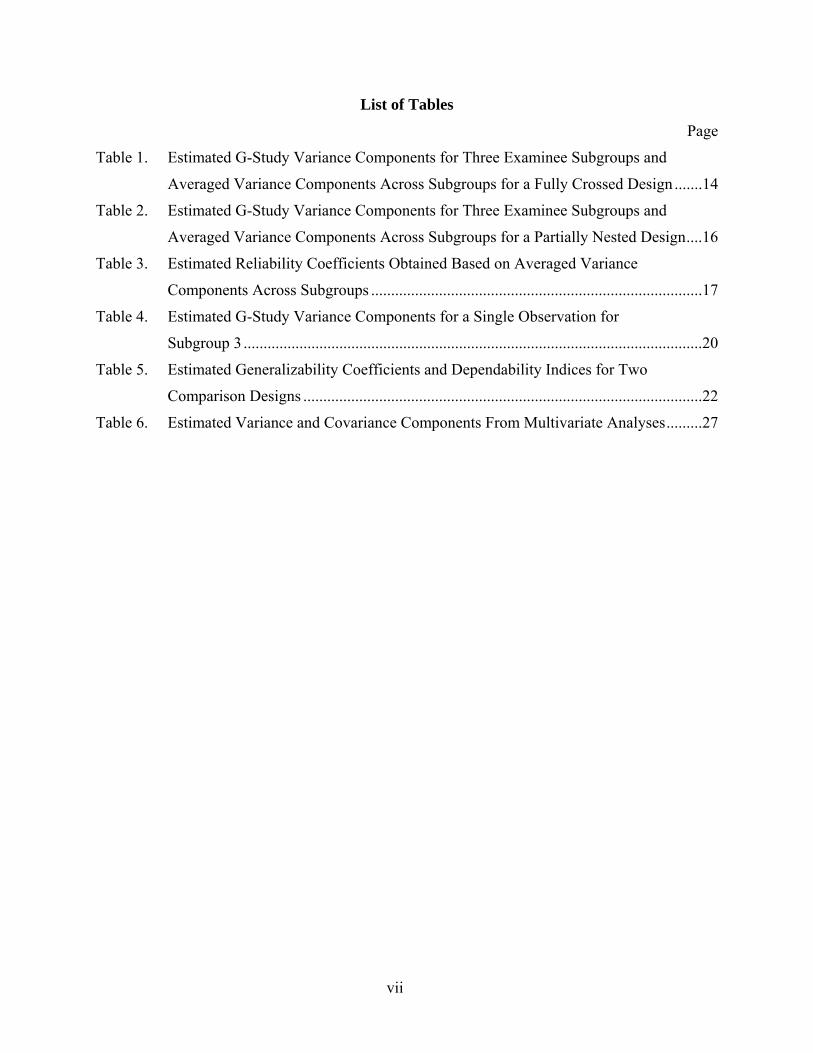
List of Tables
Page
Table 1. Estimated G-Study Variance Components for Three Examinee Subgroups and
Averaged Variance Components Across Subgroups for a Fully Crossed Design .......14
Table 2. Estimated G-Study Variance Components for Three Examinee Subgroups and
Averaged Variance Components Across Subgroups for a Partially Nested Design....16
Table 3. Estimated Reliability Coefficients Obtained Based on Averaged Variance
Components Across Subgroups ...................................................................................17
Table 4. Estimated G-Study Variance Components for a Single Observation for
Subgroup 3 ...................................................................................................................20
Table 5. Estimated Generalizability Coefficients and Dependability Indices for Two
Comparison Designs ....................................................................................................22
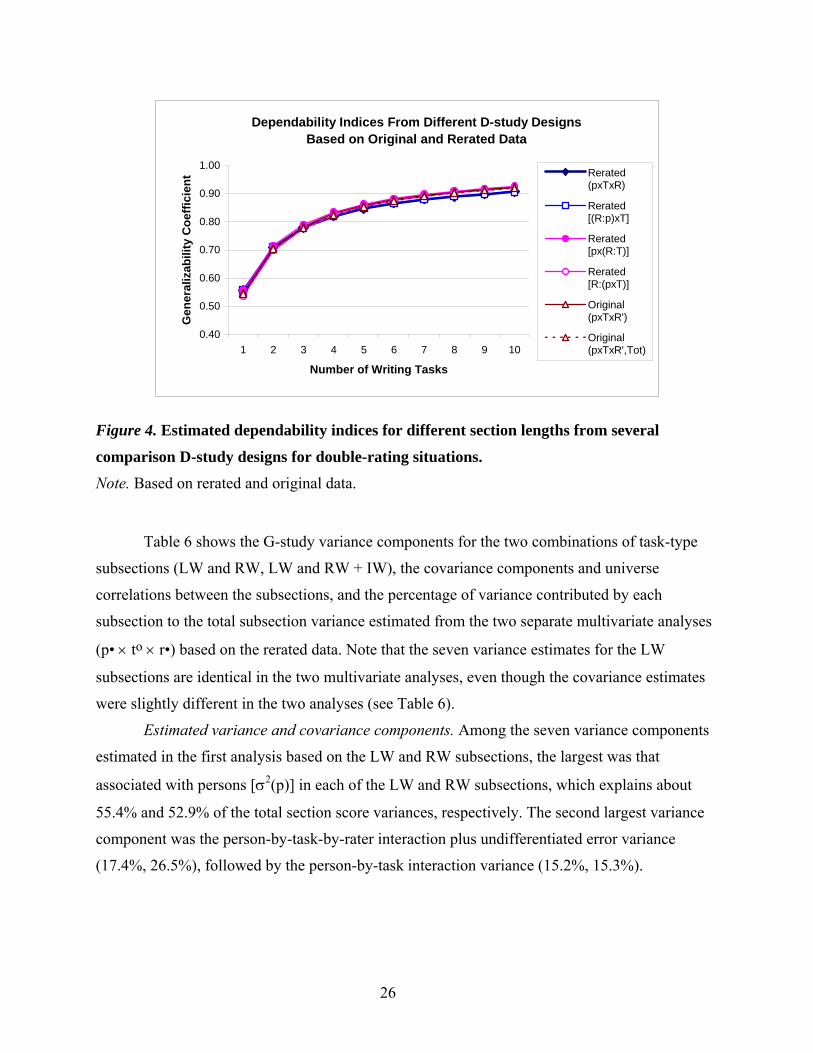
Table 6. Estimated Variance and Covariance Components From Multivariate Analyses.........27
vii
List of Figures
Page
Figure 1. Estimated reliability coefficients for one-rating- and two-ratings-per-essay
scenarios. ................................................................................................................ 18
Figure 2. Generalizability coefficients and dependability indices for single and double
ratings per essay. .................................................................................................... 23
Figure 3. Estimated dependability indices for different section lengths from several
comparison D-study designs for single-rating situations. ...................................... 24
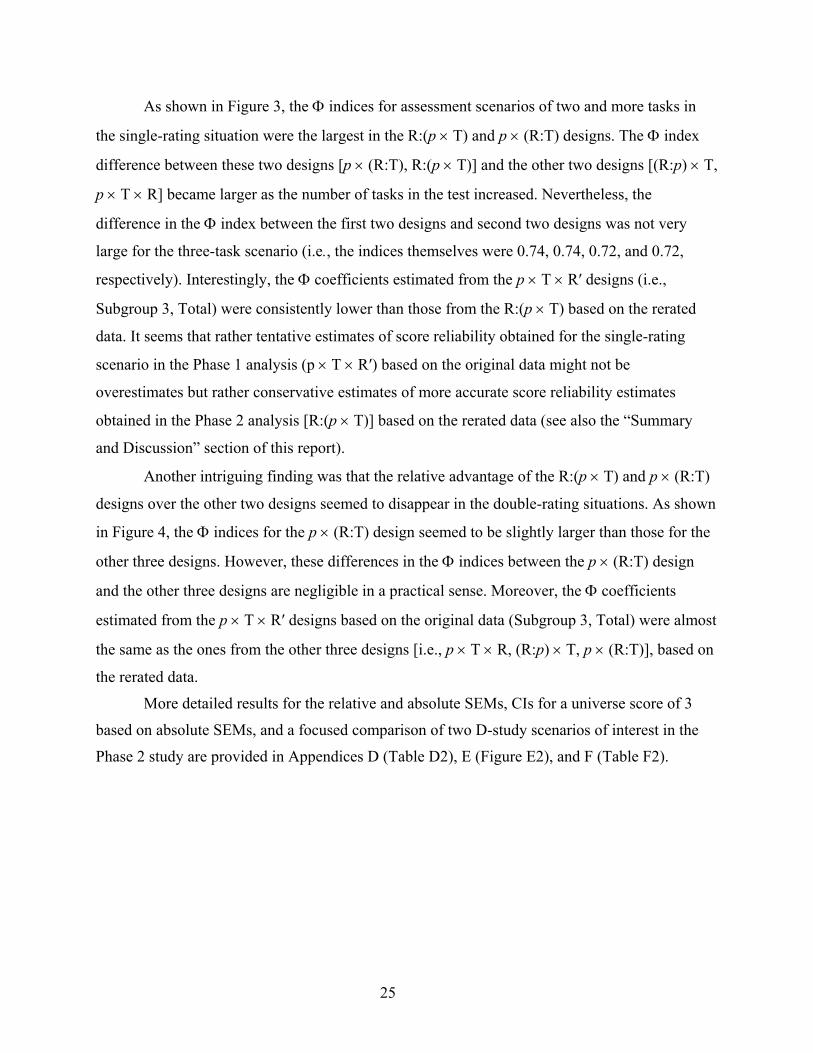
Figure 4. Estimated dependability indices for different section lengths from several
comparison D-study designs for double-rating situations. ..................................... 26
Figure 5. Estimated composite score reliability for different combinations of subsection
lengths for fixed total section lengths based on LW and RW subsections............. 29
Figure 6. Estimated composite score reliability for different combinations of subsection
lengths for fixed total section lengths based on LW and RW + IW subsections. .. 30
viii
Introduction
A new multitask writing measure is expected to be an essential component of a new
generation of TOEFL® (Test of English as a Foreign Language™) examination, as first
envisioned in the TOEFL 2000 Writing Framework (Cumming, Kantor, Powers, Santos, &
Taylor, 2000). In preliminary planning, three major types of writing tasks were considered for
the writing section of the new test. These included two integrated task types (listening-writing
[LW] and reading-writing [RW]) and a third, independent writing (IW) task, that is, a task based
on a stand-alone prompt. Integrated tasks require examinees to first understand academic
lectures or texts and then compose written responses that demonstrate understanding of such
stimulus material, whereas independent tasks require the test takers to depend on their personal
experiences or general knowledge rather than stimulus material to respond to a writing prompt.
However, assessments that require such extended, constructed responses from examinees in
general suffer from low score generalizability across tasks or task types (Brennan, 2000;
Brennan & Johnson, 1995; Linn, 1993a; Miller & Linn, 2000; Shavelson, Baxter, & Pine, 1992)
and depend on subjective rater (or reader) judgment for scoring the examinee responses. The
same can be true for constructed-response tasks designed to assess examinees’ language
proficiency, including their writing proficiency (Breland, Bridgeman, & Fowles, 1999; Brennan,
Gao, & Colton, 1995; Cumming et al., 2000; Powers & Fowles, 1998).
For this reason, tasks and raters have been investigated as two major sources of score
variability in the context of performance-based language assessment (Bachman, Lynch, &
Mason, 1995; Bolus, Hinofotis, & Bailey, 1982; Henning, 1996; Lynch & McNamara, 1998).
With respect to tasks, different types of tasks are associated with different types of input stimuli
(e.g., a lecture, a reading passage, a stand-alone prompt) in the new writing assessment. Thus,
one intriguing research issue is whether examinees’ performance on one task would be very
similar to their performance on other tasks designed to measure a common construct of interest
(i.e., writing proficiency). Additionally, since only a limited number of performance tasks can
usually be given to examinees (due to testing time constraints in large-scale performance-based
assessment in general), the generalizability of writing scores across tasks and task types is an
important issue in evaluating and validating new writing measures.
Score variability related to rater judgment is another critical factor that needs to be
carefully examined in performance-based writing assessments. Different task types require raters
to apply somewhat different scoring criteria. In addition, if a writing measure consists of multiple
1
tasks, the costs associated with scoring are likely to increase significantly, especially if each
writing sample is rated by two raters. To contain costs, one potential rating design might use a
single rating per essay but have each task for a particular test taker rated by a different rater.
Under such circumstances, it is critical to examine carefully the degree to which score
dependability can be affected by adopting a certain rating design over other possible alternative
designs, and how seriously decreasing or increasing the number of ratings per essay would affect
score dependability.
The main purpose of the current investigation is to examine the relative effects of tasks
and raters on examinees’ writing scores based on integrated and independent tasks and the
impact that the number of tasks and raters, and the rating designs, have on the score reliability
from the generalizability theory (G-theory) perspective. In this report, (a) theoretical frameworks
for integrated writing tasks and scoring criteria are examined, along with the issues of task
generalizability in the new writing assessment; (b) both univariate and multivariate G-theory
approaches to reliability estimation are described, along with some challenges for their
application in writing assessment; and (c) the results of G-theory analyses of new prototype
writing tasks are presented and discussed in terms of score dependability.
Integrated and Independent Tasks in Writing Assessment
As previously mentioned, integrated and independent writing tasks have been considered
as possible candidates for assessment tasks to be included in the new TOEFL examination
(Cumming et al., 2000). Both of these task types are intended to elicit responses that reflect
writing skills needed in an academic environment. Integrated tasks require examinees to
integrate multiple language skills in a substantial way to respond to a writing prompt (e.g., to
understand academic lectures or texts and create written responses that demonstrate
understanding of such stimulus material). While the integrated tasks provide the information
about which examinees will write, the independent tasks usually require examinees to rely on
their personal experiences or general knowledge to respond to a writing prompt. Integrated tasks
are advocated for two main reasons (Lewkowicz, 1997): (a) test takers are less likely to be
disadvantaged due to a lack of information on which to base their argument (Read, 1990; Weir,
1993); and (b) validity would be enhanced by simulating real-life writing tasks in academic
contexts (Wesche, 1987).
2
However, some concerns can also be raised regarding the incorporation of integrated
tasks in writing assessment. One important concern is the issue of low task generalizability that
could be exacerbated by the dependency created by common stimulus material shared between
the writing and comprehension sections (i.e., between writing and listening, between writing and
reading). For the tasks reported on here, input stimuli for listening-writing tasks are lectures used
in the listening section, and those for reading-writing tasks are passages used in the reading
section. On the other hand, an independent task type is associated with a stand-alone prompt. A
claim can then be made that each of these different writing task types measures a somewhat
distinct construct of writing, and that separate scores should be reported for each of these distinct
constructs. A similar argument could be made about the rating process. Raters are expected to
apply somewhat different scoring criteria for different task types. When they rate examinee
responses for independent tasks, raters mostly focus on language and ideas developed by the
writer. When they rate examinee responses from integrated tasks, however, raters also have to
attend to content accuracy to make sure that the examinees have adequately understood and
conveyed ideas presented in the lecture or text.
Nevertheless, if the seemingly distinct constructs associated with these three task types
are correlated highly among themselves for the TOEFL examinees, it would be justifiable from a
psychometric perspective to report a composite score for these task types. It remains to be seen
whether the three different types of tasks can be shown to be truly additive in terms of the
writing construct they are intended to measure as a whole. Whether the three task scores can be
aggregated to form a single, reliable writing score (or a single composite) is an empirical
question.
Multifaceted Perspective on Reliability of Writing Scores
When only a single measurement facet is involved in the assessment system, classical test
theory (CTT) is appropriate for examining the generalizability of test scores from a norm-
referenced testing perspective, as exemplified by internal consistency reliabilities. The new
TOEFL writing assessment, however, involves more than one major random facet. These facets
include tasks and raters as major sources of score variability. Such a context clearly requires
employing a multifaceted G-theory analysis (Cronbach, Gleser, Nanda, & Rajaratnam, 1972) that
can analyze more than one measurement facet simultaneously, in addition to the object of
measurement (i.e., examinees).1
3
Univariate Versus Multivariate G-Theory
G-theory provides a comprehensive conceptual framework and methodology for
analyzing more than one measurement facet in investigations of assessment error and score
dependability (Brennan, 1992, 2000, 2001; Cronbach et al., 1972; Shavelson & Webb, 1991;
Suen, 1990). Through a two-staged investigation that includes generalizability and decision
studies (G-studies and D-studies), G-theory enables researchers to disentangle multiple sources
of measurement error and investigate the impact of various changes in the measurement design
on score reliabilities. In the G-study, the variances associated with various facets of
measurement, including the object of measurement (usually examinees), are estimated and
evaluated in terms of their relative importance in contributing to the total score variance, given a
universe of admissible observations (Brennan, 2001). In the D-study, the impact of various
changes in the measurement design (e.g., different numbers of tasks or raters, standardization of
tasks or rating procedures) on score reliability is investigated for the universes of generalization
(Brennan, 2001) of interest.
In the D-study, two different types of reliability coefficients can be computed, one for
norm-referenced and the other for criterion-referenced score interpretations, respectively: (a) a
generalizability coefficient (Eρ2) and (b) a dependability index (Φ). A generalizability
coefficient (Eρ2) that uses relative error variance [σ2(δ)] as error variance can be conceptualized
as the ratio of universe (true) score variance to expected observed score variance (Brennan,
2001; Cronbach et al., 1972). It is also analogous to a reliability coefficient (i.e., coefficient
alpha) in classical test theory. However, a classical reliability coefficient usually implies a single
undifferentiated source of measurement error. To emphasize the multifaceted nature of
measurement error, the term generalizability coefficient is used to describe the reliability
coefficient obtained in the D-study for norm-referenced score interpretation (Suen, 1990). In
contrast, a dependability index (Φ) uses absolute error variance [σ2(∆)] as error variance and is
more appropriate for domain-referenced or criterion-referenced situations (Brennan, 2001). The
generalizability coefficients are useful in testing situations where the purpose of measurement is
to make relative decisions about examinees (e.g., selection of individuals for a particular
program) based on the relative standing, or rank ordering, of examinees compared to others in
the same group or a group average in test scores (Bachman, 1990; Bolus et al., 1982; Shavelson
& Webb, 1991). However, when the objective of measurement is to make absolute decisions
about whether examinees have attained a prespecified criterion level of performance, it is more
4
appropriate to use the reliability coefficient (i.e., Φ) that takes into account such systematic
differences related to test forms, tasks, and raters.2
G-theory can also be extended for multivariate situations where a test is made up of
multiple subsections or subtests, and where there is a need to examine the reliability of the
composite of subsection scores as well as each subsection score for the test (Brennan, 2001). In
the multivariate G-theory design, a set of subsections or content categories in the test are
considered a fixed facet, and the number of levels (or conditions) in each fixed category can be
either the same (balanced) or different (unbalanced) across the categories. Another quite-often-
cited use of multivariate G-theory is for analyzing a test for which multiple test forms have been
developed according to the same table of specifications. In this type of test, the same
specification, such as structure of content categories for items, is applied across different forms
of the test, and thus content categories can be regarded as a fixed facet. Univariate G-theory may
be regarded as a special case of multivariate G-theory, but the latter is more appropriate for
analyzing scores from multiple subsections simultaneously (see Brennan, 2001).
In the context of the new TOEFL assessment, task types in writing assessment (i.e.,
listening-writing, reading-writing, independent writing) can be viewed as a fixed content facet
for multivariate G-theory analyses because all three of these task types would appear in each
form of the writing assessment, according to the test specifications. If we are simply interested in
examining the impact on the score reliability of different numbers of tasks and raters in the
whole section, ignoring the task types as a facet, we can just use univariate G-theory to estimate
variance components and score reliability coefficients for the total section. However, if we are
interested in what combinations of task-type subsection lengths for a fixed total section length
can maximize or minimize the composite score reliability of the section, the multivariate G-
theory analysis can provide answers to such questions.3 More importantly, the universe score
correlations among the subsections estimated in multivariate G-theory analyses can provide a
basis for determining whether these subsection scores can sensibly be combined into a single
composite score for the whole section.
Rating Designs for Large-Scale Performance Assessment
When multiple raters (r) and tasks (t) are involved in the assessment of examinee (p)
proficiency, the most powerful G-study design from the research perspective might be a fully
crossed, two-facet design (p × t × r), with tasks (t) and raters (r) as random facets. This requires
that all the examinees take all the tasks included in a test form, and that all of the tasks be rated
5
by all raters for all examinees. In other words, examinees should be crossed with tasks (t) that are
also crossed with raters (r). Once data are collected according to such a fully crossed design,
researchers can investigate score reliability for various nested as well as crossed D-study designs
(Brennan, 2001). However, such a crossed design is not usually feasible for scoring large-scale
performance-based assessments because a large number of examinees would have to be rated by
the same raters on multiple tasks.
In many large-scale performance-based assessments, two raters selected from a pool of
trained raters rate each examinee’s performance sample on a single task or examinee’s
performance samples over multiple tasks, and the two raters’ ratings are averaged for each task.
A similar rating design was adopted for the initial ratings of writing samples in this study. One of
the G-study designs that can be used in such a context is a partially nested design with “tasks” (t)
and “raters” (r) as two random facets [(r:p) × t].4 In this G-study design, examinees are assumed
to take all the tasks in a test, with raters rating all the tasks in the test (i.e., rater overlap allowed
across tasks), but raters are nested within examinees (p). This design may be used to investigate
the joint impact of the number of tasks and raters on score dependability in such a context. It
should be pointed out, however, that the G-theory analyses based on the nested design may not
be applicable for such contexts in the strictest sense, because some degree of rater overlap is
usually allowed across examinees or blocks of examinees in operational testing situations
(including the rating design used in this study).
One alternative design in such circumstances would be to treat ratings (i.e., the first and
second rating: r′) as a random facet, instead of raters (r). Since all examinees’ final scores were
based on two ratings, it would be possible to use a fully crossed design with two random facets
of tasks and ratings (not raters) (p × t × r′). This alternative strategy is also consistent with the
inter-rater reliability computation procedure used for large-scale performance-type language
assessments, such as the Test of Written English™ (TWE®) assessment, the computer-based
TOEFL (CBT) essay test, and the Test of Spoken English™ (TSE®) assessment, where the inter-
rater reliability is computed by adjusting the correlation between the first and second ratings for
the number of ratings per performance sample. In other words, the ratings (not raters) are used as
the unit of analysis to obtain the inter-rater reliability estimate. The same approach has been used
by some researchers in language assessment as an alternative to, or together with, a partially
nested design (Bachman et al., 1995; Lee, Golub-Smith, Payton, & Carey, 2001).
6
In a research context, a more ideal approach would be to take performance samples of a
subgroup of examinees from a large-scale testing program and have all the essays for the
subgroup of examinees rerated by a different group of raters according to a fully crossed
(p × t × r) design in a special rating session.5 Once such a complete data matrix has been
obtained for a subgroup of examinees, it would be possible to investigate the impact of the
number of tasks and raters on score reliability in various rating scenarios, including partially
nested designs in the D-study [e.g., p × T × R, (R:p) × T, R:(p × T), p × (R:T)]6.
In this study, the (r:p) × t and p × t × r′ designs were used in the G-study for the original
data, but the p × t × r design was used for the rerated data. In addition, the results from the
p × t × r′ design based on the original data were compared with those from the p × t × r design
based on the rerated data. However, it should be mentioned that the multivariate counterparts of
most of the partially nested designs of interest—(r:p) × t, r:(p × t)—are not feasible in the
currently available computer program for multivariate G-theory analysis, mGENOVA (Brennan,
1999); whereas the multivariate counterpart of the p × t × r design is. For this reason, only the
p• × to × r• design is used to analyze the rerated data in this study for multivariate analyses.7
Research Questions
One particular single-rating scenario of interest investigated in this study for the new
writing assessment is to have all the essays rated only once, but each task for an examinee rated
by a different rater (possibly with a detection mechanism in place to flag unusual ratings for
further investigation). The consequences of adopting such a single-rating scheme would be that
the number of raters per essay would decrease from two to one, but the number of raters per
examinee could be the same as the number of tasks given in a test. For instance, when there are
three writing prompts given for all the examinees in the writing section, each of the three
prompts taken by the same examinee would be single-rated by a different rater. Thus, the total
number of raters for each examinee would be three under this particular assessment scenario.
The current program of research was carried out with the following five research
questions in mind:
1. What would be the impact of increasing the number of tasks from 1 to 10 in the writing
section?
2. What would be the impact of increasing the number of ratings per essay from one to two
for different section lengths?
7
3. What would be the impact of adopting a single-rating scheme in which each task is rated
by a different rater for each examinee for different section lengths?
4. What combinations of task-type subsection lengths for fixed total lengths (e.g., three
tasks) would maximize the composite score reliability for writing?
5. Do G-study designs using rating (r′) and raters (r) as random facets provide similar
results?
Methods
Participants
Phase 1. Participants were 488 English as a second/foreign language (ESL/EFL) students
recruited from three domestic and five overseas (Australia, Canada, Hong Kong, Mexico, and
Taiwan) testing sites. Participants completed a battery of English assessments containing a
prototype version of writing task types in the autumn of 2000 (Enright et al., in press). Included
in this study were 488 examinees with ratable writing responses on six of the eight writing tasks
taken. Each of the three different subgroups of examinees (np=162 for Subgroup 1, np= 164 for
Subgroup 2, np =162 for Subgroup 3) took a different combination of six writing tasks sampled
from a total of eight tasks, although each combination had five integrated tasks in common with
other combinations and one independent task unique for each combination (see also the
instrument subsection). Of the 488 examinees, 233 were males, 247 were females, and 8
examinees were of unidentified gender. At the time of the testing, the average age of the
examinees was 22.3 years. The examinees also took an ITP (Institutional Testing Program)
version of the paper-based TOEFL as a part of the larger pilot study, and their paper-based
TOEFL scores ranged from 337 to 673 (maximum possible score 677) with a mean of 558 and a
standard deviation of 61. The participants were from 43 diverse language backgrounds, with the
5 largest native language groups being Chinese (26%), Spanish (22%), Cantonese (11%), Korean
(8%), and Thai (7%).
Phase 2. Only the essays for Subgroup 3 examinees (np = 162) were rerated by six raters
according to a fully crossed design (p × t × r) (i.e., each rater rated each examinee’s response to
each of the six essays). Of the 162 examinees used in the Phase 2 study, there were 83 males, 71
females, and 1 examinee of unidentified gender. At the time of the testing, the average age of the
examinees was 21.9 years. Their paper-based ITP-TOEFL scores ranged from 403 to 673, with a
8
mean of 559 and a standard deviation of 61. The participants were from 29 different language
backgrounds, with the 5 largest native language groups being Chinese (22%), Spanish (19%),
Cantonese (16%), Korean (9%), and Japanese (6%).
Instrument
A total of eight writing tasks for the three task types were prepared and administered
originally as part of a prototyping study for the new TOEFL (Enright et al., in press). These
writing tasks included three LW, two RW, and three IW tasks (see Appendix G for examples of
each task type). In Phase 1, three LW and two RW tasks were administered to 488 ESL/EFL
examinees. There were also three IW tasks used, but each of these independent tasks was given
to a different subgroup of examinees, with three subgroups in total. For this reason, each
subgroup of examinees completed a total of six writing tasks (i.e., five common integrated tasks
plus one independent task specific to each subgroup). More specifically, analyses involved three
LW tasks, two RW tasks, and one IW task for each subgroup, in which the LW and RW tasks
were the same but the IW task was different across the three subgroups (see the Data Analysis
subsection of this report for more analysis details).
Rating Procedures
In rating the essays for the Phase 1 and 2 studies, three distinct scoring rubrics were used
to score examinees’ essays, with each rubric associated with one of the three task types (see
Appendix H for scoring rubrics). In Phase 1, each examinee response was double rated on a scale
of 1 to 5. Different pairs of independent raters were somewhat randomly selected from a pool of
27 raters, and one pair was assigned to each essay for each task. Raters had a chance to rate all
the tasks in the writing section (i.e., rater overlap was allowed across tasks), but raters were
nested within examinees. Rater training and rating sessions for these three task types were held at
the same location for two days. Raters were first trained about the scoring rubric for one task
type and asked to rate the examinee essays for each task in that specific task type on the same
day. Then, they were trained about the scoring rubric of the next task type and asked to rate all
the essays for each task in that task type. Printed copies of examinee essays were used for the
Phase 1 rating.
In Phase 2, 6 raters were chosen from the pool of 27 trained raters who had participated
in the rating session for Phase 1. To represent a universe of typical ETS raters trained and
certified to rate essays for large-scale writing assessment in the G-study, the 6 raters who had
9
comparatively low rating disagreement with other raters in Phase 1 were selected for the Phase 2
rating.8 Each of the essays for the six tasks for Subgroup 3 was rerated by each of these 6 raters
to obtain a complete data matrix for the examinees, tasks, and raters (p × t × r). In addition, to
emulate the rating conditions for the Online Scoring Network (OSN) at ETS (Powers & Kubota,
1998a, 1998b), two rating arrangements were made for the Phase 2 study: (a) A CD-ROM-based
rating kit was developed that permits raters to read word-processed essays online at their own
computers and assign the scores directly into the spreadsheet program; and (b) raters were given
a week to complete the rating of all of the essays at their own pace. To minimize the potential
halo effect, they were also asked to rate all the essays for a specific task (a specific task type) for
all examinees before moving on to the next task
Data Analysis
The computer program GENOVA (Crick & Brennan, 1983) was used to estimate not
only the variance components for the main and interaction effects for examinees, tasks, and
raters, but also the generalizability coefficients (Eρ2) and dependability indices (Φ) for univariate
analyses for the Phase 1 and 2 studies. The computer program mGENOVA (Brennan, 1999) was
used to conduct multivariate G-theory analysis for the rerated data from the Phase 2 study.
Phase 1. Separate univariate analyses were conducted to estimate the variance
components for the main and interaction effects for each of the three subgroups of examinees
based on the original data set. The three subgroups were treated as if each of the examinee
subgroups had taken a different form of the same test with three LW and two RW tasks as
common tasks across all three forms, but with one unique IW task in each test form. Each of the
same variance components was averaged across the three subgroups (test forms) to obtain more
stable estimates (Brennan et al., 1995; Gao, Shavelson, & Baxter, 1994), and then these averaged
variance components were used to compute the Eρ2 and Φ coefficients for the writing section.9
Three different G-study designs were used to estimate the variance components for the
main and interaction effects: (a) a two-facet crossed design (p × t × r′) with tasks (t) and ratings
(r′) as random facets, (b) a partially nested, two-facet design [(r:p) × t] with tasks (t) and raters (r)
as random facets, and (c) a single-facet crossed design (p × t) with tasks as a random facet and
ratings (r’) as a hidden facet. For the first two designs, multiple D-studies were carried out to
compute the Eρ2 and Φ coefficients by varying the number of tasks from 1 to 10 and the number
of ratings from 1 to 2 (see Appendix B for more details). The third design (p × t) was used to
10
estimate internal consistency reliability coefficients (αT) for different section lengths when the
averaged ratings over two raters were used as the unit of analysis (e.g., possible scores of 1.0,
1.5, …, 4.5, 5.0). Cronbach’s (1951) coefficient alpha (α) is numerically equivalent to a
generalizability coefficient (Eρ2) in a single-facet crossed design (Brennan, 1992; Suen, 1990).
Multiple D-studies were carried out to compute the αT coefficients by varying the number of
tasks from 1 to 10. The Eρ2 and Φ coefficients estimated from the p × T × R′ design were plotted
together with the αT coefficients from the p × T design for different testing conditions.
Phase 2. In univariate analyses, a fully crossed, two-facet design (p × t × r) with tasks (t)
and raters (r) as random facets was first employed to estimate the variance components for the
G-study based on the rerated data for Subgroup 3 (np = 162). The variance components estimated
from the p × t × r design were examined in comparison to those from the p × t × r′ design based
on the original data. In the rating data collected for a fully crossed design (p × t × r) in this study,
the rater (r) and rating (r′) facets are overlapped and thus refer to identical entities in the data
matrix (i.e., the first rating always assigned by Rater 1 for each examinee on each task, the
second rating always assigned by Rater 2, and so forth).
In the D-study based on the rerated data, four comparison designs of investigation were
the (a) p × T × R, (b) (R:p) × T, (c) p × (R:T), and (d) R:(p × T) designs. The p × T × R design
was used for a situation where the same universe of generalization would be used in the D-study
as in the G-study, while the (R:p) × T design was used to represent a typical rating design used
for TOEFL-family large-scale performance-based assessments (e.g., the TSE) in which an
examinee takes all the tasks in the test, and raters also rate all the tasks for that examinee, but
raters are nested within examinees. Finally, both of the p × (R:T) and R:(p × T) designs were
included here to represent the single-rating scenarios in which each task for the same examinee is
rated by a different rater. The two designs are similar in that raters do not overlap across tasks,
but they are different in terms of whether or not all the examinees for the same task are rated by
the same raters. In the p × (R:T) design, the same rater (or raters) rates all the examinees for the
same task, whereas each “examinee-by-task pair” is rated by a different rater (or different raters)
in the R:(p × T) design. Since these two designs are not very feasible for large-scale writing
assessment, the single-rating design that is more feasible for the new writing assessment is a
relaxed version of the R:(p × T) design, which can be viewed as something located in between
the extreme versions of the p × (R:T) and R:(p × T) designs (see Appendix A for more details).
11
For this reason, the R:(p × T) design is used as a main D-study design to represent the single-
rating scenario being considered for the new writing test in this study, but the results of the p ×
(R:T) design are also provided for comparison purposes. The Eρ2 and Φ coefficients were
estimated for different numbers of tasks and raters for the above four designs (see Appendix B
for details). The Eρ2 and Φ coefficients estimated from the four designs based on the rerated data
were also compared to those from the p × t × r′ design based on the original data for Subgroup 3.
For multivariate analyses, task-type subsections (e.g., LW, RW, and IW) had to be
treated as a fixed facet. However, it was not possible to have all these three subsections
represented as parts (or levels) of the fixed facet in the test because there was only one IW task
taken by all the examinees in Subgroup 3. For the purpose of multivariate analysis, there should
be at least two tasks given in each subsection to estimate the variances associated with tasks for
each subsection. For this reason, analyses had to be conducted using only two subsections with
more than one task: (a) the LW and RW subsections only, and (b) LW and the redefined RW +
IW subsections. In the first analysis, only the LW and RW subsections were used (ignoring the
IW subsection), while the LW subsection and the combined subsection of RW+IW were used in
the second analysis. The RW + IW subsection was formed by combining the RW and IW tasks,
partly on the grounds that both RW and IW tasks provide test input to examinees only in a
written mode (i.e., a passage plus a writing prompt, a writing prompt only). It should be
mentioned, however, that the creation of the redefined subsection was primarily done for
comparison purposes rather than for content-related reasons.
In each of the two separate analyses based on different pairs of task-type subsections
(LW and RW, LW and RW + IW), a two-facet crossed design (p• × to × r•) with tasks (t) and
raters (r) as random facets was employed in the G-study to estimate the variance components for
each subsection and the covariance components for such subsections. It was assumed that tasks
(t) were nested within each subsection (v), but persons (p) and raters (r) were crossed with the
subsections. Multiple D-studies were carried out to compute the Eρ2 and Φ coefficients for
composites of the subsection scores by varying the number of tasks in each subsection for the
several fixed total section lengths (see Appendix C for more details). Of particular interest were
comparisons of composite score reliabilities for different combinations of subsection lengths for
the fixed total section lengths of 2, 3, and 4 tasks. When the total section length was two, the
only possible scenario for representing each of these two subsections was to take 1 task for each
of the two subsections (i.e., 1−1). For the test length of three, there were two possible scenarios
12
(i.e., 2−1, 1−2). When the total test length was 4, there were three possible scenarios (3−1, 2−2,
and 1−3). For comparison purposes, two additional combinations for longer section scenarios (6
and 10 tasks) were also included in the D-study (i.e., 3−3, 5−5).
Results
For both the Phase 1 and 2 analyses, similar results were obtained about the relative
effects of tasks and raters on the examinees’ writing scores in the univariate G-theory analyses.
Phase 1 univariate analyses based on the p × T × R′ and (R:p) × T designs produced, in a
practical sense, the same results in terms of score reliability estimates and standard errors of
measurement (SEM). Phase 2 univariate analysis also revealed intriguing patterns of results for
the four comparison designs. Finally, Phase 2 multivariate G-theory analysis with only two task-
type subsections (e.g., LW and RW) also provided useful information about the relationships
between the task-type subsections. More detailed descriptions of the results of univariate and
multivariate analyses in Phases 1 and 2 are presented next.
Phase 1 Results: Univariate Analysis
Variance components were estimated for each of the three subgroups of examinees
through three separate analyses, and then they were averaged across the three subgroups (or test
forms). The analyses that followed for the p × t × r′ and (r:p) × t designs yielded very similar
patterns of results (e.g., relative proportions of various variance components, score reliabilities
for different numbers of tasks and raters). Since two comparison assessment scenarios of interest
in this study were writing tests of (a) three tasks rated once and (b) one task rated twice, the
results of analyses are discussed with a focus on these two assessment scenarios.10
Estimated variance components. Tables 1 and 2 display the estimated G-study variance
components (Var.), the estimated standard error of estimated variances (S.E.), and the percentage
of each variance component for the three subgroups and the total (averaged) group for the p × t ×
r′ and (r:p) × t designs, respectively. There were seven variance components estimated in the p ×
t × r′ design, as shown in Table 1, which included the variance components associated with (a)
persons [σ2(p)], (b) tasks [σ2(t)], (c) ratings [σ2(r′)], (d) person-by-task interaction [σ2(pt)], (e)
person-by-rating interaction [σ2(pr′)], (f) task-by-rating interaction [σ2(tr′)], and (g) person-by-
task-by-rating interaction plus undifferentiated error [σ2(ptr′, undifferentiated)] effects.
13
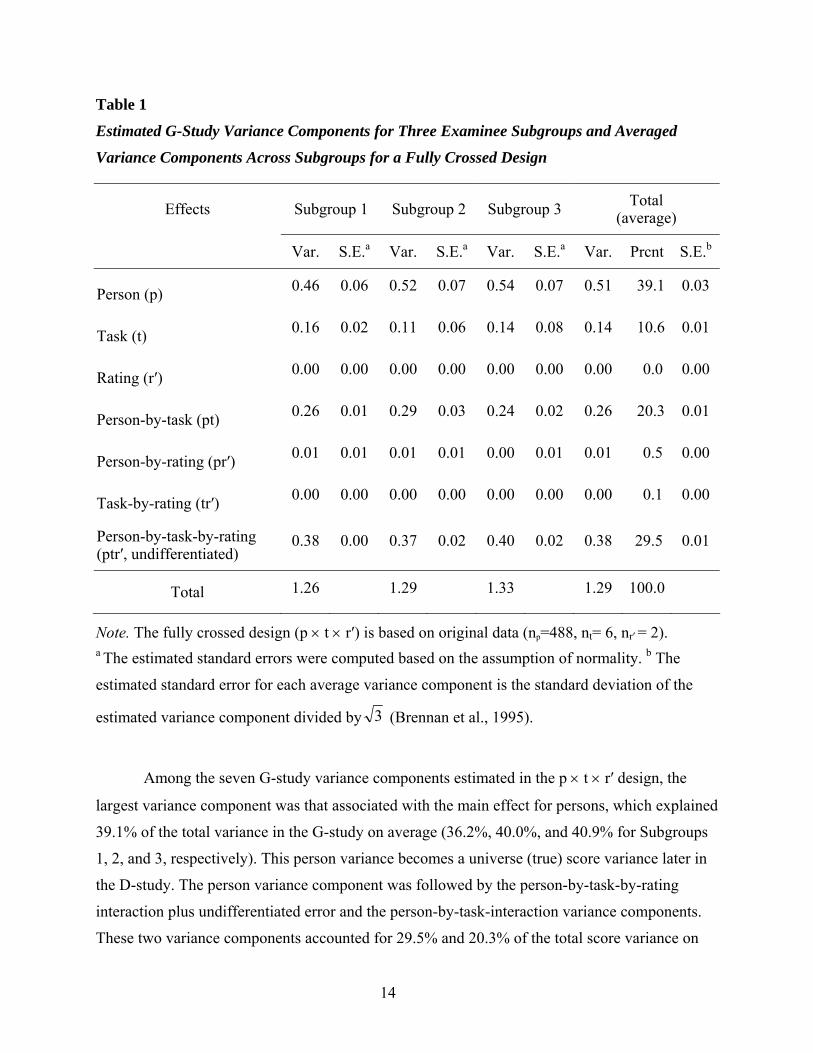
Table 1
Estimated G-Study Variance Components for Three Examinee Subgroups and Averaged
Variance Components Across Subgroups for a Fully Crossed Design
Effects Subgroup 1 Subgroup 2 Subgroup 3 Total (average)
Var. S.E.a Var. S.E.a Var. S.E.a Var. Prcnt S.E.b
Person (p) 0.46 0.06 0.52 0.07 0.54 0.07 0.51 39.1 0.03
Task (t) 0.16 0.02 0.11 0.06 0.14 0.08 0.14 10.6 0.01
Rating (r′) 0.00 0.00 0.00 0.00 0.00 0.00 0.00 0.0 0.00
Person-by-task (pt) 0.26 0.01 0.29 0.03 0.24 0.02 0.26 20.3 0.01
Person-by-rating (pr′) 0.01 0.01 0.01 0.01 0.00 0.01 0.01 0.5 0.00
Task-by-rating (tr′) 0.00 0.00 0.00 0.00 0.00 0.00 0.00 0.1 0.00
Person-by-task-by-rating (ptr′, undifferentiated)
0.38 0.00 0.37 0.02 0.40 0.02 0.38 29.5 0.01
Total 1.26 1.29 1.33 1.29 100.0
Note. The fully crossed design (p × t × r′) is based on original data (np=488, nt= 6, nr′ = 2). a The estimated standard errors were computed based on the assumption of normality. b The
estimated standard error for each average variance component is the standard deviation of the
estimated variance component divided by 3 (Brennan et al., 1995).
Among the seven G-study variance components estimated in the p × t × r′ design, the
largest variance component was that associated with the main effect for persons, which explained
39.1% of the total variance in the G-study on average (36.2%, 40.0%, and 40.9% for Subgroups
1, 2, and 3, respectively). This person variance becomes a universe (true) score variance later in
the D-study. The person variance component was followed by the person-by-task-by-rating
interaction plus undifferentiated error and the person-by-task-interaction variance components.
These two variance components accounted for 29.5% and 20.3% of the total score variance on
14
average, respectively. These results suggest that the relative ranking of examinees changes
considerably across different tasks as well as different task-by-rating pairs. The next largest
variance component was the one associated with the main effect for tasks, which accounted for
10.6% of the total variance and indicates that there is some difference in task difficulty across
writing tasks used in this study. Nevertheless, the person-by-rating interaction variance was very
small (0.5%) and the task-by-rating interaction was close to zero, indicating that examinees’ and
tasks’ relative rankings remain constant across the first and second ratings. The main effect for
ratings (r′) was also zero, which means that there were no significant differences in severity
between the first and second ratings. Since the same individual raters were allowed to serve as
the first raters for some examinees and the second raters for other examinees in the same rating
sessions, this was very much an expected phenomenon (i.e., potential severity differences among
raters could have been accumulated and canceled out across examinees in a similar fashion in the
first and second ratings).
As shown in Table 2, five different variance components estimated in the (r:p) × t design
were associated with (a) persons [σ2(p)], (b) tasks [σ2(t)], (c) raters nested within persons
[σ2(r:p)], (d) person-by-task interaction [σ2(pt)], and (e) task-by-rater (nested within person)
interaction plus undifferentiated error [σ2(tr:p, undifferentiated)], respectively. Of the five
variance components, the variance component associated with the main effect for persons [σ2(p)]
was again the largest, as in the p × t × r′ design and explained 39.1% of the total variance for a
single observation on average in the G-study (36.2%, 40.1%, and 40.9% for Subgroups 1, 2, and
3, respectively). The second largest variance was the task-by-rater (nested within person)
interaction plus undifferentiated error variance, which accounted for 29.6% of the total score
variance in the G-study. The third largest variance component was the person-by-task interaction
variance, which explained 20.2% of the total score variance for a single observation and
indicates that the relative ranking of examinees varies considerably across different tasks. The
main effect for tasks accounted for 10.6% of the total variance, suggesting that there is some
difference in task difficulty among writing tasks used in this study. The main effect for raters
nested within persons [σ2(r:p)] accounted for 0.5% of the total variance. It should be noted that
the main effect for raters [σ2(r)] and the person-by-rater interaction effect [σ2(pr)] are
confounded in this variance component.
15
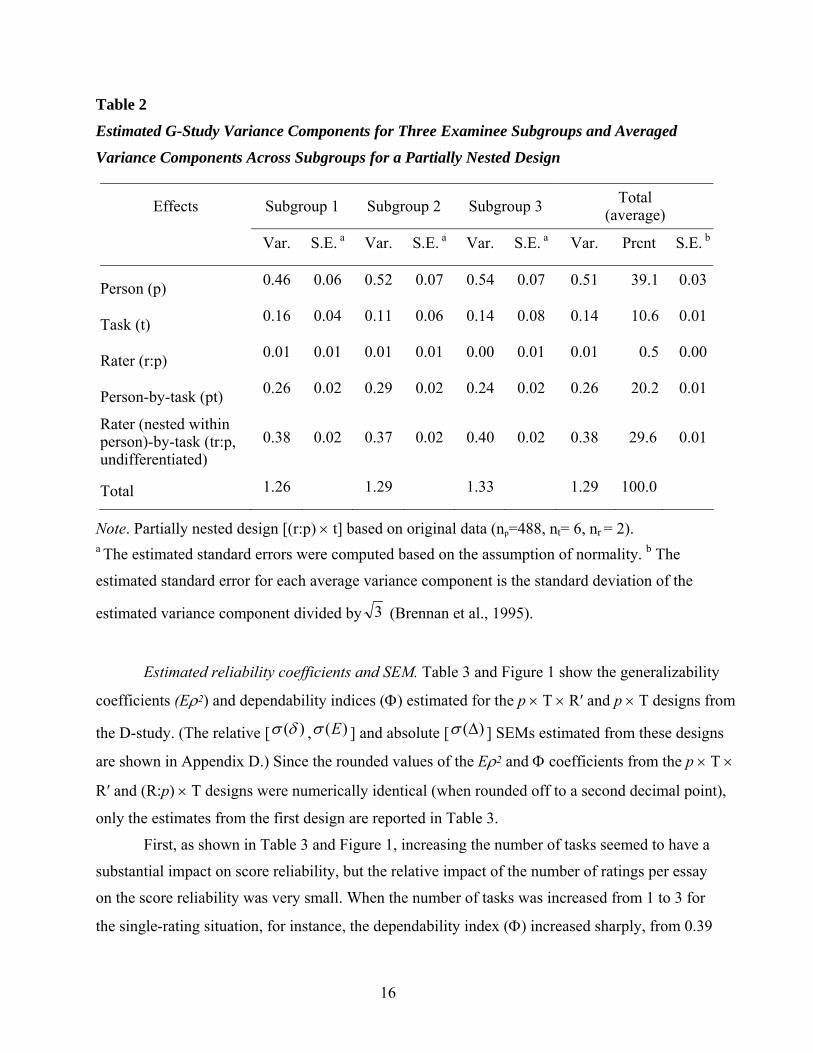
Table 2
Estimated G-Study Variance Components for Three Examinee Subgroups and Averaged
Variance Components Across Subgroups for a Partially Nested Design
Effects Subgroup 1 Subgroup 2 Subgroup 3 Total (average)
Var. S.E. a Var. S.E. a Var. S.E. a Var. Prcnt S.E. b
Person (p) 0.46 0.06 0.52 0.07 0.54 0.07 0.51 39.1 0.03
Task (t) 0.16 0.04 0.11 0.06 0.14 0.08 0.14 10.6 0.01
Rater (r:p) 0.01 0.01 0.01 0.01 0.00 0.01 0.01 0.5 0.00
Person-by-task (pt) 0.26 0.02 0.29 0.02 0.24 0.02 0.26 20.2 0.01
Rater (nested within person)-by-task (tr:p, undifferentiated)
0.38 0.02 0.37 0.02 0.40 0.02 0.38 29.6 0.01
Total 1.26 1.29 1.33 1.29 100.0
Note. Partially nested design [(r:p) × t] based on original data (np=488, nt= 6, nr = 2). a The estimated standard errors were computed based on the assumption of normality. b The
estimated standard error for each average variance component is the standard deviation of the
estimated variance component divided by 3 (Brennan et al., 1995).
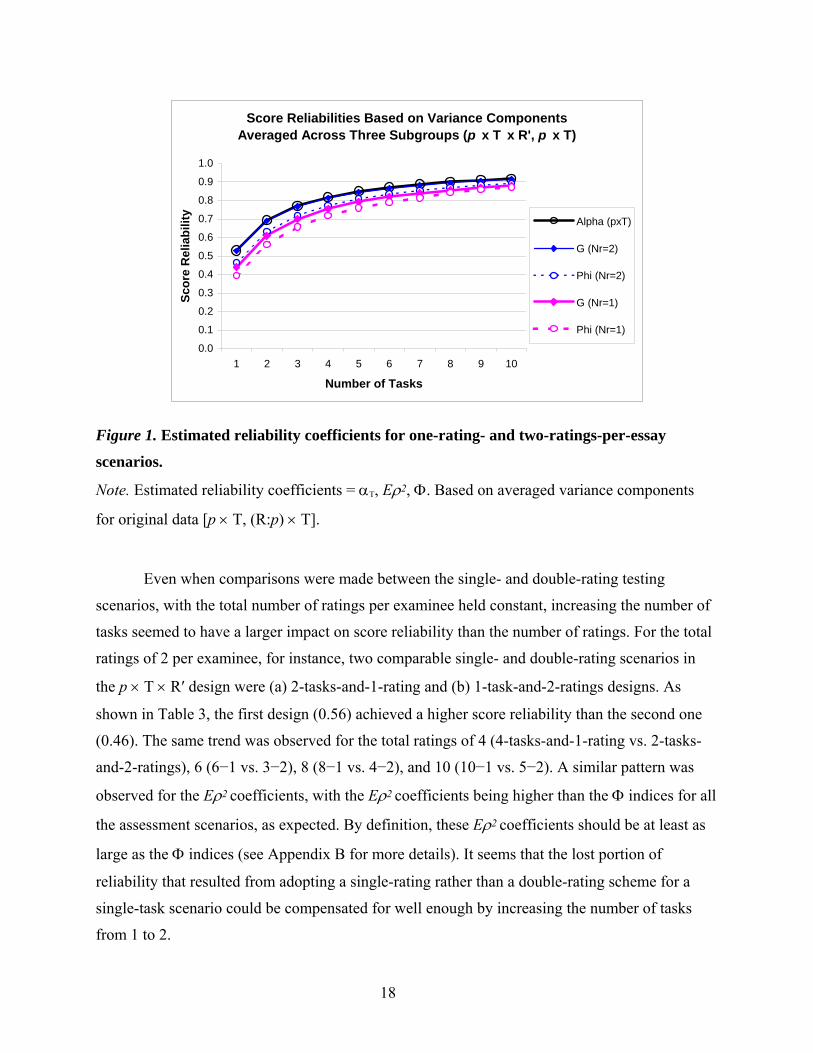
Estimated reliability coefficients and SEM. Table 3 and Figure 1 show the generalizability
coefficients (Eρ2) and dependability indices (Φ) estimated for the p × T × R′ and p × T designs from
the D-study. (The relative [ )(δσ , )(Eσ ] and absolute [ )(∆σ ] SEMs estimated from these designs
are shown in Appendix D.) Since the rounded values of the Eρ2 and Φ coefficients from the p × T ×
R′ and (R:p) × T designs were numerically identical (when rounded off to a second decimal point),
only the estimates from the first design are reported in Table 3.
First, as shown in Table 3 and Figure 1, increasing the number of tasks seemed to have a
substantial impact on score reliability, but the relative impact of the number of ratings per essay
on the score reliability was very small. When the number of tasks was increased from 1 to 3 for
the single-rating situation, for instance, the dependability index (Φ) increased sharply, from 0.39
16
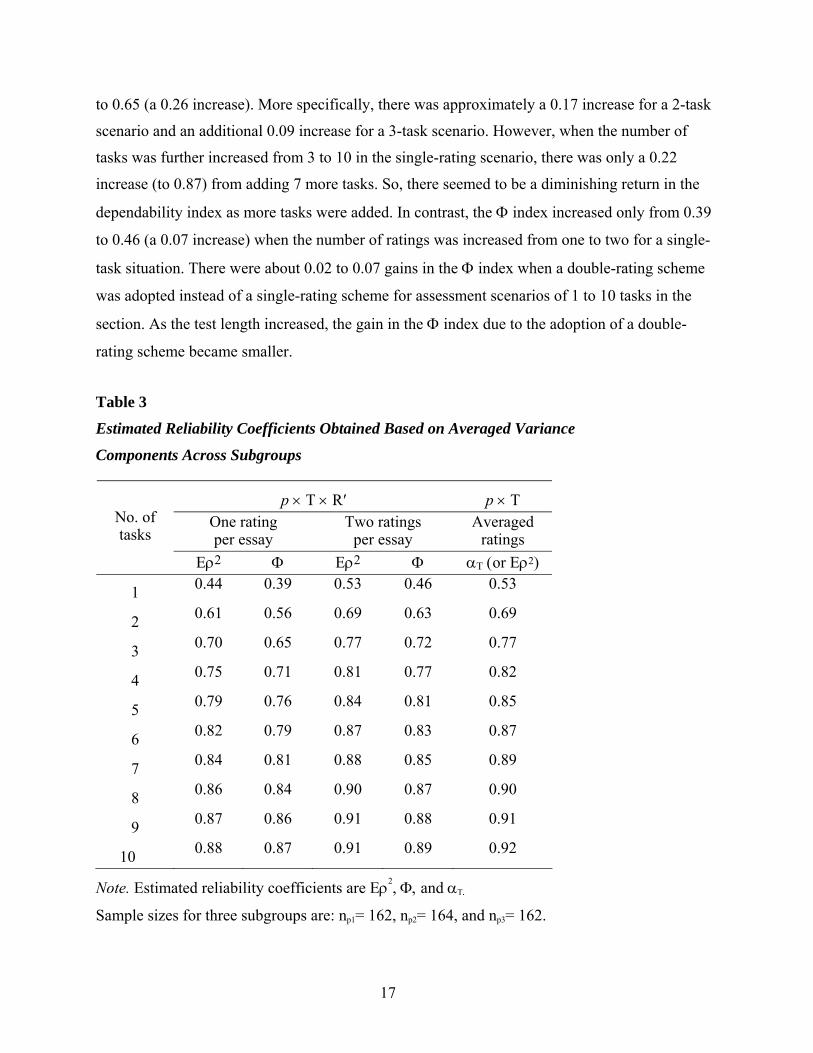
to 0.65 (a 0.26 increase). More specifically, there was approximately a 0.17 increase for a 2-task
scenario and an additional 0.09 increase for a 3-task scenario. However, when the number of
tasks was further increased from 3 to 10 in the single-rating scenario, there was only a 0.22
increase (to 0.87) from adding 7 more tasks. So, there seemed to be a diminishing return in the
dependability index as more tasks were added. In contrast, the Φ index increased only from 0.39
to 0.46 (a 0.07 increase) when the number of ratings was increased from one to two for a single-
task situation. There were about 0.02 to 0.07 gains in the Φ index when a double-rating scheme
was adopted instead of a single-rating scheme for assessment scenarios of 1 to 10 tasks in the
section. As the test length increased, the gain in the Φ index due to the adoption of a double-
rating scheme became smaller.
Table 3
Estimated Reliability Coefficients Obtained Based on Averaged Variance
Components Across Subgroups
p × T × R′ p × T One rating per essay
Two ratings per essay
Averaged ratings
No. of tasks
Eρ2 Φ Eρ2 Φ αΤ (or Eρ2)
1 0.44 0.39 0.53 0.46 0.53
2 0.61 0.56 0.69 0.63 0.69
3 0.70 0.65 0.77 0.72 0.77
4 0.75 0.71 0.81 0.77 0.82
5 0.79 0.76 0.84 0.81 0.85
6 0.82 0.79 0.87 0.83 0.87
7 0.84 0.81 0.88 0.85 0.89
8 0.86 0.84 0.90 0.87 0.90
9 0.87 0.86 0.91 0.88 0.91
10 0.88 0.87 0.91 0.89 0.92
Note. Estimated reliability coefficients are Eρ2, Φ, and αΤ.
Sample sizes for three subgroups are: np1= 162, np2= 164, and np3= 162.
17
Score Reliabilities Based on Variance Components Averaged Across Three Subgroups (p x T x R', p x T)
0.0
0.1
0.2
0.3
0.4
0.5
0.6
0.7
0.8
0.9
1.0
1 2 3 4 5 6 7 8 9 10
Number of Tasks
Scor
e R
elia
bilit
y
Alpha (pxT)
G (Nr=2)
Phi (Nr=2)
G (Nr=1)
Phi (Nr=1)
Figure 1. Estimated reliability coefficients for one-rating- and two-ratings-per-essay
scenarios.
Note. Estimated reliability coefficients = αT, Eρ2, Φ. Based on averaged variance components
for original data [p × T, (R:p) × T].
Even when comparisons were made between the single- and double-rating testing
scenarios, with the total number of ratings per examinee held constant, increasing the number of
tasks seemed to have a larger impact on score reliability than the number of ratings. For the total
ratings of 2 per examinee, for instance, two comparable single- and double-rating scenarios in
the p × T × R′ design were (a) 2-tasks-and-1-rating and (b) 1-task-and-2-ratings designs. As
shown in Table 3, the first design (0.56) achieved a higher score reliability than the second one
(0.46). The same trend was observed for the total ratings of 4 (4-tasks-and-1-rating vs. 2-tasks-
and-2-ratings), 6 (6−1 vs. 3−2), 8 (8−1 vs. 4−2), and 10 (10−1 vs. 5−2). A similar pattern was
observed for the Eρ2 coefficients, with the Eρ2 coefficients being higher than the Φ indices for all
the assessment scenarios, as expected. By definition, these Eρ2 coefficients should be at least as
large as the Φ indices (see Appendix B for more details). It seems that the lost portion of
reliability that resulted from adopting a single-rating rather than a double-rating scheme for a
single-task scenario could be compensated for well enough by increasing the number of tasks
from 1 to 2.
18
Table 3 and Figure 1 also illustrate estimates of internal consistency alpha (αΤ) based on
averaged ratings across two raters from the p × T design. The coefficient αΤ from the p × T
design based on the averaged ratings over two raters is usually expected to be higher than the
Eρ2 coefficient estimated from the p × T × R′ design for the double-rating situation. This is
because ratings (r′) are treated as a hidden fixed facet in the p × T design and because the
variances associated with ratings become part of the universe score variance in the p × T
design.11 As expected, the αΤ estimates were slightly higher than the Eρ2 estimates, but only for a
certain number of tasks in the test. Clearly, these αΤ estimates were very close to those of the Eρ2
coefficient for the two-ratings-per-essay scenario based on the p × T × R′ design. This may be
attributed to the fact that the variance components associated with ratings were very small in this
study. In other words, the rating main effect [σ2(R′)] and the person-by-rating interaction effect
[σ2(pR′)] were very small (close to zero) in the p × T × R′ design.
More detailed analysis results for the relative and absolute SEMs, confidence intervals
(CIs) for a universe score of 3 based on absolute SEMs, and a focused comparison of two D-
study scenarios in the Phase 1 study are given in Appendixes D (Table D1), E (Figure E1), and F
(Table F1).
Phase 2 Results: Univariate Analysis
One important concern for estimating score reliability coefficients from the original data
in Phase 1 was whether the error variances associated with raters were inaccurately estimated in
the p × T × R′ or the (R:p) × T designs since the original data did not allow for separate
estimation of the main effect for raters (rater severity) and the person-by-rater interaction (rater
inconsistency) effect. In addition, because the rating condition for Phase 1 was not very
representative of the typical online rating condition for large-scale writing assessment at ETS, all
the essays for Subgroup 3 were rerated by six raters according to a fully crossed design (p × t × r)
under the rating condition more similar to the OSN rating conditions set by ETS. Univariate
analyses were repeated on these rerated data, but, nevertheless, similar patterns of results were
observed for both the original (np=162, nt = 6, nr′ = 2) and rerated (np=162, nt = 6, nr = 6) data in
terms of the relative proportions in the total variance of various task-related and rater-related
variances. Because finer-grained differentiations were made among various nested assessment
scenarios in the D-studies in the Phase 2 analyses, it was possible to investigate score reliability
19
for two main assessment scenarios of interest in our study in a more accurate manner: (a) three
tasks rated once based on the R:(p × T) design and one task rated twice based on the
(R:p) × T design. The results of analyses are discussed with a focus on these two assessment
scenarios.
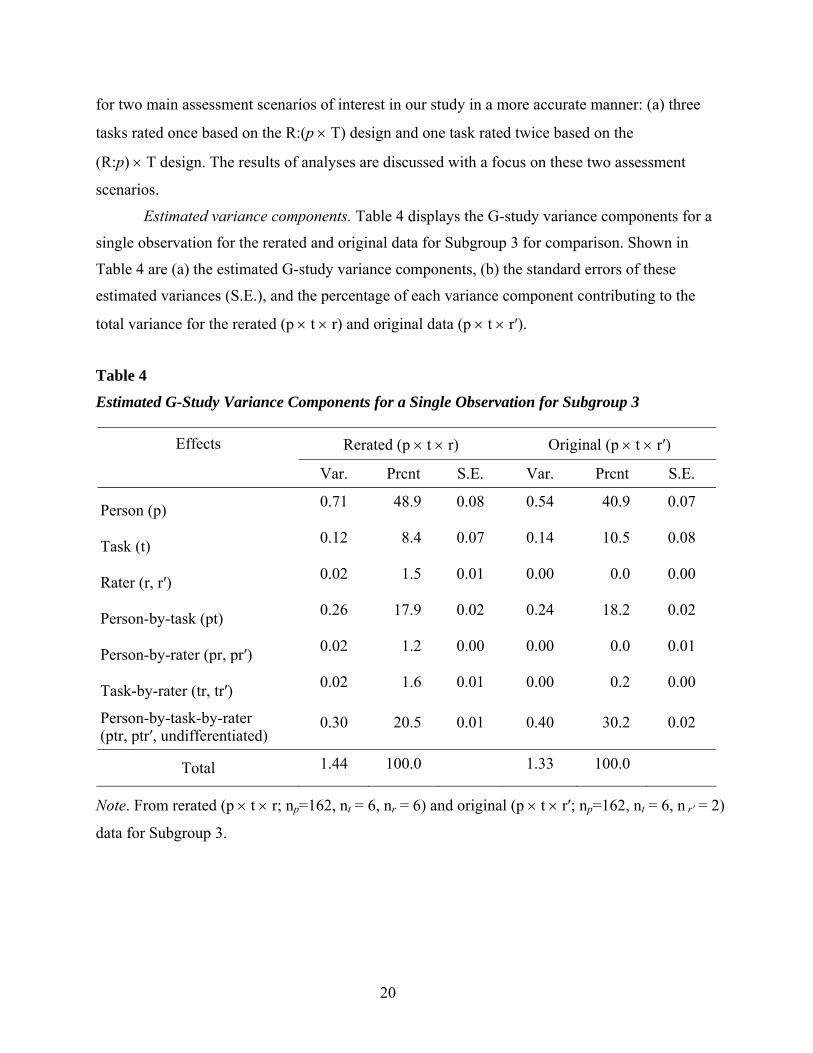
Estimated variance components. Table 4 displays the G-study variance components for a
single observation for the rerated and original data for Subgroup 3 for comparison. Shown in
Table 4 are (a) the estimated G-study variance components, (b) the standard errors of these
estimated variances (S.E.), and the percentage of each variance component contributing to the
total variance for the rerated (p × t × r) and original data (p × t × r′).
Table 4
Estimated G-Study Variance Components for a Single Observation for Subgroup 3
Effects Rerated (p × t × r) Original (p × t × r′)
Var. Prcnt S.E. Var. Prcnt S.E.
Person (p) 0.71 48.9 0.08 0.54 40.9 0.07
Task (t) 0.12 8.4 0.07 0.14 10.5 0.08
Rater (r, r′) 0.02 1.5 0.01 0.00 0.0 0.00
Person-by-task (pt) 0.26 17.9 0.02 0.24 18.2 0.02
Person-by-rater (pr, pr′) 0.02 1.2 0.00 0.00 0.0 0.01
Task-by-rater (tr, tr′) 0.02 1.6 0.01 0.00 0.2 0.00
Person-by-task-by-rater (ptr, ptr′, undifferentiated)
0.30 20.5 0.01 0.40 30.2 0.02
Total 1.44 100.0 1.33 100.0
Note. From rerated (p × t × r; np=162, nt = 6, nr = 6) and original (p × t × r′; np=162, nt = 6, n r′ = 2)
data for Subgroup 3.
20
Of the seven G-study variance components in the p x t x r design based on the rerated
data, the largest variance component was that associated with the main effect for persons [σ2(p)].
A slightly larger proportion of the total score variance was explained by the person variance in
the rerated data (48.9%) than in the original data (40.9%) for Subgroup 3, as shown in Table 4.
The second largest variance component was that associated with the person-by-task-by-rater
interaction plus undifferentiated error [σ2(ptr, undifferentiated)]. Interestingly, its relative
proportion in the total score variance (20.5%) was considerably smaller than that of its three-way
interaction counterpart [σ2(ptr′, undifferentiated)] in the original data (30.2%). The third largest
variance components were the person-by-task-interaction variances [σ2(pt)] in both the p × t × r
and p × t × r′ designs, which explained 17.9% and 18.2% of the total score variance, respectively.
The fourth largest variance components were the variances for task main effect [σ2(t)] in both
data sets, which accounted for 8.4% and 10.5% of the total variances, respectively. Even though
the variances associated with the rater main, person-by-rater interaction, and task-by-rater
interaction effects were larger than zero in the rerated data (p × t × r), all of these variance
components turned out to be very small, explaining only 1.5%, 1.2%, and 1.6% of the total
variance, respectively.
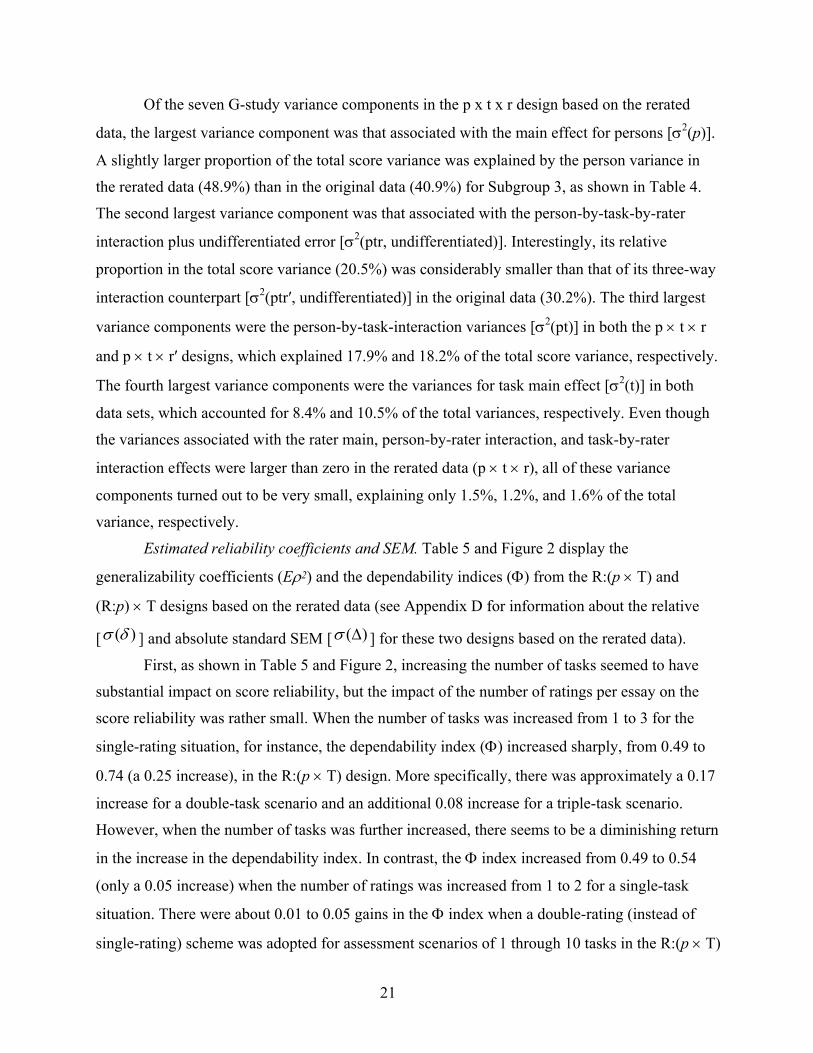
Estimated reliability coefficients and SEM. Table 5 and Figure 2 display the
generalizability coefficients (Eρ2) and the dependability indices (Φ) from the R:(p × T) and
(R:p) × T designs based on the rerated data (see Appendix D for information about the relative
[ )(δσ ] and absolute standard SEM [ )(∆σ ] for these two designs based on the rerated data).
First, as shown in Table 5 and Figure 2, increasing the number of tasks seemed to have
substantial impact on score reliability, but the impact of the number of ratings per essay on the
score reliability was rather small. When the number of tasks was increased from 1 to 3 for the
single-rating situation, for instance, the dependability index (Φ) increased sharply, from 0.49 to
0.74 (a 0.25 increase), in the R:(p × T) design. More specifically, there was approximately a 0.17
increase for a double-task scenario and an additional 0.08 increase for a triple-task scenario.
However, when the number of tasks was further increased, there seems to be a diminishing return
in the increase in the dependability index. In contrast, the Φ index increased from 0.49 to 0.54
(only a 0.05 increase) when the number of ratings was increased from 1 to 2 for a single-task
situation. There were about 0.01 to 0.05 gains in the Φ index when a double-rating (instead of
single-rating) scheme was adopted for assessment scenarios of 1 through 10 tasks in the R:(p × T)
21
design. As the test length increased, the gain in the Φ index due to the adoption of a double-rating
scheme became smaller. A similar pattern was observed for the Eρ2 coefficients, but the Eρ2
coefficients were always higher than Φ indices for all the assessment scenarios examined in this
study, as expected.
Table 5
Estimated Generalizability Coefficients and Dependability Indices for Two Comparison
Designs
R:(p × T) design (R:p) × T design
One rating per essay
Two ratings per essay
One rating per essay
Two ratings per essay
No. of tasks
Eρ2 Φ Eρ2 Φ Eρ2 Φ Eρ2 Φ
1 0.53 0.49 0.59 0.54 0.53 0.49 0.62 0.56
2 0.70 0.66 0.74 0.70 0.68 0.65 0.76 0.71
3 0.77 0.74 0.81 0.78 0.75 0.72 0.82 0.78
4 0.82 0.79 0.85 0.82 0.79 0.77 0.85 0.82
5 0.85 0.83 0.88 0.85 0.82 0.80 0.87 0.85
6 0.87 0.85 0.90 0.87 0.84 0.82 0.89 0.87
7 0.89 0.87 0.91 0.89 0.85 0.84 0.90 0.88
8 0.90 0.88 0.92 0.90 0.86 0.85 0.91 0.89
9 0.91 0.90 0.93 0.91 0.87 0.86 0.92 0.90
10 0.92 0.91 0.94 0.92 0.88 0.87 0.92 0.91
Note. Generalizability coefficients = Eρ2; dependability indices = Φ; the two comparison designs
[R:(p × T), (R:p) × T,] are based on rerated data.
22
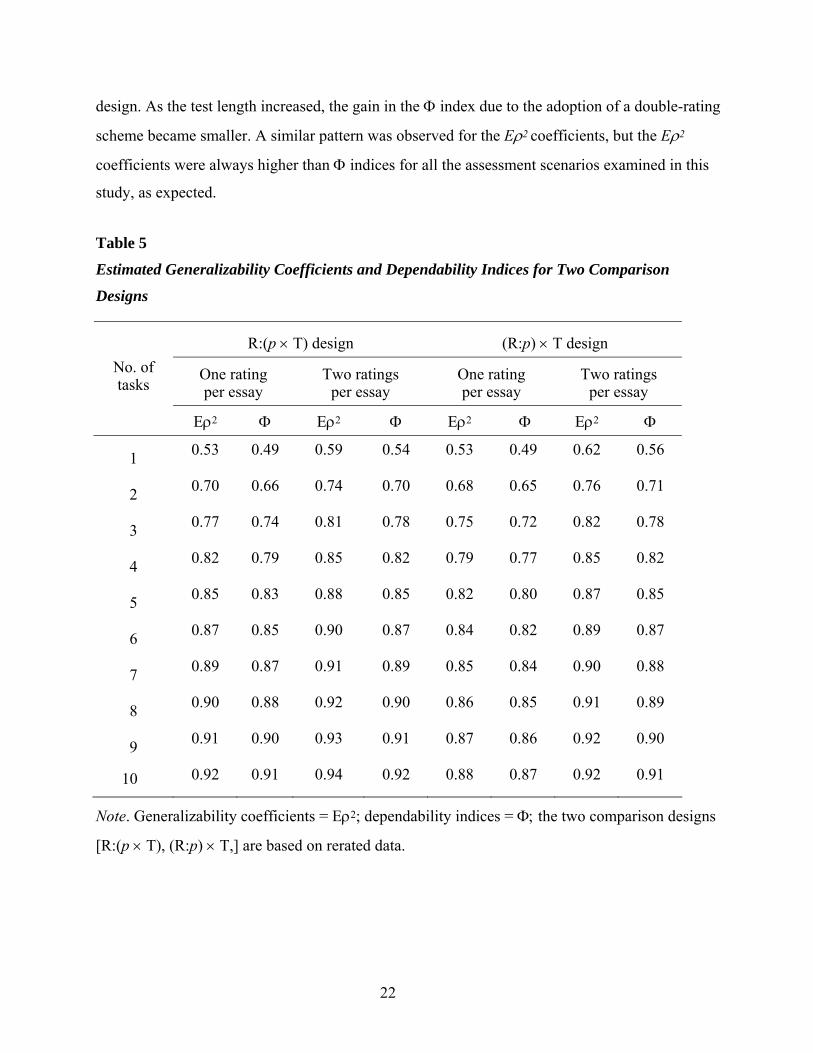
Estimated Reliability Coefficients for Single- and Double-Rating Schemes Based on Rerated Data
0.000.100.200.300.400.500.600.700.800.901.00
1 2 3 4 5 6 7 8 9 10
Number of Tasks
Coe
ffici
ent
G [Nr=2,(r:p) x t)]
Phi [Nr=2,(r:p) x t)]
G [Nr=1,r:(p x t)]
Phi [Nr=1,r:(p x t)]
Figure 2. Generalizability coefficients and dependability indices for single and double
ratings per essay.
Note. Generalizability coefficients = Eρ2 or G; dependability indices = Φ or Phi; double ratings
per essay are for (R:p) × T design, and single rating per essay is for R:(p × T) design.
Even when comparisons were made between the single-rating scenarios based on the
R:(p × T) design and the double-rating testing scenarios based on the (R:p) × T design, with the
total number of ratings per examinee held constant, the number of tasks seemed to have a larger
impact on the Φ index than the number of ratings per essay. For the total number of ratings of
two per examinee, for instance, two comparable single- and double-rating designs were: (a) 2-
tasks-and-1-rating in R:(p × T) and (b) 1-task-and-2-ratings in (R:p) × T. As shown in Table 6,
the first design achieved a higher score reliability (0.66) than the second one (0.49). The same
trend was shown for the total ratings of 4 (4-tasks-and-1-rating vs. 2-tasks-and-2-ratings), 6 (6−1
vs. 3−2), 8 (8−1 vs. 4−2), and 10 (10−1 vs. 5−2) between the two designs. It is clear that it would
be more efficient in terms of reliability to increase the number of tasks rather than the number of
ratings per writing sample. This basically confirmed the Phase 1 findings about the impact of the
number of tasks and raters on score reliability.
23
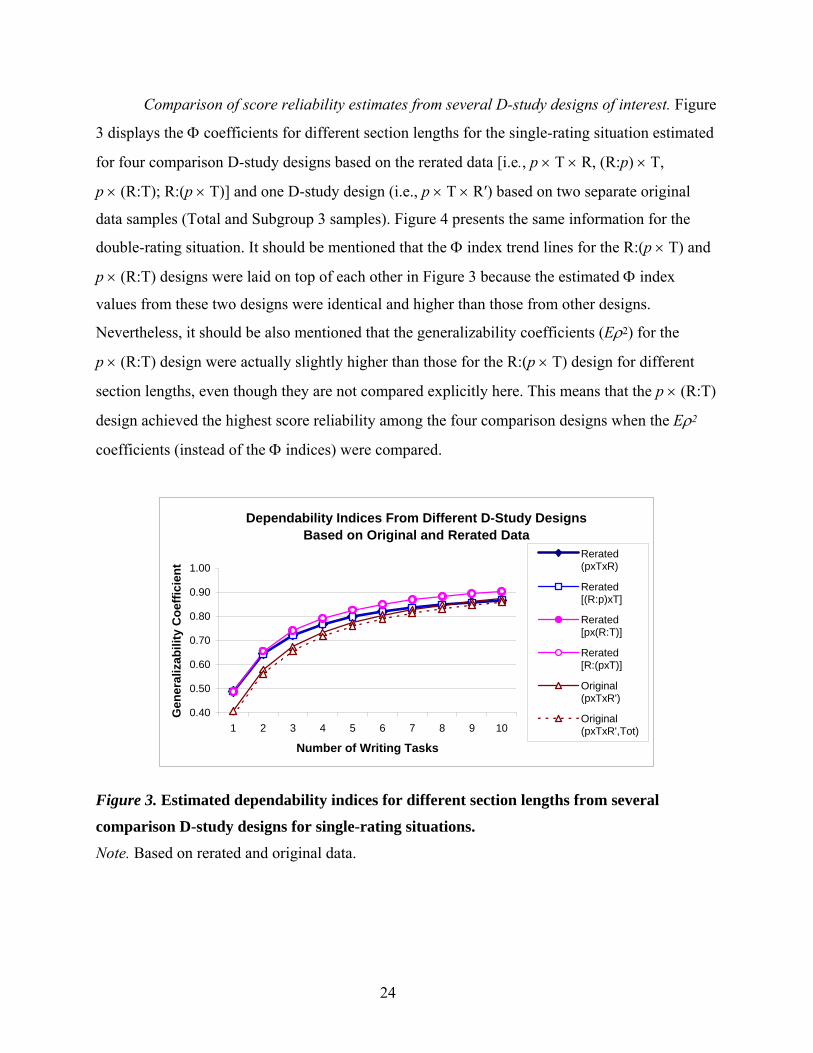
Comparison of score reliability estimates from several D-study designs of interest. Figure
3 displays the Φ coefficients for different section lengths for the single-rating situation estimated
for four comparison D-study designs based on the rerated data [i.e., p × T × R, (R:p) × T,
p × (R:T); R:(p × T)] and one D-study design (i.e., p × T × R′) based on two separate original
data samples (Total and Subgroup 3 samples). Figure 4 presents the same information for the
double-rating situation. It should be mentioned that the Φ index trend lines for the R:(p × T) and
p × (R:T) designs were laid on top of each other in Figure 3 because the estimated Φ index
values from these two designs were identical and higher than those from other designs.
Nevertheless, it should be also mentioned that the generalizability coefficients (Eρ2) for the
p × (R:T) design were actually slightly higher than those for the R:(p × T) design for different
section lengths, even though they are not compared explicitly here. This means that the p × (R:T)
design achieved the highest score reliability among the four comparison designs when the Eρ2
coefficients (instead of the Φ indices) were compared.
Dependability Indices From Different D-Study Designs Based on Original and Rerated Data
0.40
0.50
0.60
0.70
0.80
0.90
1.00
1 2 3 4 5 6 7 8 9 10
Number of Writing Tasks
Gen
eral
izab
ility
Coe
ffici
ent
Rerated(pxTxR)
Rerated[(R:p)xT]
Rerated[px(R:T)]
Rerated[R:(pxT)]
Original(pxTxR')
Original(pxTxR',Tot)
Figure 3. Estimated dependability indices for different section lengths from several
comparison D-study designs for single-rating situations.
Note. Based on rerated and original data.
24
As shown in Figure 3, the Φ indices for assessment scenarios of two and more tasks in
the single-rating situation were the largest in the R:(p × T) and p × (R:T) designs. The Φ index
difference between these two designs [p × (R:T), R:(p × T)] and the other two designs [(R:p) × T,
p × T × R] became larger as the number of tasks in the test increased. Nevertheless, the
difference in the Φ index between the first two designs and second two designs was not very
large for the three-task scenario (i.e., the indices themselves were 0.74, 0.74, 0.72, and 0.72,
respectively). Interestingly, the Φ coefficients estimated from the p × T × R′ designs (i.e.,
Subgroup 3, Total) were consistently lower than those from the R:(p × T) based on the rerated
data. It seems that rather tentative estimates of score reliability obtained for the single-rating
scenario in the Phase 1 analysis (p × T × R′) based on the original data might not be
overestimates but rather conservative estimates of more accurate score reliability estimates
obtained in the Phase 2 analysis [R:(p × T)] based on the rerated data (see also the “Summary
and Discussion” section of this report).
Another intriguing finding was that the relative advantage of the R:(p × T) and p × (R:T)
designs over the other two designs seemed to disappear in the double-rating situations. As shown
in Figure 4, the Φ indices for the p × (R:T) design seemed to be slightly larger than those for the
other three designs. However, these differences in the Φ indices between the p × (R:T) design
and the other three designs are negligible in a practical sense. Moreover, the Φ coefficients
estimated from the p × T × R′ designs based on the original data (Subgroup 3, Total) were almost
the same as the ones from the other three designs [i.e., p × T × R, (R:p) × T, p × (R:T)], based on
the rerated data.
More detailed results for the relative and absolute SEMs, CIs for a universe score of 3
based on absolute SEMs, and a focused comparison of two D-study scenarios of interest in the
Phase 2 study are provided in Appendices D (Table D2), E (Figure E2), and F (Table F2).
25
Dependability Indices From Different D-study Designs Based on Original and Rerated Data
0.40
0.50
0.60
0.70
0.80
0.90
1.00
1 2 3 4 5 6 7 8 9 10
Number of Writing Tasks
Gen
eral
izab
ility
Coe
ffici
ent Rerated
(pxTxR)
Rerated[(R:p)xT]
Rerated[px(R:T)]
Rerated[R:(pxT)]
Original(pxTxR')
Original(pxTxR',Tot)
Figure 4. Estimated dependability indices for different section lengths from several
comparison D-study designs for double-rating situations.
Note. Based on rerated and original data.
Table 6 shows the G-study variance components for the two combinations of task-type
subsections (LW and RW, LW and RW + IW), the covariance components and universe
correlations between the subsections, and the percentage of variance contributed by each
subsection to the total subsection variance estimated from the two separate multivariate analyses
(p• × to × r•) based on the rerated data. Note that the seven variance estimates for the LW
subsections are identical in the two multivariate analyses, even though the covariance estimates
were slightly different in the two analyses (see Table 6).
Estimated variance and covariance components. Among the seven variance components
estimated in the first analysis based on the LW and RW subsections, the largest was that
associated with persons [σ2(p)] in each of the LW and RW subsections, which explains about
55.4% and 52.9% of the total section score variances, respectively. The second largest variance
component was the person-by-task-by-rater interaction plus undifferentiated error variance
(17.4%, 26.5%), followed by the person-by-task interaction variance (15.2%, 15.3%).
26
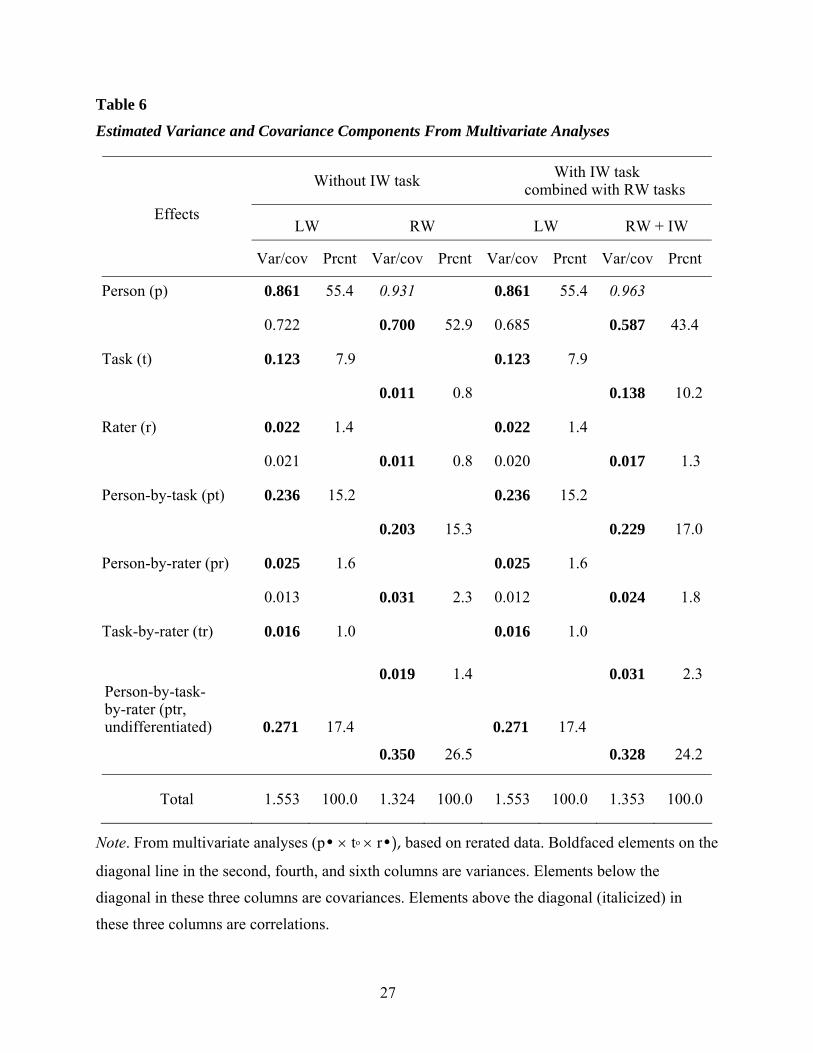
Table 6
Estimated Variance and Covariance Components From Multivariate Analyses
Without IW task With IW task combined with RW tasks
LW RW LW RW + IW Effects
Var/cov Prcnt Var/cov Prcnt Var/cov Prcnt Var/cov Prcnt
Person (p) 0.861 55.4 0.931 0.861 55.4 0.963
0.722 0.700 52.9 0.685 0.587 43.4
Task (t) 0.123 7.9 0.123 7.9
0.011 0.8 0.138 10.2
Rater (r) 0.022 1.4 0.022 1.4
0.021 0.011 0.8 0.020 0.017 1.3
Person-by-task (pt) 0.236 15.2 0.236 15.2
0.203 15.3 0.229 17.0
Person-by-rater (pr) 0.025 1.6 0.025 1.6
0.013 0.031 2.3 0.012 0.024 1.8
Task-by-rater (tr) 0.016 1.0 0.016 1.0
0.019 1.4 0.031 2.3 Person-by-task- by-rater (ptr, undifferentiated) 0.271 17.4 0.271 17.4
0.350 26.5 0.328 24.2
Total 1.553 100.0 1.324 100.0 1.553 100.0 1.353 100.0
Note. From multivariate analyses (p• × to × r•), based on rerated data. Boldfaced elements on the
diagonal line in the second, fourth, and sixth columns are variances. Elements below the
diagonal in these three columns are covariances. Elements above the diagonal (italicized) in
these three columns are correlations.
27
It should be noted that the relative proportion in the total subsection score variance of the
person-by-task-by-rater interaction plus undifferentiated error variance was considerably larger
in the RW subsection than in the LW subsection, suggesting that examinees were rank-ordered
less consistently across different task-by-rater pairs in the RW subsection (also see the “Avenues
for Further Investigation” section of this report for a discussion of potential causes for such a
difference). By contrast, the percentage of the task variance contributing to the total subsection
variance was considerably smaller in the RW subsection (about 0.8%) than in the LW subsection
(7.9%). This suggests that there may be a considerable difference in difficulty among LW tasks,
whereas there is virtually no difference in difficulty among RW tasks. However, the main effects
for raters were very small (1.4%, 0.8%), indicating that the six raters who participated in the
rerating of the essays in Phase 2 did not differ much in severity among themselves in each
subsection. In addition, the percentages of the person-by-rater interaction (1.6%, 2.3%) variance
and the task-by-rater interaction variance (1.0%, 1.4%) were very small in both subsections.
In the second analysis based on the LW and RW + IW subsections, the largest variance
component was again that associated with persons [σ2(p)] in both LW and RW + IW subsections,
explaining about 55.4% and 43.4% of the total section score variances, respectively. The second
largest variance component was the person-by-task-by-rater interaction plus undifferentiated
error variance (17.4%, 24.2%), followed by the person-by-task interaction variance (15.2%,
17.0%). It should be noted that the relative proportion in the total subsection score variance of
the person-by-task-by-rater interaction plus undifferentiated error variance for the RW + IW
subsection became somewhat smaller than that for the RW subsection in the first analysis, but
was still larger than that for the LW subsection. The next largest variance component was the
one associated with the main effect for tasks, which accounted for 7.9% of the total subsection
score variance in the LW subsection, but about 10.2% of the total score variance in the RW + IW
subsection. This suggests that there may be some difference in task difficulty among both LW
tasks and RW + IW tasks. However, the main effects for raters were very small again (1.4%,
1.3%). In addition, the percentages of the person-by-rater interaction (1.6%, 1.8%) and task-by-
rater interaction variances (1.0%, 2.3%) were small in both subsections.
Interestingly, the percentage of the person variance in the RW + IW subsection became
smaller than in the RW subsection. This seems to be largely due to a substantially increased
variance for the task main effect in the RW + IW subsection (0.8% to 10.2%). Nevertheless, the
universe score correlation between the LW and the RW + IW subsections was larger than that
28
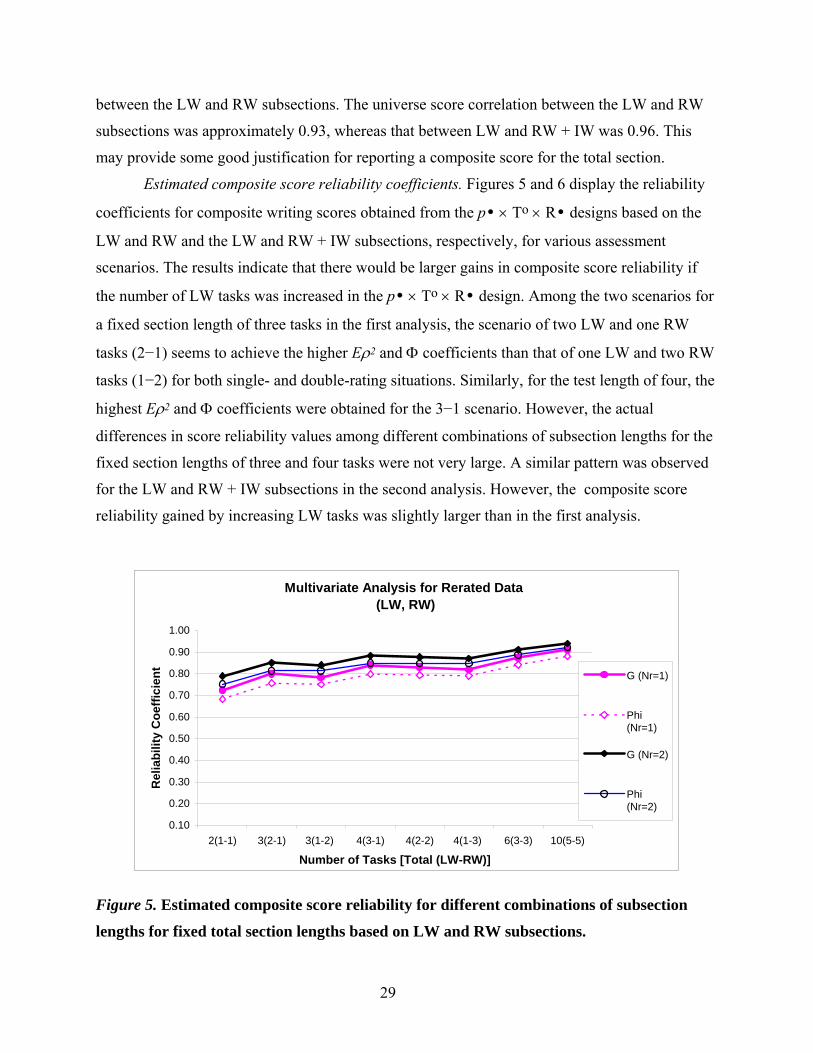
between the LW and RW subsections. The universe score correlation between the LW and RW
subsections was approximately 0.93, whereas that between LW and RW + IW was 0.96. This
may provide some good justification for reporting a composite score for the total section.
Estimated composite score reliability coefficients. Figures 5 and 6 display the reliability
coefficients for composite writing scores obtained from the p• × To × R• designs based on the
LW and RW and the LW and RW + IW subsections, respectively, for various assessment
scenarios. The results indicate that there would be larger gains in composite score reliability if
the number of LW tasks was increased in the p• × To × R• design. Among the two scenarios for
a fixed section length of three tasks in the first analysis, the scenario of two LW and one RW
tasks (2−1) seems to achieve the higher Eρ2 and Φ coefficients than that of one LW and two RW
tasks (1−2) for both single- and double-rating situations. Similarly, for the test length of four, the
highest Eρ2 and Φ coefficients were obtained for the 3−1 scenario. However, the actual
differences in score reliability values among different combinations of subsection lengths for the
fixed section lengths of three and four tasks were not very large. A similar pattern was observed
for the LW and RW + IW subsections in the second analysis. However, the composite score
reliability gained by increasing LW tasks was slightly larger than in the first analysis.
Multivariate Analysis for Rerated Data (LW, RW)
0.10
0.20
0.30
0.40
0.50
0.60
0.70
0.80
0.90
1.00
2(1-1) 3(2-1) 3(1-2) 4(3-1) 4(2-2) 4(1-3) 6(3-3) 10(5-5)
Number of Tasks [Total (LW-RW)]
Rel
iabi
lity
Coe
ffici
ent
G (Nr=1)
Phi(Nr=1)
G (Nr=2)
Phi(Nr=2)
Figure 5. Estimated composite score reliability for different combinations of subsection
lengths for fixed total section lengths based on LW and RW subsections.
29
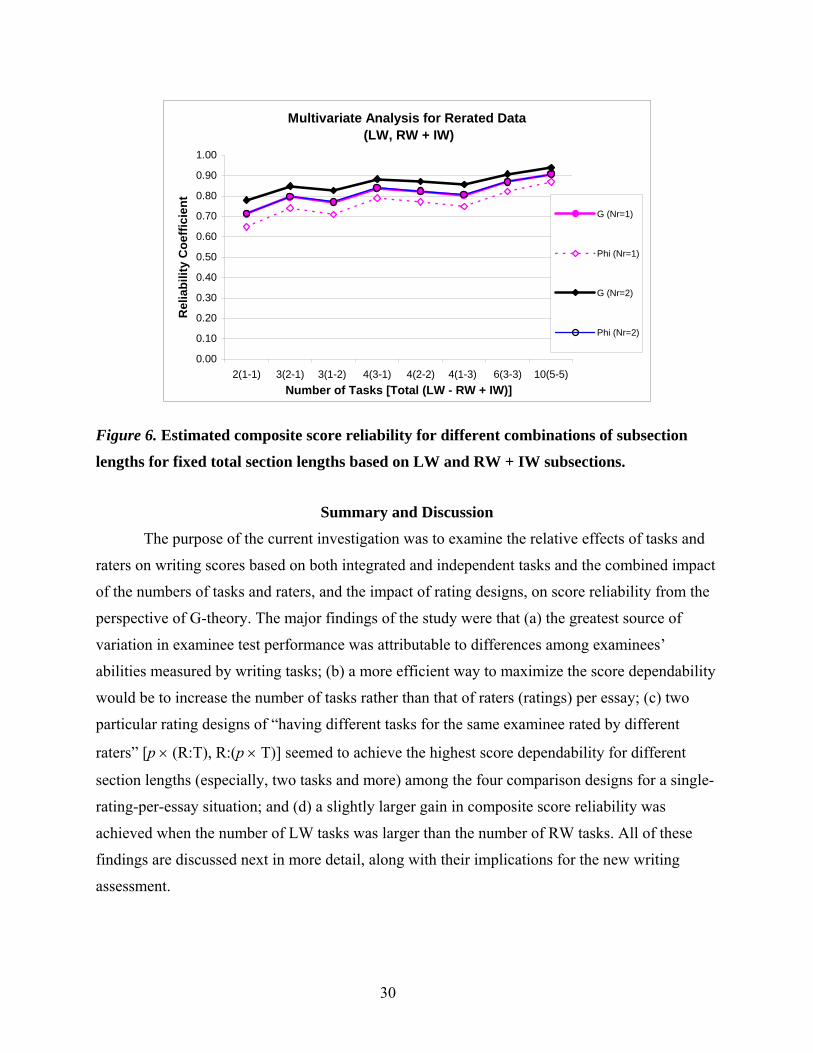
Multivariate Analysis for Rerated Data (LW, RW + IW)
0.00
0.10
0.20
0.30
0.40
0.50
0.60
0.70
0.80
0.90
1.00
2(1-1) 3(2-1) 3(1-2) 4(3-1) 4(2-2) 4(1-3) 6(3-3) 10(5-5)Number of Tasks [Total (LW - RW + IW)]
Rel
iabi
lity
Coe
ffici
ent
G (Nr=1)
Phi (Nr=1)
G (Nr=2)
Phi (Nr=2)
Figure 6. Estimated composite score reliability for different combinations of subsection
lengths for fixed total section lengths based on LW and RW + IW subsections.
Summary and Discussion
The purpose of the current investigation was to examine the relative effects of tasks and
raters on writing scores based on both integrated and independent tasks and the combined impact
of the numbers of tasks and raters, and the impact of rating designs, on score reliability from the
perspective of G-theory. The major findings of the study were that (a) the greatest source of
variation in examinee test performance was attributable to differences among examinees’
abilities measured by writing tasks; (b) a more efficient way to maximize the score dependability
would be to increase the number of tasks rather than that of raters (ratings) per essay; (c) two
particular rating designs of “having different tasks for the same examinee rated by different
raters” [p × (R:T), R:(p × T)] seemed to achieve the highest score dependability for different
section lengths (especially, two tasks and more) among the four comparison designs for a single-
rating-per-essay situation; and (d) a slightly larger gain in composite score reliability was
achieved when the number of LW tasks was larger than the number of RW tasks. All of these
findings are discussed next in more detail, along with their implications for the new writing
assessment.
30
Relative Effects of Examinees, Tasks, and Raters on Writing Scores
Results of G-studies in both Phases 1 and 2 have revealed similar patterns of difference in
light of the proportions of the examinee-, task-, and rater-related variances contributing to the
total variances. First of all, we found that the largest source of writing score variation was
attributable to differences among examinees’ writing proficiencies as measured by the
assessment tasks used in this study. In the univariate analysis in Phase 1, the largest variance
component was that associated with the main effect for persons (or examinees) in the total group
as well as in the data for each of the three subgroups. Even in the Phase 2 univariate analysis, the
variance associated with the persons also explained the largest portion of the total score variance
in the G-study. Intriguingly, however, the person variance in Phase 2 turned out to explain a
somewhat larger portion of the total variance for Subgroup 3 than the person variance in the
Phase 1 analyses did for the same group. This suggests that the examinees were discriminated
somewhat better in the Phase 2 analyses, with relatively smaller measurement error. This is
likely partly due to the fact that finer-grained differentiations among examinees were made
possible in Phase 2 because the averaged rating across six (rather than two) raters was used to
represent the examinees’ proficiencies in the G-study. Other interesting possibilities in relation to
rater-related error variances are discussed later in this subsection.
A similar pattern emerged in each task-type subsection in the two multivariate analyses
of the different subsections combined. In the first and second multivariate analyses, the person
variance was the largest component, explaining nearly a half of the total variance in each
subsection (i.e., 55% for LR, 53% for RW, 43% for RW + IW). This means that, as intended, the
writing tasks used in this study do distinguish among examinees on the construct measured by
these tasks or task types as a whole. One interesting pattern, though, was that the percentages of
the person variance were somewhat similar for the LW and RW subsections (actually slightly
larger for the LW subsection) in the first analysis, while the person variance was considerably
smaller for the RW + IW subsection than for the LW subsection in the second analysis. As
previously mentioned, this is largely due to a substantially increased variance for the task main
effect in the RW + IW subsection. In essence, results of both the first and second analyses
suggest that the LW tasks are discriminating examinees somewhat better than the RW tasks or
the combination of RW and IW tasks.
Second, the largest contributor to the total score variation, other than the person main
effect variance, seemed to be task-related score variation in both Phase 1 and 2 analyses. In the
31
univariate analyses in Phases 1 and 2, the relatively large G-study variance components
following in size the person and the three-way interaction variance containing undifferentiated
error variances were those associated with (a) the person-by-task interaction and (b) the task
main effect. The person-by-task interaction variance accounted for about one fifth of the total
section score variance for the two G-study designs in Phase 1 and a bit smaller than one fifth of
the total variance in Phase 2. This indicates that some significant number of examinees were not
rank-ordered consistently across different writing tasks used in this study. Moreover, the
variances associated with the main effect for tasks were also of considerable size (explaining
about one-tenth of the total variance) in both Phase 1 and 2 analyses, which indicates that tasks
themselves vary in difficulty in the writing section. In general, the proportions of the two task-
related variances in the total variance in the Phase 2 analyses were smaller than those of their
counterparts in the p × t × r′ design in the Phase 1 analyses, but they still were the third and
fourth largest variances in the Phase 2 analyses. Overall, it seems that tasks not only differed in
difficulty among themselves (task main effect), but also were differentially difficult for different
examinees (person-by-task interaction). This may be also linked to the issues of task
comparability and task generalizability in writing assessment.
A similar pattern emerged in each task-type subsection in the two multivariate analyses,
except for the task main effect for the RW subsection. In the first analysis, the person-by-task
interaction variance explained about the same amount (about one-sixth) of the total variance in
both the LW and RW subsections, but slightly more than one-sixth of the total variance in the
RW + IW subsection in the second analysis. One noteworthy difference between the multivariate
and comparable univariate analyses for Subgroup 3 was that the person-by-task interaction
variance for the LW, RW, and RW + IW subsections in the two multivariate analyses explained a
slightly smaller portion of the total variance on average (15%, 17%, 15%) than in the univariate
analysis (18%). This is an expected result because the random task facet in the univariate
analysis is further differentiated into (a) a fixed task-type facet and (b) a random (but more
restricted) facet of tasks nested within task types in the multivariate analysis. Another interesting
(and rather surprising) result was that the task main effect variance explained only a negligible
portion (0.8%) of the total subsection variance in the RW subsection, whereas it accounted for a
considerable portion of the total subsection score variance (8%) in the LW subsection. This
indicates that there was comparatively less variation in overall difficulty among RW tasks than
among LW tasks. In the second multivariate analysis, however, there was not a large difference
32
of task main effect between the two subsections (8% and 10% for the LW and RW + IW
subsections, respectively). This seems to suggest that, even though the two RW tasks were
similar in difficulty, the RW and IW tasks were somewhat different in difficulty. This was also
confirmed by comparing the mean score differences for the two RW tasks (2.6, 2.4) and one IW
task (3.2).
Third, it was found in the Phase 1 and 2 analyses that raters might also contribute to score
variation in the writing assessment used in this study, but their effects on writing scores seemed
to be very small, compared to those of tasks. In the univariate analysis in Phase 1, the smallest
variance components were those associated with the rating/rater-related effects: (a) the person-
by-rating interaction and the rating main effect in the p × t × r′ design and (b) the rater-nested-
within-examinee effect in the (r:p) × t design, respectively. In the p × t × r′ design, the person-by-
rating interaction variance turned out to account for less than 1% of the total section score
variance, while the rating (r′) main effect variance was virtually zero. This means that the
examinees were rank-ordered very much the same way across the first and second ratings and
that there was no difference in severity between the first and second ratings. The zero variance
for the rating main effect variance was very much expected, given that the same raters were
allowed to serve as the first raters for some examinees, and also as second raters for other
examinees, for a prompt in the same rating session. Both the first and second ratings consist of
ratings assigned by the same group of raters participating in the same rating sessions. Therefore,
it is likely that some potential effects of severity differences among individual raters, if any,
would be either aggregated similarly across examinees in the first and second ratings or absorbed
into the person-by-rating interaction variance in the p × t × r′ design. In the (r:p) × t design as
well, the raters (nested within examinees) variance also accounted for less than 1% of the total
variance. In this variance component, the main effect for raters and the person-by-rater
interaction effect are confounded rather than differentiated. In a sense, both the p × t × r′ and
(r:p) × t designs are exhibiting the same pattern with respect to the undifferentiated rater severity
and rater inconsistency effects in the Phase 1 data, which in both cases turned out to be very
small.
However, a fully crossed, two-facet design (p × t × r) was employed in the Phase 2
analysis to enable the main effect for the raters (rater severity) and the person-by-rater interaction
(rater inconsistency) effects to be estimated and examined separately in the G-study.
Nevertheless, these two rater-related variances turned out to be rather small in this crossed
33
design as well, compared to the task-related effects. The person-by-rater interaction variance and
the rater main effect variance accounted for only about 1% and less than 2% of the total variance,
respectively. This means that examinees were rank-ordered very much the same way across
raters and that there was only a slight overall difference in severity among the raters. A similar
pattern was observed in each task-type subsection in the two multivariate analyses. In the first
analysis, the variances for the person-by-rater interaction and the rater main effects contributed
to only a small percentage of the total score variance (2% and 1% of the total variance,
respectively, in both the LW and RW subsections). Also in the second analysis, the two
variances for the LW and RW + IW subsections explained the same amount of the total variance,
respectively, as in the first analysis. When the Phase 1 and 2 results for the rater/rating-related
effects are compared, the rating-related variances seemed to have been underestimated in the
Phase 1 analyses, as expected, but the difference was very small.
Nonetheless, a surprising finding was that even though the proportion of the rater-related
variances contributing to the total variance was slightly underestimated in the Phase 1 analysis
(as expected), the three-way interaction plus undifferentiated error variances turned out to be
substantially overestimated in Phase 1 when compared to the Phase 2 analyses. The net result of
such differences between Phase 1 and 2 results was the underestimation (rather than
overestimation) of the proportion of the person (universe score) variance in the Phase 1 analysis.
(For a discussion on the impact of such differences on reliability, see the “Impact of Rating
Designs on Score Reliability” subsection later.) Relatedly, the second largest variance
component, next to the person variance, in terms of its size and proportion was the three-way
interaction variances plus undifferentiated error in both the Phase 1 and 2 analyses, which might
be related to both tasks and raters. For instance, the three-way interaction variance [i.e., the
person-by-task-by-rater interaction plus undifferentiated error variance in the p × t × r′ design,
task-by-rater (nested within examinees) plus undifferentiated error in the (r:p) × t design] for
Subgroup 3 in Phase 1 explained more than one fourth of the total variance in the Phase 1
analyses, whereas its three-way interaction counterpart in Phase 2 (i.e., the person-by-task-by-
rater interaction plus undifferentiated error variance) accounted for only about one fifth of the
total variance for Subgroup 3.
One interesting possibility is that such differences between the Phase 1 and 2 studies may
be partly attributable to the different universes of admissible observations used for raters and
rating conditions, in addition to the different G-study designs used in the two studies. First of all,
34
the six raters in the Phase 2 study were those who had previously participated in the rating of
essays for the Phase 1 study and had comparatively good rating performance in that study. To
become certified to rate essays for large-scale writing assessment through the OSN at ETS, raters
go through strict rater training and pass a certification test (Powers & Kubota, 1998a, 1998b).
Moreover, rater performance is constantly monitored through the OSN, and, when necessary, the
raters are recalibrated using a set of benchmark (anchor) essays that exemplify each of the score
levels in the scoring rubric. In this sense, it is true that the Phase 2 raters had more rating
experience than the Phase 1 raters, but they may be more representative of a “universe of trained
and certified raters” for the operational test. Second, the rating conditions in the Phase 2 study
more closely emulated the operational rating conditions for the new writing measure. In Phase 1,
rater training and rating sessions for the three task types were held at the same location for two
days. Rater training and actual rating of essays for each task type were done on the same day in
the original rating, and raters were asked to rate a hard (or printed) copy of writing samples in a
shorter time period immediately after training on the same day. In contrast, in Phase 2, raters
were given a week to rate essays online at their own pace, using their home computers. This may
partly explain why the Phase 2 scores are more consistent in spreading out the examinees than
the Phase 2 raters.
Based on all of this information, it would be more efficient to increase the number of
tasks than the number of raters to reduce the construct-irrelevant score variance in the current
writing assessment system, given that the examinees are the object of measurement. Overall, the
results of the current study are consistent with the findings of previous research on performance-
based assessments (Breland et al., 1999; Brennan & Johnson, 1995; Dunbar, Koretz, & Hoover,
1991; Linn, 1993b; Gao et al., 1994; Linn, Burton, DeStefano, & Hanson, 1996; Miller & Linn,
2000; Shavelson, Baxter, & Gao, 1993). In most of the previous research, the rater and the
person-by-rater interaction variance components were found to be relatively very small
compared to the person-by-task interaction effect, resulting in fewer raters needed to achieve
acceptable values of score reliability or generalizability in large-scale performance-based
assessments.
Impact of Number of Tasks and Raters on Score Dependability
The number of tasks in the writing section (or the section lengths) seemed to have a
rather substantial impact on the reliability of writing scores and SEM associated with these
scores, whereas the number of raters (or ratings) per essay turned out to have a relatively small
35
impact. Such relatively large impact of the number of tasks on score reliability was very much
expected due to the large task-related variances observed in the G-studies for both Phase 1 and 2
data (as has been discussed previously). When the number of tasks increased from one to three
for the single-rating scenario, for instance, there were drastic 0.26 and 0.25 increases in the
dependability index (Φ) for adding only two more tasks in the Phase 1 (p × T × R′) and Phase 2
[R:(p × T)] analyses, respectively. When the number of tasks was further increased from 3 to 10
in the single-rating scenario, however, there clearly seemed to be a diminishing return in gains in
score reliability per task. There were only 0.22 and 0.17 increases in the two D-study designs,
respectively, for adding seven more tasks to the writing section. Such a trend in score reliability
was also confirmed visually in the plots of the Eρ2 and Φ coefficients for different section
lengths. Contrary to our initial expectation, the reliability coefficients were larger in the Phase 2
analysis than in the Phase 1 analysis.
In stark contrast, the impact of the number of ratings per essay on the score reliability
seemed to be very small in general because both the rating-related (e.g., the person-by-rating
interaction, the rating main effect) or rater-related (e.g., the person-by-rater interaction, the rater
main effect) variances were zero or very small in the Phase 1 and 2 analyses. There were about
0.02 to 0.07 gains in the dependability index when a double-rating scheme was adopted over a
single-rating scheme for different section lengths (1-10 tasks). Further, as the section length
increased, the gain in the dependability index due to the adoption of a double-rating scheme
rather than a single-rating scheme became smaller. It appears that adopting a single-rating
scheme would have a small effect on the score dependability for the new writing assessment.
A reversed pattern of impact was ascertained in the SEM for adding more tasks to the
writing section and increasing the number of ratings per essay because score reliability is
inversely related to SEM (Appendix D). The CIs for a universe score of 3 based on the absolute
SEMs were also useful in illustrating the impact of the numbers of tasks and raters on score
dependability for the writing section (Appendix E). The CIs were the widest for the single-task
scenario in both the single- and double-rating situations, and as the numbers of tasks and ratings
per essay increased the CIs became narrower. When the single- and double-rating situations were
compared, however, the widths of the CIs were only slightly narrower for the double-rating
situation. As the number of tasks was increased, the difference between the CIs for the single-
and double-rating situations became even smaller.
36
Impact of Rating Designs on Score Dependability
Results of D-studies based on the original and rerated data have provided important
insights about the single-rating schemes and the impact of using rating (r′) as a random facet on
the estimation of score reliability in large-scale rater-mediated writing assessment. First, the
analysis of the rerated data has demonstrated that both the p × (R:T) and R:(p × T) designs could
achieve the highest score dependability in the single-rating-per-essay scenarios among the four
comparison D-study designs investigated in the Phase 2 analysis. A general trend was that the
dependability indices for various section lengths from the p × (R:T) and R:(p × T) designs were
higher than those from the other two D-study designs [p × T × R, (R:p) × T] in the single-rating-
per-essay scenario. The difference in score reliability between the former and the latter two
designs became larger as the number of tasks increased under the single-rating-per-essay
scenario. It should be remembered that both the p × (R:T) and R:(p × T) designs for the single-
rating scheme were investigated in this study to approximate a single-rating design in which all
the essays are rated once, but each task is rated by a different rater for the same examinee.
Nonetheless, the comparative advantage of these two designs over the other designs
demonstrated in the single-rating scheme disappeared in the double-rating scheme. The
dependability indices for all three designs were very close in the double-rating situations across
the different section lengths. This means that the p × (R:T) and R:(p × T) designs are more
efficient than the other two designs when the single-rating-per-essay scheme is adopted for the
rating of essays. Such a tendency seems reasonable, given that the number of raters per examinee
is likely to be proportional to the increase in the number of tasks in the writing section in these
two designs under the single-rating scheme.
Second, another related and interesting finding was that the score reliability estimates
obtained for the single-rating scenario in Phase 1 were not overestimates (but rather conservative
estimates) of the true score reliabilities obtained for the R:(p × T) design based on the rerated
data. Contrary to our initial prediction, the dependability indices estimated from the p x T x R′
designs based on the original data (Subgroup 3, Total) for the single-rating scenario were
consistently lower than those from the four designs based on the rerated data [p × T × R,
(R:p) × T, p × (R:T), R:(p × T)] in the single-rating scenario, but these estimates from the four
designs, themselves, were very close in the double-rating scheme. The main reason for this
surprising result was that even though the proportion of the rater-related variances contributing
37
to the total variance was slightly smaller (underestimated) in the Phase 1 analysis, as was
expected, the three-way interaction plus undifferentiated error variances turned out to be
substantially larger (overestimated) in Phase 1 than in Phase 2. This resulted in a proportionally
smaller person variance (or universe score variance) in Phase 1 than in Phase 2. This, in turn,
resulted in a proportionally larger total error variance and lower score reliability coefficients in
the Phase 1 D-study. As previously mentioned, it should be also taken into account that
somewhat more-experienced raters participated in the Phase 2 study and that the rating condition
used in the Phase 2 study more closely emulated the situation for the operational test. In that
sense, it is also possible that the p × T × R′ design based on the original data turned out to be a
robust alternative to other D-study designs based on the rerated data for score reliability
estimation in this study, because the rater-related variances were rather small in both the Phase 1
and 2 studies.
Psychometric Relationships Among Different Task Types
The results of the multivariate analyses have revealed some important relationships
among the task-type subsections and with respect to the effects of the tasks and raters in each
subsection. First, we found that the universe scores from two task-type subsections estimated
based on (a) the LW and RW subsections and (b) the LW and RW + IW subsections in the
p• × to × r• design were very highly correlated, which provides a good justification for
combining the two subsection scores into a single composite score for score reporting. For
example, the universe score correlation between the LW and RW subsections was 0.93 in the
first multivariate analysis. Such a very high correlation between the two subsections in this
analysis suggests that both LW and RW tasks may be measuring a very similar underlying
construct (i.e., writing proficiency), even though the input stimuli are in different modes (i.e.,
recorded lectures vs. reading passages). Interestingly, the universe score correlation between
the LW subsection and the RW + IW subsections was even higher in the second analysis (0.96)
than that between the LW and RW subsections in the first analysis. The higher universe
correlation between the two subsections observed in the second analysis is in stark contrast
with the fact that the percentage of the universe score (person) variance contributing to the total
variance was actually smaller in the RW + IW subsection (43.4%) in the second analysis than
in the RW subsection (52.9%) in the first analysis. This means that if we include an IW task as
part of the second subsection (RW + IW) it would slightly decrease the score dependability (or
38
score reliability) for the second subsection but strengthen the construct-related relationship
between the first and second subsections.
Second, we found that there were larger gains in composite score reliability when the
number of LW tasks was increased in the first multivariate analysis, since there was somewhat
smaller measurement error observed for the LW tasks. Between the two scenarios for the fixed
section length of three tasks, the scenario of two LW and one RW tasks (2−1) seemed to achieve
the higher generalizability coefficients and dependability indices for both the single- and double-
rating situations. Similarly for the fixed section length of four tasks, the highest score reliability
coefficients were obtained for the 3−1 scenario. This was consistent with the fact that the
proportion of the universe score variance was larger in the LW subsection, and hence the
proportions of the relative and absolute error variances were smaller in this subsection. This is
partially due to the fact that the person-by-task-by-rater interaction plus undifferentiated error
component in the LW subsection was much smaller in size and proportion than in the RW
subsection (see the “Avenues for Further Investigation” subsection of this report for a discussion
of potential causes of such a difference), while the relative proportions of other error variance
components were similar across the two subsections. However, the actual differences in score
reliability values among different combinations of subsection lengths for a fixed section length
were not large.
Conclusions and Avenues for Further Investigation
Conclusions
As previously mentioned, one major challenge for assessments that require examinees to
provide extended, constructed responses is the issue of limited score generalizability across tasks
or task types. Often an examinee’s performance is highly dependent on a particular task type or a
particular task within the task type that is posed (Powers & Fowles, 1998). This study has also
confirmed that task generalizability might be one of the real challenges facing the new TOEFL
writing assessment. It was revealed that the pilot tasks employed were, on average, somewhat
different in difficulty and not uniformly difficult for all examinees as well. Nevertheless, the
rater facet does not seem to explain much of the variability in the observed writing scores. Raters
did not vary much in severity among themselves and did not vary differentially in severity
among examinees overall. These results indicate that to maximize score reliability for writing it
would be more efficient to increase the number of tasks rather than number of ratings per task.
39
Clearly, however, there would be a diminishing return for increasing the number of tasks beyond
a certain point. Overall, the study provides test developers with information about the degree to
which the numbers of tasks and raters impact score dependability. This information, in
conjunction with other considerations, such as testing time and task development costs, will
contribute to final decisions about the configuration of the writing section.
Methodologically speaking, the results of the study provided useful information about the
robustness of the inter-rater reliability and score reliability computation procedures using ratings
(e.g., first rating, second rating) as units of analysis in large-scale rater-mediated assessment.
Despite some concerns raised about using rating (r′) as a random facet in G-theory analyses for
rater-mediated assessment, the analyses of rerated writing data have shown that the p × t × r′
design resulted in similar (probably more conservative) estimates of score reliabilities for the
single- and double-rating situations. Since the subsample of essays used in Phase 1 were rerated
according to a fully crossed design (p × t × r) in Phase 2, it was possible to compare the variance
estimates from the original and rerated data and examine how much underestimation (or
overestimation) occurred in relation to the error variance related to rater judgment and with
respect to the reliability coefficients in these two designs. Overall, G-theory has proven to be
very powerful and useful for TOEFL research and development activities.
Avenues for Further Investigation
1. Multivariate analyses with all three task types represented. The power of G-theory
analyses can be realized when there is a large sample of observations available for each
measurement facet in the universe of admissible observations. In this study, it was not possible to
do a multivariate analysis with all three task-type subsections (LW, RW, and IW subsections)
represented as levels of a fixed-content facet in the writing section because only one IW task was
taken by all of the examinees in the test. If more than one IW task had been given to the same
group of examinees who took the LW and RW tasks, all three subsections could have been
analyzed together in the multivariate analyses. Moreover, if the same number of tasks had been
used for all three subsections in a balanced design, a fairer comparison might have been possible
among the three subsections about differences in the main and interaction effects related to tasks
and raters. Further study along this line would prove very useful for evaluating the writing tasks
prototyped for the new writing assessment in a more reasonable way.
2. Many-faceted IRT approaches to rater-mediated writing assessments. In examining
assessment systems, the focus of investigation in G-theory analyses is usually on groups rather
40
than individual facet elements (see Marcoulides, 1999, for an exception to this case). In the
prototype stage of developing new assessment tasks, however, it would also be useful to provide
psychometric information about individual facet elements (e.g., tasks, raters) and combinations
of facet elements (e.g., person-by-rater pairs, person-by-task pairs, person-by-task-by-rater
combinations) that can inform the test development and refinement process. In this regard, an
alternative psychometric tool for analyzing rater-mediated assessment would be the many-
faceted Rasch measurement (MFRM; also called FACETS) procedure (Linacre, 1989, 1998)
developed within the framework of item response theory (IRT), particularly Rasch measurement.
This MFRM procedure makes it possible to not only put examinees, raters, and tasks in the same
frame of reference (on the same logit scale) but also to identify unusual combinations of facet
elements for further examination. More recently, some other IRT procedures have emerged that
can also analyze rating data as the MFRM does, but by making use of more complex IRT
models, such as the raters’ effect model (Muraki & Bock, 1999) and the hierarchical rater model
(Patz, Junker, Johnson, & Mariano, 2002). Further analysis along this line may be able to
complement the results of the G-theory analyses in evaluating the prototype writing tasks used in
this study.
3. Content analyses of tasks and examinee essays. In the multivariate analyses, it was
found that the three-way interaction variance accounted for a substantially larger portion of the
total score variance in the RW subsection than in the LW subsection, indicating that the
examinee scores are less consistent across different task-by-rater pairs in the RW subsection or
that there may be more unidentified error in this subsection. In relation to this, one potentially
difficult issue for rating essay responses to the RW tasks had to do with a copy-and-paste
response strategy used by examinees. Since the examinees were allowed to see a reading passage
again when they wrote a response to the prompt, they were able to use in their essays some
sentences or phrases they had copied verbatim from the reading passage. Raters were actually
instructed to assign the lowest possible score (i.e., 1) to an essay containing material that had
been copied and pasted from the stimulus material, even though the resulting essay might appear
to be long enough and well-organized enough to receive a score higher than 1. Under some
circumstances and in some essays, however, it may not be easy for some raters to determine a
clear borderline between copied material and paraphrased material. Moreover, it is likely to be
unavoidable for some examinees to borrow certain key terms and vocabulary directly from the
text for use in their essay. Possibly content analysis of the essays flagged due to a large
41
discrepancy between the two human raters might help to test whether such a plagiarism issue can
be linked to a proportionally large three-way interaction variance in the reading-writing
subsection. If that turns out to be true, some careful thought should be given to the question of
how much is an acceptable or unacceptable range of overlap between the reading passage and the
examinee essay, or how best to redesign a task to minimize examinees’ inclination to use
material verbatim.
In relation to this, it was found in the multivariate analyses that there was relatively more
variation in difficulty among LW tasks than RW tasks. A close examination of the mean scores
of the three LW tasks revealed that the task difficulty difference among the LW tasks seemed to
be a result of the unusually easy third task (mean of 3.4) as compared to the first two tasks
(means of 2.8, 2.7). Because the number of tasks used in this study was rather small (three LW
and two RW tasks), it may not be possible to generalize these findings to larger universes of LW
and RW tasks. Nevertheless, content analyses of tasks, including stimulus material and prompts,
could provide content-related clues about why there were larger differences in difficulty among
LW tasks compared to RW tasks, particularly if these analyses are complemented by qualitative
analyses of examinee protocol data.
42
References
Bachman, L. F. (1990). Fundamental considerations in language testing. New York: Oxford
University Press.
Bachman, L. F., Lynch, B. K., & Mason, M. (1995). Investigating variability in tasks and rater
judgment in a performance test of foreign speaking. Language Testing, 12, 238-257.
Bolus, R. E., Hinofotis, F. B., & Bailey, K. M. (1982). An introduction of generalizability theory
in second language acquisition research. Language Learning, 32(2), 245-258.
Breland, H., Bridgeman, B., & Fowles, M. E. (1999). Writing assessment in admission to higher
education: Review and framework (ETS RR-99-3). Princeton, NJ: Educational Testing
Service.
Brennan, R. L. (1992). Elements of generalizability theory. Iowa City, IA: ACT.
Brennan, R. L. (1999). Manual for mGENOVA Version 2.0. Iowa City, IA: The University of
Iowa.
Brennan, R. L. (2000). Performance assessments from the perspective of generalizability theory.
Applied Psychological Measurement, 24(4), 339-353.
Brennan, R. L. (2001). Generalizability theory. New York: Springer.
Brennan, R. L., Gao, X., & Colton, D. A. (1995). Generalizability analyses of work key listening
and writing tests. Educational and Psychological Measurement, 55, 157-176.
Brennan, R. L., & Johnson, E. G. (1995). Generalizability of performance assessments.
Educational Measurement: Issues and Practice, 14(4), 9-12.
Crick, G. E., & Brennan, R. L. (1983). Manual for GENOVA: A generalized analysis of variance
system (ACT Tech. Bulletin No. 43). Iowa City, IA: American College Testing Program.
Cronbach, L. J. (1951). Coefficient alpha and the internal structure of tests. Psychometrika, 16,
297-334.
Cronbach, L. J., Gleser, G. C., Nanda, H., & Rajaratnam, N. (1972). The dependability of
behavioral measurements: Theory of generalizability. New York: John Wiley.
Cumming, A., Kantor, R., Powers, D., Santos, T., & Taylor, C. (2000). TOEFL 2000 writing
framework: A working paper (TOEFL MS-19). Princeton, NJ: ETS.
Dunbar, S. B., Koretz, D. M., & Hoover, H. D. (1991). Quality control in the development and
use of performance assessments. Applied Measurement in Education, 4, 298-303.
Enright, M. K, Bridgeman, B., Cline, F., Eignor, D., Lee, Y.-W., & Powers, D. (in press).
Formative investigations of prototype measures of listening, reading, writing, and
43
speaking. In C. Chapelle, M. K. Enright, & J. Jamieson (Eds.), Building a
validity argument for the Test of English as a Foreign Language. Mahwah, NJ:
Erlbaum.
Gao, X., Shavelson, R. J., & Baxter, G. P. (1994). Generalizability of large-scale performance
assessments in science: Promises and problems. Applied Measurement in Education,
7(4), 323-342.
Henning, G. H. (1996). Accounting for nonsystematic error in performance ratings. Language
Testing, 13, 53-61.
Lee, Y.-W., Golub-Smith, M., Payton, C., & Carey, J. (2001, April). The score reliability of the
Test of Spoken English (TSE) from the generalizability theory perspective: Validating the
current procedure. Paper presented at the annual conference of American Educational
Research Association (AERA) in Seattle, WA.
Lewkowicz, J. A. (1997). The integrated testing of a second language. In C. Clapham & D.
Corson (Eds.), Encyclopedia of language and education: Vol. 7. Language testing and
assessment (pp. 121-130). Dordrecht, Netherlands: Kluwer Academic Publishers.
Linacre, J. M. (1989). Many-facet Rasch measurement. Chicago: MESA Press.
Linacre, J. M. (1998). A user’s guide to FACETS: A Rasch measurement computer program.
Chicago: MESA Press.
Linn, R. L. (1993a). Educational assessment: Expanded expectations and challenges.
Educational Evaluation and Policy Analysis, 15, 1-16.
Linn, R. L. (1993b). Performance-based assessments: Implications of task specificity.
Educational Measurement: Issues and Practice, 13(1), 5-8, 15.
Linn, R. L., Burton, E., DeStefano, L., & Hanson, M. (1996). Generalizability of new standards
project 1993 pilot study tasks in mathematics. Applied Measurement in Education, 9(3),
201-214.
Lynch, B. K., & McNamara, T. F. (1998). Using G-theory and many-facet Rasch measurement
in the development of performance assessments of the ESL speaking skills of
immigrants. Language Testing 15(2), 158-80.
Marcoulides, G. A. (1999). Generalizability theory: Picking up where Rasch IRT leaves off? In
S. Embretson & S. L. Hershberger (Eds.), The new rules of measurement: What every
psychologist and educator should know (pp. 129-152). Mahwah, NJ: Lawrence Erlbaum.
44
Miller, M. D., & Linn, R. L. (2000). Validation of performance-based assessments. Applied
Psychological Measurement, 24, 367-378.
Muraki, E., & Bock, R. D. (1999). PARSCALE: IRT item analysis and test scoring for rating-
scale data. Chicago: Scientific Software International.
Patz, R. J., Junker, B. W., Johnson, M. S., & Mariano, L. T. (2002). The hierarchical rater model
for rated test items and its application to large-scale educational assessment data. Journal
of Educational and Behavioral Statistics, 27, 341-384.
Powers, D. E., & Fowles, M. E. (1998). Test takers’ judgments about GRE writing test prompts
(ETS RR-98-36). Princeton, NJ: ETS.
Powers, D., & Kubota, M. (with Bentley, J., Farnum, M., Swartz, R., & Willard, A.). (1998a).
Qualifying readers for an Online Scoring Network (OSN) (ETS RR-98-20). Princeton,
NJ: ETS.
Powers, D., & Kubota, M. (with Bentley, J., Farnum, M., Swartz, R., & Willard, A.). (1998b).
Qualifying readers for the Online Scoring Network: Scoring argument essays (ETS RR-
98-28). Princeton, NJ: ETS.
Read, J. (1990). Providing relevant content in an EAP writing test. English for Specific Purposes,
9, 109-121.
Shavelson, R. J., Baxter, G. P., & Gao, X. (1993). Sampling variability of performance-based
assessments. Journal of Educational Measurement, 30, 215-232.
Shavelson, R. J., Baxter, G. P., & Pine, J. (1992). Performance assessments: Political rhetoric
and measurement reality. Educational Researcher, 21, 22-27.
Shavelson, R. J., & Webb, N. R. (1991). Generalizability theory: A primer. Newbury Park, CA:
Sage.
Suen, H. K. (1990). Principles of test theories. Hillsdale, NJ: Lawrence Erlbaum.
Weir, C. J. (1993). Understanding and developing language tests. Hemel, Hamstead, England:
Prentice Hall.
Wesche, B. (1987). Second language performance testing: The Ontario test of ESL as an
example. Language Testing, 4, 28-47.
45
Notes
1 Many-faceted Rasch measurement (MFRM) can be used as an alternative to generalizability
theory analyses in examining the effects of tasks and raters on examinees’ scores. However, the
focus of this research is to investigate the impact of such facets on score dependability for
various assessment scenarios through D-studies in G-theory analyses. While the MFRM
approach provides more detailed diagnostic information at the levels of individual examinees,
tasks, raters, and combinations of these elements, it does not lend itself well to such
investigation as extrapolating to various assessment scenarios that are different from the one
used in the data-collection process, as done in the D-study of G-theory analyses.
2 Often, a statistical procedure of test equating is conducted for multiple-choice sections of a
large-scale language test (e.g., TOEFL) to make an adjustment for form-to-form difficulty
differences. Such a procedure makes it possible for test scores to have equivalent meanings
across test forms. Under such circumstances, a generalizability coefficient can represent
measurement accuracy for both norm-referenced and criterion-referenced tests very well.
Often, however, test equating is not a feasible option for performance-based writing assessment
because it involves a small number of tasks and somewhat subjective rater judgment in scoring.
In addition, the dependability index is a rather conservative (safer) estimate of score reliability,
compared to the generalizability coefficient. For this reason, a dependability index is a
preferred type of reliability coefficient for rater-mediated writing assessment.
3 A section length refers to the number of tasks in a particular section of a test; likewise, a
subsection length refers to the number of tasks in a particular subsection in the test section. In
this report, a writing test is a section of a larger test consisting of listening, reading, speaking,
and writing measures.
4 In generalizability theory notation, an operator “×” means crossed with while “:” means nested
within in both G- and D-studies. In the p × t × r design, for instance, persons are crossed with
tasks that are crossed with raters, whereas raters are nested within persons in the (r:p) × t
design, even though tasks are crossed with both persons and raters.
5 The term rerated in this report does not necessarily mean that each of the raters read the same
essays twice in two separate rating sessions conducted at two different time points. Because a
partially nested design was used in the initial rating of essays (Phase 1) in this study, the Phase
1 raters did not have a chance to see all the essays used in the first rating session. Thus, this
46
term simply means that a selected sample of essays rated in one rating session were rated again
in a subsequent rating session by a different group of raters under similar or somewhat different
rating conditions.
6 In generalizability theory, measurement facets in a generalizability study (G-study) are
identified by lowercase letters (e.g., “t” for tasks and “r” for raters), but the facets in a decision
study (D-study) are identified by uppercase letters (e.g., “T” and “R”). However, the object of
measurement is represented by a lowercase letter (e.g., “p” for persons) in both G- and D-
studies. It should be noted, however, that the italicized letter (“p”) is usually used for the object
of measurement in the D-study.
7 In the multivariate design, a superscript filled-circle (•) next to a facet symbol indicates that the
facet is crossed with the fixed category facet (v), whereas a superscript empty circle (o) signals
that the facet is nested within the multivariate variables (v).
8 One reviewer has suggested that biased results about rater variability could have been obtained
in the Phase 2 study because the best-performing six raters (as opposed to random 6 raters)
were selected from a pool of 27 raters who had previously participated in the Phase 1 study. We
agree that this should be taken into account in comparing the results of the Phase 1 and Phase 2
studies. However, it should be pointed out that in order for raters to be invited to rate essays for
operational large-scale testing programs at ETS, they go through strict rater training and are
required to pass a certification test (Powers & Kubota, 1998a, 1998b). If they fail on the test,
they are not invited to participate in the actual ratings of the essays. In this sense, we argue that
the best-performing six raters represent a universe of admissible observations for raters for the
operational testing situations that is usually made up of trained ETS raters who are certified to
rate essays.
9 It should be pointed out that different test forms involved different tasks in Brennan, Gao, and
Colton (1995), whereas the test forms used in this study mainly involved the same tasks. In that
sense, the three subgroups (or test forms) in this study can be said to be more dependent.
10 The 3-tasks-and-1-rating scenario was rather arbitrarily chosen, because an assessment
scenario of three tasks is the shortest section length that allows inclusion of all of the three task
types in the section. On the other hand, the 1-task-2-ratings scenario was selected because this
represents the assessment scenario for the current TOEFL CBT and TWE assessments.
47
11 If we compare the (r:p) × t design and p x t design based on averaged ratings, raters (r) should
be treated as a hidden random facet in the p x t design, as one reviewer has correctly pointed
out. In other words, there are different raters for persons in the (r:p) × t design. Nevertheless,
we want to point out that if we look at the p x t design from the perspective of the p × t × r′
design, ratings (r′) should be treated as a hidden fixed facet in the p × t design. In the p × t × r′
design, ratings (r′) are assumed to be crossed with persons (p). This means that there would be
the same two ratings (i.e., first ratings, second ratings) for all the examinees, at least in the
formal representation of the rating facet.
48
List of Appendixes
Page
A - Schematic Illustrations of Two D-Study Designs Without Rater Overlap Across
Tasks Used in the Phase 2 Study.....................................................................................50
B - Mathematical Formulas for Computing Generalizability Coefficients and
Dependability Indices From the Univariate Analyses in the Phase 1 and 2 Studies.......53
C - Mathematical Formulas for Computing Generalizability Coefficients and
Dependability Indices From the Multivariate Analyses in the Phase 2 Study ................58
D - Estimated Standard Errors of Measurement (SEM) from the Phase 1 and 2 Studies .....60
E - Confidence Intervals (CI) Estimated for a Universe Score of 3 in the Phase 1 and 2
Studies .............................................................................................................................62
F - Focused Comparisons of Two D-Study Assessment Scenarios Used in the Phase 1
and 2 Studies....................................................................................................................64
G - Sample Tasks for Integrated and Independent Task Types.............................................66
H - Scoring Rubrics for Integrated and Independent Speaking Tasks...................................71
49
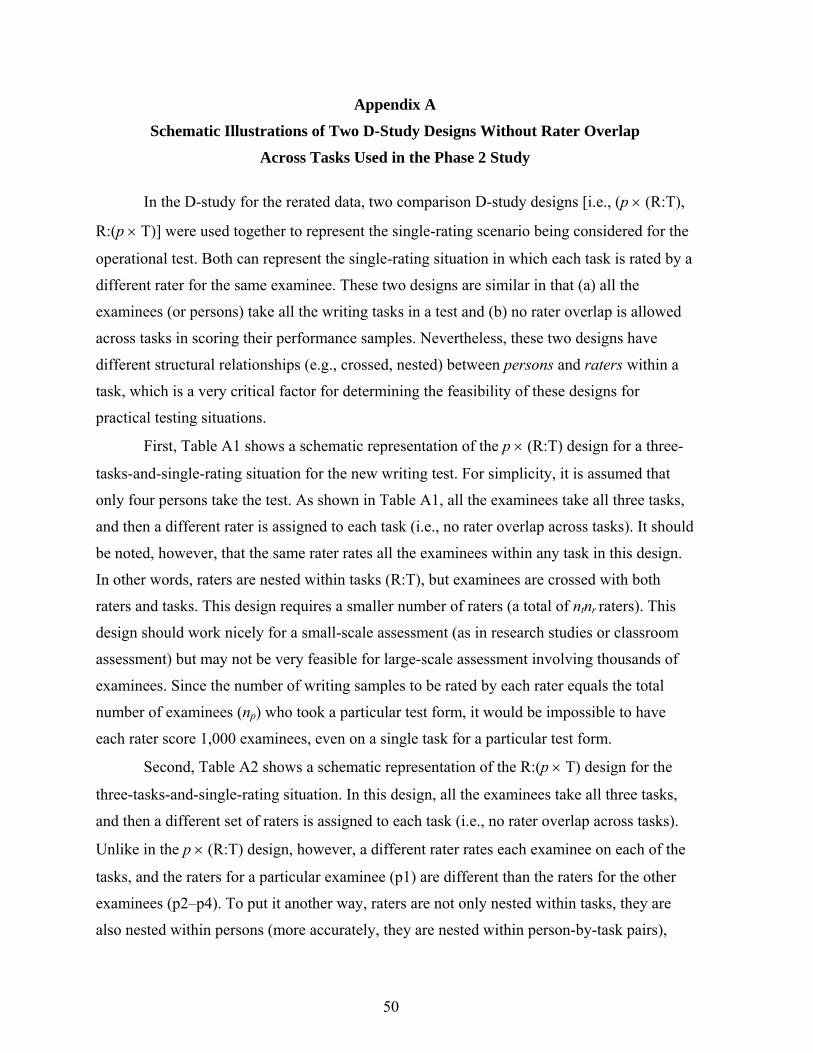
Appendix A
Schematic Illustrations of Two D-Study Designs Without Rater Overlap
Across Tasks Used in the Phase 2 Study
In the D-study for the rerated data, two comparison D-study designs [i.e., (p × (R:T),
R:(p × T)] were used together to represent the single-rating scenario being considered for the
operational test. Both can represent the single-rating situation in which each task is rated by a
different rater for the same examinee. These two designs are similar in that (a) all the
examinees (or persons) take all the writing tasks in a test and (b) no rater overlap is allowed
across tasks in scoring their performance samples. Nevertheless, these two designs have
different structural relationships (e.g., crossed, nested) between persons and raters within a
task, which is a very critical factor for determining the feasibility of these designs for
practical testing situations.
First, Table A1 shows a schematic representation of the p × (R:T) design for a three-
tasks-and-single-rating situation for the new writing test. For simplicity, it is assumed that
only four persons take the test. As shown in Table A1, all the examinees take all three tasks,
and then a different rater is assigned to each task (i.e., no rater overlap across tasks). It should
be noted, however, that the same rater rates all the examinees within any task in this design.
In other words, raters are nested within tasks (R:T), but examinees are crossed with both
raters and tasks. This design requires a smaller number of raters (a total of ntnr raters). This
design should work nicely for a small-scale assessment (as in research studies or classroom
assessment) but may not be very feasible for large-scale assessment involving thousands of
examinees. Since the number of writing samples to be rated by each rater equals the total
number of examinees (np) who took a particular test form, it would be impossible to have
each rater score 1,000 examinees, even on a single task for a particular test form.
Second, Table A2 shows a schematic representation of the R:(p × T) design for the
three-tasks-and-single-rating situation. In this design, all the examinees take all three tasks,
and then a different set of raters is assigned to each task (i.e., no rater overlap across tasks).
Unlike in the p × (R:T) design, however, a different rater rates each examinee on each of the
tasks, and the raters for a particular examinee (p1) are different than the raters for the other
examinees (p2–p4). To put it another way, raters are not only nested within tasks, they are
also nested within persons (more accurately, they are nested within person-by-task pairs),
50
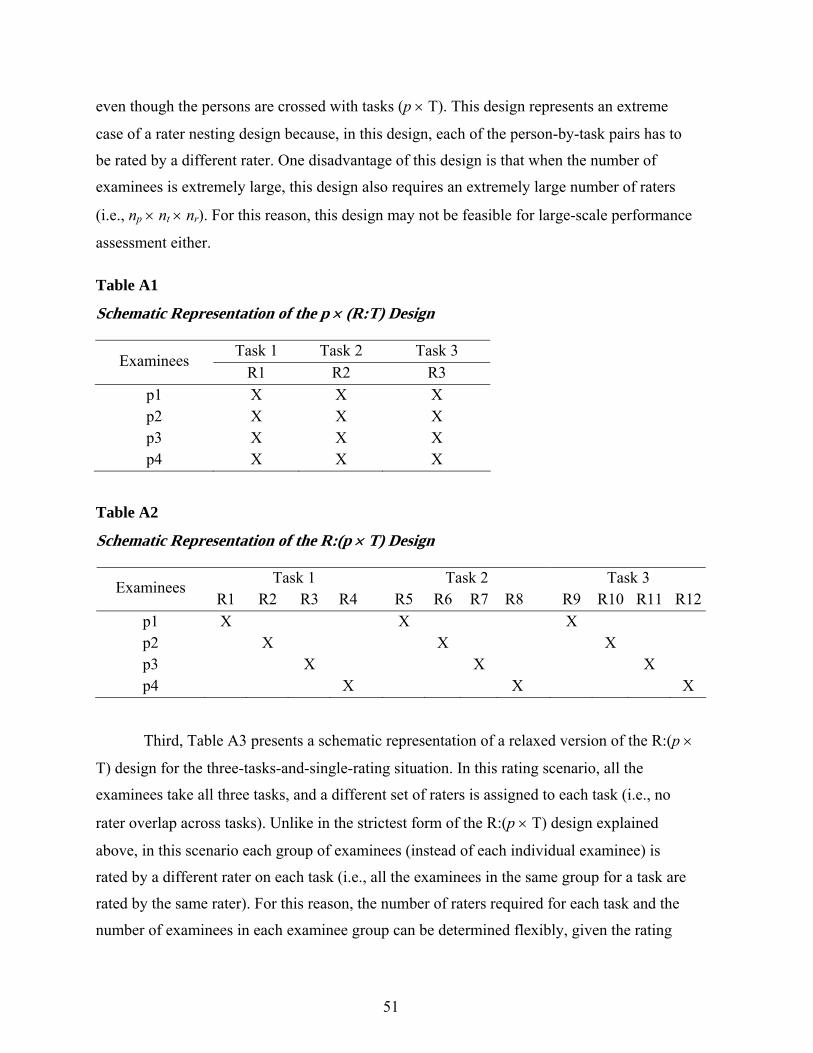
even though the persons are crossed with tasks (p × T). This design represents an extreme
case of a rater nesting design because, in this design, each of the person-by-task pairs has to
be rated by a different rater. One disadvantage of this design is that when the number of
examinees is extremely large, this design also requires an extremely large number of raters
(i.e., np × nt × nr). For this reason, this design may not be feasible for large-scale performance
assessment either.
Table A1
Schematic Representation of the p × (R:T) Design
Task 1 Task 2 Task 3 Examinees R1 R2 R3
p1 X X X p2 X X X p3 X X X p4 X X X
Table A2
Schematic Representation of the R:(p × T) Design
Task 1 Task 2 Task 3 Examinees R1 R2 R3 R4 R5 R6 R7 R8 R9 R10 R11 R12
p1 X X X p2 X X X p3 X X X p4 X X X
Third, Table A3 presents a schematic representation of a relaxed version of the R:(p ×
T) design for the three-tasks-and-single-rating situation. In this rating scenario, all the
examinees take all three tasks, and a different set of raters is assigned to each task (i.e., no
rater overlap across tasks). Unlike in the strictest form of the R:(p × T) design explained
above, in this scenario each group of examinees (instead of each individual examinee) is
rated by a different rater on each task (i.e., all the examinees in the same group for a task are
rated by the same rater). For this reason, the number of raters required for each task and the
number of examinees in each examinee group can be determined flexibly, given the rating
51
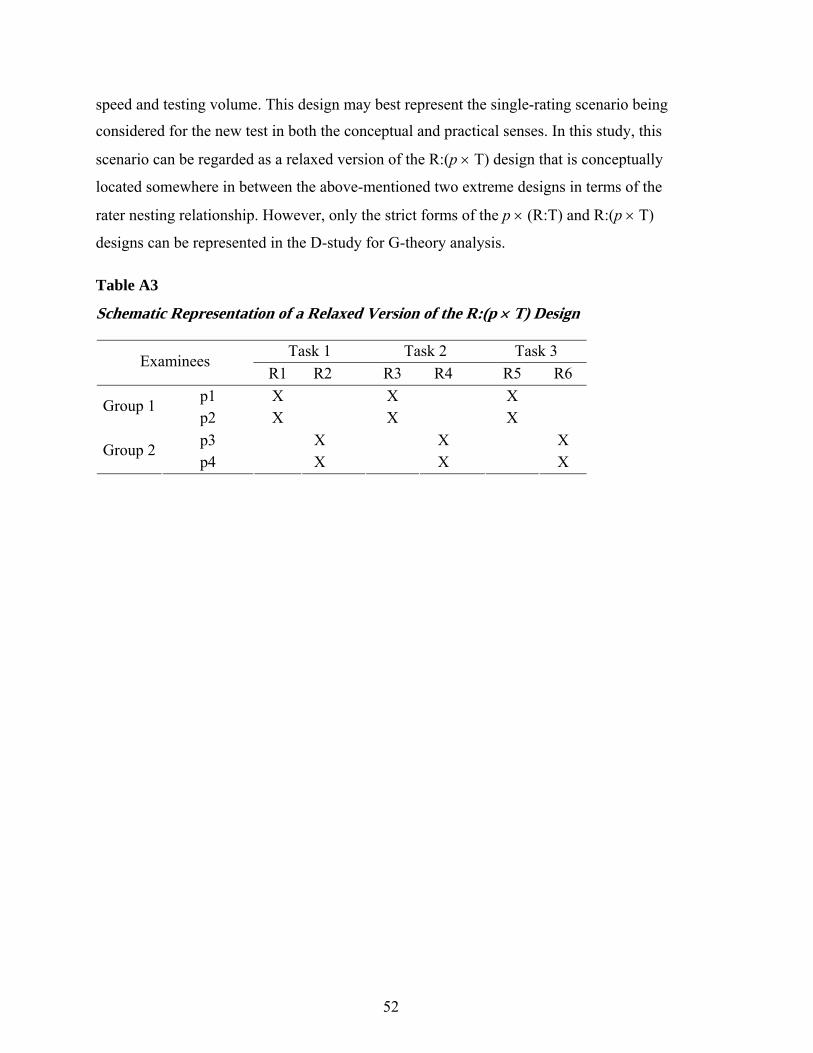
speed and testing volume. This design may best represent the single-rating scenario being
considered for the new test in both the conceptual and practical senses. In this study, this
scenario can be regarded as a relaxed version of the R:(p × T) design that is conceptually
located somewhere in between the above-mentioned two extreme designs in terms of the
rater nesting relationship. However, only the strict forms of the p × (R:T) and R:(p × T)
designs can be represented in the D-study for G-theory analysis.
Table A3
Schematic Representation of a Relaxed Version of the R:(p × T) Design
Task 1 Task 2 Task 3 Examinees R1 R2 R3 R4 R5 R6
p1 X X X Group 1 p2 X X X
p3 X X X Group 2 p4 X X X
52
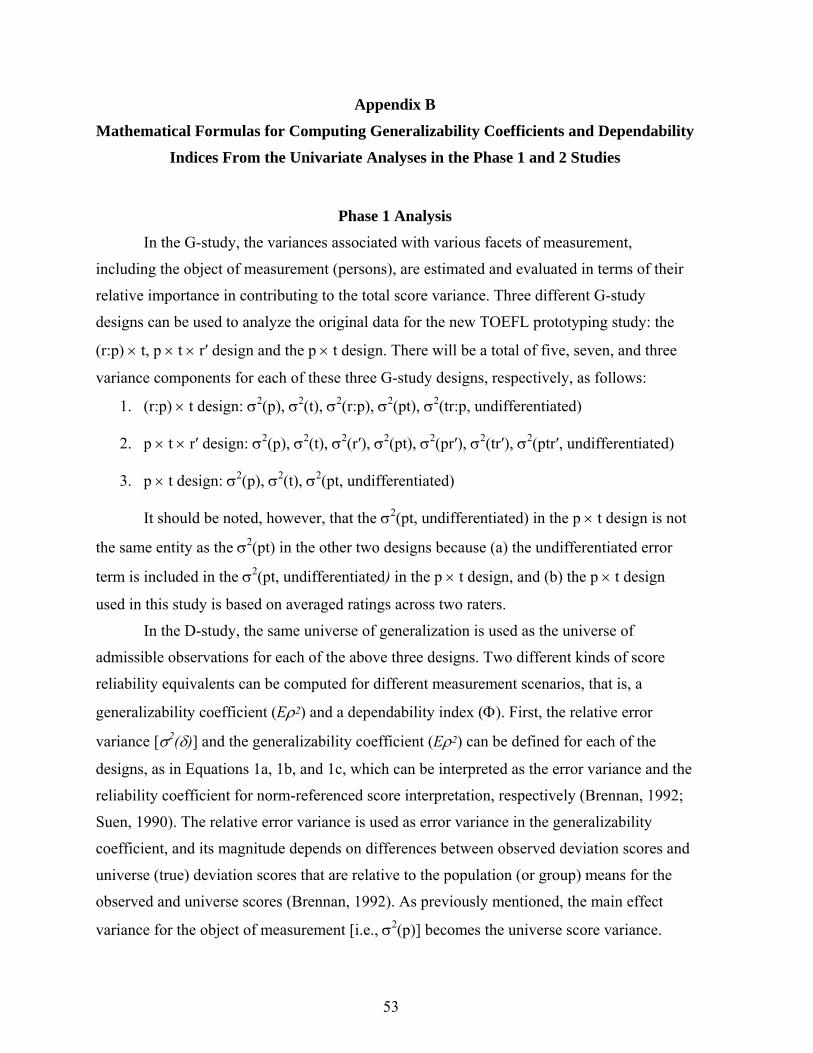
Appendix B
Mathematical Formulas for Computing Generalizability Coefficients and Dependability
Indices From the Univariate Analyses in the Phase 1 and 2 Studies
Phase 1 Analysis
In the G-study, the variances associated with various facets of measurement,
including the object of measurement (persons), are estimated and evaluated in terms of their
relative importance in contributing to the total score variance. Three different G-study
designs can be used to analyze the original data for the new TOEFL prototyping study: the
(r:p) × t, p × t × r′ design and the p × t design. There will be a total of five, seven, and three
variance components for each of these three G-study designs, respectively, as follows:
1. (r:p) × t design: σ2(p), σ2(t), σ2(r:p), σ2(pt), σ2(tr:p, undifferentiated)
2. p × t × r′ design: σ2(p), σ2(t), σ2(r′), σ2(pt), σ2(pr′), σ2(tr′), σ2(ptr′, undifferentiated)
3. p × t design: σ2(p), σ2(t), σ2(pt, undifferentiated)
It should be noted, however, that the σ2(pt, undifferentiated) in the p × t design is not
the same entity as the σ2(pt) in the other two designs because (a) the undifferentiated error
term is included in the σ2(pt, undifferentiated) in the p × t design, and (b) the p × t design
used in this study is based on averaged ratings across two raters.
In the D-study, the same universe of generalization is used as the universe of
admissible observations for each of the above three designs. Two different kinds of score
reliability equivalents can be computed for different measurement scenarios, that is, a
generalizability coefficient (Eρ2) and a dependability index (Φ). First, the relative error
variance [σ2(δ)] and the generalizability coefficient (Eρ2) can be defined for each of the
designs, as in Equations 1a, 1b, and 1c, which can be interpreted as the error variance and the
reliability coefficient for norm-referenced score interpretation, respectively (Brennan, 1992;
Suen, 1990). The relative error variance is used as error variance in the generalizability
coefficient, and its magnitude depends on differences between observed deviation scores and
universe (true) deviation scores that are relative to the population (or group) means for the
observed and universe scores (Brennan, 1992). As previously mentioned, the main effect
variance for the object of measurement [i.e., σ2(p)] becomes the universe score variance.
53
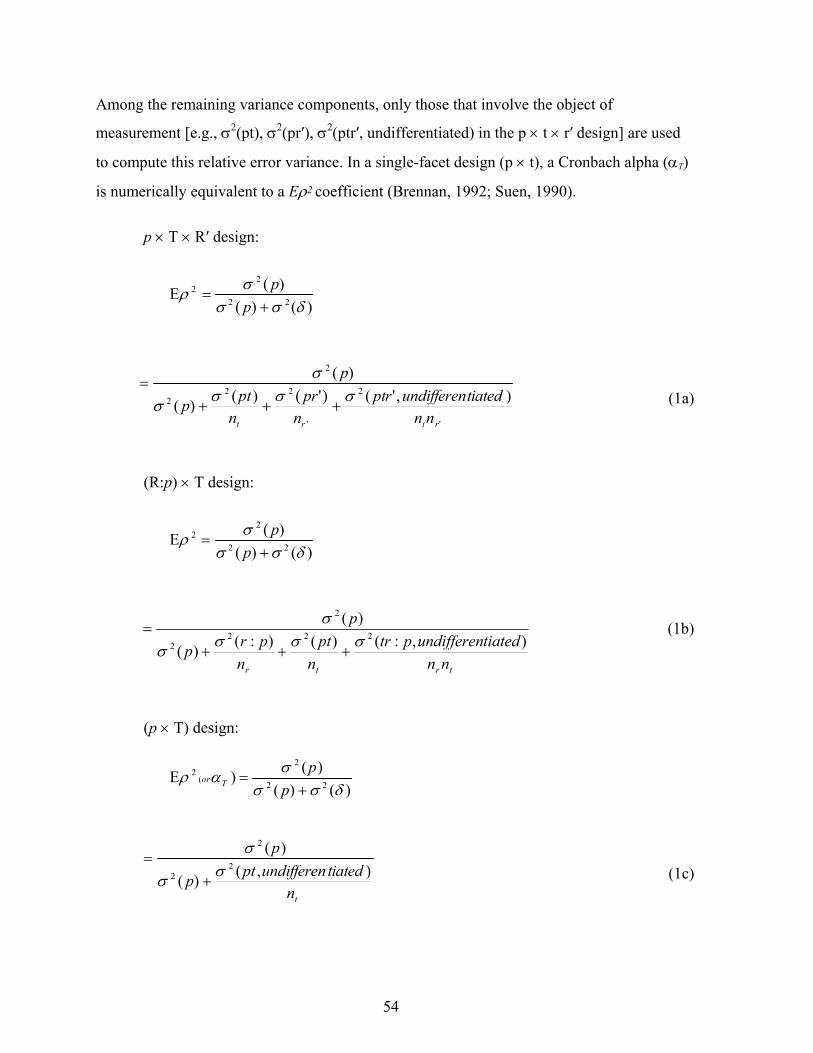
Among the remaining variance components, only those that involve the object of
measurement [e.g., σ2(pt), σ2(pr′), σ2(ptr′, undifferentiated) in the p × t × r′ design] are used
to compute this relative error variance. In a single-facet design (p × t), a Cronbach alpha (αT)
is numerically equivalent to a Eρ2 coefficient (Brennan, 1992; Suen, 1990).
p × T × R′ design:
)()()(E
22
22
δσσσρ
+=
pp
'
2
'
222
2
),'()'()()(
)(
rtrt nntiatedundifferenptr
npr
nptp
pσσσσ
σ
+++=
(1a)
(R:p) × T design:
)()()(E
22
22
δσσσρ
+=
pp
trtr nntiatedundifferenptr
npt
nprp
p),:()():()(
)(222
2
2
σσσσ
σ
+++= (1b)
(p × T) design:
)()()()E
22
2
(2
δσσσαρ
+=
pp
Tor
tntiatedundifferenptp
p),()(
)(2
2
2
σσ
σ
+=
(1c)
54
Second, the absolute error variance [σ2(∆)] and the dependability index (Φ) can be
computed for the first two designs, as in Equations 2a and 2b, which can be interpreted as the
error variance and the score reliability index for criterion-referenced score interpretation,
respectively. The absolute error variance is used as error variance in the dependability index
and its magnitude depends on differences between observed and universe (true) score
differences (Brennan, 1992). By definition, all the variance components other than the main
effect variance for the object of measurement [i.e., σ2(p)] are used to compute this absolute
error variance. When the scores are given absolute interpretations, as in a domain-referenced
or criterion-referenced situation, the Φ coefficient and the absolute error variance are more
appropriate (Brennan, 2001).
p × T × R′ design:
)()()(
22
2
∆+=Φ
σσσp
p
'
2
'
2
'
22
'
222
2
),'()'()'()()'()()(
)(
rtrtrtrt nntiatedundifferenptr
nntr
npr
npt
nr
ntp
pσσσσσσσ
σ
++++++=
(2a)
(R:p) × T design:
)()()(
22
2
∆+=Φ
σσσp
p
trtrt nntiatedundifferenptr
npt
npr
ntp
p),:()():()()(
)(2222
2
2
σσσσσ
σ
++++= (2b)
55
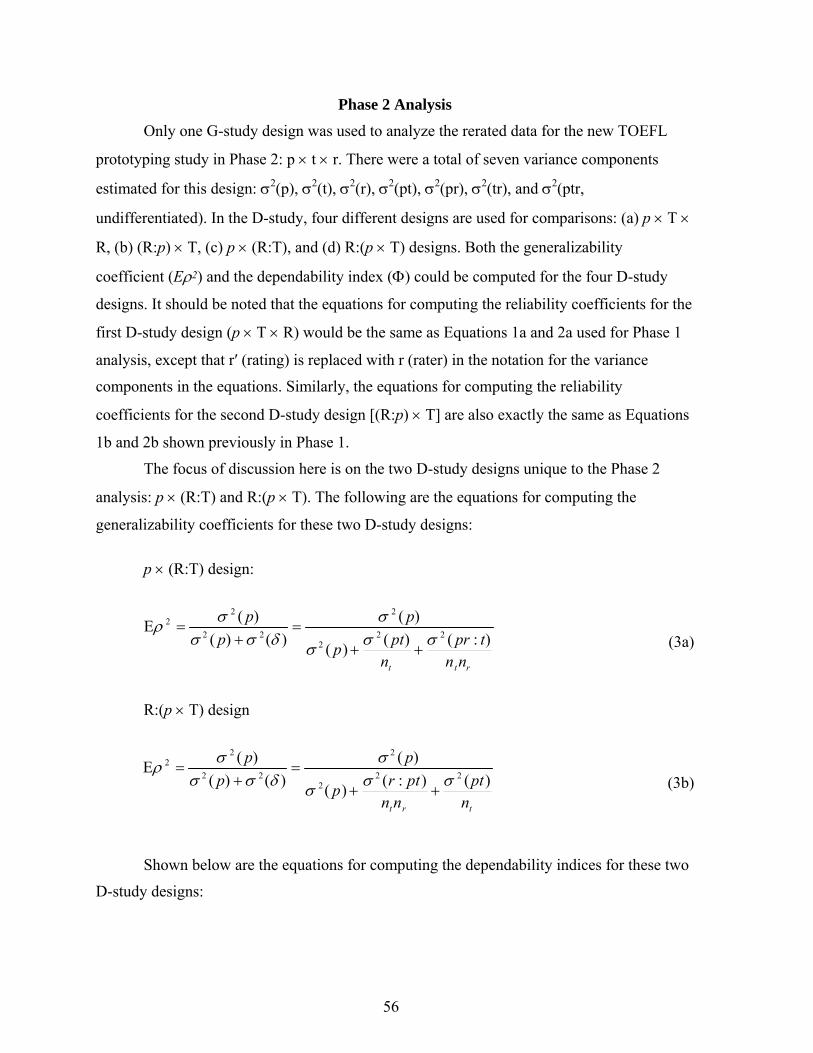
Phase 2 Analysis
Only one G-study design was used to analyze the rerated data for the new TOEFL
prototyping study in Phase 2: p × t × r. There were a total of seven variance components
estimated for this design: σ2(p), σ2(t), σ2(r), σ2(pt), σ2(pr), σ2(tr), and σ2(ptr,
undifferentiated). In the D-study, four different designs are used for comparisons: (a) p × T ×
R, (b) (R:p) × T, (c) p × (R:T), and (d) R:(p × T) designs. Both the generalizability
coefficient (Eρ2) and the dependability index (Φ) could be computed for the four D-study
designs. It should be noted that the equations for computing the reliability coefficients for the
first D-study design (p × T × R) would be the same as Equations 1a and 2a used for Phase 1
analysis, except that r′ (rating) is replaced with r (rater) in the notation for the variance
components in the equations. Similarly, the equations for computing the reliability
coefficients for the second D-study design [(R:p) × T] are also exactly the same as Equations
1b and 2b shown previously in Phase 1.
The focus of discussion here is on the two D-study designs unique to the Phase 2
analysis: p × (R:T) and R:(p × T). The following are the equations for computing the
generalizability coefficients for these two D-study designs:
p × (R:T) design:
rtt nntpr
nptp
pp
p):()()(
)()()(
)(E22
2
2
22
22
σσσ
σδσσ
σρ++
=+
= (3a)
R:(p × T) design
trt npt
nnptrp
pp
p)():()(
)()()(
)(E22
2
2
22
22
σσσ
σδσσ
σρ++
=+
= (3b)
Shown below are the equations for computing the dependability indices for these two
D-study designs:
56
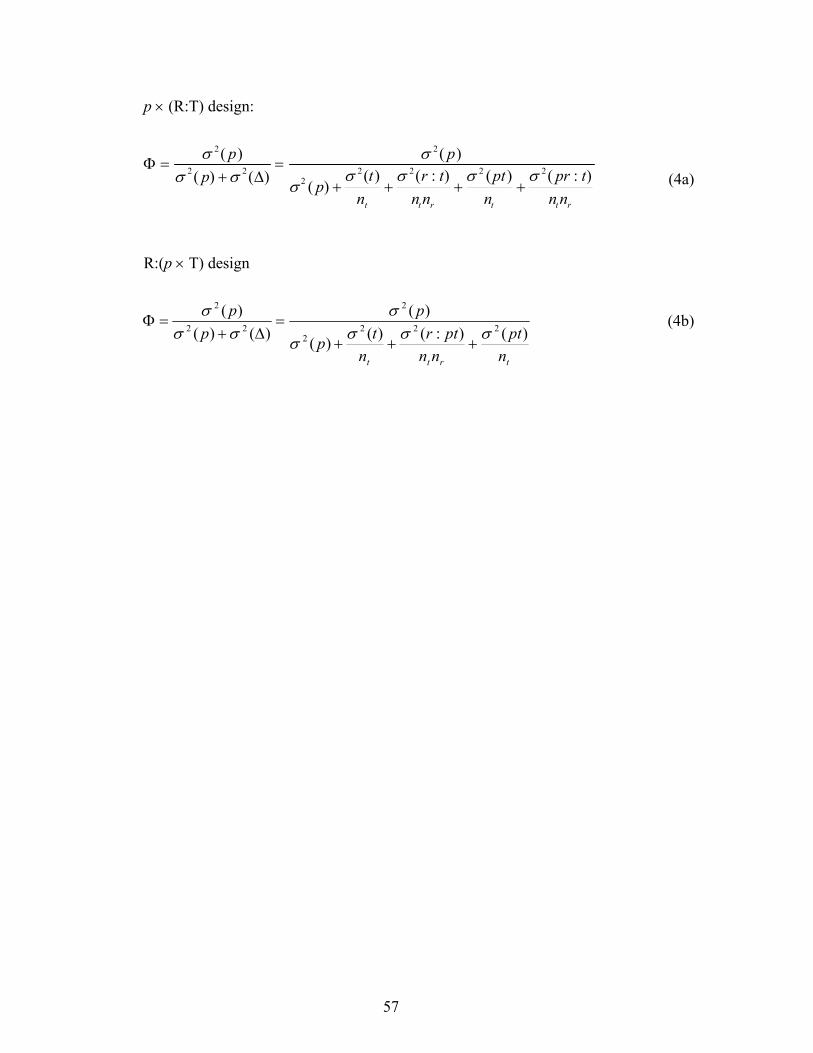
p × (R:T) design:
rttrtt nntpr
npt
nntr
nt
p
pp
p):()():()(
)(
)()()(
)(2222
2
2
22
2
σσσσσ
σσσ
σ
++++=
∆+=Φ
(4a)
R:(p × T) design
trtt npt
nnptr
ntp
pp
p)():()()(
)()()(
)(222
2
2
22
2
σσσσ
σσσ
σ
+++=
∆+=Φ (4b)
57
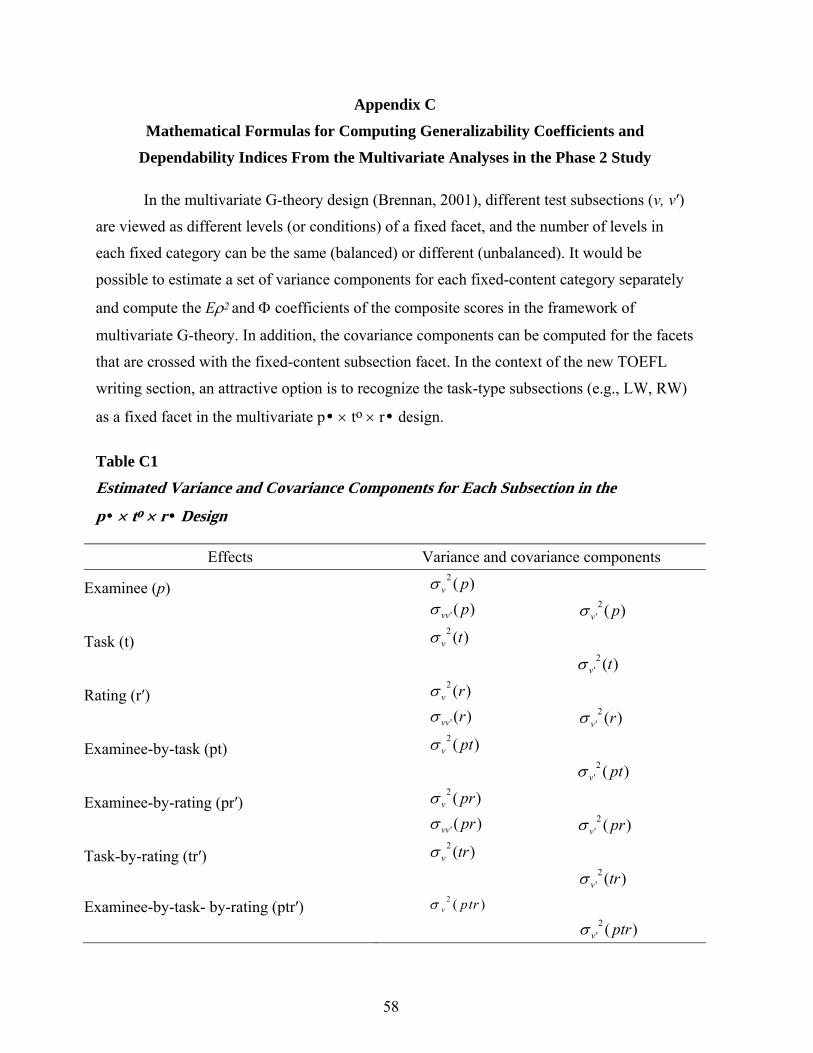
Appendix C
Mathematical Formulas for Computing Generalizability Coefficients and
Dependability Indices From the Multivariate Analyses in the Phase 2 Study
In the multivariate G-theory design (Brennan, 2001), different test subsections (v, v′)
are viewed as different levels (or conditions) of a fixed facet, and the number of levels in
each fixed category can be the same (balanced) or different (unbalanced). It would be
possible to estimate a set of variance components for each fixed-content category separately
and compute the Eρ2 and Φ coefficients of the composite scores in the framework of
multivariate G-theory. In addition, the covariance components can be computed for the facets
that are crossed with the fixed-content subsection facet. In the context of the new TOEFL
writing section, an attractive option is to recognize the task-type subsections (e.g., LW, RW)
as a fixed facet in the multivariate p• × to × r• design.
Table C1
Estimated Variance and Covariance Components for Each Subsection in the
p• × to × r• Design
Effects Variance and covariance components
Examinee (p) )(2 pvσ
)(' pvvσ )(2' pvσ
Task (t) )(2 tvσ
)(2' tvσ
Rating (r′) )(2 rvσ
)(' rvvσ )(2' rvσ
Examinee-by-task (pt) )(2 ptvσ
)(2' ptvσ
Examinee-by-rating (pr′) )(2 prvσ
)(' prvvσ )(2' prvσ
Task-by-rating (tr′) )(2 trvσ
)(2' trvσ
Examinee-by-task- by-rating (ptr′) )(2 ptrvσ
)(2' ptrvσ
58
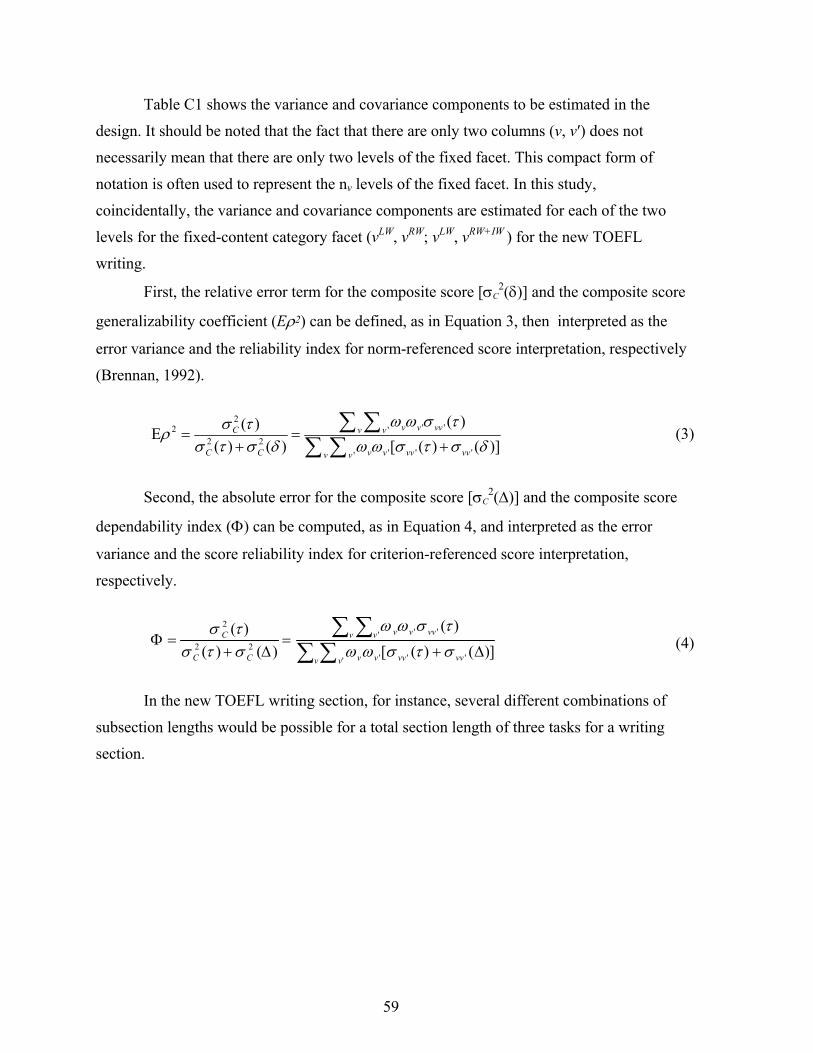
Table C1 shows the variance and covariance components to be estimated in the design. It should be noted that the fact that there are only two columns (v, v′) does not
necessarily mean that there are only two levels of the fixed facet. This compact form of
notation is often used to represent the nv levels of the fixed facet. In this study,
coincidentally, the variance and covariance components are estimated for each of the two
levels for the fixed-content category facet (vLW, vRW; vLW, vRW+IW ) for the new TOEFL
writing.
First, the relative error term for the composite score [σC2(δ)] and the composite score
generalizability coefficient (Eρ2) can be defined, as in Equation 3, then interpreted as the
error variance and the reliability index for norm-referenced score interpretation, respectively
(Brennan, 1992).
2' '2 '
2 2' ' ''
( )( )E( ) ( ) [ ( ) ( )]
v v vvC v v
C C v v vv vvv v
ω ω σ τσ τρσ τ σ δ ω ω σ τ σ δ
= =+ +
∑ ∑∑ ∑
(3)
Second, the absolute error for the composite score [σC2(∆)] and the composite score
dependability index (Φ) can be computed, as in Equation 4, and interpreted as the error
variance and the score reliability index for criterion-referenced score interpretation,
respectively.
)]()([)(
)()()(
''''
'''22
2
∆+=
∆+=Φ
∑ ∑∑ ∑
vvv vvvv v
v vvvv v
CC
C
στσωω
τσωω
στστσ
(4)
In the new TOEFL writing section, for instance, several different combinations of
subsection lengths would be possible for a total section length of three tasks for a writing
section.
59
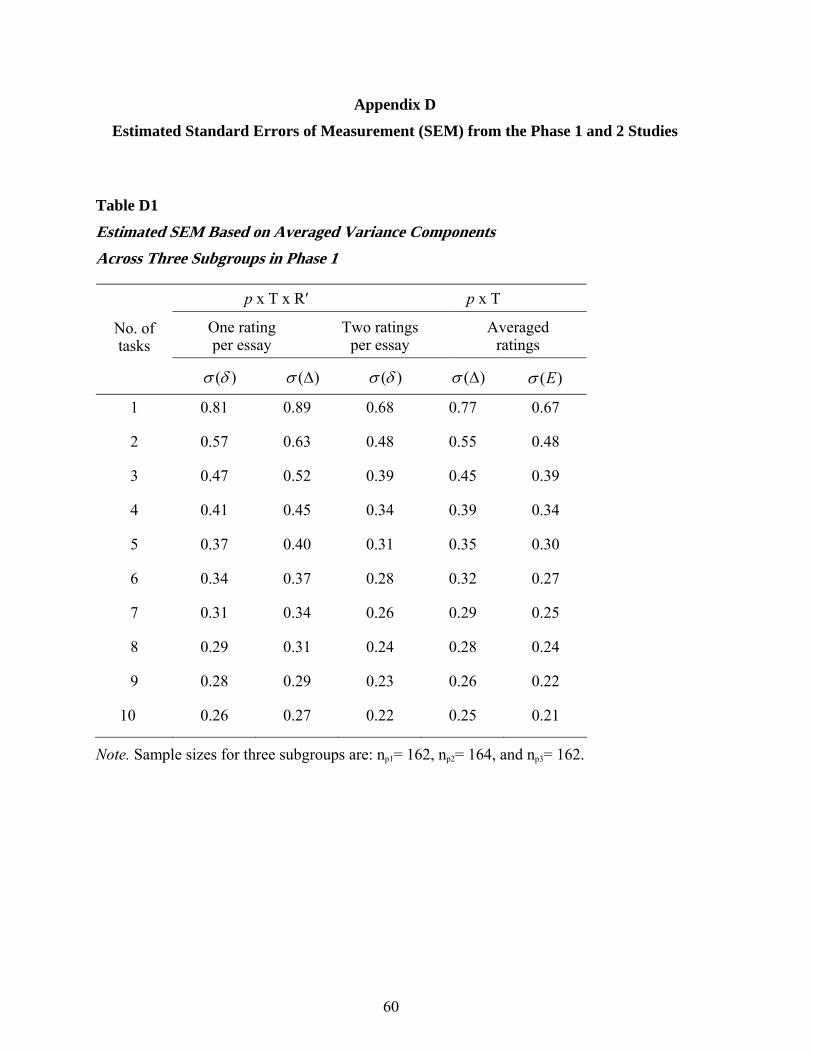
Appendix D
Estimated Standard Errors of Measurement (SEM) from the Phase 1 and 2 Studies
Table D1
Estimated SEM Based on Averaged Variance Components Across Three Subgroups in Phase 1
p x T x R′ p x T
One rating per essay
Two ratings per essay
Averaged ratings
No. of tasks
)(δσ )(∆σ )(δσ )(∆σ )(Eσ 1 0.81 0.89 0.68 0.77 0.67
2 0.57 0.63 0.48 0.55 0.48
3 0.47 0.52 0.39 0.45 0.39
4 0.41 0.45 0.34 0.39 0.34
5 0.37 0.40 0.31 0.35 0.30
6 0.34 0.37 0.28 0.32 0.27
7 0.31 0.34 0.26 0.29 0.25
8 0.29 0.31 0.24 0.28 0.24
9 0.28 0.29 0.23 0.26 0.22
10 0.26 0.27 0.22 0.25 0.21
Note. Sample sizes for three subgroups are: np1= 162, np2= 164, and np3= 162.
60
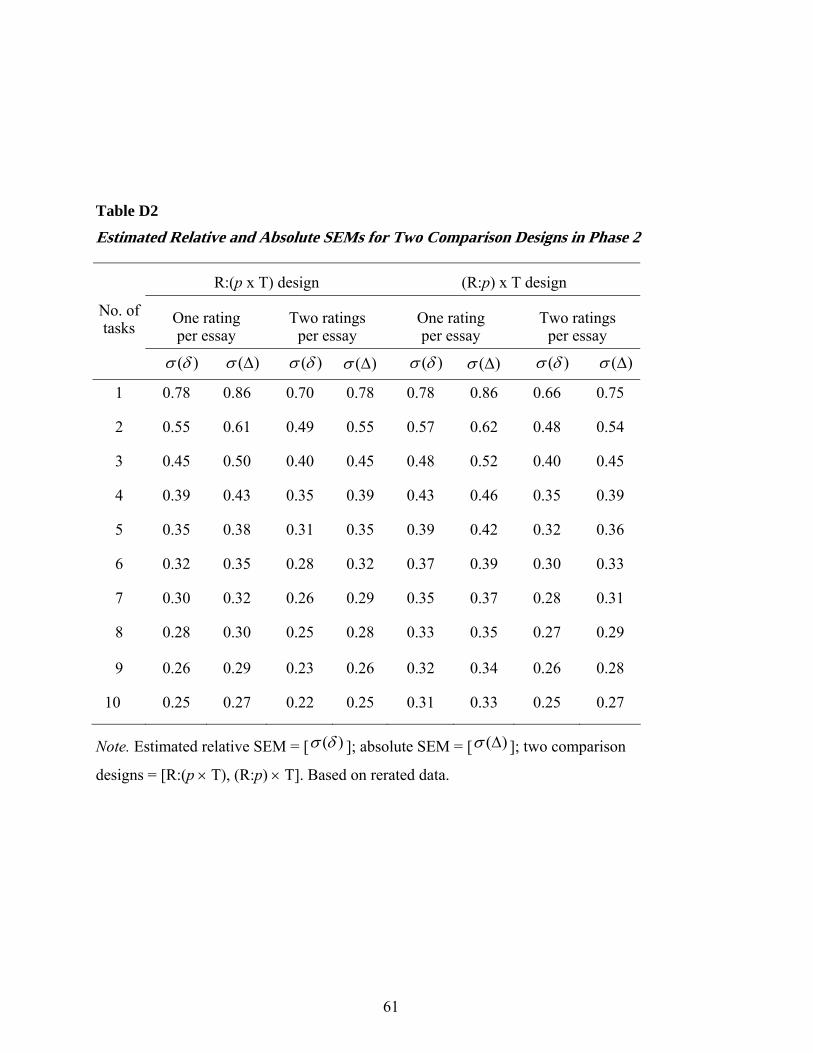
Table D2
Estimated Relative and Absolute SEMs for Two Comparison Designs in Phase 2
R:(p x T) design (R:p) x T design
One rating per essay
Two ratings per essay
One rating per essay
Two ratings per essay
No. of tasks
)(δσ )(∆σ )(δσ )(∆σ )(δσ )(∆σ )(δσ )(∆σ 1 0.78 0.86 0.70 0.78 0.78 0.86 0.66 0.75
2 0.55 0.61 0.49 0.55 0.57 0.62 0.48 0.54
3 0.45 0.50 0.40 0.45 0.48 0.52 0.40 0.45
4 0.39 0.43 0.35 0.39 0.43 0.46 0.35 0.39
5 0.35 0.38 0.31 0.35 0.39 0.42 0.32 0.36
6 0.32 0.35 0.28 0.32 0.37 0.39 0.30 0.33
7 0.30 0.32 0.26 0.29 0.35 0.37 0.28 0.31
8 0.28 0.30 0.25 0.28 0.33 0.35 0.27 0.29
9 0.26 0.29 0.23 0.26 0.32 0.34 0.26 0.28
10 0.25 0.27 0.22 0.25 0.31 0.33 0.25 0.27
Note. Estimated relative SEM = [ )(δσ ]; absolute SEM = [ )(∆σ ]; two comparison
designs = [R:(p × T), (R:p) × T]. Based on rerated data.
61
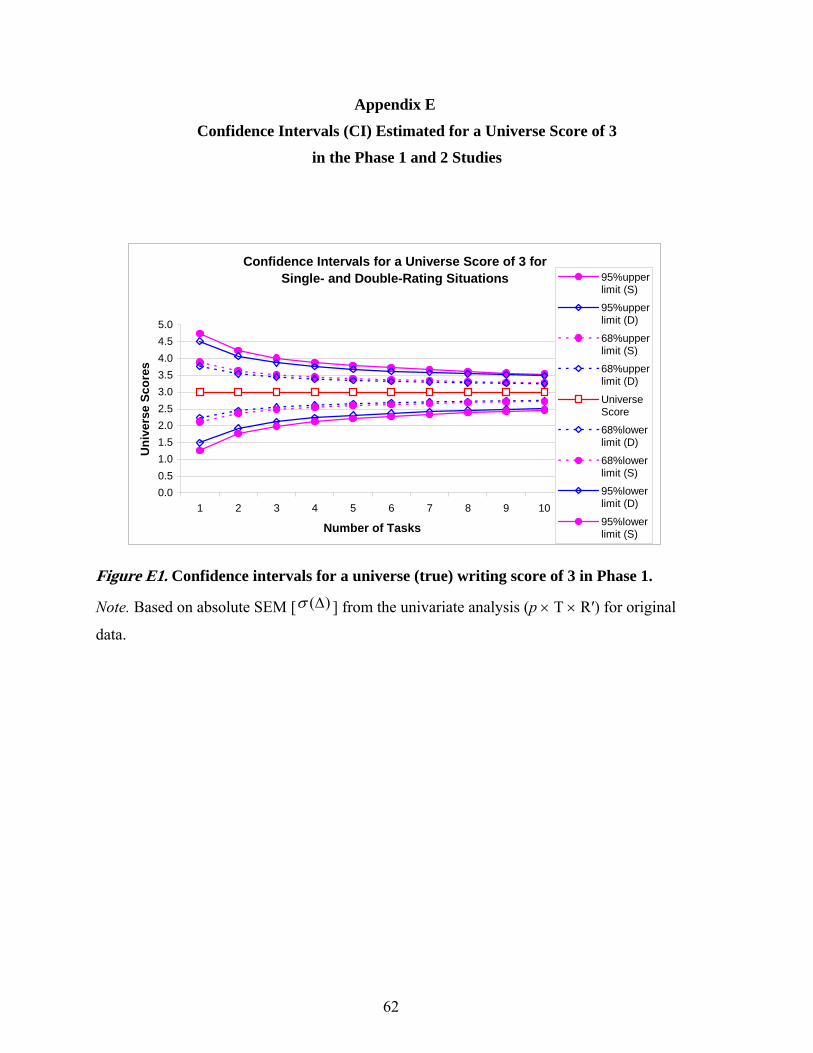
Appendix E
Confidence Intervals (CI) Estimated for a Universe Score of 3
in the Phase 1 and 2 Studies
Confidence Intervals for a Universe Score of 3 for Single- and Double-Rating Situations
0.00.51.01.52.02.53.03.54.04.55.0
1 2 3 4 5 6 7 8 9 10
Number of Tasks
Uni
vers
e Sc
ores
95%upperlimit (S)
95%upperlimit (D)
68%upperlimit (S)
68%upperlimit (D)
UniverseScore
68%lowerlimit (D)
68%lowerlimit (S)
95%lowerlimit (D)
95%lowerlimit (S)
Figure E1. Confidence intervals for a universe (true) writing score of 3 in Phase 1.
Note. Based on absolute SEM [ )(∆σ ] from the univariate analysis (p × T × R′) for original
data.
62
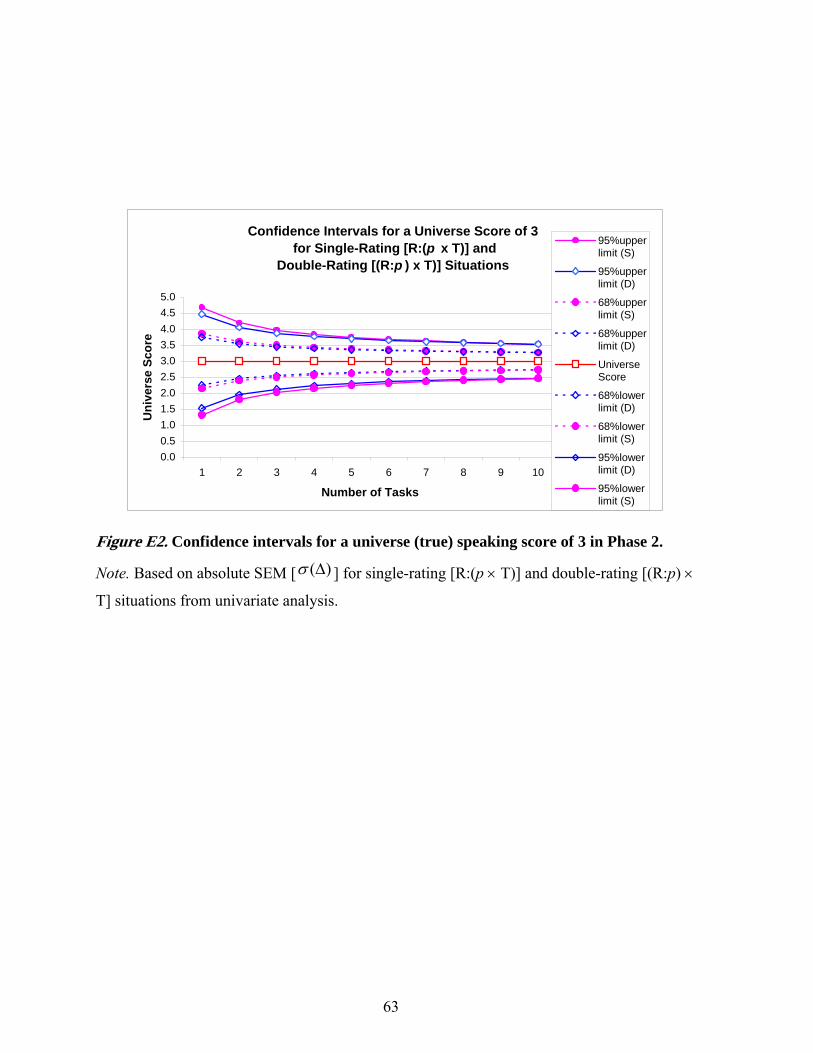
Confidence Intervals for a Universe Score of 3 for Single-Rating [R:(p x T)] and
Double-Rating [(R:p ) x T)] Situations
0.00.51.01.52.02.53.03.54.04.55.0
1 2 3 4 5 6 7 8 9 10
Number of Tasks
Uni
vers
e Sc
ore
95%upperlimit (S)
95%upperlimit (D)
68%upperlimit (S)
68%upperlimit (D)
UniverseScore
68%lowerlimit (D)
68%lowerlimit (S)
95%lowerlimit (D)
95%lowerlimit (S)
Figure E2. Confidence intervals for a universe (true) speaking score of 3 in Phase 2.
Note. Based on absolute SEM [ )(∆σ ] for single-rating [R:(p × T)] and double-rating [(R:p) ×
T] situations from univariate analysis.
63
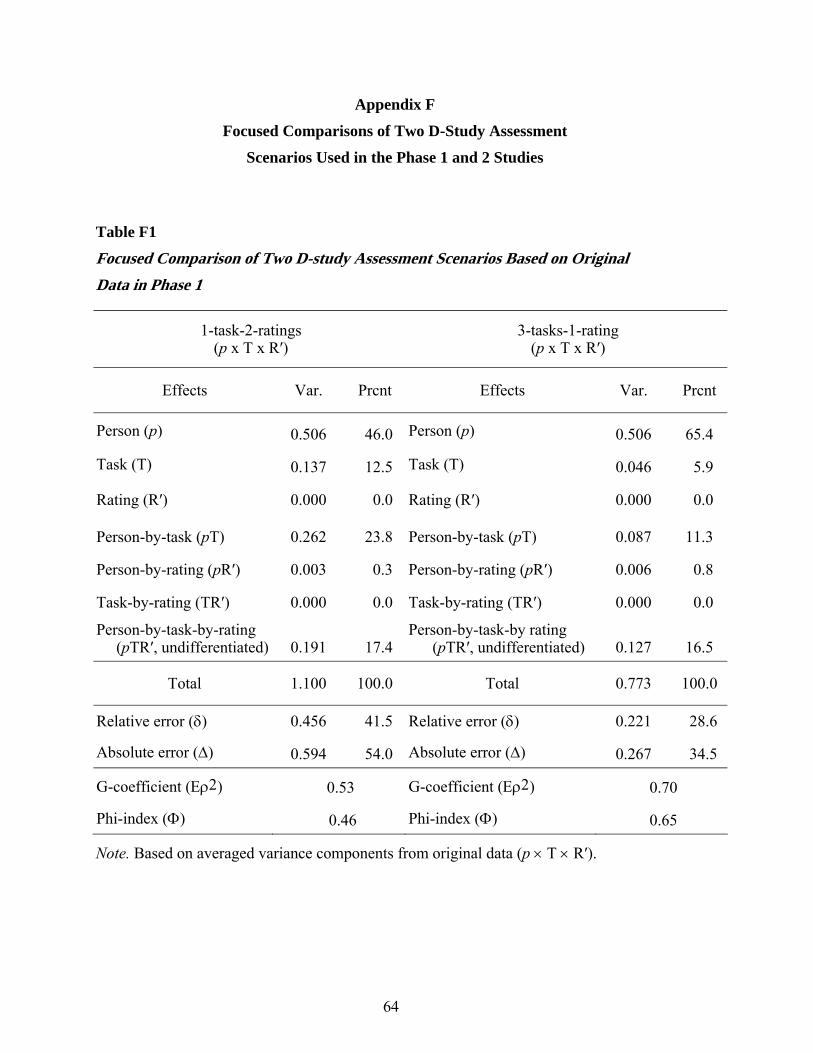
Appendix F
Focused Comparisons of Two D-Study Assessment
Scenarios Used in the Phase 1 and 2 Studies
Table F1
Focused Comparison of Two D-study Assessment Scenarios Based on Original Data in Phase 1
1-task-2-ratings (p x T x R′)
3-tasks-1-rating (p x T x R′)
Effects Var. Prcnt Effects Var. Prcnt
Person (p) 0.506 46.0 Person (p) 0.506 65.4
Task (T) 0.137 12.5 Task (T) 0.046 5.9
Rating (R′) 0.000 0.0 Rating (R′) 0.000 0.0
Person-by-task (pT) 0.262 23.8 Person-by-task (pT) 0.087 11.3
Person-by-rating (pR′) 0.003 0.3 Person-by-rating (pR′) 0.006 0.8
Task-by-rating (TR′) 0.000 0.0 Task-by-rating (TR′) 0.000 0.0
Person-by-task-by-rating (pTR′, undifferentiated) 0.191 17.4
Person-by-task-by rating (pTR′, undifferentiated) 0.127 16.5
Total 1.100 100.0 Total 0.773 100.0
Relative error (δ) 0.456 41.5 Relative error (δ) 0.221 28.6
Absolute error (∆) 0.594 54.0 Absolute error (∆) 0.267 34.5
G-coefficient (Ερ2) 0.53 G-coefficient (Ερ2) 0.70
Phi-index (Φ) 0.46 Phi-index (Φ) 0.65
Note. Based on averaged variance components from original data (p × T × R′).
64
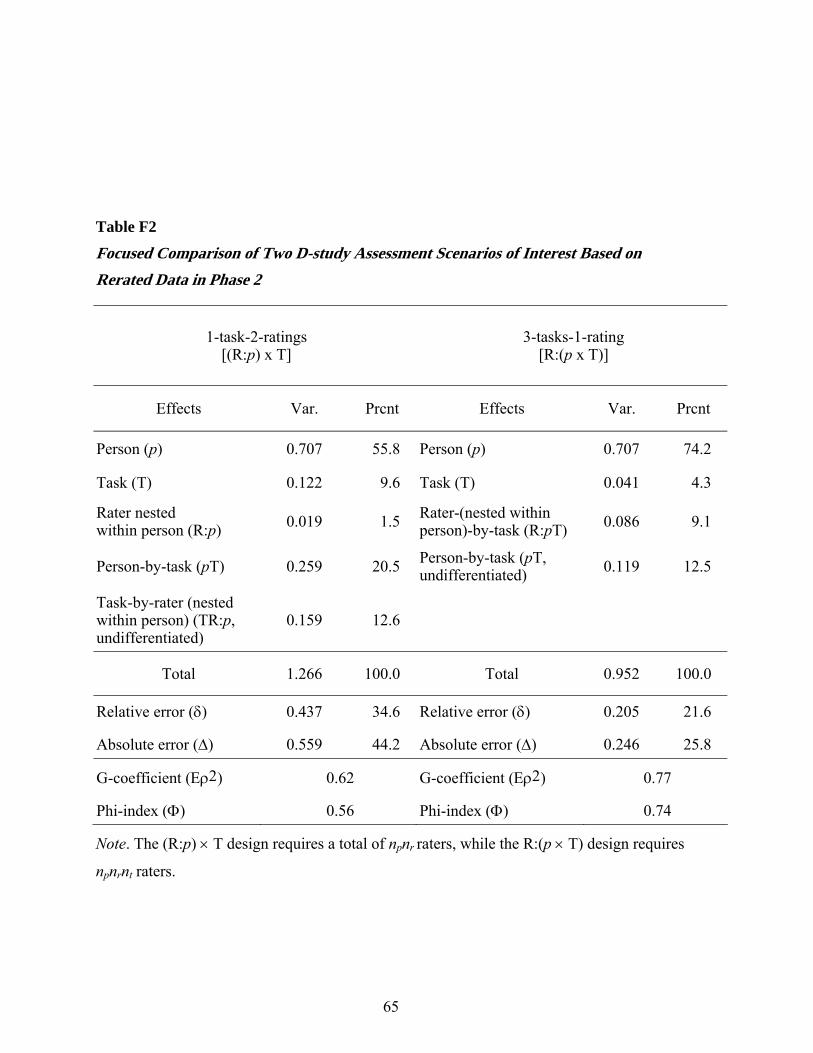
Table F2
Focused Comparison of Two D-study Assessment Scenarios of Interest Based on Rerated Data in Phase 2
1-task-2-ratings [(R:p) x T]
3-tasks-1-rating [R:(p x T)]
Effects Var. Prcnt Effects Var. Prcnt
Person (p) 0.707 55.8 Person (p) 0.707 74.2
Task (T) 0.122 9.6 Task (T) 0.041 4.3
Rater nested within person (R:p) 0.019 1.5 Rater-(nested within
person)-by-task (R:pT) 0.086 9.1
Person-by-task (pT) 0.259 20.5 Person-by-task (pT, undifferentiated) 0.119 12.5
Task-by-rater (nested within person) (TR:p, undifferentiated)
0.159 12.6
Total 1.266 100.0 Total 0.952 100.0
Relative error (δ) 0.437 34.6 Relative error (δ) 0.205 21.6
Absolute error (∆) 0.559 44.2 Absolute error (∆) 0.246 25.8
G-coefficient (Ερ2) 0.62 G-coefficient (Ερ2) 0.77
Phi-index (Φ) 0.56 Phi-index (Φ) 0.74
Note. The (R:p) × T design requires a total of npnr raters, while the R:(p × T) design requires
npnrnt raters.
65
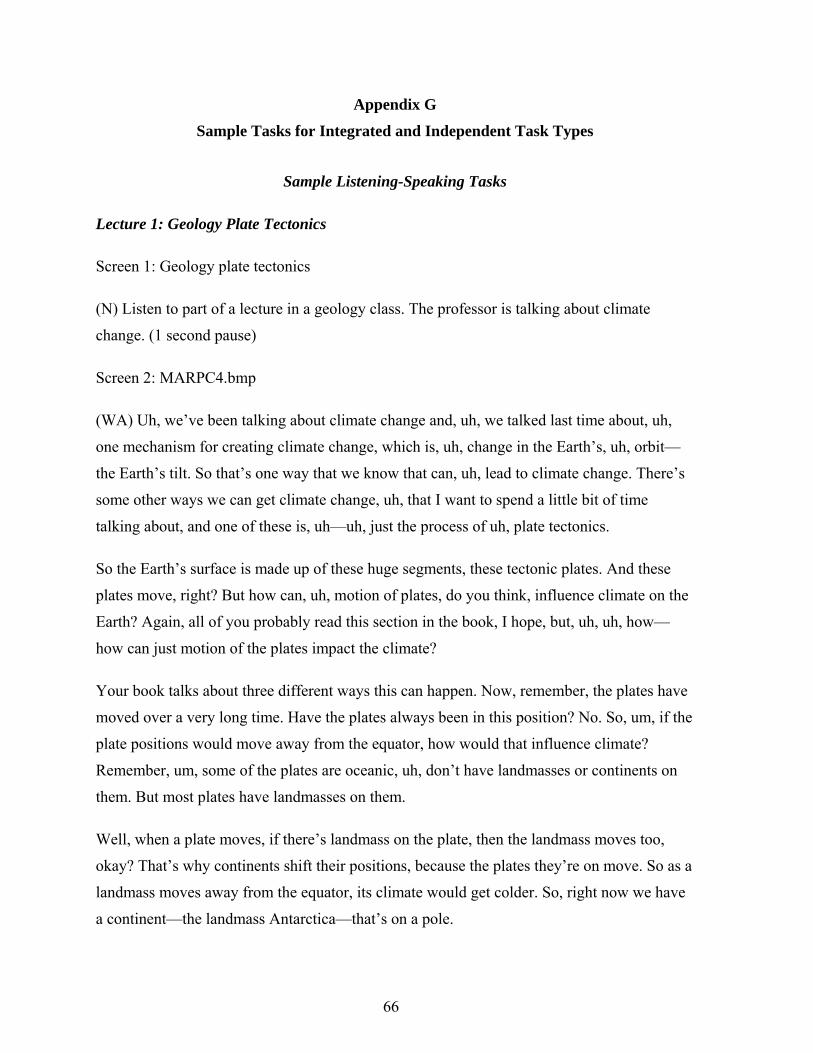
Appendix G
Sample Tasks for Integrated and Independent Task Types
Sample Listening-Speaking Tasks
Lecture 1: Geology Plate Tectonics
Screen 1: Geology plate tectonics
(N) Listen to part of a lecture in a geology class. The professor is talking about climate
change. (1 second pause)
Screen 2: MARPC4.bmp
(WA) Uh, we’ve been talking about climate change and, uh, we talked last time about, uh,
one mechanism for creating climate change, which is, uh, change in the Earth’s, uh, orbit—
the Earth’s tilt. So that’s one way that we know that can, uh, lead to climate change. There’s
some other ways we can get climate change, uh, that I want to spend a little bit of time
talking about, and one of these is, uh—uh, just the process of uh, plate tectonics.
So the Earth’s surface is made up of these huge segments, these tectonic plates. And these
plates move, right? But how can, uh, motion of plates, do you think, influence climate on the
Earth? Again, all of you probably read this section in the book, I hope, but, uh, uh, how—
how can just motion of the plates impact the climate?
Your book talks about three different ways this can happen. Now, remember, the plates have
moved over a very long time. Have the plates always been in this position? No. So, um, if the
plate positions would move away from the equator, how would that influence climate?
Remember, um, some of the plates are oceanic, uh, don’t have landmasses or continents on
them. But most plates have landmasses on them.
Well, when a plate moves, if there’s landmass on the plate, then the landmass moves too,
okay? That’s why continents shift their positions, because the plates they’re on move. So as a
landmass moves away from the equator, its climate would get colder. So, right now we have
a continent—the landmass Antarctica—that’s on a pole.
66
So that’s dramatically influencing the climate in Antarctica. Um, there was a time when most
of the landmasses were closer to a pole; they weren’t so close to the equator. Uh, maybe 200
million years ago Antarctica was attached to the South American continent, oh and Africa
was attached too and the three of them began moving away from the equator together.
So that can be some influences on climate change; now we just happen to have a lot of
landmass near the equator. So it makes those areas warmer. Um, so that can influence
climate—is the position of the landmass relative to the equator.
Now, why is Flagstaff, Arizona wetter than Phoenix, Arizona? It’s in the mountains. The
elevation. So the elevation of the landmass on top of a plate is going to influence climate as
well. And that brings me to another way—the second way plate movement affects climate.
Remember how mountains form? You have two plates moving toward each other. Like, it
can be two oceanic plates coming together, where one of them moves under the other. Or it
can be two continental plates colliding. Either way, sediment and volcanic rock and parts of
the earth’s crust, uh, they all can get pushed upward, and you get a mountain. And this
affects climate.
Why do the Sierra Mountains get so much snow? Because they’re high, and as the air masses
move across the continent, they raise up on the Sierra Nevada and the moisture condenses. It
cools and falls out as precipitation. So, um, that’s a plate tectonics principle.
So plate tectonics is what’s created that climate, relative to landmasses. Same thing happens,
uh, in the Himalayas. That was where two continental plates collided. Two continents on
separate plates. Um, when this, uh, Indian, uh, uh, plate collided with the Asian plate, it
wasn’t until then that we created the Himalayas. When we did that, then we started creating
the type of cold climate that we see there now. Wasn’t there until this area was uplifted.
So again, that’s something else that plate tectonics plays a critical role in. Now these
processes are relatively slow; the, uh, Himalayas are still rising, but on the order of
millimeters per year. So they’re not dramatically influencing climate on your—the time scale
of your lifetime. But over the last few thousands of—tens of thousands of years, uh—
hundreds of thousands of years—yes, they’ve dramatically influenced it.
67
Uh, another important thing—number three—on how plate tectonics have influenced climate
is how they’ve influenced—we talked about how changing land masses can affect
atmospheric circulation patterns, but if you alter where the land masses are connected, it can
impact oceanic, uh, uh, uh, circulation patterns.
And a good example most recently is Antarctica.
Remember it was originally attached to both South America and Africa? And after the
three—this huge landmass started moving south, the Antarctica plate split off, and that
opened up circulation between it and the other two. That’s when we started to get . . . when
Antarctica dramatically cooled off is when it separated, uh, from the other continents. Later
on, of course, you had the African plate splitting off from the South American one.
Um, so, uh, these other processes, if—if we were to disconnect North and South America . . .
right through the middle, say, through Panama . . . that would dramatically influence climate
in North and South America—probably the whole globe. So suddenly now as the two
continents gradually move apart, you can have different circulation patterns in the ocean
between the two. So, uh, that might cause a dramatic change in climate if that were to
happen, just as we’ve had happen here in Antarctica to separate, uh, from South America.
So again, plate tectonics—not in your lifetimes—influences climate, but over long-term
scales dramatically influences climate by those three different things. We have these different
kinds of plate movements and then, uh, where the position is relative to the equator, uh, you
get the influence on topography, and the influence on, uh, uh, oceanic circulation patterns. So
those are all critical factors for influencing climate.
Screen 3: Now get ready to answer the questions. You may use your notes to answer.
Directions: Read the question below and write a response based on the information in the
lecture. Typically an effective response will be between 126 and 200 words.
Question: Describe the three types of plate movement discussed by the professor, and explain
how each movement can influence climate on Earth, using examples from the lecture.
68
Sample Reading-Writing Tasks
Dance
The revolutionary force of fresh ideas known as “modern dance,” which developed at
the start of the twentieth century, was not just about how dancers were supposed to move; it
was also about how art should be made and who should make it. In the West, dance as a
serious theater art had always been a male-dominated, group endeavor requiring the
contributions of hundreds of individuals (from dancers and musicians to carpenters and
stagehands) and substantial outlays of money. There was virtually no way to practice the art
of dance, either as a dancer or a choreographer, outside the large ballet companies. Like most
large enterprises, especially those that rely on the support of the wealthy and powerful, ballet
companies tended to resist change.
Ballet was unique in one way; although its dominant institutions were in the hands of
men, the stars of the ballet stage were women. In no other nineteenth-century enterprise,
artistic or otherwise, did women play so significant a role as they did in classical ballet.
Behind the scenes, it is true, men remained in charge. Even the most acclaimed ballerinas
danced, quite literally, to the tunes of men. With rare exceptions, men composed the music
and the librettos, devised and staged the dances, collected and disbursed the money, and, as
ballet masters and critics, set the standards and shaped the images that the dancers embodied
onstage and off. A ballerina might express her personality in her dancing, but that personality
was expressed through companies owned and managed by men. Nevertheless, dance was one
area of public endeavor in nineteenth-century Europe where women’s talents were not only
prized but idolized. The ballerinas whom audiences cheered were well rewarded; they had
both money and fame. It is not surprising that they did not separate themselves from the
institutions and traditions that had nurtured them to strike out on their own by creating
dances of a purely personal inspiration under conditions of their choosing.
When agitation for this kind of personal freedom began, it came not from within the
ballet establishment, but from women like Loїe Fuller at the Folies-Bergère in Paris, who
designed, choreographed, and organized her own dance show. The goal of these women was
unfettered self-expression through body movement. The freedom they won for themselves
has invigorated theatrical dance in the West, including ballet, ever since.
The women who created modern dance were asserting for themselves something that
poets and painters in the West had come to take for granted by the end of the nineteenth
69
century: the right to follow personal inspiration without following the tastes of some private
or institutional patron. This right was inherent in the cultural phenomenon known as
Romanticism that began in Europe toward the end of the eighteenth century. Although
Romanticism meant different things at different times to different people, common to all its
manifestations was an emphasis on the individual as opposed to society, on feelings and
intuition as opposed to rationality and calculation, on an almost mystical faith in the ability of
an inspired artist to perceive universal truths and to communicate those truths to others.
Romanticism had a built-in bias against the status quo; the artist needed no official sanction
for his or her genius and could expect incomprehension and resistance from the institutions
that society had set up to monitor “good taste” in the arts. William Wordsworth, who
challenged accepted taste in English poetry at the beginning of the nineteenth century, urged
would-be poets to look within for their justification: “You feel strongly, trust those feelings,
and your poem will take its shape and proportions as a tree does from the vital principle that
actuates it.” If the word “poem” is changed to “dance,” you have the recipe that the pioneer
of modern dance, Isadora Duncan, followed in her seminal career.
Directions: Read the question below. You have 25 minutes to plan, write, and revise your
response. Typically an effective response will be between 175 and 250 words.
Question: Explain how modern dance differed from classical ballet.
Sample Independent Writing Tasks
Directions: Read the question below. You have 30 minutes to plan, write, and revise your
essay. Typically an effective response will contain a minimum of 300 words.
Question: Some people prefer to spend their free time outdoors. Other people prefer to spend
their leisure time indoors. Would you prefer to be outside or would you prefer to be inside for
your leisure activities? Use specific reasons and examples to explain your choice.
70
Appendix H
Scoring Rubrics for Integrated and Independent Speaking Tasks
Integrated Writing Task Scoring Rubric: Listening/Writing Rubric
5 A response at this level
• amply and accurately discusses all key points required by task
• is well organized
• displays accurate and appropriate sentence formation and word choice; response may
have occasional minor grammatical or lexical errors
4 A response at this level
• accurately discusses most key points required by task, though some key points may
not be fully elaborated; response may have minor inaccuracies/distortion of
information; and is generally well organized; and
• displays generally accurate and appropriate sentence formation and word choice;
response may have minor errors and some imprecision and/or unidiomatic language
use and/or imprecise connections
3 A response at this level
• presents most key points, though some key points may be incomplete, inaccurate, or
unclear; and
• demonstrates some sense of organization; and
• may display inconsistent facility in sentence formation and word choice that may
produce unclarity and occasionally obscure meaning
2 A response at this level
• mentions some key points, though many key points are significantly incomplete,
inaccurate, or unclear; and/or
71
• may display consistent infacility in sentence formation and word choice that produces
unclarity and that may interfere with meaning
1 A response at this level
• may be incoherent with respect to the task; or
• may contain little or no mention of key points; or
• may fail to connect points mentioned to required task; or
• may contain pervasive language errors that make it difficult for reader to derive
meaning at all
Integrated Writing Task Scoring Rubric: Reading/Writing Rating
Score point 5
A response at this level has all of the following qualities:
Language
• Syntax and word forms generally accurate and idiomatic, though there may be
occasional minor errors; meaning is clear.
• A range of vocabulary and phrasing and complexity of clause and sentence types
appropriate to the task
• Appropriate use of own language and language from source text
Discourse
• Organization effective in response to the task
Content
• Principal ideas presented accurately with sufficient and accurately connected key
supporting points/elaboration as required to fulfill the task effectively
Score point 4
A response at this level has all of the following qualities:
72
Language
• Syntax and word forms generally accurate, with noticeable minor errors and
unidiomatic expressions that do not interfere with meaning
• Vocabulary range and structural complexity generally appropriate to the task
• Generally appropriate use of own language and language from source text
Discourse
• Organization generally effective in response to the task
Content
• Principal ideas presented accurately as required by the task; one or two key
supporting points/details/elaboration may be omitted, or be misrepresented, or be
somewhat inexplicit or inexplicitly connected
Score point 3
A response at this level has all of the following qualities:
Language (Most of the text is comprehensible)
• Inconsistent facility and/or unidiomatic expression in sentence formation or word
choice that may occasionally obscure meaning
• Efforts at paraphrasing present but do not move sufficiently away from exact
wordings and/or structures of the text, or
• Efforts at paraphrasing may result in a number of syntactic and word-form errors, but
meaning is not obscured in these instances
Discourse
• Organization is present in response to the task
• Connections between and among some ideas may be inferable but are not sufficiently
explicit
73
Content
• Principal ideas mentioned, some of which are supported accurately with key
supporting points/elaboration; other support/elaboration may be absent or obscured
by weaknesses in language.
Score point 2
A response at this level has all of the following qualities:
Language (Some of the text is comprehensible)
• Syntax and word forms often inaccurate and may often obscure meaning, or
• Vocabulary and sentence structures noticeably limited, imprecise, and/or unidiomatic,
or
• Efforts at paraphrasing usually unsuccessful, or
• Very limited attempts at paraphrasing
Discourse
• Attempts at organization in response to the task may be only partially successful, or
• Connections between and among ideas are sometimes unsuccessful
Content
• Principal ideas and key supporting points required by the task are only partially
present or are inaccurately represented, or
• Support for principal ideas may be inadequate.
Score point 1
A response at this level has all of the following qualities:
Language
• Errors in sentences, phrases, word choice, and word forms are pervasive, or
• Reader often struggles to derive meaning, or
74
• Text too brief or too borrowed from source text to allow for judgment of language
proficiency
Discourse
• Little or no evidence of organization in response to the task, or
• Little or no evidence of coherent connections between and among ideas
Content
• Little or no evidence present of principal ideas and key supporting points required by
the task
Independent Writing Task Scoring Rubric
5 An essay at this level
• effectively addresses the writing task
• is well organized and well developed
• uses clearly appropriate details to support a thesis or illustrate ideas
• displays consistent facility in the use of language
• demonstrates syntactic variety and appropriate word choice, though it may have
occasional errors
4 An essay at this level
• may address some parts of the task more effectively than others
• is generally well organized and well developed
• uses details to support a thesis or illustrate an idea
• displays facility in the use of the language
• demonstrates some syntactic variety and range of vocabulary, though it will probably
have occasional errors
75
3 An essay at this level
• addresses the writing topic adequately, but may slight parts of the task
• is adequately organized and developed
• uses some details to support a thesis or illustrate an idea
• demonstrates adequate but possibly inconsistent facility with syntax and usage
• may contain some errors that occasionally obscure meaning
2 An essay at this level may reveal one or more of the following weaknesses
• inadequate organization or development
• inappropriate or insufficient details to support or illustrate generalizations
• a noticeably inappropriate choice of words or word forms
• an accumulation of errors in sentence structure and/or usage
1 An essay at this level is seriously flawed by one or more of the following weaknesses
• serious disorganization or underdevelopment
• little or no detail, or irrelevant specifics
• serious and frequent errors in sentence structure or usage
• serious problems with focus
0 An essay will be rated 0 if it
• contains no response
• merely copies the topic
• is off-topic, is written in a foreign language, or consists only of keystroke characters.
76


![Attali(1991)_1492 [Fayard]](https://img.pdfslide.net/doc/110x75/577cdd721a28ab9e78ad0aa5/attali19911492-fayard.jpg)