Embed Size (px)
Citation preview

Michael BrownUniversity of Maryland
MSA PRESIDENTIAL ADDRESS: METAMORPHISM, SECULAR CHANGE AND GEODYNAMICS

Heat production (normalized to present-day value) vs age
Age (Ma)
Heat produ
ction
Variation of mantle potential temperature through time
Ø Secular evolution of mantle potential temperature (TP) suggests a decline of 200–300 °C since c. 3.0 Ga (petrological data from Herzberg et al., 2010, EPSL, with ages as corrected by Johnson et al., 2014, NG).
Ø Mantle TP at the start of mantle convection—after crystallization of the last magma ocean—is uncertain, but may have been ~200 °C warmer than at present (Labrosse & Jaupart, 2007, EPSL).
Ø Evolution of mantle potential temperature can be modeled either with constant surface heat flow and low present-day Urey ratio (top) or with a switch in heat-flux scaling from stagnant lid (lower heat flow) to plate tectonics (higher heat flow) at 3 Ga, 2 Ga or 1 Ga (Korenaga, 2013, AnnRev; 2017, JGR).
Plate tectonics
Plate tectonics
Stagnant lid

Aim: To evaluate variations in the thermal history of the crust using the metamorphic rock record.
Method:1. We1 compile T, P, apparent thermal gradient (T/P), and age (t ) of metamorphism for 564 localities from the Cenozoic to the Eoarchean2, although before the Neoarchean data are sparse.2. Based on temporal variations in the T/P of granulite facies (high dT/dP) metamorphism and clustering of ages of metamorphism, we define multiple thermal and, by implication, geodynamic cycles.
What about the thermal history of the crust?
1Brown & Johnson, 2018, American Mineral., 103, 181–196. Dataset updated 02-28-2018 (~24% larger).2For a few localities, we relaxed the limits for consideration (previously, if P < 1 GPa, minimum
T of ~600 °C, and if T < 600 °C, minimum P of ~1 GPa)

What do the data represent?Ø Ideally, each datum records a point on a geotherm crossed during a dynamic evolution from lower to higher (clockwise P–T–t path (CW)) or higher to lower (counter-clockwise P–T–t path (CCW)) thermal gradients.
Ø By careful selection of data, we expect to minimize errors related to the necessary assumption of synchroneity among T, P and t.
CW
CCW
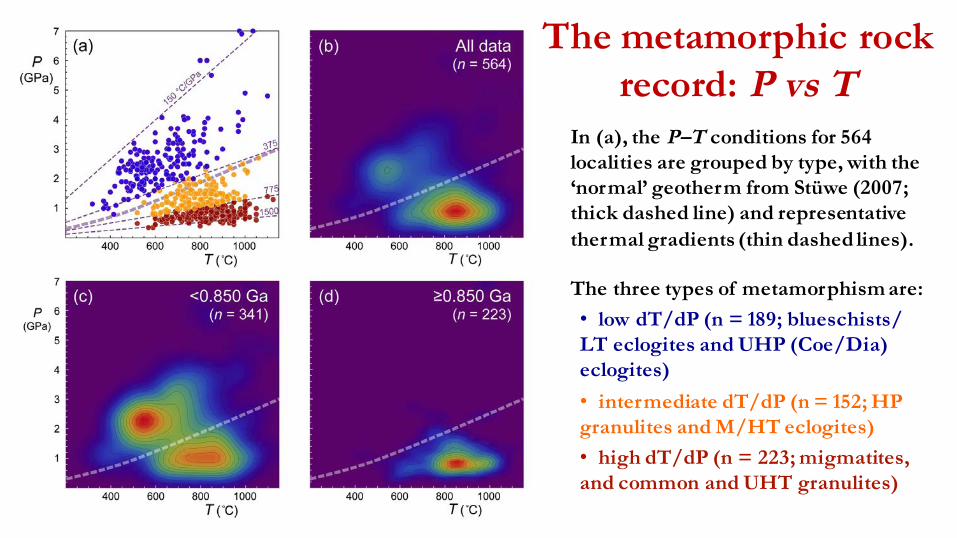
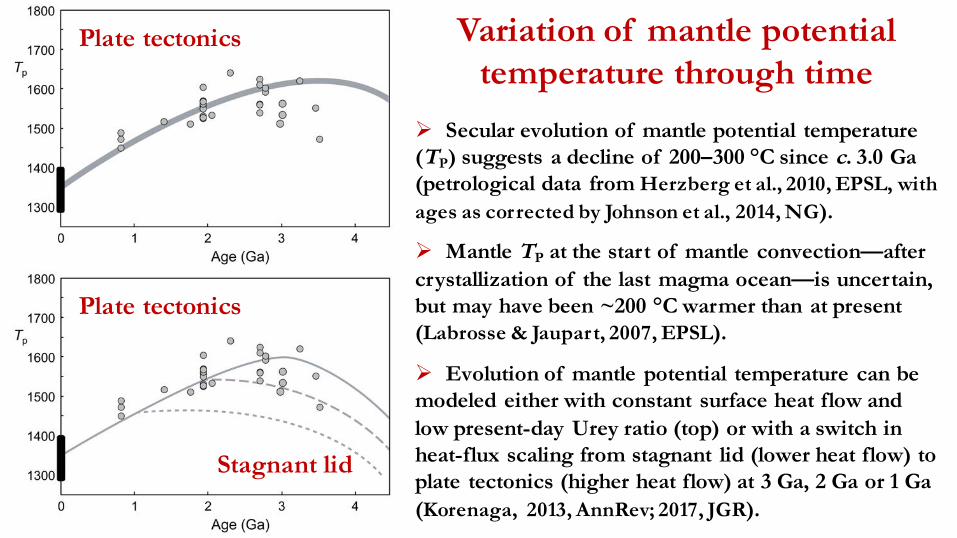
The metamorphic rock record: P vs T
In (a), the P–T conditions for 564 localities are grouped by type, with the ‘normal’ geotherm from Stüwe (2007; thick dashed line) and representative thermal gradients (thin dashed lines).
The three types of metamorphism are:• low dT/dP (n = 189; blueschists/ LT eclogites and UHP (Coe/Dia) eclogites)• intermediate dT/dP (n = 152; HP granulites and M/HT eclogites)• high dT/dP (n = 223; migmatites, and common and UHT granulites)

In (b) all data, in (c) data <850 Ma in age and in (d) data ≥850 Ma in age are contoured for density.
NB. If the so-called ‘normal’ geotherm has relevance, it only
applies to the contemporary tectonic regime!
The metamorphic rock record: P vs T

Distribution of low, intermediate and high dT/dP
metamorphic rocks older than
Jurassic

Secular change in temperature and pressure

Apparent thermal gradient (T/P) for 564 localities grouped by type of metamorphism plotted against age.
Moving means with 1 σ uncertainty (calculated every 1 Myr within a moving 300 Myr window, except for low dT/dPmetamorphism calculated every 1 Myrwithin a moving 100 Myr window).
Secular change in T/P

Why is T/P a more useful parameter than T or P ?On contemporary Earth, each type of
metamorphism is associated with a particular plate tectonic setting.
Ø low dT/dP metamorphism (blueschists/LT eclogites, and UHP (Coe/Dia) eclogites) – subduction (accretionary orogens and sutures in collisional orogens (variable P–T paths))
Ø intermediate dT/dP metamorphism (HP granulitesand MT/HT eclogites) – mountain belts (collisional orogens (CW P–T paths))
Ø high dT/dP metamorphism (migmatites, granulites and UHT granulites) – orogenic hinterlands (plateaus (high HPE/low erosion rate; CW P–T paths)/arcs and backarcs(thickening/thermal decay; CCW (rarely CW) P–T paths))

Key changes in the metamorphic record
Ø During the Neoproterozoic: The widespread appearance of low dT/dPmetamorphism records cold collision and deep continental subduction.
Ø In the Paleoproterozoic: The rare occurrence of low dT/dPmetamorphism records (local?) atypical cold collision.
Ø At the beginning of the Neoarchean: The widespread appearance of paired metamorphism and cyclicity may record the emergence of (global?) plate tectonics.
Key changes in the metamorphic record

² Low dT/dP metamorphism occurs mostly in late Neoproterozoic and Phanerozoic (collisional) orogens.² Records a change to deeper slab breakoff during collisional orogenesis, which allows subduction of continental lithosphere to and exhumation from mantle depths.
Distribution of low dT/dP rocks

Beware of myths about low dT/dP rocksIn the literature, it has been stated that:1. Lws-bearing rocks preserve a record of very low-temperature conditions in subduction zones, i.e. their formation requires abnormally low thermal gradients.2. Oceanic subduction-related rocks record Pmax <2.7 GPa whereas continental subduction-related rocks record Pmax >2.7 GPa and slightly higher prograde thermal gradients, suggesting that the mechanism and pathways of their exhumation likely differ.

Myth 1Lws-bearingMean T/P = 236 ± 64 (1σ) oC/GPaRange* of T/P = 155–357 oC/GPa
Lws-absentMean T/P = 260 ± 59 (1σ) oC/GPaRange of T/P = 133–393 oC/GPa
*excludes Anglesey Lws blueschists
Myth 2Oceanic (n = 104*) Continental (n = 84)Mean P = 2.38 ± 0.88 (1σ) GPa Mean P = 2.99 ± 1.04 (1σ) GPaRange of P = 1.0–7.0 GPa Range of P = 1.1–7.0 GPa
*excludes Anglesey Lws blueschists

In the literature, it has been stated that:1. Lws-bearing rocks preserve a record of very low-temperature conditions in subduction zones, i.e. their formation requires abnormally low thermal gradients.2. Oceanic subduction-related rocks record Pmax <2.7 GPa whereas continental subduction-related rocks record Pmax >2.7 GPa and slightly higher prograde thermal gradients, suggesting that the mechanism and pathways of their exhumation likely differ.
Each of these statements appears to be a misleading simplification!

Does low dT/dP metamorphism of oceanic rocks record subduction zone thermal gradients?
Comparison between thermal models of van Keken et al. (2018; models without shear heating) and peak P–T conditions of oceanic low dT/dP rocks (n = 105).
(a) Green lines are slab PTpaths for the uppermost oceanic crust (OC; 0.5 km below top of slab (black line is average of 56 models)) and magenta lines are lowermost OC (6.5 km into the OC).
(b) PT conditions averaged over the OC in each model (teal lines, black line is average of 56 models), i.e. assumes exhumation from any level in the crust.

Peak metamorphic conditions of oceanic low dT/dP rocks vs the temporal evolution of T in the top of the ocean crust1 for the warm Cascadia (a), intermediate Nicaragua (b), and cold Central Honshu (c) models of van Keken et al. (2018; models without shear heating).1From low P, the first two lines are for 1 and 2 Ma after subduction initiation, and thereafter the lines are for 3 to 30 Ma at 3 Ma intervals; each PT path is limited to the P at the tip of the slab at each time instant.
Comparison between thermal models for warm, intermediate and cold subduction, and peak P–T conditions of low dT/dP oceanic rocks

Comparison between thermal models for warm, intermediate and cold subduction, and peak P–T conditions of low dT/dP oceanic rocks
Van Keken et al. (2018, G3) ague for preferential exhumation of oceanic crust under relatively warm conditions, such as those encountered for young oceanic lithosphere or during the initial stages of subduction.But, might oceanic rocks with Pmax >2.5 GPa record exhumation related to cold subduction?

Why do low dT/dP rocks only appear in the geological record
since the Neoproterozoic?

Why do low dT/dP rocks only appear in the geological record
since the Neoproterozoic?

Testing hypothesis I
Sizova et al., 2012, JMG and 2014, GR
Results using a 2-D petrological–thermomechanical numerical model

Present-day
T = 100K

Why do low dT/dP rocks only appear in the geological record
since the Neoproterozoic?

Hypothesis II is based on the stability of sodic amphiboleSodic amphibole is significantly more stable in MgO-poor (≤ 11.2 wt%) compositions, and blueschists will not form in high-MgOrocks under low thermal gradients (Palin & White, 2016, NG).
Testing hypothesis IIThere is a wide range of basalt compositions in ancient greenstone belts, including more than half with MgO-poor (≤ 11.2 wt%) compositions (Condie et al., 2016, GF).
Thus, the absence of blueschistsprior to the Cryogenian is unlikely to be due an absence of suitable
rock compositions.

Cyclicity in the metamorphic rock record begins in the Neoarchean,
as suggested by the distribution of ages of metamorphism, which is
similar to the distribution of ages of magmatic crustal rocks.
Cyclicity

The Archean rock recordThe age distribution of pre-Neoarchean TTGs (Johnson et al., 2019, EPSL) and scarce pre-Neoarchean metamorphic rocks is similar, suggesting similar survival rates of both prior to the dramatic increase in preservation in the Neoarchean.

Observations1. Synchronous widespread appearance/survival of intermediate dT/dP and high dT/dPmetamorphism in the Neoarchean, recording contrasting apparent thermal gradients and suggesting ‘paired’ metamorphism. 2. Widespread appearance of voluminous granitoid and detrital zircons (e.g. Condie et al., 2011, GSAB).3. Cyclicity in metamorphic rock and magmatic/detrital zircon records.
Inferences1. Transition to global (?) continuous (?) subduction, associated with lateral plate motions, the development of ‘continental’ margin arcs and preservation of crustal rocks in collisional sutures. 2. Formation and break-up of supercratons, formation of the supercontinent Columbia.
Summary of the main features of the transition from the Mesoarchean to the Paleoproterozoic Eras

Geodynamic cycles
Cycle III
Cycle I
Cycle II
Using the moving and arithmetic means of T and T/P, and the probability density function (PDF) of age for all 564 localities, it is clear that since c. 3.0 Ga cyclic variations in the thermal history of the crust have been superimposed on secular cooling identifying 3 (or 4) geodynamic cycles.
Cf. Brown & Johnson(2018, Amer. Mineral.)

Cycle IØ Began with the widespread appearance of paired metamorphism in the Neoarchean.
Ø Was coeval with amalgamation of dispersed blocks of protocontinentallithosphere into Neoarchean supercratons.
Ø Was terminated by the progressive fragmentation of the supercratons in the early Paleoproterozoic producing the Archean cratons we recognize today.
Cycle I

Cycle IIØ Began with the progressive amalgamation of the cratons into the supercontinent Columbia in the Paleoproterozoic.Ø Extended until the breakup of the supercontinent Rodinia in the Neoproterozoic.Ø Represented a period of relative tectonic stability (the “boring billion”) and perhaps limited subduction (lower rate of production of continental crust in the Mesoproterozoic).
During most of the Proterozoic the moving means for both T and T/P exceeded the
arithmetic means, reflecting insulation of the mantle beneath the quasi-integrated
lithosphere of Columbia and, after a limited reorganization, Rodinia.
Cycle II

Limited subductionglobally during
cycle II is suggested by the low volume
of Mesoproterozoiccrust
The map claims to represent the age of the basement (i.e. all the
sediments were removed to display the inferred age).
W. Mooney (Pers. Comm., Oct. 2017)

*Volumes from W. Mooney (Pers. Comm., 2017)
Volume* of crust normalized by length
of Eon/EraAr Eon - 5x10⁵ km3 Myr-1
PP Era - 2x10⁶ km3 Myr-1
MP Era - 1x10⁶ km3 Myr-1
NP Era - 2x10⁶ km3 Myr-1
Ph Eon - 5x10⁶ km3 Myr-1

Hotter mantle during the Proterozoic is supported by the
temporality of massif-type anorthosites
Massif type anorthosites are the most volumetrically abundant of terrestrial varieties and are almost entirely restricted in age to the Proterozoic Eon, although most of the volume (taking area as a proxy for volume) was emplaced during the Mesoproterozoic.
Ashwal (2010, Can. Min.)

Laurentia, Baltica, Siberia
The Goldilocks period
A supercontinent may insulate the ambient mantle (blue), creating a warm anomaly (red), which may destabilize the supercontinent and cause it to attempt to break apart.
East Gondwana
Conditions ‘just right’ to generate anorthositealong the convergent margin of Laurentiaand Baltica in Columbia
Site of anorthosite
generation and emplacement
Continental reconstructions courtesy of S. Pisarevsky, Pers. Comm., Oct. 2018
Modified after Lenardic (2017, NG)

Cycle III
Cycle III
Ø Begins with the steep decline in thermal gradients of high dT/dP metamorphism to their lowest value, although T remains relatively high, and the appearance of low dT/dP metamorphism in the rock record.
Ø Extends to another steep decline in thermal gradient of high dT/dPmetamorphism associated with the breakup of Pangea and the start of a possible fourth cycle at c. 0.175 Ga.
Thermal gradients for high dT/dPmetamorphism show a rise to a second peak at the end of the Variscides during
the formation of Pangea, again reflecting insulation of the mantle.

Although variable, the mean T/P for high dT/dP metamorphism (1107 ±246 (1σ)) is consistent with:
1. constant surface heat flow since the Neoarchean (Korenaga, 2013, AnnRev; 2017, JGR);
and,
2. the post-orogenic thermal evolution of Archean orogens and stabilization of cratons by intracrustaldifferentiation (Jaupart & Mareschal, 2015, EPSL; Jaupart et al., 2016, Lithos).
One last point

Conclusions1. The limited occurrence of high and intermediate dT/dP metamorphism before the late Mesoarchean suggests that suitable tectonic environments to generate these types of metamorphism were not widely available or rates of preservation were low.
2. The widespread appearance of high dT/dP metamorphism in the Neoarchean and low dT/dP metamorphism in the late Neoproterozoic identify changes in global geodynamics, first, as secular cooling overwhelms heat production, from dominantly stagnant lid tectonics to widespread subduction and plate tectonics, and second, after mantle TPdropped below 100 °C warmer than present, to deeper slab breakoff during collisional orogenesis.