Embed Size (px)
Citation preview
Erasmus University Rotterdam
M.Sc. in Maritime Economics and Logistics
2015/2016
Autonomous Cargo Vessels: Analysis for a Future
Operations Model
By
Adar Granot
Copyright © Adar Granot
i
Acknowledgements
First I would like to thank the people which had a direct contribution to this
thesis. I am aware that your time was scarce, however, it did not prevent you
from investing some of your time and knowledge on a topic which we share
our enthusiasm. Furthermore, I would like to thank Prof. Albert Veenstra, from
day one, you provided the best supervision; on one hand, you provided me
with the freedom to bring my thoughts and ideas into play, and on the other,
knew when to intervene and navigate the ship towards the right course. Your
straightforward comments allowed me to focus on the key issues without
spending precious time chasing dead-end paths.
Furthermore, I would like to thank the MEL staff; Renee, Mariem, Felicia,
Martha. Although the thesis is the final step in our joint path, it is the product
of hard work that could not have been done without you.
Last but definitely not least, I would like to state my deepest gratitude to my
family. Although scattered around the globe, close contact and daily support
has helped immensely on this lone journey. Oded, Omer, and Gigi, each of
you has been an inspiration in his own unique way. I always believe that I am
the Mazaliko in the family, as every day I get to learn from your thoughts, ideas
and recommendations, each with his own personal way. To my parents, it is
only appropriate that I acknowledge you last, although you are the one who
come to mind. Your endless support, love and pure common sense have never
ceased to amaze me. Providing the best advices at the most crucial times,
along with short visits exactly when such are needed. Expressing my gratitude
for you both would require alone a book length. Thank you for believing,
educating, and pushing, to gain knowledge and to “never be a stranger in a
foreign country”. I can only aspire to follow your footsteps, create, educate,
and provide value as you have done in your life so far.
ii
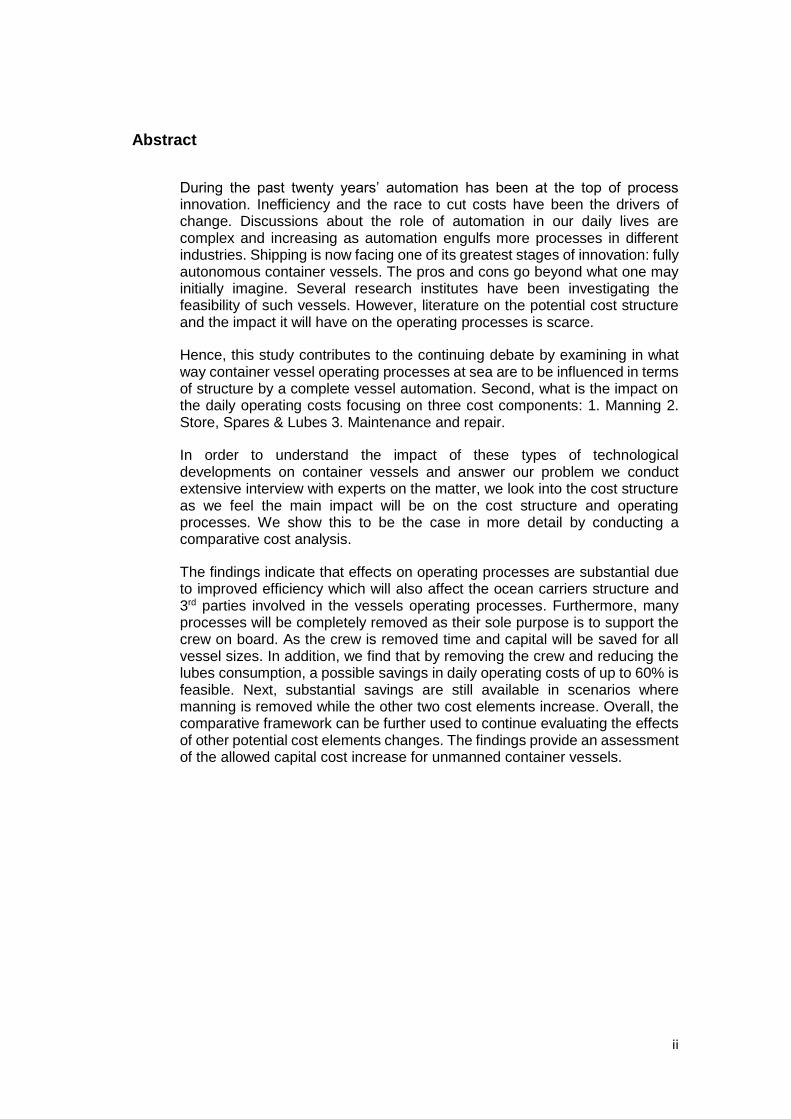
Abstract
During the past twenty years’ automation has been at the top of process innovation. Inefficiency and the race to cut costs have been the drivers of change. Discussions about the role of automation in our daily lives are complex and increasing as automation engulfs more processes in different industries. Shipping is now facing one of its greatest stages of innovation: fully autonomous container vessels. The pros and cons go beyond what one may initially imagine. Several research institutes have been investigating the feasibility of such vessels. However, literature on the potential cost structure and the impact it will have on the operating processes is scarce.
Hence, this study contributes to the continuing debate by examining in what way container vessel operating processes at sea are to be influenced in terms of structure by a complete vessel automation. Second, what is the impact on the daily operating costs focusing on three cost components: 1. Manning 2. Store, Spares & Lubes 3. Maintenance and repair.
In order to understand the impact of these types of technological developments on container vessels and answer our problem we conduct extensive interview with experts on the matter, we look into the cost structure as we feel the main impact will be on the cost structure and operating processes. We show this to be the case in more detail by conducting a comparative cost analysis.
The findings indicate that effects on operating processes are substantial due to improved efficiency which will also affect the ocean carriers structure and 3rd parties involved in the vessels operating processes. Furthermore, many processes will be completely removed as their sole purpose is to support the crew on board. As the crew is removed time and capital will be saved for all vessel sizes. In addition, we find that by removing the crew and reducing the lubes consumption, a possible savings in daily operating costs of up to 60% is feasible. Next, substantial savings are still available in scenarios where manning is removed while the other two cost elements increase. Overall, the comparative framework can be further used to continue evaluating the effects of other potential cost elements changes. The findings provide an assessment of the allowed capital cost increase for unmanned container vessels.
iii
Table of Contents
Acknowledgements ................................................................................................... i
Abstract .................................................................................................................... ii
List of Tables ............................................................................................................ v
List of Figures .......................................................................................................... vi
List of Abbreviations ................................................................................................ vii
1. Introduction ....................................................................................................... 1
1.1 Background ............................................................................................. 1
1.2 Problem identification ............................................................................ 2
1.4 Research question .................................................................................. 3
2. Literature review ................................................................................................ 7
2.1 Liner Shipping ............................................................................................... 7
2.1.1 Ocean carrier structure ...................................................................... 8
2.1.2 Vessel cost elements ........................................................................ 10
2.1.3 Vessel productivity ........................................................................... 10
2.2 Task analysis ........................................................................................ 11
2.3 Operating processes ............................................................................ 12
2.4 Ground for automation ......................................................................... 15
2.4.1 The human element .............................................................................. 15
2.4.2 Design .................................................................................................... 17
2.4.3 Maintenance, repair, and lubricating oil costs .................................... 21
2.4.4 Crewing cost ......................................................................................... 22
2.5 Automation ............................................................................................ 23
2.6 Challenges of automation .................................................................... 24
2.6.1 Trust....................................................................................................... 25
2.6.2 Cyber security ....................................................................................... 25
2.6.3 Legal framework ................................................................................... 25
2.6.4 Maintenance .......................................................................................... 26
2.7 Literature review summery .................................................................. 26
3. Methodology ................................................................................................... 29
3.1 Hypothesis ............................................................................................ 29
3.2 Task analysis approach ........................................................................ 30
3.3 Interview approach ............................................................................... 30
3.4 Cost structure model ............................................................................ 31
3.5 Data ........................................................................................................ 33
3.6 Cost comparison analysis .................................................................... 34

iv
3.7 Scenario portrayal ................................................................................ 35
3.8 Methodological limitations ................................................................... 36
4. Results and data analysis ............................................................................... 37
4.1 Task analysis results ............................................................................ 37
4.2 Cost model results ................................................................................ 40
4.2.1 Base scenario results ........................................................................... 40
4.2.2 Scenario I results .................................................................................. 44
4.2.3 Scenario II results ................................................................................. 46
4.2.4 Scenario III results ................................................................................ 47
4.2.4.1 Sub-scenarios assumptions ............................................................ 47
4.2.4.2 Sub-scenarios results ....................................................................... 48
4.3 Summary of the results ........................................................................ 51
5. Conclusions .................................................................................................... 53
5.1 Main Findings ........................................................................................ 53
5.2 Limitations of the research .................................................................. 55
5.3 Areas for further research .................................................................... 56
6. Bibliography .................................................................................................... 59
v
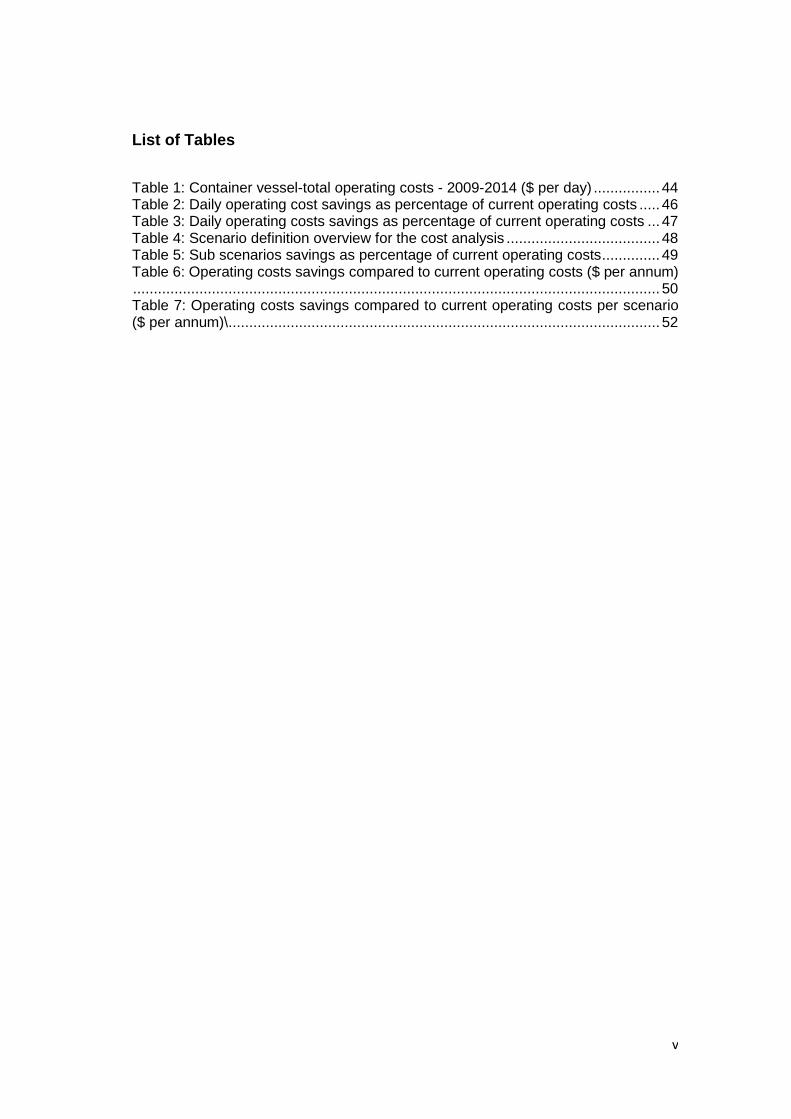
List of Tables
Table 1: Container vessel-total operating costs - 2009-2014 ($ per day) ................ 44 Table 2: Daily operating cost savings as percentage of current operating costs ..... 46 Table 3: Daily operating costs savings as percentage of current operating costs ... 47 Table 4: Scenario definition overview for the cost analysis ..................................... 48 Table 5: Sub scenarios savings as percentage of current operating costs .............. 49 Table 6: Operating costs savings compared to current operating costs ($ per annum) ............................................................................................................................... 50 Table 7: Operating costs savings compared to current operating costs per scenario ($ per annum)\ ........................................................................................................ 52
vi
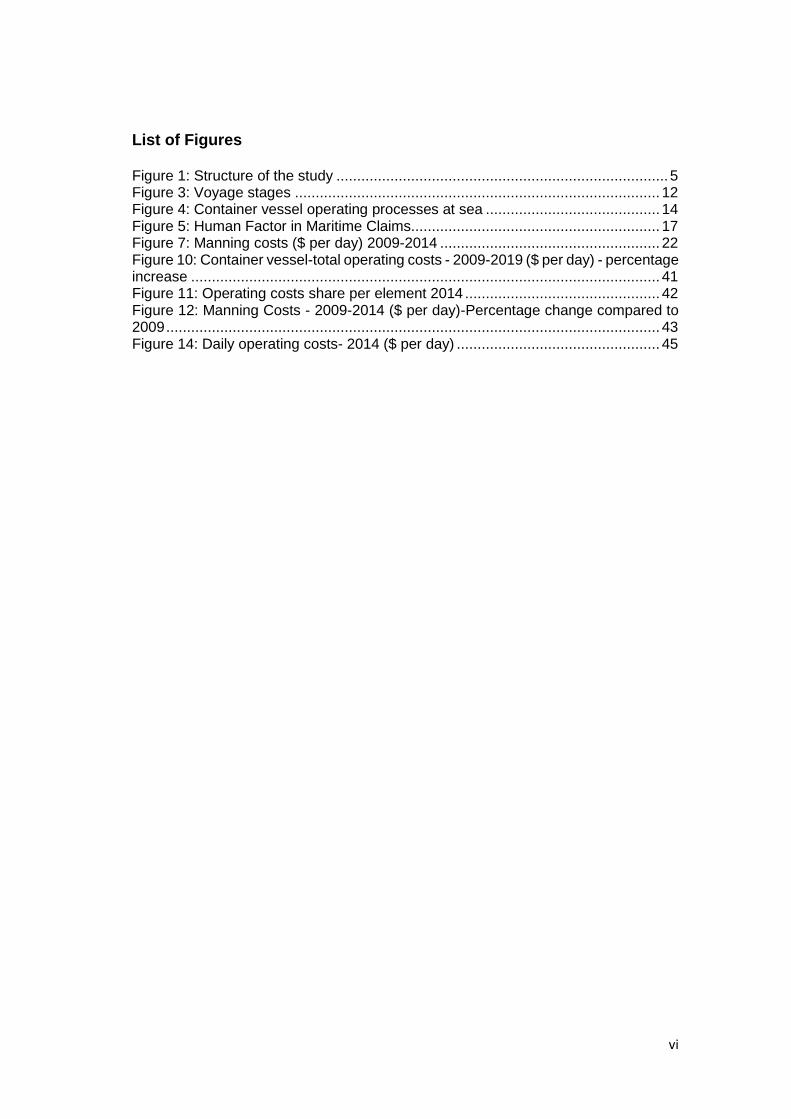
List of Figures Figure 1: Structure of the study ................................................................................ 5 Figure 3: Voyage stages ........................................................................................ 12 Figure 4: Container vessel operating processes at sea .......................................... 14 Figure 5: Human Factor in Maritime Claims............................................................ 17 Figure 7: Manning costs ($ per day) 2009-2014 ..................................................... 22 Figure 10: Container vessel-total operating costs - 2009-2019 ($ per day) - percentage increase ................................................................................................................. 41 Figure 11: Operating costs share per element 2014 ............................................... 42 Figure 12: Manning Costs - 2009-2014 ($ per day)-Percentage change compared to 2009 ....................................................................................................................... 43 Figure 14: Daily operating costs- 2014 ($ per day) ................................................. 45
vii
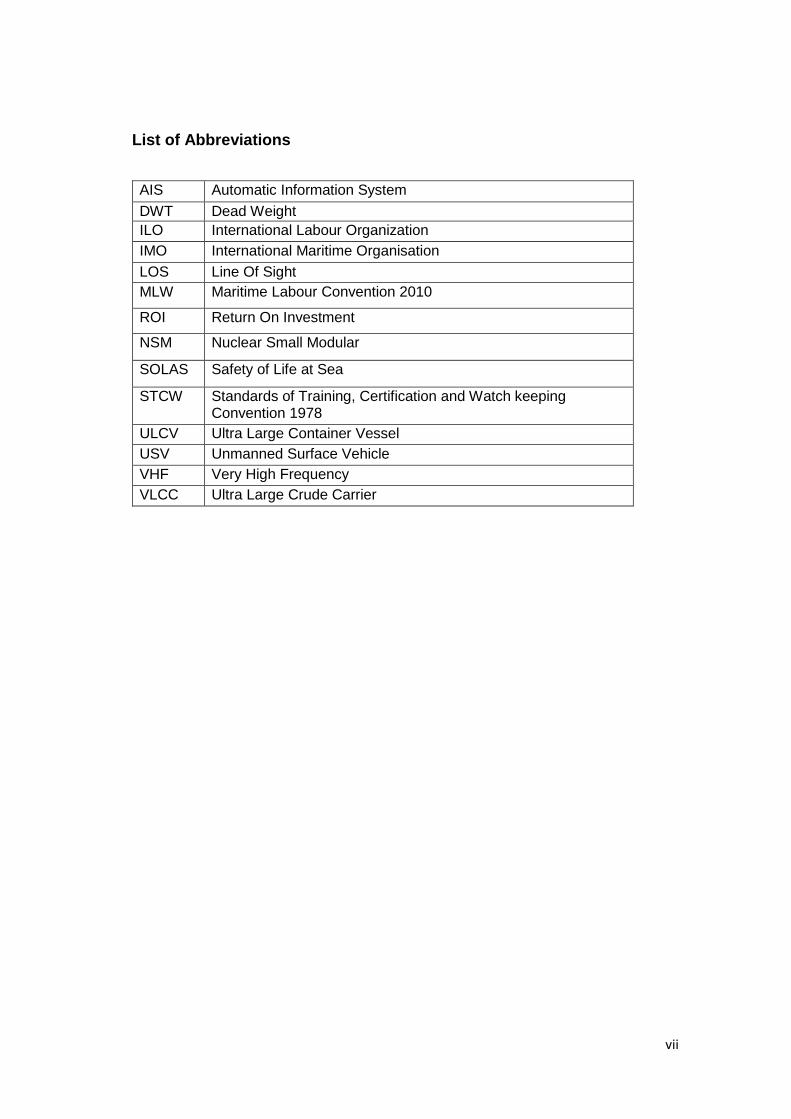
List of Abbreviations
AIS Automatic Information System
DWT Dead Weight
ILO International Labour Organization
IMO International Maritime Organisation
LOS Line Of Sight
MLW Maritime Labour Convention 2010
ROI Return On Investment
NSM Nuclear Small Modular
SOLAS Safety of Life at Sea
STCW Standards of Training, Certification and Watch keeping Convention 1978
ULCV Ultra Large Container Vessel
USV Unmanned Surface Vehicle
VHF Very High Frequency
VLCC Ultra Large Crude Carrier
1
1. Introduction
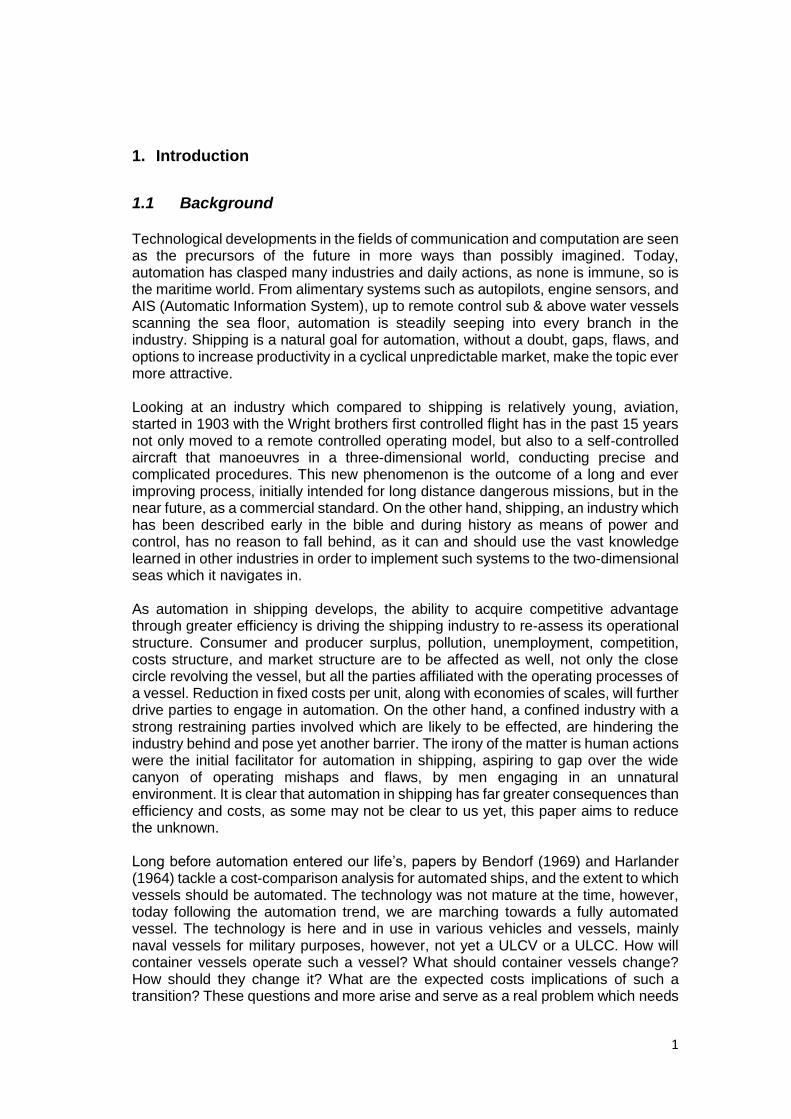
1.1 Background Technological developments in the fields of communication and computation are seen as the precursors of the future in more ways than possibly imagined. Today, automation has clasped many industries and daily actions, as none is immune, so is the maritime world. From alimentary systems such as autopilots, engine sensors, and AIS (Automatic Information System), up to remote control sub & above water vessels scanning the sea floor, automation is steadily seeping into every branch in the industry. Shipping is a natural goal for automation, without a doubt, gaps, flaws, and options to increase productivity in a cyclical unpredictable market, make the topic ever more attractive.
Looking at an industry which compared to shipping is relatively young, aviation, started in 1903 with the Wright brothers first controlled flight has in the past 15 years not only moved to a remote controlled operating model, but also to a self-controlled aircraft that manoeuvres in a three-dimensional world, conducting precise and complicated procedures. This new phenomenon is the outcome of a long and ever improving process, initially intended for long distance dangerous missions, but in the near future, as a commercial standard. On the other hand, shipping, an industry which has been described early in the bible and during history as means of power and control, has no reason to fall behind, as it can and should use the vast knowledge learned in other industries in order to implement such systems to the two-dimensional seas which it navigates in.
As automation in shipping develops, the ability to acquire competitive advantage through greater efficiency is driving the shipping industry to re-assess its operational structure. Consumer and producer surplus, pollution, unemployment, competition, costs structure, and market structure are to be affected as well, not only the close circle revolving the vessel, but all the parties affiliated with the operating processes of a vessel. Reduction in fixed costs per unit, along with economies of scales, will further drive parties to engage in automation. On the other hand, a confined industry with a strong restraining parties involved which are likely to be effected, are hindering the industry behind and pose yet another barrier. The irony of the matter is human actions were the initial facilitator for automation in shipping, aspiring to gap over the wide canyon of operating mishaps and flaws, by men engaging in an unnatural environment. It is clear that automation in shipping has far greater consequences than efficiency and costs, as some may not be clear to us yet, this paper aims to reduce the unknown.
Long before automation entered our life’s, papers by Bendorf (1969) and Harlander (1964) tackle a cost-comparison analysis for automated ships, and the extent to which vessels should be automated. The technology was not mature at the time, however, today following the automation trend, we are marching towards a fully automated vessel. The technology is here and in use in various vehicles and vessels, mainly naval vessels for military purposes, however, not yet a ULCV or a ULCC. How will container vessels operate such a vessel? What should container vessels change? How should they change it? What are the expected costs implications of such a transition? These questions and more arise and serve as a real problem which needs

2
attention. Whether automated cargo vessels will arrive or not is no longer the issue, the true questions which arise are when they will arrive, how we will operate them, and how they will impact costs; our research will focus on the last.
1.2 Problem identification As technology develops, countries around the globe have understood the immense potential automated systems withhold. Rolls-Royce announced their project for developing an unmanned cargo vessel which is monitored and controlled when such is required, along with other vessels, from a central location, and is expected to set sail by 2020. The UN’s MUNIN project which aims in developing operating and technical concepts of unmanned vessels, while investigating the legal, economical, and technical aspects of the concept. Their approach was using a conventional dry bulk carrier. The project first sets the vision of the different technical units required for such vessel to be automated. Second, presents a cost benefit analysis, legal and liability analysis, and safety and security analysis to present the benefits of unmanned shipping. Third, they describe the technical units they have used in the project and the obtained capabilities of each along the project. They conclude the crewing cost is a large factor of dry bulk shipping cost and present their view of the limitations of unmanned shipping (Jonas Aamodt Moræus et al. (2016)). MARIN institute started experiments to assess key stages towards autonomous vessels in terms of safety, control, and design. Although currently the experiments are being drafted, the analyses are foreseen to materialize this coming year. As the world advances towards automation, the consequences for the shipping industry are yet to be known. Considering the immense effects and potential automation holds for fleet operating processes and the shipping world as a whole, making the topic an important and relevant one to be researched.
The challenge the industry faces is not only looking at the current cost structure of liner shipping and see if or how the coefficients of the components will change, but also figuring whether new cost components need to be accounted for. Furthermore, an important field of research is ship operating processes, how they will change, and the costs to be gained or lose from these changes. Before we dive into the topic we must first understand the definition and scope of the term ‘operating processes’. Operating processes refer to the set of processes involved in running a vessel which include manning, maintenance, and steering, thus we have the narrow scope of the technical processes required to run the vessel. However, in this research we broaden the definition and include cargo handling aboard the ship as part of the operating processes. We do so as temperature control, lashing, and other cargo handling processes require the crew intervention, and need to be addressed when discussing an unmanned vessel.
To our knowledge, no academic literature which quantifies the impact of automation on liner shipping operating processes and operating cost structure exists. This study aims to fill the gap in literature.
3
1.3 Motivation The motivation for the research is first and foremost the passion with the topic of automation. Except following our passion and a true desire to leave an impact, we also approach a topic which is well covered and discussed from a technical aspect, but less from the operational and financial aspects of it. By conducting this research, we hope to provide a genuine contribution to the academic and shipping world, while initiating an important conversation for a system yet to come, but well into planning. Furthermore, it is a topic which we would like to peruse a PhD at.
1.4 Research question With reference to the identified problem, this study is guided by the following main research question:
What is the impact of the introduction of automated vessels on liner shipping operations?
The main research question contains three elements. The first, it takes into consideration the role of automation as a facilitator for change on operating processes. Second, operating processes of automated vessels differ from operating processes of non-automated vessels. Third, operating processes for various companies are relatively the same. In order to provide a profound and comprehensive answer to the research question, the following sub-questions need to be answered:
1. What are the current mechanisms which define the container vessel operating process? (Section II)
2. How will these processes change for an automated vessel? (section II+IV)
3. What are the cost implications of autonomous fleet operating processes? (section
IV)
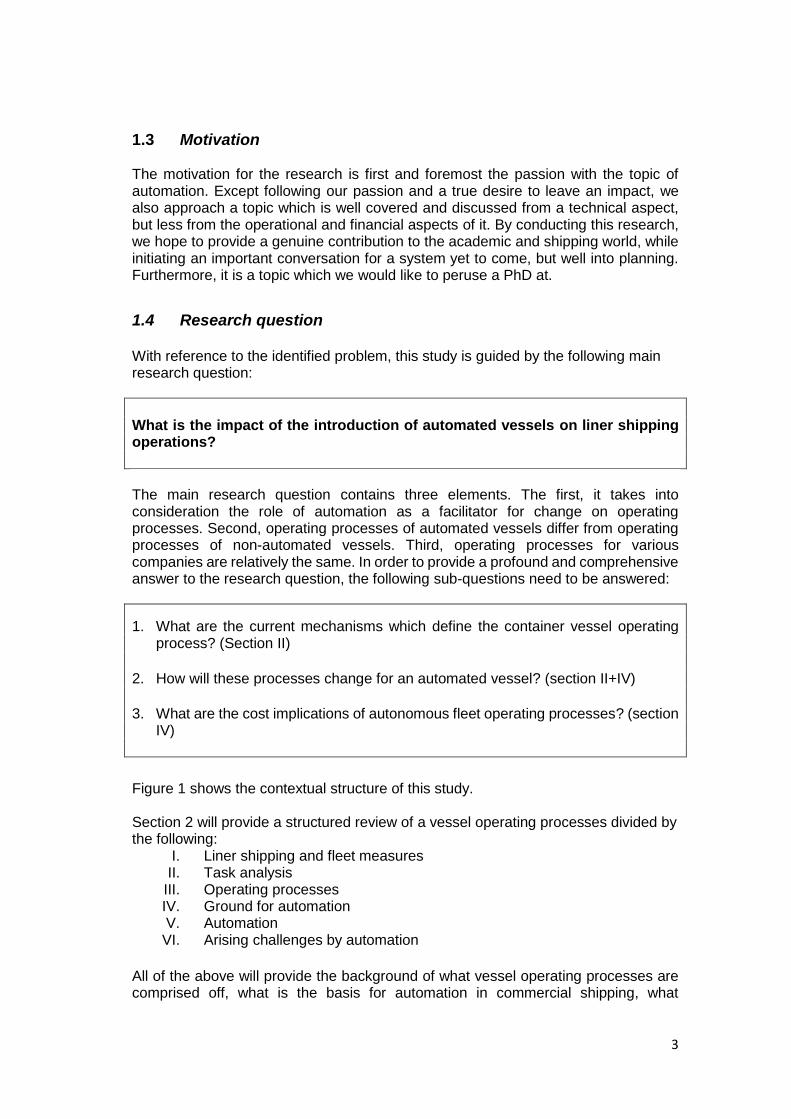
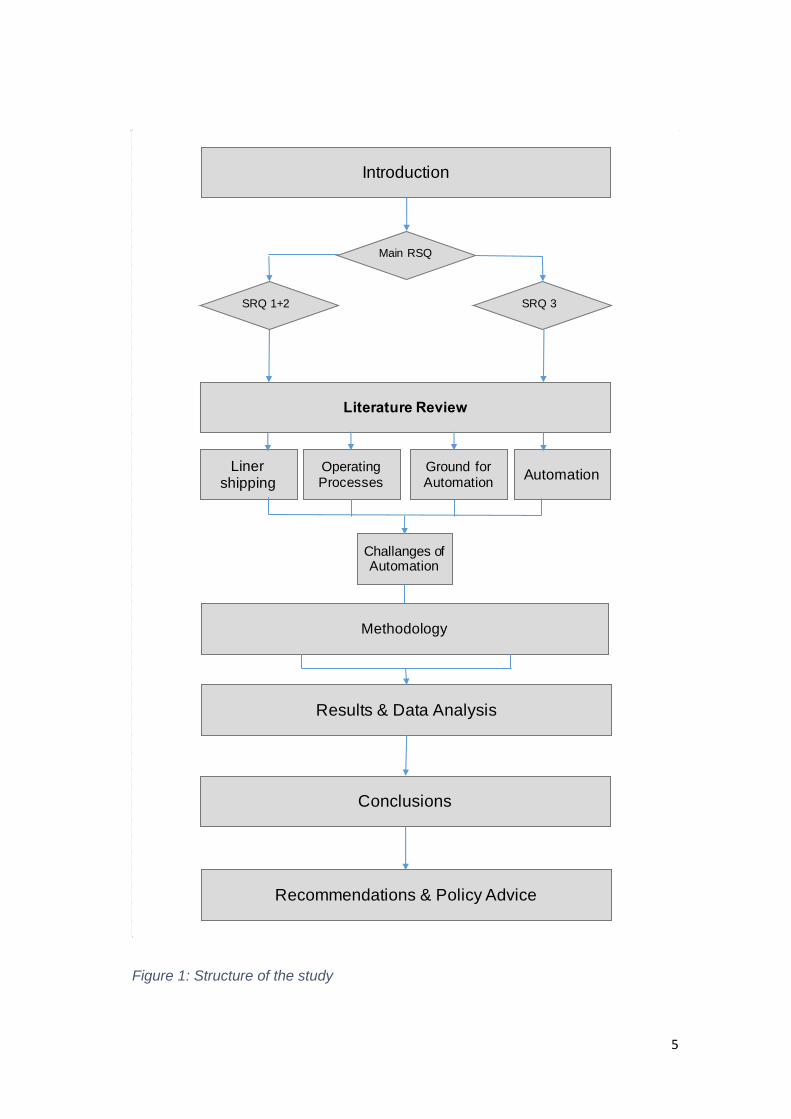
Figure 1 shows the contextual structure of this study. Section 2 will provide a structured review of a vessel operating processes divided by the following:
I. Liner shipping and fleet measures II. Task analysis
III. Operating processes IV. Ground for automation V. Automation VI. Arising challenges by automation
All of the above will provide the background of what vessel operating processes are comprised off, what is the basis for automation in commercial shipping, what

4
automation is, and which stages are likely to be affected by automation. The outcome of section 2 is to present profiles of a regular vessel with an emphasis on manned procedures, while presenting three modes of an unmanned vessel and the derived challenges. Section 2 will provide answers to sub-question I & II, and will present the context for section 3.
Sections 3 will explain the chosen conceptual methodological approach in order to answer why is the topic important. The section will present how the model was calculated and how the impact is analysed. Data will be stated and explained on the reason for choosing the data, followed by the gaps, the problems, and how we solved them. The description of the costs model equations (operating costs, voyage costs, capital costs, cargo handling costs). The section will explain the variables used in the costs model equations. Presentation of the cost model will focus on new cost components and changes of current components focusing on three elements (Manning, Stores, Repair and Maintenance). Cost comparison analysis, presenting the various scenarios base line, one in which the impact will change the coefficient which is used in the model, and the others where a structural change in the model as a result of automation is applicable. Methodological limitations are presented. Section 3 will provide ground to answer sub-questions II & III.
Section 4 will present the results and analysis. The results are the outcome of our methodology and literature review. The literature review will be qualitative oriented, and the methodology quantitative oriented. A new structured operating processes model is derived from the data presented in section II. An analysis will summarize the results and explain how the operational profile of the vessel changes, how the changes in costs can be translated into design, operating processes, and maintenance policy. The main outcomes will be how the changes of operational profile are translated into costs. Section 6 will answer sub-questions II & III.
Sections 5 will conclude the findings and provide policy recommendations with respect to the main research question, whether the introduction of automated vessels will have an impact on container vessels operating model, and to what extent. Closing with areas for further research.
5
Figure 1: Structure of the study
Introduction
Main RSQ
SRQ 1+2 SRQ 3
Literature Review
Liner shipping
Operating Processes
Ground for Automation
Automation
Challanges of Automation
Methodology
Results & Data Analysis
Conclusions
Recommendations & Policy Advice

6
7
2. Literature review
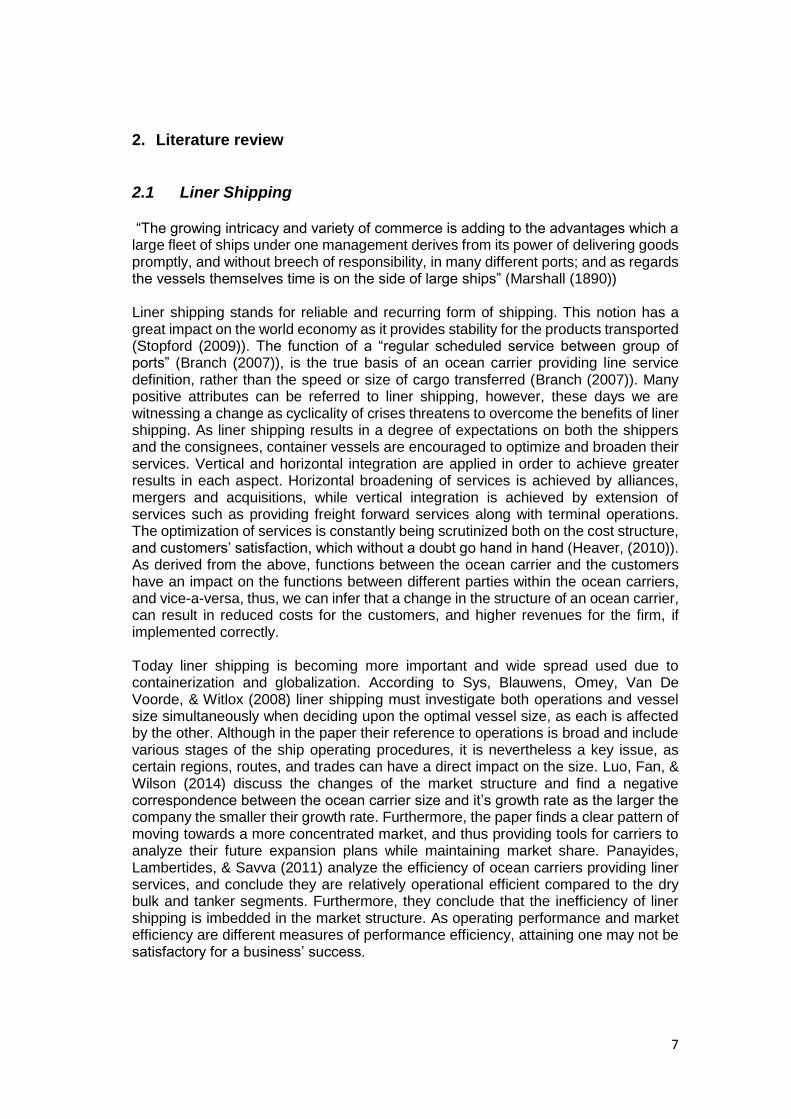
2.1 Liner Shipping “The growing intricacy and variety of commerce is adding to the advantages which a large fleet of ships under one management derives from its power of delivering goods promptly, and without breech of responsibility, in many different ports; and as regards the vessels themselves time is on the side of large ships” (Marshall (1890)) Liner shipping stands for reliable and recurring form of shipping. This notion has a great impact on the world economy as it provides stability for the products transported (Stopford (2009)). The function of a “regular scheduled service between group of ports” (Branch (2007)), is the true basis of an ocean carrier providing line service definition, rather than the speed or size of cargo transferred (Branch (2007)). Many positive attributes can be referred to liner shipping, however, these days we are witnessing a change as cyclicality of crises threatens to overcome the benefits of liner shipping. As liner shipping results in a degree of expectations on both the shippers and the consignees, container vessels are encouraged to optimize and broaden their services. Vertical and horizontal integration are applied in order to achieve greater results in each aspect. Horizontal broadening of services is achieved by alliances, mergers and acquisitions, while vertical integration is achieved by extension of services such as providing freight forward services along with terminal operations. The optimization of services is constantly being scrutinized both on the cost structure, and customers’ satisfaction, which without a doubt go hand in hand (Heaver, (2010)). As derived from the above, functions between the ocean carrier and the customers have an impact on the functions between different parties within the ocean carriers, and vice-a-versa, thus, we can infer that a change in the structure of an ocean carrier, can result in reduced costs for the customers, and higher revenues for the firm, if implemented correctly. Today liner shipping is becoming more important and wide spread used due to containerization and globalization. According to Sys, Blauwens, Omey, Van De Voorde, & Witlox (2008) liner shipping must investigate both operations and vessel size simultaneously when deciding upon the optimal vessel size, as each is affected by the other. Although in the paper their reference to operations is broad and include various stages of the ship operating procedures, it is nevertheless a key issue, as certain regions, routes, and trades can have a direct impact on the size. Luo, Fan, & Wilson (2014) discuss the changes of the market structure and find a negative correspondence between the ocean carrier size and it’s growth rate as the larger the company the smaller their growth rate. Furthermore, the paper finds a clear pattern of moving towards a more concentrated market, and thus providing tools for carriers to analyze their future expansion plans while maintaining market share. Panayides, Lambertides, & Savva (2011) analyze the efficiency of ocean carriers providing liner services, and conclude they are relatively operational efficient compared to the dry bulk and tanker segments. Furthermore, they conclude that the inefficiency of liner shipping is imbedded in the market structure. As operating performance and market efficiency are different measures of performance efficiency, attaining one may not be satisfactory for a business’ success.
8
According to Tran & Haasis (2015) the liner shipping market although seeing an increase in vessel sizes and enlargement of the fleets, the revenues per unit are still diminishing. The authors conclude that no clear evidence regarding financial performance can be attributed to vessel size, vessel capacity, and fleet size, but instead point the fuel and manning expenses as key elements for an ocean carrier operating a fleet of vessels. On the impact of technological developments Talley (2000) points that it is technology which provides ocean carriers providing line services a comparative advantage, as other paths of mergers, acquisitions, and alliances have been exploited.
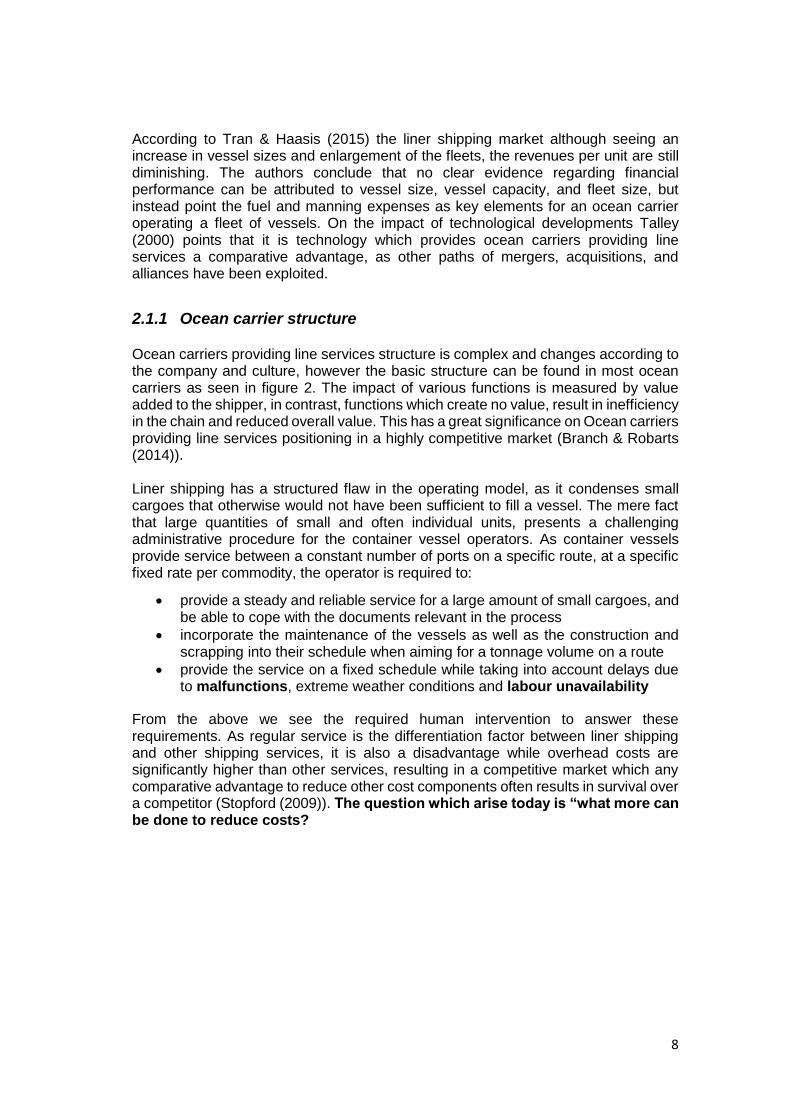
2.1.1 Ocean carrier structure Ocean carriers providing line services structure is complex and changes according to the company and culture, however the basic structure can be found in most ocean carriers as seen in figure 2. The impact of various functions is measured by value added to the shipper, in contrast, functions which create no value, result in inefficiency in the chain and reduced overall value. This has a great significance on Ocean carriers providing line services positioning in a highly competitive market (Branch & Robarts (2014)).
Liner shipping has a structured flaw in the operating model, as it condenses small cargoes that otherwise would not have been sufficient to fill a vessel. The mere fact that large quantities of small and often individual units, presents a challenging administrative procedure for the container vessel operators. As container vessels provide service between a constant number of ports on a specific route, at a specific fixed rate per commodity, the operator is required to:
From the above we see the required human intervention to answer these requirements. As regular service is the differentiation factor between liner shipping and other shipping services, it is also a disadvantage while overhead costs are significantly higher than other services, resulting in a competitive market which any comparative advantage to reduce other cost components often results in survival over a competitor (Stopford (2009)). The question which arise today is “what more can be done to reduce costs?
provide a steady and reliable service for a large amount of small cargoes, and be able to cope with the documents relevant in the process
incorporate the maintenance of the vessels as well as the construction and scrapping into their schedule when aiming for a tonnage volume on a route
provide the service on a fixed schedule while taking into account delays due to malfunctions, extreme weather conditions and labour unavailability
9
Figure 2: Ocean carrier structure
Source: Complied from various sources
Chairman
Finance Director
Managing Director
Marketing Director
Company Secretary
Personal Director
IT Director Board
Logistics Director
Technical Director
Operations Director
Accountant Planning manager
Board
Sales & Marketing
Board
Assistant secretary
HR Manager
Fleet Manager
Marine Superintendent
Board
Marine Engineer
Board
Logistics Manager
Board
IT Manger
IT Budgets
IT Contracts
IT Development
IT Planning
IT Research
Logistics executive Far East
Logistics executive North America
Logistics executive Far East
Naval architecture
Ship overhauls
Ship surveys Stores control
Crewing ISM
Registered ship management
Ship security
ISA Code
ISPS code
Catering
Chartering
Customs
Inwards freight
Insurance
Outwards freight
Ship deployment
Ship purchases
Ship sales
Ship schedules
Victualling
Industrial relations
Management services
Marine staff
Shore staff
Training
Administration
Estate
Legal matters
Secretarial
Stocks & shares
Advertising
Cargo consultancy
Claims
Commercial development
Customer relations
Documentation
Fares
Freight and Port agents
Marketing Officer
Market developer
Marketing research
Overseas agents liaison
Press and publicity
Rates
Refunds
Sales
Service traffic managers
Annual accounts
Audit
Budgets
Costings
Credit control
Management data
Business plan
Investment
Project execution
10
2.1.2 Vessel cost elements Martin Stopford (2009) divides the cost of operating a vessel to the following elements: Annual capital cost, annual periodic maintenance, annual cargo handling cost, annual voyage cost, and annual operating cost. Capital cost is a unique cost element which differs from the others. Capital cost are distributed through structured payments to the shipyard or the bank, once the vessel is build the cost does not have an operational influence on the performance of the vessel. In the case of unmanned container vessels, it is difficult to assess how capital cost will change as it is design-based. Periodic maintenance includes the costs of dry docking and surveys. The costs are periodically and known in advance, however, in a situation where the maintenance during the dry docking is not conducted adequately, the operational performance of the vessel is influenced. Cargo handling cost refers to the cost of loading and unloading the cargo from the vessel, and the cargo claims. Voyage cost account for 40% of total cost and is the second largest cost element following the capital cost. The largest component of the voyage cost is fuel which may reach to 50 percent of the total voyage cost. Port dues, tugs and pilotage, and canal dues comprise together the remainder. In the case of liner shipping, schedule and reduced fuel cost are the leading factors of the fuel consumption. In addition, the price of fuel fluctuates substantially, thus an analysis based on other fuels as energy sources for unmanned shipping cannot be properly analyzed. Operating costs include manning, stores, maintenance and repairs, which is not part of dry docking, insurance, and administration costs. Operating cost is the cost element we need to analyze as the changes it will have are significant and can be evaluated with the current resources. Within operating costs, manning, stores, and maintenance & repairs, combined represent more than 60 percent of annual operating costs. The following sub-section will present in detail the likelihood for these changes and the reason why they should be investigated first.
2.1.3 Vessel productivity An important figure in shipping is vessel productivity (𝑃𝑡𝑚 = 24 ∙ 𝑆𝑡𝑚 ∙ 𝐿𝐷𝑡𝑚 ∙ 𝐷𝑊𝑈𝑡𝑚). The productivity is defined by ton miles per deadweight and rests upon four components: speed (s), port time, deadweight utilization (DWU) and loaded days at sea (LD). Speed, in recent years this factor has been depended on operating costs savings and less due to time constraints. We can only assume that this factor will remain an operating dependent decision rather than service availability factor as long as bunker remains at an unstable rate. Port time, a crucial component of productivity, differs among cargoes, but is significantly more efficient due to containerization and increased performance by terminals, a trend which is only likely to continue. Deadweight utilization, is influenced by the capacity that is not utilized due to stores, bunker, accommodation, etc. Stores and accommodation impacts and opportunities will be elaborated in section 2.4 but we can already see they play a significant role in a critical component for vessel productivity. Loaded days at sea, are a fraction of a vessel’s time. The delicate balance between the last and unproductive days is the port time, ballast and off hire, a container vessel which is able to reduce the other two factors can achieve longer port stay, obviously it is not up to the container vessel alone, but this fact by itself may be important in an era where maintenance is conducted solely at port.

11
To conclude, liner shipping is a customer intensive service which follows a fixed schedule. Advantages and disadvantages result from the fix schedule and allow for changes to have a long term effect and a distribution of risk. Liner companies have multiple departments operating in purpose of securing a reliable and constant transportation services. A key figure in shipping is vessel productivity which in certain situations can be improved.
2.2 Task analysis The underlying component behind any transportation service is given by the operators who perform certain tasks and procedures in a structured and timely manner. Autor, Levy, & Murnane (2003) divide all tasks into two categories. The first distinguishes between cognitive and physical tasks, while the second distinguishes between repetitive and non-repetitive tasks. Currently we see cognitive and manual tasks being gradually replaced by technology. In regards to non-repetitive tasks, the challenge lies in being able to specify and define the tasks in advance. According to Acemoglu & Autor (2011) technology will outperform human tasks where tasks, problems and situations can be pre-defined. Today, non-repetitive tasks are being addressed through analyzing large data sets which allow non-repetitive tasks and problems to by defined (Brynjolfsson & Mcafee (2011)) Gregoriades & Sutcliffe (2006) asses the human capacity to perform tasks within naval command and control rooms where technology and human based tasks are shared. They do so in order to provide a tool for future design of such rooms while taking into account the human capacity for tasks under changing operational situations. Godwin et al. (2013) analyze novice and expert behavior in a maritime navigation tasks simulator. The authors find experienced participants to achieve greater control over the vessel under changing wave lengths and height, and novice participants to present greater vertical fixations. They conclude that novice participants present less capability to adjust to changing navigational situations. Plavšić, Klinker, & Bubb (2010) examine vehicle drivers’ behavior and situation awareness in simulated junctions. They find that situations where information is deliberately missing, the primary cause for accidents was the lack of previous similar experiences and situations. In regards to complex situations where information was deliberately swarming, the primary cause for accidents was inability to process large quantities of data. Human tasks which involve creativity have not yet been fully matured on the automation side. The challenge for both human and machine, of responding to an unfamiliar or condensed informative situation lye, as described above, in the ability to code or analyze great amounts of data, and doing so in a changing geography, systems, and languages. Itoh, Yamaguchi, Hansen, & Nielsen (2001) unleash the potential which task analysis offers on vessel navigation. They begin by explaining the various tasks different members on board a vessel are required to do at any given time, as well as specific tasks of which they are assigned to. By running a cognitive simulation, they explore the key risks involved in vessel’s navigation and suggest using the results as a ground for vessels navigational risk. To conclude, tasks analysis has been widely used in literature for assessing in what manner technology should replace human-based tasks. Tasks can be divided to various categories upon each, the ability to automate a task can be obtained. We
12
determine that by grasping all the tasks performed in specific stages and by specific participants, one is able not only to better formulate the system to replace or improve those tasks, but also to quantify its impact in changing scenarios.
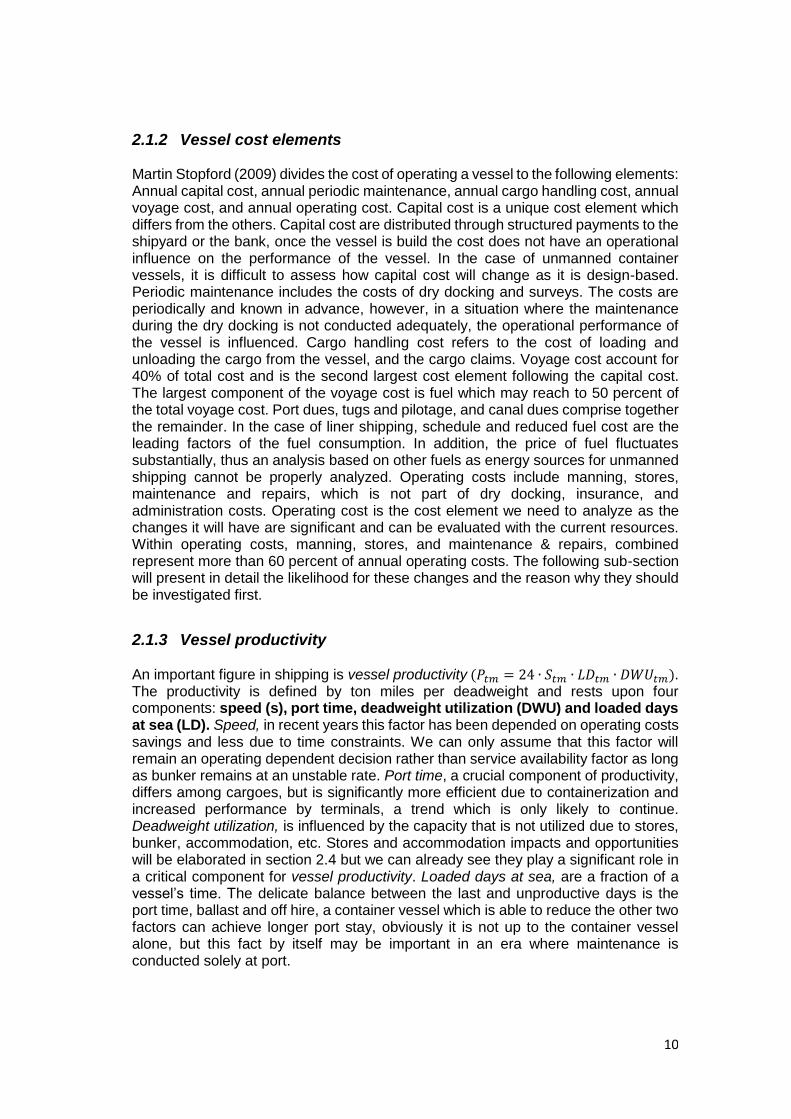
2.3 Operating processes Ship operating processes are similar across different ocean carriers and ship management companies. Although three models are familiar (traditional, outsourcing and hybrid) it does not affect the processes which occur at sea as well as the interaction between the shore based parties and the sea based (the vessel) activities (Branch & Robarts (2014)). Dividing the processes into three main stages: Port departure, deep sea voyage and port arrival (Figure 3). It is important to differentiate
between the three stages as each has different processes and risks relating to it. The differentiation between the three stages is the arrival to open sea. This may change according to the port, region and master, as it depends on navigational safety, draft and traffic density in the area. Furthermore, the distance in which a vessel moves between one stage to another varies as well between geographic location, sea conditions, and master experience (Nair (2016)1). It is clear that each stage encompasses different processes as proximity and procedures require so. Different procedures mean different communications between the ocean carrier’s parties and 3rd parties involved, such as the agent. The paper will present the processes based on the purpose (commercial, technical, crew) as well as the parties conducting them. In the paper we will focus on the deep sea voyage lag as it is the most likely to be automated in the foreseeable future (Rødseth (2016)2). All processes can be categorized under three headings, commercial, technical and crew oriented. it is important to know what are the stages and at what frequency they occur for several reasons, first, they provide a view on the processes that in the future will no longer occur, second, the processes which will have to be conducted by a shore based party, third, the impact it will have on the other two stages as processes are transferred to them. Commercial refers to all activities which secure the revenues and financial return through securing cargo while adequately using the company’s resources (Branch & Robarts (2014)). Technical refers to any activity aiming at “safety, statutory obligations and service standards” (Branch & Robarts (2014)). Crew
1 Based on personal communication with Abhishek Nair. June 11, 2016. 2 Based on personal communication with with Ørnulf Jan Rødseth. February 24,
2016.
DeepSeaVoyagePortDeparture PortArrival
A B
Figure 2: Voyage stages
13
oriented relates to any activity aimed in providing the needs and required documentation of the crew. Today many activities have been removed from the seafarer’s responsibility and became computerized, the effect can be seen in the crew size that has been steadily decreasing over the past century. The remaining personal are largely involved in activities that relate to the crew on board the vessel itself, and not as much to the cargo, the machinery, and navigation of the vessel, as all have been to a large extent been automated and are currently being supervised by the crew personal (Pirjak (2016)3). Thus again the question arises, if monitoring is the role, why conduct so from sea and not from shore? In figure 4 we see the vessel as the centre node and the various communication and processes conducted by it.
3 Based on personal communication. June 12, 2016.

14
Figure 3: Container vessel operating processes at sea
Source: Complied from various sources
15
Looking at the processes and communications which occur aboard the vessel we see a clear division between intraship processes on one part, and ship to third party processes on the other. Further division is available on activities that revolve the cargo or vessel, and activities which relate to the crew on board and do not differ among various vessel types. Activities supporting the crew include reports, training, medical assistance, and catering. It is obvious that numerous working hours are to be saved from removing the crew component in this equation. Furthermore, it is clear that tremendous inefficiency in the form of data collection and sharing it with the parties on-shore is occurring. Looking at the documentation and registration activities which are time consuming and could be simply replaced. One example is the agent report of the required stores and services at the port of arrival, once sensors are accurately replacing manned registration, the system will initiate an automatic request for fuel/ oil/ malfunctioned parts (Nair (2016)4). To conclude, vessel operating processes at sea are to a large extent conducted by crew only due to absence of systems to replace them. The quality of the processes can be hampered due to the physiological state of the personal involved and may change during a voyage, resulting in an inconsistent performance level. Several processes are conducted for the sole purpose of the crew on board, and have no direct additional value to the cargo or the service the vessel is providing. A large component of vessel processes is the maintenance, both for the systems on board and the cargo. New operating processes model for unmanned vessels relies on high performance level by the systems and will be more efficient as all activities are value adding.
2.4 Ground for automation Automation aims to replace human involvement in procedures which can be done either faster, safer, more precise, more productive and/or cheaper. In liner shipping, faster in the operating sense is not necessarily relevant as speed currently is the outcome of financial consideration and service obligations. Nevertheless, the other reasons for automation are most definitely relevant.
2.4.1 The human element The most significant component of container vessel operating processes at sea is navigational safety, which is comprised of track keeping and collision avoidance. The factors which contribute to the outcome of navigational safety are:
4 Based on personal communication with Abhishek Nair. June 11, 2016.
16
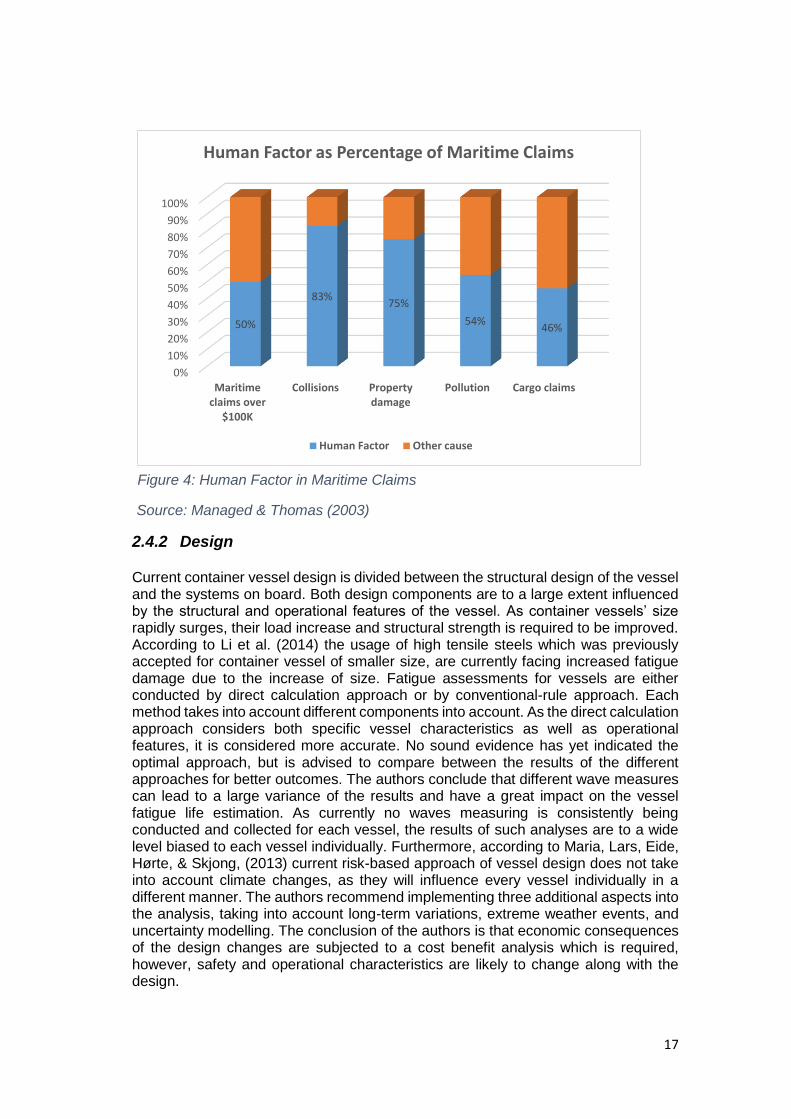
It is also important to understand that the factors above require human intervention. Navigational system require officers to receive the data, authenticate it, analyze it, conclude a solution based on the information available and conduct the solution (Burmeister, Bruhn, Rødseth, & Porathe (2014); Man, Lundh, Porathe, & MacKinnon (2015)). This becomes problematic as the process changes among different officers, but also becomes more complex once the situation changes, thus the action plan must change and the process must repeat itself with the new input (Statheros, Howells, & Mcdonald-maier (2008)). It is also true that advanced aid technology systems installed to aid in navigation result in the opposite outcome, this is a cause of men not being able to decipher the information given by those systems. Nevertheless, as can be seen in figure 5 , over 56% of the maritime accidents are a cause of failure to abide by the rules of proper navigation (Statheros, Howells, & Mcdonald-maier (2008)). In case of collision it is often the case where one party is not acting according to procedures and thus brings the situation to a spiraling scenario where intuitions, experience and fair judgment, are the determinants of the final outcome. According the UK P&I club, human error plays a substantial share of their claims. More than 50% of over $100,000 claims are due to the human element. It also stands for 83% of collisions, 75% property damage, 54% pollution cases and 46% cargo claims. In contrast, technical failures are the cause for less than 25% of claims of such magnitude. The loses for the club sum up to an astounding $1.5 billion since 1987 till today, and a staggering $1.5M per day for the industry (Managed & Thomas (2003); Sousa & Gonçalves (n.d.)). Unlike the opinion of the writer, according to Schager (2008) “The underlying thought is to allocate responsibilities to humans for dealing with tasks that humans do better and to let technology complement in areas where such solutions are best”, his paper suggests that due to “safe” technology, the operators are not required to perform, thus when reaching a point where their abilities to analyse and act are required, they fail to do so. He goes on by stating that technology error is a human error as these systems are designed, maintained and supervised by humans and warns from over reliance on the systems.
Vessel type. Which derives from it the manoeuvrability, speed and weather resilience capabilities. The differences between various vessels requires different training and results in lack of flexibility for different masters and sea fearers
Traffic picture. During a journey, a vessel may face several different vessel sizes as well as objects, this requires adjustment of the navigational officer on post to perform well in changing situations
Weather. Ship manoeuvrability is highly dependent on the weather situation and changes accordingly. Different conditions call for different operating measures and require safety measures to be conducted
Navigational systems. On board the vessel many systems are provided to assist in making the right decisions.
17
2.4.2 Design Current container vessel design is divided between the structural design of the vessel and the systems on board. Both design components are to a large extent influenced by the structural and operational features of the vessel. As container vessels’ size rapidly surges, their load increase and structural strength is required to be improved. According to Li et al. (2014) the usage of high tensile steels which was previously accepted for container vessel of smaller size, are currently facing increased fatigue damage due to the increase of size. Fatigue assessments for vessels are either conducted by direct calculation approach or by conventional-rule approach. Each method takes into account different components into account. As the direct calculation approach considers both specific vessel characteristics as well as operational features, it is considered more accurate. No sound evidence has yet indicated the optimal approach, but is advised to compare between the results of the different approaches for better outcomes. The authors conclude that different wave measures can lead to a large variance of the results and have a great impact on the vessel fatigue life estimation. As currently no waves measuring is consistently being conducted and collected for each vessel, the results of such analyses are to a wide level biased to each vessel individually. Furthermore, according to Maria, Lars, Eide, Hørte, & Skjong, (2013) current risk-based approach of vessel design does not take into account climate changes, as they will influence every vessel individually in a different manner. The authors recommend implementing three additional aspects into the analysis, taking into account long-term variations, extreme weather events, and uncertainty modelling. The conclusion of the authors is that economic consequences of the design changes are subjected to a cost benefit analysis which is required, however, safety and operational characteristics are likely to change along with the design.
0%
10%
20%
30%
40%
50%
60%
70%
80%
90%
100%
Maritimeclaims over
$100K
Collisions Propertydamage
Pollution Cargo claims
50%
83%75%
54%46%
Human Factor as Percentage of Maritime Claims
Human Factor Other cause
Figure 4: Human Factor in Maritime Claims
Source: Managed & Thomas (2003)
18
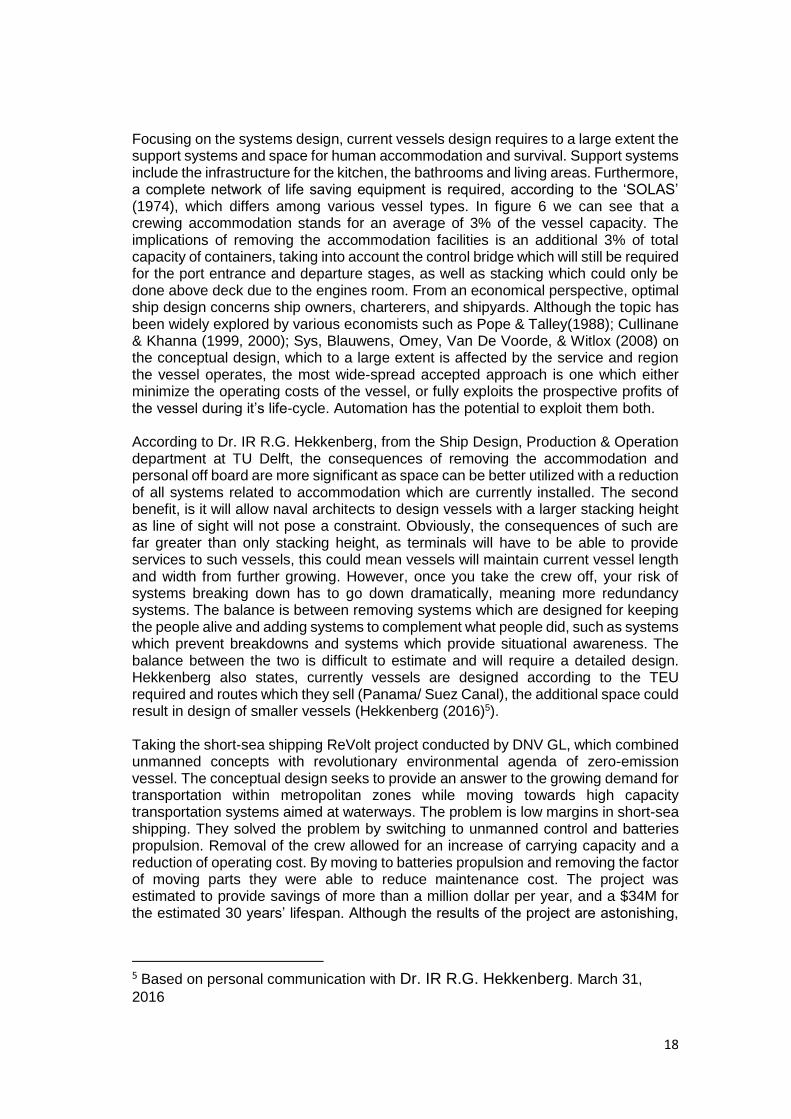
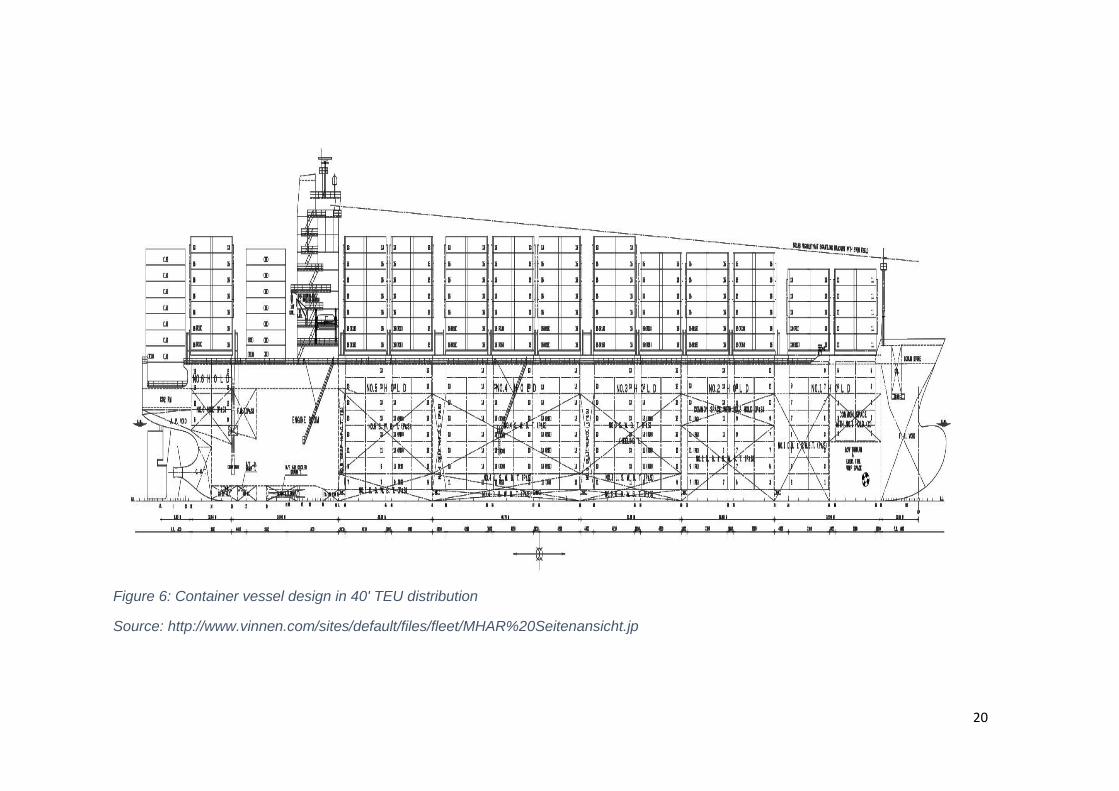
Focusing on the systems design, current vessels design requires to a large extent the support systems and space for human accommodation and survival. Support systems include the infrastructure for the kitchen, the bathrooms and living areas. Furthermore, a complete network of life saving equipment is required, according to the ‘SOLAS’ (1974), which differs among various vessel types. In figure 6 we can see that a crewing accommodation stands for an average of 3% of the vessel capacity. The implications of removing the accommodation facilities is an additional 3% of total capacity of containers, taking into account the control bridge which will still be required for the port entrance and departure stages, as well as stacking which could only be done above deck due to the engines room. From an economical perspective, optimal ship design concerns ship owners, charterers, and shipyards. Although the topic has been widely explored by various economists such as Pope & Talley(1988); Cullinane & Khanna (1999, 2000); Sys, Blauwens, Omey, Van De Voorde, & Witlox (2008) on the conceptual design, which to a large extent is affected by the service and region the vessel operates, the most wide-spread accepted approach is one which either minimize the operating costs of the vessel, or fully exploits the prospective profits of the vessel during it’s life-cycle. Automation has the potential to exploit them both. According to Dr. IR R.G. Hekkenberg, from the Ship Design, Production & Operation department at TU Delft, the consequences of removing the accommodation and personal off board are more significant as space can be better utilized with a reduction of all systems related to accommodation which are currently installed. The second benefit, is it will allow naval architects to design vessels with a larger stacking height as line of sight will not pose a constraint. Obviously, the consequences of such are far greater than only stacking height, as terminals will have to be able to provide services to such vessels, this could mean vessels will maintain current vessel length and width from further growing. However, once you take the crew off, your risk of systems breaking down has to go down dramatically, meaning more redundancy systems. The balance is between removing systems which are designed for keeping the people alive and adding systems to complement what people did, such as systems which prevent breakdowns and systems which provide situational awareness. The balance between the two is difficult to estimate and will require a detailed design. Hekkenberg also states, currently vessels are designed according to the TEU required and routes which they sell (Panama/ Suez Canal), the additional space could result in design of smaller vessels (Hekkenberg (2016)5). Taking the short-sea shipping ReVolt project conducted by DNV GL, which combined unmanned concepts with revolutionary environmental agenda of zero-emission vessel. The conceptual design seeks to provide an answer to the growing demand for transportation within metropolitan zones while moving towards high capacity transportation systems aimed at waterways. The problem is low margins in short-sea shipping. They solved the problem by switching to unmanned control and batteries propulsion. Removal of the crew allowed for an increase of carrying capacity and a reduction of operating cost. By moving to batteries propulsion and removing the factor of moving parts they were able to reduce maintenance cost. The project was estimated to provide savings of more than a million dollar per year, and a $34M for the estimated 30 years’ lifespan. Although the results of the project are astonishing,
5 Based on personal communication with Dr. IR R.G. Hekkenberg. March 31,
2016
19
in the current stage of batteries’ technology, it is not a feasible solution for a cross-ocean voyage (DNV-GL, n.d.).
Ørnulf Jan Rødseth is the leader of the EU MUNIN project and a senior scientist at MARINTEK. Rødseth claims that you optimize the savings as a result of automation depending on the specific purpose for which the vessel is designed. The fundamental approach is that one can optimize a vessel for automation along different dimensions and parameters, and the choices one makes depend on the purpose of the vessel. Thus, a vessel which is likely to remain in port for extended periods of time is better to optimize its cargo handling processes, and a vessel which is at sea for extended periods of time, it is advised to minimize the crew. Furthermore, Rødseth assess that in certain trades such as short-sea shipping, savings can be achieved by optimizing the capacity, reducing crew, and optimizing the cargo handling. In contrast, the unmanned vessels in the current vision will not be suitable for certain routes as they require adequate infrastructure and support in certain stages. Rødseth concludes the main problem for liner shipping is enormous investments which are required, as it is not cost effective to just have one vessel, but to replace large parts of your fleet. The reason is not necessarily for the long term benefits, but due to high investments that must be first proved in other trades (Rødseth (2016)6). Unlike Hekkenberg, the researcher believes unmanned vessels should aim for a complete removal of human intervention from the entire process, including for the port arrival and departure stages.
6 Based on personal communication with Ørnulf Jan Rødseth. February 24, 2016
20
Figure 6: Container vessel design in 40' TEU distribution
Source: http://www.vinnen.com/sites/default/files/fleet/MHAR%20Seitenansicht.jp

21
2.4.3 Maintenance, repair, and lubricating oil costs Today vessels have various systems on board which are crucial for the operating of the ship during the sea voyage. All systems can by divided by their function and use. Most systems have redundancy either within the system itself or by a parallel system in order to provide better vessel and service reliability. Therefore, the scheduling of the maintenance, especially those which cannot be conducted at sea become ever more significant. The challenge in scheduling is lack of reliable data on the actual status of each system. Verma, Srividya, Rana, & Khattri (2012) recommends short maintenance periods to achieve higher level of reliability while maintaining the cost without change. This is important as achieving greater operating reliability at sea is a crucial element and is embedded in liner shipping. Aldous, Smith, Bucknall, & Thompson (2015) discuss the significance of vessel performance monitoring systems for ship owners and operators in order to benefit from improved maintenance and assessing technological involvements. The drive for such tools is optimization of the operating processes on board the vessel, and to pose a benchmarking tools for relevant parties on the performance of the vessel. The underlining conclusion of both papers are that reliable and continuous information is a key to reducing maintenance and repairs costs. In regards to lubricating oils, although their consumption is not high, they are nevertheless the most expensive oils on board the ship. The majority of the consumption is used for the main engines and auxiliary engines. Other systems such as sewage pumps, fresh water pumps, etc. is relatively low, thus we cannot infer a significant reduction of lubricating oils due to the removal of the crew. Nonetheless, as the suggested energy system to power the unmanned vessels has not been decided upon, we can expect significant fluctuations in the consumption according to the designated system. Taking the example of LNG as fuel, the SFOC (Specific Fuel Oil Consumption) is significantly lower compared to the currently low grade bunker used in container vessels (Schinas & Butler, (2016). As lubricating oils are necessary to lubricate moving parts, moving to a battery powered propulsion will drastically reduce the lubricating oil consumption such as achieved in the ReVolt project previously discussed. Although such technology is yet to develop, extensive research is being conducted on renewable powered systems and should be taken into consideration. Hirdaris et al. (2014) propose the concept of Nuclear Small Modular (SMR) technology for ocean going vessels as means of propulsion. The authors assessment suggests that from a design perspective it is achievable and will benefit in reduced oil consumption and greater economic and environmental benefits. To conclude, current bunker used in container vessels leads to many technical challenges, and require many human interventions for problem solving along the voyage. As unmanned vessels will have to adapt their propulsion system to one which allows lower maintenance requirements, we look into other fuels and fuelling systems. As the propulsion systems to be used are likely to change, we can expect variations of the cost components described above. Understanding and incorporating the uncertainty of the expected changes in any analysis regarding cost implications of operating costs is thus obligatory.
22
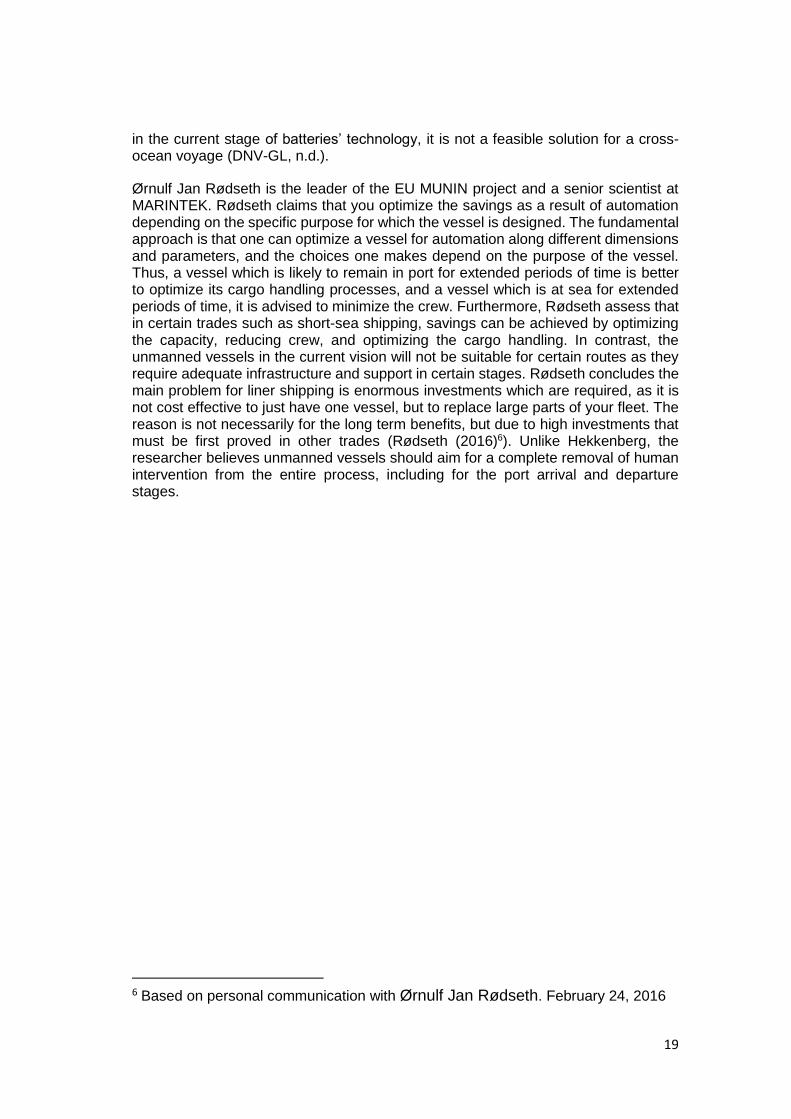
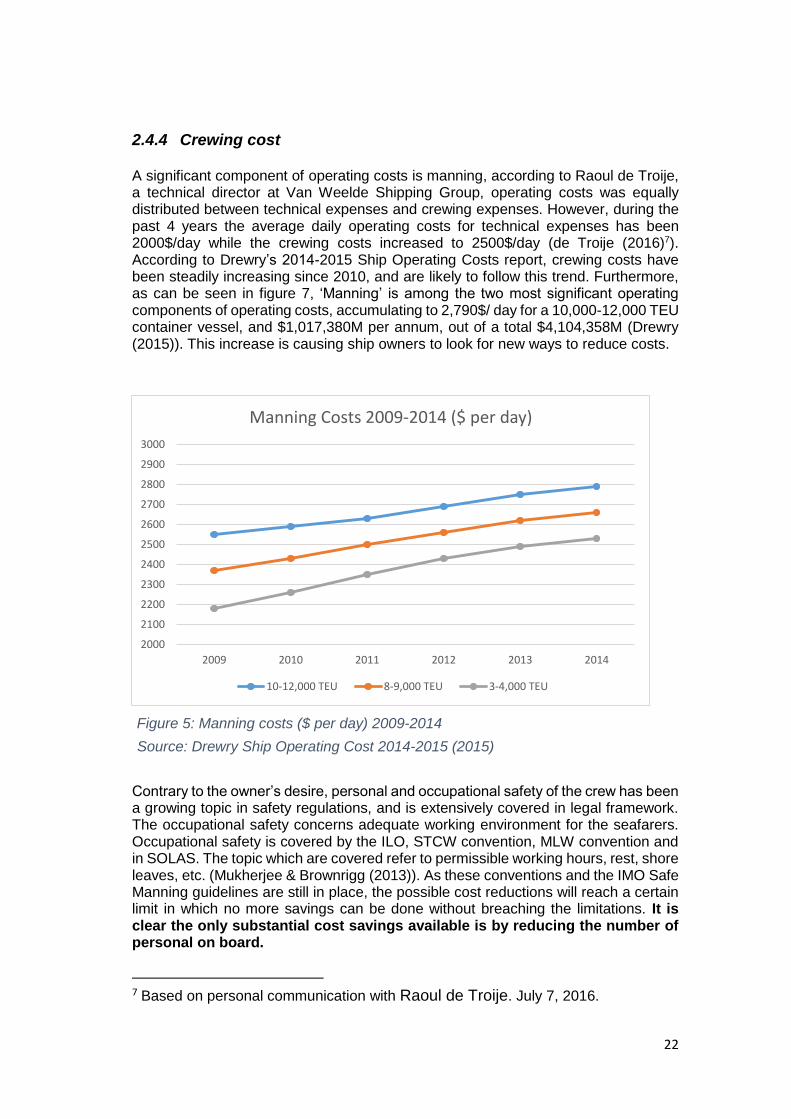
2.4.4 Crewing cost A significant component of operating costs is manning, according to Raoul de Troije, a technical director at Van Weelde Shipping Group, operating costs was equally distributed between technical expenses and crewing expenses. However, during the past 4 years the average daily operating costs for technical expenses has been 2000$/day while the crewing costs increased to 2500$/day (de Troije (2016)7). According to Drewry’s 2014-2015 Ship Operating Costs report, crewing costs have been steadily increasing since 2010, and are likely to follow this trend. Furthermore, as can be seen in figure 7, ‘Manning’ is among the two most significant operating components of operating costs, accumulating to 2,790$/ day for a 10,000-12,000 TEU container vessel, and $1,017,380M per annum, out of a total $4,104,358M (Drewry (2015)). This increase is causing ship owners to look for new ways to reduce costs.
Contrary to the owner’s desire, personal and occupational safety of the crew has been a growing topic in safety regulations, and is extensively covered in legal framework. The occupational safety concerns adequate working environment for the seafarers. Occupational safety is covered by the ILO, STCW convention, MLW convention and in SOLAS. The topic which are covered refer to permissible working hours, rest, shore leaves, etc. (Mukherjee & Brownrigg (2013)). As these conventions and the IMO Safe Manning guidelines are still in place, the possible cost reductions will reach a certain limit in which no more savings can be done without breaching the limitations. It is clear the only substantial cost savings available is by reducing the number of personal on board. 7 Based on personal communication with Raoul de Troije. July 7, 2016.
2000
2100
2200
2300
2400
2500
2600
2700
2800
2900
3000
2009 2010 2011 2012 2013 2014
Manning Costs 2009-2014 ($ per day)
10-12,000 TEU 8-9,000 TEU 3-4,000 TEU
Figure 5: Manning costs ($ per day) 2009-2014
Source: Drewry Ship Operating Cost 2014-2015 (2015)

23
To conclude, although the topic is disputed in the literature, there is no doubt that human intervention is the fundamental flow in navigation and is the cause for the majority of maritime accidents. We must nevertheless remember, systems aiming at replacing humans are also designed and maintained by humans and by such have a structured flow in them. Furthermore, there are gains from removing the crew of vessels in the form of additional capacity for cargo, however, will be limited by the space required for redundancy systems. Manning take a substantial share of operating costs, as ship owners are looking for ways of savings, reducing or removing personal completely will benefit owners in a stable way which will counterbalance the expected high capital costs involved with unmanned vessels.
2.5 Automation “The first rule of any technology used in a business is that automation applied to an efficient operation will magnify the efficiency. The second is that automation applied to an inefficient operation will magnify the inefficiency.” (Bill Gates) The terminology of ‘automation’ differs across industries and functions. In order to provide ground upon the paper will discus, we must first address, state, and explain the various degrees of automation, and their meaning in the context of automation in vessel operating processes. When referring to unmanned vessels and automation there is a difference which is important to mention and crucial to understand. Automation refers to activities that are conducted by machines, thus a model which is most likely to occur is human relief systems which will substitute or complement the crew. This is in continuous with past developments and is the reason we see a reduction of crew size today compared to past times. When referring to various modes of automation, the standard division is as follows: 1. Remote Controlled 2. Semi-Automated 3. Fully autonomous Remote control refers to a system which is being controlled from a control centre either on shore or at sea, depending on the utilization of the system (military naval vessels are often required to be controlled from a control ship in the vicinity). This option also requires a full staff to operate the vessel in a remote mode, resulting in reduced costs on ship design, however, increased costs on technology based systems as all the information needs to be collected and transferred live to the crew on shore. As this option requires high investments and does not necessarily reduces operating costs (mainly administration & crewing) make), this option is less attractive (Porathe (2014)). Semi-Automated refers to a system which some of its functions are replaced by computerized systems while some remain man-based (Gupta, Ghonge, & Jawandhiya (2016)). This degree is a midpoint between remote controlled and fully autonomous. Although it deals with some of the remote controlled impairments, it is yet to completely overcome them. One important aspect in transition between the systems is trust, which is widely explored by Chavaillaz, Westell, & Sauer (2016), and Liu, Jaramillo, & Vincenzi (2015) and discussed in section 2.5.
24
Fully autonomous refers to systems which receive, process, and conduct actions based on predefined algorithms. In case of an emergency the system will notify the control centre on the matter, which in return could take control and operate the vessel manually remote controlled (Gupta et al. (2016)). This system is highly complex and requires high degree of reliable technology, which can comprehend complex situations and respond accordingly. This is the preferred system for naval automation as it reduces the demand for personal and allows one operator to control several vessels at once, which will dramatically reduce crewing costs for container vessels (Porathe (2014)). According to Rødseth (2016)8 unmanned vessels are a completely different business model because they allow you to design the vessel completely different and operate the vessel at speeds which are optimal for the cargo while reducing energy consumption. On deciding on the most appropriate and feasible option for merchant vessels, which maintains the cost-effective solution, we look into an option in which a remote control centre is constantly manned, this provides immediate response in case of an emergency, and reduction of complex and expensive systems on board. The degree of operating processes available for the unmanned vessels are: first, in which autonomy is restrained to deep sea sections of the route, thus removing unnecessary risk of unmanned vessel sailing in congested/ multi vessel area, however creates issues regarding ship design. Second, in which full autonomy is available, including sailing in multi vessel area, this option is relatively complicated, not necessarily due to heavy traffic, but rather due to legal issues concerning each state (Insaurralde & Lane (2014); Rødseth & Burmeister (2015)). The paper will focus on the first degree of automation as it is the most likely to occur in the near future. To conclude, when referring to autonomous vessels we need to distinguish between automation and remote control. Furthermore, within automation we need to distinguish between the three degrees of automation. We see that current literature is not consistent in the matter due to integration spill overs in terminology from other industries. Furthermore, we see how we define the degree of automation, resolves in different requirements from all the parties involved (elaborated in sub section 2.1), the paper will address and assess the impact based on two operating modes: fully autonomous vessel during the deep sea voyage and manned mode during port entrance/ departure, congested areas. The according impacts and challenges derived from it will be analysed and presented for the deep sea voyage.
2.6 Challenges of automation Liners and the maritime industry as a whole faces many challenges in regards to automation. The following paragraphs will state the various challenges and explain their potential impact on successful implementation of unmanned vessels. It is not in the scope of the paper to go in depth for each, however, understanding the challenges and the expected process of adjusting each is important for the various scenarios presented and analysed in the following sections. The main five issues at hand cover both legal and technological fields, as some are challenges faced by liner shipping today, their weight in the future will be significantly higher.
8 Based on personal communication with Ørnulf Jan Rødseth. February 24, 2016
25
2.6.1 Trust
The success of many systems and products on the market today rise and fall due to trust. As shipping is a transportation service which not only refers to the movement of cargo from point A to point B, but also doing so according to a certain expectation and performance level. Although it is a challenge any new or innovative product faces, the stakes in our case are higher. As an industry which had many innovations and adjustment to geographical or political situations at the time, the slope of the process in which it did so was relatively low and spread over hundreds of years. Although innovation in shipping was often the result of extreme inefficiency or the search for better productivity, the acceptance was often a processes, and so it shall be with autonomous vessels, the key difference is the substantial capital costs which will be incurred in the process. High capabilities and reliable systems in the beginning will have significant consequences on the length of the acceptance process (Chavaillaz, Wastell, & Sauer (2016); Rupp & Rupp (2008)).
2.6.2 Cyber security In the future, as communication and control of a vessel with precious cargo is conducted from a distanced station, the possibilities and challenges of safe guarding the vessel get new meaning. The fact that navigation decision is a result of data transferred vie satellite, which although difficult to hack, provides cyber criminals high earnings in case of successful take over. Although it is no different than any other electronic system, the consequences of such a breach go beyond the mere loss of trust, but also to rejection of an advanced system and unstable service. In the future we are likely to see the increasing involvement of companies dealing with data security, this can lead to a structural change in shipping as ships are mere capital intensive assets at sea, and the control and operating of such will not necessarily be confined to the shipping lines we know today (Hekkenberg (2016)9; Rødseth (2016)10; Gupta et al. (2016)).
2.6.3 Legal framework One of the burning issues on the table is the legal field. Many questions arise by automation, with whom relies the responsibility in case of a collision, who is to blame, should it be the operator or should it be the system, and if so, what is the definition of system responsibility? As autonomous operating mode means the vessel with the systems on-board conducts the decision making according to pre-defined algorithms which are defined by men. This are only several issues which arise, the majority of the problems concern the interaction between manned and unmanned vessels, as currently there is no convention or provisions covering this field. Vessels cannot use international rules and regulations for unmanned shipping, until IMO will acknowledge the new mechanism. However, bilateral agreements between the states and the flag states could provide a temporary solution. Again, for shipping it is a solution that will also limit the vessels to certain routes and prevent them from moving to other regions.
9 Based on personal communication with Dr. IR R.G. Hekkenberg. March 31,
2016 10 Based on personal communication with Ørnulf Jan Rødseth. February 24, 2016
26
A feasible option for ocean crossing line is the example of China and the USA which will require the countries and the flag states to sign the agreement (Rødseth (2016)11).
2.6.4 Maintenance As there is no crew on board the vessel you cannot conduct any technical maintenance on the systems while the vessel is sailing. This will be a major change in the way ship operating processes are conducted. Today, maximizing the utilization of the vessel is achieved by reducing the number of maintenance stops for the vessel which is the outcome of conducting the majority of the maintenance while the vessel is sailing. The theory today is it will be hard to have a vessel which operates on heavy fuel as it requires substantial manual intervention in the heavy fuel system, especially when the process includes mixing the heavy fuel with non sulphur in order to get into ports. A possible and promising solution for the problem is LNG as it requires less maintenance and it complies with the regulations, however, the cost component is more expensive at the moment and could lead to higher operating costs (Rødseth (2016)12; de Troije (2016)13; Pirjak (2016)14). To conclude, several key issues pose as real problems for automation in shipping to be properly implemented. Although trust is a critical issue; it has been a barrier in many other industries and aspects in our daily life’s, but as in others, so in shipping will it be a temporary element which will long be forgotten. Legal framework is important and must be discussed prior to the vessels arrival, as conventions and their implementations require time. Control method and the derived cyber security issues arising from it will pose a significant and continues challenge for liner shipping. Maintenance is a significant challenge and will require more reliable and less maintenance demanding systems. The consequences for some companies is moving from a breakdown maintenance and/or effective maintenance to predictive maintenance. Utilizing the port stay for the sufficient maintenance required, and should do so without increasing the port stay which will hamper the cost-comparison equation.
2.7 Literature review summery
From the section above we understand the structure and business of liner shipping, both the financial driving components of ocean carriers, and the operating processes which affect these factors. We also see that given the available information and knowledge, operating costs are the most important and comprehensive to which we can and should focus on. We do not focus on voyage costs as fuel plays the largest share of voyage costs and can only be analysed once the propulsion system and fuel type to be used are decided upon. In addition, as fuel consumption is a factor of fuel cost and speed, the last is not decided according to an optimal speed, but an optimal speed in regards to the schedule the ocean carrier decided upon for the specific route. Capital cost is not investigated as it designed-based, thus insufficient data of available
11 Based on personal communication with Ørnulf Jan Rødseth. February 24, 2016. 12 Based on personal communication with Ørnulf Jan Rødseth. February 24, 2016. 13 Based on personal communication with Raoul de Troije. July 7, 2016. 14 Based on personal communication with Dario Pirjak. June 12, 2016.

27
designs does not allow us to properly explore the impacts of automation on this cost element. Within operating costs three cost components stand out in their current share of total operating costs, as well as in their likelihood to change and tilt the scales of operating costs final change for an unmanned container vessel. The factors are manning, stores, spares and lubricating oils, and maintenance and repairs. As manning is straight forward when discussing unmanned vessels, the other two components are yet unknown to follow a certain trend, but are definitely likely to change as fuel type and propulsion systems are likely to change, thus making their fluctuation an intriguing one to explore. We then see the large gap between operating costs and efficiency of operating processes, and observe that manned processes and expenses are the reason for this gap. The current processes are to a large extent flawed as they present varying performance level and can only be improved as the human factor is removed from the equation. Nevertheless, although removal of the human factor will achieve significant improvements in terms of waste management, new challenges arise due to it.

28
29
3. Methodology
Considering the share of manning, maintenance and repairs, and stores in operating costs, this section introduces the qualitative and quantitative tools that will be used to estimate the effects on operating costs should have unmanned vessels be introduced. These quantitative methods will focus on the values of the three cost components to be analysed since this will allow for different scenarios to be presented. As described in section 2, the decision to focus on operating costs, rather than the other cost elements of operating a ship by Martin Stopford, is derived from the following facts: 1. Capital costs are a direct result of the vessels design. As detailed design at this moment is not available, any assumptions made would not be supported by professionals or literature. 2. Voyage cost main component is fuel. Although some reductions on energy consumption is assumed due to the removal of the crew supporting systems and optimal voyage speed, the change of fuel type which is required in order to achieve the required maintenance level, might counter balance the reduction. In addition, fuel rates fluctuate substantially, thus calculating changes using current rates for different fuels is unpractical. Lastly, fuel consumption is derived by the fuel cost and speed of the vessel, the speed is not decided according to an optimal speed, but an optimal speed in regards to the schedule the ocean carrier decides upon according to the line schedule. 3.Cargo handling cost is not likely to change as the components which influence it are not to be automated. 4. Periodic maintenance is included in the Drewry report and is not analysed as its shares of the total operating cost is inferior with comparison to the three elements discussed in the paper. As this thesis aims to analyse the impact by the introduction of unmanned vessels on the operating costs and the cost structure of operating a vessel in liner shipping, it is imperative to understand the different cost components. This is achieved through breaking down the different components and their relative share of the operating costs, which will prove the significance of the three components that are to be analysed. In addition, the thesis aims to predict the changes in the cost structure in terms of new cost components that will occur in the future as a result by the introduction of unmanned vessels. As the cost structure cannot be analysed by the data of costs alone, the new structure is presented as different scenarios for the cost comparison. In this section, we present the cost structure of operating a vessel while explaining the various components. We first put forward a hypothesis. Next, we describe the task analysis approach and the interview methodology used for it. We continue with the cost structure and the cost components of operating a vessel along with the data, which we describe the sources, the gaps, and how we solved them, followed by the base scenario and the different scenarios to be analysed. We finish with describing the cost-comparison analysis method used in section 4.
3.1 Hypothesis The literature contains many studies that link between automation and cost reduction. Next, we have seen that there is a variety of reasons for the shipping industry to move to automation. Our first hypothesis (H1) is then that there is a reduction of operating
30
costs per day from operating an unmanned vessel. Following various authors, we next hypothesize (H2) that there is a change of the cost structure of operating a vessel, as
we expect some cost components to disappear completely and other cost components to reduce significantly. The first hypotheses can be examined using cost-comparison analysis to be discussed below. The second hypotheses can be examined using task analysis and professional interviews to be discussed below.
3.2 Task analysis approach In order to evaluate the changes of operating processes and draw conclusions how these changes will impact the operating costs of the vessels, we put forth the task analysis conducted for the research. Task analysis analyses what tasks are conducted on board along with a detailed overview of each tasks. The analysis we conduct includes the understanding of the parties involved in accomplishing a specific task, along with the duration, the frequency, the costs, and the exterior factors which can influence each task, and the parties accomplishing it. We attain answers to the variables above via an interview approach as described below, and do so as we have a solid foundation to believe unmanned vessels reduction of tasks on board will be translated to monetary implications.
3.3 Interview approach
We believe the impact will affect both the cost structure and the operating processes. In order to calibrate the operating processes model and better estimate the impact of certain parameters on the cost components we need experts’ opinion. By conducting the interviews, we hope to better understand what are the mechanisms which currently define container vessel operating processes, who is conducting them, who are the parties involved, and the stage and length of each one. Furthermore, by conducting the interviews we will better understand which cost elements are to be influenced the most, the buffer at which they may fluctuate, and the difficulties and implications behind each one. We believe interviews are necessary as current literature does not provide sufficient background and basis upon this research can be conducted. In addition, as the technology is still at its conceptual stage, interviewing professional who have been involved in the limited number of projects that have been conducted till today, will immensely benefit the research and its results. The interviewees were divided into three categories; first, researchers from technical research institutes. Second, technical operational staff, including chief engineers and technical superintendents. Third, container vessel masters and commercial department personnel. We differentiate between the groups as a different set of questions is presented to each. The researchers were asked on the challenges, the cost structure, which cost elements are likely to change, how will they change and why, how do these changes influence operating processes and design, and lastly what methods can be used to mitigate negative effects if such arise. For the technical operational staff, the questions were focused on the technical processes included in running the ship, and the challenges of maintaining the level of maintenance and repairs in an unmanned container vessel. The masters and commercial department personnel were interviewed on their role in the daily running of the ship, the processes which they conduct, the time period and frequency at which they conduct them, and the time and value each processes requires.
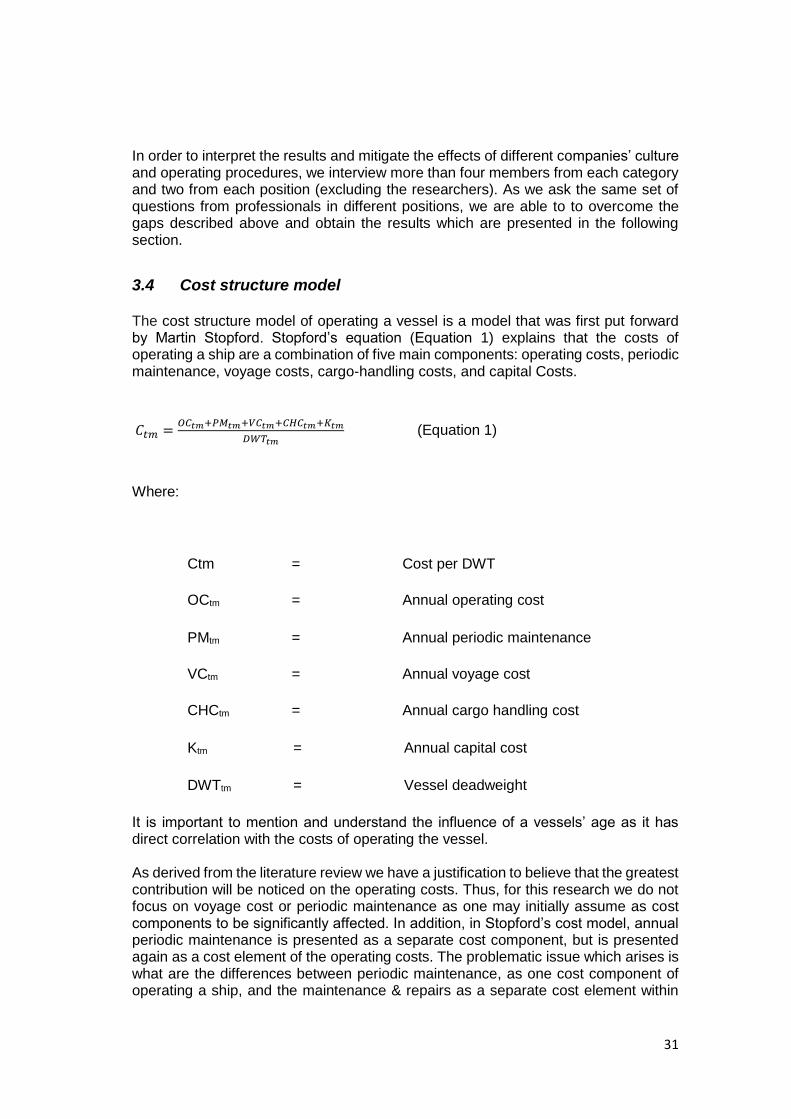
31
In order to interpret the results and mitigate the effects of different companies’ culture and operating procedures, we interview more than four members from each category and two from each position (excluding the researchers). As we ask the same set of questions from professionals in different positions, we are able to to overcome the gaps described above and obtain the results which are presented in the following section.
3.4 Cost structure model The cost structure model of operating a vessel is a model that was first put forward by Martin Stopford. Stopford’s equation (Equation 1) explains that the costs of operating a ship are a combination of five main components: operating costs, periodic maintenance, voyage costs, cargo-handling costs, and capital Costs.
𝐶𝑡𝑚 =𝑂𝐶𝑡𝑚+𝑃𝑀𝑡𝑚+𝑉𝐶𝑡𝑚+𝐶𝐻𝐶𝑡𝑚+𝐾𝑡𝑚
𝐷𝑊𝑇𝑡𝑚 (Equation 1)
Where:
It is important to mention and understand the influence of a vessels’ age as it has direct correlation with the costs of operating the vessel. As derived from the literature review we have a justification to believe that the greatest contribution will be noticed on the operating costs. Thus, for this research we do not focus on voyage cost or periodic maintenance as one may initially assume as cost components to be significantly affected. In addition, in Stopford’s cost model, annual periodic maintenance is presented as a separate cost component, but is presented again as a cost element of the operating costs. The problematic issue which arises is what are the differences between periodic maintenance, as one cost component of operating a ship, and the maintenance & repairs as a separate cost element within
Ctm = Cost per DWT
OCtm = Annual operating cost
PMtm = Annual periodic maintenance
VCtm = Annual voyage cost
CHCtm = Annual cargo handling cost
Ktm = Annual capital cost
DWTtm = Vessel deadweight
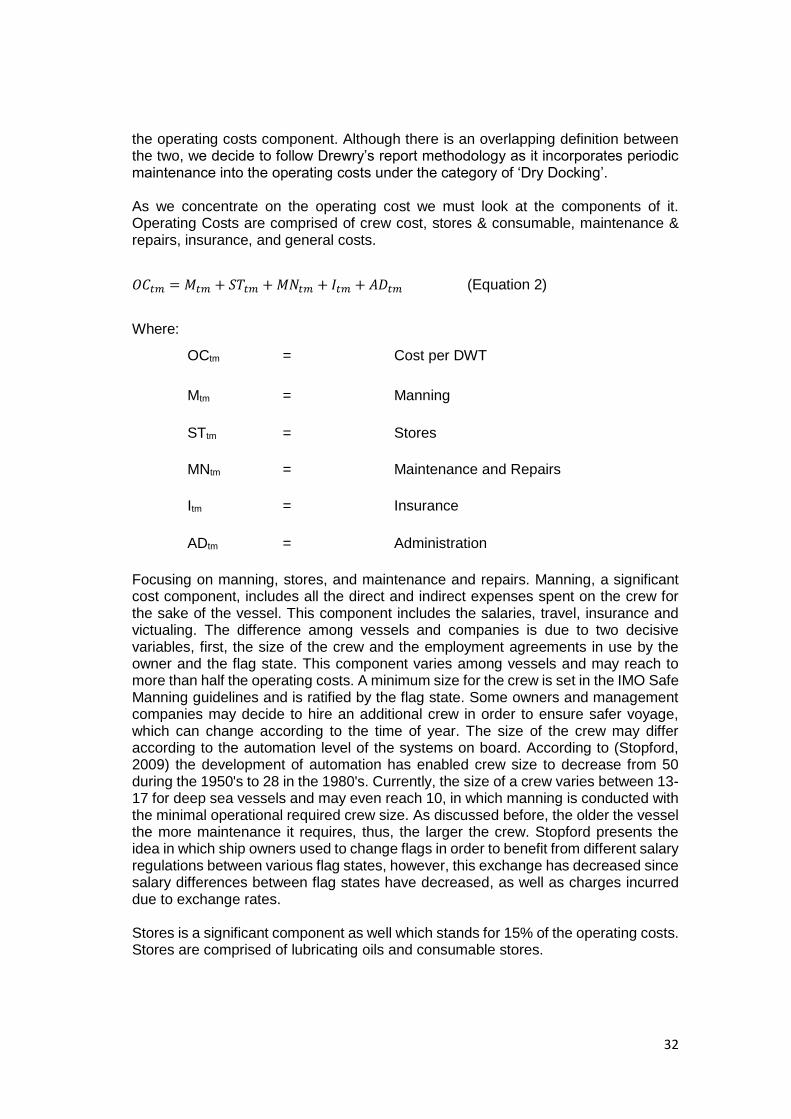
32
the operating costs component. Although there is an overlapping definition between the two, we decide to follow Drewry’s report methodology as it incorporates periodic maintenance into the operating costs under the category of ‘Dry Docking’. As we concentrate on the operating cost we must look at the components of it. Operating Costs are comprised of crew cost, stores & consumable, maintenance & repairs, insurance, and general costs.
𝑂𝐶𝑡𝑚 = 𝑀𝑡𝑚 + 𝑆𝑇𝑡𝑚 + 𝑀𝑁𝑡𝑚 + 𝐼𝑡𝑚 + 𝐴𝐷𝑡𝑚 (Equation 2)
Where:
Focusing on manning, stores, and maintenance and repairs. Manning, a significant cost component, includes all the direct and indirect expenses spent on the crew for the sake of the vessel. This component includes the salaries, travel, insurance and victualing. The difference among vessels and companies is due to two decisive variables, first, the size of the crew and the employment agreements in use by the owner and the flag state. This component varies among vessels and may reach to more than half the operating costs. A minimum size for the crew is set in the IMO Safe Manning guidelines and is ratified by the flag state. Some owners and management companies may decide to hire an additional crew in order to ensure safer voyage, which can change according to the time of year. The size of the crew may differ according to the automation level of the systems on board. According to (Stopford, 2009) the development of automation has enabled crew size to decrease from 50 during the 1950's to 28 in the 1980's. Currently, the size of a crew varies between 13-17 for deep sea vessels and may even reach 10, in which manning is conducted with the minimal operational required crew size. As discussed before, the older the vessel the more maintenance it requires, thus, the larger the crew. Stopford presents the idea in which ship owners used to change flags in order to benefit from different salary regulations between various flag states, however, this exchange has decreased since salary differences between flag states have decreased, as well as charges incurred due to exchange rates. Stores is a significant component as well which stands for 15% of the operating costs. Stores are comprised of lubricating oils and consumable stores.
OCtm = Cost per DWT
Mtm = Manning
STtm = Stores
MNtm = Maintenance and Repairs
Itm = Insurance
ADtm = Administration
33
Maintenance and Repairs are an important factor of operating costs. The costs may reach 14% and it is the maintenance which is required on a regular basis to maintain the vessel worthiness to the desired level of the company, the owners/ charterers, and the classification society. Three common spread maintenance policies are known:
The above three components will be analyzed in section 4 according to different scenarios presented below.
3.5 Data In order to conduct the costs changes in various scenarios, it is necessary to obtain relevant data. This data can predominately be found through the consolidation of various publicly accessible databases. A comprehensive description of the different data used to complete this research and the justification for their use is presented below. Before the two hypotheses can be examined, the question should be addressed which data set is the most suitable for our analysis. We decide to rely on the Drewry Ship Operating Costs data set collected for the years 2014/15. Drewry creates a comprehensive portfolio of daily and annual operating costs for a variety of vessels. We will use the container vessels information which is divided to seven vessel sizes (TEU): 500-700, 1K-2,000, 2K-3,000, 3K-4,000, 5K-6,000, 8K-9,000, 10K-12,000. The report includes a cost distribution of five main categories: Manning, Insurance, Stores and Spares, Repairs and Maintenance, Management & Administration. The data presented in the report was collected via contact from ship owners, ship managers, companies' financial reports and expert's opinion on the cost profile per vessel type and size. As the paper will focus on manning, stores & oils, and repair & maintenance, it is important to mention that manning costs are structured according to the proper manning by the International Transport Workers Federation, and repair & maintenance costs are based on a 10-year old vessel. Drewry's report includes data sets from 2009 till today. In the following, we discuss Drewry's breakdown of manning, stores, repair and maintenance. It is important to mention and understand the components as they allow us to construct our scenarios, taking into account which components can be removed and which should be maintained. Manning is comprised of the wages, overtime, and other. The cost varies between vessels sizes due to the crew size and the specific
Breakdown Maintenance. A policy in which maintenance is kept to the minimal required, any malfunction which occurs is handled per case. There are extra costs which incur due to loss of time and the derived contract breaches.
Routine Maintenance. A policy in which maintenance is conducted according to the manufacturer recommendations and the required maintenance for the vessel's superstructure. The costs increase with age.
Preventive Maintenance. A policy in which maintenance is conducted prior to any breakdown, and above the minimum required for the routine maintenance. This method is obviously more expensive as it includes more working hours and spares.
34
qualifications required to operate a large vessel, thus wages increase accordingly. Stores are broken down to three elements in the report, stores, spares, and lubricating oils. Stores include deck, cabin, and medical equipment which in an unmanned scenario can be removed completely. Furthermore, ropes/ wires are necessary items which cannot be removed and are the most significant element in stores. Safety items, maintenance paint, tools & hardware, engine stores & hardware, chemicals & gasses, and hoses and other, are all components which are crucial given a situation where ships are manned. Spares include various units for systems on board the vessel. In our case, it is difficult to state which if any are to remain. The implications of removing the spares are increased costs of storage to ensure sufficient level of the spares inventory in various stops along the route. Lubricating oils as well vary among vessel sizes, as obviously more of the products is needed. As this paper does not focus on the conceptual and material design of the vessel, any assumption made regarding lubricating oils is a result of the change of fuel and propulsion system. Repair & maintenance includes contracted services for various systems on board the vessel. They will remain and may change according to the actual design. However, one component is servicing of life rafts, which in all scenarios except for the base scenario will be completely removed. For the remainder, different estimations of increase and decrease of the costs, are presented for each scenario. Drewry's cost data involves recognized general data set problems such as personal bias of the data providers, and the fact that it is arbitrary to assume the costs to be a representation of real life rather than the average of various data sets. Moreover, an important shortcoming of the used data could be that there is no division per route and per time of year, which is assumed to be equal whereas in practice the costs may differ. This is all the more relevant because this could impact the relevance of the results. Third, Martin Stopford's model and Drewry's report include the same cost components but differ in the level of details. This influences the level of scrutiny we can achieve with the analysis as in the Drewry data set all other expenses for crewing other than salaries are categorized as ‘others'. Instead, in terms of the store's element we do get a complete breakdown of the various components. In our case of a complete removal of the crew the most important component to have a full description of is in fact stores, spares and lubricating oils. To close, we aim to provide operators, owners, and management companies, a benchmark to compare to in the case of inaccurate costs. Although the mentioned shortcomings, the data is the best data set available for the research as is to be conducted.
3.6 Cost comparison analysis The cost comparison analysis sets out to compare between the current manned operating mode costs of liner shipping and the derived elements’ costs of the crew on board, with an unmanned vessels’ costs in various operating modes. The analysis takes the base scenario for various vessel sizes and convert the values of the three elements discussed above according to the new scenario which is examined. We first put forth the current components share of total daily expenses and present a view on the future years cost distribution following recent years’ trends. We do so to emphasize the increasing share of crew wages while the others elements are decreasing due to technological developments. We continue by analysing each component reduction effect on daily operating costs, although there is a dependency
35
among the various components, we wish to explore the changes impact and possible savings by the reduction of each. We then proceed by analysing the different scenarios and reveal the possible savings of each. Upon completion of the analysis, a table summarizing the results and savings of all the scenarios is presented, allowing for the most desirable option to be presented and under which circumstances.
3.7 Scenario portrayal In the following section, we present the various scenarios to be analysed. Each component will be analysed individually and in a combined method. For each scenario following the base scenario, six results are introduced regarding repair & maintenance, three include an increase of 10 percent, 30 percent, 50 percent, and three outcomes in which repairs & maintenance are reduced by 10 percent, 30 percent, and 50 percent. The scenarios were jointly developed by top researchers in the field of maritime automation and are the results of former experiments and its conclusions in the appropriate level of automation and crew size required to operate in each.
The base scenario (scenario 0) will be current state, meaning all costs remain as is. This scenario will provide us as a benchmark upon the savings can be calculated, and is presented for all vessel sizes as described above. Following this scenario an analysis of each of the elements current share of operating costs is presented, as well as the possible savings from solely improving each. Scenario 1 will take into account a remote control operating mode where no crew on board, while focusing on stores, spares and lubes, thus presenting three sub-scenarios. The first, where reduction of the crew is available while stores is maintained as is. Second, where reduction of crew and stores of the critical requirements for the crew basic supplies are reduced. Third, will take into account a remote control operating mode where no crew on board while stores, spares, and lubes are further reduced beyond the required minimum supplies to sustain a crew. Once again we present three levels of percentage reduction for stores, spares and lubes. This scenario is set forth as leading researchers believe the mechanical systems will change to allow for a reduced maintenance ability to be applicable. We present three level of reduction as to address the lubes component rather than the stores and spares. We do so as removal of either stores or spares from the vessel will result in much higher holding costs for companies, if they wish to obtain a service level which allows safe running of the vessel along the line. Scenario 2 will take into account a remote control operating mode where no crew on board, while focusing on the repairs & maintenance, thus presenting six sub-scenarios. We follow the methodology of scenario 2, as we look to compare the savings or additional costs arising from a various maintenance & repairs possible scenarios. We compare between the reduction of crew and maintenance & repairs by 10 percent, 30 percent, 50 percent, as well as an increase of 10 percent, 30 percent, 50 percent. This scenario is essential as the savings obtained on a daily basis could provide us with an insight on the length of the ROI of the capital cost to be invested in the systems on board, as well as the breakeven point from which savings from this particular component will turn to profits.
36
The scenario 3 will be a comprehensive combination of scenario 1 and scenario 2. We wish to see the outcome of various situations where the crew is removed while the stores, spares, and lubes are reduced by various levels as maintenance & repairs are increased by various levels and vice versa. We do so as it will provide us the most comprehensive description of the operating costs in different scenarios, and will allow us to understand what is the buffer in which naval architects can design the vessels, while still maintaining an operating costs savings compared to the manned vessels operating costs.
3.8 Methodological limitations Certain limitations must be presented prior to the presentation of the results. First, as the design of the vessel has not yet been conducted, the changes in operating costs per day are ignoring any changes in capital costs, voyage costs, periodic maintenance, and cargo handling costs. The last is not likely to change in the foreseeable future as the operating model will be such in which port entrance and departure are conducted in a manned mode. Second, the resulted reduction or addition to the vessel costs will be according to the balance between the increase of capital costs and the reduction of operating costs, which is not in the scope of the study. As voyage cost main component is fuel, no addressing is conducted in the paper and will eventually be determined by the energy system and its consumption used for the vessels. This is suggested as an area for further research.

37
4. Results and data analysis
In this section the outcomes of the scenario analysis are presented. All scenarios are used to predominantly draw conclusions concerning unmanned vessels operating costs and their effects on savings. As described beforehand, due to the features of the data, results are focused on a generalized function level and are used to answer sub-research questions II & III. Therefore, results are classified by year, cost, and separate effect. This includes calculating the combined cost elements effects, which is of great significance for answering sub-research question three, as combined scenarios are the most likely to occur. Hence, interpreting conclusions about how the unmanned vessels in different scenarios will impact the daily operating costs of a vessel.
4.1 Task analysis results Most likely the greatest benefit of unmanned vessels is big data and what it actually means to us, such as proper energy consumption reports according to the time of year, route, speed, etc. This will allow ocean carriers to better understand their expanses and optimize their pricing strategy compared to competitors. Many shippers will benefit from this as stable shipping expenses allow for clarity and basis to plan and grow their businesses without needing to adjust to fluctuating financial environments in the world of liner shipping. Big data will also play a role which effects both navigation and safety through weather reports and forecasting. Today, weather reports are collected by the master or by one of the bridge officers. These estimations are subjective and may change due to experience/ vision/ time of day/ physical status. Unmanned vessels will produce accurate, more frequent, weather measures. The new additional information will allow for routing and collision avoidance to be optimized. Safety improvement is achieved by ballasting and de-ballasting which is conducted automatically to provide the optimal stability for the vessel in any given sea condition and cargo load. If we draw our attention to figure 8 which presents the processes in an automated operating mode, we reveal key insights which support the described above. First, many activities are no longer being conducted as they are irrelevant for unmanned vessels. Although some activities such as various reports regarding the crew status, training and health, are only time consuming for the crew and do not have direct financial implications, some activities such as cooking and life-boat maintenance do require specific additional crew members and expenses. In addition, as it is part of the administration cost component, many reports are first written and filled by the crew and then analyzed and registered by shore-based staff members which their time does have direct cost implications. Second, we see many activities being replaced by machine and are being fully automated; giving ground to great savings on administration expenses. The processes can be divided into two main divisions, intraship processes and third party related processes. In terms of intraship processes we benefit from equal performance level throughout the voyage which is not influenced by weather, physiological status, or experience, thus achieving greater safety for the vessel and the cargo. Moreover, activities such as ballasting and ballast exchange can be optimized in consideration
38
with weather, schedule, and route. For the registration and position fixing, automation will rip benefits and allow tracing back and optimizing the route and events on board the vessel for future sails, a feature which to a large extent was not possible as the crew performance varied due to exterior factors, and changing of crews. Documentation activities see a drastic change as for each port the specific documents required can be sent on a pre-defined distance and time, although this activity has been conducted manually prior to automation, it can be easily automated and does not impact the organizational structure. Third, several core activities will remain and the method of applying them will depend on the operating model to be chosen, whether one operator to supervise a fleet, or a bridge crew to control each vessel at times of deep sea voyage. Lastly, today maintenance is conducted both at sea and at shore, the majority is conducted at sea and fueling or replenishing oil and stores, as well as breakdown maintenance are conducted at shore. In an unmanned operating model all maintenance will be massed to port stay, thus all activities relating to maintenance and cargo handling will pose a significant challenge for automation in liner shipping as elaborated extensively in section 2. Accordingly, the fact of these activities remaining can lead to increase costs of storage and maintenance expenses in stops along the line, as port stay will be aimed to remain the same, meaning a concentration of technical manpower in a short period of time, not including unplanned maintenance, and also further hampered as maintenance on deck during cargo handling is not possible. The full extent of the implications by this change of maintenance policy and routine is yet unknown. Ocean carriers need to acknowledge that unmanned technology may lead to alteration of schedule, while naval architects need to look for solutions which will allow simultaneously conducting maintenance and cargo handling.
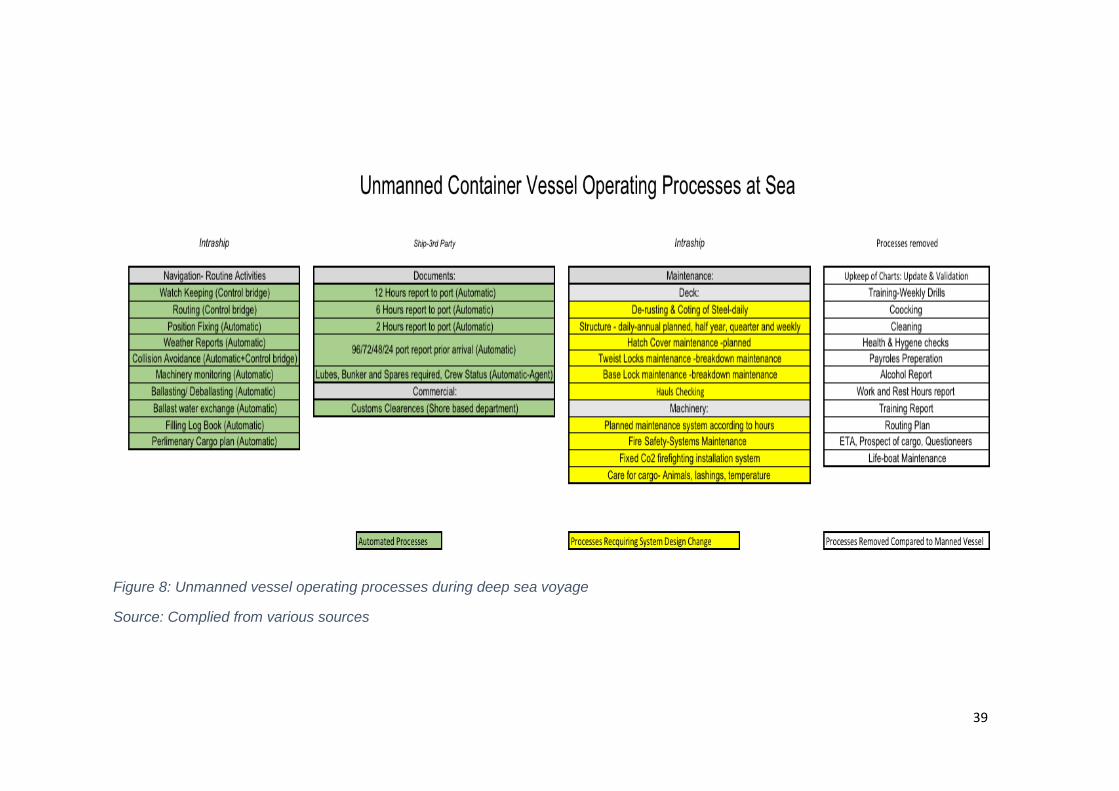
39
Figure 8: Unmanned vessel operating processes during deep sea voyage
Source: Complied from various sources

40
4.2 Cost model results
4.2.1 Base scenario results Looking in depth into the current status of operating costs for container vessels we clearly see a pattern of increased operating costs in all vessel sizes. As can be seen in figure 9 It is clear that although sizes are experiencing an increase of costs, vessels above 5,000 TEU have the highest increase.
Figure 9: Container vessel-total operating costs - 2009-2014 ($ per day)
However, if we focus our attention towards figure 10, we see that it is in fact smaller vessels that are presenting the highest percentage increase in operating costs as compared to the larger vessels.
3,5004,3005,1005,9006,7007,5008,3009,1009,900
10,70011,500
2009 2010 2011 2012 2013 2014
Container Vessel-Total Operating Costs - 2009-2014 ($ per day)
500-700 1-2,000 2-3,000 3-4,000 5-6,000 8-9,000 10-12,000

41
Figure 6: Container vessel-total operating costs - 2009-2019 ($ per day) - percentage increase
If we continue looking at the cost elements in depth, in order to better understand the cause behind the increased costs, we focus our attention on figure 11 where we present the 2014 breakdown of operating costs per day and the share of each elements for different vessel size. First, we conclude that as vessel size increases, the manning cost element share of total operating costs is decreased, while stores, spares and lubes share of total operating costs increases, this is in line with the break down of costs. The main components that affect this change are in fact the lubricating oils. Third, maintenance & repairs do not differ substantially between different vessel sizes.
0.9500.9700.9901.0101.0301.0501.0701.0901.1101.1301.1501.1701.1901.2101.230
2009 2010 2011 2012 2013 2014 2015 2016 2017 2018 2019
Container Vessel-Total Operating Costs - 2009-2019 ($ per day) - percentage increase
500-700 1-2,000 2-3,000 3-4,000
5-6,000 8-9,000 10-12,000
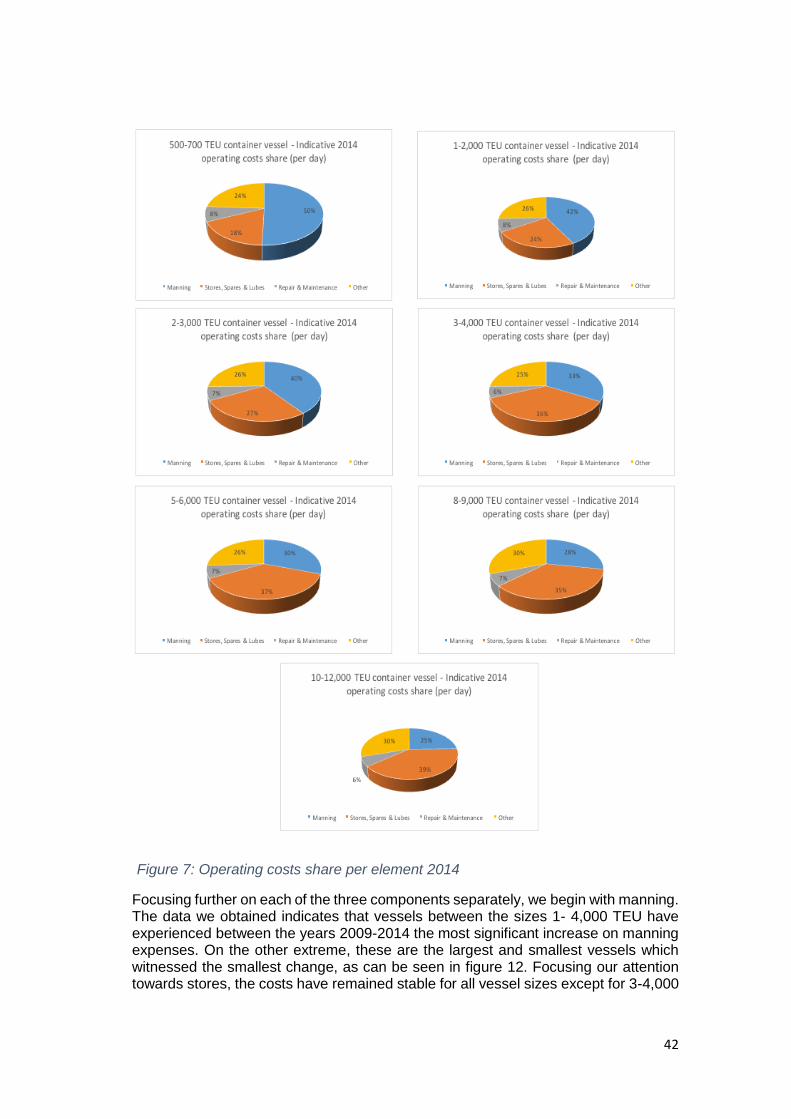
42
Focusing further on each of the three components separately, we begin with manning. The data we obtained indicates that vessels between the sizes 1- 4,000 TEU have experienced between the years 2009-2014 the most significant increase on manning expenses. On the other extreme, these are the largest and smallest vessels which witnessed the smallest change, as can be seen in figure 12. Focusing our attention towards stores, the costs have remained stable for all vessel sizes except for 3-4,000
Figure 7: Operating costs share per element 2014

43
TEU vessels which increased by 20% between 2009-2014 as seen in figure 13. Regarding spares, lubes, maintenance and repairs, no significant conclusion can be seen for a certain vessel size, as they all present a mutual percentage growth.
Figure 8: Manning Costs - 2009-2014 ($ per day)-Percentage change compared to 2009
Figure 13: Stores costs - 2009-2014 ($ per day)
0.90000
0.95000
1.00000
1.05000
1.10000
1.15000
1.20000
2009 2010 2011 2012 2013 2014
Manning Costs - 2009-2014 ($ per day)-Percentage change compared to 2009
500-700 1-2,000 2-3,000 3-4,000
5-6,000 8-9,000 10-12,000
0
100
200
300
400
500
600
2009 2010 2011 2012 2013 2014
Stores Costs - 2009-2014 ($ per day)
500-700 1-2,000 2-3,000 3-4,000
5-6,000 8-9,000 10-12,000
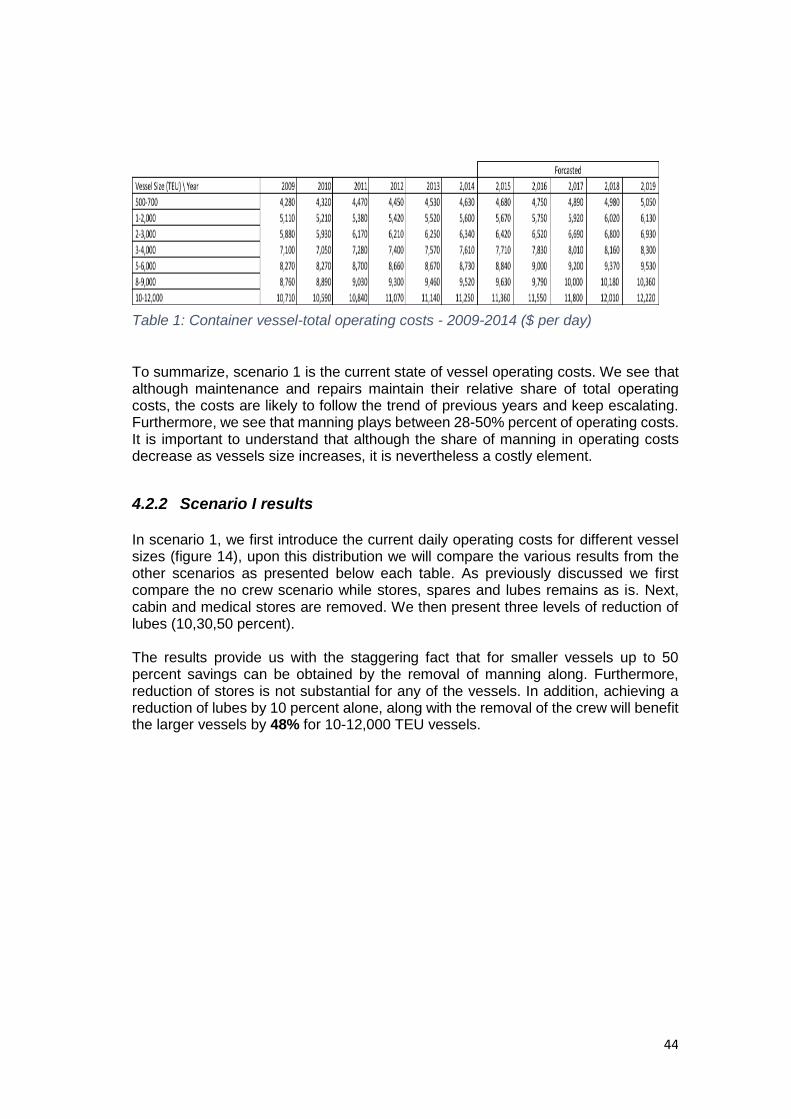
44
To summarize, scenario 1 is the current state of vessel operating costs. We see that although maintenance and repairs maintain their relative share of total operating costs, the costs are likely to follow the trend of previous years and keep escalating. Furthermore, we see that manning plays between 28-50% percent of operating costs. It is important to understand that although the share of manning in operating costs decrease as vessels size increases, it is nevertheless a costly element.
4.2.2 Scenario I results In scenario 1, we first introduce the current daily operating costs for different vessel sizes (figure 14), upon this distribution we will compare the various results from the other scenarios as presented below each table. As previously discussed we first compare the no crew scenario while stores, spares and lubes remains as is. Next, cabin and medical stores are removed. We then present three levels of reduction of lubes (10,30,50 percent). The results provide us with the staggering fact that for smaller vessels up to 50 percent savings can be obtained by the removal of manning along. Furthermore, reduction of stores is not substantial for any of the vessels. In addition, achieving a reduction of lubes by 10 percent alone, along with the removal of the crew will benefit the larger vessels by 48% for 10-12,000 TEU vessels.
Table 1: Container vessel-total operating costs - 2009-2014 ($ per day)

45
Figure 9: Daily operating costs- 2014 ($ per day)
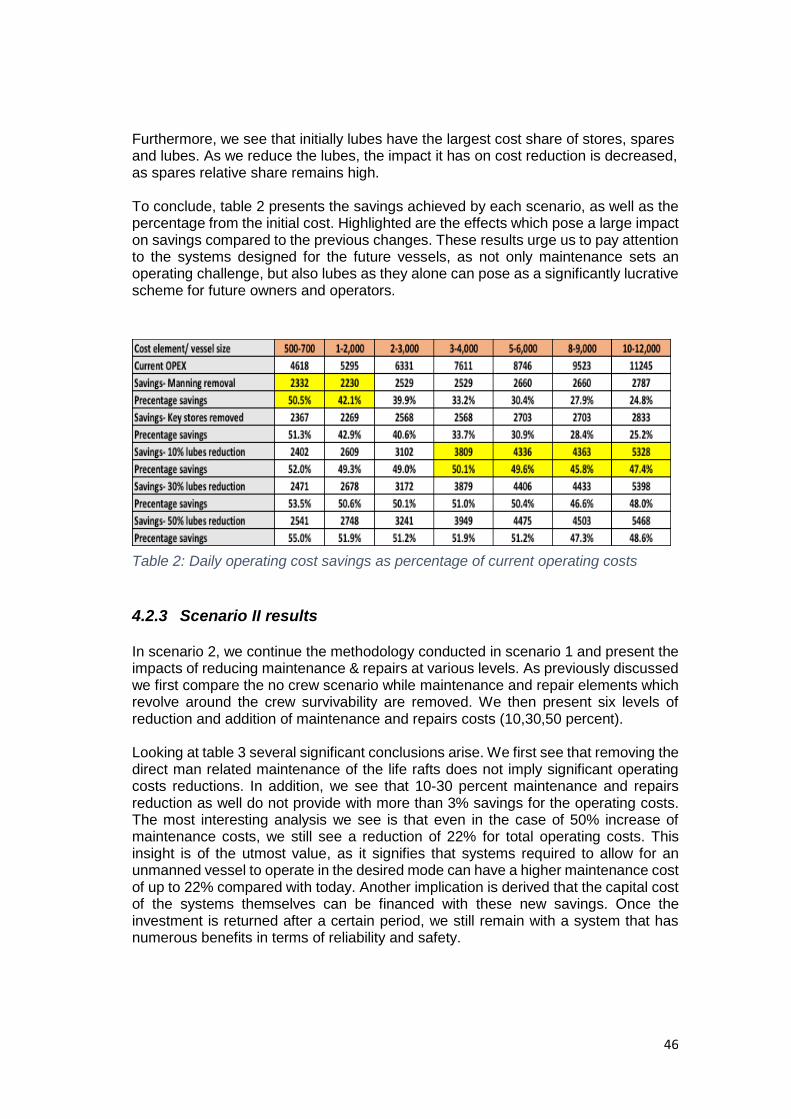
46
Furthermore, we see that initially lubes have the largest cost share of stores, spares and lubes. As we reduce the lubes, the impact it has on cost reduction is decreased, as spares relative share remains high. To conclude, table 2 presents the savings achieved by each scenario, as well as the percentage from the initial cost. Highlighted are the effects which pose a large impact on savings compared to the previous changes. These results urge us to pay attention to the systems designed for the future vessels, as not only maintenance sets an operating challenge, but also lubes as they alone can pose as a significantly lucrative scheme for future owners and operators.
4.2.3 Scenario II results In scenario 2, we continue the methodology conducted in scenario 1 and present the impacts of reducing maintenance & repairs at various levels. As previously discussed we first compare the no crew scenario while maintenance and repair elements which revolve around the crew survivability are removed. We then present six levels of reduction and addition of maintenance and repairs costs (10,30,50 percent). Looking at table 3 several significant conclusions arise. We first see that removing the direct man related maintenance of the life rafts does not imply significant operating costs reductions. In addition, we see that 10-30 percent maintenance and repairs reduction as well do not provide with more than 3% savings for the operating costs. The most interesting analysis we see is that even in the case of 50% increase of maintenance costs, we still see a reduction of 22% for total operating costs. This insight is of the utmost value, as it signifies that systems required to allow for an unmanned vessel to operate in the desired mode can have a higher maintenance cost of up to 22% compared with today. Another implication is derived that the capital cost of the systems themselves can be financed with these new savings. Once the investment is returned after a certain period, we still remain with a system that has numerous benefits in terms of reliability and safety.
Table 2: Daily operating cost savings as percentage of current operating costs
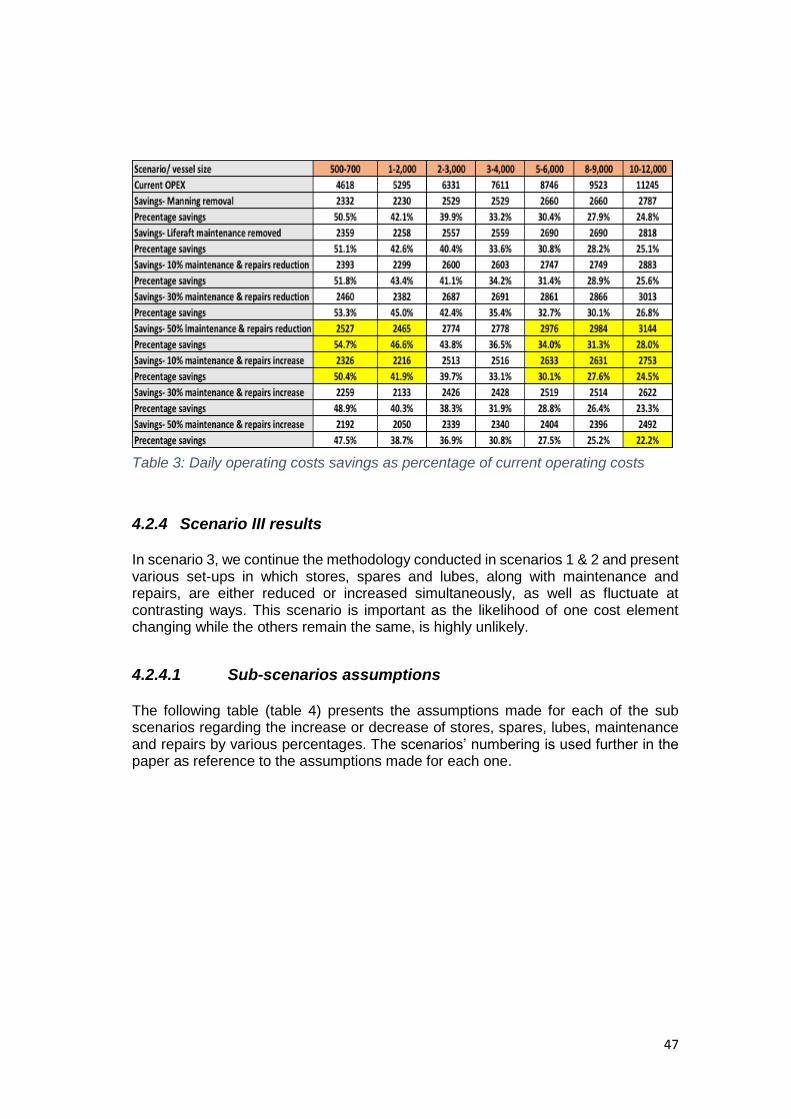
47
4.2.4 Scenario III results In scenario 3, we continue the methodology conducted in scenarios 1 & 2 and present various set-ups in which stores, spares and lubes, along with maintenance and repairs, are either reduced or increased simultaneously, as well as fluctuate at contrasting ways. This scenario is important as the likelihood of one cost element changing while the others remain the same, is highly unlikely.
4.2.4.1 Sub-scenarios assumptions The following table (table 4) presents the assumptions made for each of the sub scenarios regarding the increase or decrease of stores, spares, lubes, maintenance and repairs by various percentages. The scenarios’ numbering is used further in the paper as reference to the assumptions made for each one.
Table 3: Daily operating costs savings as percentage of current operating costs
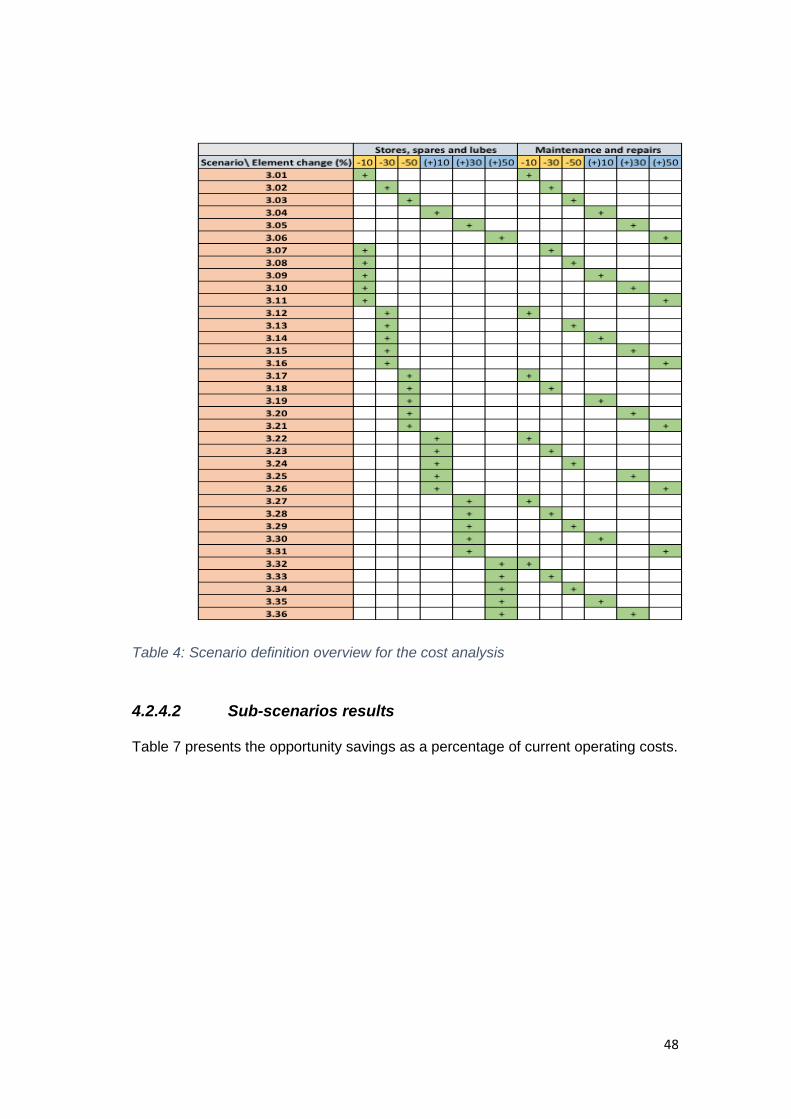
48
Table 4: Scenario definition overview for the cost analysis
4.2.4.2 Sub-scenarios results Table 7 presents the opportunity savings as a percentage of current operating costs.
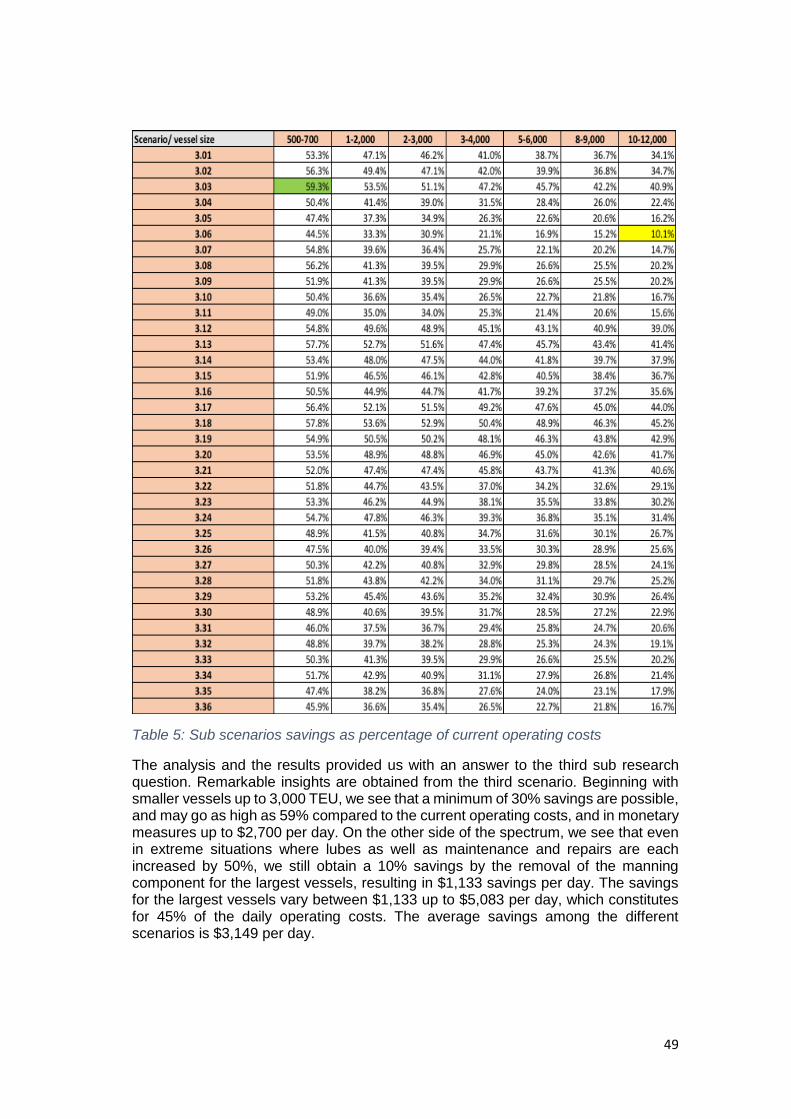
49
Table 5: Sub scenarios savings as percentage of current operating costs
The analysis and the results provided us with an answer to the third sub research question. Remarkable insights are obtained from the third scenario. Beginning with smaller vessels up to 3,000 TEU, we see that a minimum of 30% savings are possible, and may go as high as 59% compared to the current operating costs, and in monetary measures up to $2,700 per day. On the other side of the spectrum, we see that even in extreme situations where lubes as well as maintenance and repairs are each increased by 50%, we still obtain a 10% savings by the removal of the manning component for the largest vessels, resulting in $1,133 savings per day. The savings for the largest vessels vary between $1,133 up to $5,083 per day, which constitutes for 45% of the daily operating costs. The average savings among the different scenarios is $3,149 per day.

50
For medium size vessels between 5-9,000 TEU, other than one extreme scenario in which both elements increase by 50%, resulting in savings of 15-16%. The minimum savings vary between 20-46%. Beyond the overwhelming values, the true significance behind them lies in the big numbers of yearly savings and what can be achieved with the new savings, as seen in table 6. Taking the lowest savings value for 10-12,000 TEU vessel of $1,133 per day, and multiplying it by 365 we save an astounding $4,063,545. This value is obtained by merely one year. As the saving pile up during the lifetime of the vessel, ocean carriers, owners, and operators can all gain substantially by this technology. Furthermore, these savings counter balance the likelihood of hefty capital cost investment that will be required.
Table 6: Operating costs savings compared to current operating costs ($ per annum)
51
4.3 Summary of the results In the section above we have analyzed multiple scenarios to see the impact by automation through changes of each cost element by itself, as well as combined with changes in other elements. During the analysis, we came up with several insights that are important for ocean carriers to be aware of. Beginning with the initial analysis we see that for small vessels, manning costs can go as high as 50%, while for larger vessels it is less, but nevertheless, can still stand for 25% of the daily operating costs. We see that as vessel’s size increases the main cost element is stores, spares, and lubes. We understood that maintenance does not play an important component of the daily operating costs, but still pose the greatest operational challenge to overcome. We do conclude that reducing the lubes is highly lucrative for larger vessels, and should be a main concern during the design phase, as significant savings, especially for vessels above 3,000 TEU, can be achieved. We continued by investigating the correlation between different cost elements scenarios and operating costs savings per day and conclude that substantial savings await by unmanned vessels for all vessel sizes. We see that in situations where manning is removed, but the other components increase, we still obtain significant savings per day, where in annual savings amount up to $1,855,295. Bellow, table 7 summarizes the results obtained during this section.

52
Table 7: Operating costs savings compared to current operating costs per scenario ($ per annum)\
53
5. Conclusions
In this section we first present the main findings of the research with regards to the main and sub-research questions. We then continue by stating the limitations of the research which are not methodological as described in section 3. The limitations are important as they refer to the scope and knowledge currently available on the matter. We finish with suggesting the areas for further research, these are being of the utmost importance as the concept of automation in liner shipping emerges, several key operational, technical, and legislative aspects must be further investigated.
5.1 Main Findings This study was steered by the main research question of "what is the impact of the introduction of automated vessels on the container vessels operating model?". The concept of automation impacting liner shipping is based on the idea that liner shipping is influenced, both financially and structurally, by manned procedures and thus vulnerable to its performance. As such, liner shipping has an embedded operating variable which does not progress at the rate of technology and is independent of the service it provides, or the environment where it operates in, thus, any decrease of these effects have a direct impact on stability and costs of the service, resulting in a decrease in transportation costs which will directly influence global trade. The main approach was to take Martin Stopford's (2009) model of shipping operating costs and focus on three cost elements as a measure of change which drives a significant portion of the daily operating costs. Such an approach made it possible to assess the financial impact of unmanned vessels on the daily operating costs. In order to deliver a complete evaluation, the main research question was divided into three sub-research focuses. The first research sub-question was ‘What are the current mechanisms which define the container vessel operating process?’. To answer, it was vital to primarily understand what is liner shipping and see how a typical ocean carrier providing line services is constructed. We concluded that the mere fact of liner shipping results in a certain form of service and expectation, and by thus have an embedded imperfection of time constraints and administrative work. Apart from the ocean carriers’ structure, a vessel's voyage is operationally divided into three stages, port arrival/ departure and deep sea voyage. Each stage incorporates different processes within it. The processes aboard the ship can be divided into three sections, first, cargo related processes, either commercial or technical. Second, vessel maintenance and safe operating processes. Third, a man oriented processes concerning solely the crew on-board. The last is significant, as many of these activities play a significant share of the time and expenses of all parties involved, resulting in activities that without a crew on board would have not been conducted, thus the result is substantial savings to be earned by this mere fact alone. Furthermore, the activities which occur aboard the ship are directly correlated with the structure of an ocean carrier, thus, a change in the activities occurring aboard the vessel will result in a structural change of the ocean carrier company as well. Researchers can now use the information obtained as a tool for automation design in a vessel, we can now better understand the requirements of the systems that are to replace the crew. The second research sub-question was ‘How will these processes (operating processes) change for an automated vessel’. We find, since automation is a
54
revolutionary step for shipping, several challenges arise which must be solved. We begin with exploring the ground for automation from a safety point of view and conclude that the human element is undisputedly the leading factor for maritime accidents, which also triggers substantial losses every year. We continue by touching upon the design benefits in terms of additional cargo to be gained and conclude that additional cargo capacity is possible, however, will be determined by the balance between the additional systems to be loaded and the expected vessel size to be desired. We finish with reviewing the increasing share in recent years of crewing costs as part of operating costs and conclude that crew size must be altered for owners to be financially fit. Following the above, we focus on the challenges and notice the increasing importance of cyber security as a limitation of the success of unmanned vessels. Currently, ocean carriers greatest challenge lies in achieving a design which will reduce the demand for maintenance as it is conducted today, and provide a failure-free system which can reliably operate for long periods of time. In addition, maintenance plays a key role in the operating processes and will have an immense impact on port stay. The amount of impact this will have can only be assessed post the vessel design. We recommend setting the desired length of port stay and the desired maintenance level that is required to allow for an ocean crossing voyage, along with the required redundant systems on board, and design according to these variables. Having an operational layout described can allow for the appropriate systems to be installed along with the derived design. The remainder of the challenges such as trust in the system, appropriate legal framework, and control, are all solvable and will not pose as barriers and challenges in the long-run. Next, we focus on the operating processes as they are likely to occur with unmanned vessels. The underlying concept is determined by the degree and mode of automation to be implemented. We conclude that current processes are to a large degree conducted by a man and have remained so due to lack of systems to substitute them. We understand that these processes vary among individuals and are subjective to the physical and mental status of the individual, as well as his experience. Currently, many activities on-board the vessel are conducted because there is a crew on board and have no contributing value to the service. New operating processes model for unmanned vessels relies on a high-performance level by the systems on-board, and will be more efficient as all activities are value adding. We see that automation will lead to a major waste reduction and process improvement in daily activities. The most significant of them all will be noticed in fewer activities per vessel. Unmanned vessels achieve a highly efficient process flow as no non-value adding activities are conducted. In a utopic operating mode where no man involvement is made, greater accuracy and stability of services is achieved, resulting in a much-needed reduction of variability and uncertainty. Although utopic by definition, it is not as implausible as imagined, as full automation materializes in terminals and mooring systems, the level of human interaction constantly decreases. We focus on an operating mode where manned intervention is required for the port arrival and departure stages and conclude that time, administration processes, and costs, are likely to disappear completely such as travel expenses for sea fearers, training hours, and the most significant component-salaries. The final outcome will depend on the method of crew deployment, whether positioning a crew at each port or move the crew along with the vessel. Resulting in an increased expenses of traveling, but decreased expenses on salaries. We recommend the decision to be made based on the number of stops along the route and the possibility to combine one crew to serve a number of vessels in a port that serves several lines. For ocean carriers the underlying result of automation

55
is new process flow which provides vaster information and allows for better decision making, routing optimization, and stability of the vessels. In addition, some of the processes will be translated to either shore based position expanding their scope of activities or new positions filling in for the emerging gap. On an industry level, they require all parties involved such as port authorities, carriers, agents, etc. to move towards a digitized documentation procedure, thus allowing for the documentation processes to be removed and by thus achieving greater efficiency and flow of operating processes. The third research sub-question was ‘What are the cost implications of autonomous fleet operating processes?’. To answer we look at the cost elements of manning, stores, spares, lubes, maintenance and repairs. We analyse each element alone as well as combined in various scenarios to better understand what possible savings or additional costs are likely to be incurred. From the results, significant implications are obtained. First, we clearly see that unmanned vessels withhold huge potential for operating costs savings per vessel. Savings for 10-12,000 TEU may go as high as $1.8M, and as low as $413K per annum per vessel. Second, substantial savings of up to 49% are achieved by removing the personnel on-board, even in cases of increased maintenance, repair, stores, spares and lubes costs. Third, maintenance and lubricating oils become the dominant cost elements of daily operating costs for an automated vessel. The savings described above become notably more substantial as we take into account that ocean carriers operate a fleet of vessels, resulting in millions of dollars per annum savings. These savings further indicate that unmanned vessels are the precise comparative advantage that will decide on who will become a market leader, and will be forced out due to inability to compete with the unmanned freight rates. Finally, the savings on daily operating costs can be directly channelled towards the initial capital costs, that are believed by leading researchers in the field to increase substantially due to advanced technology required on-board. The results obtained in the previous section pose naval architects with key factors to take into account when designing such vessels, while deciding on the most suitable propulsion and control systems, achieving a reduction of lubes usage will rip great benefits even in the case of high maintenance and repairs costs.
5.2 Limitations of the research Although the outcomes of this research are significant, there are several limitations, which need to be remembered in order to fully comprehend and unravel the results. Firstly, we use the experience and current knowledge available by professionals from different companies instead of conducting a detailed registration of all the activities of one company. We believe that there is an advantage in this approach as it allows to have a more comprehensive detailed representation of the operating processes, while simultaneously unravel challenges and gaps not biased by a company's working processes or agenda. The advantage of such approach lies where looking at a single company level, some activities would have been disregarded or partially underestimated, as looking at various companies, we overcome these drawbacks. Additionally, the cost elements investigated above are inspected as self-standing and have an implication on other cost elements which have not been investigated in this paper. As these elements are directly correlated with other elements, conducting
56
scenarios while ignoring this relationship could lead to results that need to be adjusted per different companies. Because the reality of a full cost structure change is expected, it is likely to see several changes to the scenarios. Thus, the full potential of these changes is yet to be known. Furthermore, different vessel types issues exist, since some vessel types are more complex than others, we can expect different operating processes as well as operating costs. As a consequence, the results refer to container vessels and require a proper adjustment in order to be compatible with other types of vessels.
5.3 Areas for further research As this paper focuses on current developments revolving unmanned vessels and their effect on the cost structure, cost components, and the operating model, there are numerous fields of interest this research could have followed. Firstly, this paper only focuses on three cost elements of the operating costs. Since there are more cost elements, it is essential that they will be investigated. Furthermore, it is pertinent that such analysis is conducted for different types of vessels and different routes, in order to assemble a picture of what the costs and savings for other vessels may be. Aside from the cost structure, but highly correlated is the vessel’s design. This paper touched upon the topic, however, a profound answer for the total cost changes can only be achieved once a detailed design of a vessel is available. It is impartial to have the design as it concerns the aspects of safety and operating mode the vessels will operate in, and thus makes the topic a crucial one to further research. This paper also touched on the challenges ocean carriers face due to the complexity of the systems as well as industry acceptance. However, this paper only mentions the challenges and explains the core issues at hand. Future research must focus on the key issues as cyber security, maintenance, and control. Cyber security is crucial as it allows for the system's trustworthiness to be certified and approved for exterior stakeholders. Maintenance and control relate to the topic previously mentioned of vessel design and the derived operating mode. Furthermore, this paper touched on the complications that unmanned vessels may face due to the unsuitable legal environment to work upon. However, this paper only mentions the complexity of manned-unmanned interactions and the liability issues. Future research may want to set the basic framework for countries to act upon, while initiating the required dialog which will touch upon the key issues mentioned above prior to the arrival of the vessels. In closing, the time span at which the unmanned vessels’ vision is materializing, in regards to the maritime industry, leads to many complicated challenges on one hand and fascinating, innovative opportunities on the other. A future in which unmanned vessels are able to safely and fully navigate the seas is closer than many would have imagined. How such vessels integrate into maritime trade will depend on not solely cost savings from reduction of systems and increased performance, but also stakeholders’ approval to partake with a new and not yet fully explored system. The role that unmanned systems play in our lives is ever increasing, and the use of it in an unstable environment could lead to ground-breaking changes in the industry structure, the companies which work in such realm, and the way they operate in it.

57
Thus, the effects of such systems will have, along with the challenges they face are important areas for further research in the following years.

58
59
6. Bibliography
1 Autor, D. H., Levy, F., & Murnane, R. J. (2003). The Skill Content of Recent Technological Change: An Empirical Exploration THE SKILL CONTENT OF RECENT TECHNOLOGICAL CHANGE: AN EMPIRICAL EXPLORATION*. Source: The Quarterly Journal of Economics, 118(4), 1279–1333. Retrieved from http://www.jstor.org/stable/25053940
2 Bendorf, H. (1969, April 1). Notes on the Design and Operation of Automated Ships. Retrieved Januery 15, 2016, from Deep Blue- University of Michigan: http://deepblue.lib.umich.edu/handle/2027.42/91652?show=full
3 Branch, A. E. (2007). Ship, their cargoes, trades and future trends (8th ed.). Oxford, UK: Routledge.
4 Branch, A. E., & Robarts , M. (2014). Branch's Elements Of Shipping (9 ed.). Abingdon, Oxon, UK: Rouledge .
5 Brynjolfsson, E., & Mcafee, A. (2011). Winning the Race With Ever-Smarter Machines.
6 Aldous, L., Smith, T., Bucknall, R., & Thompson, P. (2015). Uncertainty analysis in ship performance monitoring. Ocean Engineering, 110, 29–38. http://doi.org/10.1016/j.oceaneng.2015.05.043
7 Burmeister, H., Bruhn, W. C., Rødseth, Ø. J., & Porathe, T. (2014). Can unmanned ships improve navigational safety ?
8 Chavaillaz, A., Wastell, D., & Sauer, J. (2016). System reliability, performance and trust in adaptable automation. Applied Ergonomics, 52, 333–342. http://doi.org/10.1016/j.apergo.2015.07.012
9 Cullinane, K., & Khanna, M. (1999). Economies of Scale in Large Container Ships Economies of Scale in Large Container Ships Kevin Cullinane and Mahim Khanna *, 33(2), 185–207.
10 Cullinane, K., & Khanna, M. (2000). Economies of scale in large containerships: optimal size and geographical implications. Journal of Transport Geography, 8(3), 181–195. http://doi.org/10.1016/S0966-6923(00)00010-7
11 Drewry. (2015). Ship operating Costs 2014-2015. London: Drewey.
12 DNV-GL. (n.d.). 7aa7d7603cd2b9fe7655ae6b3f454108f9732df0 @ www.dnvgl.com. Retrieved from https://www.dnvgl.com/technology-innovation/revolt/
13 The Influence of Expertise on Maritime Driving Behaviour. Applied Cognitive Psychology, 27(4), 483–492. http://doi.org/10.1002/acp.2925
14 Gregoriades, A., & Sutcliffe, A. G. (2006). Automated assistance for human factors analysis in complex systems. Ergonomics, 49(12-13), 1265–1287. http://doi.org/10.1080/00140130600612721
60
15 Gupta, S. G., Ghonge, M. M., & Jawandhiya, P. M. (2016). Review of Unmanned Aircraft System ( UAS ) Review of Unmanned Aircraft System ( UAS ), (April 2013).
16 Harlander, L. (1964). Ship Automation To What Extent. Naval Engineers Jounal , 76 (2), 265-274.
17 Heaver, T. D. (2002). The Evolving Roles of Shipping Lines in International Logistics. International Journal of Maritime Economics , 4 (3), 210-230.
18 Heaver, T. D. (2010). The response of liner shipping companies to the evolution of global supply chain management. In C. o. authors, & C. T. Grammenos (Ed.), The Handbook of Maritime Economics and Business (2nd ed., pp. 464-470). London, UK: Lloyd's List.
19 Hirdaris, S. E., Cheng, Y. F., Shallcross, P., Bonafoux, J., Carlson, D., Prince, B., & Sarris, G. A. (2014). Considerations on the potential use of Nuclear Small Modular Reactor (SMR) technology for merchant marine propulsion. Ocean Engineering, 79, 101–130. http://doi.org/10.1016/j.oceaneng.2013.10.015
20 Insaurralde, C. C., & Lane, D. L. (2014). Engineering Applications of Arti fi cial Intelligence Metric assessment of autonomous capabilities in unmanned maritime vehicles. Engineering Applications of Artificial Intelligence, 30, 41–48. http://doi.org/10.1016/j.engappai.2013.09.003
21 Itoh, K., Yamaguchi, T., Hansen, J. P., & Nielsen, F. R. (2001). Risk Analysis of Ship Navigation by Use of Cognitive Simulation. Cognition, Technology & Work, 3(1), 4–21. http://doi.org/10.1007/PL00011520
22 Jonas Aamodt Moræus, Dr. Scott N. MacKinnon, Burmeister, H.-C., Dr.-Ing. Karsten Wehner, Dr. Volker Köhler, Ørnulf Jan Rødseth, … Dr. Benedicte Sage-Fuller. (2016). Research in maritime autonomous systems project Results and technology potentials.
23 Li, Z., Mao, W., Ringsberg, J. W., Johnson, E., & Storhaug, G. (2014). A comparative study of fatigue assessments of container ship structures using various direct calculation approaches. Ocean Engineering, 82, 65–74. http://doi.org/10.1016/j.oceaneng.2014.02.022
24 Liu, D., Jaramillo, M., & Vincenzi, D. (2015). The Effects of System Reliability and Task Uncertainty on Autonomous Unmanned Aerial Vehicle Operator Performance under High Time Pressure. Human Factors and Ergonomics in Manufacturing & Service Industries , 25 (5), 515-522.
25 Luo, M., Fan, L., & Wilson, W. W. (2014). Firm growth and market concentration in liner shipping. Journal of Transport Economics and Policy, 48(PART 1), 171–187.
26 Man, Y., Lundh, M., Porathe, T., & MacKinnon, S. (2015). From Desk to Field - Human Factor Issues in Remote Monitoring and Controlling of Autonomous Unmanned Vessels. Procedia Manufacturing, 3(Ahfe), 2674–2681. http://doi.org/10.1016/j.promfg.2015.07.635
61
27 Managed, I. S., & Thomas, B. Y. (n.d.). UK P & I CLUB The human element, 1–8.
28 Maria, E., Lars, B.-G., Eide, I., Hørte, T., & Skjong, R. (n.d.). SPRINGER BRIEFS IN CLIMATE STUDIES Ship and Offshore Structure Design in Climate Change Perspective.
29 Marshall, A. (1890). Principles of Economics. In A. Marshall, Principles of Economics (8th Edition ed.).
30 Mukherjee, P. K., & Brownrigg, M. (2013). Farthing on International Shipping (4 ed.). London, UK: Springer.
31 Panayides, P. M., Lambertides, N., & Savva, C. S. (2011). The relative efficiency of shipping companies. Transportation Research Part E: Logistics and Transportation Review, 47(5), 681–694. http://doi.org/10.1016/j.tre.2011.01.001
32 Plavšić, M., Klinker, G., & Bubb, H. (2010). Situation awareness assessment in critical driving situations at intersections by task and human error analysis. Human Factors and Ergonomics in Manufacturing & Service Industries, 20(3), 177–191. http://doi.org/10.1002/hfm.20173
33 Pope, J. A., & Talley, W. K. (1988). Inventory Costs And Optimal Ship Size. Logistics and Transportation Review, 24(2), 107. Retrieved from http://search.proquest.com/docview/197439373?accountid=10297\nhttp://sfx.cranfield.ac.uk/cranfield?url_ver=Z39.88-2004&rft_val_fmt=info:ofi/fmt:kev:mtx:journal&genre=article&sid=ProQ:ProQ:abiglobal&atitle=Inventory+Costs+And+Optimal+Ship+Size&title=Logist
34 Porathe, T. (2014). Remote Monitoring and Control of Unmanned Vessels –The MUNIN Shore Control Centre. Proceedings of the 13th International Conference on Computer Applications and Information Technology in the Maritime Industries (COMPIT ’14), (May), 460–467. Retrieved from http://publications.lib.chalmers.se/publication/198197-remote-monitoring-and-control-of-unmanned-vessels-the-munin-shore-control-centre
35 Rødseth, Ø. J., & Burmeister, H.-C. (2015). Risk Assessment for an Unmanned Merchant Ship. TransNav, the International Journal on Marine Navigation and Safety of Sea Transportation, 9(3), 357–364. http://doi.org/10.12716/1001.09.03.08
36 Rupp, J. D., & Rupp, M. Y. (2008). A Perspective on Emerging Automotive Safety Applications , Derived from Lessons Learned through Participation in the DARPA, 25(10), 808–840. http://doi.org/10.1002/rob
37 Schager, B. (2008). When Technology Leads Us Astray : A Broadened View of Human Error, 63–70. http://doi.org/10.1017/S0373463307004493
38 Schinas, O., & Butler, M. (2016). Feasibility and commercial considerations of LNG-fueled ships. Ocean Engineering, 122, 84–96. http://doi.org/10.1016/j.oceaneng.2016.04.031
39 Sousa, J. B. De, & Gonçalves, G. A. (n.d.). Autonomous vehicles in the response to maritime incidents. http://doi.org/10.3182/20080408-3-IE-4914.00013
62
40 Statheros, T., Howells, G., & Mcdonald-maier, K. (2008). Autonomous Ship Collision Avoidance Navigation Concepts , Technologies and Techniques, 129–142. http://doi.org/10.1017/S037346330700447X
41 Statista. (2015, January 1). Number of ships in the world mechant fleet as of January 1, 2015, by type. Retrieved July 10, 2016, from Statista: http://www.statista.com/statistics/264024/number-of-merchant-ships-worldwide-by-type/
42 Stopford, M. (2009). Supply, Demand and Freight (pp. 135-174), Rates The Cost of Running Ships (p. 227), The General Transport of General Cargo (p. 505). In M. Stopford, Maritime Economics (3 ed.). Abingdon, Oxon, UK: Routeledge.
43 Sys, C., Blauwens, G., Omey, E., Van De Voorde, E., & Witlox, F. (2008). In Search of the Link between Ship Size and Operations. Transportation Planning and Technology, 31(4), 435–463. http://doi.org/10.1080/03081060802335109
44 Talley, W. K. (2000). Ocean Container Shipping: Impacts of a Technological Improvement. Journal of Economic Issues, 34(4), 933–948. http://doi.org/10.1080/00213624.2000.11506322
45 Tran, N. K., & Haasis, H.-D. (2015). An empirical study of fleet expansion and growth of ship size in container liner shipping. International Journal of Production Economics, 159, 241–253. http://doi.org/10.1016/j.ijpe.2014.09.016
46 United Nations. (2013). Department of Economic and Social Affairs. United Nations, Department of Economic and Social Affairs . New-York: United Nations.
47 VERMA, A. K., SRIVIDYA, A., RANA, A., & KHATTRI, S. K. (2012). OPTIMIZATION OF MAINTENANCE SCHEDULING OF SHIP BORNE MACHINERY FOR IMPROVED RELIABILITY AND REDUCED COST. International Journal of Reliability, Quality and Safety Engineering, 19(03), 1250014. http://doi.org/10.1142/S0218539312500143
48 Wahlström, M., Hakulinen, J., Karvonen, H., & Lindborg, I. (2015). Human Factors Challenges in Unmanned Ship Operations – Insights from Other Domains. Procedia Manufacturing, 3(Ahfe), 1038–1045. http://doi.org/10.1016/j.promfg.2015.07.167
49 Yan, R., Pang, S., Sun, H., & Pang, Y. (2010). Development and Missions of Unmanned Surface Vehicle, 451–457. http://doi.org/10.1007/s11804-010-1033-2

![A Robot Application for Marine Vessel Inspectiondownload.xuebalib.com/xuebalib.com.36861.pdf · [Source: (left,center) Lloyd’s Register, (right) ] abulkcarrier,isthemosttime-consumingpartoftheinspec-tion](https://img.pdfslide.net/doc/110x75/5ac3e0137f8b9a2b5c8c7c0f/a-robot-application-for-marine-vessel-source-leftcenter-lloyds-register.jpg)


![Tea party son granot [modo de compatibilidad]](https://img.pdfslide.net/doc/110x75/55821146d8b42ac7728b4835/tea-party-son-granot-modo-de-compatibilidad.jpg)