Embed Size (px)
DESCRIPTION
MSCI Equity Quantitative Analysis From HSBC (November 2013)
Citation preview
abcGlobal Research
MSCI rebalances its global equities indices on a regular basis in February, May, August
and November. The Semi-Annual Index Reviews (SAIRs) which take place in May and
November are comprehensive index reviews.
During each index review, MSCI refreshes its universe of stocks covered, updates the free
float factors and number of issued shares, updates liquidity criteria, finalises the market
cap size cut-offs for different markets from which it determines potential index changes.
In order to predict potential index changes, we aim to replicate MSCI’s index review
process. Our index prediction model is for the MSCI All Country World Index (ACWI)
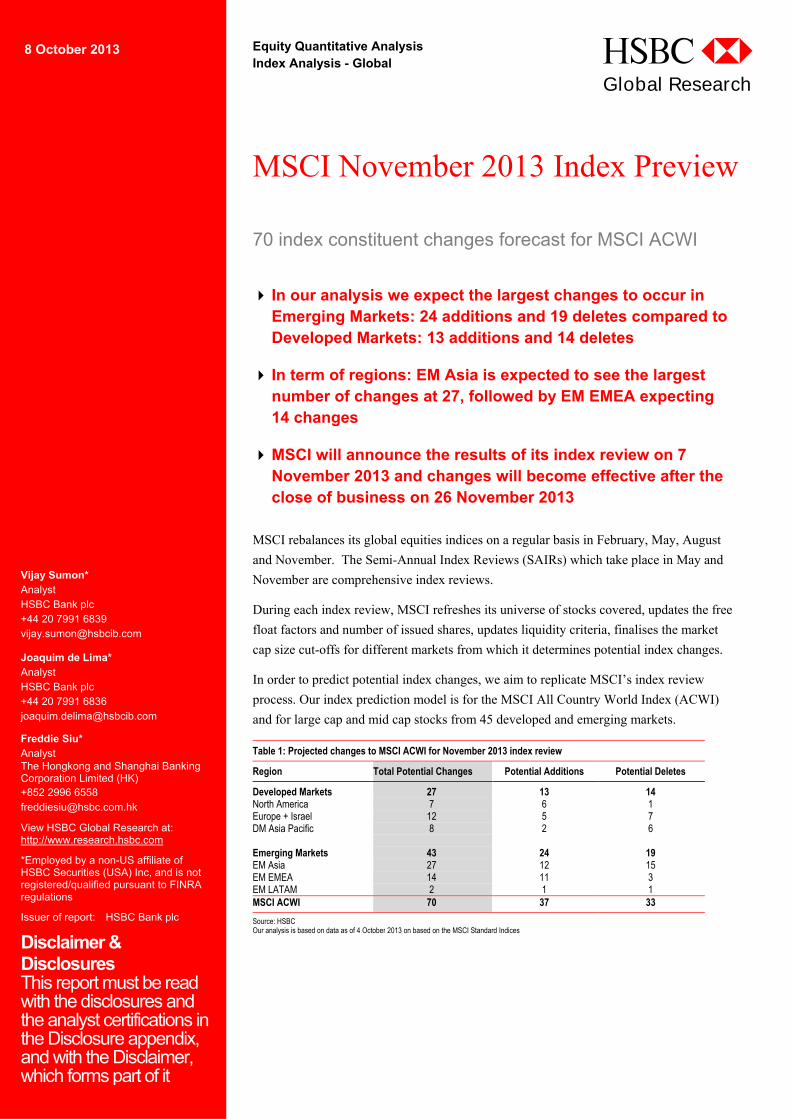
and for large cap and mid cap stocks from 45 developed and emerging markets. Table 1: Projected changes to MSCI ACWI for November 2013 index review
Region Total Potential Changes Potential Additions Potential Deletes
Developed Markets 27 13 14 North America 7 6 1 Europe + Israel 12 5 7 DM Asia Pacific 8 2 6 Emerging Markets 43 24 19EM Asia 27 12 15EM EMEA 14 11 3 EM LATAM 2 1 1 MSCI ACWI 70 37 33
Source: HSBC Our analysis is based on data as of 4 October 2013 on based on the MSCI Standard Indices
8 October 2013 Equity Quantitative Analysis Index Analysis - Global
Vijay Sumon* Analyst HSBC Bank plc +44 20 7991 6839 [email protected]
Joaquim de Lima* Analyst HSBC Bank plc +44 20 7991 6836 [email protected]
Freddie Siu* Analyst The Hongkong and Shanghai Banking Corporation Limited (HK) +852 2996 6558 [email protected]
View HSBC Global Research at: http://www.research.hsbc.com
*Employed by a non-US affiliate of HSBC Securities (USA) Inc, and is not registered/qualified pursuant to FINRA regulations
Issuer of report: HSBC Bank plc
Disclaimer & Disclosures This report must be read with the disclosures and the analyst certifications in the Disclosure appendix, and with the Disclaimer, which forms part of it
MSCI November 2013 Index Preview
70 index constituent changes forecast for MSCI ACWI
In our analysis we expect the largest changes to occur in Emerging Markets: 24 additions and 19 deletes compared to Developed Markets: 13 additions and 14 deletes
In term of regions: EM Asia is expected to see the largest number of changes at 27, followed by EM EMEA expecting 14 changes
MSCI will announce the results of its index review on 7 November 2013 and changes will become effective after the close of business on 26 November 2013
Equity Quantitative Analysis Index Analysis - Global 8 October 2013
2
abc
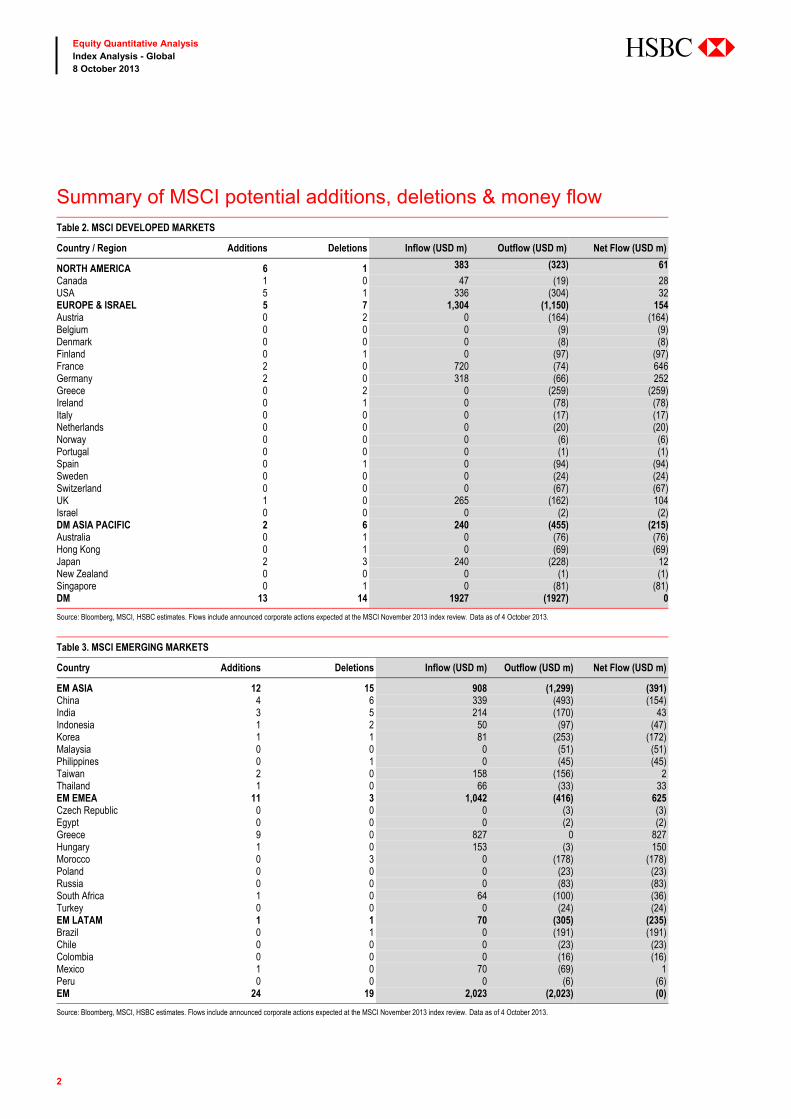
Summary of MSCI potential additions, deletions & money flow Table 2. MSCI DEVELOPED MARKETS
Country / Region Additions Deletions Inflow (USD m) Outflow (USD m) Net Flow (USD m)
NORTH AMERICA 6 1 383 (323) 61
Canada 1 0 47 (19) 28 USA 5 1 336 (304) 32 EUROPE & ISRAEL 5 7 1,304 (1,150) 154 Austria 0 2 0 (164) (164)Belgium 0 0 0 (9) (9)Denmark 0 0 0 (8) (8)Finland 0 1 0 (97) (97)France 2 0 720 (74) 646 Germany 2 0 318 (66) 252 Greece 0 2 0 (259) (259)Ireland 0 1 0 (78) (78)Italy 0 0 0 (17) (17)Netherlands 0 0 0 (20) (20)Norway 0 0 0 (6) (6)Portugal 0 0 0 (1) (1)Spain 0 1 0 (94) (94)Sweden 0 0 0 (24) (24)Switzerland 0 0 0 (67) (67)UK 1 0 265 (162) 104 Israel 0 0 0 (2) (2)DM ASIA PACIFIC 2 6 240 (455) (215)Australia 0 1 0 (76) (76)Hong Kong 0 1 0 (69) (69)Japan 2 3 240 (228) 12 New Zealand 0 0 0 (1) (1)Singapore 0 1 0 (81) (81)DM 13 14 1927 (1927) 0
Source: Bloomberg, MSCI, HSBC estimates. Flows include announced corporate actions expected at the MSCI November 2013 index review. Data as of 4 October 2013.
Table 3. MSCI EMERGING MARKETS
Country Additions Deletions Inflow (USD m) Outflow (USD m) Net Flow (USD m)
EM ASIA 12 15 908 (1,299) (391)China 4 6 339 (493) (154)India 3 5 214 (170) 43 Indonesia 1 2 50 (97) (47)Korea 1 1 81 (253) (172)Malaysia 0 0 0 (51) (51)Philippines 0 1 0 (45) (45)Taiwan 2 0 158 (156) 2 Thailand 1 0 66 (33) 33 EM EMEA 11 3 1,042 (416) 625 Czech Republic 0 0 0 (3) (3)Egypt 0 0 0 (2) (2)Greece 9 0 827 0 827Hungary 1 0 153 (3) 150 Morocco 0 3 0 (178) (178)Poland 0 0 0 (23) (23)Russia 0 0 0 (83) (83)South Africa 1 0 64 (100) (36)Turkey 0 0 0 (24) (24)EM LATAM 1 1 70 (305) (235)Brazil 0 1 0 (191) (191)Chile 0 0 0 (23) (23)Colombia 0 0 0 (16) (16)Mexico 1 0 70 (69) 1 Peru 0 0 0 (6) (6)EM 24 19 2,023 (2,023) (0)
Source: Bloomberg, MSCI, HSBC estimates. Flows include announced corporate actions expected at the MSCI November 2013 index review. Data as of 4 October 2013.

Equity Quantitative Analysis Index Analysis - Global 8 October 2013
3
abc
Projected changes for MSCI’s November 2013 index review
In the following tables we highlight our projected index changes together with a probability of change.
Additionally, we will continue to monitor the price-action of these stocks and their potential status.
Developed Markets - Additions & Deletions
Table 4: HSBC projected adds to MSCI Standard Indices for the upcoming November 2013 review
Name Ticker Country GICS Industry EDT Value to trade USD m
Shares to trade m
Probability of change
Developed Markets – Adds Alcatel-Lucent ALU FP France Technology Hardware & Equipment 1.4 428 109.3 HighEvonik Industries EVK GY Germany Materials 8.8 120 3.3 HighSky Deutschland SKYD GY Germany Media 7.6 198 20.6 HighKakaku.com Inc. 2371 JP Japan Software & Services 2.7 129 5.8 HighNippon Paint 4612 JP Japan Materials 5.6 111 6.8 HighASOS ASC LN UK Retailing 6.4 265 3.3 MidChicago Bridge & Iron CBI US USA Capital Goods 1.2 83 1.2 HighNetSuite N US USA Software & Services 1.4 41 0.4 HighNXP Semiconductors NXPI US USA Semiconductors & Semiconductor 1.0 90 2.3 HighPharmacyclics PCYC US USA Pharmaceuticals, Biotechnology 1.0 89 0.6 HighValeo FR FP France Automobile & Components 7.5 293 3.4 LowGroupon GRPN US USA Retailing 0.1 33 2.9 LowMethanex MX CN Canada Materials 1.2 47 0.9 Low Developed Markets - Deletes Sydney Airport SYD AU Australia Transportation -1.1 -34 -8.9 LowVerbund VER AV Austria Utilities -9.3 -72 -3.2 MidTelekom Austria TKA AV Austria Telecommunication Services -10.1 -90 -10.4 LowKesko B KESBV FH Finland Food & Staples Retailing -12.4 -91 -3.0 HighHellenic Telecom^ HTO GA Greece Telecommunication Services +3.6 35 3.1 HighOPAP^ OPAP GA Greece Consumer Services +4.8 35 2.8 HighOrient Overseas International 316 HK HK Transportation -7.3 -53 -9.2 HighCosmo Oil 5007 JP Japan Energy -5.4 -39 -21.8 HighRyanair Holdings RYA ID Ireland Transportation -1.1 -75 -8.8 LowFurukawa Electric 5801 JP Japan Capital Goods -4.1 -58 -26.5 HighGree 3632 JP Japan Software & Services -1.3 -30 -4.2 HighOlam International OLAM SP Singapore Food & Staples Retailing -13.1 -73 -61.5 MidAcciona ANA SM Spain Utilities -3.8 -70 -1.2 HighPenney (J C) JCP US USA Retailing -0.1 -25 -3.2 High Source: MSCI, HSBC, Bloomberg, Thomson Reuters Datastream, EDT – Equivalent Days Trading, ^ MSCI has announced in provisional list and adjusted for moving to MSCI EM
High Conviction – Stock which exceeds the estimated market cut-off by more than 10% and passes liquidity criteria and size segments for index inclusion or a stock which is below the estimated market cut-off by more than 10% for index exclusion.
Medium Conviction – Stock that is between 5-10% higher than the estimated market cut-off criteria for index inclusion. Or a stock which is 5-10% below the estimated market cut-off for index exclusion.
Low Conviction – Stock which is at or up to 5% off the estimated market cut-off criteria and thus represents a marginal index inclusion/exclusion.
Equity Quantitative Analysis Index Analysis - Global 8 October 2013
4
abc
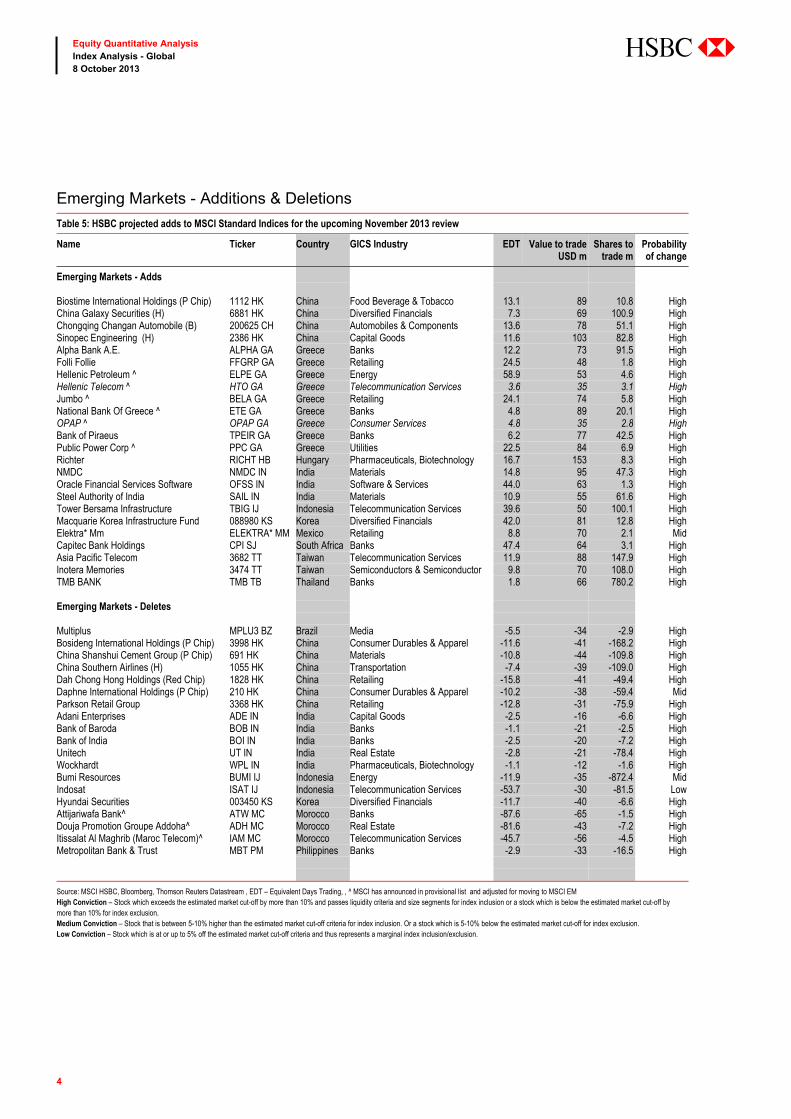
Emerging Markets - Additions & Deletions Table 5: HSBC projected adds to MSCI Standard Indices for the upcoming November 2013 review
Name Ticker Country GICS Industry EDT Value to trade USD m
Shares to trade m
Probability of change
Emerging Markets - Adds Biostime International Holdings (P Chip) 1112 HK China Food Beverage & Tobacco 13.1 89 10.8 HighChina Galaxy Securities (H) 6881 HK China Diversified Financials 7.3 69 100.9 HighChongqing Changan Automobile (B) 200625 CH China Automobiles & Components 13.6 78 51.1 HighSinopec Engineering (H) 2386 HK China Capital Goods 11.6 103 82.8 HighAlpha Bank A.E. ALPHA GA Greece Banks 12.2 73 91.5 HighFolli Follie FFGRP GA Greece Retailing 24.5 48 1.8 HighHellenic Petroleum ^ ELPE GA Greece Energy 58.9 53 4.6 HighHellenic Telecom ^ HTO GA Greece Telecommunication Services 3.6 35 3.1 HighJumbo ^ BELA GA Greece Retailing 24.1 74 5.8 HighNational Bank Of Greece ^ ETE GA Greece Banks 4.8 89 20.1 HighOPAP ^ OPAP GA Greece Consumer Services 4.8 35 2.8 HighBank of Piraeus TPEIR GA Greece Banks 6.2 77 42.5 HighPublic Power Corp ^ PPC GA Greece Utilities 22.5 84 6.9 HighRichter RICHT HB Hungary Pharmaceuticals, Biotechnology 16.7 153 8.3 HighNMDC NMDC IN India Materials 14.8 95 47.3 HighOracle Financial Services Software OFSS IN India Software & Services 44.0 63 1.3 HighSteel Authority of India SAIL IN India Materials 10.9 55 61.6 HighTower Bersama Infrastructure TBIG IJ Indonesia Telecommunication Services 39.6 50 100.1 HighMacquarie Korea Infrastructure Fund 088980 KS Korea Diversified Financials 42.0 81 12.8 HighElektra* Mm ELEKTRA* MM Mexico Retailing 8.8 70 2.1 MidCapitec Bank Holdings CPI SJ South Africa Banks 47.4 64 3.1 HighAsia Pacific Telecom 3682 TT Taiwan Telecommunication Services 11.9 88 147.9 HighInotera Memories 3474 TT Taiwan Semiconductors & Semiconductor 9.8 70 108.0 HighTMB BANK TMB TB Thailand Banks 1.8 66 780.2 High Emerging Markets - Deletes Multiplus MPLU3 BZ Brazil Media -5.5 -34 -2.9 HighBosideng International Holdings (P Chip) 3998 HK China Consumer Durables & Apparel -11.6 -41 -168.2 HighChina Shanshui Cement Group (P Chip) 691 HK China Materials -10.8 -44 -109.8 HighChina Southern Airlines (H) 1055 HK China Transportation -7.4 -39 -109.0 HighDah Chong Hong Holdings (Red Chip) 1828 HK China Retailing -15.8 -41 -49.4 HighDaphne International Holdings (P Chip) 210 HK China Consumer Durables & Apparel -10.2 -38 -59.4 MidParkson Retail Group 3368 HK China Retailing -12.8 -31 -75.9 HighAdani Enterprises ADE IN India Capital Goods -2.5 -16 -6.6 HighBank of Baroda BOB IN India Banks -1.1 -21 -2.5 HighBank of India BOI IN India Banks -2.5 -20 -7.2 HighUnitech UT IN India Real Estate -2.8 -21 -78.4 HighWockhardt WPL IN India Pharmaceuticals, Biotechnology -1.1 -12 -1.6 HighBumi Resources BUMI IJ Indonesia Energy -11.9 -35 -872.4 MidIndosat ISAT IJ Indonesia Telecommunication Services -53.7 -30 -81.5 LowHyundai Securities 003450 KS Korea Diversified Financials -11.7 -40 -6.6 HighAttijariwafa Bank^ ATW MC Morocco Banks -87.6 -65 -1.5 HighDouja Promotion Groupe Addoha^ ADH MC Morocco Real Estate -81.6 -43 -7.2 HighItissalat Al Maghrib (Maroc Telecom)^ IAM MC Morocco Telecommunication Services -45.7 -56 -4.5 HighMetropolitan Bank & Trust MBT PM Philippines Banks -2.9 -33 -16.5 High
Source: MSCI HSBC, Bloomberg, Thomson Reuters Datastream , EDT – Equivalent Days Trading, , ^ MSCI has announced in provisional list and adjusted for moving to MSCI EM High Conviction – Stock which exceeds the estimated market cut-off by more than 10% and passes liquidity criteria and size segments for index inclusion or a stock which is below the estimated market cut-off by more than 10% for index exclusion. Medium Conviction – Stock that is between 5-10% higher than the estimated market cut-off criteria for index inclusion. Or a stock which is 5-10% below the estimated market cut-off for index exclusion. Low Conviction – Stock which is at or up to 5% off the estimated market cut-off criteria and thus represents a marginal index inclusion/exclusion.
Equity Quantitative Analysis Index Analysis - Global 8 October 2013
5
abc
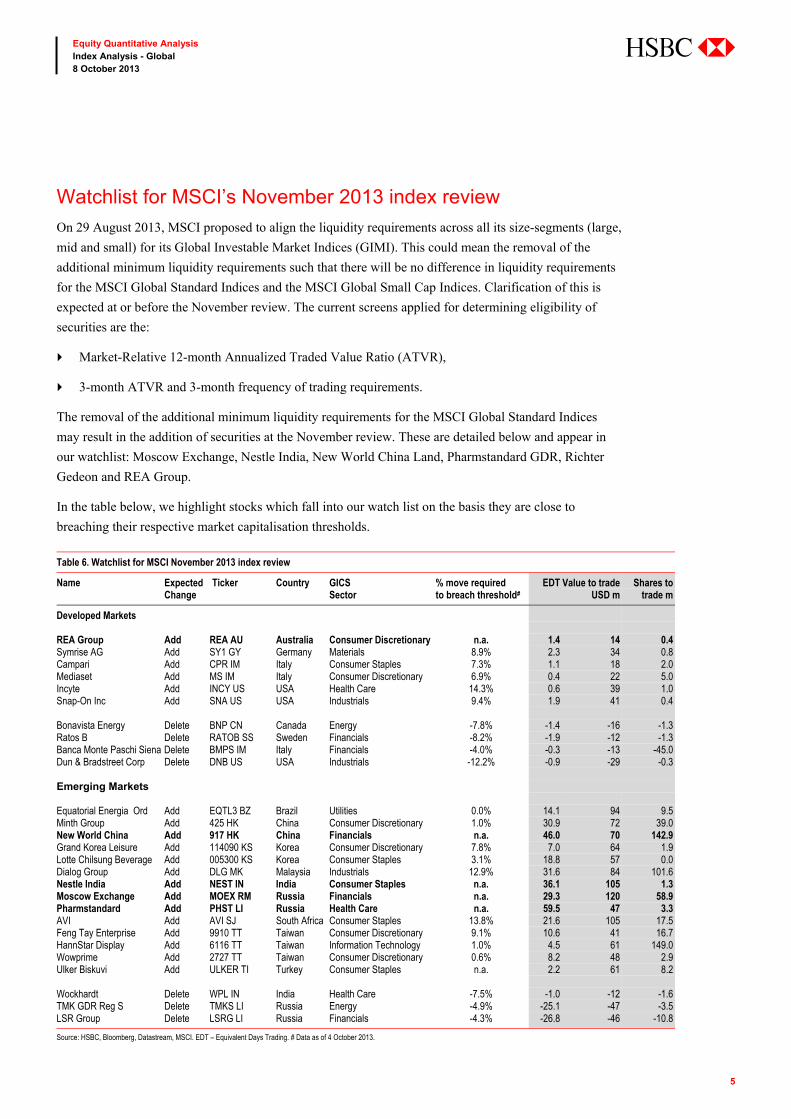
Watchlist for MSCI’s November 2013 index review
On 29 August 2013, MSCI proposed to align the liquidity requirements across all its size-segments (large,
mid and small) for its Global Investable Market Indices (GIMI). This could mean the removal of the
additional minimum liquidity requirements such that there will be no difference in liquidity requirements
for the MSCI Global Standard Indices and the MSCI Global Small Cap Indices. Clarification of this is
expected at or before the November review. The current screens applied for determining eligibility of
securities are the:
Market-Relative 12-month Annualized Traded Value Ratio (ATVR),
3-month ATVR and 3-month frequency of trading requirements.
The removal of the additional minimum liquidity requirements for the MSCI Global Standard Indices
may result in the addition of securities at the November review. These are detailed below and appear in
our watchlist: Moscow Exchange, Nestle India, New World China Land, Pharmstandard GDR, Richter
Gedeon and REA Group.
In the table below, we highlight stocks which fall into our watch list on the basis they are close to
breaching their respective market capitalisation thresholds.
Table 6. Watchlist for MSCI November 2013 index review
Name Expected Change
Ticker Country GICS Sector
% move required to breach threshold#
EDT Value to trade USD m
Shares to trade m
Developed Markets REA Group Add REA AU Australia Consumer Discretionary n.a. 1.4 14 0.4Symrise AG Add SY1 GY Germany Materials 8.9% 2.3 34 0.8Campari Add CPR IM Italy Consumer Staples 7.3% 1.1 18 2.0Mediaset Add MS IM Italy Consumer Discretionary 6.9% 0.4 22 5.0Incyte Add INCY US USA Health Care 14.3% 0.6 39 1.0Snap-On Inc Add SNA US USA Industrials 9.4% 1.9 41 0.4 Bonavista Energy Delete BNP CN Canada Energy -7.8% -1.4 -16 -1.3Ratos B Delete RATOB SS Sweden Financials -8.2% -1.9 -12 -1.3Banca Monte Paschi Siena Delete BMPS IM Italy Financials -4.0% -0.3 -13 -45.0Dun & Bradstreet Corp Delete DNB US USA Industrials -12.2% -0.9 -29 -0.3
Emerging Markets Equatorial Energia Ord Add EQTL3 BZ Brazil Utilities 0.0% 14.1 94 9.5Minth Group Add 425 HK China Consumer Discretionary 1.0% 30.9 72 39.0New World China Add 917 HK China Financials n.a. 46.0 70 142.9Grand Korea Leisure Add 114090 KS Korea Consumer Discretionary 7.8% 7.0 64 1.9Lotte Chilsung Beverage Add 005300 KS Korea Consumer Staples 3.1% 18.8 57 0.0Dialog Group Add DLG MK Malaysia Industrials 12.9% 31.6 84 101.6Nestle India Add NEST IN India Consumer Staples n.a. 36.1 105 1.3Moscow Exchange Add MOEX RM Russia Financials n.a. 29.3 120 58.9Pharmstandard Add PHST LI Russia Health Care n.a. 59.5 47 3.3AVI Add AVI SJ South Africa Consumer Staples 13.8% 21.6 105 17.5Feng Tay Enterprise Add 9910 TT Taiwan Consumer Discretionary 9.1% 10.6 41 16.7HannStar Display Add 6116 TT Taiwan Information Technology 1.0% 4.5 61 149.0Wowprime Add 2727 TT Taiwan Consumer Discretionary 0.6% 8.2 48 2.9Ulker Biskuvi Add ULKER TI Turkey Consumer Staples n.a. 2.2 61 8.2 Wockhardt Delete WPL IN India Health Care -7.5% -1.0 -12 -1.6TMK GDR Reg S Delete TMKS LI Russia Energy -4.9% -25.1 -47 -3.5LSR Group Delete LSRG LI Russia Financials -4.3% -26.8 -46 -10.8
Source: HSBC, Bloomberg, Datastream, MSCI. EDT – Equivalent Days Trading. # Data as of 4 October 2013.
Equity Quantitative Analysis Index Analysis - Global 8 October 2013
6
abc
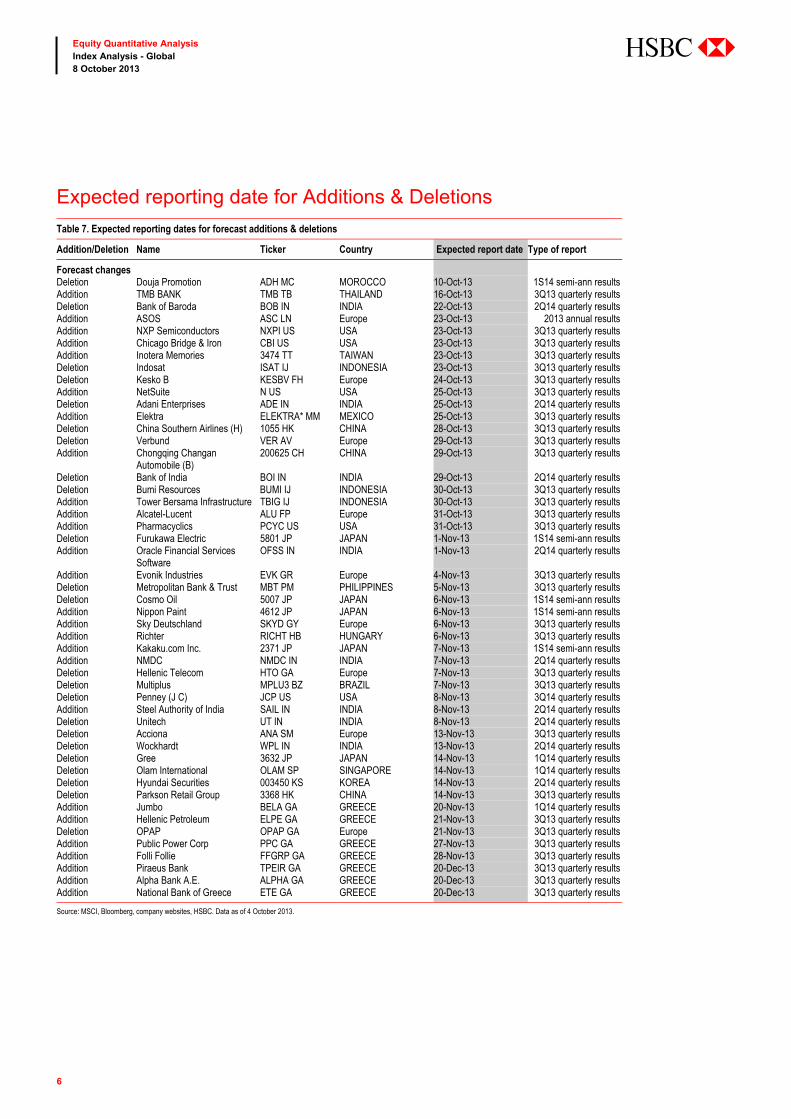
Expected reporting date for Additions & Deletions Table 7. Expected reporting dates for forecast additions & deletions
Addition/Deletion Name Ticker Country Expected report date Type of report
Forecast changes Deletion Douja Promotion ADH MC MOROCCO 10-Oct-13 1S14 semi-ann results Addition TMB BANK TMB TB THAILAND 16-Oct-13 3Q13 quarterly results Deletion Bank of Baroda BOB IN INDIA 22-Oct-13 2Q14 quarterly results Addition ASOS ASC LN Europe 23-Oct-13 2013 annual results Addition NXP Semiconductors NXPI US USA 23-Oct-13 3Q13 quarterly results Addition Chicago Bridge & Iron CBI US USA 23-Oct-13 3Q13 quarterly results Addition Inotera Memories 3474 TT TAIWAN 23-Oct-13 3Q13 quarterly results Deletion Indosat ISAT IJ INDONESIA 23-Oct-13 3Q13 quarterly results Deletion Kesko B KESBV FH Europe 24-Oct-13 3Q13 quarterly results Addition NetSuite N US USA 25-Oct-13 3Q13 quarterly results Deletion Adani Enterprises ADE IN INDIA 25-Oct-13 2Q14 quarterly results Addition Elektra ELEKTRA* MM MEXICO 25-Oct-13 3Q13 quarterly results Deletion China Southern Airlines (H) 1055 HK CHINA 28-Oct-13 3Q13 quarterly results Deletion Verbund VER AV Europe 29-Oct-13 3Q13 quarterly results Addition Chongqing Changan
Automobile (B) 200625 CH CHINA 29-Oct-13 3Q13 quarterly results
Deletion Bank of India BOI IN INDIA 29-Oct-13 2Q14 quarterly results Deletion Bumi Resources BUMI IJ INDONESIA 30-Oct-13 3Q13 quarterly results Addition Tower Bersama Infrastructure TBIG IJ INDONESIA 30-Oct-13 3Q13 quarterly results Addition Alcatel-Lucent ALU FP Europe 31-Oct-13 3Q13 quarterly results Addition Pharmacyclics PCYC US USA 31-Oct-13 3Q13 quarterly results Deletion Furukawa Electric 5801 JP JAPAN 1-Nov-13 1S14 semi-ann results Addition Oracle Financial Services
Software OFSS IN INDIA 1-Nov-13 2Q14 quarterly results
Addition Evonik Industries EVK GR Europe 4-Nov-13 3Q13 quarterly results Deletion Metropolitan Bank & Trust MBT PM PHILIPPINES 5-Nov-13 3Q13 quarterly results Deletion Cosmo Oil 5007 JP JAPAN 6-Nov-13 1S14 semi-ann results Addition Nippon Paint 4612 JP JAPAN 6-Nov-13 1S14 semi-ann results Addition Sky Deutschland SKYD GY Europe 6-Nov-13 3Q13 quarterly results Addition Richter RICHT HB HUNGARY 6-Nov-13 3Q13 quarterly results Addition Kakaku.com Inc. 2371 JP JAPAN 7-Nov-13 1S14 semi-ann results Addition NMDC NMDC IN INDIA 7-Nov-13 2Q14 quarterly results Deletion Hellenic Telecom HTO GA Europe 7-Nov-13 3Q13 quarterly results Deletion Multiplus MPLU3 BZ BRAZIL 7-Nov-13 3Q13 quarterly results Deletion Penney (J C) JCP US USA 8-Nov-13 3Q14 quarterly results Addition Steel Authority of India SAIL IN INDIA 8-Nov-13 2Q14 quarterly results Deletion Unitech UT IN INDIA 8-Nov-13 2Q14 quarterly results Deletion Acciona ANA SM Europe 13-Nov-13 3Q13 quarterly results Deletion Wockhardt WPL IN INDIA 13-Nov-13 2Q14 quarterly results Deletion Gree 3632 JP JAPAN 14-Nov-13 1Q14 quarterly results Deletion Olam International OLAM SP SINGAPORE 14-Nov-13 1Q14 quarterly results Deletion Hyundai Securities 003450 KS KOREA 14-Nov-13 2Q14 quarterly results Deletion Parkson Retail Group 3368 HK CHINA 14-Nov-13 3Q13 quarterly results Addition Jumbo BELA GA GREECE 20-Nov-13 1Q14 quarterly results Addition Hellenic Petroleum ELPE GA GREECE 21-Nov-13 3Q13 quarterly results Deletion OPAP OPAP GA Europe 21-Nov-13 3Q13 quarterly results Addition Public Power Corp PPC GA GREECE 27-Nov-13 3Q13 quarterly results Addition Folli Follie FFGRP GA GREECE 28-Nov-13 3Q13 quarterly results Addition Piraeus Bank TPEIR GA GREECE 20-Dec-13 3Q13 quarterly results Addition Alpha Bank A.E. ALPHA GA GREECE 20-Dec-13 3Q13 quarterly results Addition National Bank of Greece ETE GA GREECE 20-Dec-13 3Q13 quarterly results
Source: MSCI, Bloomberg, company websites, HSBC. Data as of 4 October 2013.

7
Equity Quantitative Analysis Index Analysis - Global 8 October 2013
abc
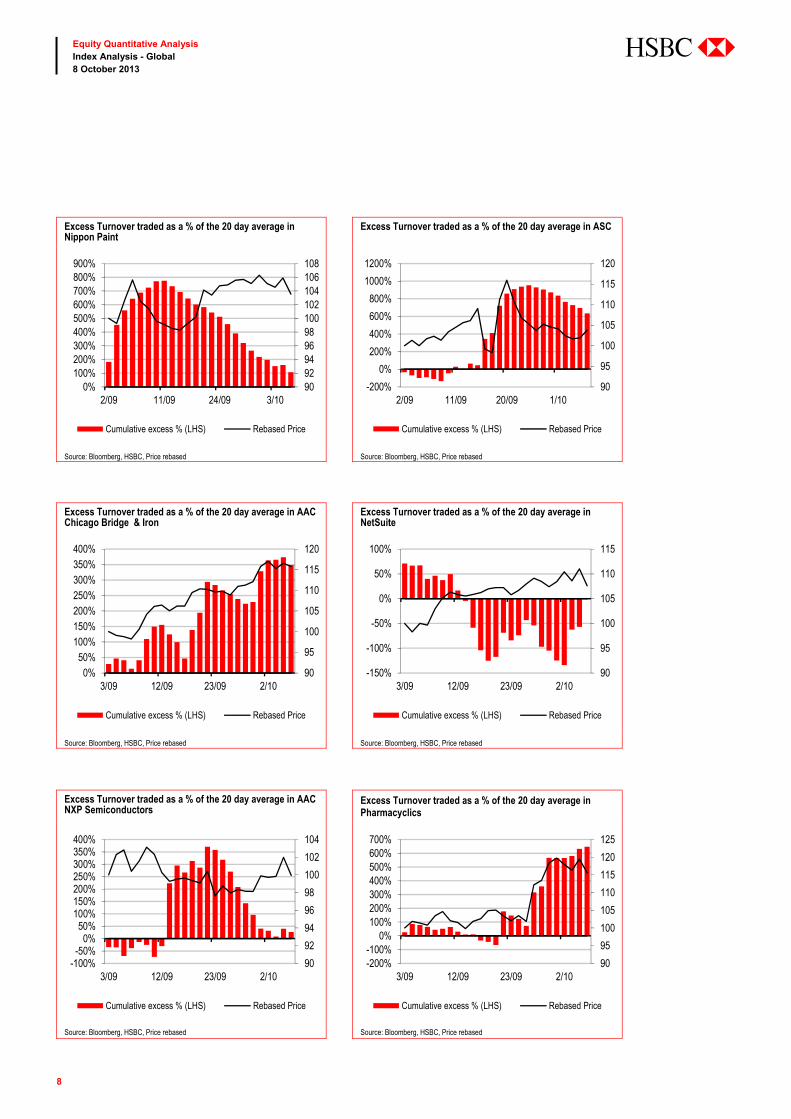
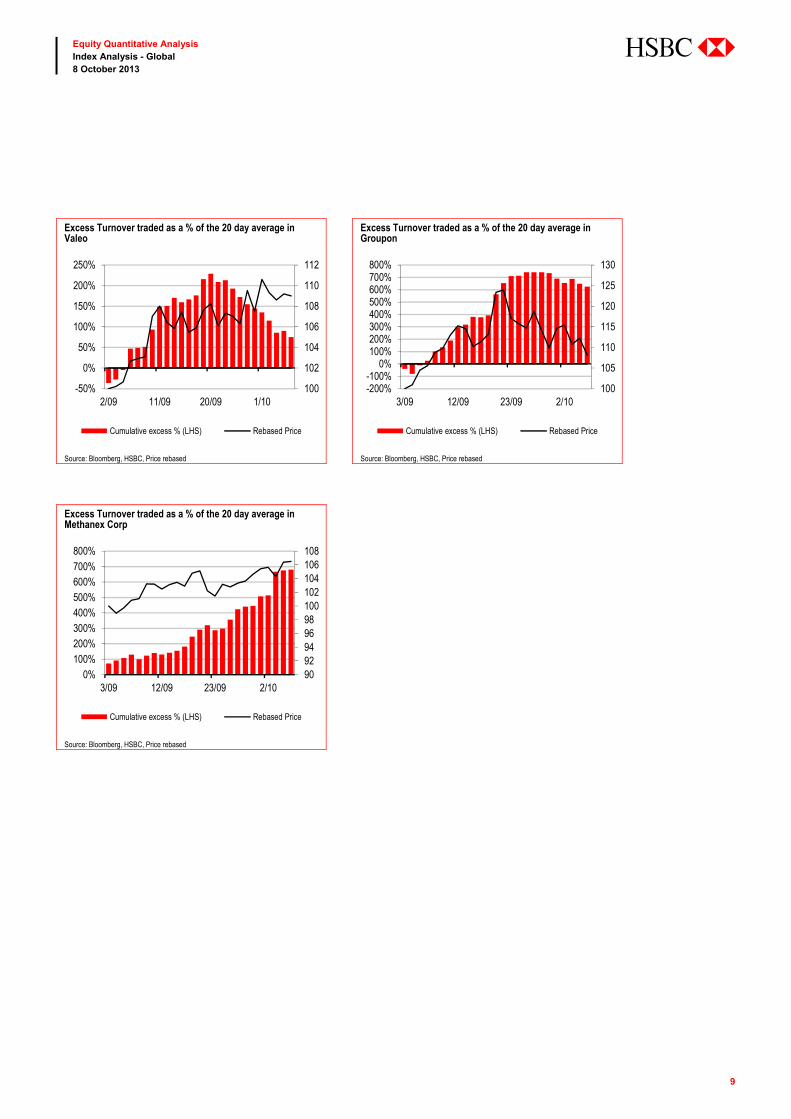
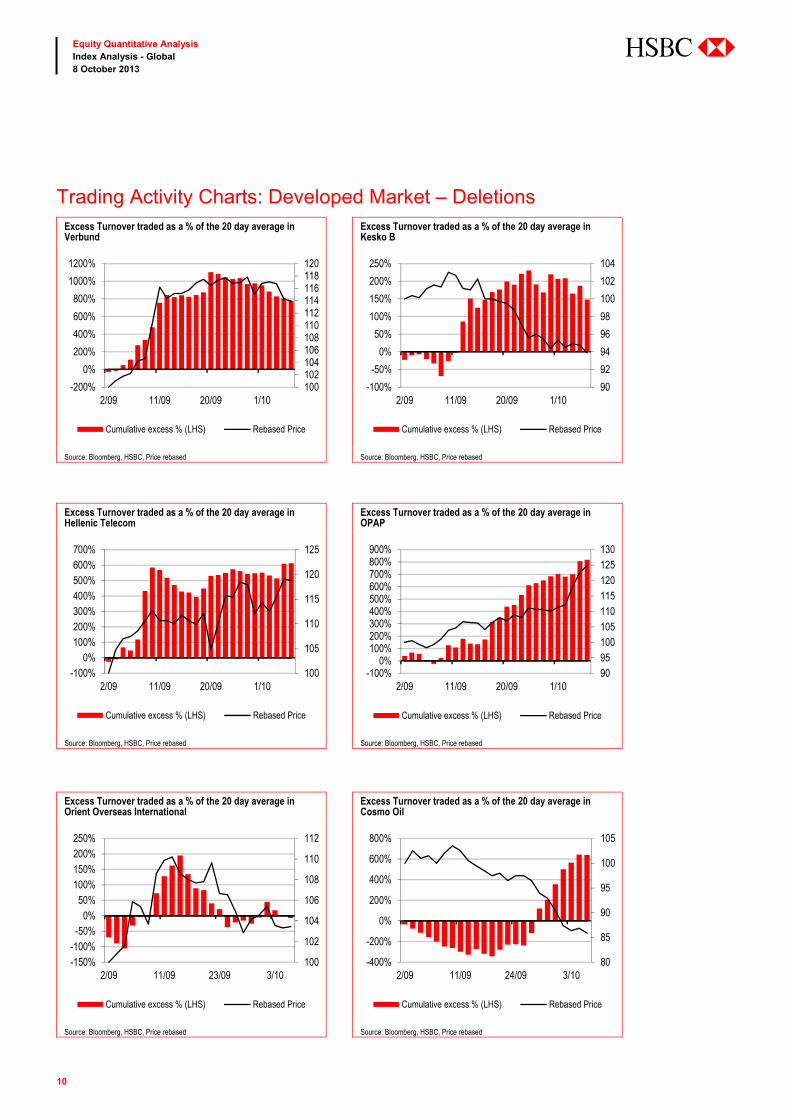
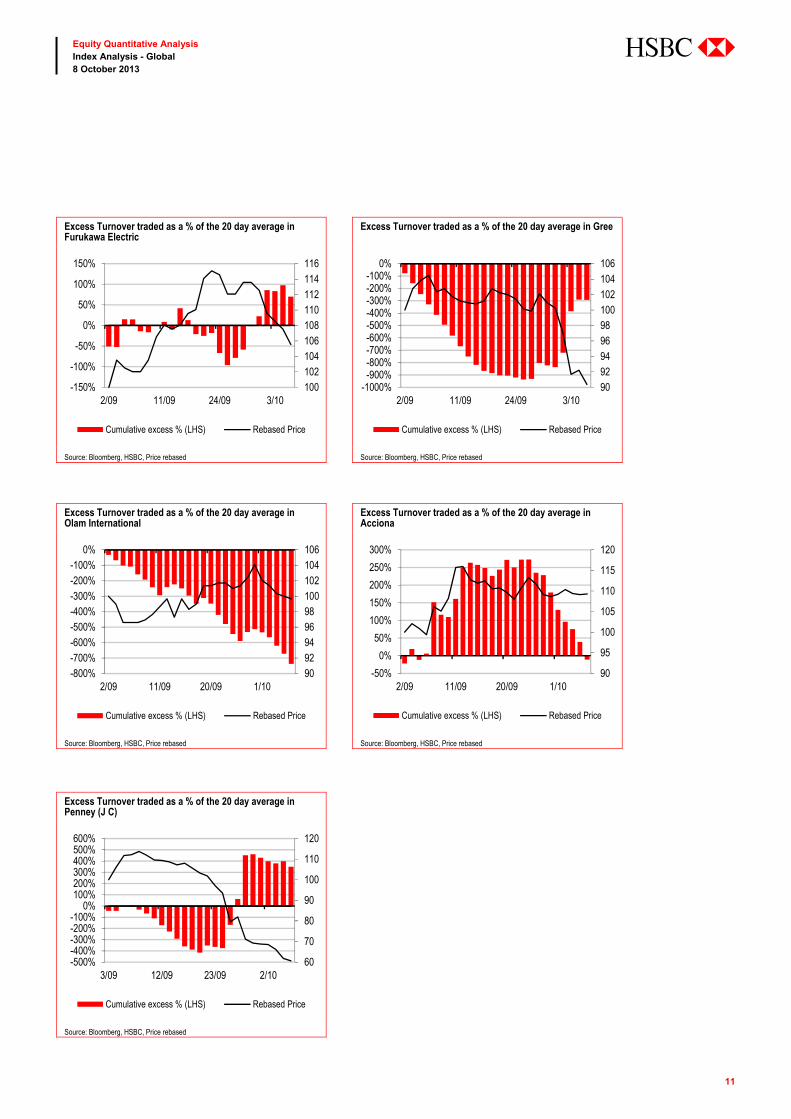
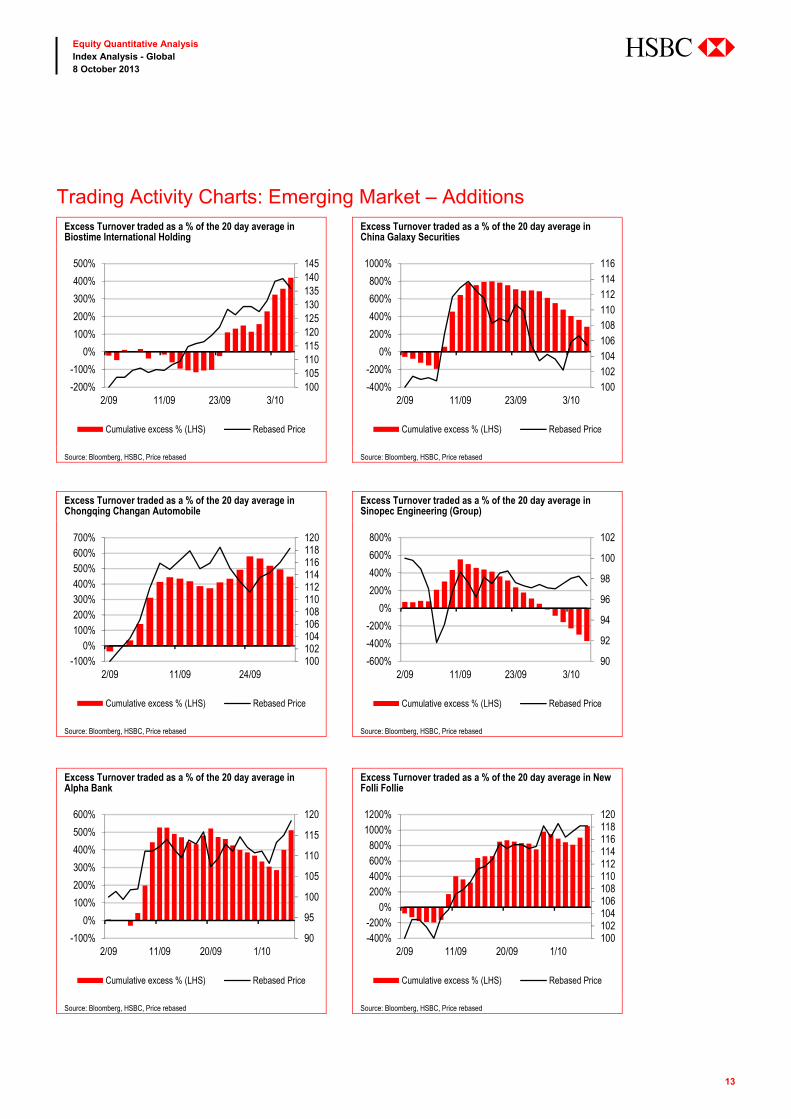
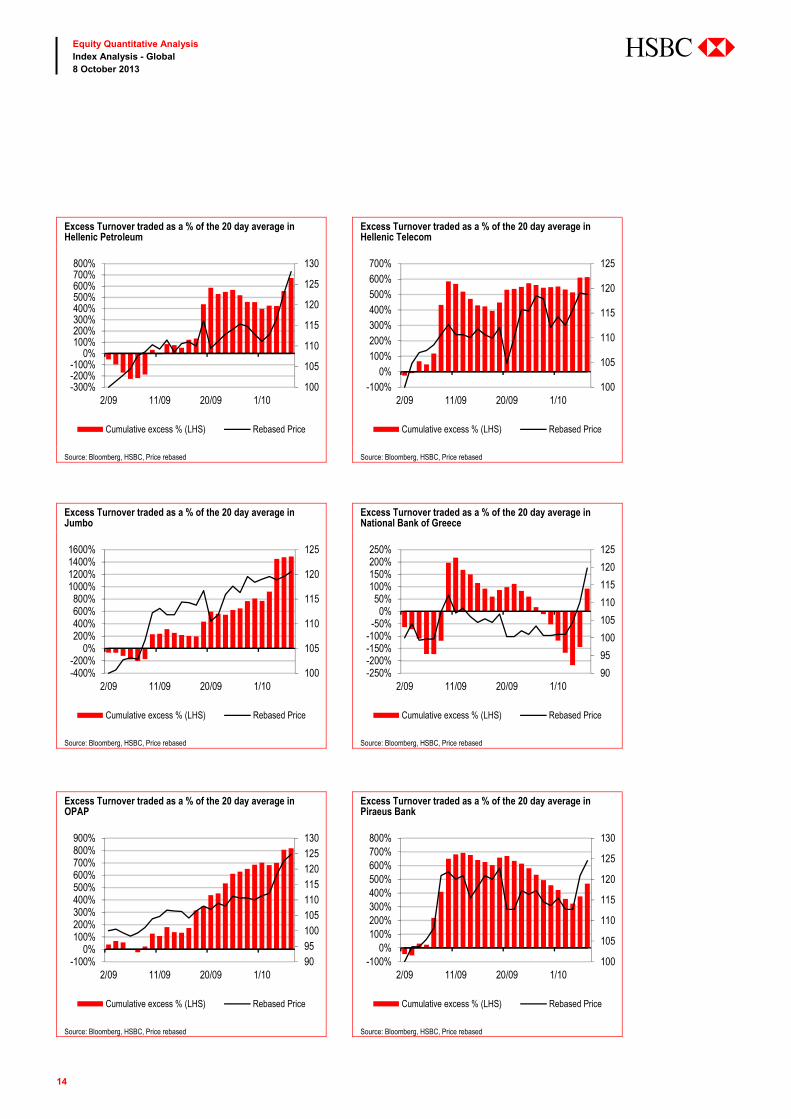
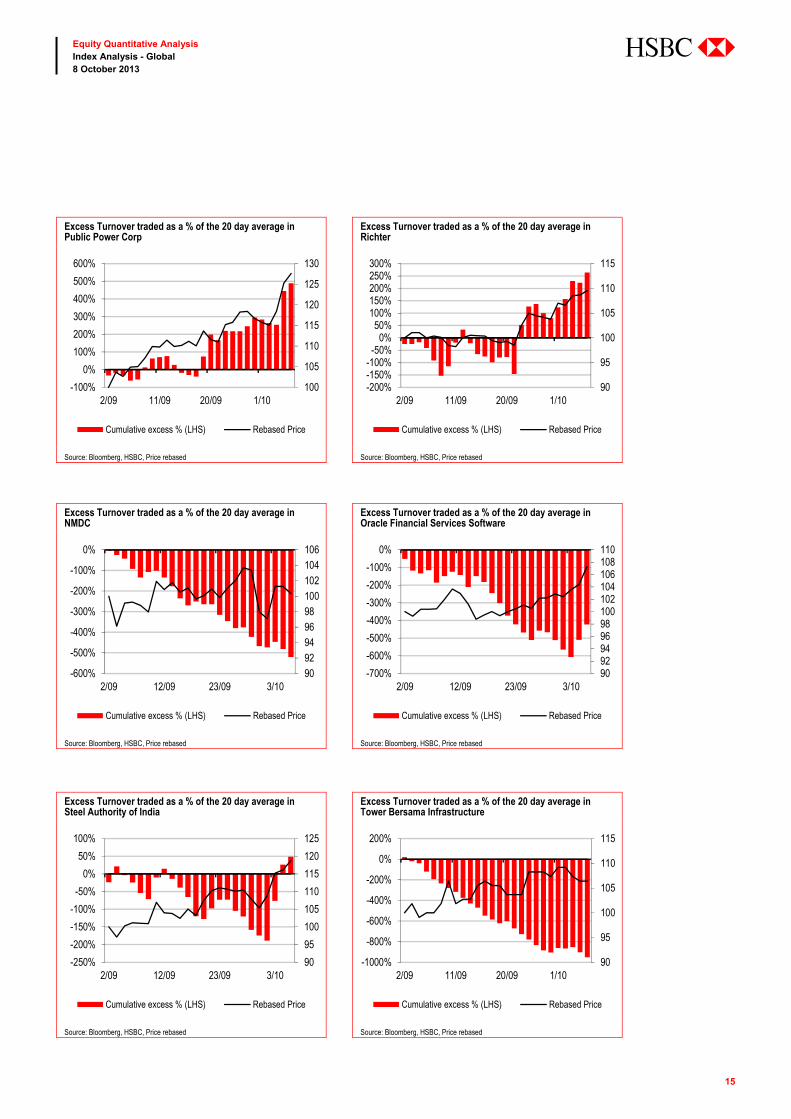
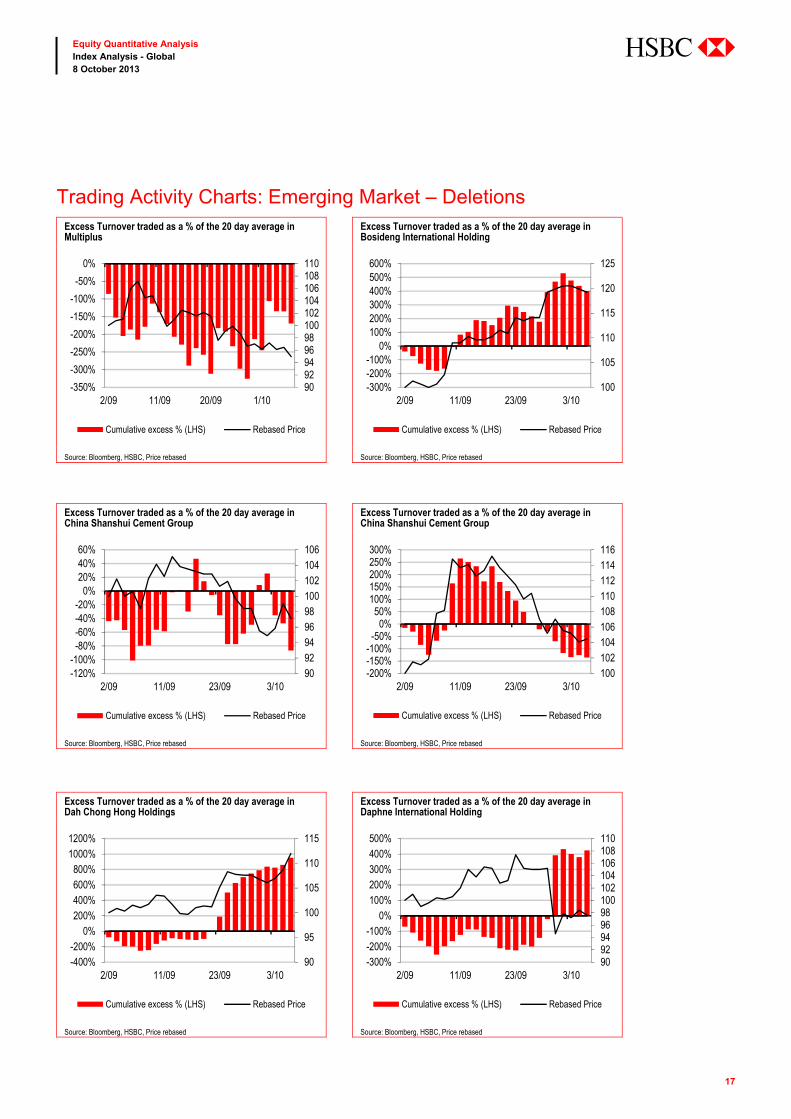
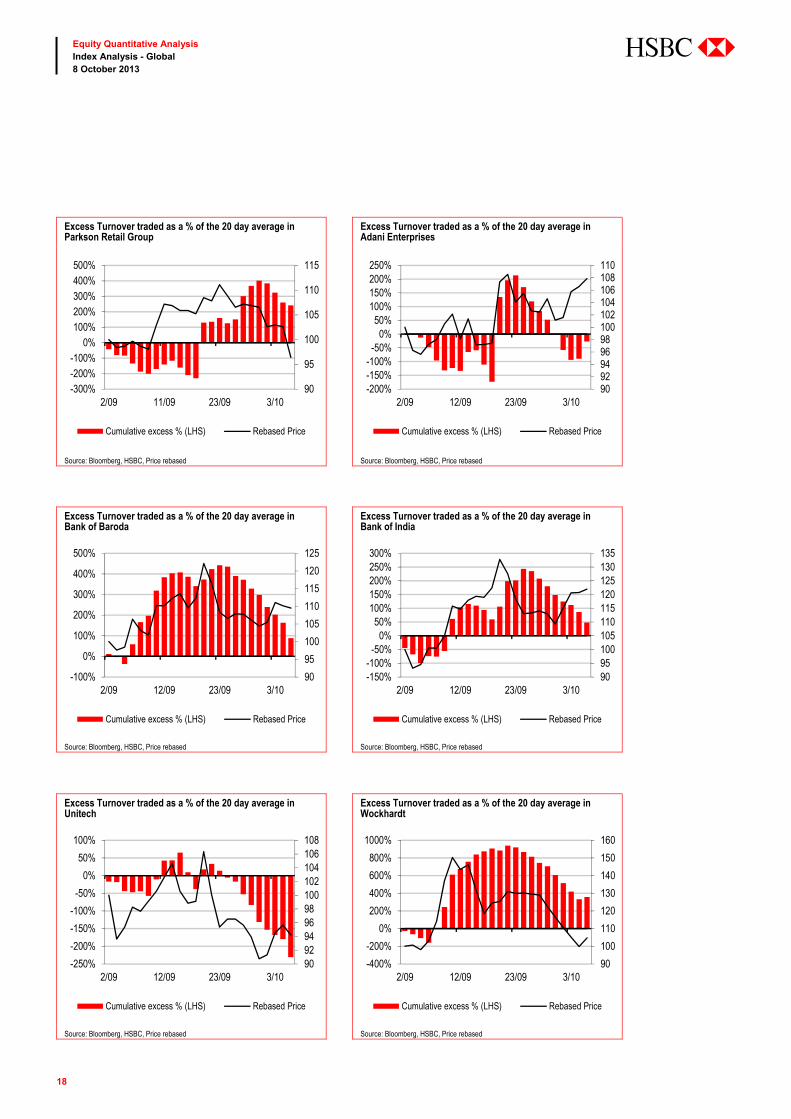
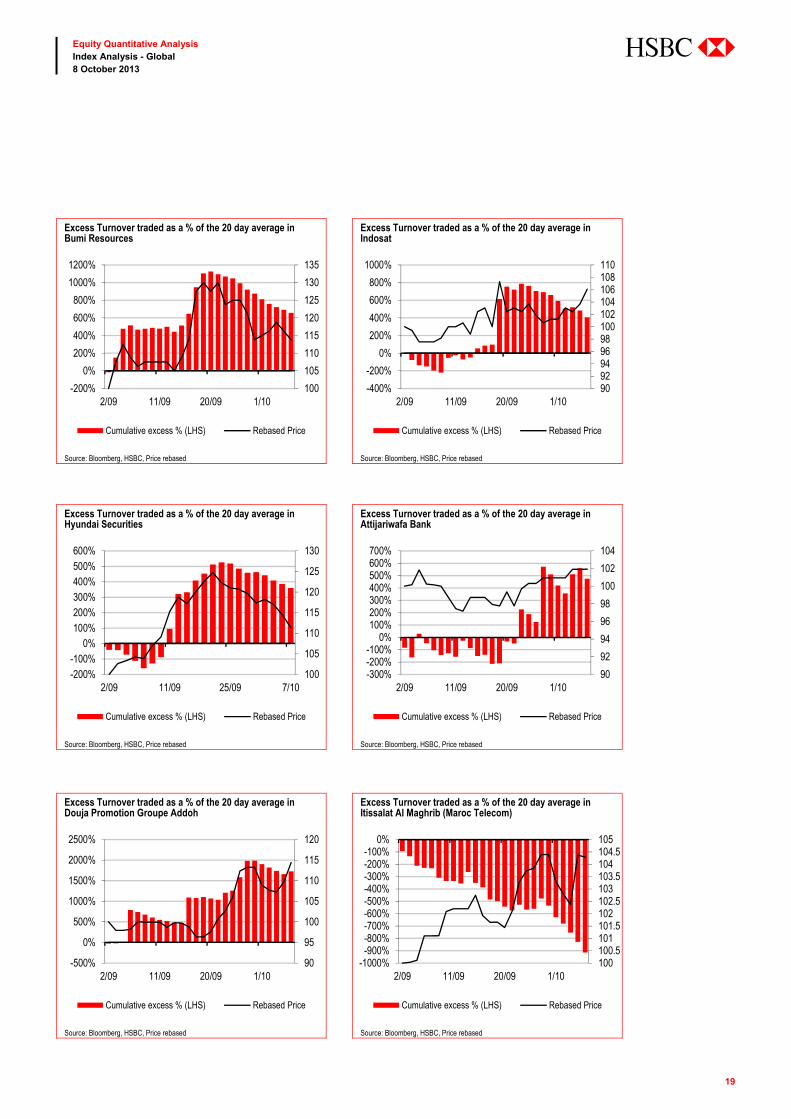
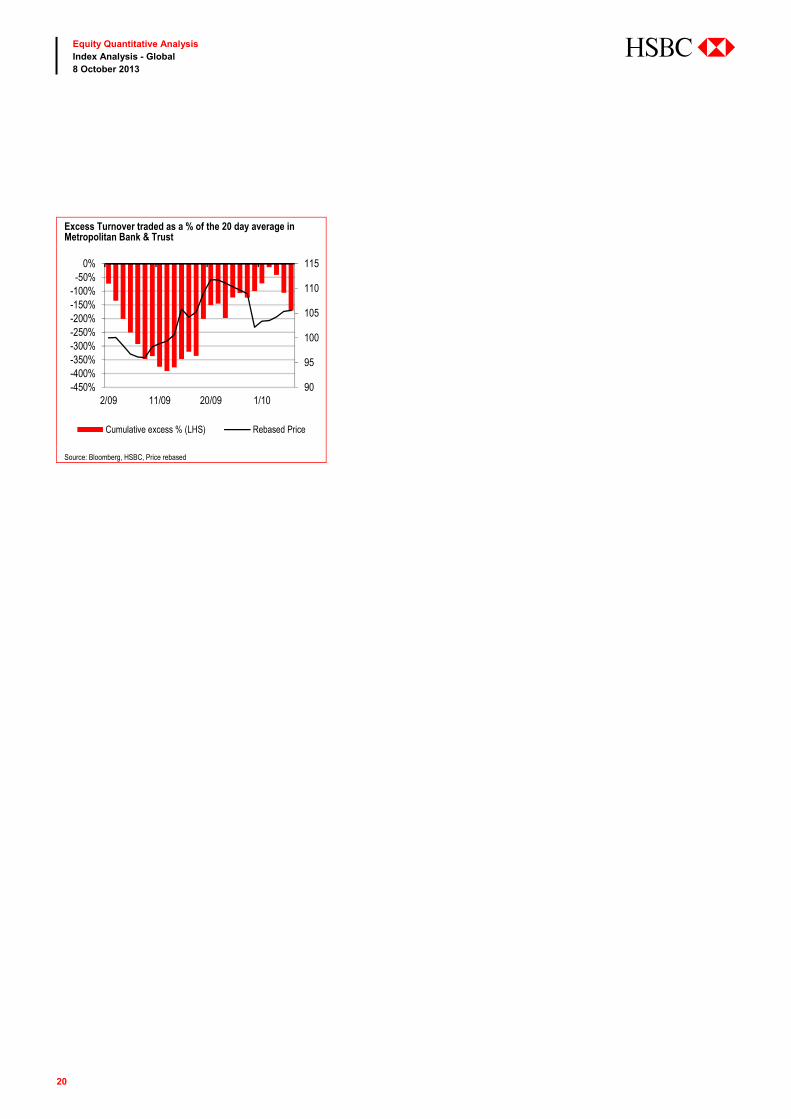
Trading activity of potential additions/deletions
Overleaf we plot the daily excess turnover, defined as the daily turnover less the 20-day average turnover, as a
percentage of the 20-day average turnover potential index additions and deletions since September 2013.
Trading Activity Charts: Developed Market – Additions Excess Turnover traded as a % of the 20 day average in Alcatel-Lucent
Excess Turnover traded as a % of the 20 day average in Evonik Industries
100105110115120125130135140145150
-100%0%
100%200%300%400%500%600%700%800%900%
2/09 11/09 20/09 1/10
Cumulative excess % (LHS) Rebased Price
9092949698100102104106
0%200%400%600%800%
1000%1200%1400%1600%
2/09 11/09 20/09 1/10
Cumulative excess % (LHS) Rebased Price
Source: Bloomberg, HSBC, Price rebased Source: Bloomberg, HSBC, Price rebased
Excess Turnover traded as a % of the 20 day average in Sky Deutschland
Excess Turnover traded as a % of the 20 day average in Kakau.com Inc
100101102103104105106107108109110
-140%-120%-100%-80%-60%-40%-20%
0%20%40%60%80%
2/09 11/09 20/09 1/10
Cumulative excess % (LHS) Rebased Price
100
105
110
115
120
125
-200%-100%
0%100%200%300%400%500%600%700%
2/09 11/09 24/09 3/10
Cumulative excess % (LHS) Rebased Price
Source: Bloomberg, HSBC, Price rebased Source: Bloomberg, HSBC, Price rebased
8
Equity Quantitative Analysis Index Analysis - Global 8 October 2013
abc
Excess Turnover traded as a % of the 20 day average in Nippon Paint
Excess Turnover traded as a % of the 20 day average in ASC
9092949698100102104106108
0%100%200%300%400%500%600%700%800%900%
2/09 11/09 24/09 3/10
Cumulative excess % (LHS) Rebased Price
90
95
100
105
110
115
120
-200%
0%
200%
400%
600%
800%
1000%
1200%
2/09 11/09 20/09 1/10
Cumulative excess % (LHS) Rebased Price
Source: Bloomberg, HSBC, Price rebased Source: Bloomberg, HSBC, Price rebased
Excess Turnover traded as a % of the 20 day average in AAC Chicago Bridge & Iron
Excess Turnover traded as a % of the 20 day average in NetSuite
90
95
100
105
110
115
120
0%50%
100%150%200%250%300%350%400%
3/09 12/09 23/09 2/10
Cumulative excess % (LHS) Rebased Price
90
95
100
105
110
115
-150%
-100%
-50%
0%
50%
100%
3/09 12/09 23/09 2/10
Cumulative excess % (LHS) Rebased Price
Source: Bloomberg, HSBC, Price rebased Source: Bloomberg, HSBC, Price rebased
Excess Turnover traded as a % of the 20 day average in AAC NXP Semiconductors
Excess Turnover traded as a % of the 20 day average in Pharmacyclics
90
92
94
96
98
100
102
104
-100%-50%
0%50%
100%150%200%250%300%350%400%
3/09 12/09 23/09 2/10
Cumulative excess % (LHS) Rebased Price
90
95
100
105
110
115
120
125
-200%-100%
0%100%200%300%400%500%600%700%
3/09 12/09 23/09 2/10
Cumulative excess % (LHS) Rebased Price
Source: Bloomberg, HSBC, Price rebased Source: Bloomberg, HSBC, Price rebased
9
Equity Quantitative Analysis Index Analysis - Global 8 October 2013
abc
Excess Turnover traded as a % of the 20 day average in Valeo
Excess Turnover traded as a % of the 20 day average in Groupon
100
102
104
106
108
110
112
-50%
0%
50%
100%
150%
200%
250%
2/09 11/09 20/09 1/10
Cumulative excess % (LHS) Rebased Price
100
105
110
115
120
125
130
-200%-100%
0%100%200%300%400%500%600%700%800%
3/09 12/09 23/09 2/10
Cumulative excess % (LHS) Rebased Price
Source: Bloomberg, HSBC, Price rebased Source: Bloomberg, HSBC, Price rebased
Excess Turnover traded as a % of the 20 day average in Methanex Corp
9092949698100102104106108
0%100%200%300%400%500%600%700%800%
3/09 12/09 23/09 2/10
Cumulative excess % (LHS) Rebased Price
Source: Bloomberg, HSBC, Price rebased
10
Equity Quantitative Analysis Index Analysis - Global 8 October 2013
abc
Trading Activity Charts: Developed Market – Deletions Excess Turnover traded as a % of the 20 day average in Verbund
Excess Turnover traded as a % of the 20 day average in Kesko B
100102104106108110112114116118120
-200%
0%
200%
400%
600%
800%
1000%
1200%
2/09 11/09 20/09 1/10
Cumulative excess % (LHS) Rebased Price
90
92
94
96
98
100
102
104
-100%
-50%
0%
50%
100%
150%
200%
250%
2/09 11/09 20/09 1/10
Cumulative excess % (LHS) Rebased Price
Source: Bloomberg, HSBC, Price rebased Source: Bloomberg, HSBC, Price rebased
Excess Turnover traded as a % of the 20 day average in Hellenic Telecom
Excess Turnover traded as a % of the 20 day average in OPAP
100
105
110
115
120
125
-100%0%
100%200%300%400%500%600%700%
2/09 11/09 20/09 1/10
Cumulative excess % (LHS) Rebased Price
9095100105110115120125130
-100%0%
100%200%300%400%500%600%700%800%900%
2/09 11/09 20/09 1/10
Cumulative excess % (LHS) Rebased Price
Source: Bloomberg, HSBC, Price rebased Source: Bloomberg, HSBC, Price rebased
Excess Turnover traded as a % of the 20 day average in Orient Overseas International
Excess Turnover traded as a % of the 20 day average in Cosmo Oil
100
102
104
106
108
110
112
-150%-100%-50%
0%50%
100%150%200%250%
2/09 11/09 23/09 3/10
Cumulative excess % (LHS) Rebased Price
80
85
90
95
100
105
-400%
-200%
0%
200%
400%
600%
800%
2/09 11/09 24/09 3/10
Cumulative excess % (LHS) Rebased Price
Source: Bloomberg, HSBC, Price rebased Source: Bloomberg, HSBC, Price rebased
11
Equity Quantitative Analysis Index Analysis - Global 8 October 2013
abc
Excess Turnover traded as a % of the 20 day average in Furukawa Electric
Excess Turnover traded as a % of the 20 day average in Gree
100102104106108110112114116
-150%
-100%
-50%
0%
50%
100%
150%
2/09 11/09 24/09 3/10
Cumulative excess % (LHS) Rebased Price
9092949698100102104106
-1000%-900%-800%-700%-600%-500%-400%-300%-200%-100%
0%
2/09 11/09 24/09 3/10
Cumulative excess % (LHS) Rebased Price
Source: Bloomberg, HSBC, Price rebased Source: Bloomberg, HSBC, Price rebased
Excess Turnover traded as a % of the 20 day average in Olam International
Excess Turnover traded as a % of the 20 day average in Acciona
9092949698100102104106
-800%-700%-600%-500%-400%-300%-200%-100%
0%
2/09 11/09 20/09 1/10
Cumulative excess % (LHS) Rebased Price
90
95
100
105
110
115
120
-50%
0%
50%
100%
150%
200%
250%
300%
2/09 11/09 20/09 1/10
Cumulative excess % (LHS) Rebased Price
Source: Bloomberg, HSBC, Price rebased Source: Bloomberg, HSBC, Price rebased
Excess Turnover traded as a % of the 20 day average in Penney (J C)
60
70
80
90
100
110
120
-500%-400%-300%-200%-100%
0%100%200%300%400%500%600%
3/09 12/09 23/09 2/10
Cumulative excess % (LHS) Rebased Price
Source: Bloomberg, HSBC, Price rebased

12
Equity Quantitative Analysis Index Analysis - Global 8 October 2013
abc
Excess Turnover traded as a % of the 20 day average in Telekom Austria
Excess Turnover traded as a % of the 20 day average in Verbund
90
95
100
105
110
115
120
-400%
-200%
0%
200%
400%
600%
800%
1000%
2/09 11/09 20/09 1/10
Cumulative excess % (LHS) Rebased Price
100102104106108110112114116118120
-200%
0%
200%
400%
600%
800%
1000%
1200%
2/09 11/09 20/09 1/10
Cumulative excess % (LHS) Rebased Price
Source: Bloomberg, HSBC, Price rebased Source: Bloomberg, HSBC, Price rebased
Excess Turnover traded as a % of the 20 day average in Ryanair Holdings
80
85
90
95
100
105
-200%-100%
0%100%200%300%400%500%600%700%
2/09 11/09 20/09 1/10
Cumulative excess % (LHS) Rebased Price
Source: Bloomberg, HSBC, Price rebased
13
Equity Quantitative Analysis Index Analysis - Global 8 October 2013
abc
Trading Activity Charts: Emerging Market – Additions Excess Turnover traded as a % of the 20 day average in Biostime International Holding
Excess Turnover traded as a % of the 20 day average in China Galaxy Securities
100105110115120125130135140145
-200%
-100%
0%
100%
200%
300%
400%
500%
2/09 11/09 23/09 3/10
Cumulative excess % (LHS) Rebased Price
100102104106108110112114116
-400%
-200%
0%
200%
400%
600%
800%
1000%
2/09 11/09 23/09 3/10
Cumulative excess % (LHS) Rebased Price
Source: Bloomberg, HSBC, Price rebased Source: Bloomberg, HSBC, Price rebased
Excess Turnover traded as a % of the 20 day average in Chongqing Changan Automobile
Excess Turnover traded as a % of the 20 day average in Sinopec Engineering (Group)
100102104106108110112114116118120
-100%0%
100%200%300%400%500%600%700%
2/09 11/09 24/09
Cumulative excess % (LHS) Rebased Price
90
92
94
96
98
100
102
-600%
-400%
-200%
0%
200%
400%
600%
800%
2/09 11/09 23/09 3/10
Cumulative excess % (LHS) Rebased Price
Source: Bloomberg, HSBC, Price rebased Source: Bloomberg, HSBC, Price rebased
Excess Turnover traded as a % of the 20 day average in Alpha Bank
Excess Turnover traded as a % of the 20 day average in New Folli Follie
90
95
100
105
110
115
120
-100%
0%
100%
200%
300%
400%
500%
600%
2/09 11/09 20/09 1/10
Cumulative excess % (LHS) Rebased Price
100102104106108110112114116118120
-400%-200%
0%200%400%600%800%
1000%1200%
2/09 11/09 20/09 1/10
Cumulative excess % (LHS) Rebased Price
Source: Bloomberg, HSBC, Price rebased Source: Bloomberg, HSBC, Price rebased
14
Equity Quantitative Analysis Index Analysis - Global 8 October 2013
abc
Excess Turnover traded as a % of the 20 day average in Hellenic Petroleum
Excess Turnover traded as a % of the 20 day average in Hellenic Telecom
100
105
110
115
120
125
130
-300%-200%-100%
0%100%200%300%400%500%600%700%800%
2/09 11/09 20/09 1/10
Cumulative excess % (LHS) Rebased Price
100
105
110
115
120
125
-100%0%
100%200%300%400%500%600%700%
2/09 11/09 20/09 1/10
Cumulative excess % (LHS) Rebased Price
Source: Bloomberg, HSBC, Price rebased Source: Bloomberg, HSBC, Price rebased
Excess Turnover traded as a % of the 20 day average in Jumbo
Excess Turnover traded as a % of the 20 day average in National Bank of Greece
100
105
110
115
120
125
-400%-200%
0%200%400%600%800%
1000%1200%1400%1600%
2/09 11/09 20/09 1/10
Cumulative excess % (LHS) Rebased Price
90
95
100
105
110
115
120
125
-250%-200%-150%-100%-50%
0%50%
100%150%200%250%
2/09 11/09 20/09 1/10
Cumulative excess % (LHS) Rebased Price
Source: Bloomberg, HSBC, Price rebased Source: Bloomberg, HSBC, Price rebased
Excess Turnover traded as a % of the 20 day average in OPAP
Excess Turnover traded as a % of the 20 day average in Piraeus Bank
9095100105110115120125130
-100%0%
100%200%300%400%500%600%700%800%900%
2/09 11/09 20/09 1/10
Cumulative excess % (LHS) Rebased Price
100
105
110
115
120
125
130
-100%0%
100%200%300%400%500%600%700%800%
2/09 11/09 20/09 1/10
Cumulative excess % (LHS) Rebased Price
Source: Bloomberg, HSBC, Price rebased Source: Bloomberg, HSBC, Price rebased
15
Equity Quantitative Analysis Index Analysis - Global 8 October 2013
abc
Excess Turnover traded as a % of the 20 day average in Public Power Corp
Excess Turnover traded as a % of the 20 day average in Richter
100
105
110
115
120
125
130
-100%
0%
100%
200%
300%
400%
500%
600%
2/09 11/09 20/09 1/10
Cumulative excess % (LHS) Rebased Price
90
95
100
105
110
115
-200%-150%-100%-50%
0%50%
100%150%200%250%300%
2/09 11/09 20/09 1/10
Cumulative excess % (LHS) Rebased Price
Source: Bloomberg, HSBC, Price rebased Source: Bloomberg, HSBC, Price rebased
Excess Turnover traded as a % of the 20 day average in NMDC
Excess Turnover traded as a % of the 20 day average in Oracle Financial Services Software
9092949698100102104106
-600%
-500%
-400%
-300%
-200%
-100%
0%
2/09 12/09 23/09 3/10
Cumulative excess % (LHS) Rebased Price
9092949698100102104106108110
-700%
-600%
-500%
-400%
-300%
-200%
-100%
0%
2/09 12/09 23/09 3/10
Cumulative excess % (LHS) Rebased Price
Source: Bloomberg, HSBC, Price rebased Source: Bloomberg, HSBC, Price rebased
Excess Turnover traded as a % of the 20 day average in Steel Authority of India
Excess Turnover traded as a % of the 20 day average in Tower Bersama Infrastructure
90
95
100
105
110
115
120
125
-250%
-200%
-150%
-100%
-50%
0%
50%
100%
2/09 12/09 23/09 3/10
Cumulative excess % (LHS) Rebased Price
90
95
100
105
110
115
-1000%
-800%
-600%
-400%
-200%
0%
200%
2/09 11/09 20/09 1/10
Cumulative excess % (LHS) Rebased Price
Source: Bloomberg, HSBC, Price rebased Source: Bloomberg, HSBC, Price rebased

16
Equity Quantitative Analysis Index Analysis - Global 8 October 2013
abc
Excess Turnover traded as a % of the 20 day average in Macquaire Korea Infrastructure Fund
Excess Turnover traded as a % of the 20 day average in Elektra
90
92
94
96
98
100
102
-100%
0%
100%
200%
300%
400%
500%
2/09 11/09 25/09 7/10
Cumulative excess % (LHS) Rebased Price
9092949698100102104106
-150%-100%-50%
0%50%
100%150%200%250%300%350%
2/09 11/09 23/09 2/10
Cumulative excess % (LHS) Rebased Price
Source: Bloomberg, HSBC, Price rebased Source: Bloomberg, HSBC, Price rebased
Excess Turnover traded as a % of the 20 day average in Capitec Bank Holdings
Excess Turnover traded as a % of the 20 day average in Asia Pacific Telecom
100102104106108110112114116
-350%
-300%
-250%
-200%
-150%
-100%
-50%
0%
2/09 11/09 20/09 2/10
Cumulative excess % (LHS) Rebased Price
9092949698100102104106108
-400%
-300%
-200%
-100%
0%
100%
200%
300%
2/09 11/09 23/09 2/10
Cumulative excess % (LHS) Rebased Price
Source: Bloomberg, HSBC, Price rebased Source: Bloomberg, HSBC, Price rebased
Excess Turnover traded as a % of the 20 day average in Inotera Memories
Excess Turnover traded as a % of the 20 day average in TMB Bank
100
110
120
130
140
150
160
-200%0%
200%400%600%800%
1000%1200%1400%
2/09 11/09 23/09 2/10
Cumulative excess % (LHS) Rebased Price
90
95
100
105
110
115
-500%
-400%
-300%
-200%
-100%
0%
100%
200%
2/09 11/09 20/09 1/10
Cumulative excess % (LHS) Rebased Price
Source: Bloomberg, HSBC, Price rebased Source: Bloomberg, HSBC, Price rebased
17
Equity Quantitative Analysis Index Analysis - Global 8 October 2013
abc
Trading Activity Charts: Emerging Market – Deletions Excess Turnover traded as a % of the 20 day average in Multiplus
Excess Turnover traded as a % of the 20 day average in Bosideng International Holding
9092949698100102104106108110
-350%
-300%
-250%
-200%
-150%
-100%
-50%
0%
2/09 11/09 20/09 1/10
Cumulative excess % (LHS) Rebased Price
100
105
110
115
120
125
-300%-200%-100%
0%100%200%300%400%500%600%
2/09 11/09 23/09 3/10
Cumulative excess % (LHS) Rebased Price
Source: Bloomberg, HSBC, Price rebased Source: Bloomberg, HSBC, Price rebased
Excess Turnover traded as a % of the 20 day average in China Shanshui Cement Group
Excess Turnover traded as a % of the 20 day average in China Shanshui Cement Group
9092949698100102104106
-120%-100%-80%-60%-40%-20%
0%20%40%60%
2/09 11/09 23/09 3/10
Cumulative excess % (LHS) Rebased Price
100102104106108110112114116
-200%-150%-100%-50%
0%50%
100%150%200%250%300%
2/09 11/09 23/09 3/10
Cumulative excess % (LHS) Rebased Price
Source: Bloomberg, HSBC, Price rebased Source: Bloomberg, HSBC, Price rebased
Excess Turnover traded as a % of the 20 day average in Dah Chong Hong Holdings
Excess Turnover traded as a % of the 20 day average in Daphne International Holding
90
95
100
105
110
115
-400%-200%
0%200%400%600%800%
1000%1200%
2/09 11/09 23/09 3/10
Cumulative excess % (LHS) Rebased Price
9092949698100102104106108110
-300%-200%-100%
0%100%200%300%400%500%
2/09 11/09 23/09 3/10
Cumulative excess % (LHS) Rebased Price
Source: Bloomberg, HSBC, Price rebased Source: Bloomberg, HSBC, Price rebased
18
Equity Quantitative Analysis Index Analysis - Global 8 October 2013
abc
Excess Turnover traded as a % of the 20 day average in Parkson Retail Group
Excess Turnover traded as a % of the 20 day average in Adani Enterprises
90
95
100
105
110
115
-300%-200%-100%
0%100%200%300%400%500%
2/09 11/09 23/09 3/10
Cumulative excess % (LHS) Rebased Price
9092949698100102104106108110
-200%-150%-100%-50%
0%50%
100%150%200%250%
2/09 12/09 23/09 3/10
Cumulative excess % (LHS) Rebased Price
Source: Bloomberg, HSBC, Price rebased Source: Bloomberg, HSBC, Price rebased
Excess Turnover traded as a % of the 20 day average in Bank of Baroda
Excess Turnover traded as a % of the 20 day average in Bank of India
90
95
100
105
110
115
120
125
-100%
0%
100%
200%
300%
400%
500%
2/09 12/09 23/09 3/10
Cumulative excess % (LHS) Rebased Price
9095100105110115120125130135
-150%-100%-50%
0%50%
100%150%200%250%300%
2/09 12/09 23/09 3/10
Cumulative excess % (LHS) Rebased Price
Source: Bloomberg, HSBC, Price rebased Source: Bloomberg, HSBC, Price rebased
Excess Turnover traded as a % of the 20 day average in Unitech
Excess Turnover traded as a % of the 20 day average in Wockhardt
9092949698100102104106108
-250%
-200%
-150%
-100%
-50%
0%
50%
100%
2/09 12/09 23/09 3/10
Cumulative excess % (LHS) Rebased Price
90
100
110
120
130
140
150
160
-400%
-200%
0%
200%
400%
600%
800%
1000%
2/09 12/09 23/09 3/10
Cumulative excess % (LHS) Rebased Price
Source: Bloomberg, HSBC, Price rebased Source: Bloomberg, HSBC, Price rebased
19
Equity Quantitative Analysis Index Analysis - Global 8 October 2013
abc
Excess Turnover traded as a % of the 20 day average in Bumi Resources
Excess Turnover traded as a % of the 20 day average in Indosat
100
105
110
115
120
125
130
135
-200%
0%
200%
400%
600%
800%
1000%
1200%
2/09 11/09 20/09 1/10
Cumulative excess % (LHS) Rebased Price
9092949698100102104106108110
-400%
-200%
0%
200%
400%
600%
800%
1000%
2/09 11/09 20/09 1/10
Cumulative excess % (LHS) Rebased Price
Source: Bloomberg, HSBC, Price rebased Source: Bloomberg, HSBC, Price rebased
Excess Turnover traded as a % of the 20 day average in Hyundai Securities
Excess Turnover traded as a % of the 20 day average in Attijariwafa Bank
100
105
110
115
120
125
130
-200%-100%
0%100%200%300%400%500%600%
2/09 11/09 25/09 7/10
Cumulative excess % (LHS) Rebased Price
90
92
94
96
98
100
102
104
-300%-200%-100%
0%100%200%300%400%500%600%700%
2/09 11/09 20/09 1/10
Cumulative excess % (LHS) Rebased Price
Source: Bloomberg, HSBC, Price rebased Source: Bloomberg, HSBC, Price rebased
Excess Turnover traded as a % of the 20 day average in Douja Promotion Groupe Addoh
Excess Turnover traded as a % of the 20 day average in Itissalat Al Maghrib (Maroc Telecom)
90
95
100
105
110
115
120
-500%
0%
500%
1000%
1500%
2000%
2500%
2/09 11/09 20/09 1/10
Cumulative excess % (LHS) Rebased Price
100100.5101101.5102102.5103103.5104104.5105
-1000%-900%-800%-700%-600%-500%-400%-300%-200%-100%
0%
2/09 11/09 20/09 1/10
Cumulative excess % (LHS) Rebased Price
Source: Bloomberg, HSBC, Price rebased Source: Bloomberg, HSBC, Price rebased
20
Equity Quantitative Analysis Index Analysis - Global 8 October 2013
abc
Excess Turnover traded as a % of the 20 day average in Metropolitan Bank & Trust
90
95
100
105
110
115
-450%-400%-350%-300%-250%-200%-150%-100%-50%
0%
2/09 11/09 20/09 1/10
Cumulative excess % (LHS) Rebased Price
Source: Bloomberg, HSBC, Price rebased
21
Equity Quantitative Analysis Index Analysis - Global 8 October 2013
abc
Appendix
Methodology
The data in this document is based on the assumption that 0.70% of the MSCI World, 2.75% of the MSCI
EAFE, 0.50% of the MSCI DM Asia Pacific, 0.15% of the MSCI US, 1.00% of the MSCI Europe, 6.00%
of the MSCI EM are held by passive funds.
EDT (Equivalent Days Trading) is based on 20 days average turnover.
Prices used for calculations are closing prices as of 4 October 2013. Volume and FX rates have been
sourced from Reuters, Bloomberg and Thomson Reuters Datastream. All constituent data and weightings
have been provided by MSCI
22
Equity Quantitative Analysis Index Analysis - Global 8 October 2013
abc
Disclosure appendix Analyst Certification The following analyst(s), economist(s), and/or strategist(s) who is(are) primarily responsible for this report, certifies(y) that the opinion(s) on the subject security(ies) or issuer(s) and/or any other views or forecasts expressed herein accurately reflect their personal view(s) and that no part of their compensation was, is or will be directly or indirectly related to the specific recommendation(s) or views contained in this research report: Vijay Sumon, Joaquim De Lima and Freddie Siu
Basis for financial analysis The strategies discussed in this report are based purely on the quantitative valuation screens illustrated and use consensus forecasts. For this reason, they do not necessarily coincide with the ratings of HSBC sector analysts who cover any of the stocks referred to.
This report is designed for, and should only be utilised by, institutional investors. HSBC believes an investor's decision to buy or sell a stock should depend on individual circumstances such as the investor's existing holdings and other considerations. Different securities firms use a variety of ratings terms as well as different rating systems to describe their recommendations. Investors should carefully read the definitions of the ratings used in each research report. In addition, because research reports contain more complete information concerning the analysts' views, investors should carefully read the entire research report and should not infer its contents from the rating. In any case, ratings should not be used or relied on in isolation as investment advice.
Rating definitions for long-term investment opportunities
Stock ratings HSBC assigns ratings to its stocks in this sector on the following basis:
For each stock we set a required rate of return calculated from the cost of equity for that stock’s domestic or, as appropriate, regional market established by our strategy team. The price target for a stock represents the value the analyst expects the stock to reach over our performance horizon. The performance horizon is 12 months. For a stock to be classified as Overweight, the potential return, which equals the percentage difference between the current share price and the target price, including the forecast dividend yield when indicated, must exceed the required return by at least 5 percentage points over the next 12 months (or 10 percentage points for a stock classified as Volatile*). For a stock to be classified as Underweight, the stock must be expected to underperform its required return by at least 5 percentage points over the next 12 months (or 10 percentage points for a stock classified as Volatile*). Stocks between these bands are classified as Neutral.
Our ratings are re-calibrated against these bands at the time of any 'material change' (initiation of coverage, change of volatility status or change in price target). Notwithstanding this, and although ratings are subject to ongoing management review, expected returns will be permitted to move outside the bands as a result of normal share price fluctuations without necessarily triggering a rating change.
*A stock will be classified as volatile if its historical volatility has exceeded 40%, if the stock has been listed for less than 12 months (unless it is in an industry or sector where volatility is low) or if the analyst expects significant volatility. However, stocks which we do not consider volatile may in fact also behave in such a way. Historical volatility is defined as the past month's average of the daily 365-day moving average volatilities. In order to avoid misleadingly frequent changes in rating, however, volatility has to move 2.5 percentage points past the 40% benchmark in either direction for a stock's status to change.
23
Equity Quantitative Analysis Index Analysis - Global 8 October 2013
abc
HSBC & Analyst disclosures Disclosure checklist
Company Disclosure
ACCIONA SA 2, 5, 6, 7ADANI ENTERPRISES 4ALCATEL LUCENT 2, 6, 7, 11ALPHA BANK 1, 5, 6, 7, 11ATTIJARIWAFA BANK 6, 7BANK OF BARODA 4, 6, 7, 11BANK OF INDIA 1, 5, 6, 7, 11BOSIDENG 4CHANGAN AUTOMOBILES 4CHINA GALAXY SECURITIES 1, 5CHINA SHANSHUI CEMENT 6CHINA SOUTHERN AIRLINES 5, 6, 7CHONGQING CHANGAN AUTOMOBILE 4EVONIK 5, 6, 7, 11FOLLI FOLLIE GROUP 7FURUKAWA ELECTRIC CO.,LTD 7GREE 4HELLENIC PETROLEUM GROUP 1, 2, 5, 6, 7, 11HYUNDAI SECURITIES CO 6, 7INDOSAT 5, 6, 11METHANEX CORP 1, 5METROPOLITAN BANK & TRUST 6, 7, 11NMDC LTD 4NXP SEMICONDUCTOR 1, 5, 7OLAM INTERNATIONAL 1, 2, 5, 6, 7, 11ORIENT OVERSEAS INT'L 2, 6, 7OTE (HELLENIC TLCM) 1, 5, 7, 11PARKSON 7PIRAEUS BANK SA 7, 11PUBLIC POWER CORPORATION 5, 7, 11RYANAIR 4SINOPEC ENGINEERING (GROUP) CO 1, 4, 5STEEL AUTHORITY OF INDIA 5, 7SYDNEY AIRPORT 6, 7TMB BANK 6, 7UNITECH LTD 4VALEO 4, 5, 6, 7, 11VERBUND 11WOCKHARDT 6, 7
Source: HSBC
1 HSBC has managed or co-managed a public offering of securities for this company within the past 12 months. 2 HSBC expects to receive or intends to seek compensation for investment banking services from this company in the next
3 months. 3 At the time of publication of this report, HSBC Securities (USA) Inc. is a Market Maker in securities issued by this
company. 4 As of 31 August 2013 HSBC beneficially owned 1% or more of a class of common equity securities of this company. 5 As of 31 August 2013, this company was a client of HSBC or had during the preceding 12 month period been a client of
and/or paid compensation to HSBC in respect of investment banking services. 6 As of 31 August 2013, this company was a client of HSBC or had during the preceding 12 month period been a client of
and/or paid compensation to HSBC in respect of non-investment banking securities-related services. 7 As of 31 August 2013, this company was a client of HSBC or had during the preceding 12 month period been a client of
and/or paid compensation to HSBC in respect of non-securities services. 8 A covering analyst/s has received compensation from this company in the past 12 months. 9 A covering analyst/s or a member of his/her household has a financial interest in the securities of this company, as
detailed below. 10 A covering analyst/s or a member of his/her household is an officer, director or supervisory board member of this
company, as detailed below.
24
Equity Quantitative Analysis Index Analysis - Global 8 October 2013
abc
11 At the time of publication of this report, HSBC is a non-US Market Maker in securities issued by this company and/or in securities in respect of this company
HSBC and its affiliates will from time to time sell to and buy from customers the securities/instruments (including derivatives) of companies covered in HSBC Research on a principal or agency basis.
Analysts, economists, and strategists are paid in part by reference to the profitability of HSBC which includes investment banking revenues.
For disclosures in respect of any company mentioned in this report, please see the most recently published report on that company available at www.hsbcnet.com/research.
Additional disclosures 1 This report is dated as at 08 October 2013. 2 All market data included in this report are dated as at close 04 October 2013, unless otherwise indicated in the report. 3 HSBC has procedures in place to identify and manage any potential conflicts of interest that arise in connection with its
Research business. HSBC's analysts and its other staff who are involved in the preparation and dissemination of Research operate and have a management reporting line independent of HSBC's Investment Banking business. Information Barrier procedures are in place between the Investment Banking and Research businesses to ensure that any confidential and/or price sensitive information is handled in an appropriate manner.
MSCI Disclaimer The MSCI sourced information is the exclusive property of Morgan Stanley Capital International Inc. (MSCI). Without prior written permission of MSCI, this information and any other MSCI intellectual property may not be reproduced, redisseminated or used to create any financial products, including any indices. This information is provided on an 'as is' basis. The user assumes the entire risk of any use made of this information. MSCI, its affiliates and any third party involved in, or related to, computing or compiling the information hereby expressly disclaim all warranties of originality, accuracy, completeness, merchantability or fitness for a particular purpose with respect to any of this information. Without limiting any of the foregoing, in no event shall MSCI, any of its affiliates or any third party involved in, or related to, computing or compiling the information have any liability for any damages of any kind. MSCI, Morgan Stanley Capital International and the MSCI indexes are services marks of MSCI and its affiliates.

25
Equity Quantitative Analysis Index Analysis - Global 8 October 2013
abc
Disclaimer * Legal entities as at 8 August 2012 ‘UAE’ HSBC Bank Middle East Limited, Dubai; ‘HK’ The Hongkong and Shanghai Banking Corporation Limited, Hong Kong; ‘TW’ HSBC Securities (Taiwan) Corporation Limited; 'CA' HSBC Bank Canada, Toronto; HSBC Bank, Paris Branch; HSBC France; ‘DE’ HSBC Trinkaus & Burkhardt AG, Düsseldorf; 000 HSBC Bank (RR), Moscow; ‘IN’ HSBC Securities and Capital Markets (India) Private Limited, Mumbai; ‘JP’ HSBC Securities (Japan) Limited, Tokyo; ‘EG’ HSBC Securities Egypt SAE, Cairo; ‘CN’ HSBC Investment Bank Asia Limited, Beijing Representative Office; The Hongkong and Shanghai Banking Corporation Limited, Singapore Branch; The Hongkong and Shanghai Banking Corporation Limited, Seoul Securities Branch; The Hongkong and Shanghai Banking Corporation Limited, Seoul Branch; HSBC Securities (South Africa) (Pty) Ltd, Johannesburg; HSBC Bank plc, London, Madrid, Milan, Stockholm, Tel Aviv; ‘US’ HSBC Securities (USA) Inc, New York; HSBC Yatirim Menkul Degerler AS, Istanbul; HSBC México, SA, Institución de Banca Múltiple, Grupo Financiero HSBC; HSBC Bank Brasil SA – Banco Múltiplo; HSBC Bank Australia Limited; HSBC Bank Argentina SA; HSBC Saudi Arabia Limited; The Hongkong and Shanghai Banking Corporation Limited, New Zealand Branch incorporated in Hong Kong SAR
Issuer of report HSBC Bank plc 8 Canada Square
London, E14 5HQ, United Kingdom
Telephone: +44 20 7991 8888
Fax: +44 20 7992 4880
Website: www.research.hsbc.com
In the UK this document has been issued and approved by HSBC Bank plc (“HSBC”) for the information of its Clients (as defined in the Rules of FCA) and those of its affiliates only. It is not intended for Retail Clients in the UK. If this research is received by a customer of an affiliate of HSBC, its provision to the recipient is subject to the terms of business in place between the recipient and such affiliate. HSBC Securities (USA) Inc. accepts responsibility for the content of this research report prepared by its non-US foreign affiliate. All U.S. persons receiving and/or accessing this report and wishing to effect transactions in any security discussed herein should do so with HSBC Securities (USA) Inc. in the United States and not with its non-US foreign affiliate, the issuer of this report. In Singapore, this publication is distributed by The Hongkong and Shanghai Banking Corporation Limited, Singapore Branch for the general information of institutional investors or other persons specified in Sections 274 and 304 of the Securities and Futures Act (Chapter 289) (“SFA”) and accredited investors and other persons in accordance with the conditions specified in Sections 275 and 305 of the SFA. This publication is not a prospectus as defined in the SFA. It maynot be further distributed in whole or in part for any purpose. The Hongkong and Shanghai Banking Corporation Limited Singapore Branch is regulated by the Monetary Authority of Singapore. Recipients in Singapore should contact a "Hongkong and Shanghai Banking Corporation Limited, Singapore Branch" representative in respect of any matters arising from, or in connection with this report. In Australia, this publication has been distributed by The Hongkong and Shanghai Banking Corporation Limited (ABN 65 117 925 970, AFSL 301737) for the general information of its “wholesale” customers (as defined in the Corporations Act 2001). Where distributed to retail customers, this research is distributed by HSBC Bank Australia Limited (AFSL No. 232595). These respective entities make no representations that the products or services mentioned in this document are available to persons in Australia or are necessarily suitable for any particular person or appropriate in accordance with local law. No consideration has been given to the particular investment objectives, financial situation or particular needs of any recipient. This publication has been distributed in Japan by HSBC Securities (Japan) Limited. It may not be further distributed, in whole or in part, for any purpose. In Hong Kong, this document has been distributed by The Hongkong and Shanghai Banking Corporation Limited in the conduct of its Hong Kong regulated business for the information of its institutional and professional customers; it is not intended for and should not be distributed to retail customers in Hong Kong. The Hongkong and Shanghai Banking Corporation Limited makes no representations that the products or services mentioned in this document are available to persons in Hong Kong or are necessarily suitable for any particular person or appropriate in accordance with local law. All inquiries by such recipients must be directed to The Hongkong and Shanghai Banking Corporation Limited. In Korea, this publication is distributed by The Hongkong and Shanghai Banking Corporation Limited, Seoul Securities Branch ("HBAP SLS") for the general information of professional investors specified in Article 9 of the Financial Investment Services and Capital Markets Act (“FSCMA”). This publication is not a prospectus as defined in the FSCMA. It may not be further distributed in whole or in part for any purpose. HBAP SLS is regulated by the Financial Services Commission and the Financial Supervisory Service of Korea. This publication is distributed in New Zealand by The Hongkong and Shanghai Banking Corporation Limited, New Zealand Branch incorporated in Hong Kong SAR. This document is not and should not be construed as an offer to sell or the solicitation of an offer to purchase or subscribe for any investment. HSBC has based this document on information obtained from sources it believes to be reliable but which it has not independently verified; HSBC makes no guarantee, representation or warranty and accepts no responsibility or liability as to its accuracy or completeness. The opinions contained within the report are based upon publicly available information at the time of publication and are subject to change without notice. Nothing herein excludes or restricts any duty or liability to a customer which HSBC has under the Financial Services and Markets Act 2000 or under the Rules of FCA and PRA. A recipient who chooses to deal with any person who is not a representative of HSBC in the UK will not enjoy the protections afforded by the UK regulatory regime. Past performance is not necessarily a guide to future performance. The value of any investment or income may go down as well as up and you may not get back the full amount invested. Where an investment is denominated in a currency other than the local currency of the recipient of the research report, changes in the exchange rates may have an adverse effect on the value, price or income of that investment. In case of investments for which there is no recognised market it may be difficult for investors to sell their investments or to obtain reliable information about its value or the extent of the risk to which it is exposed. In Canada, this document has been distributed by HSBC Bank Canada and/or its affiliates. Where this document contains market updates/overviews, or similar materials (collectively deemed “Commentary” in Canada although other affiliate jurisdictions may term “Commentary” as either “macro-research” or “research”), the Commentary is not an offer to sell, or a solicitation of an offer to sell or subscribe for, any financial product or instrument (including, without limitation, any currencies, securities, commodities or other financial instruments). HSBC Bank plc is registered in England No 14259, is authorised by the Prudential Regulation Authority and regulated by the Financial Conduct Authority and the Prudential Regulation Authority and is a member of the London Stock Exchange. (070905) © Copyright 2013, HSBC Bank plc, ALL RIGHTS RESERVED. No part of this publication may be reproduced, stored in a retrieval system, or transmitted, on any form or by any means, electronic, mechanical, photocopying, recording, or otherwise, without the prior written permission of HSBC Bank plc. MICA (P) 118/04/2013, MICA (P) 068/04/2013 and MICA (P) 110/01/2013
abc
Joaquim de Lima Analyst, Head of Equity Quantitative Research +44 20 7991 6836 [email protected]
Vijay Sumon Director, Head of Indexation +44 20 7991 6839 [email protected]
Xiao Cheng Analyst +44 20 7991 1246 [email protected]
Ely Klepfish Analyst +44 20 7991 6719 [email protected]
Freddie Siu Analyst +852 2996 6558 [email protected]
Winnie Ma Analyst +852 2822 4393 [email protected]
Global Equity Quantitative Research