Embed Size (px)
Citation preview

MSE 600
Descriptive Statistics
Chapter 10 in 6th Edition(may be another chapter in 7th edition)
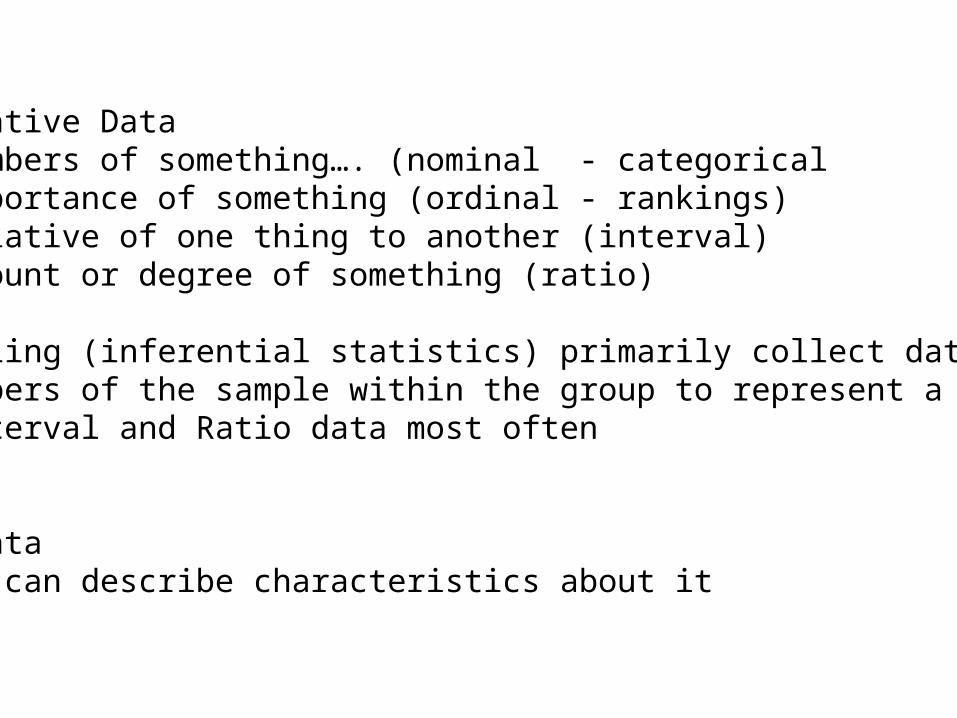
Quantitative DataNumbers of something…. (nominal - categoricalImportance of something (ordinal - rankings)Relative of one thing to another (interval)Amount or degree of something (ratio)
In sampling (inferential statistics) primarily collect data aboutthe members of the sample within the group to represent a Group
Interval and Ratio data most often
Group dataWe can describe characteristics about it

A set of scores represent each person in the group
Frequency tableDistribution of the group’s scores
Frequency polygon
X-Y axesX axis – the scoreY axis – the number of times that each score occurs

Example of a Frequency Polygon

Frequency Polygons – shape of distribution
NormalSkewed
to the left (mean to the left of mode)to the right (mean to right of mode)

Measures of Central Tendency
MeanMedianMode
Mode – most frequently occurring scoreuseful for nominal data
Median – 50th percentileuseful if extreme scores
Mean – averagecommonly used in statsaffected by extreme scores

The Normal CurveNormal Curve – Bell Curve –
Normal Distribution of Scores

Example of the Mode, Median and Mean in a
Distribution
Mode = 62
Median 64.5
Mean = 66.7
Raw Score Freq98 197 191 285 180 577 772 565 364 762 1058 345 233 111 1
5 150
Total = 3337
Range = 93 (98 -5)St Dev = 17.1

Calculation of the Standard Deviation of a Distribution
Σ Σσ√Χ¯
Σσ√Χ¯
√
RawScore Mean X – X (X – X)
2
85 54 31 96180 54 26 67670 54 16 25660 54 6 3655 54 1 150 54 -4 1645 54 -9 8140 54 -14 19630 54 -24 57625 54 -29 841
Variance (SD2) =
Σ(X – X)2
n
= 3640
10 = 364a
Standard deviation (SD) = Σ(X – X)2
n

Summary of Commonly Used Statistical Techniques
Two or more groups are compared:
Descriptive Statistics
Inferential Statistics
• Frequency polygons• Averages• Spreads• Effect size
• t-test for means• ANOVA• Confidential interval
• Scatterplot• Correlation coefficient (r)
• Percentages• Bar graphs• Pie charts• Crossbreak (contingency) tables
• Chi square
Quantitative Categorical

• Percentiles
Standardized test scores often accompanied by percentiles.
Percentiles are a comparison with the whole group – a norming function – normalizing
Related to the normal curve in terms of comparing one person’s score with another – using standard deviations.
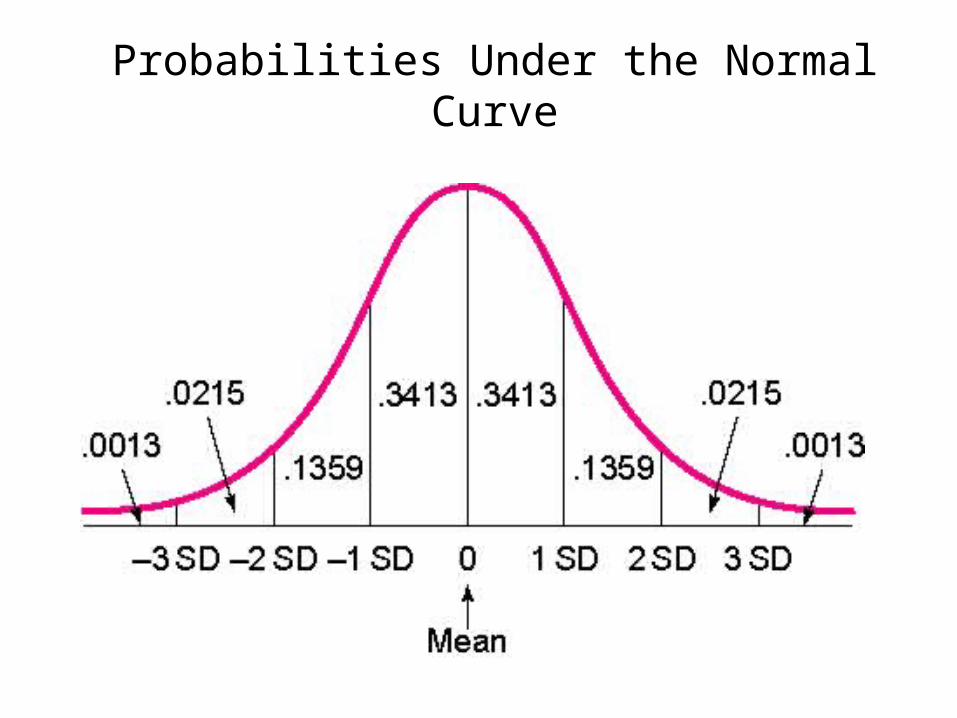
Probabilities Under the Normal Curve

Percentages Under the Normal Curve

Examples of Standard Scores
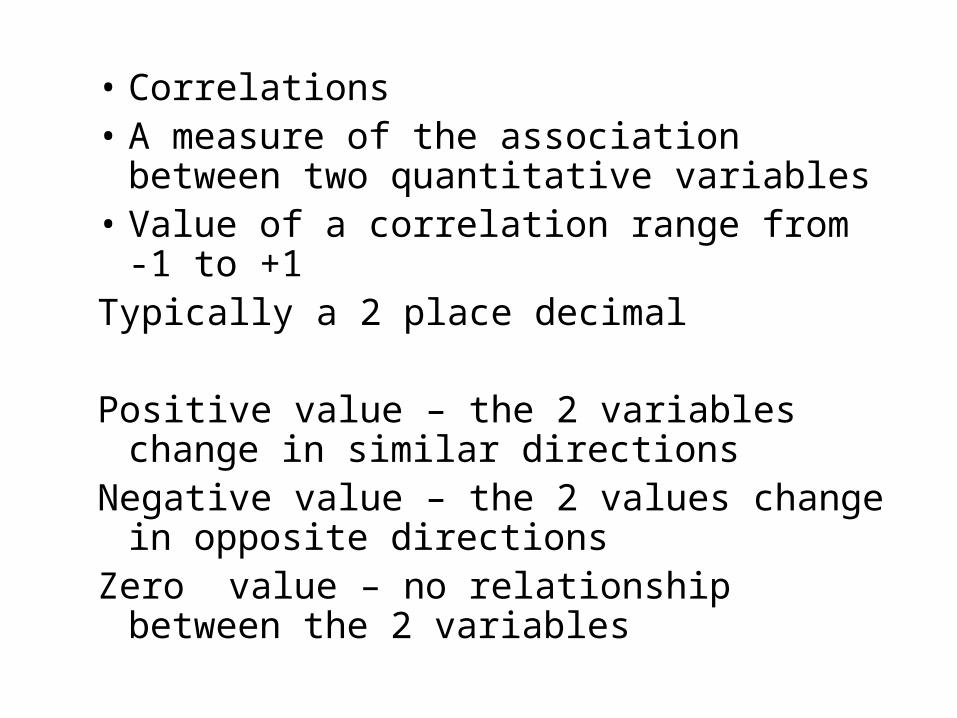
• Correlations• A measure of the association between two
quantitative variables• Value of a correlation range from -1 to +1Typically a 2 place decimal
Positive value – the 2 variables change in similar directions
Negative value – the 2 values change in opposite directions
Zero value – no relationship between the 2 variables

• Correlation
• DOES NOT imply causation
• During the day, the more windows that are open is associated with more light and heat.
• Windows do not cause light or heat

Examples of Scatterplots

Interpretation of Correlation when Testing Research Hypotheses
Magnitude of r Interpretation
.00 to .40 Of little practical importance except inunusual circumstances; perhapsof theoretical value.a
.41 to .60 Large enough to be of practical as well astheoretical use.
.61 to .80 Very important, but rarely obtained ineducational research.
.81 to above Possibly an error in calculation; if not, a very sizable relationship.

end