Embed Size (px)
Citation preview
Full Terms & Conditions of access and use can be found athttp://www.tandfonline.com/action/journalInformation?journalCode=ragr20
Download by: [UNIVERSITY OF KWAZULU-NATAL] Date: 29 June 2017, At: 03:17
AgrekonAgricultural Economics Research, Policy and Practice in Southern Africa
ISSN: 0303-1853 (Print) 2078-0400 (Online) Journal homepage: http://www.tandfonline.com/loi/ragr20
Social capital effects on rural household poverty inMsinga, KwaZulu-Natal, South Africa
Lloyd James S. Baiyegunhi
To cite this article: Lloyd James S. Baiyegunhi (2014) Social capital effects on ruralhousehold poverty in Msinga, KwaZulu-Natal, South Africa, Agrekon, 53:2, 47-64, DOI:10.1080/03031853.2014.915478
To link to this article: http://dx.doi.org/10.1080/03031853.2014.915478
Published online: 12 Jun 2014.
Submit your article to this journal
Article views: 225
View related articles
View Crossmark data
Citing articles: 1 View citing articles
AgrekonVol. 53 (2) 2014 • ISSN Print 0303-1853/Online 2078-0400 © Agricultural Economics Association of South Africa pp 47–64 DOI: 10.1080/03031853.2014.915478
SOCIAL CAPITAL EFFECTS ON RURAL HOUSEHOLD POVERTY IN MSINGA, KWAZULU-NATAL, SOUTH AFRICA
Lloyd James S. Baiyegunhi1
ABSTRACTThis study examined the relationship between rural households’ social capital and poverty. Primary data were collected using a structured questionnaire from a representative sample of 300 rural households in Msinga, KwaZulu-Natal. The study used a logistic regression model to examine the effect of social capital on household poverty, testing the hypothesis that the possession of social capital reduces household poverty. The result of the logistic regression model indicated that, in addition to the demographic and socio-economic characteristics of some households, social capital endowments have a statistically significant negative effect on the probability of a household being poor. The study concluded that, among other factors, social capital is very important to reduce household poverty. Policy implications were discussed.
Keywords: effect, social capital, poverty, rural households, simulation
JEL Classification: I30, C31, C53, R20, Q01
1 INTRODUCTION South Africa, with a gross domestic product of approximately $10 700 per capita, is an upper-middle-income country, but its income and wealth distribution is the most unequal in the world, with a Gini coefficient of 0.63 in 2009 (World Bank, 2013). Income inequality has indirect effects on a country – it can lead to a decrease in trust among people and it impedes community development levels (Alesina and La Ferrara, 2002). Efforts aimed at redressing the social and economic imbalances and racial divisions of the past have been a government priority since the advent of democracy in 1994. Black Economic Empowerment (BEE), renamed Broad Based Black Economic Empowerment (BBBEE), is a strategy for economic empowerment of all black people including women, workers, youth, people with disabilities and people living in rural areas. The strategy is shaped through diverse
1 Senior Lecturer, Discipline of Agricultural Economics, SAEES-University of KwaZulu-Natal. P. Bag X01, Scottsville 3209, Pietermaritzburg, South Africa. Email: [email protected]. Tel: +2733 260 5437.
Lloyd James S.Baiyegunhi
48
but integrated socio-economic strategies that include: “[an] increasing the number of black people that manage, own and control enterprises and productive assets; (b) facilitating ownership and management of enterprises and productive assets by communities, workers, cooperatives and other collective enterprises; (c) human resources and skills development; (d) achieving equitable representation in all occupational categories and levels in the workforce; (e) preferential procurement; and (f) investment in enterprises that are owned or managed by black people” (Sanchez, 2011).
However, in spite of these efforts, many South African households still live in poverty and are vulnerable to becoming poor. The national poverty headcount has basically remained unchanged between 1995 and 2005 and was still at around 41% at US$3 in 2005 (Duclos and Verdier-Chouchane, 2011), with poverty rates of 54.2% and 67.7% for households and individuals in rural areas, respectively. These figures are more than double the corresponding rates of 21.9% and 32.7% in urban areas (Armstrong, Lekezwa and Siebrits, 2008). With 57.1% of all poor households and 59.3% of poor individuals being rural dwellers (Armstrong et al., 2008), it is imperative for policy makers to understand the mechanisms through which poverty can be alleviated. Currently, most development programmes, such as land reform, water supply, public health, rural poor, and community-based poverty reduction and agricultural development projects for farmers, work through networks/social groups. This has made community involvement an important component of the development process. Through social capital, these programmes have become an empowerment instrument for beneficiary groups beyond the direct personal benefits delivered.
Social capital consists of aspects of social structure, obligations and expectations, information channels, and a set of norms and effective sanctions that encourage and/or constrain certain kinds of behaviour (Coleman, 1988). Putman (2000) described social capital as the features of social organisation such as social networks and norms, and social trust that enables community members to act collectively for mutual benefits through coordination and cooperation among themselves. Social capital is defined by Durlauf and Fafchamps (2005) as informal types of institutions and organisations based on social relationships, networks and associations that create shared knowledge, mutual trust, social norms and unwritten rules. According to Imandoust (2011), social capital refers to networks of social relations that may provide individuals and groups with access to resources and support. It is as an important resource as physical or human capital in household production systems contributing to individual, household or group productivity and welfare outcomes.
Although these definitions are a variety of related concepts, they tend to share the core idea that social networks have value. Sociologists and economists have
49
Social capital effects on rural household poverty in Msinga, KwaZulu-Natal, South Africa
continued to recognise the important role played by social networks in household decision-making (Conley and Udry, 2010; Miguel and Kremer, 2007; Munshi and Myaux, 2006), as well as in reducing poverty, sustaining human and economic development, and facilitating rural development through streams of benefits that may flow from an individual or a group’s network of social ties (Durlauf and Fafchamps, 2005; Hayami, 2009; Imandoust, 2011; Ishise and Sawada, 2009; Yusuf, 2008). It is well recognised that social capital improves credit market accessibility through social enforcement and social collateral mechanisms, particularly in developing countries (Fafchamps and Gubert, 2007; Karlan, 2007; Karlan et al., 2009; Okten and Osilis, 2004). Social capital also helps solve enforcement problems in risk-sharing arrangements, because it makes individuals creditworthy (Karlan, 2007; Paal and Wiseman, 2011) and helps them recover quickly from negative calamities (Carter and Castillo, 2005). Studies have shown that community involvement increases the benefit for community members by decreasing crime rates (Yamamura, 2009) and the number of deaths in natural disasters (Yamamura, 2010).
Chamlee-Wright (2008) used the concept of social capital to explain the process of economic development stemming from entrepreneurial activity. It is generally argued that the existence of networks among agents and the dense flow of information among them increase successes in market information. In turn, the collective action created lowers transaction costs and provides a range of market transactions in output, labour, credit and land, leading to higher incomes (Paavola and Adger, 2005; Heikkila, Kalami and Ruuskanen, 2009). Moreover, social participation in group activities and being connected to social systems proved to be positively associated with early adoption of technologies (Birungi and Hassan, 2007; Katungi, Machethe and Smale, 2007). Evidence exists that communities with a good stock of such social capital are more likely to benefit by lower crime figures, better health, higher educational achievements and better economic growth (Halpern, 2009).
Inversely, social capital can impact negatively on economic and environmental outcomes by reinforcing existing inequalities, especially in depressed communities, and in groups having strong intolerance of outsiders, or working to exclude and subordinate others. An unjustifiable focus on a group’s needs is thereby created to the disadvantage of the wider society. Furthermore, some social norms can suppress individual expression and initiative, and the desirability and humanity of certain groups’ norms and sanctions may be questioned (Ray and Bijarnia, 2007; Halpern, 2009).
Lloyd James S.Baiyegunhi
50
2 CONCEPTUAL FRAMEWORK Despite the lack of consensus on the definition of social capital, a clear understanding of what social capital means is essential to make the concept useful for policy makers. A generally accepted idea is that social capital refers to networks, relationships and norms that shape the quality and quantity of society’s social interactions (Putman, 2000; Durlauf and Fafchamps, 2005; Imandoust, 2011). The effects of social capital differ according to its definition and choice of proxy. Therefore, this study follows a framework suggested by Imandoust (2011), who defined social capital based on social networks as its central component.
The central idea of the network approach framework is that “social networks are a valuable asset” – a stock, which generates a measurable return (stream of income) to the household. A great deal of social capital is built during interactions, which occur for social, cultural, or religious reasons. It enables people to build communities, to commit themselves to one another, and to knit the social fabric. It is argued that a sense of belonging and the concrete experience of social networks (including the relationships of trust and tolerance that can be involved) can benefit people (Field 2003; Yusuf, 2008). In other words, the assumption of network approach is that individuals’ involvement and participation in groups (i.e. having social ties and relation with others in society) can have positive socio-economic consequences, not only to the individual household but also to the community at large.
This leads to the argument put forward in this study that rural household poverty reduction requires measures to be taken at micro (i.e. individual, household or group) levels. In this regard, it is foreseen that the potential of encouraging the accumulation of social capital among poor rural households in South Africa is one of the possible strategies to reduce poverty. This argument, however, needs a quantitative assessment of the effects of social capital in enhancing household welfare and thereby reducing poverty. The study therefore tests the hypothesis that social capital has positive effects on poverty reduction, with particular focus on the rural poor.
3 RESEARCH METHODS
3.1 Description of study area, sampling procedure and data collectionThis study was conducted in Msinga, which is one of the four local municipalities constituting the Umzinyathi district municipality. Msinga has six traditional authority areas, namely Mchunu, Bomvu, Mabaso, Mthembu, Ngome and Qamu, with a total area of 2 500km2. According to the Msinga Municipality Integrated
51
Social capital effects on rural household poverty in Msinga, KwaZulu-Natal, South Africa
Development Plan (MMIDP, 2011), the estimated population of Msinga is 161 894 people with a total of 32 592 households. Only one-third (about 53 000) of its population is economically active. This inactivity results in the area’s high unemployment rate, which has led many citizens to become involved in subsistence and informal activities. Msinga’s municipality is mostly rural, with about 99% of its population living in traditional areas and farming contributing to 18% of their income. About 30% of the municipal area is made up of commercial farmland and 70% of the land is held in trust by the traditional authority, the Ingonyama Trust (MMIDP, 2011).
This study included households within the six community groups that participated in a University of KwaZulu-Natal community farming project in Msinga. The households within the groups were assumed to have different levels of social capital, thus allowing for an analysis of the extent of contribution of social capital in reducing poverty. Using a structured questionnaire, primary data was obtained from a cross section of rural household heads. The data focused on their demographic and socio-economic characteristics, consumption expenditures and participation in local level institutions. A multi-stage stratified random sample was used to select representative households for the study (Barnett, 1991). The first stage was a reconnaissance survey conducted to identify households in the six traditional authority areas. The second stage involved random sampling of 50 respondent households from each of the traditional authority areas in order to get a representative sample of the whole community.
3.2 Analytical technique
3.2.1 Determination of poverty lines The poverty line is the level of welfare that distinguishes poor households from non-poor households. This is a pre-determined and well-defined standard of income, or value of consumption (expenditure). The “lower bound” of the absolute poverty line proposed by Statistics South Africa, which was used for this study, provides for essential food and non-food consumption and amounts to R515 per capital per month in 2008 prices (Bhorat, Oosthuizen and Van der Westhuizen, 2012).
The choice of a consumption-based rather than an income-based measure of household welfare is motivated by the fact that income can be viewed as a measure of welfare opportunity or a measure of welfare potential, whereas consumption, on the other hand, can be interpreted as a realised welfare or a measure of welfare achievement (Meyer and Sullivan, 2003). Since realised rather than potential welfare is the concept of interest, consumption is arguably a more appropriate indicator. Moreover, in most cases, expenditure might be more accurately captured, particularly among the poor who have relatively constant and well-
Lloyd James S.Baiyegunhi
52
known expenditures on relatively few items, while their incomes can be erratic and unpredictable (Klasen, 2000; Garner, Ruiz-Castillo and Sastre, 2003; Meyer and Sullivan, 2003).
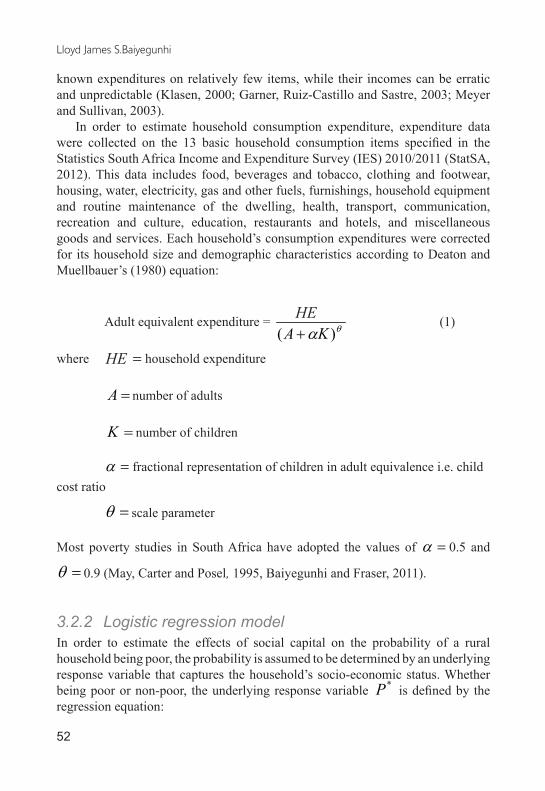
In order to estimate household consumption expenditure, expenditure data were collected on the 13 basic household consumption items specified in the Statistics South Africa Income and Expenditure Survey (IES) 2010/2011 (StatSA, 2012). This data includes food, beverages and tobacco, clothing and footwear, housing, water, electricity, gas and other fuels, furnishings, household equipment and routine maintenance of the dwelling, health, transport, communication, recreation and culture, education, restaurants and hotels, and miscellaneous goods and services. Each household’s consumption expenditures were corrected for its household size and demographic characteristics according to Deaton and Muellbauer’s (1980) equation:
Adult equivalent expenditure = θα )( KAHE+
(1)
where =HE household expenditure
=A number of adults
=K number of children
=α fractional representation of children in adult equivalence i.e. child cost ratio
=θ scale parameter
Most poverty studies in South Africa have adopted the values of =α 0.5 and
=θ 0.9 (May, Carter and Posel, 1995, Baiyegunhi and Fraser, 2011).
3.2.2 Logistic regression modelIn order to estimate the effects of social capital on the probability of a rural household being poor, the probability is assumed to be determined by an underlying response variable that captures the household’s socio-economic status. Whether being poor or non-poor, the underlying response variable *P is defined by the regression equation:
HE
HE
53
Social capital effects on rural household poverty in Msinga, KwaZulu-Natal, South Africa
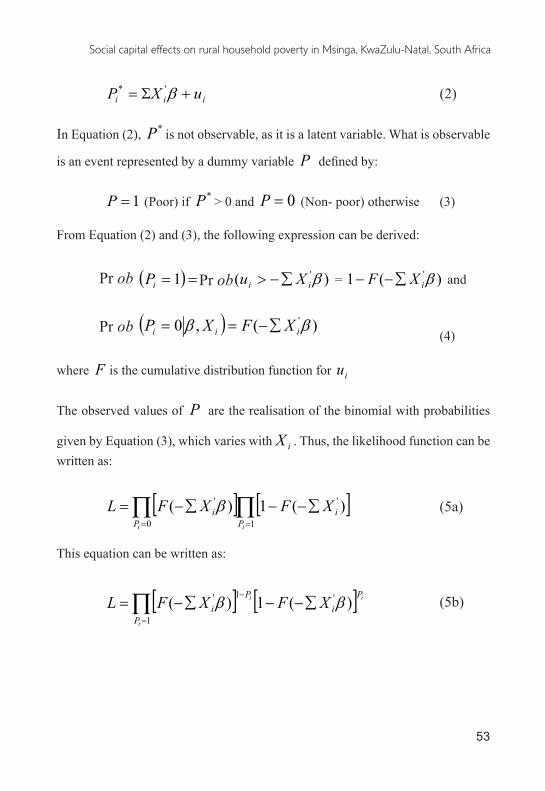
iii uXP +Σ= β'* (2)
In Equation (2), *P is not observable, as it is a latent variable. What is observable
is an event represented by a dummy variable P defined by:
1=P (Poor) if *P > 0 and 0=P (Non- poor) otherwise (3)
From Equation (2) and (3), the following expression can be derived:
( ) )(Pr1Pr 'βiii XuobPob ∑−>== = )(1 'βiXF ∑−− and
( ) )(,0Pr 'ββ iii XFXPob ∑−==
(4)
where F is the cumulative distribution function for iu
The observed values of P are the realisation of the binomial with probabilities
given by Equation (3), which varies with iX . Thus, the likelihood function can be written as:
[ ] [ ]∏ ∏= =
∑−−∑−=0 1
'' )(1)(i iP P
ii XFXFL β (5a)
This equation can be written as:
[ ] [ ]∏=
−∑−−∑−=
1
'1' )(1)(i
ii
P
Pi
Pi XFXFL ββ
(5b)
Pr ob Pr ob
Pr ob
Lloyd James S.Baiyegunhi
54
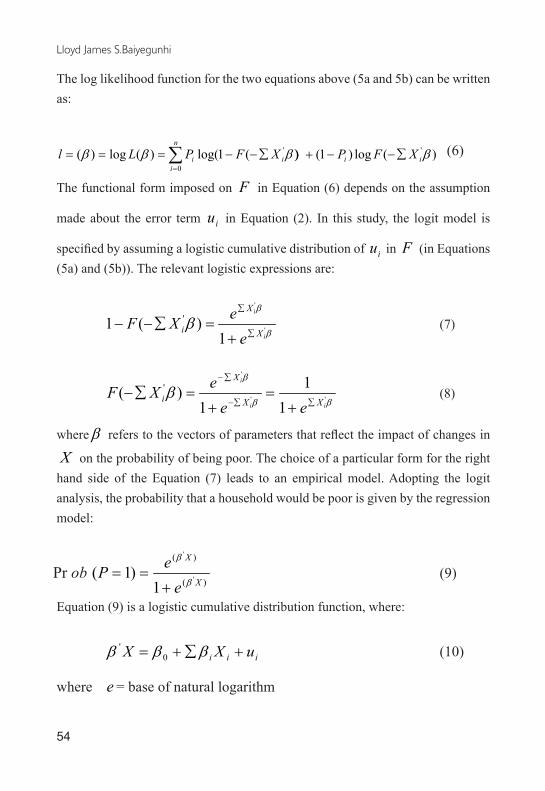
The log likelihood function for the two equations above (5a and 5b) can be written as:
∑=
∑−−+∑−−===n
iiiii XFPXFPLl
0
'' )(log)1())(1log()(log)( ββββ (6)
The functional form imposed on F in Equation (6) depends on the assumption
made about the error term iu in Equation (2). In this study, the logit model is
specified by assuming a logistic cumulative distribution of iu in F (in Equations (5a) and (5b)). The relevant logistic expressions are:
β
β
β '
'
1)(1 '
i
i
X
X
ie
eXF∑
∑
+=∑−− (7)
ββ
β
β ''
'
11
1)( '
ii
i
XX
X
iee
eXF∑∑−
∑−
+=
+=∑− (8)
where β refers to the vectors of parameters that reflect the impact of changes in
X on the probability of being poor. The choice of a particular form for the right hand side of the Equation (7) leads to an empirical model. Adopting the logit analysis, the probability that a household would be poor is given by the regression model:
)(
)(
'
'
1)1(Pr
X
X
eePob
β
β
+== (9)
Equation (9) is a logistic cumulative distribution function, where:
iii uXX +∑+= βββ 0' (10)
where e = base of natural logarithm
Pr ob
55
Social capital effects on rural household poverty in Msinga, KwaZulu-Natal, South Africa
0β = the constant term
iβ = the vector of coefficients
iX = the vectors of explanatory variables, and
iu = the error term
The estimation of Equation (10), using the maximum likelihood methods, helps to identify statistically significant explanatory variables.
3.2.3 VariabledefinitionsusedintheempiricalmodelLiterature has shown that rural household poverty is determined by a host of factors, such as group participation (social capita), human capital (education), physical capital and other household characteristics, which include age, marital status, household size, dependency ratio, remittance/grants/pension and gender (Roberts, 2001; Yusuf, 2008, Abdul-Hakim, Abdul-Rasaq and Ismail, 2010; Hassan and Birungi, 2011; Baiyegunhi and Fraser, 2011). The explanatory variables used in the empirical model include:
Social capital (SC) variable: This study follows Jones and Woolcock (2007) who viewed social capital as constituting six dimensions or components. These components include groups and networks, trust and solidarity, collective action and co-operation, information and communication, social cohesion and inclusion, and empowerment and political action. The related item used in capturing or measuring each component is described below:
Groups and networks (S1): This component was measured by determining member ship of formal or informal associations or organisations, and the ability to get support from resources other than family members and relatives in times of difficulty and hardship in the community.
Trust and solidarity (S2): This component was measured by determining whether most people in the community can be trusted, and whether they always help one another in times of need and hardship.
Collective action and co-operation (S3): This component was measured by determin ing whether the majority (more than half) of the community members contribute time or money towards common development goals, and the likelihood that community members cooperate to solve common problems.
Information and communication (S4): This component was measured by
Lloyd James S.Baiyegunhi
56
determining the frequency at which households in the community listen to radio, watch television, or read newspapers.
Social cohesion and inclusion (S5): This component was measured by determining whether households have a strong feeling of cohesion within the community, and whether they feel safe from crime and violence when alone at home.
Empowerment and political action (S6): This component was measured by determin ing whether community members have control over making decisions that affect everyday activities and whether they voted in the last general election in 2009.
Aggregate social capital index (SCA): All items representing each domain above are dichotomous response variables, which simply requires a “Yes” or “No” answer (1 if Yes; 0 if otherwise). In order to derive an aggregate social capital index for each household, the percentage of Yes answers was calculated, and the result transformed into a scale of 1 to 10 by applying the following linear transformation:
( ) XXhS A *10/91)( +== (11)
where SA is the aggregate social capital index and X is the raw score (percentage of Yes answers).
Human capital (HC) variable: The human capital variable of each household was measured by determining the average years of formal education of all the members.
Physical capital (PC) variable: The variable measuring household assets were not included in the model because of the problem of endogeneity, as most households reportedly sold assets to pay for consumption expenditure. Instead, a dummy variable was used to indicate whether the household head was a farmer. This is seen as an occupational variable as well as a proxy for ownership of agricultural assets, that is, physical capital.
Household characteristics (Xi): Household characteristics which were considered are:• the age of the household head in years;• the marital status of the household head (D = 1 if married, 0 if otherwise);• the gender of the household head (D = l if Male, 0 if otherwise);• the household size (number);• the dependency ratio (ratio of non-workers to workers in each household);• the household remittances/grants/pension; and• the primary occupation of the household head (D = l if farming, 0 if otherwise).Since all sampled households reside in the same rural area, Msinga, a regional
10
57
Social capital effects on rural household poverty in Msinga, KwaZulu-Natal, South Africa
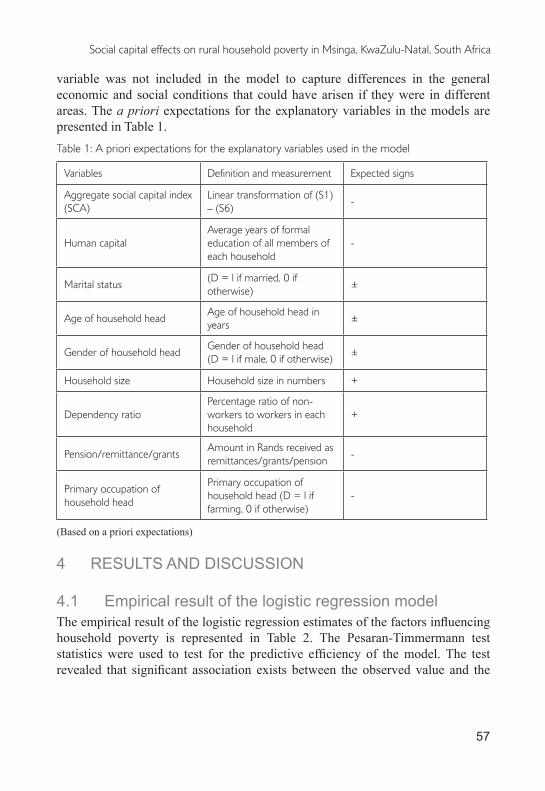
variable was not included in the model to capture differences in the general economic and social conditions that could have arisen if they were in different areas. The a priori expectations for the explanatory variables in the models are presented in Table 1.Table 1: A priori expectations for the explanatory variables used in the model
Variables Definition and measurement Expected signs
Aggregate social capital index (SCA)
Linear transformation of (S1) – (S6)
-
Human capitalAverage years of formal education of all members of each household
-
Marital status(D = l if married, 0 if otherwise)
±
Age of household headAge of household head in years
±
Gender of household headGender of household head (D = l if male, 0 if otherwise)
±
Household size Household size in numbers +
Dependency ratioPercentage ratio of non-workers to workers in each household
+
Pension/remittance/grantsAmount in Rands received as remittances/grants/pension
-
Primary occupation of household head
Primary occupation of household head (D = l if farming, 0 if otherwise)
-
(Based on a priori expectations)
4 RESULTS AND DISCUSSION
4.1 Empirical result of the logistic regression modelThe empirical result of the logistic regression estimates of the factors influencing household poverty is represented in Table 2. The Pesaran-Timmermann test statistics were used to test for the predictive efficiency of the model. The test revealed that significant association exists between the observed value and the
Lloyd James S.Baiyegunhi
58
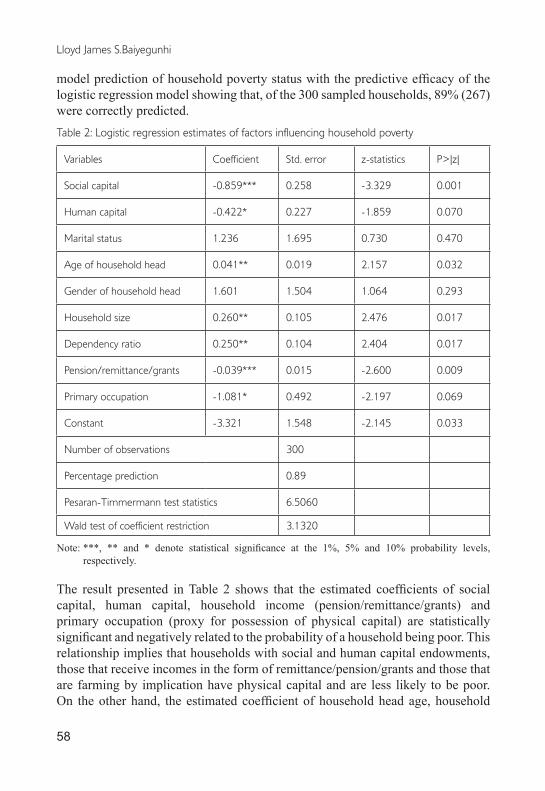
model prediction of household poverty status with the predictive efficacy of the logistic regression model showing that, of the 300 sampled households, 89% (267) were correctly predicted. Table 2: Logistic regression estimates of factors influencing household poverty
Variables Coefficient Std. error z-statistics P>|z|
Social capital -0.859*** 0.258 -3.329 0.001
Human capital -0.422* 0.227 -1.859 0.070
Marital status 1.236 1.695 0.730 0.470
Age of household head 0.041** 0.019 2.157 0.032
Gender of household head 1.601 1.504 1.064 0.293
Household size 0.260** 0.105 2.476 0.017
Dependency ratio 0.250** 0.104 2.404 0.017
Pension/remittance/grants -0.039*** 0.015 -2.600 0.009
Primary occupation -1.081* 0.492 -2.197 0.069
Constant -3.321 1.548 -2.145 0.033
Number of observations 300
Percentage prediction 0.89
Pesaran-Timmermann test statistics 6.5060
Wald test of coefficient restriction 3.1320
Note: ***, ** and * denote statistical significance at the 1%, 5% and 10% probability levels, respectively.
The result presented in Table 2 shows that the estimated coefficients of social capital, human capital, household income (pension/remittance/grants) and primary occupation (proxy for possession of physical capital) are statistically significant and negatively related to the probability of a household being poor. This relationship implies that households with social and human capital endowments, those that receive incomes in the form of remittance/pension/grants and those that are farming by implication have physical capital and are less likely to be poor. On the other hand, the estimated coefficient of household head age, household
59
Social capital effects on rural household poverty in Msinga, KwaZulu-Natal, South Africa
size and dependency ratio are statistically significant and positively related to the probability of a household being poor. This relationship implies that households with older household heads, and a large household size and dependency ratio are more likely to be poor.
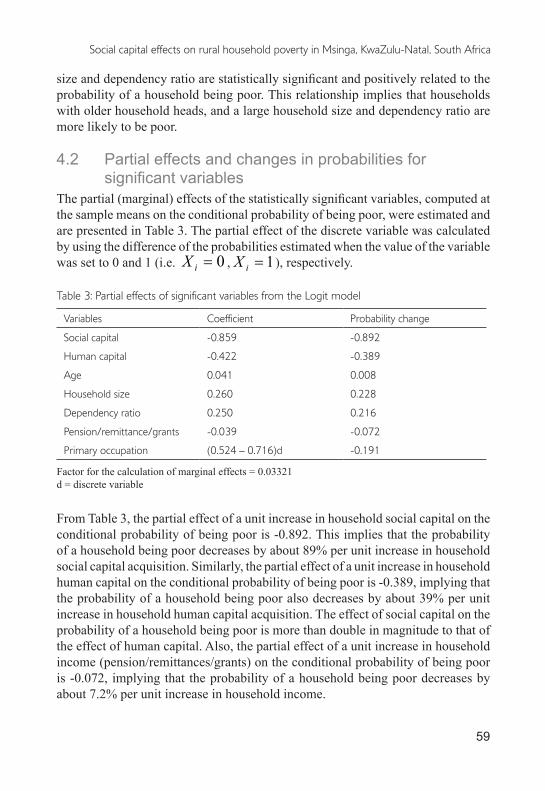
4.2 Partial effects and changes in probabilities for significant variablesThe partial (marginal) effects of the statistically significant variables, computed at the sample means on the conditional probability of being poor, were estimated and are presented in Table 3. The partial effect of the discrete variable was calculated by using the difference of the probabilities estimated when the value of the variable was set to 0 and 1 (i.e. 0=iX , 1=iX ), respectively.
Table 3: Partial effects of significant variables from the Logit model
Variables Coefficient Probability change
Social capital -0.859 -0.892
Human capital -0.422 -0.389
Age 0.041 0.008
Household size 0.260 0.228
Dependency ratio 0.250 0.216
Pension/remittance/grants -0.039 -0.072
Primary occupation (0.524 – 0.716)d -0.191
Factor for the calculation of marginal effects = 0.03321d = discrete variable
From Table 3, the partial effect of a unit increase in household social capital on the conditional probability of being poor is -0.892. This implies that the probability of a household being poor decreases by about 89% per unit increase in household social capital acquisition. Similarly, the partial effect of a unit increase in household human capital on the conditional probability of being poor is -0.389, implying that the probability of a household being poor also decreases by about 39% per unit increase in household human capital acquisition. The effect of social capital on the probability of a household being poor is more than double in magnitude to that of the effect of human capital. Also, the partial effect of a unit increase in household income (pension/remittances/grants) on the conditional probability of being poor is -0.072, implying that the probability of a household being poor decreases by about 7.2% per unit increase in household income.
Lloyd James S.Baiyegunhi
60
The partial impact of household occupation (proxy for physical asset) was estimated. The result indicates that, all things being equal, a shift from non-farming to farming defined by change from ( 0=iX , to 1=iX ) is -0.191, implying that the probability of a household being poor decreases by about 19%. However, the partial effect of a unit increase in household head age, household size and dependency ratio on the conditional probability of being poor is 0.008, 0.228, and 0.216, respectively. This implies that the probability of a household being poor increases by about 1% per unit increase in household head age, 23% per unit increase in household size and 22% per unit increase in dependency ratio.
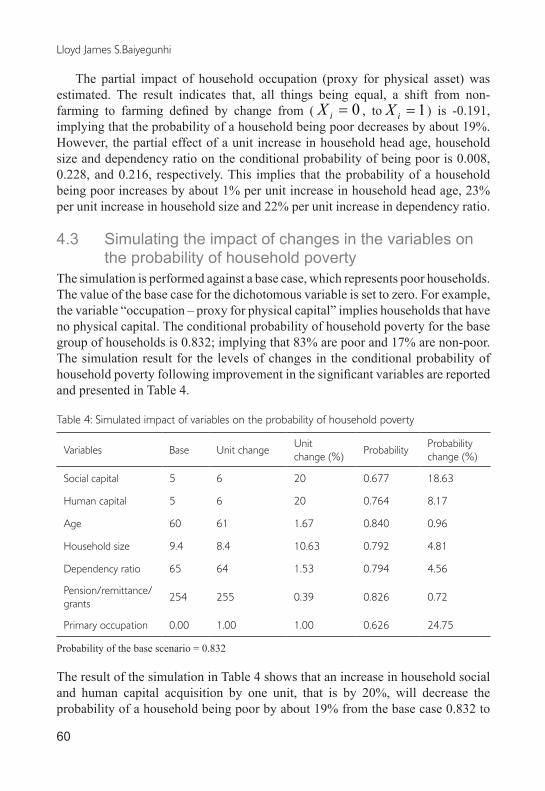
4.3 Simulating the impact of changes in the variables on the probability of household povertyThe simulation is performed against a base case, which represents poor households. The value of the base case for the dichotomous variable is set to zero. For example, the variable “occupation – proxy for physical capital” implies households that have no physical capital. The conditional probability of household poverty for the base group of households is 0.832; implying that 83% are poor and 17% are non-poor. The simulation result for the levels of changes in the conditional probability of household poverty following improvement in the significant variables are reported and presented in Table 4.
Table 4: Simulated impact of variables on the probability of household poverty
Variables Base Unit changeUnit change (%)
ProbabilityProbability change (%)
Social capital 5 6 20 0.677 18.63
Human capital 5 6 20 0.764 8.17
Age 60 61 1.67 0.840 0.96
Household size 9.4 8.4 10.63 0.792 4.81
Dependency ratio 65 64 1.53 0.794 4.56
Pension/remittance/grants
254 255 0.39 0.826 0.72
Primary occupation 0.00 1.00 1.00 0.626 24.75
Probability of the base scenario = 0.832
The result of the simulation in Table 4 shows that an increase in household social and human capital acquisition by one unit, that is by 20%, will decrease the probability of a household being poor by about 19% from the base case 0.832 to
61
Social capital effects on rural household poverty in Msinga, KwaZulu-Natal, South Africa
0.677, and by about 8% from the base case 0.832 to 0.764 for social and human capital, respectively. Similarly, one rand increase in household income (in the form of pension/remittance/grants) – by 0.39% from the base case 0.832 to 0.826 – will decrease the probability of a household being poor by about 1%. Moreover, a shift from non-farming to farming as a primary occupation will decrease the probability of a household being poor by about 25% from the base case 0.832 to 0.626. This is not surprising, because most farming households in the study area belong to co-operative farming associations/groups, which boost their social capital status. However, the simulation results show that a year increase in household head age (from 60 to 61) will increase the probability of a household being poor by about 1% from the base case 0.832 to 0.840; a unit decrease in household size (from 9.4 to 8.4) will decrease the probability of a household being poor by 5% from the base case 0.832 to 0.792; and a unit decrease in dependency ratio (from 65 to 64) will decrease the probability of a household being poor by 5% from the base case 0.832 to 0.794.
5 CONCLUSION AND POLICY IMPLICATIONSThe study has demonstrated that social capital acquisition, among other factors, is an important determinant of household poverty and is crucial for improved welfare and poverty reduction for rural households. While the impact of social capital on household poverty compares well with human capital (education), the result of the sensitivity analysis (simulation) shows that an increase in household social capital and a shift to farming as a major occupation have high probabilities of reducing household poverty from the current level.
This finding suggests that it is important for the government to have knowledge of existing social groups and networks, and that it should be given more attention in addressing the issue of poverty, as it will improve the effectiveness of the present strategies aimed at poverty reduction. Furthermore, policy makers and private sectors could channel poverty reduction programmes appropriately with a better understanding of the nature and objectives of the existing social groups/networks in rural areas and use them for project designs and delivery, especially in extension and microcredit services. This has the potential to enhance interaction between policy makers, private sectors, non-governmental organisations and social institutions by improving beneficiary targeting, projection cost reduction, sustainability enhancement and social organisation strengthening.
Human capital (education) is a crucial factor in improving a household’s income and it has been proven to have a positive influence on the probability of joining social groups. This implies that government and private sector intervention in the provision of quality education is essential for the improved welfare of rural households. Also, farming as main occupation of rural dwellers needs to
Lloyd James S.Baiyegunhi
62
be developed and modernised. This development can be done by modifying the rules determining access to land and the way it is distributed among members of the community; through the provision of financial support, supply and delivery of equipment (tractors, improved seeds, fertilisers); through the development of infrastructures (silos, telephones, good roads); by encouraging the formation of farmers’ groups; and through the provision of an enabling environment for their performance, informed by a legal framework.
ACKNOWLEDGEMENTSThe researcher gratefully acknowledges the University of KwaZulu-Natal Research Office for funding this study through its Competitive Research Grant. I also thank the UKZN Farmer Support Group for facilitating the study in Msinga, and all the households that participated in this study.
REFERENCESAbdul-Hakim, R., Abdul-Rasaq, N. A. & Ismail, R. 2010. Does social capital reduce poverty?
A case study of households in Terengganu, Malaysia. European Journal of Social Sciences 14(4):556–566.
Alesina, A. and La Ferrara, E. 2002. Who trust others? Journal of Public Economics 85(2):207–234.
Armstrong, P., Lekezwa, B. and Siebrits, K. 2008. Poverty in South Africa: A profile based on recent household survey. Stellenbosch Economic Working Paper, No. 04/08.
Baiyegunhi, L.J.S. and Fraser, G.C.G. 2011. Vulnerability and poverty dynamics in rural areas of Eastern Cape Province, South Africa. Ghana Journal of Development Studies 8(2):84–100.
Barnett, V. 1991. Sample survey: principles and methods. London: Edward Arnold. Bhorat, H., Oosthuizen, M. and Van der Westhuizen, C. 2012. Estimating a poverty line: An
application to free basic municipal service in South Africa. Development Southern Africa 29(1):77–96.
Birungi, P. and Hassan, R. 2007. Impact of alternative land management options on soil fertility and erosion in Uganda. Agrekon 46(3):410–424.
Carter, M.R. and Castillo, M. 2005. Morals, markets, and mutual insurance using economic experiments to study recovery from Hurricane Mitch. In C.B. Barrett (ed.), The social economics of poverty, 268-287. London & New York: Routledge.
Chamlee-Wright, E. 2008. The structure of social capital: An Austrian perspective on its nature and development. Review of Political Economy 20:41–58.
Coleman, J.S. 1988. Social capital in the creations of human capital. American Journal of Sociology 94:95–121.
Conley, T. and Udry, C. 2010. Learning about a new technology: Pineapple in Ghana. American Economic Review 100(1):35–69.
Deaton, A. and Muellbauer, J. 1980. Economics and consumer behaviour. New York: Cambridge University Press.
63
Social capital effects on rural household poverty in Msinga, KwaZulu-Natal, South Africa
Duclos, J.Y. and Verdier-Chouchane, A. 2011. Analysing pro-poor growth in Southern Africa: Lessons from Mauritius and South Africa. African Development Review 23(3):121–146.
Durlauf, S.N. and Fafchamps, M. 2005. Social capital. In P. Aghion and S.N. Durlauf (eds.), Handbook of economic growth (Volume IB, 1639–1699). Amsterdam: Elsevier.
Fafchamps, M. and Gubert, F. 2007. The formation of risk sharing networks. Journal of Development Economics 83(2):326–350.
Field, J. 2003. Social capital. London: Routledge.Garner, T.I., Ruiz-Castillo, J. and Sastre, M. 2003. The influence of demographics and household-
specific price indexes on consumption-based inequality and welfare: A comparison of Spain and the United States. Southern Economic Journal 70(1):22–48.
Halpern, D. 2009. The hidden wealth of nations. Cambridge: Polity.Hassan, R. and Birungi, P. 2011. Social capital and poverty in Uganda. Development Southern
Africa 28(10):19–37.Hayami, Y. 2009. Social capital, human capital and the community mechanism: Toward a
conceptual framework for economists. Journal of Development Studies 45(1):96–123.Heikkila, H., Kalami, P. and Ruuskanen, O. 2009. Social capital and access to credit: Evidence
from Uganda. Department of Economics, Helsinki School of Economics.Imandoust, S.B. 2011. Relationship between education and social capital. International Journal
of Humanities and Social Science 1(12):52–57.Ishise, H. and Sawada, Y. 2009. Aggregate returns to social capital: Estimates based on the
augmented Solow model. Journal of Macroeconomics 31(3):376–393.Jones, V.N. & Woolcock, M. 2007. Using mixed methods to assess social capital in Low Income
Countries: a practical guide. Brooks World Poverty Institute (BWPI) working paper 12. University of Manchester.
Karlan, D. 2007. Social connections and group banking. The Economic Journal 117(517):F52–F84.
Karlan, D., Mobius, M., Rosenblat, T. and Szeidl, A. 2009. Trust and social collateral. The Quarterly Journal of Economics 124(3):1307–1361.
Katungi, E., Machethe, C. and Smale, M. 2007. Determinants of social capital in rural Uganda: Implications for group-based agricultural extension approaches. African Journal of Agricultural and Resource Economics 1(2):166–190.
Klasen, S. 2000. Measuring poverty and deprivation in South Africa. Review of Income and Wealth 46(1):33–58.
May, J., Carter, M. and Posel, D. 1995. The composition and persistence of poverty in rural South Africa: an entitlement approach (Policy Paper 15). Johannesburg: Land and Agriculture Policy Centre.
Meyer, B.D. and Sullivan, J.X. 2003. Measuring the well-being of the poor using income and consumption. Journal of Human Resources, 38(4):1180–1220.
Miguel, E. and Kremer, M. 2007. The illusion of sustainability. Quarterly Journal of Economics 122:1007–1065.
Msinga Municipality Integrated Development Plan 2011. Available at: http://devplan.kzntl.gov.za/idp_reviewed_2011_12/IDPS/KZ244/Adopted/Msinga%20%20IDP%202011.12%20.pdf (accessed on 25 May 2012).
Lloyd James S.Baiyegunhi
64
Munshi, K. and Myaux, J. 2006. Social norms and the fertility transition. Journal of Development Economics 80(1):1–38.
Okten, C. & Osilis, U.O. 2004. Social networks and credit access in Indonesia. World Development 32(7):1225–1246.
Paal, B. and Wiseman, T. 2011. Group insurance and lending with endogenous social collateral. Journal of Development Economics 94(1):30–40.
Paavola, J. and Adger, N. 2005. Institutional ecological economics. Ecological Economics 53(3):353–368.
Putnam, R.D. 2000. Bowling alone: The collapse and revival of American community. New York: Touchstone.
Ray, S. and Bijarnia, M. 2007. Power relations and institutional outcomes: a case of pastureland development in semi-arid Rajasthan. Ecological Economics 62(2):360–372.
Robert, B.J. 2001. Chronic and transitory poverty in post-apartheid South Africa: Evidence from KwaZulu-Natal. Journal of Poverty 5(4):1–28.
Sanchez, D. 2011. The economic empowerment of African descendants: lessons from South Africa’s Black Economic Empowerment Strategy. A paper presented at the Conference on Equity, Justice, Development: People of African descent in Latin America in comparative perspective. Sephis Universidad de Cartagena, Cartagena. March 2011.
StatsSA. 2012. Income and expenditure of households, 2010/2011. Pretoria: Statistics South Africa.
World Bank, 2013. World development indicators: distribution of income and consumption. Washington, D.C.: World Bank. Available at: http://wdi.worldbank.org/table /2.9 (accessed 8 January 2014).
Yamamura, E. 2009. Impact of formal and informal deterrents on crime. Journal of Socio-Economics 38(4):611–621.
Yamamura, E. 2010. Effects of interactions among social capital, income and learning from experiences of natural disasters: a case study from Japan. Regional Studies 44(8):1019–1032.
Yusuf, S.A. 2008. Social capital and household welfare in Kwara State, Nigeria. Journal of Human Ecology 23(3):219–229.