Embed Size (px)
Citation preview
MSU-Land Resource and Environmental Studies 2016 Story Mill Final Report
1
MSU-Land Resource and Environmental Studies 2016
Story Mill Final Report
Prof: William Kleindl
The Fall 2016 Land Resources and Environmental Services (LRES) Capstone Class focused on
ecosystem services provided by the wetlands and riparian areas within the City of Bozeman.
Bozeman Creek and the East Gallatin River within the City limits are listed as polluted for total
nitrogen and sediment under the TMDL criteria established by the State of Montana. The City of
Bozeman and Trust for Public Land enhanced a wetland and several riparian areas within the
future site of the Story Mill Community Park with the intent to reduce some of these pollutants.
Early in the semester, the class met with Maddy Pope from Trust for Public Lands, Kyle
Mehrens and Myanna Rice from the City of Bozeman, Steve Carpenedo from Montana
Department of Environmental Quality, Rich McEldowney from Confluence Consulting, and
Lynn Bacon from Tarraquatic Consulting to hear what questions and concerns that these
agencies and consultants have regarding the wetlands and riparian areas within he Story Mill and
other means to leverage the City’s ecological infrastructure to reduce the pollutants within City’s
streams. These questions help guide the students to define and determine the extent of the
ecological services that the Story Mill restoration and future community park will provide to the
City of Bozeman to reduce listed pollutants from our area’s streams. They also assessed other
options to reduce the source of these pollutants. The Class prepared five separate group projects
to address these questions. The following are the final reports of the student groups and will
provide:
Social and environmental interface at Story Mill,
Water quality and Story Mill wetland,
Story Mill’s restoration: evaluating success,
The assignment of riparian buffer zone pollution attenuation in the Gallatin Valley,
Application of green infrastructure in Bozeman: A GIS suitability model approach, and
A copy of the class’ final presentation
MSU-Land Resource and Environmental Studies 2016 Story Mill Final Report
2
Social and Environmental Interface at Story Mill
Jessica Chrisp, Hannah Johnson, Willy Carter
Introduction
The Story Mill area, in the northeast corner of Bozeman, has an interesting past, present
and ostensibly, future. It has been altered greatly from its natural state through homesteading,
agriculture, and industry. As Bozeman expanded, the Story Mill area has remained largely
undeveloped. Recently the Trust for Public Land purchased the site to develop a regional park,
and along with this development was the restoration of a floodplain and wetland habitats. The
restoration of this site was important not only for the restoration of a wetland environment, but
also as an example of the importance of wetlands to our community. However, the Story Mill
park and wetland enhancement project balances some strikingly diverse and occasionally
conflicting goals. The wetlands are promised to improve water quality (Story Mill Fact Sheet
2015) and provide valuable habitat for wildlife, but human visitors might disturb wildlife, cause
erosion, and trample vegetation. Further housing development in the area could limit wildlife
migration to and from the park by cutting off
corridors that connect the wetlands to the Story
Mill hills and the Bridger mountain range.
While the Story Mill wetlands can be used as a
demonstrative natural area to make visitors care
about wetlands which are not normally
accessible, it is not the intent of the future park
to sacrifice the function and habitat of the
wetlands to this cause. Using careful planning,
we can honor our cultural values to minimize
impacts to the wetland and its wildlife while
still providing a recreation area where citizens
can relax, gather, and learn about wetlands.
This paper will illuminate some of those
planning needs in the context of our
community.
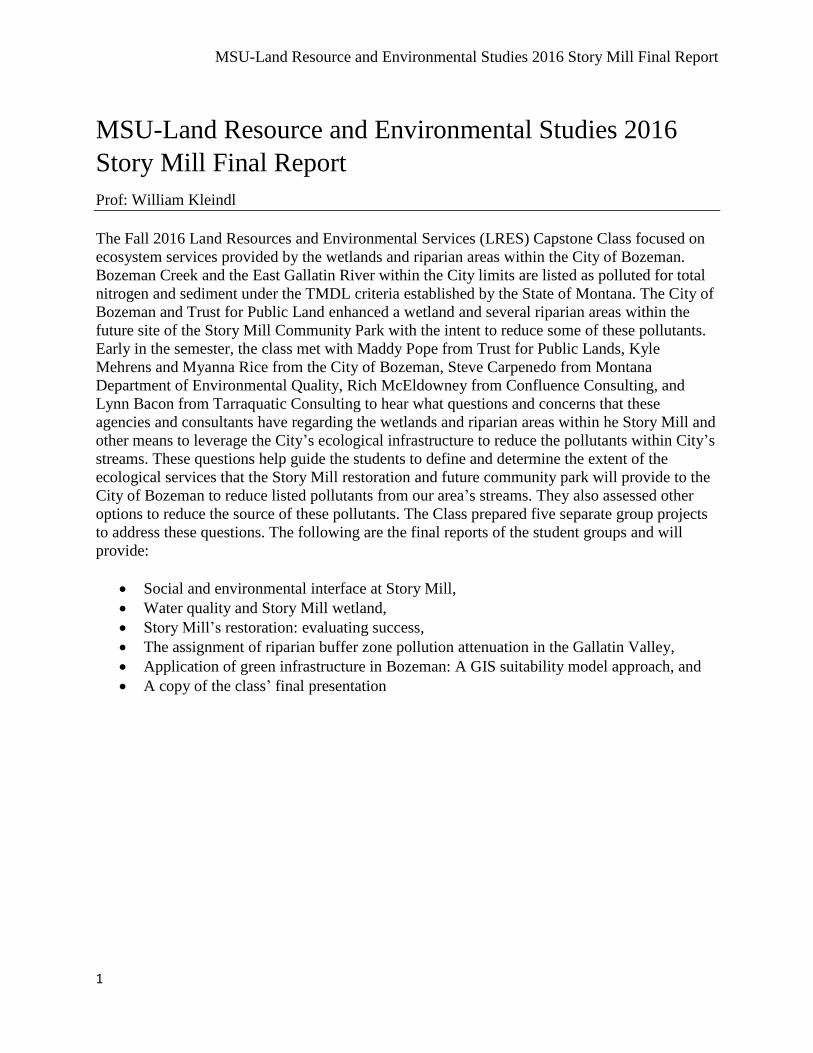
The shape of the Story Mill Community
Park, as seen in the Conceptual Park Plan
(Figure 1), portrays a simple reality: a rigidly
outlined patch of undeveloped land surrounded
by urban infrastructure. A glance at the map of
the Story Mill Community Park plan shows
hard lines surrounding the open fields and
Figure 1: The Conceptual Park Plan visual from
the Trust for Public Land
(Trust for Public Land, 2015)
MSU-Land Resource and Environmental Studies 2016 Story Mill Final Report
3
rehabilitated wetlands. However, nature doesn’t work in straight lines, nor does it recognize
borders. Its ambiguous characteristics, mixed with the structure of the community around it,
influence the complexity of the parks goals, both social and ecological. In order to understand
these goals, it is crucial to understand the constraints placed on the area through historical land
use decisions.
Site History
At the end of the last ice age large alluvial fans of glacial outwash formed in the Gallatin
Valley. Over the next few thousand years, a fertile soil profile developed over this foundation via
sedimentary and aeolian deposits creating a thick loam over coarse sand and gravel (USDA,
2016). Topographical indentations combined with soil characteristics and contact with a low
water table produced an area of sustained saturation for enough of the year to promote a
hydrophilic vegetation community. With the help of the annual spring surface water input from
streams and precipitation, a stable wetland habitat was formed. This hydrology was later altered
by settlers.
Meriwether Lewis was the first known white man to see the valley in 1805, and thanks to
his lavish descriptions of the area, settlement soon followed (Strahn, 1996). With the coming of
the railroad to the valley, Nelson Story began a flour mill operation. A two-mile-long canal was
excavated to divert water from Bozeman Creek, Rocky Creek, and Bridger Creek. Thanks to
Nelson Story, Bozeman became a prosperous community, at great ecological cost to the wetland
area.
Throughout Bozeman’s post-settlement history, water has been at the core of most issues,
and tracing its usage through time can help us understand the current state of the Story Mill
wetland. In most cases, new water rights claims served to deplete the many wetlands of surface
water, but the irrigation canal that ran along the base of Story Hills may have fed the Story Mill
wetlands by increasing groundwater discharge to the wetland area. To better understand this
concept of water use through Bozeman’s history, it’s important to look to the history of the law
that dictates water use in the West. The Prior Appropriation Doctrine came about in the latter
half of the 19th century and quickly became the norm for most of the Western U.S. It basically
states on a “first in time, first in right” basis that whoever got there first has rights to as much
water as they want, whenever they want it. There are hundreds of water rights upstream of the
Story Mill area, meaning hundreds of different sources of potential pollution feeding into the
wetland habitat, including the City of Bozeman itself, and its stormwater system that drains right
into Bozeman Creek. This also meant hundreds of different sources of depletion of the water that
the wetland depends on (Carter, 2016).
As ecological awareness grew, further aspects of regulation were added to the Prior
Appropriation Doctrine that are applicable to assessing the health of the water that flows in and
around the restoration site (Carter, 2016). The Endangered Species Act, a federal mandate placed
in 1973, ensures the conservation of the habitat for listed species. Public Recreation Claims
could potentially be obtained for the Story Mill Community Park to prevent upstream water
rights holders from taking so much water out that, even on high water years, there is not enough
MSU-Land Resource and Environmental Studies 2016 Story Mill Final Report
4
flow to fill the backwater slough. The problem with all this is that the basic foundation of “first
in time, first in right” inherent in the Prior Appropriation Doctrine still takes priority in the eyes
of the law. This leaves the Story Mill wetland site at permanent risk (Carter, 2016).
Aside from the use of water upstream, there have been issues in other realms outside of
water law with serious detrimental potential to the health of the wetland site. For example, in
1945 the Idaho Pole Co. began operation just north of the site, and was later targeted by the EPA
as a superfund site (EPA, 2016). The plant treated wood poles with a variety of highly toxic
chemicals, including pentachlorophenol, which contaminated the soil and groundwater for years.
The Clean Water Act was passed by the Federal Government in 1972, and the property was
declared a superfund site in 1986, but the wood treatment at the plant continued until 1997.
According to the EPA, the efforts during operation to contain contamination of the groundwater,
such as an “interceptor trench”, were deemed ineffective and the harmful chemicals were
continually recorded as moving through the groundwater away from the site, and on to the
neighboring land (EPA, 2016).
Changing Approaches to Land Use
At some point in the 20th century a shift began to occur in a portion of the population’s
mentality towards nature, which unfolded into the environmental movement. Aldo Leopold’s
book “Sand County Almanac”, and Rachel Carson’s “Silent Spring” were some of the iconic
influences defining the growing ideal that we needed to stop neglecting the health of the planet.
In the incessantly developing West, few better places exist for this mentality than Bozeman, and
the Story Mill Community Park project is a direct result of this ethic. Bozeman is small enough,
and surrounded by enough natural beauty, that the benefits of incorporating nature back into
society can be directly observed. Story Mill Community Park is an example of how these ideals
manifest.
Integrating Parks with Wildlife
To begin it is important to stress that maintaining habitats is far less expensive than trying
to recreate them later. In many cases, recreated habitat is expensive and either is not as
productive as the original habitat, or fails completely in its attempt to provide for the needs of the
wildlife in question (Opdam et al. 2011). A multitude of species are already taking advantage of
the Story Mill Wetlands and have begun to establish a foothold in this new environment.
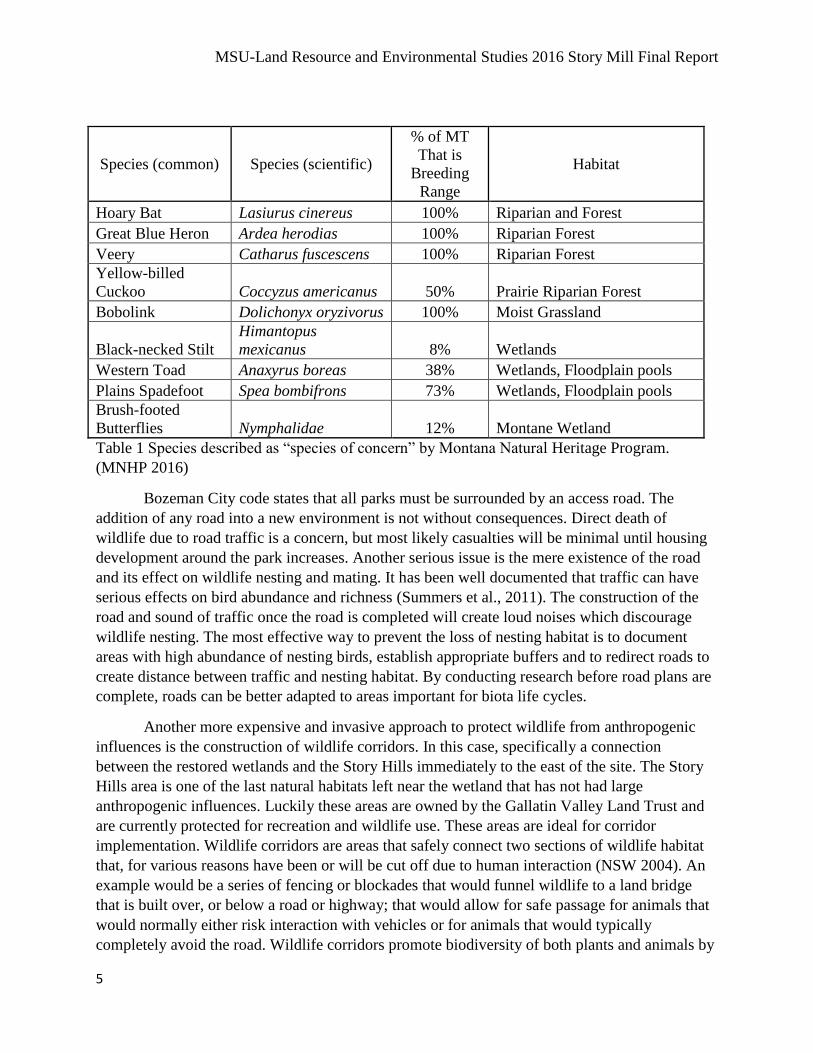
Even though only a small percentage of Montana is considered to be ‘wetland habitat’
there are a variety of organisms that benefit from, or require this type of habitat. The
rehabilitation of this wetland to Gallatin County is very beneficial to promote biodiversity for
wetland organisms. In Gallatin County there are a variety of wildlife that either require wetlands
or can take advantage of a wetland environment, some of which are at risk of losing their habitat.
In Table 1 the fauna that are considered “species of concern” by the Montana Natural Heritage
Program are listed. The creation of Story Mill wetlands is extremely important for these sensitive
animals and other more common wetland species.
MSU-Land Resource and Environmental Studies 2016 Story Mill Final Report
5
Species (common) Species (scientific)
% of MT
That is
Breeding
Range
Habitat
Hoary Bat Lasiurus cinereus 100% Riparian and Forest
Great Blue Heron Ardea herodias 100% Riparian Forest
Veery Catharus fuscescens 100% Riparian Forest
Yellow-billed
Cuckoo Coccyzus americanus 50% Prairie Riparian Forest
Bobolink Dolichonyx oryzivorus 100% Moist Grassland
Black-necked Stilt
Himantopus
mexicanus 8% Wetlands
Western Toad Anaxyrus boreas 38% Wetlands, Floodplain pools
Plains Spadefoot Spea bombifrons 73% Wetlands, Floodplain pools
Brush-footed
Butterflies Nymphalidae 12% Montane Wetland
Table 1 Species described as “species of concern” by Montana Natural Heritage Program.
(MNHP 2016)
Bozeman City code states that all parks must be surrounded by an access road. The
addition of any road into a new environment is not without consequences. Direct death of
wildlife due to road traffic is a concern, but most likely casualties will be minimal until housing
development around the park increases. Another serious issue is the mere existence of the road
and its effect on wildlife nesting and mating. It has been well documented that traffic can have
serious effects on bird abundance and richness (Summers et al., 2011). The construction of the
road and sound of traffic once the road is completed will create loud noises which discourage
wildlife nesting. The most effective way to prevent the loss of nesting habitat is to document
areas with high abundance of nesting birds, establish appropriate buffers and to redirect roads to
create distance between traffic and nesting habitat. By conducting research before road plans are
complete, roads can be better adapted to areas important for biota life cycles.
Another more expensive and invasive approach to protect wildlife from anthropogenic
influences is the construction of wildlife corridors. In this case, specifically a connection
between the restored wetlands and the Story Hills immediately to the east of the site. The Story
Hills area is one of the last natural habitats left near the wetland that has not had large
anthropogenic influences. Luckily these areas are owned by the Gallatin Valley Land Trust and
are currently protected for recreation and wildlife use. These areas are ideal for corridor
implementation. Wildlife corridors are areas that safely connect two sections of wildlife habitat
that, for various reasons have been or will be cut off due to human interaction (NSW 2004). An
example would be a series of fencing or blockades that would funnel wildlife to a land bridge
that is built over, or below a road or highway; that would allow for safe passage for animals that
would normally either risk interaction with vehicles or for animals that would typically
completely avoid the road. Wildlife corridors promote biodiversity of both plants and animals by
MSU-Land Resource and Environmental Studies 2016 Story Mill Final Report
6
providing a connection between fragmented habitats that without intervention could become
isolated. In many cases, isolated populations become stressed due to disease and lack of genetic
diversity (NSW 2004). In the worst case scenarios local extinction occurs. Wetland habitats
provide habitat refuge as upland habitat losses have occurred in the United States (Deneen 1998).
Use of these wildlife corridors should be encouraged and Story Mill wetland is a good candidate
for implementation.
Some studies have shown that wildlife corridors and land bridges can have negative
impacts, the most troublesome being that it can become a prey trap. As predators learn the habits
of other animals, it becomes easy to predict when and where their prey will make use of the
habitat connection (Little et al. 2002). The best ways to combat this issue include; providing
multiple areas for wildlife to cross traffic, and to make the corridors as large as possible. Some of
these wildlife would include deer, small rodents and birds. These innovations make it more
difficult for predators to corner prey and provide more cover for wildlife that requires
concealment as a main mode of defense.
Vegetation is a very important part of any habitat, including wetlands. Oftentimes
vegetation is not interpreted as wildlife in the eyes of the public, and the need to protect these
non-mobile organisms can be overlooked. Plants are often damaged unintentionally, by people
straying off designated paths, but the most detrimental cause is the introduction of non-native
species to a new area. Something as simple as wearing the same boots to different places can
have strong negative impacts on native plants and native plant diversity (van Kleunen et al.,
2015). With the addition of traffic, the chances of seed dispersal increase significantly. As
vehicles travel through any area they can accumulate seeds that attach to tires, mud and other
parts of the automobile. The vehicles then become vectors moving seeds and pollen long
distances to detach in new areas (Zwaenepoel et al. 2006). This can have a significant negative
impact on native vegetation, particularly in areas where native vegetation is only beginning to
establish a foothold in a newly populated or restored environment.
One way to minimize foreign seed dispersal is to encourage citizens with a vehicle to use
a washing station when entering the park. Even on a volunteer-only basis, this can dramatically
decrease the amount of non-native and invasive species entering the area (Rothlisberger 2010).
Another way to prevent seeds from reaching areas where they could germinate and reproduce is
by making it difficult for off-roading by adding blockades or obstructions that make it
challenging for a vehicle to go off the designated road. Adding designated parking spots in
multiple areas may also encourage citizens to stop in those areas instead of trying to find off-trail
areas to park. To truly make this site a natural wetland that the City of Bozeman desires, the
addition and protection of vegetation native to this area must be a key aspect in continuing its
restoration.
The largest impact to native wildlife, excluding invasive, is the introduction of trails into
the wetland ecosystem. The environmental impact associated with trails is largely associated
with off-trail behavior. When hikers stray from the trail, their passage can result in trampled
vegetation, soil erosion, and ultimately negative impacts on water quality (Guo et al. 2015). In a
town consistently ranked as one of the “best places to live” for outdoor enthusiasts (Dyckman
MSU-Land Resource and Environmental Studies 2016 Story Mill Final Report
7
2013), it would be reasonable to expect that residents might exhibit above-average trail etiquette,
but Guo et al. (2015) found that people who hike more often are actually more likely to indicate
that they would hike off-trail in a stated choice survey. According to the same stated-choice
survey, hikers are most likely to leave the trail when the trail itself exhibits degradation:
muddiness or erosion (Guo et al. 2015). Therefore, designing trails that stand up to local
conditions is an important and relevant step towards reducing off-trail behaviors. A common
method for managing visitor behavior is displaying educational signage. Counterintuitively, Guo
found that participants who viewed an educational message were actually more likely to indicate
that they would hike off-trail. In light of these findings, trail development at Story Mill should
focus on the infrastructure of trails primarily as a means of encouraging visitors to stay on trail.
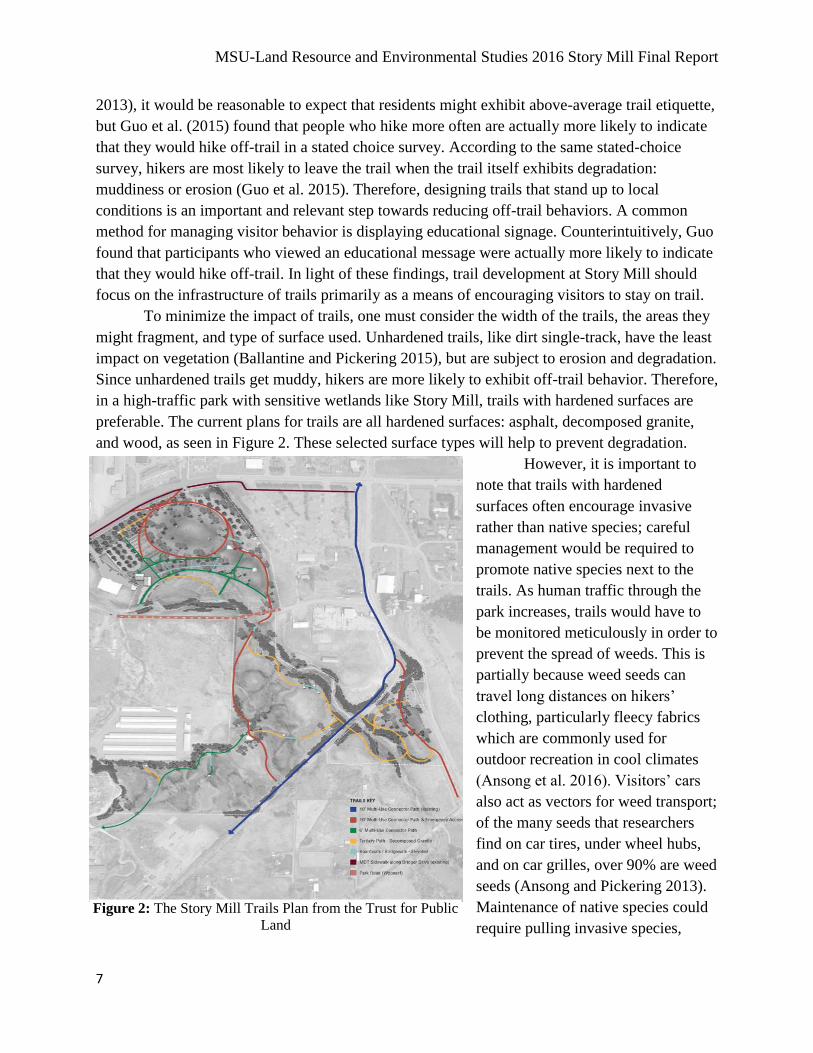
To minimize the impact of trails, one must consider the width of the trails, the areas they
might fragment, and type of surface used. Unhardened trails, like dirt single-track, have the least
impact on vegetation (Ballantine and Pickering 2015), but are subject to erosion and degradation.
Since unhardened trails get muddy, hikers are more likely to exhibit off-trail behavior. Therefore,
in a high-traffic park with sensitive wetlands like Story Mill, trails with hardened surfaces are
preferable. The current plans for trails are all hardened surfaces: asphalt, decomposed granite,
and wood, as seen in Figure 2. These selected surface types will help to prevent degradation.
However, it is important to
note that trails with hardened
surfaces often encourage invasive
rather than native species; careful
management would be required to
promote native species next to the
trails. As human traffic through the
park increases, trails would have to
be monitored meticulously in order to
prevent the spread of weeds. This is
partially because weed seeds can
travel long distances on hikers’
clothing, particularly fleecy fabrics
which are commonly used for
outdoor recreation in cool climates
(Ansong et al. 2016). Visitors’ cars
also act as vectors for weed transport;
of the many seeds that researchers
find on car tires, under wheel hubs,
and on car grilles, over 90% are weed
seeds (Ansong and Pickering 2013).
Maintenance of native species could
require pulling invasive species,
Figure 2: The Story Mill Trails Plan from the Trust for Public
Land
(the Trust for Public Land, 2015)
MSU-Land Resource and Environmental Studies 2016 Story Mill Final Report
8
herbicide application, seeding with native species, or monitoring of soil and water characteristics
to ensure optimal conditions for native vegetation. Accidental transport of weed seeds
necessitates continuous monitoring of species composition to prevent invasion of noxious weeds.
Some of the trails at Story Mill are planned to be boardwalks. These raised surfaces are
ideal because some vegetation can grow underneath the path when constructed from metal
grates, which let through sufficient light, (Ballantine and Pickering 2015) and hikers are less
likely to wander off-trail; the addition of railings can further discourage off-trail behaviors. It is
likely that cost is a limiting factor for the inclusion of boardwalks as they are much more
expensive to install than, for example, crushed gravel trails. To ensure low environmental
impacts from trails, the boardwalks must not be constructed from wood treated with chromated
copper arsenate (CCA). Particularly after abrasion from foot traffic, the chromium, copper, and
arsenate can contaminate the soil under and near the boardwalk (Lebow and Foster 2005). There
are new lumber treatments available based mostly on copper which are considered less toxic than
lumber treated with CCA, but these treatments cost more with prices 15-30% higher (Keiley
2003). Metal grates are a lower-cost alternative for boardwalks. Although aesthetically rather
unappealing, metal grates let more light through to plants underneath the boardwalk, allowing
the ecosystem to be more productive.
Placing trails parallel to contours is another best practice for sustainability (Ballantine
and Pickering 2015), but the relatively flat contours at Story Mill render this a moot point. The
paths planned closest to the active wetlands and the riparian zone should be reviewed to ensure
they are clear of the floodplain. Trails on the floodplain would be subject to erosion and
degradation.
While off-trail behavior is more concerning from a biochemical perspective, litter also
constitutes a potential problem as activity increases at Story Mill. Fortunately, research indicates
that littering can be reduced using social norms; when subjects observe someone picking up litter
in a mostly clean environment, they are much less likely to litter when they encounter the
opportunity (Reno et al. 1993). Therefore, if a few key volunteers keep the park free from litter
and are seen doing so, the Trust for Public Land will be able to maintain a culture that litters
infrequently. Litter can also be prevented by the regular placement of trash-cans. However, much
like the battle against invasive species, the battle against litter is a practice that will continue
through the lifespan of the park, so long as the ecological integrity is valued.
The Story Mill wetlands have been protected partially for the ecosystem services a
wetland can provide, but also because of a fortuitous cultural fascination with wildlife. In fact,
the community park will include features like bird watching blinds and observation platforms
(Story Mill Fact Sheet 2015). While this may seem to promote a cohesive vision of recreation
and protection, this once again presents the difficulty of balancing somewhat contradictory goals
for the Story Mill Community Park. When birders locate a species of interest, like nesting
sandhill cranes or bald eagles, large numbers of observers follow their every move through
binoculars. This phenomenon of mass-observation is exacerbated by social media; birders can
share the location of their finds instantly with one another. While a few observers would be
MSU-Land Resource and Environmental Studies 2016 Story Mill Final Report
9
harmless for the birds, the constant observation raises ambient anxiety for the birds (Burger et al.
1995). For some species, this means that parents or offspring suffer from malnutrition because
they hunt less when stressed. Some species have even shown abandonment behavior when highly
stressed. (Burger et al. 1995). Human activity also impacts food sources for predators like
hawks; the prey hides from noisy humans and thus is hidden when hawks come looking.
Ecotourists can coexist with birds as long as avian welfare is considered in management
plans. Since each species is affected by humans at a different distance, managers can attend to
what proximities produce changes in behavior for target species. If Sandhill cranes are of special
interest, for example, their habits could be observed in the area with people at various
proximities and then park rules could be adjusted to protect the birds if they are being disturbed.
Modifications like the suggested bird blinds may help to decrease bird anxiety; limiting off-trail
behavior can also help to regulate human distance from birds.
Conclusions and Recommendations
Taking into account the legacy of disturbance that has occurred at Story Mill, it seems
reasonable to re-assess the criteria for the success of the park. The ecological goals of the park
are attainable, but wetlands and riparian habitats are complex ecosystems that take a long time to
reach their fragile functioning state. It is hard to say if and when the ecological goals will ever
fully be attained. The aim should not necessarily be to restore a pristine ideal. Instead, the
restoration efforts incorporated in the park plan should be seen as a key element in achieving
conservation and natural resource management goals for the City (Halme et al., 2013), as well as
emphasizing public education. Since it is the largest public park of its kind around in the area, it
can also set an example for more projects like it in the future. Incorporating the history of the
area, and placing it on a timescale will open the public’s eyes to the complexity of ecosystems.
Acknowledging it as a restoration of a severely damaged urban ecosystem will legitimize the
slow ecological processes leading back towards a healthy state, and give the public who utilize
the park an elevated perspective on the importance of nature. Ideally, this park will blend the
ever-evolving social and environmental interface here in Bozeman.
Ultimately, to navigate challenges associated with balancing ecological and social goals,
stakeholders must actively engage the public (Yung et al. 2016). When visitors at the park feel
that they, too, are stakeholders and that the park reflects their values, they are more likely to care
for this novel ecosystem; Story Mill Community Park would be considered a “novel ecosystem”
because it was created by human agency. Once again, Story Mill is off to a good start since
public opinion was actively sought and incorporated into the park design. It is in Bozeman City’s
plans to incorporate housing around the park, the addition of wildlife corridors will provide the
best protection for wildlife once these structures are built. If plans for wildlife corridors are built
into city planning for the area surrounding the new park, the impact on wildlife can be
significantly diminished. Areas where the corridor would be most effective can be used, rather
than merely the area available after development has already occurred. This may also allow
MSU-Land Resource and Environmental Studies 2016 Story Mill Final Report
10
leeway on housing regulations, if proven that measurements to lower impacts on wildlife and
habitat have already taken place.
The thoughtful goals constructed for Story Mill Community Park are ecologically
progressive compared to other park designs. However, some of the social goals present serious
conflict with the ecological goals. This is not necessarily a bad thing; in fact, the contradictory
nature of these goals forces stakeholders to have more in-depth conversations about what the
park will mean for our community. When assessing the success of the park, it is important to
remember that the goals and objectives exist under a complex system of constraints, spanning
history, science, and culture. By finding the interstices of these goals, Story Mill Community
Park can achieve success as defined by our community values.
Sources Cited
Ansong, Michael, and Catherine Pickering. “Are Weeds Hitchhiking a Ride on Your Car? A
Systematic Review of Seed Dispersal on Cars.” PLOS ONE 8.11 (2013): e80275. PLoS
Journals.
Ansong, M., Pickering, C. “The Effects of Seed Traits and Fabric Type on the Retention of Seed
on Different Types of Clothing.” Basic and Applied Ecology 17.6 (2016): 516–526.
ScienceDirect.
Ballantyne, Mark, and Catherine Marina Pickering. “The Impacts of Trail Infrastructure on
Vegetation and Soils: Current Literature and Future Directions.” Journal of Environmental
Management 164 (2015): 53–64. ScienceDirect.
Burger, Joanna, Michael Gochfeld, and Larry J. Niles. “Ecotourism and Birds in Coastal New
Jersey: Contrasting Responses of Birds, Tourists, and Managers.”
EnvironmentalConservation 22.1 (1995): 56–65.
Carter, John B. Water Rights Attorney for the Confederated Salish and Kootenai Tribes (2016,
October 15), personal interview.
Cialdini, Robert B., Raymond R. Reno, and Carl A. Kallgren. “A Focus Theory of Normative
Conduct: Recycling the Concept of Norms to Reduce Littering in Public Places.” Journal of
Personality and Social Psychology 58.6 (1990): 1015–1026. ProQuest.
Deneen, S. Paradise lost: America’s disappearing wetlands. E Environ. (1998) Mag. 9, 36.
Dyckman, Kyle. "Outside's Best Towns 2013." Outside Online. Outside Magazine, 12 Aug.
2013.
EPA. 2016. EPA Superfund Program: Idaho Pole Co., Bozeman, MT.
https://cumulis.epa.gov/supercpad/cursites/csitinfo.cfm?id=0800379. Accessed 12/6/2016.
Guo, Tian et al. “Determinants of Responsible Hiking Behavior: Results from a Stated Choice
Experiment.” Environmental Management 56.3 (2015): 765–776. EBSCOhost.
Halme, P., Allen, K. A., Auniņš, A., Bradshaw, R. H. W., Brūmelis, G., Čada, and others.
Challenges of ecological restoration: Lessons from forests in northern Europe. Biological
Conservation, 167, (2013) 248–256.
Hobbs, R. J., Higgs, E., & Hall, C. M. (Eds.). Novel ecosystems: intervening in the new
ecological world order. (2013). Chichester, West Sussex ; Hoboken, NJ: John Wiley & Sons.
MSU-Land Resource and Environmental Studies 2016 Story Mill Final Report
11
Keiley, Lynn. "Choosing Safe Lumber." Mother Earth News. Mother Earth News, Feb. 2003.
Lebow, Stan, and Daniel Foster. “Environmental Concentrations of Copper, Chromium, and
Arsenic Released from a Chromated-Copper-Arsenate- (CCA-C-) Treated Wetland
Boardwalk.” Forest Products Journal 55.2 (2005): 62–70. Print.
Little, S.J., Harcourt, R.G., Clevenger, A.P. Do wildlife passages act as prey-traps? Biol.
Conserv. 107, (2002) 135–145. doi:10.1016/S0006-3207(02)00059-9
Montana DNRC http://dnrc.mt.gov/divisions/water/adjudication/41h. Accessed 10/24/2016.
Montana Natural Heritage Program Wetlands Information [WWW Document], n.d. URL
http://mtnhp.org/wetlands/. Accessed 10.17.16.
Rothlisberger, J.D. Human-mediated dispersal of aquatic nonindigenous species: Impacts and
interventions (Ph.D.). (2013) University of Notre Dame, United States -- Indiana.
Rust, T. C. Lost Fort Ellis: a frontier history of Bozeman. Charleston, SC: The History
Press. (2016)
Strahn, B. Derek. “National Register of Historic Places Nomination Form: Northern
Pacific/Story Mill Historic District.” Montana State Historic Preservation Office, Helena,
Montana, 1996.
Summers, P.D., Cunnington, G.M., Fahrig, L. Are the negative effects of roads on breeding birds
caused by traffic noise? J. Appl. Ecol. 48, (2011) 1527–1534. doi:10.1111/j.1365-
2664.2011.02041.x
Sutter, R. D. et al. “Monitoring the Effectiveness of a Boardwalk at Protecting a Low Heath Bald
in the Southern Appalachians.” Natural Areas Journal 13.4 (1993): 250–255. Print.
United States Environmental Protection Agency.
https://cumulis.epa.gov/supercpad/cursites/csitinfo.cfm?id=0800379. Accessed 10/24/2016.
U.S. Army Corps of Engineers. Regional Supplement to the Corps of Engineers Wetland
Delineation Manual: Western Mountains, Valleys, and Coast Region. May 2010.
http://www.nrcs.usda.gov/Internet/FSE_DOCUMENTS/stelprdb1046494.pdf.
Van Kleunen, M., Dawson, W., Essl, F., Pergl, J., Winter, M., Weber, E., Kreft, H., Weigelt, P.,
and others. Global exchange and accumulation of non-native plants. Nature 525, (2015) 100–
103. doi:10.1038/nature14910
USDA Web Soil Survey. http://websoilsurvey.sc.egov.usda.gov/App/WebSoilSurvey.aspx.
Accessed 10/24/2016.
Wildlife corridors - natural resource management information note -
landholderNotes15WildlifeCorridors.pdf, n.d.
http://www.environment.nsw.gov.au/resources/nature/landholderNotes15WildlifeCorridors.p
df. Accessed 10/22/2016.
Yung, Laurie et al. “Engaging the Public in Novel Ecosystems.” Novel Ecosystems. Ed. Richard
J. Hobbs, Eric S. Higgs, and Carol M. Hall. John Wiley & Sons, Ltd, 2013. 247–256.
Zwaenepoel, A., Roovers, P., Hermy, M. Motor vehicles as vectors of plant species from road
verges in a suburban environment. Basic Appl. Ecol. 7, (2006) 83–93.
MSU-Land Resource and Environmental Studies 2016 Story Mill Final Report
12
Water Quality and Story Mill Wetland
Hayden Altenburg, Shijia Luo, Paul Rychener, Melissa Marlen
Introduction
An extraordinary amount of pressure has been placed on the quality of our water
resources as industrial and agricultural activities expand to meet increasing population growth in
urbanized settings. Despite our reliance on fresh water, our actions have severely degraded both
the quality and quantity of rivers and streams. A nationwide assessment of streams in the U.S.
found that 42% of stream lengths were in poor condition, with the most widespread stressors
identified as nitrogen (N), phosphorus (P), streambed sediments, and riparian disturbance
(Paulsen et al., 2006). Increased sediment loads create impermeable streambeds and reduce
recharge of groundwater. Excessive phosphorus inputs from human activities such as fertilizer
use in agricultural lands (Carpenter, 2005) and sewage discharge through stormwater flow and
groundwater flow are further decreasing water quality by causing algae blooms, resulting in low
levels of dissolved oxygen in the water. Oxygen depletion causes fish kill and decreases species
diversity. Further, some types of algae release toxins that endanger wildlife and human health
when water is used for drinking or recreation. Wetlands have also been severely impacted, 50%
of wetland habitat has been lost due to draining, filling of soil, and excavation in the lower 48
states of the U.S. (Batzer et al., 2014; Dahl, 1990). This has resulted in efforts to restore and
protect the highly valued services of streams and wetlands that have been degraded, damaged, or
destroyed.
Wetlands are closely related to the survival and development of human beings (Chen,
Z.M. et al., 2008). Wetlands are one of the most ecologically diverse environments and provide
many resources for human production and life. The environmental function and benefits
provided by wetlands cannot be replaced by other systems in the aspects of controlling floods,
regulating runoff, controlling pollution, adjusting climate, and decreasing soil erosion. Therefore,
wetlands are praised as "Earth, kidneys" (Cherubini et al., 2008).
Bozeman’s population increases at a rate of 4.2% per year and suffers from water
pollution problems (Dietrich, 2016). The Montana Department of Environmental Quality (DEQ)
Watershed Management Section leads the Total Maximum Daily Load (TMDL) program, which
determines sources of pollution that enters the streams, rivers and lakes across the state and
defines allowable levels of pollution that our waters can sustain and still support our needs.
Under the TMDL program, Bozeman Creek/East Fork Gallatin is considered impaired due to
inputs of nonpoint source pollution from urban stormwater runoff and agricultural practices. This
research paper focuses on the following questions:
1) What are the ecological services provided by Story Mill Wetlands and riparian areas
and what are the effects of water quantity on these systems?
MSU-Land Resource and Environmental Studies 2016 Story Mill Final Report
13
2) How can we better manage water quantity and nutrient loading at Story Mill with the
use of upstream constructed wetlands and riparian corridor enhancements?
3) Can sediment loads be reduced with the current improvements at Story Mill, and what
effect does the Backwater Slough have?
4) How is phosphorus retained at Story Mill and how can phosphorus retention be
quantified?
Effect of Water Quantity On Story Mill
This reduction in wetland quality was an incentive for the purchase of Story Mill
Wetlands. The site has had very dynamic land use history consisting of ditching, draining and
filling (Deford, 2014; Kramer, 2014) for homesteading, ranching, and stock ponds. The wetland
at Story Mill Community Park can improve soil environment, purify water quality, prevent
pollution and regulate ecological balance. This regulation improves the quality of wetlands,
which is beneficial to water circulation and the protection of biological diversity.
Wetlands can store water in a role similar to a reservoir. During a flood period, wetlands
accumulate water and slowly release water in the dry season, improving water retention for the
watershed. If quantity of water is too high, the maximization storage will be exceeded and will
not accept additional flood water. If quantity of water is too little, the wildlife and vegetation
would not survive and the balance in the Story Mill wetlands would be harmed, decreasing its
function.
Ecological Services from Story Mill Wetlands
Story Mill wetland provides a multitude of invaluable ecosystem services including:
Groundwater Recharge and Discharge: Some wetlands help to recharge and maintain
groundwater levels, while other wetlands discharge groundwater to streams, helping to maintain
baseline flow and reduce flooding (Wright et al., 2006).
Flood Protection: Wetlands act as a reservoir, storing rainfall, snowmelt, and floodwater and
then slowly releases this water. Vegetation slows the speed of runoff and distributes it over the
floodplain. Wetlands can collect and counteract the increased runoff from buildings and
pavement in urban areas. (USEPA, n.d.)
Provision of Available Resources: Wetlands can give us a wide range of products, including
wood and medicinal materials.
Maintaining the Microclimate: Wetlands can affect the microclimate. Wetlands become water
vapor by evaporation, and then in the form of precipitation down to the surrounding areas, to
maintain local humidity and rainfall, affecting the lives of local people, industrial, and
agricultural production.
Wildlife Habitat: Wetlands provide habitat for many bird, fish, and amphibians; many of which
are rare and endangered species. Migratory birds rely heavily on wetlands for a variety of
MSU-Land Resource and Environmental Studies 2016 Story Mill Final Report
14
functions, including feeding, breeding, and nesting (NCSU Water Quality Group, n.d.). Wetlands
can also function as wildlife corridors.
Retention and Transformation of Toxins and Impurities: As water containing contaminants
(pesticides, domestic sewage, metals, and industrial discharges) passes through wetlands, the rate
of flow slows down and toxins/impurities accumulate (NCSU Water Quality Group, n.d.). In
addition, wetland plants, such as reed and water lake lotus, can effectively absorb toxic
substances.
Retention of Nutrients and Sediment: Excess nutrients and sediment in water flowing through
the wetland can accumulate in wetland vegetation or the wetland sediment layer, leading to the
purification of downstream water.
Erosion Protection: Wetland vegetation roots stabilize stream banks, absorb energy from water
and prevent erosion (USEPA, n.d.), thus improving water quality and protecting agricultural
production.
Tourism and Aesthetics: Wetlands are a rich and natural beauty with great opportunities for
sightseeing, bird watching, and entertainment.
Education and Scientific Research: Complex wetland ecosystems contain rich flora and fauna,
and valuable endangered species that play an important role in natural science education and
research. Some wetlands also retain valuable historical and cultural sites.
Inline Wetland Treatment Systems
Implementation of constructed riparian wetland networks may help to provide additional
ecosystem regulating services along Bozeman Creek, which has been listed on the Montana DEQ
303d due to various urban non-point pollution sources that impact the 14-mile stream segment.
While the City of Bozeman is making adjustments to roadway infrastructure to accommodate
increased traffic and implementing improvements to best management practice (BMP)
operations, the addition of these in stream riparian wetland treatment systems would likely help
to alleviate some of the nutrient and sediment loading concerns affecting Bozeman Creek before
reaching Story Mill.
Wetlands and wetland networks improve water quality within urban areas (Helfield et al.,
1997). Constructed wetland (CW) networks also reduce diffuse non-point source pollution along
the length of an impaired river corridor. Wetland systems are effective in treating organic matter,
nitrogen and phosphorus, and decrease the concentrations of heavy metals, organic chemicals,
and pathogens (Haberl et al., 2003). CW systems improve water quality and control the transport
of nutrients and urban pollutants downstream by reducing stream velocity as stormwater reaches
the CW where roughness from aquatic and riparian vegetation reduces stream velocity and
settles the suspended sediments and captures nutrients in CWs (Jones, 1996). New regulations in
the United States, aiming to protect natural wetlands, now restrict their use for stormwater runoff
(Debusk et al. 1996). Typically, CW’s do not have the full range of ecological functions of
natural wetlands; CWs are instead designed specifically for flood control and water quality
purposes (U.S. EPA, 1993). However, these projects can also accomplish multiple urban use
MSU-Land Resource and Environmental Studies 2016 Story Mill Final Report
15
objectives by providing increased wildlife habitat, improved landscape value, and enhance
recreational opportunities. Constructed wetland systems provide different characteristics
regarding their ability to retain nutrients depending upon factors including water chemistry,
hydrology, sediment, and plant typology.
With current restoration projects underway at Bogert Park, future plans to widen Rouse
Ave., and discussion of purchasing land near city hall (BCEC, 2012); a great opportunity exists
for the application of inline stream treatment processes that could enhance sediment and nutrient
holding capacity to prevent further degradation downstream. Over the years, the ecological value
of Bozeman Creek has been diminished, while the floodplain/riparian corridor has undergone
significant development. Throughout the downtown area, opportunities for community recreation
and aesthetic enjoyment are limited or nonexistent (Confluence Consulting et al., 2012). The
once meandering stream channel of Bozeman Creek has undergone human alteration throughout
most of the city limits into a straightened and simplified ditch channel with a series of culverts
and pipes that transport stream flow beneath downtown Bozeman streets and parking lots. The
highest level of impairment occurs on a 1-mile reach of the stream between Story Street and
Peach Street where the stream has been channelized and armored, has limited riparian vegetation
and has been piped beneath parking lots and downtown buildings.
An enhancement project for Bogert Park has been scheduled to begin in the Fall of 2016,
with plans to reconstruct approximately 800 ft. of Bozeman Creek in order to return the system
to a more natural and ecologically productive condition. The current restoration objective will be
accomplished by incorporating two stream meanders into the park, constructing an inset
floodplain to increase flood storage, and incorporating native streamside vegetation to aid in
nutrient retention and sediment control during flooding. This particular restoration project has
been identified as a high priority by the Bozeman Creek Enhancement Committee due to the
level of impairment within the stream reach and the value it provides for area residents (BCEC,
2012). Future restoration efforts could incorporate constructed riparian wetland networks within
the stream corridor to help alleviate downstream nutrient loading concerns and attenuate flooding
events. Typically self-maintaining CWs are designed to emulate the functions of natural wetland
marshes, swamps, and bogs. The success and self-maintaining attributes of these CW treatment
systems rely on a functioning association between plants, water, and microbial communities.
Marshes offer the most potential for water treatment because the emergent and submergent plant
communities are well adapted to fluctuations in water level and are more tolerant of high nutrient
and pollution concentrations (Hammer, 1989). Previous research has shown that helophyte plant
species are most applicable in wastewater treatment systems and the most frequently chosen
species include: reeds, rushes and cattails (Stottmeister et al., 2003). Ultimately, the selection of
plant species used within locally implemented CWs should be referenced from nearby natural
wetland systems containing established plant communities that are adapted to local climate and
soil conditions. Optimal environmental conditions must also be maintained for desirable
microbial populations to effectively manage a wetland system for wastewater treatment.
MSU-Land Resource and Environmental Studies 2016 Story Mill Final Report
16
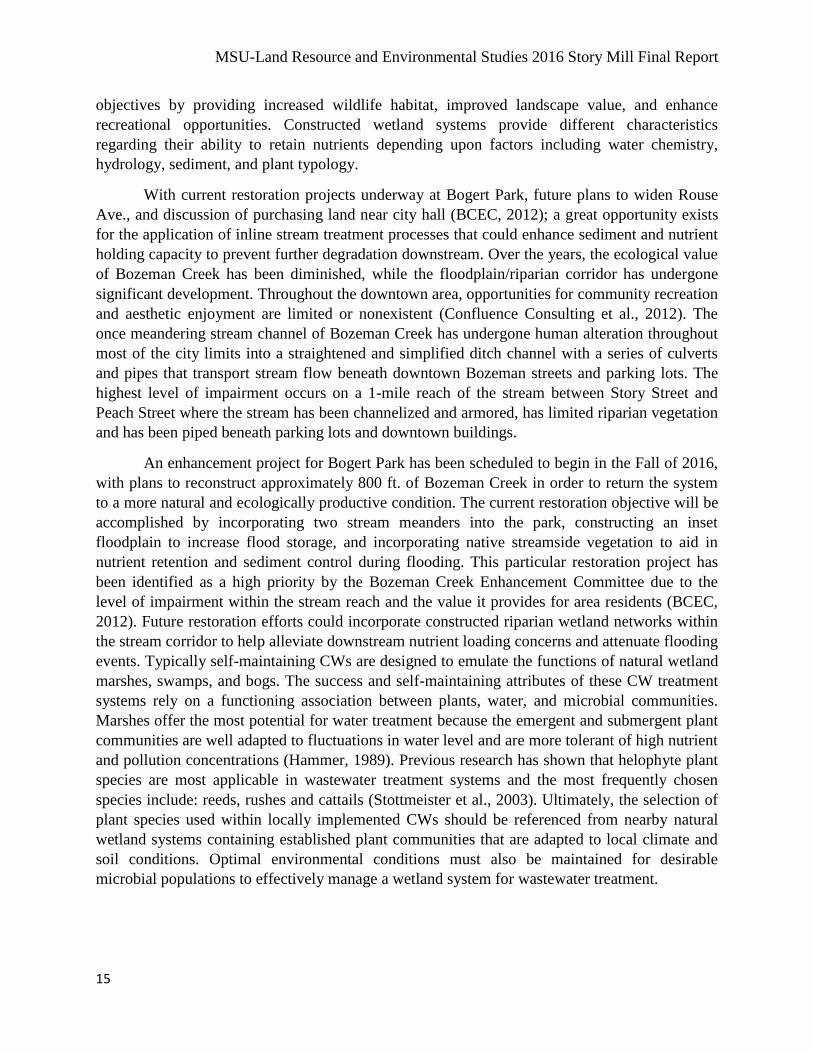
Riparian Corridor Revegetation
Buffer enhancements involve creation and widening of existing riparian zones, improving
stream bank stability and provide a natural filter for sediment and nutrients from upland runoff
(Ranalli et.al., 2010). These regions also decrease potential for groundwater contamination,
through increased plant uptake of nutrients that would otherwise leach below the plant-rooting
zone. Without access to floodplains, stormwater runoff is often trapped within the stream
channel, causing an increase in erosion of the channel bed and banks, degraded water quality and
loss of in-stream habitat (Mcmillan et al., 2014).
Floodplains provide hydraulic relief for streams,
attenuating flood flows, recharging
groundwater, assimilating nutrients and
harboring many species of flora and fauna
(Thompson et al., 2011). Space constraints often
limit the efforts of urban restoration projects to
reconnect a stream with its floodplain, however;
careful consideration needs to be taken to
attempt to restore some floodplain access back
into an impaired stream.
A delay in the development of the
Montana Department of Transportation (MDT)
Rouse Avenue reconstruction project, initially
planned for 2015, presents a great opportunity to
restore structure and function to Bozeman Creek
along a developing traffic corridor within
downtown Bozeman. Initial road expansion
plans from the MDT provide no enhancements
to improve or maintain the current condition of
the stream, although the project could
substantially increase the transport of pollutants
into the nearby stream from increased automobile traffic. Depending upon the outcome of right-
of-way negotiations that involve the acquisition of homes along Rouse Avenue, there may be an
opportunity to reposition the roadway further away from the stream allowing for restructuring of
the channel to reintroduce meander bends and reconnect the stream with the floodplain/riparian
zone. These additional efforts could help to reduce downstream transport of pollutants and
alleviate flooding concerns from the highly impervious downtown Bozeman area. Similar efforts
could also be proved useful on a parcel of land near city hall that may be purchased by the City,
where improved floodplain access and stream bank revegetation practices could help alleviate
pollution inputs to Bozeman Creek and further reduce flooding concerns through the highly
channelized and tunneled downtown area. The proposed restoration project is likely to result in
an improvement to downstream water quality near Story Mill through a decrease in N, P and
sediment transport. The intended goal of the wetland/riparian network is to reduce peak stream
flows in order to facilitate plant uptake of nutrients, to allow suspended sediments to settle, and
(Fig.1) Source: Repec Consulting & Services, 2014.
MSU-Land Resource and Environmental Studies 2016 Story Mill Final Report
17
to extend the flow duration within the stream by increasing groundwater recharge before
reaching Story Mill.
Sediment Accumulation at Story Mill
As previously stated, there are many ways to reduce nutrient and sediment loads
upstream before it reaches the newly developed park at Story Mill, so what beneficial use can
Story Mill provide to reduce sediment loads? The main goal stated by The Trust for Public Land
(TPL) for Story Mill Wetland is, “In consideration of site constraints and other project goals,
restore and protect on-site natural processes necessary for a functioning riparian and wetland
system” (Respec Consulting, 2014). Respec Consulting worked with TPL to enhance on-site
wetlands. As previously stated, Montana DEQ has confirmed that sediment loads in Bozeman
Creek are 37% above the TMDL limit and is currently listed as “impaired for sediment” (Respec,
2014). To mitigate this issue, Respec Consulting increased the hydrologic connectivity of the
south west corner of the property, located on the Turner parcel adjacent to Bozeman Creek by
excavating 6,200 cubic yards of topsoil to lower the land elevation closer to the standing water
table to re-establish wetland properties (Respec Consulting, 2015). This slough is designed to
capture two-year and greater flood events based on the elevation of the border of the slough
relative to the elevation of the water flowing through Bozeman Creek during that flood event.
The area for this “backwater slough” is within the green polygon, highlighted by the red box
(Figure 1). This area can capture moving water from a flood event, reducing the velocity of the
water and providing the opportunity for sediments and other contaminants to settle out. This
periodic deposition of sediment can help improve water quality downstream as well as improve
soil quality within the slough. Since the excavation, there has been very little flooding within the
backwater slough which has made soil development a slow process. When the slough was
excavated, it was dug down to a coarse sandy horizon in the soil profile. This improved the
mechanical function of the wetland, but changed the ecological function. This coarse sand soil
allows for rapid drainage of the backwater slough, creating a less hospitable habitat than most
hydrophilic plants inhabit. This has made the revegetation efforts challenging for the area. In
2013, TerraAquatic worked with TPL to establish a vegetation management plan that will
enhance desirable vegetation and decrease undesirable plant species. The intent of the Story Mill
Vegetation Plan is to create a living document that will adapt to changing site conditions and
evolving development plans by the TPL. Methods of vegetation control included biocontrol,
chemical control (selective herbicide application), and mechanical pulling of weeds
(TerraAquatic, 2013). The success of the revegetation efforts should be documented as well as
population growth or depletion of invasive species to know whether the site is naturally
attenuating back to the desired wetland population. This slough helps reduce sediment loads
during flood events, but currently no plan is in place to reduce sediment loads during non-peak
flows in Bozeman Creek, creating a need for increased riparian corridor revegetation plan as
previously stated.
MSU-Land Resource and Environmental Studies 2016 Story Mill Final Report
18
Wetland Phosphorus Retention
Retention is defined as the capacity of a wetland to remove water column phosphorus
and/or other nutrients through chemical, physical, and biological processes and hold it in a form
not readily released under normal conditions (Reddy et al., 1999). Phosphorus retention in
wetlands decreases the load to downstream aquatic systems and improves water quality. Biotic
and abiotic processes regulate P retention. Biotic processes include assimilation by vegetation
and microorganisms creating a short-term storage of P; abiotic processes include adsorption of
soluble P by soils and sedimentation of particulate P creating a long-term storage of P.
Macrophytes uptake inorganic P forms through their roots and/or foliage and converts it
into organic phosphorus for growth. Phosphorus uptake is highest during the peak-growing
season, followed by decrease in the fall and winter. Before fall senescence of the macrophytes,
the majority of P is transferred from aboveground biomass (shoots and leaves) to belowground
biomass (roots and rhizomes) where it is stored and used during early spring growth (Reddy,
1999). Due to rapid turnover in aboveground biomass, P storage is short term and it is estimated
that 35 to 75% of the P is released back into the water column when vegetative decomposition
occurs (Richardson, 1985). Roots decompose underground and contribute refractory residuals to
subsurface soils while aboveground biomass decomposition also contributes refractory residuals
on the soil and sediment surface; these contributions provide long-term storage of P in the
wetland (Howard-Williams, 1985).
Microorganisms can regulate P concentrations in the water column by assimilating both
organic and inorganic forms of P. In a study by Sloey et al. (1978) about 60% of P retention was
attributed to microorganisms in wetlands. When macrophytes begin to decompose, P is released
into the water column and utilized by microorganisms living on the surface of vegetation, while
benthic microorganisms living on the sediment surface utilize P found in the sediment and the
water column and assimilate the P into their biomass during growth. Wetlands that receive water
with high concentrations of P will increase the amount of P assimilated by microorganisms with
little evidence of rapid P release to the water column, whereas in oligotrophic conditions, it was
found that P would be released into the water column and decrease amount of P assimilated by
microorganisms (Howard-Williams 1985).
The adhesion of P to different elements in wetlands is referred to as adsorption. Under
acidic conditions, Fe and Al hydrous oxides will bind with inorganic phosphates to form
insoluble precipitates (Dunne et al. 2005). In soils dominated by Fe minerals, reduction of the
soluble ferrous oxyhydroxides compounds results in amorphous reduced ferrous compounds with
greater surface areas for phosphorus sorption reactions to occur (Reddy et al., 1995). Although
these sites have increased sorption sites for P these sites have lower P bonding energies, thus
desorption potential is high. Whereas in oxidized soils, less P will be adsorbed, but it will be held
more tightly. Under alkaline conditions, precipitation as insoluble Ca-phosphates becomes more
dominant (Reddy et al., 1999). In wetlands, retention by soils will only occur when inorganic P is
in direct contact with the adsorbent, so P in the water column must diffuse into underlying soils
or sediments before it can be retained. This diffusion will only occur if the water column has
MSU-Land Resource and Environmental Studies 2016 Story Mill Final Report
19
(Jamieson et al., 2002). If water column P concentrations are lower than the pore-water
concentration sediments will release P rather than retain it.
Sedimentation (also referred to as accretion) occurs when incoming water velocity is
reduced by wetland vegetation and incoming particulate P, organic matter, and sediment from
the water column is trapped and accumulates (Dunne et al., 2005). Sediment accumulation
increases soil mass and provides a long-term storage of P and other nutrients in the wetland.
During low flow, wetlands behave as sediment traps and resuspension of settled sediments is
unlikely unless there is high flow velocity, possibly caused by an extreme weather event (Reddy
et al., 1999). Disturbance of sedimentation by living organisms can stir up accumulated sediment
and contribute P from pore-water and particulate P in sediment to the water column but it also
greatly increases the oxidized layer at the sediment-water interface and increases P retention
(Howard-Williams 1985).
Methods to Measure Wetland Phosphorus Retention in Story Mill Wetland
Laboratory experiments and field methods can be used to estimate phosphorus retention
in Story Mill Wetland. These methodologies include measuring changes in P concentration in the
sediment pore-water column in a laboratory and using sedimentation rates in the field to estimate
P accumulation in sediments.
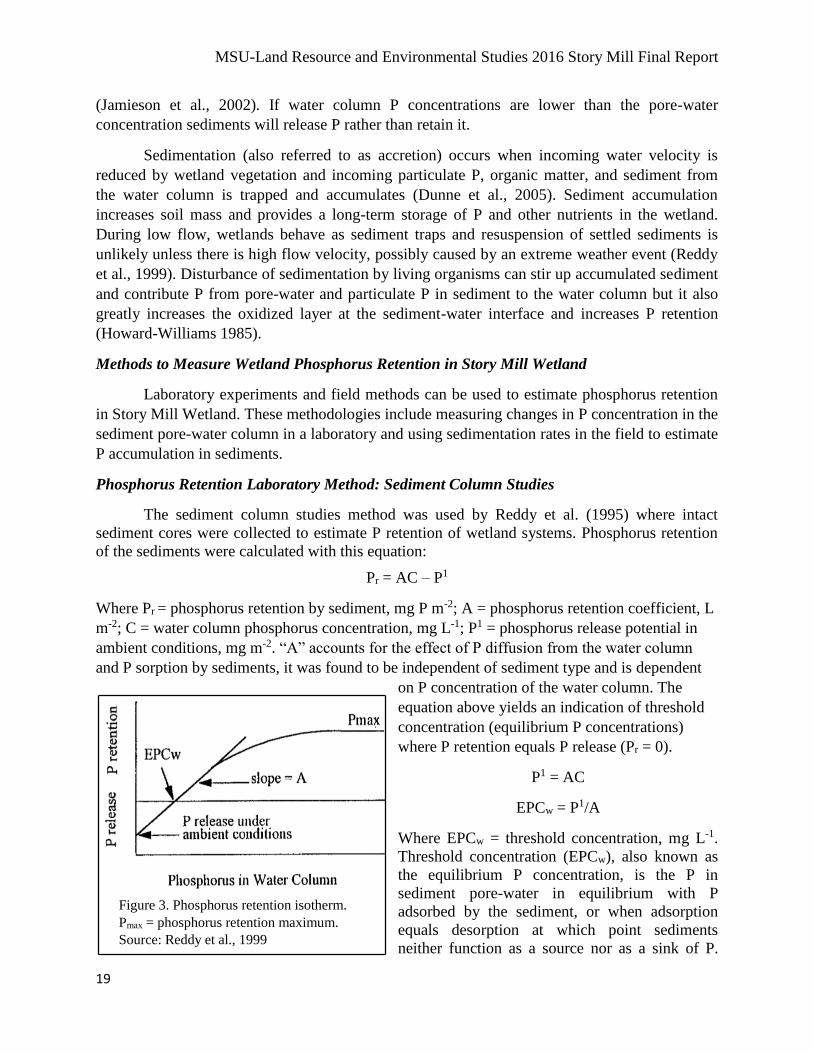
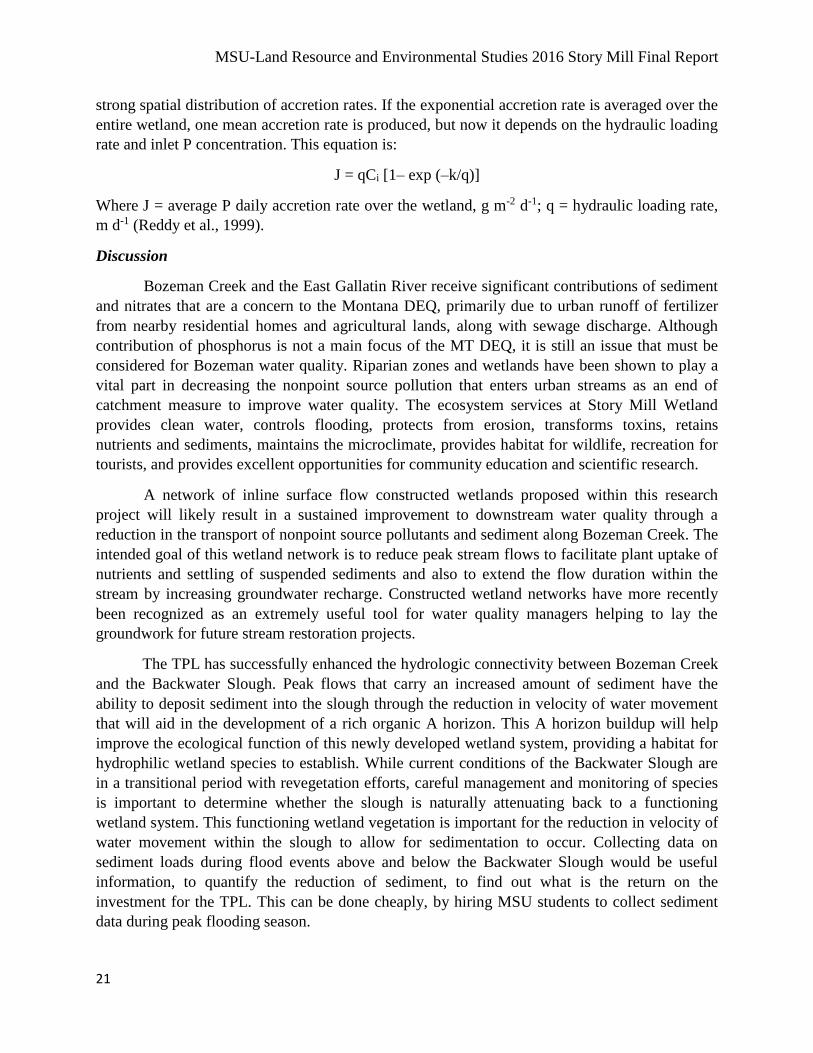
Phosphorus Retention Laboratory Method: Sediment Column Studies
The sediment column studies method was used by Reddy et al. (1995) where intact
sediment cores were collected to estimate P retention of wetland systems. Phosphorus retention
of the sediments were calculated with this equation:
Pr = AC – P1
Where Pr = phosphorus retention by sediment, mg P m-2; A = phosphorus retention coefficient, L
m-2; C = water column phosphorus concentration, mg L-1; P1 = phosphorus release potential in
ambient conditions, mg m-2. “A” accounts for the effect of P diffusion from the water column
and P sorption by sediments, it was found to be independent of sediment type and is dependent
on P concentration of the water column. The
equation above yields an indication of threshold
concentration (equilibrium P concentrations)
where P retention equals P release (Pr = 0).
P1 = AC
EPCw = P1/A
Where EPCw = threshold concentration, mg L-1.
Threshold concentration (EPCw), also known as
the equilibrium P concentration, is the P in
sediment pore-water in equilibrium with P
adsorbed by the sediment, or when adsorption
equals desorption at which point sediments
neither function as a source nor as a sink of P.
Figure 3. Phosphorus retention isotherm.
Pmax = phosphorus retention maximum.
Source: Reddy et al., 1999
MSU-Land Resource and Environmental Studies 2016 Story Mill Final Report
20
Water column P concentrations that are
greater than EPCw suggest net P retention by
sediments while water column P
concentrations that are less than EPCw
suggest net P release by sediments (Dunne et
al., 2005). This can be observed in what is
called an adsorption isotherm shown in
Figure 3. Adsorption isotherms of sediment
are measured by mixing water containing a
known P concentration with a known
amount of sediment from the wetland and
shaking for a 24-hour period. Phosphorus
not recovered in solution is considered
adsorbed by the sediment. Repeating this
process with varying water column P
concentrations results in an adsorption
isotherm, where the y-axis shows P adsorbed by sediment and the x-axis shows water column P
concentration (Reddy et al., 1999). The sediment column method of measuring P retention has
the advantage that it includes the effect of diffusion of water column P into the sediment and
other processes including uptake of P by algae/vegetation, physico-chemical properties, and
bioturbation) at the sediment-water interface on P retention (Reddy et al., 1995).
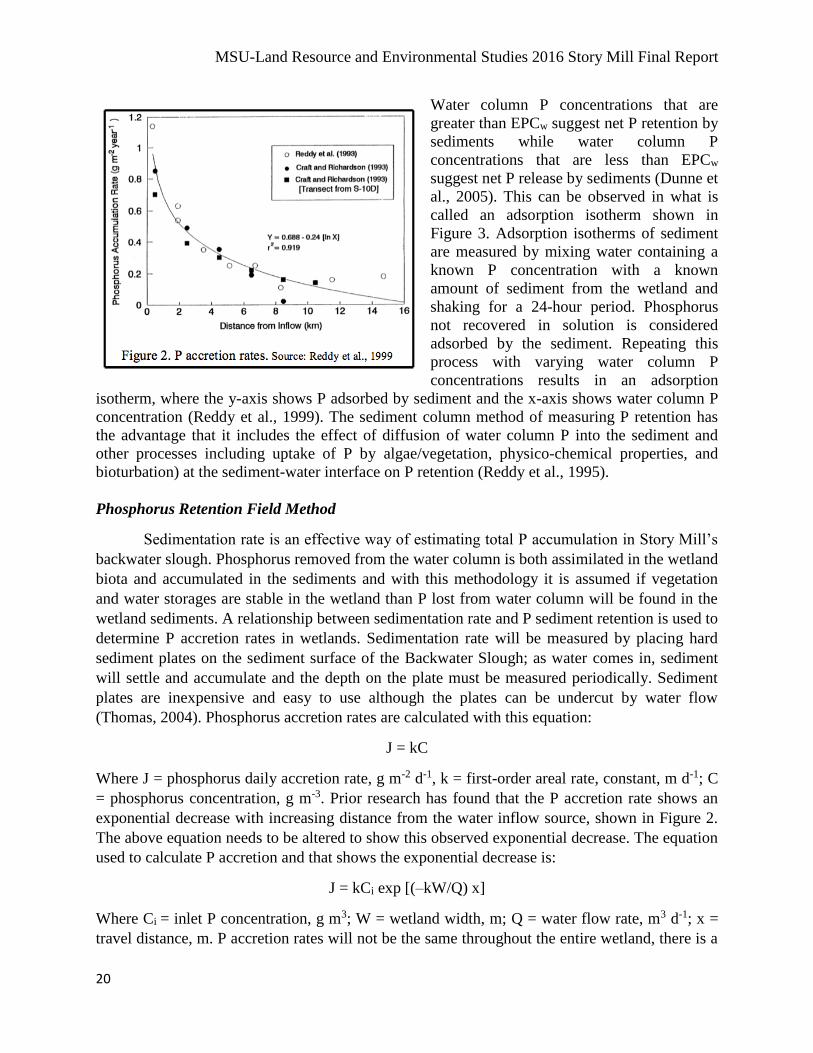
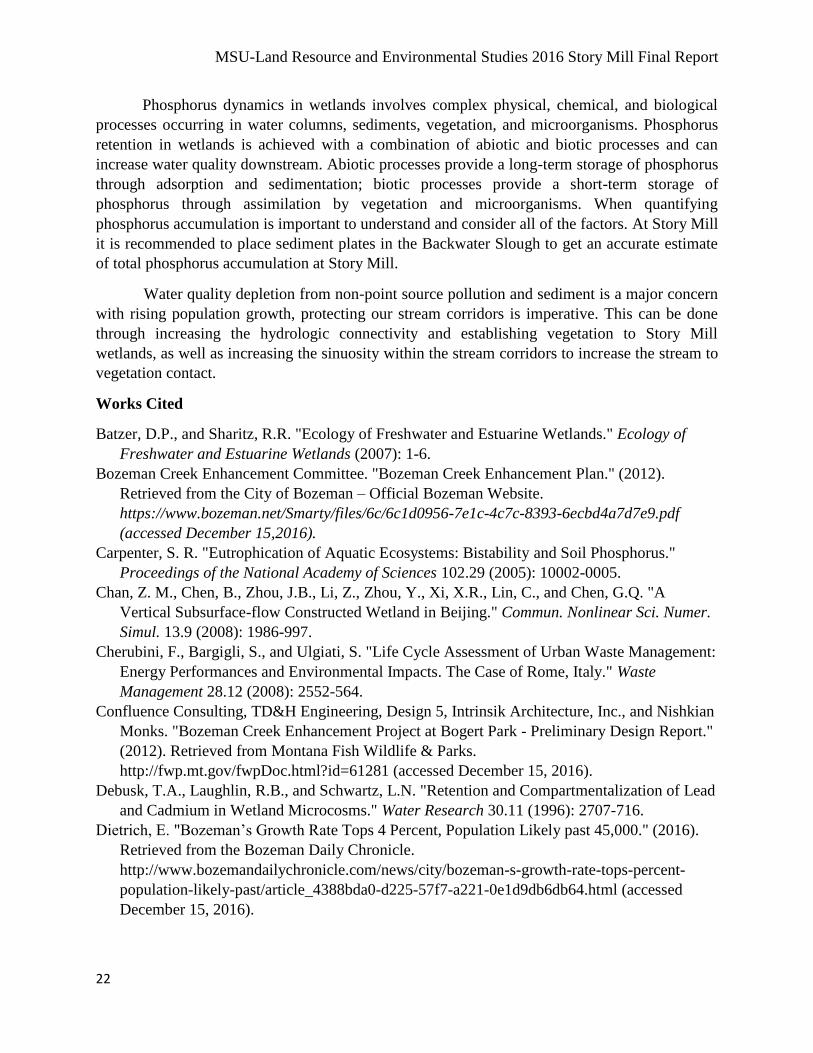
Phosphorus Retention Field Method
Sedimentation rate is an effective way of estimating total P accumulation in Story Mill’s
backwater slough. Phosphorus removed from the water column is both assimilated in the wetland
biota and accumulated in the sediments and with this methodology it is assumed if vegetation
and water storages are stable in the wetland than P lost from water column will be found in the
wetland sediments. A relationship between sedimentation rate and P sediment retention is used to
determine P accretion rates in wetlands. Sedimentation rate will be measured by placing hard
sediment plates on the sediment surface of the Backwater Slough; as water comes in, sediment
will settle and accumulate and the depth on the plate must be measured periodically. Sediment
plates are inexpensive and easy to use although the plates can be undercut by water flow
(Thomas, 2004). Phosphorus accretion rates are calculated with this equation:
J = kC
Where J = phosphorus daily accretion rate, g m-2 d-1, k = first-order areal rate, constant, m d-1; C
= phosphorus concentration, g m-3. Prior research has found that the P accretion rate shows an
exponential decrease with increasing distance from the water inflow source, shown in Figure 2.
The above equation needs to be altered to show this observed exponential decrease. The equation
used to calculate P accretion and that shows the exponential decrease is:
J = kCi exp [(–kW/Q) x]
Where Ci = inlet P concentration, g m3; W = wetland width, m; Q = water flow rate, m3 d-1; x =
travel distance, m. P accretion rates will not be the same throughout the entire wetland, there is a
MSU-Land Resource and Environmental Studies 2016 Story Mill Final Report
21
strong spatial distribution of accretion rates. If the exponential accretion rate is averaged over the
entire wetland, one mean accretion rate is produced, but now it depends on the hydraulic loading
rate and inlet P concentration. This equation is:
J = qCi [1– exp (–k/q)]
Where J = average P daily accretion rate over the wetland, g m-2 d-1; q = hydraulic loading rate,
m d-1 (Reddy et al., 1999).
Discussion
Bozeman Creek and the East Gallatin River receive significant contributions of sediment
and nitrates that are a concern to the Montana DEQ, primarily due to urban runoff of fertilizer
from nearby residential homes and agricultural lands, along with sewage discharge. Although
contribution of phosphorus is not a main focus of the MT DEQ, it is still an issue that must be
considered for Bozeman water quality. Riparian zones and wetlands have been shown to play a
vital part in decreasing the nonpoint source pollution that enters urban streams as an end of
catchment measure to improve water quality. The ecosystem services at Story Mill Wetland
provides clean water, controls flooding, protects from erosion, transforms toxins, retains
nutrients and sediments, maintains the microclimate, provides habitat for wildlife, recreation for
tourists, and provides excellent opportunities for community education and scientific research.
A network of inline surface flow constructed wetlands proposed within this research
project will likely result in a sustained improvement to downstream water quality through a
reduction in the transport of nonpoint source pollutants and sediment along Bozeman Creek. The
intended goal of this wetland network is to reduce peak stream flows to facilitate plant uptake of
nutrients and settling of suspended sediments and also to extend the flow duration within the
stream by increasing groundwater recharge. Constructed wetland networks have more recently
been recognized as an extremely useful tool for water quality managers helping to lay the
groundwork for future stream restoration projects.
The TPL has successfully enhanced the hydrologic connectivity between Bozeman Creek
and the Backwater Slough. Peak flows that carry an increased amount of sediment have the
ability to deposit sediment into the slough through the reduction in velocity of water movement
that will aid in the development of a rich organic A horizon. This A horizon buildup will help
improve the ecological function of this newly developed wetland system, providing a habitat for
hydrophilic wetland species to establish. While current conditions of the Backwater Slough are
in a transitional period with revegetation efforts, careful management and monitoring of species
is important to determine whether the slough is naturally attenuating back to a functioning
wetland system. This functioning wetland vegetation is important for the reduction in velocity of
water movement within the slough to allow for sedimentation to occur. Collecting data on
sediment loads during flood events above and below the Backwater Slough would be useful
information, to quantify the reduction of sediment, to find out what is the return on the
investment for the TPL. This can be done cheaply, by hiring MSU students to collect sediment
data during peak flooding season.
MSU-Land Resource and Environmental Studies 2016 Story Mill Final Report
22
Phosphorus dynamics in wetlands involves complex physical, chemical, and biological
processes occurring in water columns, sediments, vegetation, and microorganisms. Phosphorus
retention in wetlands is achieved with a combination of abiotic and biotic processes and can
increase water quality downstream. Abiotic processes provide a long-term storage of phosphorus
through adsorption and sedimentation; biotic processes provide a short-term storage of
phosphorus through assimilation by vegetation and microorganisms. When quantifying
phosphorus accumulation is important to understand and consider all of the factors. At Story Mill
it is recommended to place sediment plates in the Backwater Slough to get an accurate estimate
of total phosphorus accumulation at Story Mill.
Water quality depletion from non-point source pollution and sediment is a major concern
with rising population growth, protecting our stream corridors is imperative. This can be done
through increasing the hydrologic connectivity and establishing vegetation to Story Mill
wetlands, as well as increasing the sinuosity within the stream corridors to increase the stream to
vegetation contact.
Works Cited
Batzer, D.P., and Sharitz, R.R. "Ecology of Freshwater and Estuarine Wetlands." Ecology of
Freshwater and Estuarine Wetlands (2007): 1-6.
Bozeman Creek Enhancement Committee. "Bozeman Creek Enhancement Plan." (2012).
Retrieved from the City of Bozeman – Official Bozeman Website.
https://www.bozeman.net/Smarty/files/6c/6c1d0956-7e1c-4c7c-8393-6ecbd4a7d7e9.pdf
(accessed December 15,2016).
Carpenter, S. R. "Eutrophication of Aquatic Ecosystems: Bistability and Soil Phosphorus."
Proceedings of the National Academy of Sciences 102.29 (2005): 10002-0005.
Chan, Z. M., Chen, B., Zhou, J.B., Li, Z., Zhou, Y., Xi, X.R., Lin, C., and Chen, G.Q. "A
Vertical Subsurface-flow Constructed Wetland in Beijing." Commun. Nonlinear Sci. Numer.
Simul. 13.9 (2008): 1986-997.
Cherubini, F., Bargigli, S., and Ulgiati, S. "Life Cycle Assessment of Urban Waste Management:
Energy Performances and Environmental Impacts. The Case of Rome, Italy." Waste
Management 28.12 (2008): 2552-564.
Confluence Consulting, TD&H Engineering, Design 5, Intrinsik Architecture, Inc., and Nishkian
Monks. "Bozeman Creek Enhancement Project at Bogert Park - Preliminary Design Report."
(2012). Retrieved from Montana Fish Wildlife & Parks.
http://fwp.mt.gov/fwpDoc.html?id=61281 (accessed December 15, 2016).
Debusk, T.A., Laughlin, R.B., and Schwartz, L.N. "Retention and Compartmentalization of Lead
and Cadmium in Wetland Microcosms." Water Research 30.11 (1996): 2707-716.
Dietrich, E. "Bozeman’s Growth Rate Tops 4 Percent, Population Likely past 45,000." (2016).
Retrieved from the Bozeman Daily Chronicle.
http://www.bozemandailychronicle.com/news/city/bozeman-s-growth-rate-tops-percent-
population-likely-past/article_4388bda0-d225-57f7-a221-0e1d9db6db64.html (accessed
December 15, 2016).
MSU-Land Resource and Environmental Studies 2016 Story Mill Final Report
23
Dunne, E. J., & Reddy, K.R. "Phosphorus Biogeochemistry of Wetlands in Agricultural
Watersheds." In E.J. Dunne, K.R. Reddy, & O.T. Carton (Eds.) Nutrient Management in
Agricultural Watersheds: A Wetlands Solution. Wageningen Academic, The Netherlands
(2005): 105-19.
Haberl, R., Grego, S., Langergraber, G., Kadlec, R.H., Cicalini, A., Dias, S.M., Novais, J.M.,
Aubert, S., Gerth, A., Hartmut, T., and Hebner, A. "Constructed Wetlands for the Treatment
of Organic Pollutants." Journal of Soils and Sediments 3.2 (2003): 109-24.
Hammer, D.A. “Constructed Wetlands for Wastewater Treatment—Municipal, Industrial and
Agricultural.” Lewis Publishers, Chelsea, MI (1989).
Helfield, M.J., and Diamond, M.R. "Use of Constructed Wetlands for Urban Stream Restoration:
A Critical Analysis." Environmental Management 21.3 (1997): 329-41.
Howard-Williams, C. "Cycling and Retention of Nitrogen and Phosphorus in Wetlands: A
Theoretical and Applied Perspective." Freshwater Biology 15.4 (1985): 391-431.
Jamieson, T. S., Stratton, G.W., Gordon R., and Madani, A. "Phosphorus Adsorption
Characteristics of a Constructed Wetland Soil Receiving Dairy Farm Wastewater." Canadian
Journal of Soil Science 82.1 (2002): 97-104.
Jones, W.W. “Design Features of Constructed Wetlands for Nonpoint Source Treatment.” School
of Public and Environmental Affairs - Indiana University, Bloomington, Indiana (1995).
Mcmillan, S.K., Tuttle, A.K., Jennings, G.D., and Gardner, A. "Influence of Restoration Age and
Riparian Vegetation on Reach-Scale Nutrient Retention in Restored Urban Streams." JAWRA
Journal of the American Water Resources Association 50.3 (2014): 626-38.
Milliman, J.D., and Syvitski, J. "Geomorphic/Tectonic Control of Sediment Discharge to the
Ocean: The Importance of Small Mountainous Rivers." The Journal of Geology 100.5
(1992): 525-44.
Mitsch, W.J., and Gosselink J.G. "The Value of Wetlands: Importance of Scale and Landscape
Setting." Ecological Economics 35.1 (2000): 25-33.
NCSU (North Carolina State University) Water Quality Group. “Types of Wetlands and Their
Roles in the Watershed” and “Functions of Wetlands (Processes)” Watersheds: A Decision
Support System for Nonpoint Source Pollution Control. North Carolina State University
Water Quality Group, Raleigh, North Carolina (n.d.).
Paulsen, S., Stoddard, J., Holdsworth, S., Mayio, A., and Tarquinio, E. "Wadeable Streams
Assessment: A Collaborative Survey of the Nation’s Streams." EPA. Environmental
Protection Agency (2006).
Ranalli, A.J., and Macalady, D.L. "The Importance of the Riparian Zone and In-stream Processes
in Nitrate Attenuation in Undisturbed and Agricultural Watersheds - A Review of the
Scientific Literature." Journal of Hydrology 389.3-4 (2010): 406-15.
Randhir, T. "Watershed-scale Effects of Urbanization on Sediment Export: Assessment and
Policy." Water Resources Research 39.6 (2003).
Reddy, K. R., Kadlec, R.H., Flaig, E., and Gale, P.M. "Phosphorus Retention in Streams and
Wetlands: A Review." Critical Reviews in Environmental Science and Technology 29.1
(1999): 83-146.
MSU-Land Resource and Environmental Studies 2016 Story Mill Final Report
24
Reddy, K.R., Diaz, O.A., Scinto, L.J., and Agami, M. "Phosphorus Dynamics in Selected
Wetlands and Streams of the Lake Okeechobee Basin." Ecological Engineering 5.2-3 (1995):
183-207.
Respec Consulting & Services. "Story Mill Ecological Restoration, Final Plan." Report, (2014):
1-39. Retrieved from The Trust for Public Land. https://www.tpl.org/our-work/story-mill-
community-park
Respec Consulting & Services. "Story Mill Ecological Restoration Phase 1 Construction Photo
Journal Summary." (2015). Retrieved from The Trust for Public Land.
https://www.tpl.org/sites/default/files/5_SMCP%20Restoration%20Description%20%26%20
Photojournal.pdf (accessed December 15, 2016).
Richardson, C. J. "Mechanisms Controlling Phosphorus Retention Capacity in Freshwater
Wetlands." Science 228.4706 (1985): 1424-427.
Sloey, W. E., Spangler, F.L., and Fetter, C.W. “Management of Freshwater Wetlands for
Nutrient Assimilation.” In R. E. Good, D. F. Whigham, and R. L. Simpson (eds.), Freshwater
Wetlands, Ecological Processes and Management Potential. Academic Press, New York
(1978): 321-340.
Stottmeister, U., A. WiebŸner, P. Kuschk, U. Kappelmeyer, M. Kastner, O. Bederski, R.A.
Muller, and H. Moormann. "Effects of Plants and Microorganisms in Constructed Wetlands
for Wastewater Treatment." Biotechnology Advances 22.1-2 (2003): 93-117.
TerraQuatic, LLC. "Story Mill Vegetation Management Plan." Report, prepared by TerraQuatic,
Bozeman, MT, for The Trust for Public Land, Bozeman, MT (2013): 1-27.
Thomas, S., and Ridd, P.V. "Review of Methods to Measure Short Time Scale Sediment
Accumulation." Marine Geology 207.1-4 (2004): 95-114.
Thompson, R., and S. Parkinson. "Assessing the Local Effects of Riparian Restoration on Urban
Streams." New Zealand Journal of Marine and Freshwater Research 45.4 (2011): 625-36.
Trust for Public Land. “Story Mill Community Park Design Process and Vision.” Report,
(2015): 1-4. Retrieved from The Trust for Public Land. http://www.tpl.org/our-work/story-
mill-community-park (accessed December 15, 2016)
Trust for Public Land. “Story Mill Ecological Restoration Project Description.” Report, (2014):
1-6. Retrieved for The Trust for Public Land. http://www.tpl.org/our-work/story-mill-
community-park (accessed December 15, 2016).
USEPA (U.S. Environmental Protection Agency). “America’s Wetlands.” Pamphlet. U.S.
Environmental Protection Agency, Office of Wetlands, Oceans, and Watersheds, Washington,
D.C. (n.d.).
USEPA (U.S. Environmental Protection Agency). “Constructed Wetlands for Wastewater
Treatment and Wildlife Habitat: 17 Case Studies.” U.S. Environmental Protection Agency
Washington, DC: (1993).
Wright, T., Tomlinson, J., Schueler, T., Cappiella, K., Kitchell, A., and Hirschman, D. “Direct
and Indirect Impacts of Urbanization on Wetland Quality.” Prepared by the Center for
Watershed Protection for the U.S. Environmental Protection Agency, Office of Wetlands,
Oceans, and Watersheds, Washington, D.C. (2006).
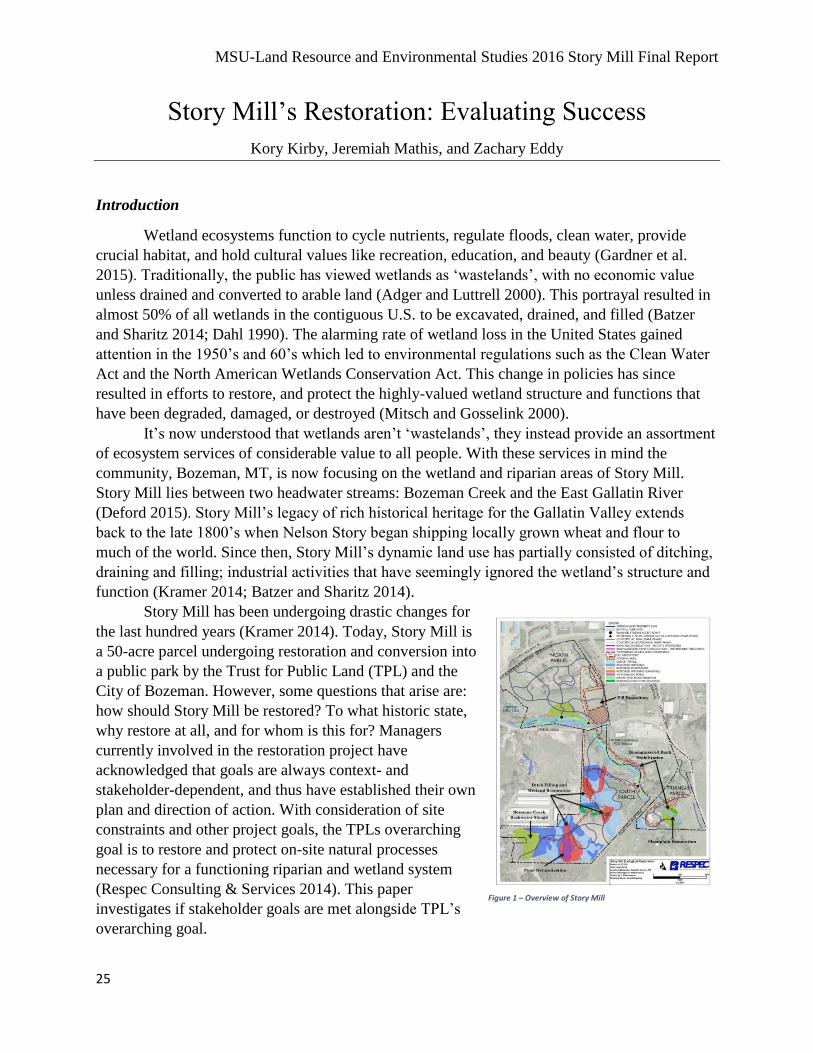
MSU-Land Resource and Environmental Studies 2016 Story Mill Final Report
25
Story Mill’s Restoration: Evaluating Success
Kory Kirby, Jeremiah Mathis, and Zachary Eddy
Introduction
Wetland ecosystems function to cycle nutrients, regulate floods, clean water, provide
crucial habitat, and hold cultural values like recreation, education, and beauty (Gardner et al.
2015). Traditionally, the public has viewed wetlands as ‘wastelands’, with no economic value
unless drained and converted to arable land (Adger and Luttrell 2000). This portrayal resulted in
almost 50% of all wetlands in the contiguous U.S. to be excavated, drained, and filled (Batzer
and Sharitz 2014; Dahl 1990). The alarming rate of wetland loss in the United States gained
attention in the 1950’s and 60’s which led to environmental regulations such as the Clean Water
Act and the North American Wetlands Conservation Act. This change in policies has since
resulted in efforts to restore, and protect the highly-valued wetland structure and functions that
have been degraded, damaged, or destroyed (Mitsch and Gosselink 2000).
It’s now understood that wetlands aren’t ‘wastelands’, they instead provide an assortment
of ecosystem services of considerable value to all people. With these services in mind the
community, Bozeman, MT, is now focusing on the wetland and riparian areas of Story Mill.
Story Mill lies between two headwater streams: Bozeman Creek and the East Gallatin River
(Deford 2015). Story Mill’s legacy of rich historical heritage for the Gallatin Valley extends
back to the late 1800’s when Nelson Story began shipping locally grown wheat and flour to
much of the world. Since then, Story Mill’s dynamic land use has partially consisted of ditching,
draining and filling; industrial activities that have seemingly ignored the wetland’s structure and
function (Kramer 2014; Batzer and Sharitz 2014).
Story Mill has been undergoing drastic changes for
the last hundred years (Kramer 2014). Today, Story Mill is
a 50-acre parcel undergoing restoration and conversion into
a public park by the Trust for Public Land (TPL) and the
City of Bozeman. However, some questions that arise are:
how should Story Mill be restored? To what historic state,
why restore at all, and for whom is this for? Managers
currently involved in the restoration project have
acknowledged that goals are always context- and
stakeholder-dependent, and thus have established their own
plan and direction of action. With consideration of site
constraints and other project goals, the TPLs overarching
goal is to restore and protect on-site natural processes
necessary for a functioning riparian and wetland system
(Respec Consulting & Services 2014). This paper
investigates if stakeholder goals are met alongside TPL’s
overarching goal.
Figure 1 – Overview of Story Mill
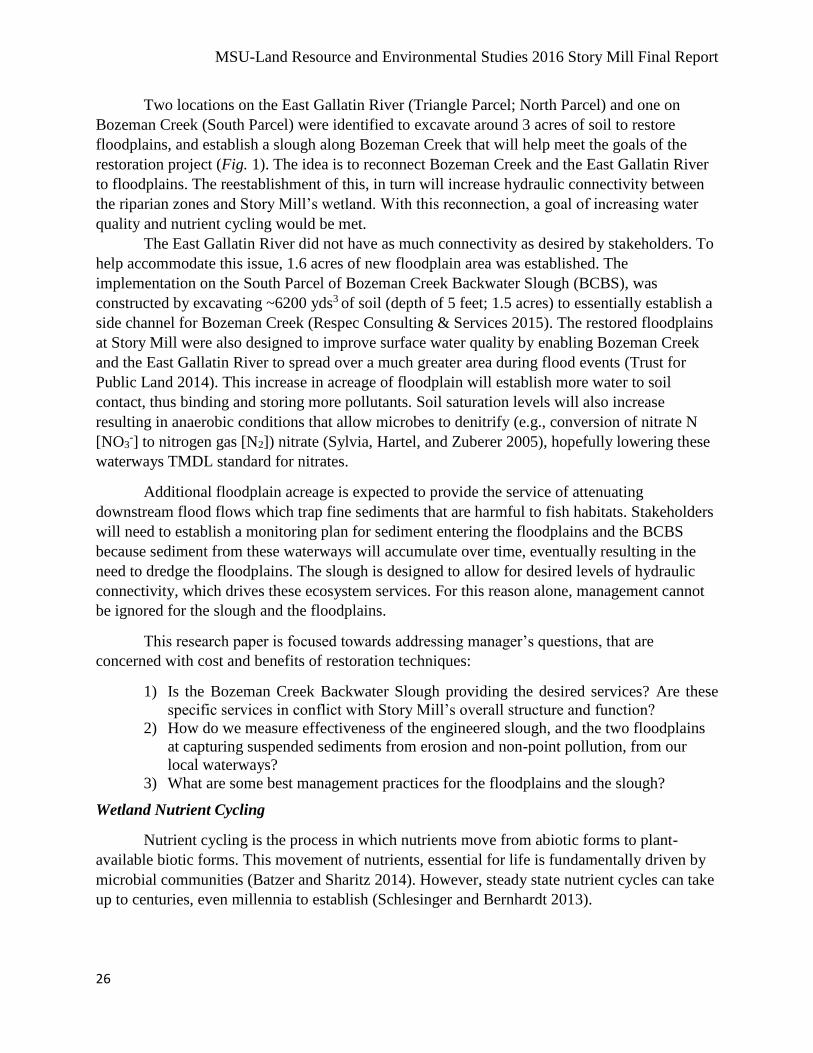
MSU-Land Resource and Environmental Studies 2016 Story Mill Final Report
26
Two locations on the East Gallatin River (Triangle Parcel; North Parcel) and one on
Bozeman Creek (South Parcel) were identified to excavate around 3 acres of soil to restore
floodplains, and establish a slough along Bozeman Creek that will help meet the goals of the
restoration project (Fig. 1). The idea is to reconnect Bozeman Creek and the East Gallatin River
to floodplains. The reestablishment of this, in turn will increase hydraulic connectivity between
the riparian zones and Story Mill’s wetland. With this reconnection, a goal of increasing water
quality and nutrient cycling would be met.
The East Gallatin River did not have as much connectivity as desired by stakeholders. To
help accommodate this issue, 1.6 acres of new floodplain area was established. The
implementation on the South Parcel of Bozeman Creek Backwater Slough (BCBS), was
constructed by excavating ~6200 yds3 of soil (depth of 5 feet; 1.5 acres) to essentially establish a
side channel for Bozeman Creek (Respec Consulting & Services 2015). The restored floodplains
at Story Mill were also designed to improve surface water quality by enabling Bozeman Creek
and the East Gallatin River to spread over a much greater area during flood events (Trust for
Public Land 2014). This increase in acreage of floodplain will establish more water to soil
contact, thus binding and storing more pollutants. Soil saturation levels will also increase
resulting in anaerobic conditions that allow microbes to denitrify (e.g., conversion of nitrate N
[NO3-] to nitrogen gas [N2]) nitrate (Sylvia, Hartel, and Zuberer 2005), hopefully lowering these
waterways TMDL standard for nitrates.
Additional floodplain acreage is expected to provide the service of attenuating
downstream flood flows which trap fine sediments that are harmful to fish habitats. Stakeholders
will need to establish a monitoring plan for sediment entering the floodplains and the BCBS
because sediment from these waterways will accumulate over time, eventually resulting in the
need to dredge the floodplains. The slough is designed to allow for desired levels of hydraulic
connectivity, which drives these ecosystem services. For this reason alone, management cannot
be ignored for the slough and the floodplains.
This research paper is focused towards addressing manager’s questions, that are
concerned with cost and benefits of restoration techniques:
1) Is the Bozeman Creek Backwater Slough providing the desired services? Are these
specific services in conflict with Story Mill’s overall structure and function?
2) How do we measure effectiveness of the engineered slough, and the two floodplains
at capturing suspended sediments from erosion and non-point pollution, from our
local waterways?
3) What are some best management practices for the floodplains and the slough?
Wetland Nutrient Cycling
Nutrient cycling is the process in which nutrients move from abiotic forms to plant-
available biotic forms. This movement of nutrients, essential for life is fundamentally driven by
microbial communities (Batzer and Sharitz 2014). However, steady state nutrient cycles can take
up to centuries, even millennia to establish (Schlesinger and Bernhardt 2013).
MSU-Land Resource and Environmental Studies 2016 Story Mill Final Report
27
Wetland sediments primarily consist of three components: (1) organic matter (e.g.,
decomposing plant and animal tissue); inorganic matter (e.g., metal oxides, hydroxides, and
carbonates); and (3) particulate mineral matter (e.g., sands, silts, and clays). Under the forces of
sedimentation, these components pack tightly together leaving only small spaces between
particles, called pore volume. When sediments become inundated, these pore spaces become
occupied by water. The proportion of air and water per volume of wetland sediments depends on
substrate type (e.g., silt, sand, and coarser material) (Batzer and Sharitz 2014; Buscot and Varma
2005). The available pore volume influences the rate and depth to which oxygen can enter
wetland sediments.
Biogeochemical processes are influenced by the rate of oxygen diffusion, mass flow with
water, or plants allowing for the movement of oxygen between alternating wet/dry phases. The
presence or absence of oxygen drives reduction-oxidation (redox) reactions that dominate
nutrient cycling in aquatic sediments (Canfield and Thamdrup 2009). When a sediment is
saturated, oxygen diffuses about 104 times more slowly in water than in air, this limited supply of
free oxygen often results in an aerobic surface layer (oxidized), and an underlying anaerobic
layer (reduced). The depth of these two layers strongly influences nutrient cycling processes with
the presence or absence of free oxygen for microbes to access (Batzer and Sharitz 2014). Redox
reactions require an electron donor and an electron acceptor, one substance is oxidized, and the
other is reduced. When oxygen is used an electron acceptor, it allows bacteria to breakdown
organic matter to carbon dioxide with the maximum yield of energy. Carbon as an energy source
in organic matter must be accessible. In the absence of oxygen many different electron acceptors
are available for the bacteria. These different acceptors allow bacteria to thrive in anaerobic
conditions. After oxygen, nitrate is next highest yield of energy for an electron acceptor where
nitrate is reduced from NO3- to N2 gas (Batzer and Sharitz 2014; Sylvia, Hartel, and Zuberer
2005). Denitrifying bacteria prefer to use oxygen as their electron acceptor when both are
available, because oxygen has a higher maximum yield of energy. Denitrifying bacteria engage
in aerobic respiration when oxygen is available, but switch to anaerobic respiration when oxygen
is not (Gottschalk 2012). Thus, anaerobic conditions are necessary for denitrification.
Comparing Optimal Conditions for services desired to Story Mill
For future disturbance, we focus our attention to the BCBS. The BCBS is expected to
provide services like sediment capture and water quality improvements by holding and
infiltrating nutrients (Trust for Public Land 2014). This results in biogeochemical processes like,
nitrogen and carbon cycling that are acknowledged as critical ecosystem services for a full
structural, and functional wetland (Batzer and Sharitz 2014). This section addresses if the BCBS
is providing the desired services, and if these specific services in conflict with Story Mill’s
overall structure and function. Optimal conditions for services like; nitrogen cycling, carbon
storage, pollutant sorption, will be analyzed and compared to the environmental conditions at
Story Mill.
Denitrification in the BCBS, and the restored floodplains represent a net loss of nitrate
from Bozeman Creek and the East Gallatin River. It’s been shown that alternating periods of
saturated soils, and non-saturated soils will create the greatest loss of N2 to the atmosphere
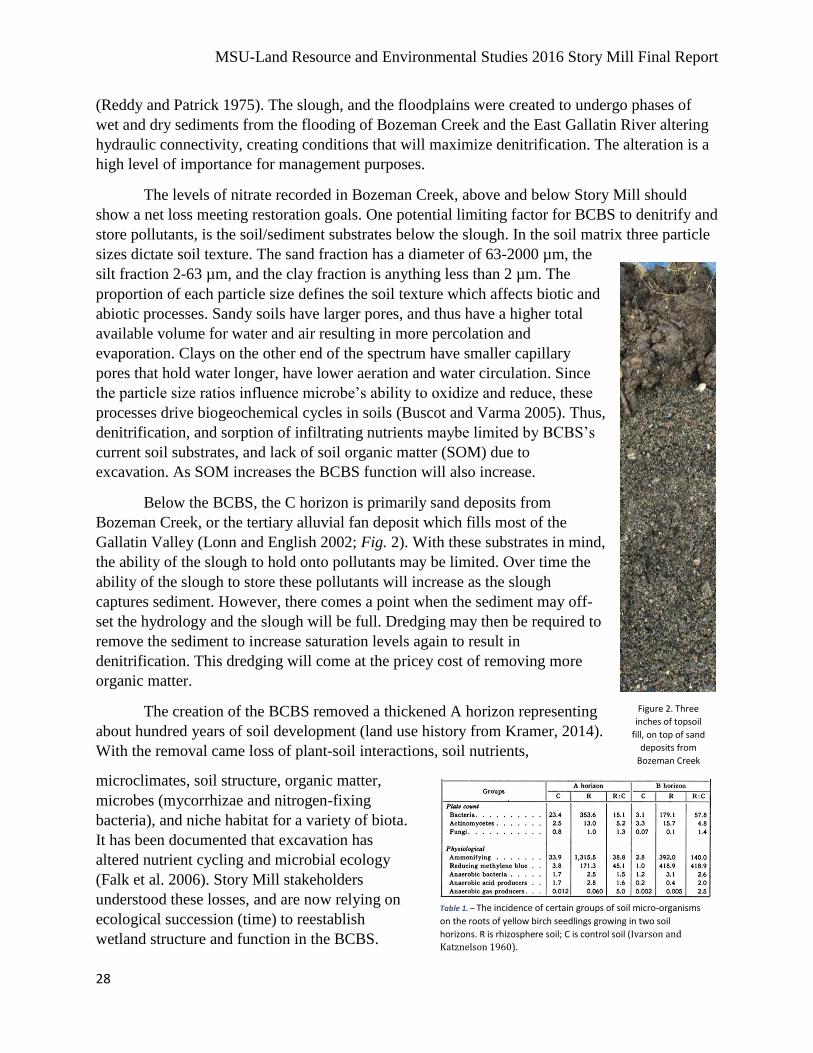
MSU-Land Resource and Environmental Studies 2016 Story Mill Final Report
28
(Reddy and Patrick 1975). The slough, and the floodplains were created to undergo phases of
wet and dry sediments from the flooding of Bozeman Creek and the East Gallatin River altering
hydraulic connectivity, creating conditions that will maximize denitrification. The alteration is a
high level of importance for management purposes.
The levels of nitrate recorded in Bozeman Creek, above and below Story Mill should
show a net loss meeting restoration goals. One potential limiting factor for BCBS to denitrify and
store pollutants, is the soil/sediment substrates below the slough. In the soil matrix three particle
sizes dictate soil texture. The sand fraction has a diameter of 63-2000 µm, the
silt fraction 2-63 µm, and the clay fraction is anything less than 2 µm. The
proportion of each particle size defines the soil texture which affects biotic and
abiotic processes. Sandy soils have larger pores, and thus have a higher total
available volume for water and air resulting in more percolation and
evaporation. Clays on the other end of the spectrum have smaller capillary
pores that hold water longer, have lower aeration and water circulation. Since
the particle size ratios influence microbe’s ability to oxidize and reduce, these
processes drive biogeochemical cycles in soils (Buscot and Varma 2005). Thus,
denitrification, and sorption of infiltrating nutrients maybe limited by BCBS’s
current soil substrates, and lack of soil organic matter (SOM) due to
excavation. As SOM increases the BCBS function will also increase.
Below the BCBS, the C horizon is primarily sand deposits from
Bozeman Creek, or the tertiary alluvial fan deposit which fills most of the
Gallatin Valley (Lonn and English 2002; Fig. 2). With these substrates in mind,
the ability of the slough to hold onto pollutants may be limited. Over time the
ability of the slough to store these pollutants will increase as the slough
captures sediment. However, there comes a point when the sediment may off-
set the hydrology and the slough will be full. Dredging may then be required to
remove the sediment to increase saturation levels again to result in
denitrification. This dredging will come at the pricey cost of removing more
organic matter.
The creation of the BCBS removed a thickened A horizon representing
about hundred years of soil development (land use history from Kramer, 2014).
With the removal came loss of plant-soil interactions, soil nutrients,
microclimates, soil structure, organic matter,
microbes (mycorrhizae and nitrogen-fixing
bacteria), and niche habitat for a variety of biota.
It has been documented that excavation has
altered nutrient cycling and microbial ecology
(Falk et al. 2006). Story Mill stakeholders
understood these losses, and are now relying on
ecological succession (time) to reestablish
wetland structure and function in the BCBS.
Table 1. – The incidence of certain groups of soil micro-organisms
on the roots of yellow birch seedlings growing in two soil
horizons. R is rhizosphere soil; C is control soil (Ivarson and
Katznelson 1960).
Figure 2. Three
inches of topsoil
fill, on top of sand
deposits from
Bozeman Creek
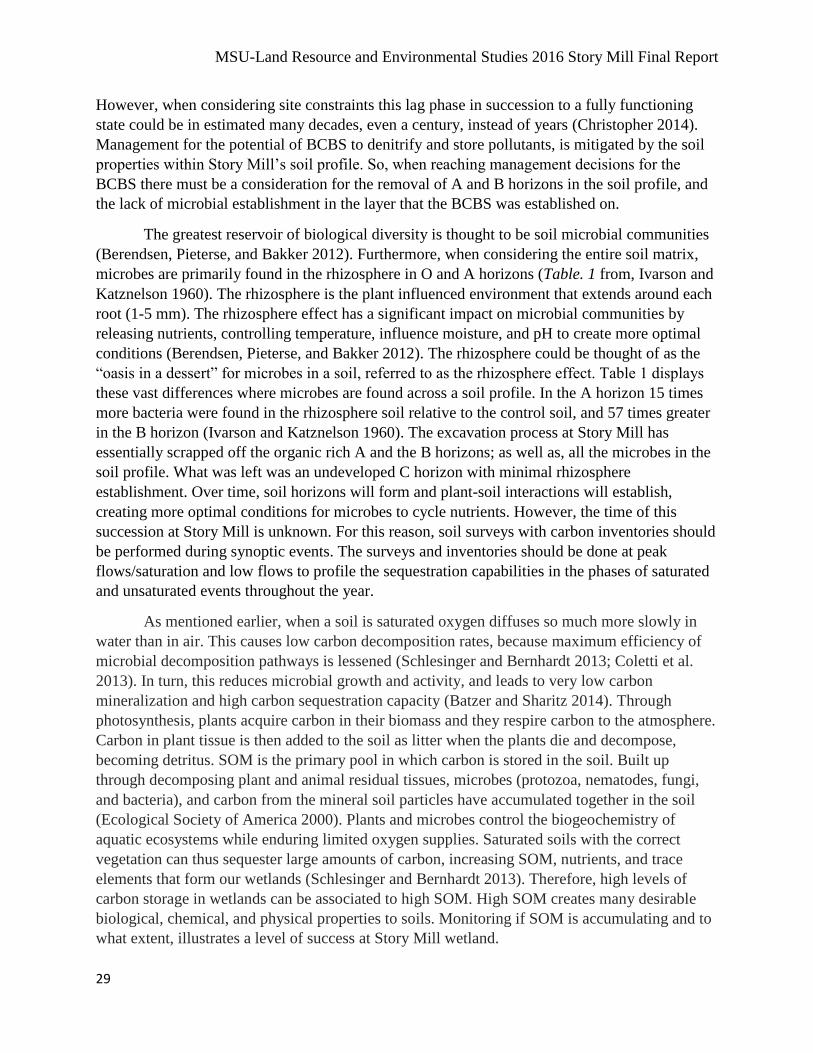
MSU-Land Resource and Environmental Studies 2016 Story Mill Final Report
29
However, when considering site constraints this lag phase in succession to a fully functioning
state could be in estimated many decades, even a century, instead of years (Christopher 2014).
Management for the potential of BCBS to denitrify and store pollutants, is mitigated by the soil
properties within Story Mill’s soil profile. So, when reaching management decisions for the
BCBS there must be a consideration for the removal of A and B horizons in the soil profile, and
the lack of microbial establishment in the layer that the BCBS was established on.
The greatest reservoir of biological diversity is thought to be soil microbial communities
(Berendsen, Pieterse, and Bakker 2012). Furthermore, when considering the entire soil matrix,
microbes are primarily found in the rhizosphere in O and A horizons (Table. 1 from, Ivarson and
Katznelson 1960). The rhizosphere is the plant influenced environment that extends around each
root (1-5 mm). The rhizosphere effect has a significant impact on microbial communities by
releasing nutrients, controlling temperature, influence moisture, and pH to create more optimal
conditions (Berendsen, Pieterse, and Bakker 2012). The rhizosphere could be thought of as the
“oasis in a dessert” for microbes in a soil, referred to as the rhizosphere effect. Table 1 displays
these vast differences where microbes are found across a soil profile. In the A horizon 15 times
more bacteria were found in the rhizosphere soil relative to the control soil, and 57 times greater
in the B horizon (Ivarson and Katznelson 1960). The excavation process at Story Mill has
essentially scrapped off the organic rich A and the B horizons; as well as, all the microbes in the
soil profile. What was left was an undeveloped C horizon with minimal rhizosphere
establishment. Over time, soil horizons will form and plant-soil interactions will establish,
creating more optimal conditions for microbes to cycle nutrients. However, the time of this
succession at Story Mill is unknown. For this reason, soil surveys with carbon inventories should
be performed during synoptic events. The surveys and inventories should be done at peak
flows/saturation and low flows to profile the sequestration capabilities in the phases of saturated
and unsaturated events throughout the year.
As mentioned earlier, when a soil is saturated oxygen diffuses so much more slowly in
water than in air. This causes low carbon decomposition rates, because maximum efficiency of
microbial decomposition pathways is lessened (Schlesinger and Bernhardt 2013; Coletti et al.
2013). In turn, this reduces microbial growth and activity, and leads to very low carbon
mineralization and high carbon sequestration capacity (Batzer and Sharitz 2014). Through
photosynthesis, plants acquire carbon in their biomass and they respire carbon to the atmosphere.
Carbon in plant tissue is then added to the soil as litter when the plants die and decompose,
becoming detritus. SOM is the primary pool in which carbon is stored in the soil. Built up
through decomposing plant and animal residual tissues, microbes (protozoa, nematodes, fungi,
and bacteria), and carbon from the mineral soil particles have accumulated together in the soil
(Ecological Society of America 2000). Plants and microbes control the biogeochemistry of
aquatic ecosystems while enduring limited oxygen supplies. Saturated soils with the correct
vegetation can thus sequester large amounts of carbon, increasing SOM, nutrients, and trace
elements that form our wetlands (Schlesinger and Bernhardt 2013). Therefore, high levels of
carbon storage in wetlands can be associated to high SOM. High SOM creates many desirable
biological, chemical, and physical properties to soils. Monitoring if SOM is accumulating and to
what extent, illustrates a level of success at Story Mill wetland.
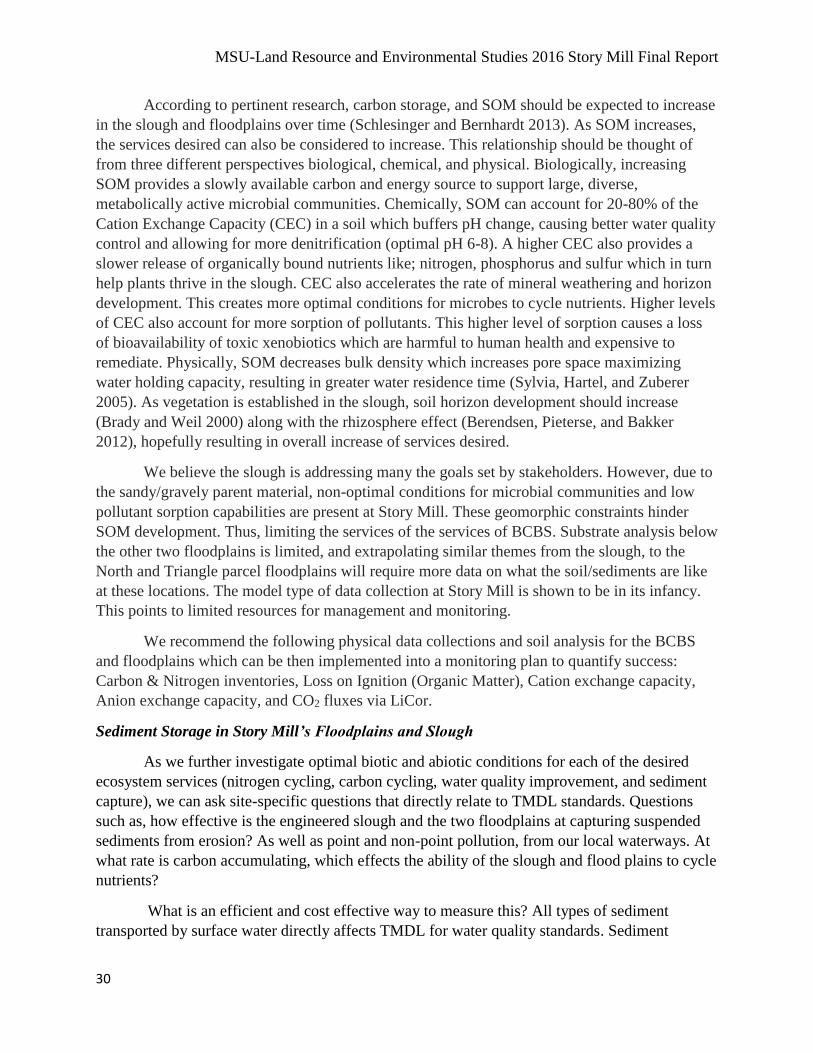
MSU-Land Resource and Environmental Studies 2016 Story Mill Final Report
30
According to pertinent research, carbon storage, and SOM should be expected to increase
in the slough and floodplains over time (Schlesinger and Bernhardt 2013). As SOM increases,
the services desired can also be considered to increase. This relationship should be thought of
from three different perspectives biological, chemical, and physical. Biologically, increasing
SOM provides a slowly available carbon and energy source to support large, diverse,
metabolically active microbial communities. Chemically, SOM can account for 20-80% of the
Cation Exchange Capacity (CEC) in a soil which buffers pH change, causing better water quality
control and allowing for more denitrification (optimal pH 6-8). A higher CEC also provides a
slower release of organically bound nutrients like; nitrogen, phosphorus and sulfur which in turn
help plants thrive in the slough. CEC also accelerates the rate of mineral weathering and horizon
development. This creates more optimal conditions for microbes to cycle nutrients. Higher levels
of CEC also account for more sorption of pollutants. This higher level of sorption causes a loss
of bioavailability of toxic xenobiotics which are harmful to human health and expensive to
remediate. Physically, SOM decreases bulk density which increases pore space maximizing
water holding capacity, resulting in greater water residence time (Sylvia, Hartel, and Zuberer
2005). As vegetation is established in the slough, soil horizon development should increase
(Brady and Weil 2000) along with the rhizosphere effect (Berendsen, Pieterse, and Bakker
2012), hopefully resulting in overall increase of services desired.
We believe the slough is addressing many the goals set by stakeholders. However, due to
the sandy/gravely parent material, non-optimal conditions for microbial communities and low
pollutant sorption capabilities are present at Story Mill. These geomorphic constraints hinder
SOM development. Thus, limiting the services of the services of BCBS. Substrate analysis below
the other two floodplains is limited, and extrapolating similar themes from the slough, to the
North and Triangle parcel floodplains will require more data on what the soil/sediments are like
at these locations. The model type of data collection at Story Mill is shown to be in its infancy.
This points to limited resources for management and monitoring.
We recommend the following physical data collections and soil analysis for the BCBS
and floodplains which can be then implemented into a monitoring plan to quantify success:
Carbon & Nitrogen inventories, Loss on Ignition (Organic Matter), Cation exchange capacity,
Anion exchange capacity, and CO2 fluxes via LiCor.
Sediment Storage in Story Mill’s Floodplains and Slough
As we further investigate optimal biotic and abiotic conditions for each of the desired
ecosystem services (nitrogen cycling, carbon cycling, water quality improvement, and sediment
capture), we can ask site-specific questions that directly relate to TMDL standards. Questions
such as, how effective is the engineered slough and the two floodplains at capturing suspended
sediments from erosion? As well as point and non-point pollution, from our local waterways. At
what rate is carbon accumulating, which effects the ability of the slough and flood plains to cycle
nutrients?
What is an efficient and cost effective way to measure this? All types of sediment
transported by surface water directly affects TMDL for water quality standards. Sediment
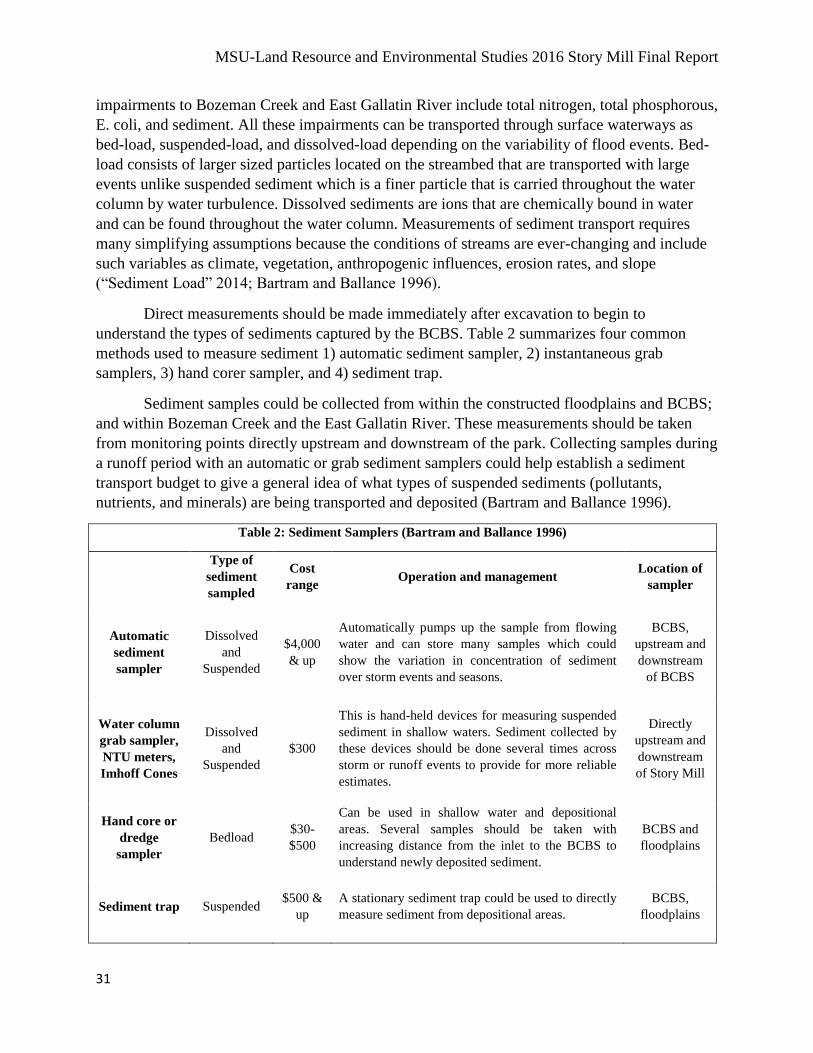
MSU-Land Resource and Environmental Studies 2016 Story Mill Final Report
31
impairments to Bozeman Creek and East Gallatin River include total nitrogen, total phosphorous,
E. coli, and sediment. All these impairments can be transported through surface waterways as
bed-load, suspended-load, and dissolved-load depending on the variability of flood events. Bed-
load consists of larger sized particles located on the streambed that are transported with large
events unlike suspended sediment which is a finer particle that is carried throughout the water
column by water turbulence. Dissolved sediments are ions that are chemically bound in water
and can be found throughout the water column. Measurements of sediment transport requires
many simplifying assumptions because the conditions of streams are ever-changing and include
such variables as climate, vegetation, anthropogenic influences, erosion rates, and slope
(“Sediment Load” 2014; Bartram and Ballance 1996).
Direct measurements should be made immediately after excavation to begin to
understand the types of sediments captured by the BCBS. Table 2 summarizes four common
methods used to measure sediment 1) automatic sediment sampler, 2) instantaneous grab
samplers, 3) hand corer sampler, and 4) sediment trap.
Sediment samples could be collected from within the constructed floodplains and BCBS;
and within Bozeman Creek and the East Gallatin River. These measurements should be taken
from monitoring points directly upstream and downstream of the park. Collecting samples during
a runoff period with an automatic or grab sediment samplers could help establish a sediment
transport budget to give a general idea of what types of suspended sediments (pollutants,
nutrients, and minerals) are being transported and deposited (Bartram and Ballance 1996).
Table 2: Sediment Samplers (Bartram and Ballance 1996)
Type of
sediment
sampled
Cost
range Operation and management
Location of
sampler
Automatic
sediment
sampler
Dissolved
and
Suspended
$4,000
& up
Automatically pumps up the sample from flowing
water and can store many samples which could
show the variation in concentration of sediment
over storm events and seasons.
BCBS,
upstream and
downstream
of BCBS
Water column
grab sampler,
NTU meters,
Imhoff Cones
Dissolved
and
Suspended
$300
This is hand-held devices for measuring suspended
sediment in shallow waters. Sediment collected by
these devices should be done several times across
storm or runoff events to provide for more reliable
estimates.
Directly
upstream and
downstream
of Story Mill
Hand core or
dredge
sampler
Bedload $30-
$500
Can be used in shallow water and depositional
areas. Several samples should be taken with
increasing distance from the inlet to the BCBS to
understand newly deposited sediment.
BCBS and
floodplains
Sediment trap Suspended $500 &
up
A stationary sediment trap could be used to directly
measure sediment from depositional areas.
BCBS,
floodplains
MSU-Land Resource and Environmental Studies 2016 Story Mill Final Report
32
These devices are relatively inexpensive but require many hours to maintain the
equipment, collect the data, analyze sediment material, manage sediment traps, and manage
sloughs. Collaboration with Montana State University students helps to minimize the cost of
these measurements and provide a ‘hands on’ learning experience. It is important to collect this
type of data as soon as possible, and most likely for the next several years so there could be
strong correlations to management, effectiveness, and design of the restoration. With quality data
objectives met specific stakeholder questions would be answered more accurately.
Perception of Success and Concluding Thoughts
Does the management at Story Mill restoration serve for wetland ecosystem functions
and services? For the stakeholders, is the current level of monitoring and management
acceptable? How accurately are management efforts being implemented at Story Mill?
TPL would like to incorporate a living classroom project. This project envisions, “Story
Mill Community Park as a destination for community members, visitors, researchers, teachers,
students, and families to explore nature and learn about the importance of protecting water,
wetlands and streams in our urban areas.” This vision goes a bit further, by placing a long-term
stream and groundwater-monitoring plan. During the past two years, TPL has been partnered
with the Greater Gallatin Watershed Council (GGWC) and conducted a ground and stream water
monitoring on site. These efforts were performed with funding from the DEQ Wetlands
Program, to help understand groundwater movement (Trust for Public Land 2014). With a
‘living classroom’ TPL has come up with creative ways of collecting data and involving the local
community. If the community develops a strong relationship to Story Mill’s wetlands, then the
level of success will reach a shared perception in Bozeman.
Seniors in Land Resource and Environmental Science department, within the College of
Agriculture, at MSU were presented a unique opportunity during the Fall of 2016 to view the
extent of restoration efforts at Story Mill. This example of outreach shows that collaborative
efforts with MSU and the Gallatin community is incorporating available resources creatively,
and at a low cost to build capacity and share a vision for long-term monitoring (Trust for Public
Land 2014). Through the DEQ’s 319-grant program, the GGWC has secured funding for
continued ground and stream water monitoring at the Story Mill site through the 2017 season
(Respec Consulting & Services 2014). Synoptic monitoring provides a before, during, and after
record of restoration impacts, and thus influences the perceived level of success. The TPL will
gather information to inform restoration assessment. Long-term monitoring will show how
resource management on Story Mill is reacting for the desired ecosystem services. Monitoring is
crucial when considering a future for this restoration; the continued long-term monitoring
depends on a high level of sustained commitment, capacity, and resources used by stakeholders.
Story Mill’s monitoring will help stakeholders to discern if the best management practices were
successful. Currently, it appears that the results are beginning to coincide with the stakeholder’s
goals. This level of success is due, in part, to the established collaborative outreach and
commitment within the City of Bozeman.
MSU-Land Resource and Environmental Studies 2016 Story Mill Final Report
33
References:
Adger, W. Neil, and Cecilia Luttrell. 2000. “Property Rights and the Utilization of Wetlands.”
Ecological Economics 35 (1): 75–89.
Bartram, Jamie, and Richard Ballance. 1996. Water Quality Monitoring: A Practical Guide to
the Design and Implementation of Freshwater Quality Studies and Monitoring Programmes.
London, UK: CRC Press.
Batzer, Darold P., and Rebecca R. Sharitz. 2014. Ecology of Freshwater and Estuarine
Wetlands. Oakland, California: Univ of California Press.
Berendsen, Roeland L., Corne MJ Pieterse, and Peter AHM Bakker. 2012. “The Rhizosphere
Microbiome and Plant Health.” Trends in Plant Science 17 (8): 478–486.
Brady, Nyle, and Ray Weil. 2000. Elements of the Nature and Properties of Soils. Student Value
Edition. Upper Saddle River: Pearson.
Buscot, François, and Ajit Varma. 2005. Microorganisms in Soils: Roles in Genesis and
Functions. New York: Springer.
Canfield, Donald Eugene, and Bo Thamdrup. 2009. “Towards a Consistent Classification
Scheme for Geochemical Environments, Or, Why We Wish the Term ‘suboxic’would Go
Away.” Geobiology 7 (4): 385–392.
Christopher, Craft. 2014. “Soils As an Integrator of Wetland Structure and Function Following
Restoration.”
Coletti, Janaine Z., Christoph Hinz, Ryan Vogwill, and Matthew R. Hipsey. 2013. “Hydrological
Controls on Carbon Metabolism in Wetlands.” Ecological Modelling 249: 3–18.
Dahl, Thomas E. 1990. “Wetlands Losses in the United States, 1780’s to 1980’s. Report to the
Congress.” National Wetlands Inventory, St. Petersburg, FL (USA).
Deford, Lily. 2015. “Monitoring Natural Wetland Restoration Impacts on Hydrology and Water
Quality.” Montana State University. Center for Biofilm Engineering.
Ecological Society of America. 2000. “Carbon Sequestration in Soils.”
Falk, Donald A., Margaret A. Palmer, Joy B. Zedler, and others. 2006. Foundations of
Restoration Ecology. Washington, D.C.: Island Press Washington, DC.
Gardner, Royal C., Stefano Barchiesi, Coralie Beltrame, C. M. Finlayson, Thomas Galewski, Ian
Harrison, Marc Paganini, et al. 2015. “State of the World’s Wetlands and Their Services to
People: A Compilation of Recent Analyses.”
Gottschalk, Gerhard. 2012. Bacterial Metabolism. London, UK: Springer Science & Business
Media.
Ivarson, K. C., and H. Katznelson. 1960. “Studies on the Rhizosphere Microflora of Yellow
Birch Seedlings.” Plant and Soil 12 (1): 30–40.
Kramer, Courtney. 2014. “The Significance of Topography, Water Power, and Transportation to
the History of Story Mill.”
Lonn, Jeffrey D., and Alan R. English. 2002. Preliminary Geologic Map of the Eastern Part of
the Gallatin Valley, Montana. Butte, MT: Montana Bureau of Mines and Geology.
Mitsch, William J., and James G. Gosselink. 2000. “The Value of Wetlands: Importance of Scale
and Landscape Setting.” Ecological Economics 35 (1): 25–33.
Reddy, K. R., and W. H. Patrick. 1975. “Effect of Alternate Aerobic and Anaerobic Conditions
on Redox Potential, Organic Matter Decomposition and Nitrogen Loss in a Flooded Soil.”
Soil Biology and Biochemistry 7 (2): 87–94.
Respec Consulting & Services. 2014. “Story Mill Ecological Restoration, Final Plan.” Trust for
Public Land. http://www.respec.comhttp://www.respec.com/.
MSU-Land Resource and Environmental Studies 2016 Story Mill Final Report
34
———. 2015. “Story Mill Ecological Phase 1 Construction Photo Journal Summary.” Trust for
Public Land. http://www.respec.comhttp://www.respec.com/.
Schlesinger, William H., and Emily S. Bernhardt. 2013. Biogeochemistry: An Analysis of Global
Change. 3rd ed. Croydon, UK: Academic Press Publications.
“Sediment Load.” 2014. In Encyclopedia of Environmental Change, by John A. Matthews. 2455
Teller Road, Thousand Oaks, California 91320: SAGE Publications, Ltd.
Sylvia, David, M., Peter Hartel G., and David Zuberer A. 2005. Principles and Applications of
Soil Microbiology. Upper Saddle River, NJ: Pearson Education Inc.
Trust for Public Land. 2014. “Story Mill Ecological Restoration Project Description.”
www.tpl.org/storymillhttp://www.tpl.org/storymill.
MSU-Land Resource and Environmental Studies 2016 Story Mill Final Report
35
The assignment of riparian buffer zone pollution
attenuation in the Gallatin Valley
Benjamin M. Farrick, Edward M. Johnson
Introduction
The City of Bozeman, Montana is currently experiencing dramatic population growth –
from 28,000 inhabitants to almost 40,000 between 2000 and 2013. This type of growth is
associated with increasing urban development in formerly agricultural or natural areas; the boom
has provided an opportunity for the community to actively guide the development of this
burgeoning city and promote sustainable and eco-friendly urban areas. Located at the headwaters
of the Missouri River system, water quality is an obvious concern for Bozeman and downstream
communities; the US Environmental Protection Agency (USEPA) already considers two of the
watersheds that encompass Bozeman to be impaired. With increasing urban development, we
will likely see increases in pollution from point and non-point sources, which can contribute up
to a third of the annual pollution load in urban stream environments (Ellis 1991). The East
Gallatin River and Bozeman Creek watersheds contribute to drinking water sources for
downstream towns, and are fed by streams coming from both the Bridger and Gallatin mountain
ranges. These streams are also known to be impaired for both recreation and aquatic life due to
excess nutrients in the form of nitrogen, phosphorus, and sediment. Some fraction of this
impairment stems from urban related runoff and stormwater, as well as municipal sewage
effluence (EPA 2016). This type of pollution is not unique to Bozeman, or even the US, the
Scottish EPA in a 1996 study indicated that 20% of all water quality failures are due to urban
non-point sources (Scotland EPA 2016). Clearly, identifying these non-point pollution sources
and mitigating their effect on water quality is essential to maintaining waters in compliance with
the Clean Water Act (CWA) - Section 319 that mandates that states address nonpoint source
pollutants during their assessment of waters and the development of Total Maximum Daily Load
(TMDL) criteria.
Reconciling the need for increased housing and development with a need to maintain
high water quality for downstream users falls onto the City, which must take measures to reduce
impairment in the East Gallatin and Bozeman Creek catchments, as well as strive to fall below
TMDL requirements set forth by the state, with Federal guidance. One of the tools at the City’s
disposal is zoning regulation - all of which are laid out in the Bozeman Municipal Code (BMC).
Maintaining water quality - and natural spaces - during accelerated urban growth are challenges,
but ones that may be simultaneously addressed by the consideration of riverine wetlands in the
context of zoning regulation.
Urban surface water runoff is strongly correlated with elevated amounts of pollution and
can be calculated as a function of impervious surfaces (Taebi and Droste 2004). Bozeman has a
well-documented GIS-based record of impermeable surfaces inside the study area. It is with this
information we hope to establish a relationship of runoff pollution entering into the East Gallatin
and Bozeman Creeks as a function of these impermeable surfaces, sorted by municipal zoning
type. Once this relationship between impervious surface and each zoning type has been
established, we can recommend the capacity of the valley to support additional growth or the
magnitude of measures needed in anticipation of future development with regards to existing
natural and potential constructed wetlands.
MSU-Land Resource and Environmental Studies 2016 Story Mill Final Report
36
Riparian corridors and wetlands are known to attenuate nitrogen, phosphorus and
sediment runoff (Lee, Isenhart, and Schultz 2003; Mitsch et al. 2014; Mitsch et al. 2005;
Tournebize, Chaumont, and Mander 2016). The City of Bozeman is attempting to take advantage
of these ecosystem functions to address their in-stream nutrient concentrations. The ecosystem
functions of riverine wetlands were a primary factor in improving a wetland on the northern
fringe of Bozeman – the Story Mill project. The Gallatin Valley Land Trust (GVLT) in
conjunction with the Trust for Public Land (TPL) improved wetlands in this area, which
involved installing several backwater slough areas. This project removed soil to bring
groundwater closer to the soil surface, and helped to restore the hydrology of the area by
converting a detention pond to a more natural pond with an outflow. However, there is riparian
ecosystem throughout Bozeman’s contributing watersheds that already provide this ecological
service. How do we quantitatively assess the benefit of riparian areas around Bozeman? Will
they continue to provide measurable benefit once the City becomes highly developed? This
paper seeks to answer those questions with the support of relevant literature and a quantitative
assessment of the potential reduction of non-point pollutants by riparian areas in the upper East
Gallatin River and Bozeman Creek watersheds (see appendix 1a – watershed boundaries).
Background
Non-point source urban runoff
Watersheds that experience urbanization are characterized with increases in impervious
surfaces and stream channelization (Taebi and Droste 2004). Inside these urban watersheds, the
majority of pollutants that enter stream flow do so during the rising limb of the storm hydrograph
- which is known as the first flush effect (Cordery 1977; Hathaway et al. 2012). Contributing to
this is the high channelization found in urban environments from storm sewers and culverts,
combined with large areas of impervious surfaces that provide little to no stormwater signal
attenuation (Mannina and Viviani 2010). The effect of this alteration is that non-point pollutants
in urban environments are unlikely to be intercepted by wetlands before entering streams. Unlike
point sources, the diffuse nature of impervious surface runoff makes identifying and quantifying
this effect difficult. In Bozeman, stormwater runoff has led to TMDL requirements for the East
Gallatin River being exceeded for nitrogen and sediments. Possible countermeasures that can be
enacted in Bozeman are a combination of additional constructed wetlands – similar to Story Mill
- and development of different zoning laws that recognize surface runoff is not intercepted in
many urban developments. Currently, Bozeman only has wetland protection that is required by
the standards of the Army Corps of Engineers and the EPA in the form of building and
development setbacks. This leaves room for alterations that could reduce this effect at the cost of
development opportunities (“Mini TOC: Chapter 38 - UNIFIED DEVELOPMENT CODE |
Code of Ordinances | Bozeman, MT | Municode Library” 2016).
Current Water Quality Conditions
Table 1 outlines the current surface water quality condition of the East Gallatin River and
Bozeman Creek as well as their TMDL Limits, and whether or not each stream meets those
limits.
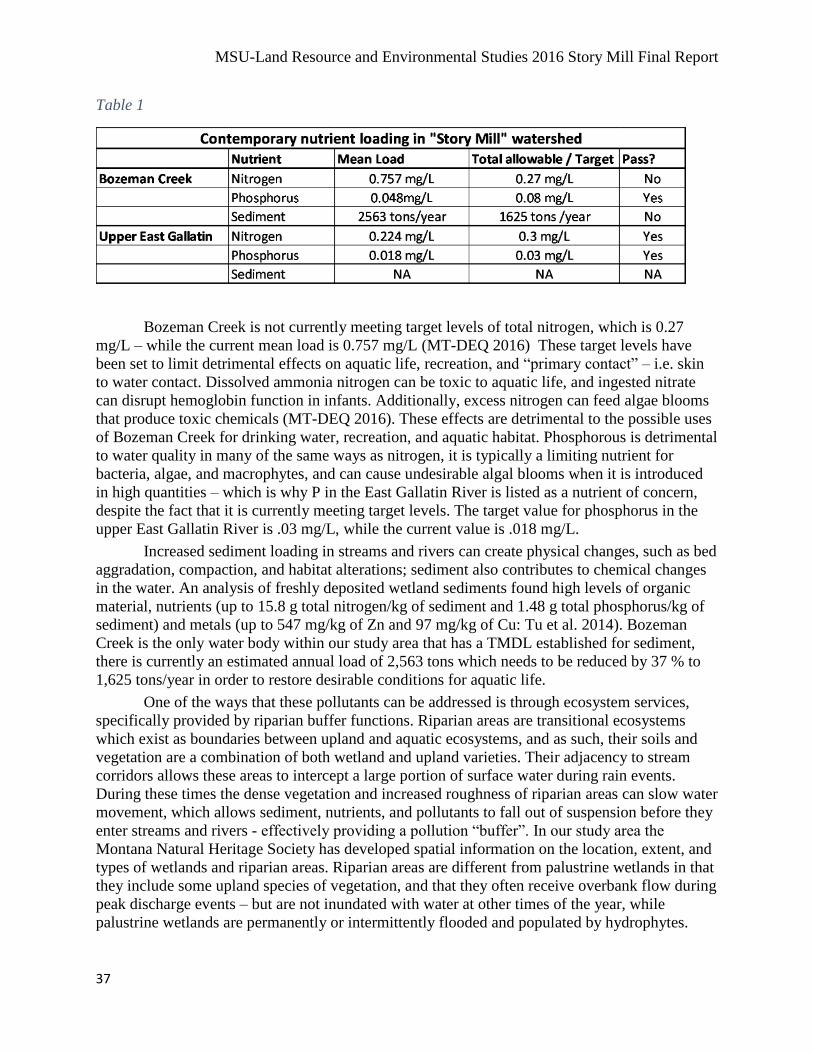
MSU-Land Resource and Environmental Studies 2016 Story Mill Final Report
37
Table 1
Bozeman Creek is not currently meeting target levels of total nitrogen, which is 0.27
mg/L – while the current mean load is 0.757 mg/L (MT-DEQ 2016) These target levels have
been set to limit detrimental effects on aquatic life, recreation, and “primary contact” – i.e. skin
to water contact. Dissolved ammonia nitrogen can be toxic to aquatic life, and ingested nitrate
can disrupt hemoglobin function in infants. Additionally, excess nitrogen can feed algae blooms
that produce toxic chemicals (MT-DEQ 2016). These effects are detrimental to the possible uses
of Bozeman Creek for drinking water, recreation, and aquatic habitat. Phosphorous is detrimental
to water quality in many of the same ways as nitrogen, it is typically a limiting nutrient for
bacteria, algae, and macrophytes, and can cause undesirable algal blooms when it is introduced
in high quantities – which is why P in the East Gallatin River is listed as a nutrient of concern,
despite the fact that it is currently meeting target levels. The target value for phosphorus in the
upper East Gallatin River is .03 mg/L, while the current value is .018 mg/L.
Increased sediment loading in streams and rivers can create physical changes, such as bed
aggradation, compaction, and habitat alterations; sediment also contributes to chemical changes
in the water. An analysis of freshly deposited wetland sediments found high levels of organic
material, nutrients (up to 15.8 g total nitrogen/kg of sediment and 1.48 g total phosphorus/kg of
sediment) and metals (up to 547 mg/kg of Zn and 97 mg/kg of Cu: Tu et al. 2014). Bozeman
Creek is the only water body within our study area that has a TMDL established for sediment,
there is currently an estimated annual load of 2,563 tons which needs to be reduced by 37 % to
1,625 tons/year in order to restore desirable conditions for aquatic life.
One of the ways that these pollutants can be addressed is through ecosystem services,
specifically provided by riparian buffer functions. Riparian areas are transitional ecosystems
which exist as boundaries between upland and aquatic ecosystems, and as such, their soils and
vegetation are a combination of both wetland and upland varieties. Their adjacency to stream
corridors allows these areas to intercept a large portion of surface water during rain events.
During these times the dense vegetation and increased roughness of riparian areas can slow water
movement, which allows sediment, nutrients, and pollutants to fall out of suspension before they
enter streams and rivers - effectively providing a pollution “buffer”. In our study area the
Montana Natural Heritage Society has developed spatial information on the location, extent, and
types of wetlands and riparian areas. Riparian areas are different from palustrine wetlands in that
they include some upland species of vegetation, and that they often receive overbank flow during
peak discharge events – but are not inundated with water at other times of the year, while
palustrine wetlands are permanently or intermittently flooded and populated by hydrophytes.
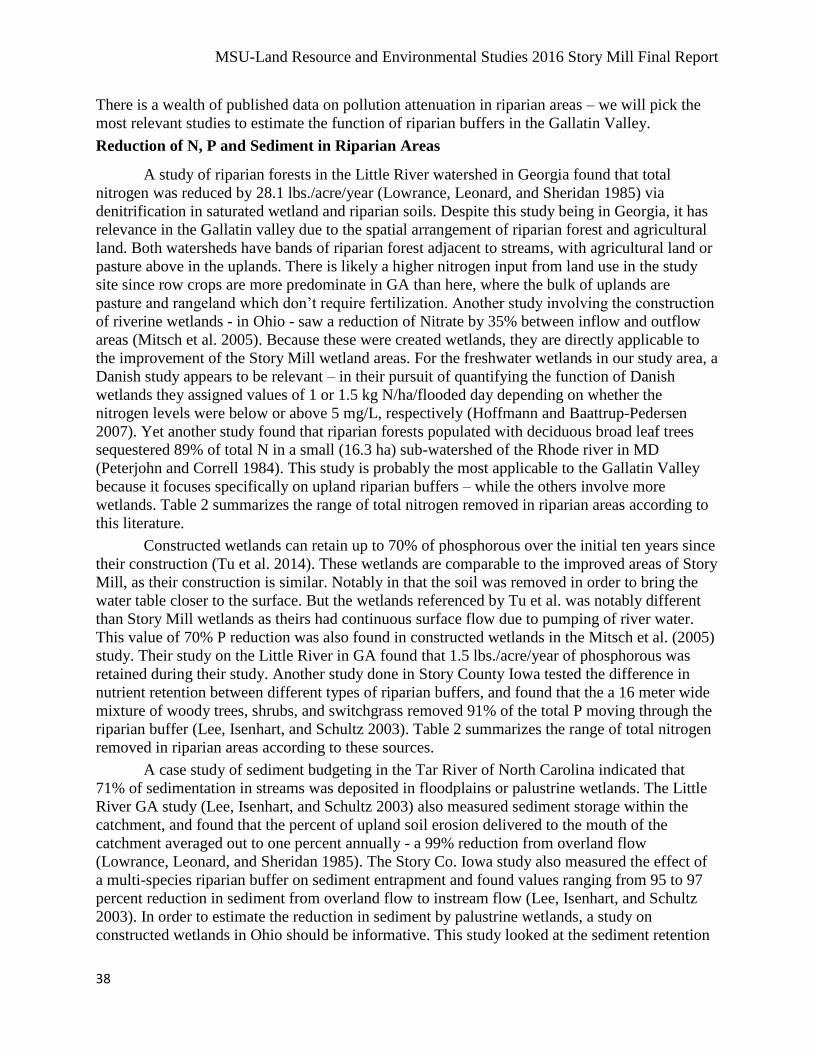
MSU-Land Resource and Environmental Studies 2016 Story Mill Final Report
38
There is a wealth of published data on pollution attenuation in riparian areas – we will pick the
most relevant studies to estimate the function of riparian buffers in the Gallatin Valley.
Reduction of N, P and Sediment in Riparian Areas
A study of riparian forests in the Little River watershed in Georgia found that total
nitrogen was reduced by 28.1 lbs./acre/year (Lowrance, Leonard, and Sheridan 1985) via
denitrification in saturated wetland and riparian soils. Despite this study being in Georgia, it has
relevance in the Gallatin valley due to the spatial arrangement of riparian forest and agricultural
land. Both watersheds have bands of riparian forest adjacent to streams, with agricultural land or
pasture above in the uplands. There is likely a higher nitrogen input from land use in the study
site since row crops are more predominate in GA than here, where the bulk of uplands are
pasture and rangeland which don’t require fertilization. Another study involving the construction
of riverine wetlands - in Ohio - saw a reduction of Nitrate by 35% between inflow and outflow
areas (Mitsch et al. 2005). Because these were created wetlands, they are directly applicable to
the improvement of the Story Mill wetland areas. For the freshwater wetlands in our study area, a
Danish study appears to be relevant – in their pursuit of quantifying the function of Danish
wetlands they assigned values of 1 or 1.5 kg N/ha/flooded day depending on whether the
nitrogen levels were below or above 5 mg/L, respectively (Hoffmann and Baattrup-Pedersen
2007). Yet another study found that riparian forests populated with deciduous broad leaf trees
sequestered 89% of total N in a small (16.3 ha) sub-watershed of the Rhode river in MD
(Peterjohn and Correll 1984). This study is probably the most applicable to the Gallatin Valley
because it focuses specifically on upland riparian buffers – while the others involve more
wetlands. Table 2 summarizes the range of total nitrogen removed in riparian areas according to
this literature.
Constructed wetlands can retain up to 70% of phosphorous over the initial ten years since
their construction (Tu et al. 2014). These wetlands are comparable to the improved areas of Story
Mill, as their construction is similar. Notably in that the soil was removed in order to bring the
water table closer to the surface. But the wetlands referenced by Tu et al. was notably different
than Story Mill wetlands as theirs had continuous surface flow due to pumping of river water.
This value of 70% P reduction was also found in constructed wetlands in the Mitsch et al. (2005)
study. Their study on the Little River in GA found that 1.5 lbs./acre/year of phosphorous was
retained during their study. Another study done in Story County Iowa tested the difference in
nutrient retention between different types of riparian buffers, and found that the a 16 meter wide
mixture of woody trees, shrubs, and switchgrass removed 91% of the total P moving through the
riparian buffer (Lee, Isenhart, and Schultz 2003). Table 2 summarizes the range of total nitrogen
removed in riparian areas according to these sources.
A case study of sediment budgeting in the Tar River of North Carolina indicated that
71% of sedimentation in streams was deposited in floodplains or palustrine wetlands. The Little
River GA study (Lee, Isenhart, and Schultz 2003) also measured sediment storage within the
catchment, and found that the percent of upland soil erosion delivered to the mouth of the
catchment averaged out to one percent annually - a 99% reduction from overland flow
(Lowrance, Leonard, and Sheridan 1985). The Story Co. Iowa study also measured the effect of
a multi-species riparian buffer on sediment entrapment and found values ranging from 95 to 97
percent reduction in sediment from overland flow to instream flow (Lee, Isenhart, and Schultz
2003). In order to estimate the reduction in sediment by palustrine wetlands, a study on
constructed wetlands in Ohio should be informative. This study looked at the sediment retention
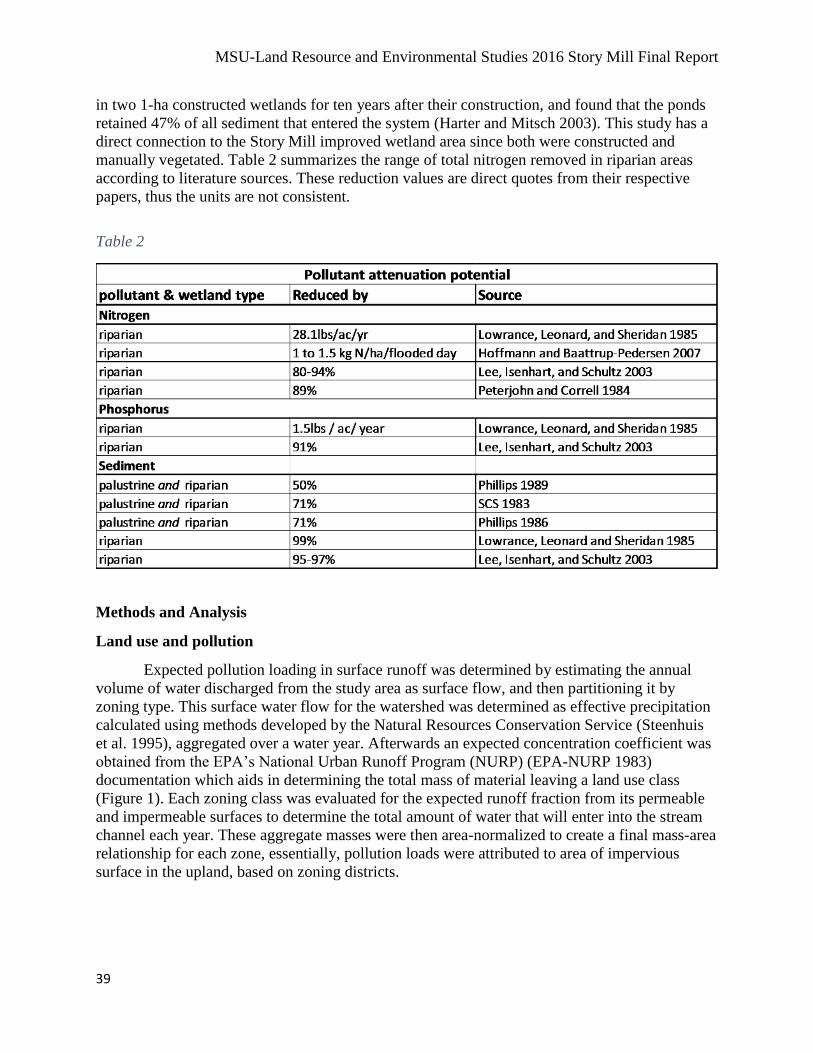
MSU-Land Resource and Environmental Studies 2016 Story Mill Final Report
39
in two 1-ha constructed wetlands for ten years after their construction, and found that the ponds
retained 47% of all sediment that entered the system (Harter and Mitsch 2003). This study has a
direct connection to the Story Mill improved wetland area since both were constructed and
manually vegetated. Table 2 summarizes the range of total nitrogen removed in riparian areas
according to literature sources. These reduction values are direct quotes from their respective
papers, thus the units are not consistent.
Table 2
Methods and Analysis
Land use and pollution
Expected pollution loading in surface runoff was determined by estimating the annual
volume of water discharged from the study area as surface flow, and then partitioning it by
zoning type. This surface water flow for the watershed was determined as effective precipitation
calculated using methods developed by the Natural Resources Conservation Service (Steenhuis
et al. 1995), aggregated over a water year. Afterwards an expected concentration coefficient was
obtained from the EPA’s National Urban Runoff Program (NURP) (EPA-NURP 1983)
documentation which aids in determining the total mass of material leaving a land use class
(Figure 1). Each zoning class was evaluated for the expected runoff fraction from its permeable
and impermeable surfaces to determine the total amount of water that will enter into the stream
channel each year. These aggregate masses were then area-normalized to create a final mass-area
relationship for each zone, essentially, pollution loads were attributed to area of impervious
surface in the upland, based on zoning districts.
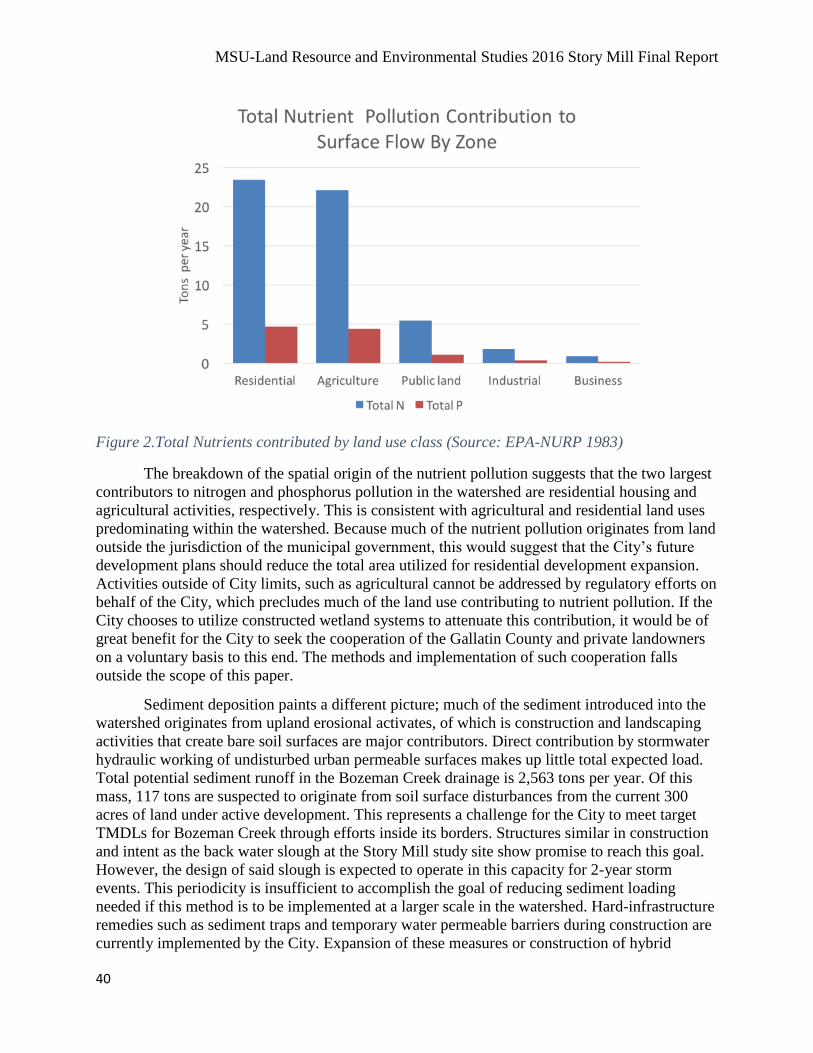
MSU-Land Resource and Environmental Studies 2016 Story Mill Final Report
40
Figure 2.Total Nutrients contributed by land use class (Source: EPA-NURP 1983)
The breakdown of the spatial origin of the nutrient pollution suggests that the two largest
contributors to nitrogen and phosphorus pollution in the watershed are residential housing and
agricultural activities, respectively. This is consistent with agricultural and residential land uses
predominating within the watershed. Because much of the nutrient pollution originates from land
outside the jurisdiction of the municipal government, this would suggest that the City’s future
development plans should reduce the total area utilized for residential development expansion.
Activities outside of City limits, such as agricultural cannot be addressed by regulatory efforts on
behalf of the City, which precludes much of the land use contributing to nutrient pollution. If the
City chooses to utilize constructed wetland systems to attenuate this contribution, it would be of
great benefit for the City to seek the cooperation of the Gallatin County and private landowners
on a voluntary basis to this end. The methods and implementation of such cooperation falls
outside the scope of this paper.
Sediment deposition paints a different picture; much of the sediment introduced into the
watershed originates from upland erosional activates, of which is construction and landscaping
activities that create bare soil surfaces are major contributors. Direct contribution by stormwater
hydraulic working of undisturbed urban permeable surfaces makes up little total expected load.
Total potential sediment runoff in the Bozeman Creek drainage is 2,563 tons per year. Of this
mass, 117 tons are suspected to originate from soil surface disturbances from the current 300
acres of land under active development. This represents a challenge for the City to meet target
TMDLs for Bozeman Creek through efforts inside its borders. Structures similar in construction
and intent as the back water slough at the Story Mill study site show promise to reach this goal.
However, the design of said slough is expected to operate in this capacity for 2-year storm
events. This periodicity is insufficient to accomplish the goal of reducing sediment loading
needed if this method is to be implemented at a larger scale in the watershed. Hard-infrastructure
remedies such as sediment traps and temporary water permeable barriers during construction are
currently implemented by the City. Expansion of these measures or construction of hybrid
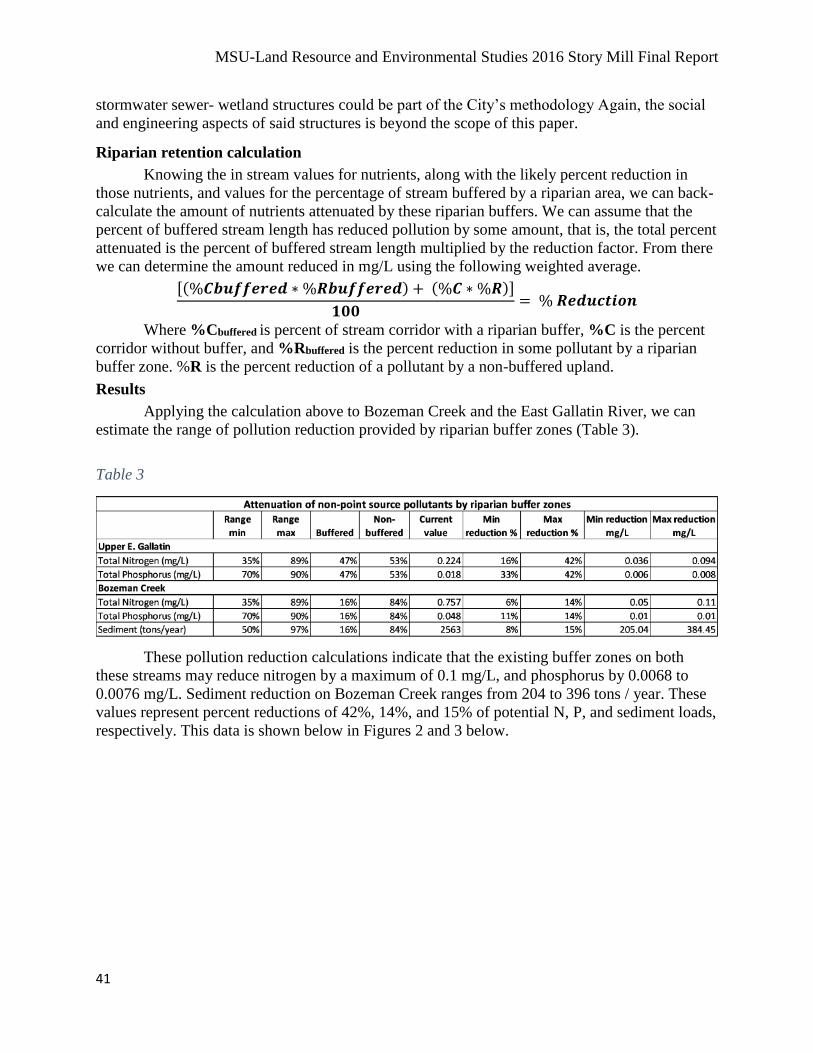
MSU-Land Resource and Environmental Studies 2016 Story Mill Final Report
41
stormwater sewer- wetland structures could be part of the City’s methodology Again, the social
and engineering aspects of said structures is beyond the scope of this paper.
Riparian retention calculation
Knowing the in stream values for nutrients, along with the likely percent reduction in
those nutrients, and values for the percentage of stream buffered by a riparian area, we can back-
calculate the amount of nutrients attenuated by these riparian buffers. We can assume that the
percent of buffered stream length has reduced pollution by some amount, that is, the total percent
attenuated is the percent of buffered stream length multiplied by the reduction factor. From there
we can determine the amount reduced in mg/L using the following weighted average.
[(%𝑪𝒃𝒖𝒇𝒇𝒆𝒓𝒆𝒅 ∗ %𝑹𝒃𝒖𝒇𝒇𝒆𝒓𝒆𝒅) + (%𝑪 ∗ %𝑹)]
𝟏𝟎𝟎= % 𝑹𝒆𝒅𝒖𝒄𝒕𝒊𝒐𝒏
Where %Cbuffered is percent of stream corridor with a riparian buffer, %C is the percent
corridor without buffer, and %Rbuffered is the percent reduction in some pollutant by a riparian
buffer zone. %R is the percent reduction of a pollutant by a non-buffered upland.
Results
Applying the calculation above to Bozeman Creek and the East Gallatin River, we can
estimate the range of pollution reduction provided by riparian buffer zones (Table 3).
Table 3
These pollution reduction calculations indicate that the existing buffer zones on both
these streams may reduce nitrogen by a maximum of 0.1 mg/L, and phosphorus by 0.0068 to
0.0076 mg/L. Sediment reduction on Bozeman Creek ranges from 204 to 396 tons / year. These
values represent percent reductions of 42%, 14%, and 15% of potential N, P, and sediment loads,
respectively. This data is shown below in Figures 2 and 3 below.
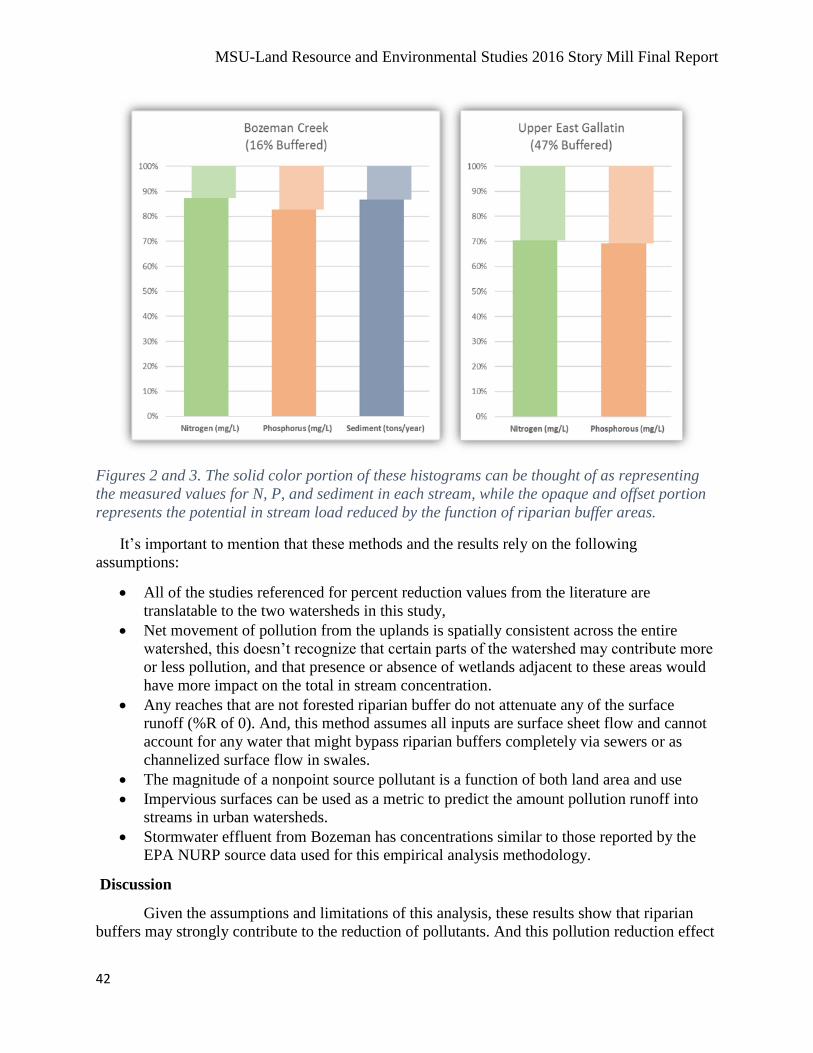
MSU-Land Resource and Environmental Studies 2016 Story Mill Final Report
42
Figures 2 and 3. The solid color portion of these histograms can be thought of as representing
the measured values for N, P, and sediment in each stream, while the opaque and offset portion
represents the potential in stream load reduced by the function of riparian buffer areas.
It’s important to mention that these methods and the results rely on the following
assumptions:
All of the studies referenced for percent reduction values from the literature are
translatable to the two watersheds in this study,
Net movement of pollution from the uplands is spatially consistent across the entire
watershed, this doesn’t recognize that certain parts of the watershed may contribute more
or less pollution, and that presence or absence of wetlands adjacent to these areas would
have more impact on the total in stream concentration.
Any reaches that are not forested riparian buffer do not attenuate any of the surface
runoff (%R of 0). And, this method assumes all inputs are surface sheet flow and cannot
account for any water that might bypass riparian buffers completely via sewers or as
channelized surface flow in swales.
The magnitude of a nonpoint source pollutant is a function of both land area and use
Impervious surfaces can be used as a metric to predict the amount pollution runoff into
streams in urban watersheds.
Stormwater effluent from Bozeman has concentrations similar to those reported by the
EPA NURP source data used for this empirical analysis methodology.
Discussion
Given the assumptions and limitations of this analysis, these results show that riparian
buffers may strongly contribute to the reduction of pollutants. And this pollution reduction effect
MSU-Land Resource and Environmental Studies 2016 Story Mill Final Report
43
is increased dramatically by the proportion of the stream which has a riparian buffer zone, as
shown in Figures 2 and 3. But, there are some limitations on the application of this model.
Observed loading in the stream have been established via monitoring by personnel in support of
the regulatory process surrounding the TMDL of the East Gallatin River and Bozeman Creek;
but the model used to predict the load contributed by the City is based on meta-analysis of
research in a wide range of locations. Each study referenced in this paper was conducted on a site
with different patterns of human behavior, geologic structure, and water regime. In the course of
a social dialogue, these results need to be interpreted within that framework. An appropriate
context to present this research is as a tool to guide stakeholders - including the general public –
to inform urban planning into the future. For example, the area immediately surrounding the
Story Mill study site is currently zoned for medium density residential. Our expectation is that
the pollution load generated during this development will produce 2.21 kilograms per acre of
sediment into an already non-compliant stream. This represents a challenge for the City to meet
target TMDLs for Bozeman Creek through efforts inside its borders. Structures similar in
construction and intent as the back water slough at the Story Mill study site show promise to
reach this goal. However, the design of said slough is expected to operate in this capacity for 2-
year storm events. This periodicity is insufficient to accomplish the goal of reducing sediment
loading needed if this method is to be implemented at a larger scale in the watershed. Hard-
infrastructure remedies such as sediment traps and temporary water permeable barriers during
construction are currently implemented by the City. Expansion of these measures or construction
of hybrid stormwater sewer- wetland structures could be part of the City’s methodology. The
City may also choose to change the zoning regulations to incorporate stormwater pollution
countermeasures like improvement of adjacent riparian buffer areas, at the expense of high value
real estate. Increasing the density of the housing created would provide developers with a higher
rate of return on their investments to offset this incurred expense, but the public may not be
willing to have high density housing going forward in Bozeman’s growth. Balancing these wants
with the need to reduce the load placed on the East Gallatin River can be better informed with
these predictions of the impacts land use has on pollution entering our rivers, and the beneficial
ecosystem services of riparian areas.
As a modern, growing city, Bozeman has an obligation to downstream water users and to
future generations of Montanans. Challenges associated with increases in global population, such
as providing food and clean water are reflected in the challenges we face in the Gallatin valley.
We must house, feed, and provide clean water to the growing population, to do one at the
expense of another is easy; in concert, these issues become more than the sum of their parts.
Ultimately, the scientific literature supports the idea that riparian buffer areas should be valued
for the reduction of pollutants and benefits that they have on water quality, and that there is
potential for development of impervious surface as a useful metric for estimating upland
pollution offloading during urban growth. Clearly riparian buffers can be a contributor to water
quality and should be considered during development adjacent to our waterways. These buffers
may not only help in achieving mandatory TMDL guidelines, but provide other desirable
functions such as increased habitat for wildlife, recreation, and aesthetics.
References
Cordery, Ian. 1977. “Quality Characteristics of Urban Storm Water in Sydney, Australia.” Water
Resources Research 13 (1): 197–202. doi:10.1029/WR013i001p00197.
MSU-Land Resource and Environmental Studies 2016 Story Mill Final Report
44
Ellis, Bryan. 1991. “Urban Runoff Quality in the UK: Problems, Prospects and Procedures.”
Applied Geography 11 (3): 187–200. doi:10.1016/0143-6228(91)90029-9.
EPA. 2016. “Waterbody Quality Assessment Report | Water Quality Assessment and TMDL
Information | US EPA.” Accessed October 6.
http://epadev.induscorp.com/waters10/attains_waterbody.control?p_list_id=MT41H003_020
&p_cycle=2014.
EPA-NURP. 1983. “Nationwide Urban Runoff Program (NURP) Executive Summary -
Sw_nurp_exec_summary.pdf.” Accessed October 14.
https://www3.epa.gov/npdes/pubs/sw_nurp_exec_summary.pdf.
Harter, Sarah K., and William J. Mitsch. 2003. “Patterns of Short-Term Sedimentation in a
Freshwater Created Marsh.” Journal of Environment Quality 32 (1): 325.
doi:10.2134/jeq2003.3250.
Hathaway, J. M., R. S. Tucker, J. M. Spooner, and W. F. Hunt. 2012. “A Traditional Analysis of
the First Flush Effect for Nutrients in Stormwater Runoff from Two Small Urban
Catchments.” Water, Air, & Soil Pollution 223 (9): 5903–15. doi:10.1007/s11270-012-1327-
x.
Hoffmann, Carl Christian, and Annette Baattrup-Pedersen. 2007. “Re-Establishing Freshwater
Wetlands in Denmark.” Ecological Engineering, Wetland restoration at the Society for
Ecological Restoration International Conference in Zaragoza, Spain, 30 (2): 157–66.
doi:10.1016/j.ecoleng.2006.09.022.
Lee, K. H., T. M. Isenhart, and R. C. Schultz. 2003. “Sediment and Nutrient Removal in an
Established Multi-Species Riparian Buffer.” Journal of Soil and Water Conservation 58 (1):
1–8.
Lowrance, Richard, Ralph Leonard, and Joseph Sheridan. 1985. “Managing Riparian
Ecosystems to Control Nonpoint Pollution.” Journal of Soil and Water Conservation 40 (1):
87–91.
Mannina, Giorgio, and Gaspare Viviani. 2010. “An Urban Drainage Stormwater Quality Model:
Model Development and Uncertainty Quantification.” Journal of Hydrology 381 (3–4): 248–
65. doi:10.1016/j.jhydrol.2009.11.047.
“Mini TOC: Chapter 38 - UNIFIED DEVELOPMENT CODE | Code of Ordinances | Bozeman,
MT | Municode Library.” 2016. Accessed October 5.
https://www.municode.com/library/mt/bozeman/codes/code_of_ordinances?nodeId=PTIICO
OR_CH38UNDECO.
Mitsch, William J., Li Zhang, Christopher J. Anderson, Anne E. Altor, and Maria E. Hernández.
2005. “Creating Riverine Wetlands: Ecological Succession, Nutrient Retention, and Pulsing
Effects.” Ecological Engineering, Constructed wetlands for wastewater treatment, 25 (5):
510–27. doi:10.1016/j.ecoleng.2005.04.014.
Mitsch, William J., Li Zhang, Evan Waletzko, and Blanca Bernal. 2014. “Validation of the
Ecosystem Services of Created Wetlands: Two Decades of Plant Succession, Nutrient
Retention, and Carbon Sequestration in Experimental Riverine Marshes.” Ecological
Engineering, The Olentangy River Wetland Research Park: Two Decades of Research on
Ecosystem Services, 72 (November): 11–24. doi:10.1016/j.ecoleng.2014.09.108.
MT-DEQ. 2016. “Lower Gallatin Planning Area TMDLs & Framework Water Quality
Improvment Plan.” Accessed October 14.
https://ofmpub.epa.gov/waters10/attains_impaired_waters.show_tmdl_document?p_tmdl_do
c_blobs_id=60439.
MSU-Land Resource and Environmental Studies 2016 Story Mill Final Report
45
Peterjohn, William T., and David L. Correll. 1984. “Nutrient Dynamics in an Agricultural
Watershed: Observations on the Role of A Riparian Forest.” Ecology 65 (5): 1466–75.
doi:10.2307/1939127.
Steenhuis, Tammo S., Michael Winchell, Jane Rossing, James A. Zollweg, and Michael F.
Walter. 1995. “SCS Runoff Equation Revisited for Variable-Source Runoff Areas.” Journal
of Irrigation and Drainage Engineering 121 (3): 234–38. doi:10.1061/(ASCE)0733-
9437(1995)121:3(234).
Taebi, Amir, and Ronald L. Droste. 2004. “Pollution Loads in Urban Runoff and Sanitary
Wastewater.” Science of The Total Environment 327 (1–3): 175–84.
doi:10.1016/j.scitotenv.2003.11.015.
Tournebize, Julien, Cedric Chaumont, and Ülo Mander. 2016. “Implications for Constructed
Wetlands to Mitigate Nitrate and Pesticide Pollution in Agricultural Drained Watersheds.”
Ecological Engineering. Accessed October 6. doi:10.1016/j.ecoleng.2016.02.014.
Tu, Y. T., P. C. Chiang, J. Yang, S. H. Chen, and C. M. Kao. 2014. “Application of a
Constructed Wetland System for Polluted Stream Remediation.” Journal of Hydrology 510
(March): 70–78. doi:10.1016/j.jhydrol.2013.12.015.
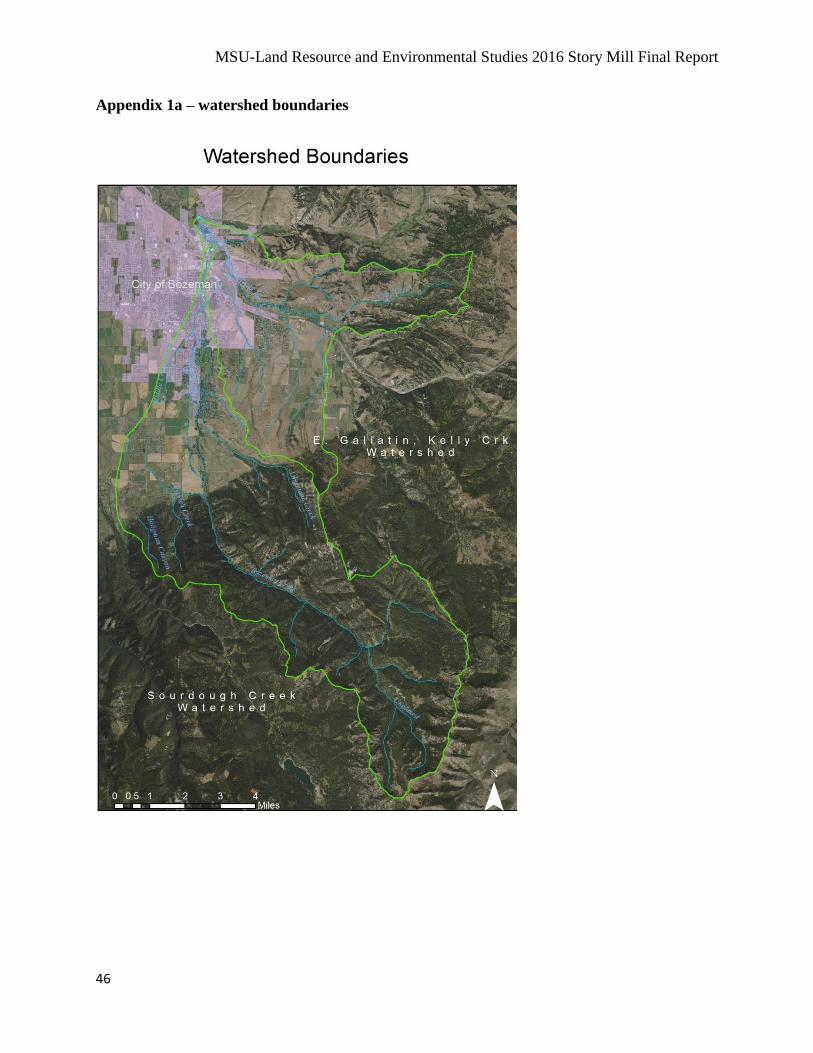
MSU-Land Resource and Environmental Studies 2016 Story Mill Final Report
46
Appendix 1a – watershed boundaries
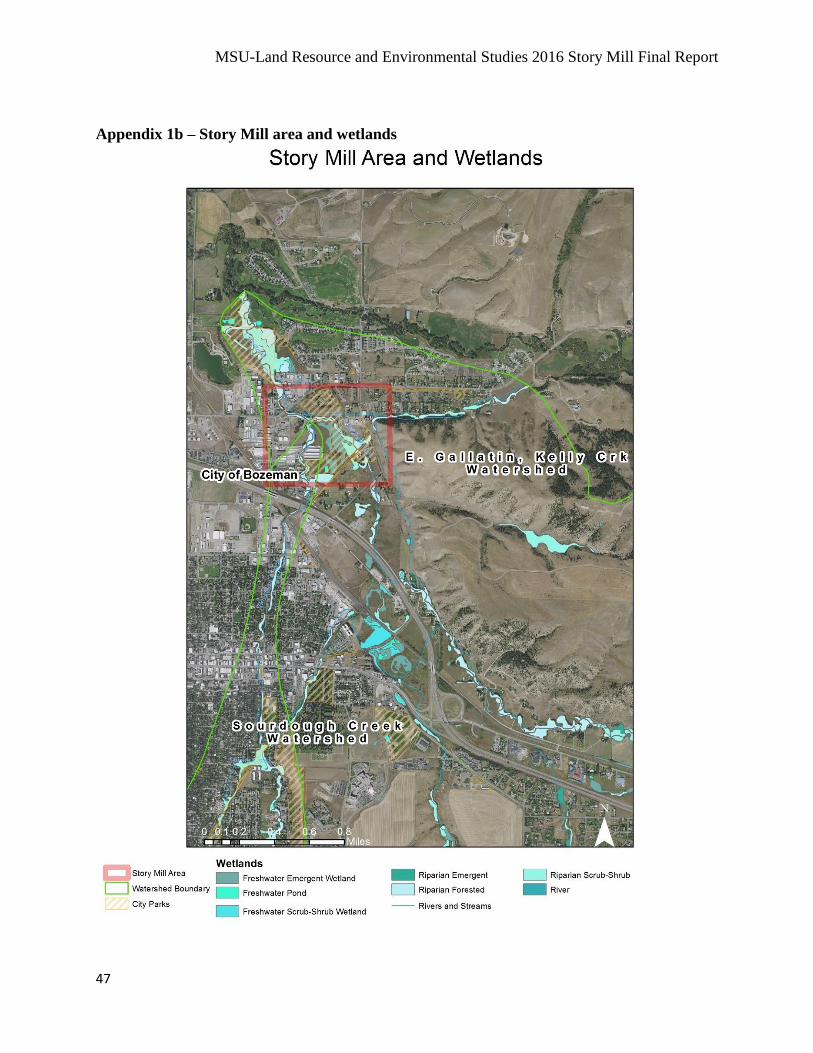
MSU-Land Resource and Environmental Studies 2016 Story Mill Final Report
47
Appendix 1b – Story Mill area and wetlands
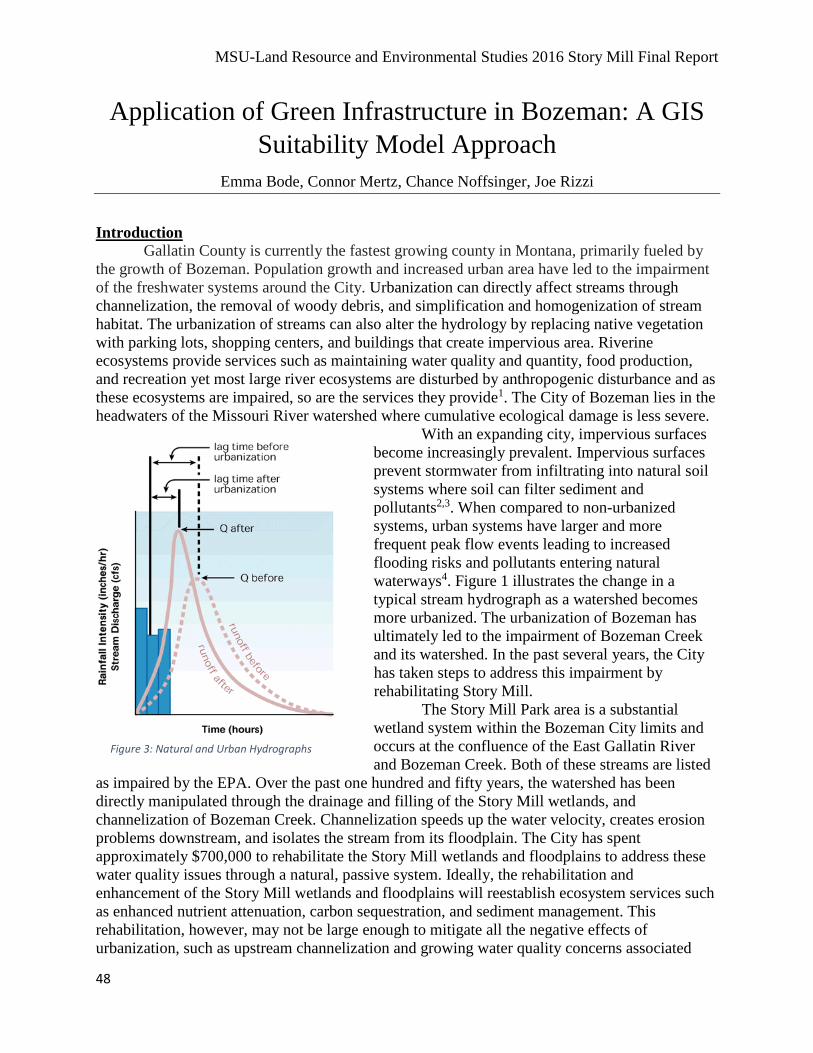
MSU-Land Resource and Environmental Studies 2016 Story Mill Final Report
48
Figure 1 -Effects of urbanization on a stream
hydrograph, EPA
Application of Green Infrastructure in Bozeman: A GIS
Suitability Model Approach
Emma Bode, Connor Mertz, Chance Noffsinger, Joe Rizzi
Introduction
Gallatin County is currently the fastest growing county in Montana, primarily fueled by
the growth of Bozeman. Population growth and increased urban area have led to the impairment
of the freshwater systems around the City. Urbanization can directly affect streams through
channelization, the removal of woody debris, and simplification and homogenization of stream
habitat. The urbanization of streams can also alter the hydrology by replacing native vegetation
with parking lots, shopping centers, and buildings that create impervious area. Riverine
ecosystems provide services such as maintaining water quality and quantity, food production,
and recreation yet most large river ecosystems are disturbed by anthropogenic disturbance and as
these ecosystems are impaired, so are the services they provide1. The City of Bozeman lies in the
headwaters of the Missouri River watershed where cumulative ecological damage is less severe.
With an expanding city, impervious surfaces
become increasingly prevalent. Impervious surfaces
prevent stormwater from infiltrating into natural soil
systems where soil can filter sediment and
pollutants2,3. When compared to non-urbanized
systems, urban systems have larger and more
frequent peak flow events leading to increased
flooding risks and pollutants entering natural
waterways4. Figure 1 illustrates the change in a
typical stream hydrograph as a watershed becomes
more urbanized. The urbanization of Bozeman has
ultimately led to the impairment of Bozeman Creek
and its watershed. In the past several years, the City
has taken steps to address this impairment by
rehabilitating Story Mill.
The Story Mill Park area is a substantial
wetland system within the Bozeman City limits and
occurs at the confluence of the East Gallatin River
and Bozeman Creek. Both of these streams are listed
as impaired by the EPA. Over the past one hundred and fifty years, the watershed has been
directly manipulated through the drainage and filling of the Story Mill wetlands, and
channelization of Bozeman Creek. Channelization speeds up the water velocity, creates erosion
problems downstream, and isolates the stream from its floodplain. The City has spent
approximately $700,000 to rehabilitate the Story Mill wetlands and floodplains to address these
water quality issues through a natural, passive system. Ideally, the rehabilitation and
enhancement of the Story Mill wetlands and floodplains will reestablish ecosystem services such
as enhanced nutrient attenuation, carbon sequestration, and sediment management. This
rehabilitation, however, may not be large enough to mitigate all the negative effects of
urbanization, such as upstream channelization and growing water quality concerns associated
Figure 3: Natural and Urban Hydrographs
MSU-Land Resource and Environmental Studies 2016 Story Mill Final Report
49
with stormwater. In order to meet the EPA water quality standards, we recommend that the City
of Bozeman further address the sources of pollution above the Story Mill Park.
The City is already under pressure to update its current infrastructure to adjust for the
demands of an increasing population. Here we consider the implementation of green
infrastructure systems around the City to mitigate nonpoint source pollutants associated with
Bozeman. The inevitable update of the City’s infrastructure in the coming decades provides an
extraordinary opportunity to address water quality issues through the implementation of green
infrastructure.
Here we explored potential types of green infrastructure to implement in Bozeman,
defined and characterized urban catchment basins by their relative pollutant contributions, and
determined the most effective sites for implementing green infrastructure systems within city
limits to further reduce pollutant loads.
Characterizing Urban Pollutants The Environmental Protection Agency (EPA) provides guidance to assess the water
quality around the US to determine if it meets the standards set by the Clean Water Act (CWA).
The EPA provides guidance for states to develop water pollution standards known as Total
Maximum Daily Load (TMDL). TMDLs specify the total amount of pollution a water body can
legally receive while still meeting water quality standards. The Montana Department of
Environmental Quality (DEQ) reported to the EPA in 2013 that Bozeman Creek was impaired by
Escherichia Coli (E. Coli), sedimentation and siltation, and total nitrogen loading because they
exceed their respective TMDLs5.
Nonpoint sources of polluted urban runoff can be difficult to characterize due to temporal
and spatial variability within urban systems6. Mixing of land use within a city is extensive and
numerous pollutants from multiple sources may be found in a single area. Temporal variation
arises from seasonality, local weather events, and irregular activities such as fertilization and
construction projects6,7.
Nitrogen and phosphorus are the target nutrient pollutants impairing Bozeman Creek.
These nutrient pollutants are typically sourced from construction sites, lawn fertilizer, pet waste,
and leaked sewage in urban settings. They are also associated with agricultural activities,
primarily fertilization and livestock production8. Anthropogenic-sourced nitrogen and
phosphorus pollution is typically associated with eutrophication of freshwater systems. Heavy
nutrient loads in a system may lead to the alteration of stream communities, toxic algal blooms,
oxygen depletion of the system, and ultimately fish kills. Excessive nutrient concentrations may
also impair water quality and taste9.
Sediment pollutants are derived from streets, parking lots, rooftops, construction sites,
vacant lots, and landscaped grounds. These sediments are subject to further contamination from
the spillage of hydrocarbons, atmospheric deposition, and fertilizer applications. In addition,
sediments may carry metals, nutrients, organochlorines, and other toxins that pose as health
threats to both humans and freshwater organisms7. Contaminated sediments threaten the
physical, chemical, and biological integrity of freshwater ecosystems10. Unlike other dissolved
pollutants, which are subject to dilution, sediments concentrate above aquatic systems in
traditional stormwater retention systems. In the event of a major outwash, these sediments have
the potential to shock load freshwater systems.
Pathogens, particularly E. Coli, are obvious human health concerns in drinking water as
well as to recreational water users. In Bozeman, livestock and dog feces are primary sources of
MSU-Land Resource and Environmental Studies 2016 Story Mill Final Report
50
fecal coliform. Oil, grease, and other hydrocarbon pollutants are categorized as ‘floatables.’
These pollutants are associated with leaks and spills from automobiles and other equipment
operations. The introduction of ‘floatable’ pollutants to aquatic systems impairs ecosystem health
and contaminates drinking water9. Green infrastructure systems reduce pollutant loads in urban
runoff before they reach stream systems, alleviating downstream water treatment costs by pre-
treating non-point source pollution.
Green Infrastructure Green infrastructure utilizes ecosystem services provided by natural environments to
alleviate pollutant loads. Green infrastructure consists of natural or engineered areas of land
designed to leverage natural ecosystem function to mitigate urban pollution closer to its source11.
Large-scale green infrastructure includes parks, wetlands, open spaces, drainage ways, and
floodplains, all of which can be integrated within urban landscapes to form large functioning
urban ecosystems that perform beneficial services. This services include improving air and water
quality, reducing flooding risks, mitigating heat island effect in urban centers, and enhancing
overall community livability12. Large-scale green infrastructure works to restore and enhance
beneficial ecological services that are missing or impaired as a result of urbanization. Small-scale
green infrastructure is the use of location-specific engineered structures, which mitigate the
harmful effects of large amounts of impervious surfaces and non-point source pollution. Some
recommendations for small-scale green infrastructure that could be implemented in Bozeman are
listed below.
Permeable paving consists of a range of materials that can be used to slow stormwater
runoff, increase stormwater infiltration, and decrease the amount of sediments and pollutants that
enter natural waterways. Permeable pavers reestablish a more natural water cycle by allowing
stormwater to infiltrate through the underlying soil and recharge groundwater. Permeable paving
includes porous pavement and laid pavers on sidewalks or green alleys to decrease impervious
areas of highly urbanized systems. Permeable pavers however, are only effective at treating the
area they cover and not the water moving off adjacent impermeable surfaces due to their slow
infiltration rate. Other considerations are that permeable pavers are more susceptible to shifting
caused by the freeze-thaw cycle in Bozeman and can present problems with snow removal13.
Street-side stormwater planters are designed to treat stormwater runoff from the street,
sidewalk, and adjacent private properties. Storm water enters the planter from a gutter on the
street and then is dispersed over the media where it infiltrates the soil and exits through a drain
system underground. The street-side stormwater planters are designed to use vegetation, which
includes grasses, perennials, shrubs, and a select number of trees, to reduce nutrient
concentration through plant uptake. Stormwater planters should be located on the downhill end
of a city block. Bump out stormwater planters are essentially larger versions of street-side
stormwater planters; however, they extend into the street and cover the zone that would be used
for parking. They can be designed to handle larger amounts of water than street-side planters
while also easing the flow of traffic. The bump out system can hold all the vegetation of the
street-side planters in addition to flowers and various tree species13.
Green gutters are smaller version of stormwater planters designed to treat less water.
They are placed in a street between the road and sidewalk and, act as a bioretention facility that
can treat runoff from the street, sidewalk, and adjacent private development. They reduce the
effects of flooding and decrease the amount of pollutants that enter the natural waterways. They
MSU-Land Resource and Environmental Studies 2016 Story Mill Final Report
51
are best used in conjunctions with native grasses but other plants may be used as well. Tree
trench/pit are essentially the same concept but are slightly larger to accommodate trees13.
Disconnected downspouts are a way of redirecting the water off of a roof onto a
permeable surface like a lawn or garden. Disconnected downspouts reduce peak stormwater
runoff and sediment loads by allowing water to infiltrate into soil or collect in wet ponds.
Disconnected downspouts are good ways for local residence to reduce stormwater runoff and
they can also be designed to move water into creative landscaping ideas like backyard ponds and
waterfalls14.
Stormwater detention ponds are designed to treat water from roofs, roads and parking
lots. They slow the overall speed of the water, which reduces runoff and allows sediments and
nutrients to settle before they enter natural waterways. Detention ponds are already a popular
way for new developments to treat storm water because, although more expensive, they can be
constructed underground so other infrastructure like parks or playgrounds can be built above13.
Detention ponds are often utilized to meet the Bozeman City mandate that all new developments
treat their stormwater and are not prevalent in older structures because the City does not extend
this requirement to prior development15.
The ideal type of green infrastructure to implement depends on the location, the climate,
water treatment needs, and budget. For Bozeman, special consideration for semi-arid climates
should be taken into account to minimize water loss through evapotranspiration by utilizing
native vegetation. More in-depth directions for construction and implementation of the described
green infrastructure are available through the Ultra Urban Green Infrastructure Guidelines
Manual13.
Bozeman Stormwater Management The Bozeman stormwater master plan lays out two approaches to treating contaminated
stormwater: first, a development-based approach, where stormwater treatment facilities are built
as new developments are constructed and second, a regional approach where larger stormwater
treatment facilities are built to treat stormwater before it reaches Bozeman Creek or other
adjacent rivers. Disadvantages are associated with both strategies. For example, the
development-based approach is expensive and will only work for new or redeveloped areas of
Bozeman; whereas, the regional approach requires large amounts of land for the facility and a
working staff that the City of Bozeman does not have money to support according to the
stormwater master plan. This master plan recommends implementing a combination of both
management techniques; however, no plan is in place for constructing a regional facility that
would treat Bozeman’s contaminated stormwater. Green infrastructure still requires a
maintenance cost, but less than a regional facility while providing services such as parks, animal
habitat, and a closer connection to nature. Therefore, the establishment of green infrastructure
throughout the city could replace Bozeman’s need for a new regional stormwater treatment
facility. This approach along with an effort to re-vegetate and restore areas along Rouse Avenue
and Bozeman Creek could be a solution to prevent flooding, slow peak runoff, and increase
water quality.
GIS as a Tool A suitability analysis using a geospatial information system (GIS) can provide
Bozeman’s city planners with a tool that integrates both spatial and storm water data to
determine the optimum sites and quantities of green infrastructure. A suitability analysis is a GIS
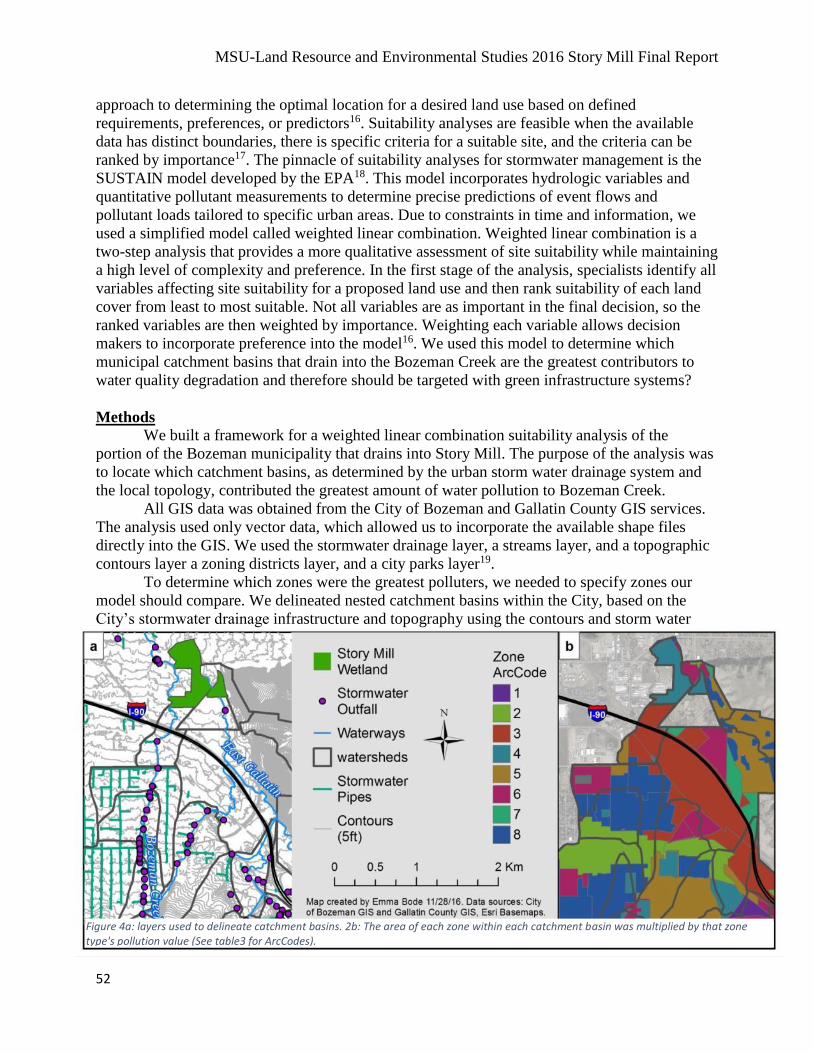
MSU-Land Resource and Environmental Studies 2016 Story Mill Final Report
52
approach to determining the optimal location for a desired land use based on defined
requirements, preferences, or predictors16. Suitability analyses are feasible when the available
data has distinct boundaries, there is specific criteria for a suitable site, and the criteria can be
ranked by importance17. The pinnacle of suitability analyses for stormwater management is the
SUSTAIN model developed by the EPA18. This model incorporates hydrologic variables and
quantitative pollutant measurements to determine precise predictions of event flows and
pollutant loads tailored to specific urban areas. Due to constraints in time and information, we
used a simplified model called weighted linear combination. Weighted linear combination is a
two-step analysis that provides a more qualitative assessment of site suitability while maintaining
a high level of complexity and preference. In the first stage of the analysis, specialists identify all
variables affecting site suitability for a proposed land use and then rank suitability of each land
cover from least to most suitable. Not all variables are as important in the final decision, so the
ranked variables are then weighted by importance. Weighting each variable allows decision
makers to incorporate preference into the model16. We used this model to determine which
municipal catchment basins that drain into the Bozeman Creek are the greatest contributors to
water quality degradation and therefore should be targeted with green infrastructure systems?
Methods We built a framework for a weighted linear combination suitability analysis of the
portion of the Bozeman municipality that drains into Story Mill. The purpose of the analysis was
to locate which catchment basins, as determined by the urban storm water drainage system and
the local topology, contributed the greatest amount of water pollution to Bozeman Creek.
All GIS data was obtained from the City of Bozeman and Gallatin County GIS services.
The analysis used only vector data, which allowed us to incorporate the available shape files
directly into the GIS. We used the stormwater drainage layer, a streams layer, and a topographic
contours layer a zoning districts layer, and a city parks layer19.
To determine which zones were the greatest polluters, we needed to specify zones our
model should compare. We delineated nested catchment basins within the City, based on the
City’s stormwater drainage infrastructure and topography using the contours and storm water
Figure 4a: layers used to delineate catchment basins. 2b: The area of each zone within each catchment basin was multiplied by that zone type's pollution value (See table3 for ArcCodes).
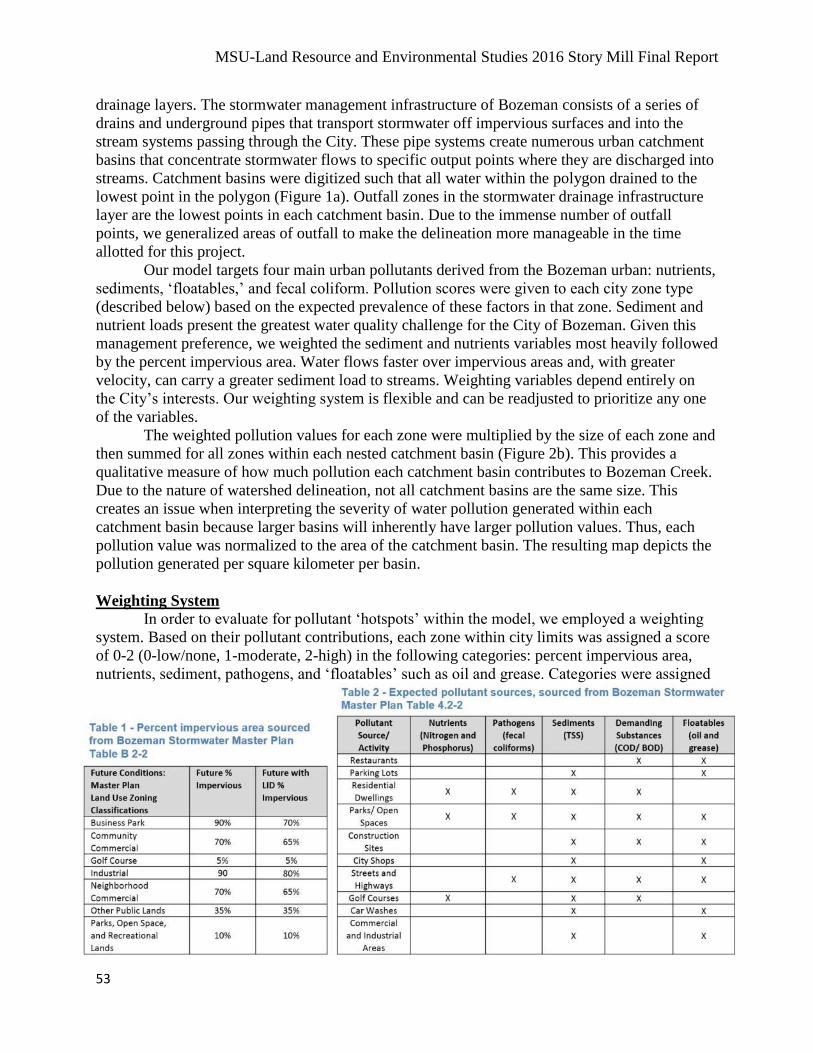
MSU-Land Resource and Environmental Studies 2016 Story Mill Final Report
53
drainage layers. The stormwater management infrastructure of Bozeman consists of a series of
drains and underground pipes that transport stormwater off impervious surfaces and into the
stream systems passing through the City. These pipe systems create numerous urban catchment
basins that concentrate stormwater flows to specific output points where they are discharged into
streams. Catchment basins were digitized such that all water within the polygon drained to the
lowest point in the polygon (Figure 1a). Outfall zones in the stormwater drainage infrastructure
layer are the lowest points in each catchment basin. Due to the immense number of outfall
points, we generalized areas of outfall to make the delineation more manageable in the time
allotted for this project.
Our model targets four main urban pollutants derived from the Bozeman urban: nutrients,
sediments, ‘floatables,’ and fecal coliform. Pollution scores were given to each city zone type
(described below) based on the expected prevalence of these factors in that zone. Sediment and
nutrient loads present the greatest water quality challenge for the City of Bozeman. Given this
management preference, we weighted the sediment and nutrients variables most heavily followed
by the percent impervious area. Water flows faster over impervious areas and, with greater
velocity, can carry a greater sediment load to streams. Weighting variables depend entirely on
the City’s interests. Our weighting system is flexible and can be readjusted to prioritize any one
of the variables.
The weighted pollution values for each zone were multiplied by the size of each zone and
then summed for all zones within each nested catchment basin (Figure 2b). This provides a
qualitative measure of how much pollution each catchment basin contributes to Bozeman Creek.
Due to the nature of watershed delineation, not all catchment basins are the same size. This
creates an issue when interpreting the severity of water pollution generated within each
catchment basin because larger basins will inherently have larger pollution values. Thus, each
pollution value was normalized to the area of the catchment basin. The resulting map depicts the
pollution generated per square kilometer per basin.
Weighting System In order to evaluate for pollutant ‘hotspots’ within the model, we employed a weighting
system. Based on their pollutant contributions, each zone within city limits was assigned a score
of 0-2 (0-low/none, 1-moderate, 2-high) in the following categories: percent impervious area,
nutrients, sediment, pathogens, and ‘floatables’ such as oil and grease. Categories were assigned
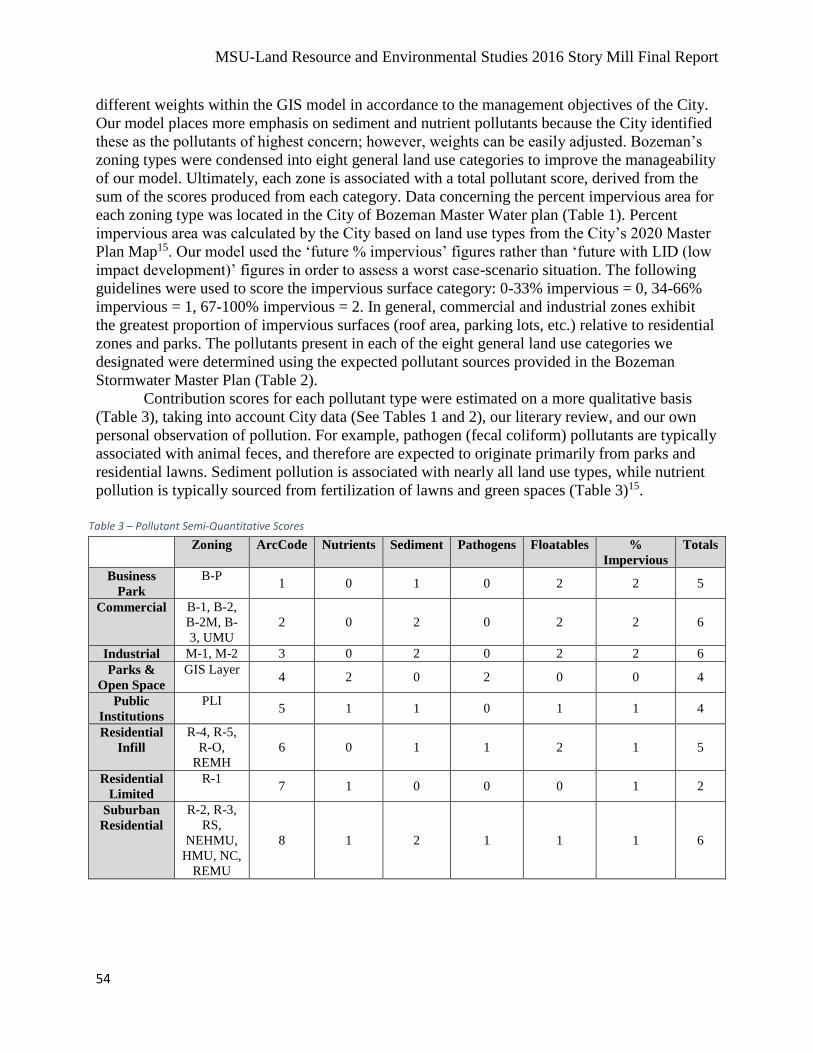
MSU-Land Resource and Environmental Studies 2016 Story Mill Final Report
54
different weights within the GIS model in accordance to the management objectives of the City.
Our model places more emphasis on sediment and nutrient pollutants because the City identified
these as the pollutants of highest concern; however, weights can be easily adjusted. Bozeman’s
zoning types were condensed into eight general land use categories to improve the manageability
of our model. Ultimately, each zone is associated with a total pollutant score, derived from the
sum of the scores produced from each category. Data concerning the percent impervious area for
each zoning type was located in the City of Bozeman Master Water plan (Table 1). Percent
impervious area was calculated by the City based on land use types from the City’s 2020 Master
Plan Map15. Our model used the ‘future % impervious’ figures rather than ‘future with LID (low
impact development)’ figures in order to assess a worst case-scenario situation. The following
guidelines were used to score the impervious surface category: 0-33% impervious = 0, 34-66%
impervious = 1, 67-100% impervious = 2. In general, commercial and industrial zones exhibit
the greatest proportion of impervious surfaces (roof area, parking lots, etc.) relative to residential
zones and parks. The pollutants present in each of the eight general land use categories we
designated were determined using the expected pollutant sources provided in the Bozeman
Stormwater Master Plan (Table 2).
Contribution scores for each pollutant type were estimated on a more qualitative basis
(Table 3), taking into account City data (See Tables 1 and 2), our literary review, and our own
personal observation of pollution. For example, pathogen (fecal coliform) pollutants are typically
associated with animal feces, and therefore are expected to originate primarily from parks and
residential lawns. Sediment pollution is associated with nearly all land use types, while nutrient
pollution is typically sourced from fertilization of lawns and green spaces (Table 3)15.
Zoning ArcCode Nutrients Sediment Pathogens Floatables %
Impervious
Totals
Business
Park
B-P
1 0 1 0 2 2 5
Commercial B-1, B-2,
B-2M, B-
3, UMU
2 0 2 0 2 2 6
Industrial M-1, M-2 3 0 2 0 2 2 6
Parks &
Open Space
GIS Layer 4 2 0 2 0 0 4
Public
Institutions
PLI 5 1 1 0 1 1 4
Residential
Infill
R-4, R-5,
R-O,
REMH
6 0 1 1 2 1 5
Residential
Limited
R-1 7 1 0 0 0 1 2
Suburban
Residential
R-2, R-3,
RS,
NEHMU,
HMU, NC,
REMU
8 1 2 1 1 1 6
Table 3 – Pollutant Semi-Quantitative Scores
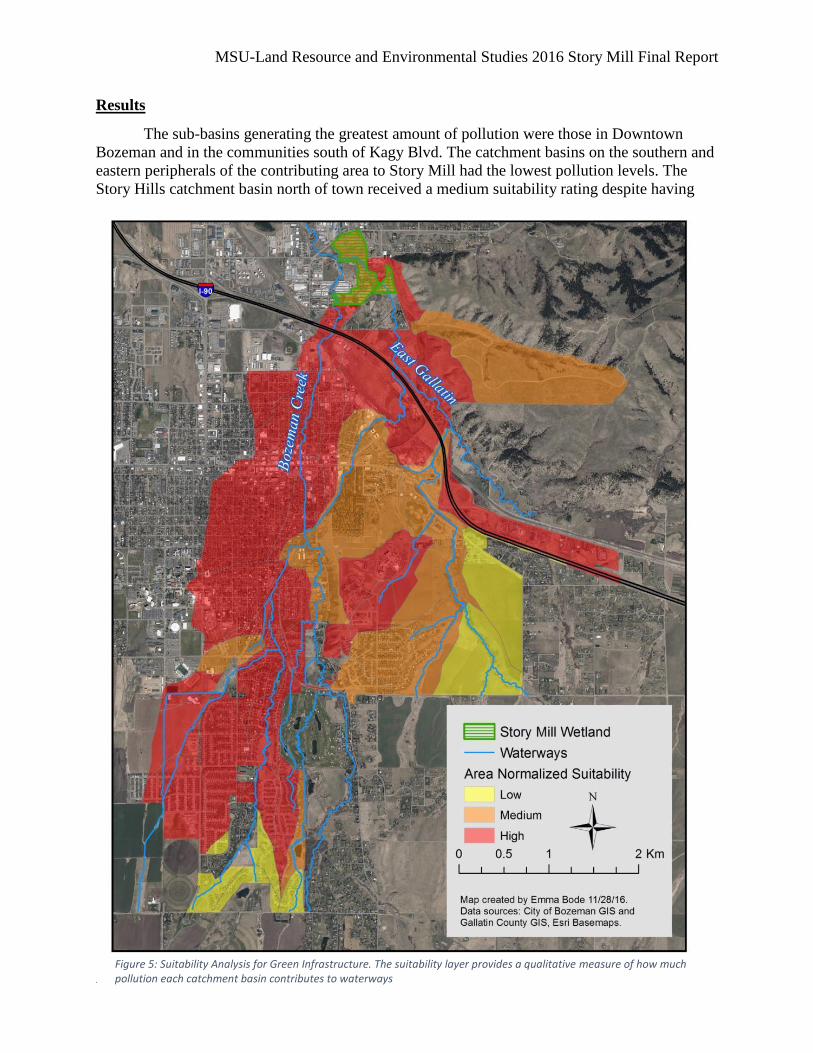
MSU-Land Resource and Environmental Studies 2016 Story Mill Final Report
55
Results
The sub-basins generating the greatest amount of pollution were those in Downtown
Bozeman and in the communities south of Kagy Blvd. The catchment basins on the southern and
eastern peripherals of the contributing area to Story Mill had the lowest pollution levels. The
Story Hills catchment basin north of town received a medium suitability rating despite having
Figure 5: Suitability Analysis for Green Infrastructure. The suitability layer provides a qualitative measure of how much pollution each catchment basin contributes to waterways
MSU-Land Resource and Environmental Studies 2016 Story Mill Final Report
56
almost no development (Figure 3). It is reasonable that Bozeman Creek running from College
Ave. to Oak St. would be the most impaired due to the high ratings of the surrounding downtown
area. It is not surprising that those catchment basins furthest from the center of town and away
from the most concentrated urbanization would receive the lowest ratings. Basing stormwater
pollution levels off of zoning districts was successful given our time constraints. Zoning districts,
however, are imperfect pollution proxies. They can only represent the City’s vision for
development and not the current development. This caused an inaccurate classification of the
Story Hills which are zoned as a residential area but have little actual development, because of
the conservation easements owned by the Gallatin Valley Land Trust.
The catchment basins generating the greatest amount of pollution were those in
Downtown and Southeast Bozeman. The catchment basins over Montana State University, Pete’s
Hill, and South 3rd Ave had the lowest pollution levels. It is logical that downtown would have a
high sediment load due to its high urbanization and percent impervious area. The high rating for
southeast Bozeman is speculative and warrants further investigation of our model. More
Bozeman specific knowledge of the pollutant loads of each zoning district would support a
superior product. The size of the catchment basins makes further interpretation difficult. In future
analyses, we recommend delineating smaller basins and using true water quality measurements
from water samples along city waterways.
Based on our findings, the catchment basins that generate the most sediment, and thus
would be most suitable for intervention via green infrastructure are in downtown Bozeman and
southeast Bozeman. While the accuracy of this study could be greatly improved with more
detailed data, the project provides a framework and methodology for performing a green
infrastructure suitability analysis for the Bozeman Municipality. Implementing a comprehensive
monitoring system such as SUSTAIN18, may be beyond the scope of Bozeman’s interests.
Discussion
This project explored potential green infrastructure to implement in Bozeman, defined
and characterized urban catchment basins by their relative pollutant contributions, and
determined the most effective sites for implementing green infrastructure systems within city
limits to further reduce pollutant loads. While the accuracy of this study could be greatly
improved with more detailed data, the project provides a framework and methodology for a
suitability analysis for the implementation of green infrastructure in the Bozeman municipality.
More site-specific knowledge of the pollutant loads in each catchment basin would support a
superior suitability analysis. Water quality monitoring stations at each outfall zone along the
stormwater system, could provide this valuable data. From a construction and management
perspective, there are many factors that must be considered when implementing green
infrastructure systems in an urban system. These include but are not limited to: construction
expenses, maintenance expenses, property rights, proximity to existing infrastructure and
utilities, and water rights13. Provided more time and resources, these constraints could be
incorporated into the model to provide a both a suitability and feasibility component.
With respect to future water quality management practices, there are three considerations
to keep in mind when moving forward11. First, conservation goals today can be uncoordinated,
reactive, site specific, and narrowly focused. The rehabilitation of Story Mill wetland and
riparian areas is in response to the water quality issues currently faced in the City of Bozeman,
MSU-Land Resource and Environmental Studies 2016 Story Mill Final Report
57
and in the future it is beneficial to think more holistically and plan for future environmental
quality issues. Second, conservation plans can be segregated from growth management and land
use planning. Determining the optimum locations for the implementation of green infrastructure
benefits both the city budget and Gallatin Valley water quality. Third, conservation efforts are
rarely prioritized when funding is cut or the economy takes a turn for the worst. With a budget
stretched thin by city growth, a model approach such as with will provide Bozeman an effective
means to implement green infrastructure.
Currently, the City of Bozeman monitors stormwater quality annually at two points, one
residential and one industrial. Both sampling points are within the City under manhole covers
and are designed to be representative of the area from which they are sampled. At these points
the City measures total suspended solids, oil and grease, total nitrogen, total phosphorus, metals
and pH20. Water quality monitoring stations at each outfall zone along the stormwater system,
however, would provide valuable data for a more informed suitability analysis. With a budget
stretched thin by city growth, Bozeman could implement green infrastructure in the most
effective means possible by determining optimum locations that benefit both the City budget and
Gallatin Valley water quality.
Our model serves merely as a framework to address the specific concerns and limitations
of the City’s stormwater management decisions. The decision of whether or not to implement
green infrastructure and reduce pollutant loads is a matter of the City’s budget and priorities
regarding water quality issues. Green infrastructure can mitigate the impacts of urbanization.
Given the value Bozeman citizens place on environmental quality and the cost the City would
spend mitigating water pollution through other methods, green infrastructure may be an ideal
solution to its water quality issues.
References
1. Jungwirth, M., Muhar, S. & Schmutz, S. Re-establishing and assessing ecological integrity in
riverine landscapes. Freshw. Biol. 47, 867–887 (2002).
2. Goonetilleke, A., Thomas, E., Ginn, S. & Gilbert, D. Understanding the role of land use in
urban stormwater quality management. J. Environ. Manage. 74, 31–42 (2005).
3. US EPA. Stream Corridor Structure. Watershed Academy Web (2016). Available at:
https://cfpub.epa.gov/watertrain/moduleFrame.cfm?parent_object_id=624&object_id=629#6
29. (Accessed: 23rd October 2016)
4. Wang, L., Lyons, J., Kanehl, P. & Bannerman, R. Impacts of urbanization on stream habitat
and fish across multiple spatial scales. Environ. Manage. 28, 255–266 (2001).
5. US EPA. TMDL Report. Water Quality Assessment and TMDL Information (2013).
Available at:
https://iaspub.epa.gov/waters10/attains_impaired_waters.tmdl_report?p_tmdl_id=42773&p_r
eport_type=. (Accessed: 9th November 2016)
6. Hatt, B. E., Fletcher, T. D., Walsh, C. J. & Taylor, S. L. The Influence of Urban Density and
Drainage Infrastructure on the Concentrations and Loads of Pollutants in Small Streams.
Environ. Manage. 34, 112–124 (2004).
7. Parker, J. T., Fossum, K. D. & Ingersoll, T. L. Chemical characteristics of urban stormwater
sediments and implications for environmental management, Maricopa County, Arizona.
Environ. Manage. 26, 99–115 (2000).
8. Carpenter, S. R. et al. Nonpoint Pollution of Surface Waters with Phosphorus and Nitrogen.
Ecol. Appl. 8, 559–568 (1998).
MSU-Land Resource and Environmental Studies 2016 Story Mill Final Report
58
9. US EPA, O. Nutrients. CADDIS: Sources, Stressors & Responses (2016). Available at:
https://www3.epa.gov/caddis/ssr_nut_int.html. (Accessed: 24th October 2016)
10. US EPA, O. Sediment. CADDIS: Sources, Stressors & Responses (2016). Available at:
https://www3.epa.gov/caddis/ssr_sed_int.html. (Accessed: 24th October 2016)
11. Benedict, M. A., McMahon, E. T. & others. Green infrastructure: linking landscapes and
communities. (Island Press, 2012).
12. Whitford, V., Ennos, A. R. & Handley, J. F. ‘City form and natural process’—indicators for
the ecological performance of urban areas and their application to Merseyside, UK. Landsc.
Urban Plan. 57, 91–103 (2001).
13. Denver Public Works, Urban Drainage and Flood Control District & EPA. Ultra urban green
infrastructure guidelines manual. (2016).
14. Bozeman Creek Enhancement Committee. Bozeman Creek Enhancement Plan. (2012).
Available at:
https://www.google.com/search?q=Bozeman+Creek+Enhancement+Plan&oq=Bozeman+Cre
ek+Enhancement+Plan&aqs=chrome.69i57.683j0j7&sourceid=chrome&ie=UTF-8.
(Accessed: 9th November 2016)
15. HDR Engineering Inc. & Morrison-Maierle. Bozeman Storm Water Facilities Plan. (2008).
16. Malczewski, J. GIS-based land-use suitability analysis: a critical overview. Prog. Plan. 62,
3–65 (2004).
17. Overview of Weighted Site Selection and Suitability Analysis. GIS Lounge (2014).
18. Shamsi, U. M. (Sam), Schombert, J. W. & Lennon, L. J. SUSTAIN Applications for
Mapping and Modeling Green Stormwater Infrastructure. J. Water Manag. Model. (2014).
doi:10.14796/JWMM.C379
19. Gallatin County, MT - Data Available For Download. Available at:
http://gallatincomt.virtualtownhall.net/Public_Documents/gallatincomt_gis/Data%20Downlo
ad%20Page. (Accessed: 24th October 2016)
20. Mehrens, K. Bozeman Stormwater Monitoring. (2016).
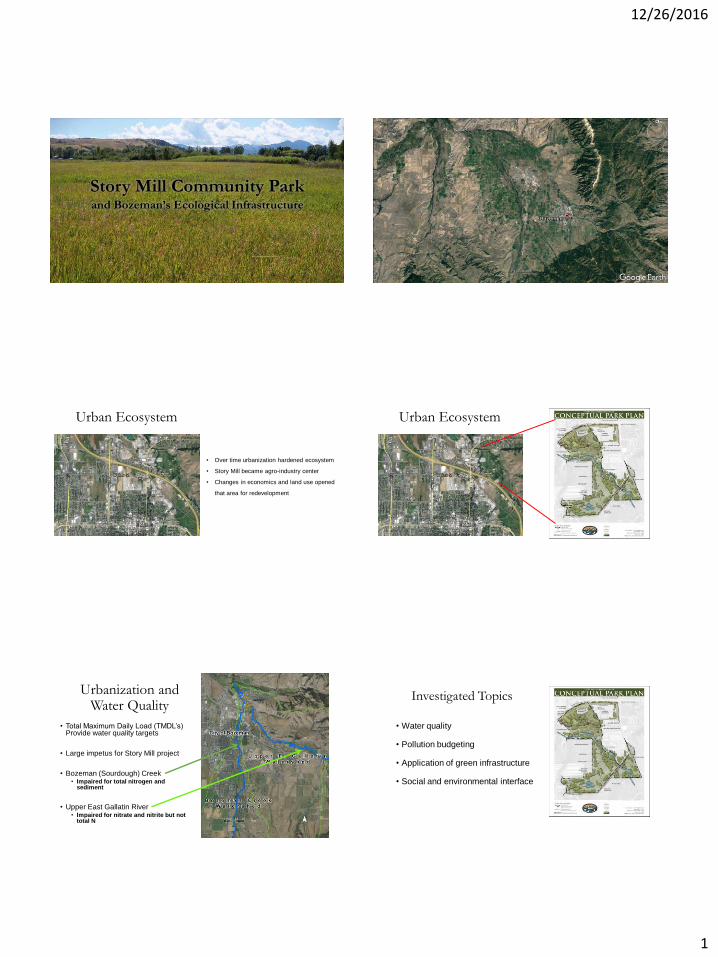
12/26/2016
1
Story Mill Community Parkand Bozeman’s Ecological Infrastructure
Full view of Gallatin valley-describe what formed fertile farmland-this brought settlers -Bozeman’s growth
Urban Ecosystem
• Over time urbanization hardened ecosystem
• Story Mill became agro-industry center
• Changes in economics and land use opened
that area for redevelopment
Urban Ecosystem
Urbanization and Water Quality
• Total Maximum Daily Load (TMDL’s) Provide water quality targets
• Large impetus for Story Mill project
• Bozeman (Sourdough) Creek• Impaired for total nitrogen and
sediment
• Upper East Gallatin River• Impaired for nitrate and nitrite but not
total N
Investigated Topics
• Water quality
• Pollution budgeting
• Application of green infrastructure
• Social and environmental interface
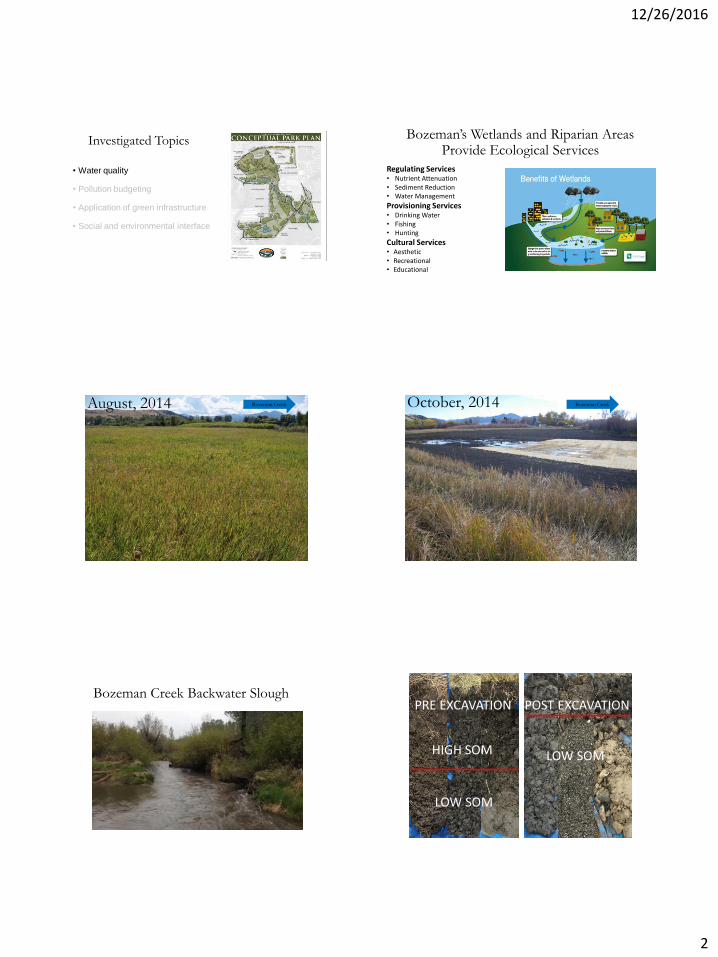
12/26/2016
2
Investigated Topics
• Water quality
• Pollution budgeting
• Application of green infrastructure
• Social and environmental interface
Bozeman’s Wetlands and Riparian Areas Provide Ecological Services
Regulating Services• Nutrient Attenuation• Sediment Reduction• Water Management
Provisioning Services• Drinking Water• Fishing• Hunting
Cultural Services• Aesthetic• Recreational• Educational
August, 2014 Bozeman Creek October, 2014 Bozeman Creek
Bozeman Creek Backwater SloughPRE EXCAVATION POST EXCAVATION
HIGH SOM
LOW SOM
LOW SOM
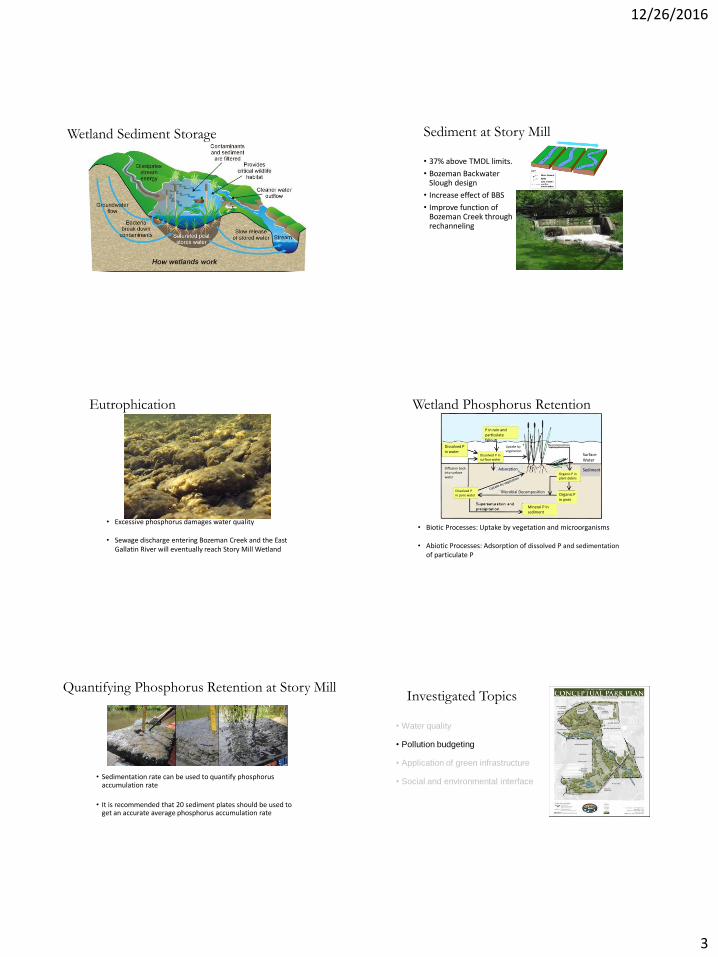
12/26/2016
3
Wetland Sediment Storage Sediment at Story Mill
• 37% above TMDL limits.
• Bozeman Backwater Slough design
• Increase effect of BBS
• Improve function of Bozeman Creek through rechanneling
Eutrophication
• Excessive phosphorus damages water quality
• Sewage discharge entering Bozeman Creek and the East Gallatin River will eventually reach Story Mill Wetland
Wetland Phosphorus Retention
• Biotic Processes: Uptake by vegetation and microorganisms
• Abiotic Processes: Adsorption of dissolved P and sedimentationof particulate P
P in rain and particulate fallout
Dissolved P in water
Dissolved P in surface water
Organic P in plant debris
Organic P in peat
Mineral P in sediment
Dissolved P in pore water
Uptake by vegetation
Sediment
Surface Water
Adsorption
Microbial Decomposition
Decomposition
Diffusion back into surface water
Quantifying Phosphorus Retention at Story Mill
• Sedimentation rate can be used to quantify phosphorus accumulation rate
• It is recommended that 20 sediment plates should be used to get an accurate average phosphorus accumulation rate
Investigated Topics
• Water quality
• Pollution budgeting
• Application of green infrastructure
• Social and environmental interface
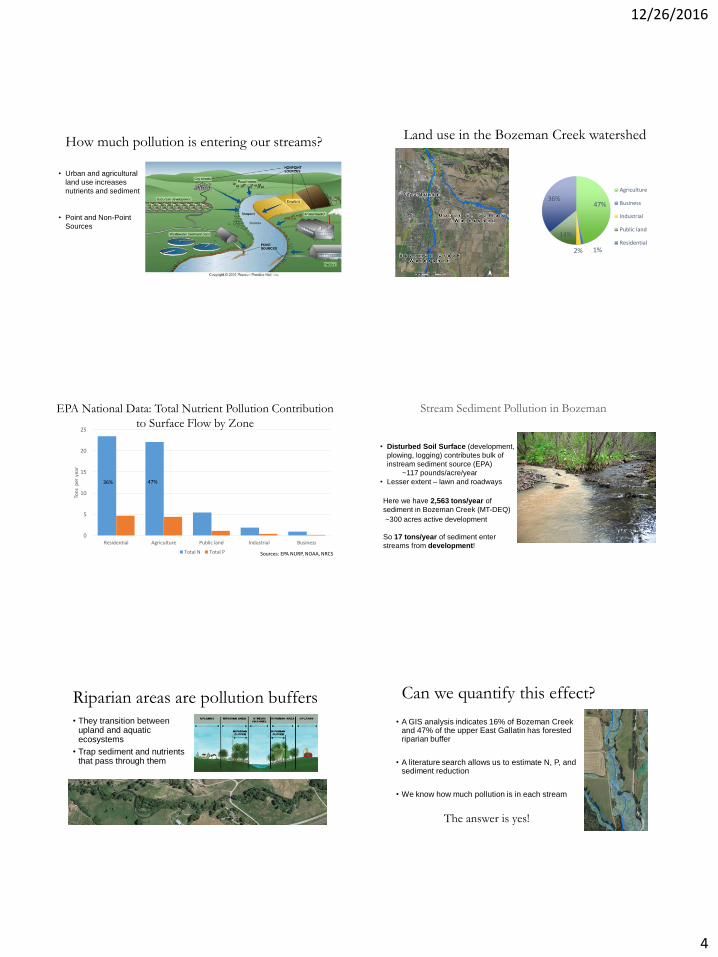
12/26/2016
4
How much pollution is entering our streams?
• Urban and agricultural
land use increases
nutrients and sediment
• Point and Non-Point
Sources
Land use in the Bozeman Creek watershed
47%
1%2%
14%
36%
Agriculture
Business
Industrial
Public land
Residential
0
5
10
15
20
25
Residential Agriculture Public land Industrial Business
Ton
s p
er y
ear
Total N Total P Sources: EPA NURP, NOAA, NRCS
36% 47%
EPA National Data: Total Nutrient Pollution Contribution
to Surface Flow by Zone
Stream Sediment Pollution in Bozeman
• Disturbed Soil Surface (development,
plowing, logging) contributes bulk of
instream sediment source (EPA)
~117 pounds/acre/year
• Lesser extent – lawn and roadways
Here we have 2,563 tons/year of
sediment in Bozeman Creek (MT-DEQ)
~300 acres active development
So 17 tons/year of sediment enter
streams from development!
Riparian areas are pollution buffers
• They transition between upland and aquatic ecosystems
• Trap sediment and nutrients that pass through them
• A GIS analysis indicates 16% of Bozeman Creek and 47% of the upper East Gallatin has forested riparian buffer
• A literature search allows us to estimate N, P, and sediment reduction
• We know how much pollution is in each stream
Can we quantify this effect?
The answer is yes!
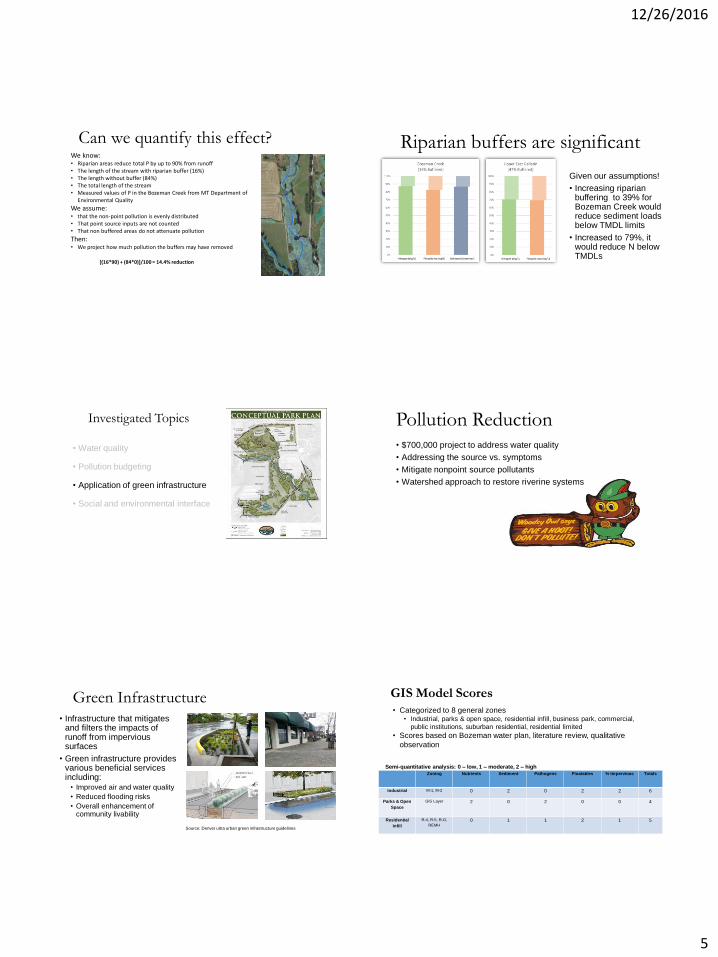
12/26/2016
5
Can we quantify this effect?We know:• Riparian areas reduce total P by up to 90% from runoff• The length of the stream with riparian buffer (16%)• The length without buffer (84%)• The total length of the stream • Measured values of P in the Bozeman Creek from MT Department of
Environmental Quality
We assume: • that the non-point pollution is evenly distributed• That point source inputs are not counted • That non buffered areas do not attenuate pollution
Then: • We project how much pollution the buffers may have removed
[(16*90) + (84*0)]/100 = 14.4% reduction
Riparian buffers are significant
Given our assumptions!
• Increasing riparian buffering to 39% for Bozeman Creek would reduce sediment loads below TMDL limits
• Increased to 79%, it would reduce N below TMDLs
Investigated Topics
• Water quality
• Pollution budgeting
• Application of green infrastructure
• Social and environmental interface
Pollution Reduction• $700,000 project to address water quality
• Addressing the source vs. symptoms
• Mitigate nonpoint source pollutants
• Watershed approach to restore riverine systems
Green Infrastructure
• Infrastructure that mitigates and filters the impacts of runoff from impervious surfaces
• Green infrastructure provides various beneficial services including:
• Improved air and water quality
• Reduced flooding risks
• Overall enhancement of community livability
Source: Denver ultra urban infrastructure guidelines
Source: Denver ultra urban green infrastructure guidelines
GIS Model Scores
Zoning Nutrients Sediment Pathogens Floatables % Impervious Totals
Industrial M-1, M-2 0 2 0 2 2 6
Parks & Open
Space
GIS Layer 2 0 2 0 0 4
Residential
Infill
R-4, R-5, R-O,
REMH
0 1 1 2 1 5
• Categorized to 8 general zones• Industrial, parks & open space, residential infill, business park, commercial,
public institutions, suburban residential, residential limited
• Scores based on Bozeman water plan, literature review, qualitative
observation
Semi-quantitative analysis: 0 – low, 1 – moderate, 2 – high
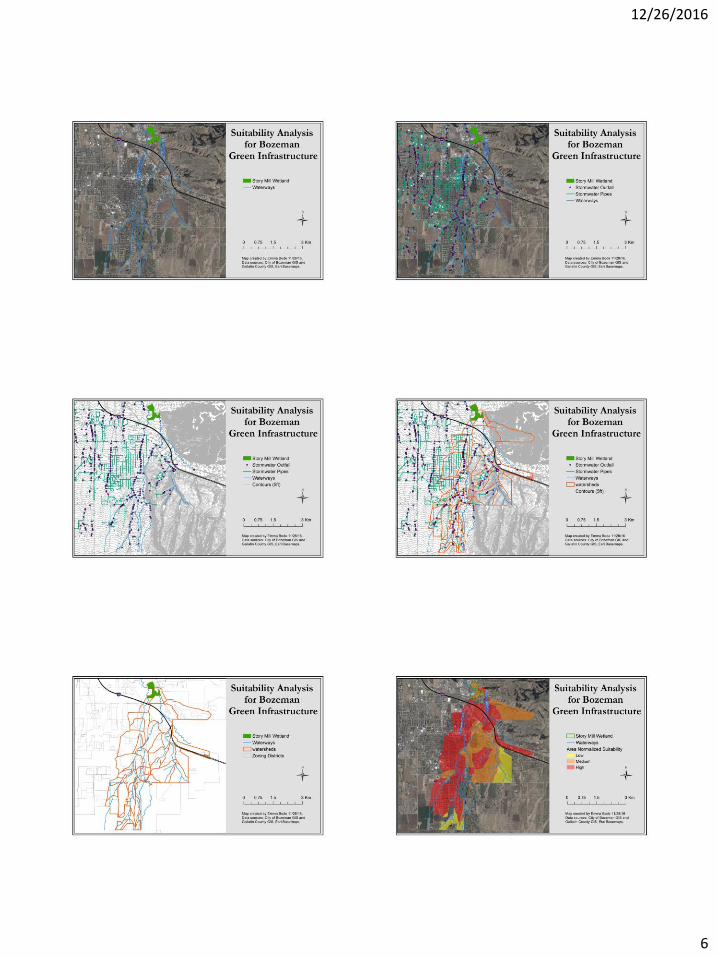
12/26/2016
6
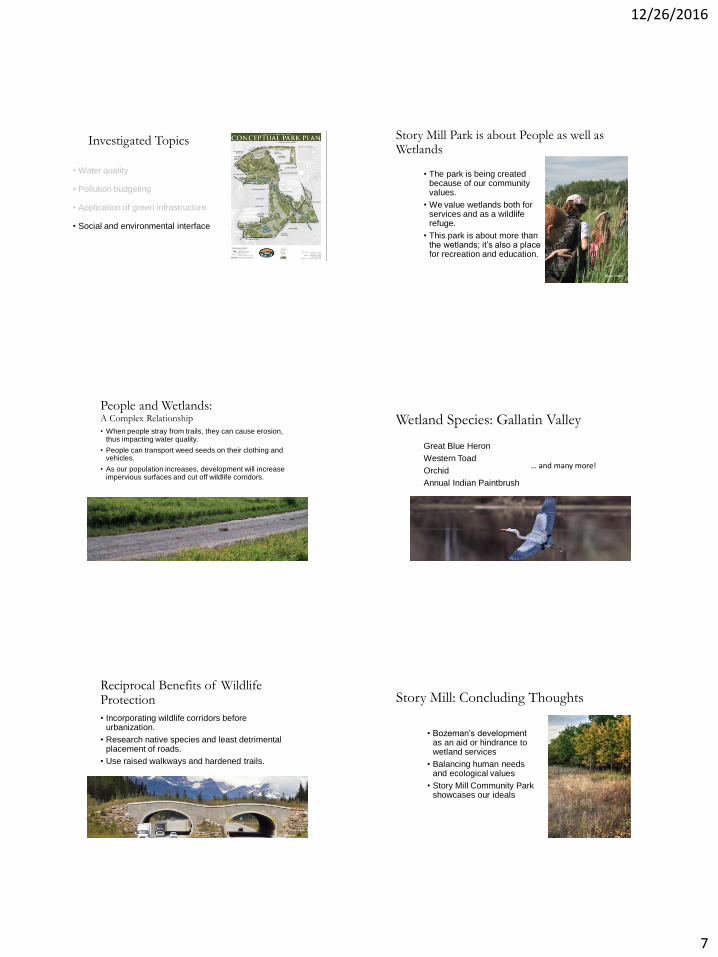
12/26/2016
7
Investigated Topics
• Water quality
• Pollution budgeting
• Application of green infrastructure
• Social and environmental interface
Story Mill Park is about People as well as Wetlands
• The park is being created because of our community values.
• We value wetlands both for services and as a wildlife refuge.
• This park is about more than the wetlands; it’s also a place for recreation and education.
People and Wetlands:A Complex Relationship
• When people stray from trails, they can cause erosion, thus impacting water quality.
• People can transport weed seeds on their clothing and vehicles.
• As our population increases, development will increase impervious surfaces and cut off wildlife corridors.
Wetland Species: Gallatin Valley
Great Blue Heron
Western Toad
Orchid
Annual Indian Paintbrush
… and many more!
Reciprocal Benefits of Wildlife Protection
• Incorporating wildlife corridors before urbanization.
• Research native species and least detrimental placement of roads.
• Use raised walkways and hardened trails.
Story Mill: Concluding Thoughts
• Bozeman’s development as an aid or hindrance to wetland services
• Balancing human needs and ecological values
• Story Mill Community Park showcases our ideals