Embed Size (px)
Citation preview

M.S.Unnikrishnan, MD & C E O,Thermax Limited
DOWNSTREAM APPLICATIONSOf
NATURAL GAS

Gas Infrastructure in Kerala Dec 2010
DISCUSSION STRUCTURE
1. THE KERALA CHALLENGE
2. GAS BASED SOLUTIONS

Gas Infrastructure in Kerala Dec 2010
DISCUSSION STRUCTURE
1. THE KERALA CHALLENGE

Gas Infrastructure in Kerala Dec 2010
ECONOMY
Economic development improves the quality of life

Gas Infrastructure in Kerala Dec 2010
ENERGY
But increases energy demand

Gas Infrastructure in Kerala Dec 2010
ENVIRONMENT
Which leads to environmental damage

Gas Infrastructure in Kerala Dec 2010
Environment
EnergyEconomy
The solution lies in the confluence

Gas Infrastructure in Kerala Dec 2010
THE KERALA CHALLENGE - JOBS
34.06
43.20
36.78
27.60
23.5021.60
POPULAT ION
( Mn.)
2010 20402020
TOTAL
PRODUCTIVE
KERALA HAS TO GENERATE 200,000 JOBS YEAR OVER YEAR
Gas Infrastructure in Kerala Dec 2010
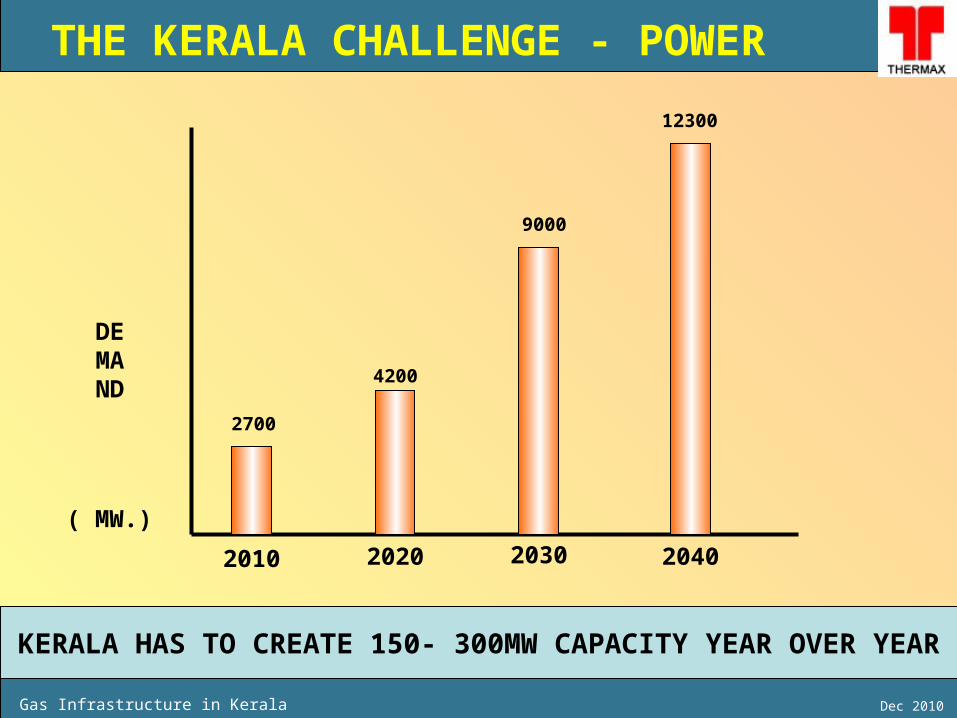
THE KERALA CHALLENGE - POWER
12300
9000
4200
2700
DEMAND
( MW.)
2010 20402020
KERALA HAS TO CREATE 150- 300MW CAPACITY YEAR OVER YEAR
2030

Gas Infrastructure in Kerala Dec 2010
THE KERALA CHALLENGE - WATER6500
6000
5500
5100DEMAND
( MLD)
2010 20402020
KERALA HAS A HUMANGOUS TASK TO PROVIDE WATER TO ITS INHABITANTS
2030
1800
PRODUCTION
UNMET GAP

Gas Infrastructure in Kerala Dec 2010
DISCUSSION STRUCTURE
2. GAS BASED SOLUTIONS

Gas Infrastructure in Kerala Dec 2010
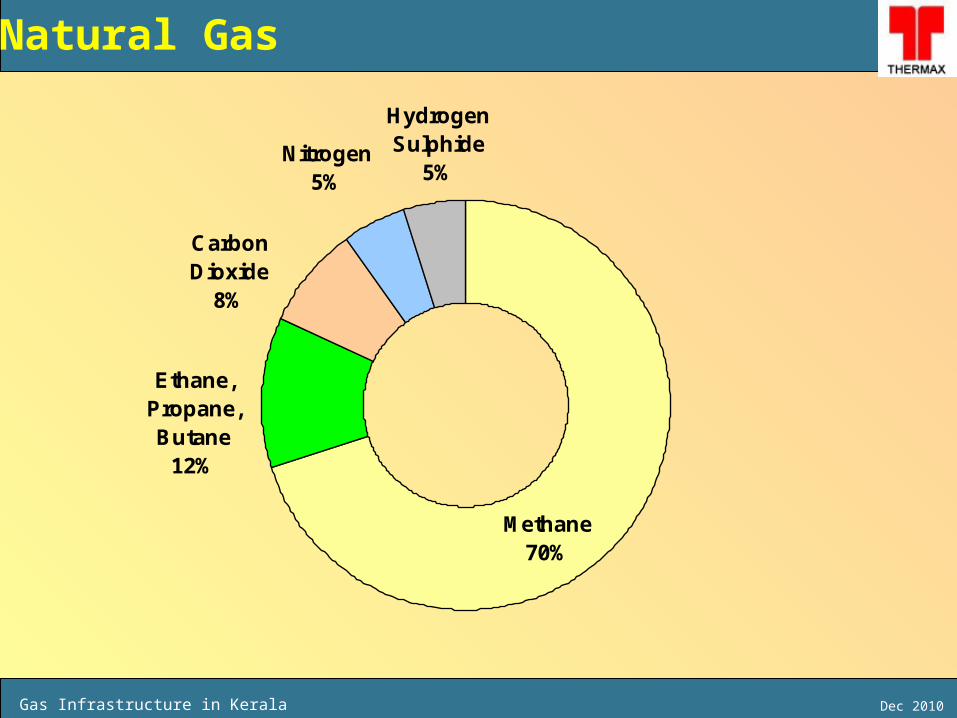
Natural Gas
Gas Infrastructure in Kerala Dec 2010
Natural Gas
Hydrogen Sulphide
5%Nitrogen
5%
Carbon Dioxide
8%
Ethane, Propane, Butane
12%
Methane70%
Gas Infrastructure in Kerala Dec 2010
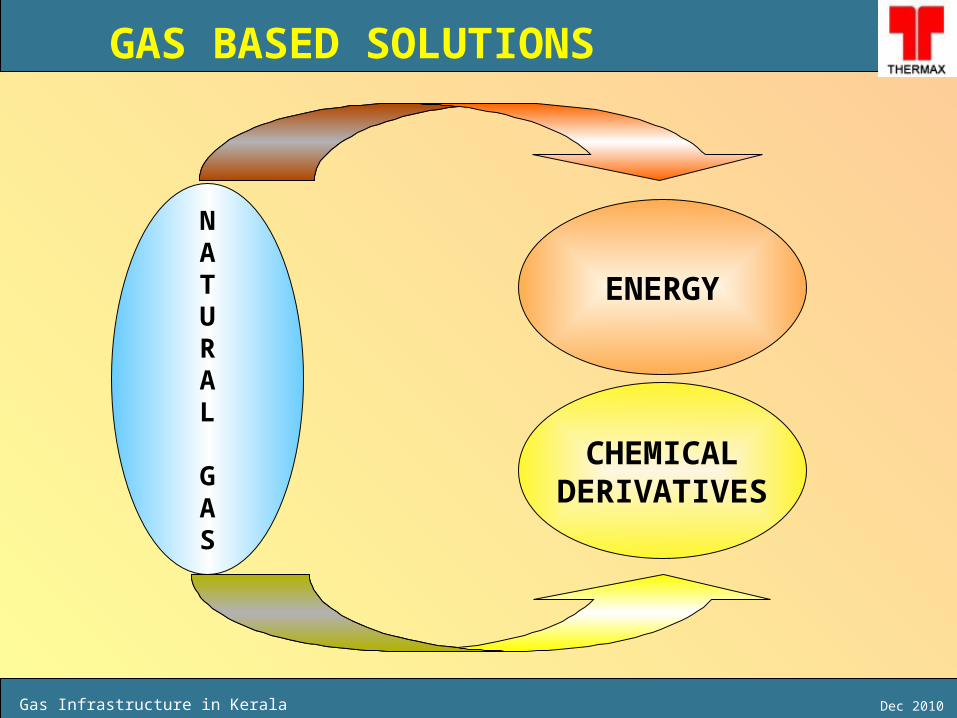
NATURAL
GAS
ENERGY
CHEMICALDERIVATIVES
GAS BASED SOLUTIONS

Gas Infrastructure in Kerala Dec 2010
DISCUSSION STRUCTURE
2. GAS BASED SOLUTIONS
( A ) ENERGY
Gas Infrastructure in Kerala Dec 2010
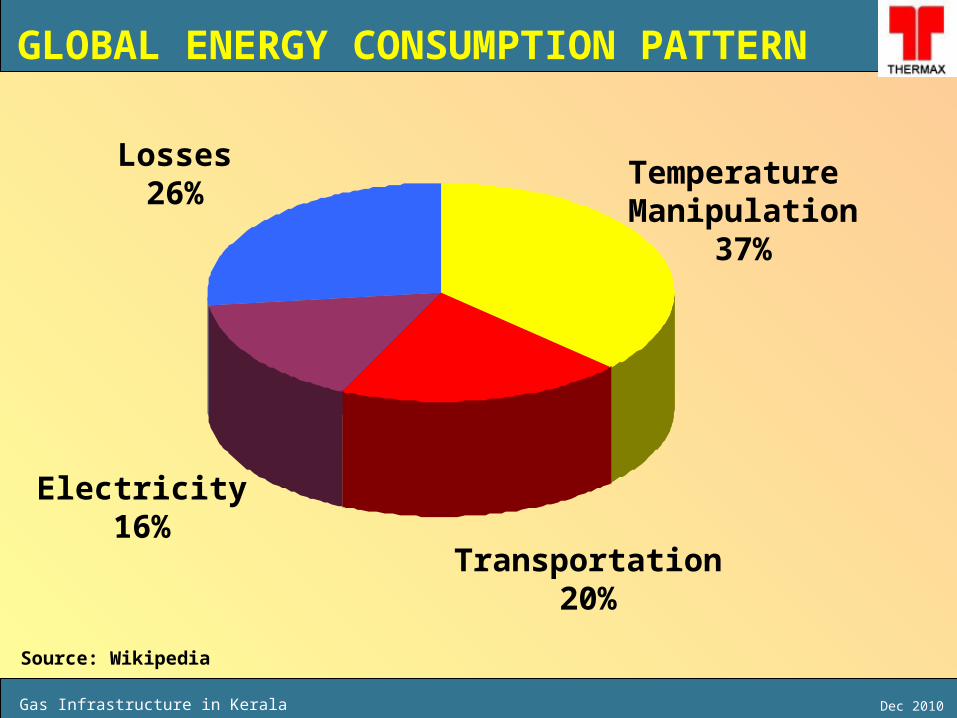
Temperature Manipulation
37%
Transportation20%
Electricity16%
Losses26%
GLOBAL ENERGY CONSUMPTION PATTERN
Source: Wikipedia

Gas Infrastructure in Kerala Dec 2010
Gas seen as the preferred energy source
0
5
10
15
20
Co
al
Na
tura
lG
as
Co
al G
as
He
avy O
il
LP
G
Pe
trole
um
A. Economical
(USD/mmbtu)
0
0.1
0.2
0.3
0.4
0.5
Lignite
Hard
Coal
HeavyO
il
Gas O
il
NaturalG
as
B. Lowest Carbon Footprint among fossil fuels
(kgCO2/Kwh fuel input)
Gas Infrastructure in Kerala Dec 2010
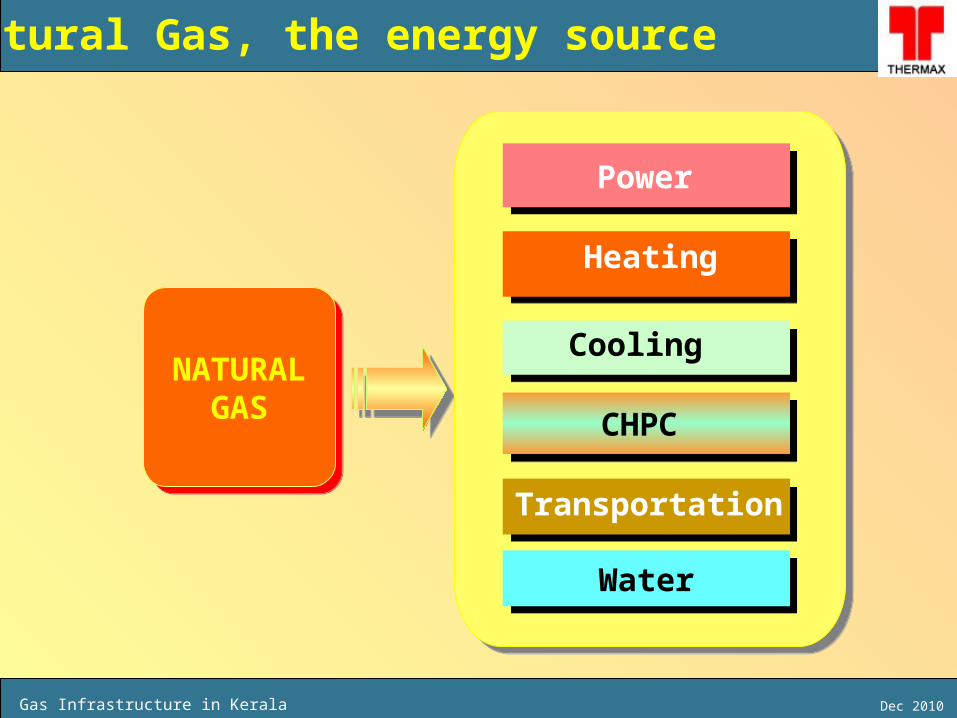
NATURALGAS
NATURALGAS
Cooling
Heating
Power
CHPC
Transportation
Natural Gas, the energy source
WaterWater

Gas Infrastructure in Kerala Dec 2010
DISCUSSION STRUCTURE
2. GAS BASED SOLUTIONS
( B ) CHEMICAL DERIVATIVES

Gas Infrastructure in Kerala Dec 2010
Natural Gas : The Chemical Route
POLYMERS
CHEMICALS
FERTILISER

Gas Infrastructure in Kerala Dec 2010
Natural Gas : The Chemical Route
POLYMERS
Fabric

Gas Infrastructure in Kerala Dec 2010
1. POLICY FRAMEWORK TO MOTIVATE INDUSTRY TO GENERATE THEIR ENERGRY NEEDS
2. STATE PROMOTED PETROCHEMICAL COMPLEX SIMILAR TO SABIC IN PPP FORMAT
3. DOWNSTREAM CLUSTERS PROMOTED BY KSIDC FOR MSME FOR (i) CHEMICAL, (ii) PLASTICS
TOWARDS PROLIFERATION OF NG

Gas Infrastructure in Kerala Dec 2010
Thank You

Gas Infrastructure in Kerala Dec 2010
Gas to drive the industrial growth in Kerala as it has done for …
Gujarat• Most developed gas market: 27% of country’s
gas based power generation, 30% of petrochem business, over 50% of sponge iron manufacturing capacity
• Combined heating , cooling & power majority used option by commercial establishments
Maharashtra• Second highest gas based power generation
capacity• MIDC following Gujarat model in developing
transmission network
Tamil Nadu• Fifth highest gas based plant capacity• 31 industries connected to the NG supply
infrastructure
Andhra Pradesh• Emerging as a second gas hub• Focus on industrial and domestic consumers

Gas Infrastructure in Kerala Dec 2010
Route Map Of Gas Distribution Network
Design Capacity: 16 MMSCMD including 4 MMSCMD as common carrier
Phase I : • 94 km pipeline from Kochi to Alwaye (Tap-off) with spur lines / feeder lines to
• Alwaye (SEZ Vyapin Kochi, GTN Textiles) • Udyogmandal (Premier Tyre Kalamassery,
REL, FACT-I, Sudchemic & Travancore Cochin)
• Binanipuram (Cochin Minerals & Binani Zinc), Ambalamedu (Kerala Chemicals & Protein Ltd. Kakkanad, FACT-II, BPCL Refinery, Hindustan Organic Ltd., Philips Carbon & MILMA)
Phase II •1018 km pipeline from Alway (Tap-off) to Kanjirrkkod, Kanjirrkkod to Mangalore and Kanjirkkod to Palghat / Palakkad with spurlines / feeder lines to
• Thrissur (Apollo Tyres), • Kottakal (Aryavaidsala), • Kozhikode (KESEB Power Plant), • Kannur (Western Plywood, Power Projects), • Mangalore (MCF) Palakkad (Indosil, Precoat &
steel industries).

Gas Infrastructure in Kerala Dec 2010
Gas Consumption Trend - Sector-wiseIndustry 2008-09 (BCM) % of Total
Energy Purposes
Power Generation 12.60 29.3%
Industrial Fuel 5.91 13.8%
Tea Plantation 0.15 0.4 %
Domestic Fuel 0.1 0.2%
Gas industry(Process) 5.71 13.3%
Others 1.54 3.6%
Total Energy Use 26.01 60.54%
Non-energy Purposes
Fertilizers 9.10 21.1%
Petrochemicals 1.11 2.6%
Others 6.76 15.7%
Total Non-energy Use 16.95 39.5%
Grand Total 42.96 100%*Source: Ministry of Petroleum & Natural Gas ** 2008-09 data Is provisional

Gas Infrastructure in Kerala Dec 2010
Significant economic gains across sectors
Power Generation
Industrial Process Heating
Transport
Household
Source: IIFL Research
• 200 MW power generation from 1 mmscmd of gas can save 35%
energy cost• Decentralized power source using
gas engine & gas turbine offer higher cycle efficiency fulfilling both Heating, Cooling & Power needs
• Substitutes expensive fuel-oil• Opex down by 20% at current fuel –oil
prices
• 1 mmscmd can runs 0.15 m vehicles
• Save emission of 25% CO2
• 1 mmscmd can support 0.9 m HH for cooking
• Lower LPG subsidy by Rs. 6.3 bn
Cooling
• Chillers using Natural gas and waste heat
• Gas driven heat pumps