Embed Size (px)
Citation preview

MTA 2017 Adopted Budget
February Financial Plan 2017 – 2020
February 2017
BUD17013_Budget2017_Cover_Budget cover 1/9/17 10:32 AM Page 1
.
TABLE OF CONTENTS
I. Overview............................................................................................................ I-1
II. MTA Consolidated Financial Plan Where the Dollars Come From and Where the Dollars Go…………………… II-1
Financial Plan: Statement of Operations…………………………………….… II-3
Reconciliation to November Plan………………………………………………... II-8
Farebox Recovery and Operating Ratios………………………………………. II-9
III. Major Assumptions Utilization………………………………………………………………………..….. III-1
Subsidies……………………………………………………………………………. III-2
Debt Service………………………………………………………………………... III-20
Debt Service Affordability Statement…………………………………………….. III-24
Positions (Headcount)……………………………………………………………... III-27
IV. Other MTA Consolidated Materials Consolidated Statements of Operations by Category:
Accrued, Cash, and Cash Conversion Detail……………….....…………….. IV-1
Year-to-Year Changes by Category……………………………………………... IV-5
Overtime Budget…………………………………………………………………… IV-6
Non-Recurring Revenues and Savings, and MTA Reserves…………………. IV-8
Consolidated 12-Month Allocation – Financials, Overtime, and Positions…… IV-10
V. MTA Capital Program Information Commitment Goals by Agency…………………………………………..……….. V-1
Completions by Agency…………………………………………………………… V-19
Operating Impacts Exceeding $1 Million…………………………………........... V-35

VI. Agency Financial Plans and 12-Month Allocations Bridges and Tunnels………………………………………………………………………... VI-1
Capital Construction Company……………………………………………………............ VI-21
Long Island Rail Road…………………………………………………………………….... VI-35
Metro-North Railroad……………………………………………………………………….. VI-57
MTA Headquarters and Inspector General………………………………………………. VI-81
First Mutual Transportation Assurance Co. (FMTAC)…………………………………... VI-113
New York City Transit………………………………………………………………………. VI-123
MTA Bus Company…………………………………………………………………………. VI-147
Staten Island Railway………………………………………………………………………. VI-171
VII. Appendix Staff Summary – MTA 2017 Budget and 2017-2020 Financial Plan………………….. VII-1
Certification of the Chairman and Chief Executive Officer……………………………… VII-11
VIII. Other The MTA Budget Process……………………………………………………………......... VIII-1

l. Overview
OVERVIEW This document includes the 2017 Adopted Budget, the 2017-2020 Financial Plan, all relevant financial tables and reconciliations to the 2016 November Plan. The purpose of the February Financial Plan (the Plan) is to incorporate Board-approved MTA Adjustments that were captured “below-the-line” and on a consolidated basis in the November Financial Plan into Agencies’ Financial Plan baseline budgets and forecasts. It also establishes a 12-month allocation of the Adopted Budget for financials, utilization and positions, which will be compared with actual results. Variances will be analyzed, reported on a monthly basis and presented to Board Committees. The February Plan also captures certain technical adjustments to MTA and Agency forecasts. Unlike the July and November Plans, the February Plan does not include any new proposals or programs; however, this Plan does include an increase in targeted savings to address projected State subsidies that are lower than projected in the November Plan – as noted below. The detailed explanation of the programs and assumptions supporting this Plan can be found in the November Financial Plan1. For more information on the MTA Budget Process, see Section VIII. In Section VI, each Agency has provided revised submissions (including reconciliation tables to the November Plan) which capture MTA Plan Adjustments on a non-reimbursable, reimbursable and cash basis.
The November Plan The November Plan, which was approved by the Board in December 2016, projected small to breakeven cash balances through 2019, with a deficit of $319 million in 2020.
Changes to the November Plan The 2017 February Plan includes important policy actions and re-estimates that were highlighted “below-the-line” in the November Plan. With Board approval secured, these items are now included within the MTA baseline. Most of these re-categorizations had no impact on the bottom line and are explained in the Additional Information section at the end of this Overview. There was, however, a modest change in the projected revenue for the March 2017 Fare and Toll Increase Fare and Toll Increase in March 2017 (4% Price) - A $280 million annualized increase in MTA consolidated farebox and toll revenues is assumed for implementation on March 19, 2017. Excluding MTA Bus and SIR, revenues are expected to increase by $220 million in 2017, $275 million in 2018, $276 million in 2019 and $277 million in 2020. MTA Bus revenue is expected to increase by $5 million in 2017 and by $7 million annually for 2018 through 2020, while SIR revenue is expected to increase by $0.2 million in 2017 and by $0.3 million in subsequent years; the additional MTA Bus and SIR revenues are used to hold down the NYC subsidies that cover the costs associated with these operations. Additionally, 10% of all B&T surplus toll revenues
1 The 2016 November Financial Plan was approved by the MTA Board at its December 2016 meeting and can be
found at http://web.mta.info/mta/budget under 2016: MTA 2017 Final Proposed Budget - November Financial Plan 2017-2020.
I-1
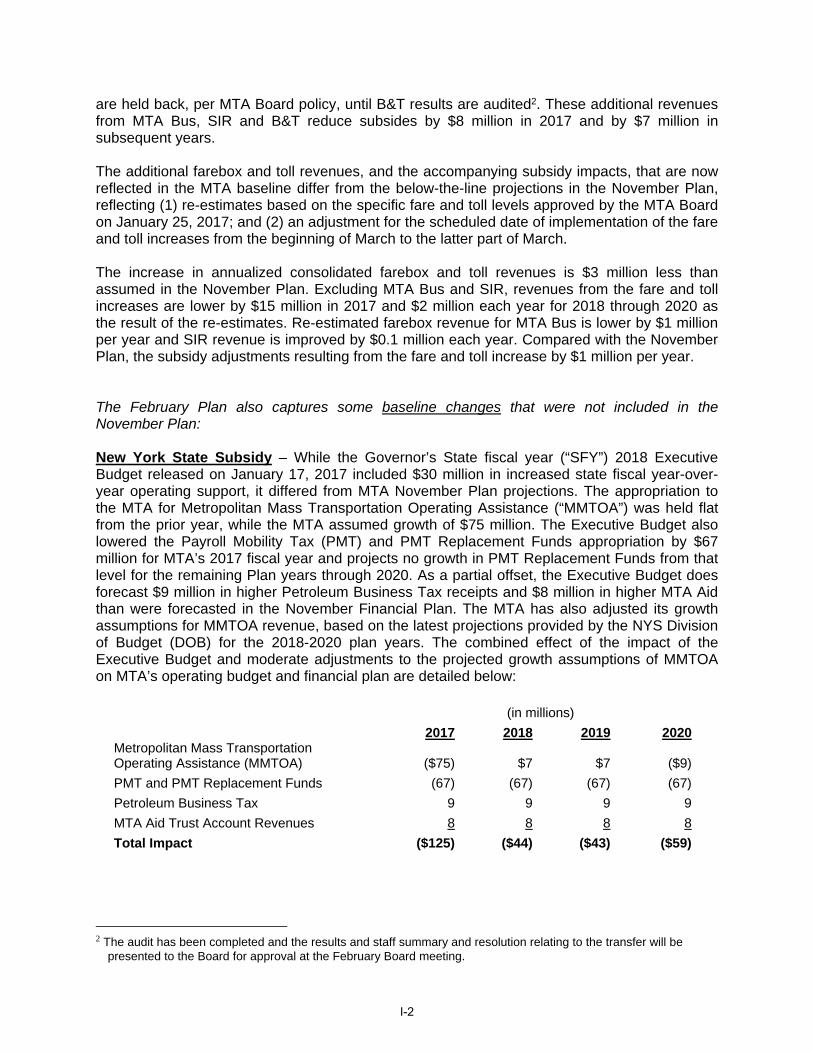
are held back, per MTA Board policy, until B&T results are audited2. These additional revenues from MTA Bus, SIR and B&T reduce subsides by $8 million in 2017 and by $7 million in subsequent years. The additional farebox and toll revenues, and the accompanying subsidy impacts, that are now reflected in the MTA baseline differ from the below-the-line projections in the November Plan, reflecting (1) re-estimates based on the specific fare and toll levels approved by the MTA Board on January 25, 2017; and (2) an adjustment for the scheduled date of implementation of the fare and toll increases from the beginning of March to the latter part of March. The increase in annualized consolidated farebox and toll revenues is $3 million less than assumed in the November Plan. Excluding MTA Bus and SIR, revenues from the fare and toll increases are lower by $15 million in 2017 and $2 million each year for 2018 through 2020 as the result of the re-estimates. Re-estimated farebox revenue for MTA Bus is lower by $1 million per year and SIR revenue is improved by $0.1 million each year. Compared with the November Plan, the subsidy adjustments resulting from the fare and toll increase by $1 million per year. The February Plan also captures some baseline changes that were not included in the November Plan: New York State Subsidy – While the Governor’s State fiscal year (“SFY”) 2018 Executive Budget released on January 17, 2017 included $30 million in increased state fiscal year-over-year operating support, it differed from MTA November Plan projections. The appropriation to the MTA for Metropolitan Mass Transportation Operating Assistance (“MMTOA”) was held flat from the prior year, while the MTA assumed growth of $75 million. The Executive Budget also lowered the Payroll Mobility Tax (PMT) and PMT Replacement Funds appropriation by $67 million for MTA’s 2017 fiscal year and projects no growth in PMT Replacement Funds from that level for the remaining Plan years through 2020. As a partial offset, the Executive Budget does forecast $9 million in higher Petroleum Business Tax receipts and $8 million in higher MTA Aid than were forecasted in the November Financial Plan. The MTA has also adjusted its growth assumptions for MMTOA revenue, based on the latest projections provided by the NYS Division of Budget (DOB) for the 2018-2020 plan years. The combined effect of the impact of the Executive Budget and moderate adjustments to the projected growth assumptions of MMTOA on MTA’s operating budget and financial plan are detailed below:
(in millions)
2017 2018 2019 2020 Metropolitan Mass Transportation Operating Assistance (MMTOA) ($75) $7 $7 ($9)
PMT and PMT Replacement Funds (67) (67) (67) (67)
Petroleum Business Tax 9 9 9 9
MTA Aid Trust Account Revenues 8 8 8 8
Total Impact ($125) ($44) ($43) ($59)
2 The audit has been completed and the results and staff summary and resolution relating to the transfer will be
presented to the Board for approval at the February Board meeting.
I-2
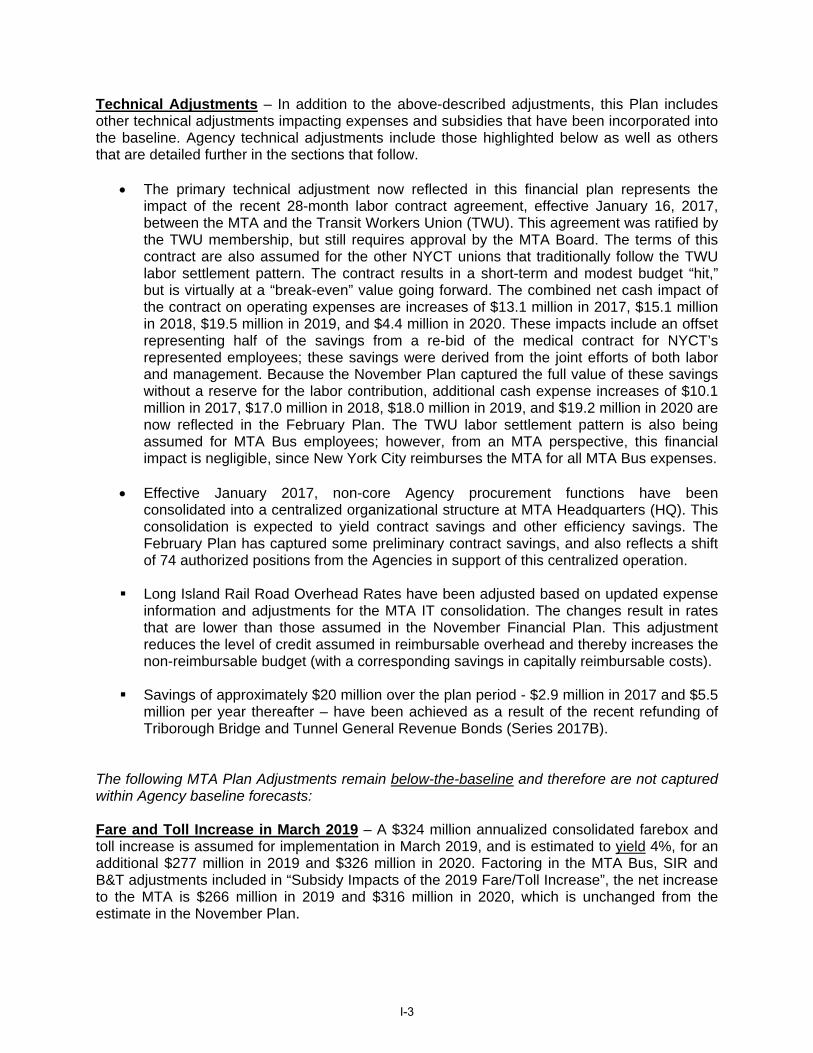
Technical Adjustments – In addition to the above-described adjustments, this Plan includes other technical adjustments impacting expenses and subsidies that have been incorporated into the baseline. Agency technical adjustments include those highlighted below as well as others that are detailed further in the sections that follow.
The primary technical adjustment now reflected in this financial plan represents the impact of the recent 28-month labor contract agreement, effective January 16, 2017, between the MTA and the Transit Workers Union (TWU). This agreement was ratified by the TWU membership, but still requires approval by the MTA Board. The terms of this contract are also assumed for the other NYCT unions that traditionally follow the TWU labor settlement pattern. The contract results in a short-term and modest budget “hit,” but is virtually at a “break-even” value going forward. The combined net cash impact of the contract on operating expenses are increases of $13.1 million in 2017, $15.1 million in 2018, $19.5 million in 2019, and $4.4 million in 2020. These impacts include an offset representing half of the savings from a re-bid of the medical contract for NYCT’s represented employees; these savings were derived from the joint efforts of both labor and management. Because the November Plan captured the full value of these savings without a reserve for the labor contribution, additional cash expense increases of $10.1 million in 2017, $17.0 million in 2018, $18.0 million in 2019, and $19.2 million in 2020 are now reflected in the February Plan. The TWU labor settlement pattern is also being assumed for MTA Bus employees; however, from an MTA perspective, this financial impact is negligible, since New York City reimburses the MTA for all MTA Bus expenses.
Effective January 2017, non-core Agency procurement functions have been consolidated into a centralized organizational structure at MTA Headquarters (HQ). This consolidation is expected to yield contract savings and other efficiency savings. The February Plan has captured some preliminary contract savings, and also reflects a shift of 74 authorized positions from the Agencies in support of this centralized operation.
Long Island Rail Road Overhead Rates have been adjusted based on updated expense information and adjustments for the MTA IT consolidation. The changes result in rates that are lower than those assumed in the November Financial Plan. This adjustment reduces the level of credit assumed in reimbursable overhead and thereby increases the non-reimbursable budget (with a corresponding savings in capitally reimbursable costs).
Savings of approximately $20 million over the plan period - $2.9 million in 2017 and $5.5
million per year thereafter – have been achieved as a result of the recent refunding of Triborough Bridge and Tunnel General Revenue Bonds (Series 2017B).
The following MTA Plan Adjustments remain below-the-baseline and therefore are not captured within Agency baseline forecasts: Fare and Toll Increase in March 2019 – A $324 million annualized consolidated farebox and toll increase is assumed for implementation in March 2019, and is estimated to yield 4%, for an additional $277 million in 2019 and $326 million in 2020. Factoring in the MTA Bus, SIR and B&T adjustments included in “Subsidy Impacts of the 2019 Fare/Toll Increase”, the net increase to the MTA is $266 million in 2019 and $316 million in 2020, which is unchanged from the estimate in the November Plan.
I-3
MTA Efficiencies – Not Yet Implemented – The MTA is committed to continuing its program of identifying efficiencies that result in overall recurring savings for the organization, and areas under review to achieve these savings include procurement efficiencies, savings in IT, insurance and office space efficiencies. The MTA has now identified savings programs that have virtually met the savings targets from pre-2016 Financial Plans. The remaining values in this category are zero in 2016 and 2017 (and approaching zero in the out years). Accordingly, the MTA increased savings targets last July by an incremental $50 million per year starting in 2017 with savings from these new targets growing to $200 million in 2020.These categories of MTA Efficiencies, that remain below-the-line, are intended to reduce future deficits and will be incorporated into Agency baselines as they are further developed. These savings show a slight increase from November to offset a very small reduction in the total value of implemented savings. The following February Plan Adjustments have been added below-the-baseline and therefore are not captured within Agency baseline forecasts: Additional MTA Efficiencies – Targeted in February 2017 Plan – In response re-estimates with a net recurring unfavorable value, the MTA is increasing its savings targets in this Plan by $25 million in 2017 and $50 million per year thereafter. When combined with previous targets, the remaining value of MTA Efficiencies that have not yet been implemented is $68 million in 2017, $166 million in 2018, $220 million in 2019 and $262 million in 2020. When combined with savings programs that have already been implemented, meeting these targets will increase the level of annual savings to $2 billion per year by 2020. MTA Policy Actions
Sandy Insurance Reimbursement for Business Interruption - The MTA has reached a global and unallocated final insurance settlement for losses incurred during Superstorm Sandy. Included in the losses were $100 million for reductions in revenue (i.e., business interruption losses) that were covered by MTA insurance, and the Plan assumes that $100 million of the insurance proceeds will be used to reimburse these losses. New York State Capital Funding Commitment – The NYS DOB has now advanced the $104 million of appropriated MMTOA funds that it had committed to the 2015-2019 Capital Program. NYS DOB has expressed its intention to release over the next twelve months $600 million of additional committed funding for the 2010-2014 Capital Program. The earlier than anticipated receipt of this $704 million in funding will allow the MTA to defer the issuance of previously scheduled bonding and will lower debt service by $12 million in 2017 and $38 million per year thereafter. Adjustments to Committed to Capital Contributions - In the November Plan, $280 million of favorable 2016 cash balances were assumed to be used to accelerate Committed to Capital contributions that were planned for 2019 and 2020. This strategy reduced projected debt service payments by $58 million over the plan period. Budgetary changes captured in this Plan are resulting in cash balances that are slightly less favorable than was anticipated in November. To adjust for this, $50 million of the planned 2017 contribution will be deferred until 2018 and $25 million of the 2019 contribution will be deferred until 2020. These adjustments slightly accelerate the need to issue debt when compared with November, and debt service is projected to increase by $4 million over the plan period. The net impact of this strategy is still an overall reduction in debt service of $54 million over the plan period.
I-4

The Bottom Line As a result of technical adjustments and other changes, year-ending cash positions have changed from the November Plan. This Plan is projecting year-end cash balances of $260 million in 2016, $24 million in 2017, $27 million in 2018 and $7 million in 2019, with a projected cash deficit of $372 million in 2020. The Plan includes funding for all of the programs included in November while reflecting a manageable increase in the 2020 projected deficit. The $372 million projected cash deficit for 2020 is higher than the $319 million that the Board approved in December because unfavorable “one-shots” necessary to address the labor settlement and the MMTOA subsidy reduction exceeded the value of the “one-shot” insurance recovery. Excluding these unfavorable impacts on carryover cash balances, the MTA’s operating cash position is virtually unchanged from the November Plan for the years 2019 and beyond.
I-5
Additional Information These Plan adjustments from July and November have now been baselined in the February Plan, with no impact on the bottom line:
Policy Actions from the July 2016 Plan Committed to Capital – Additional Funding from DS Savings - As proposed in prior Plans, whenever possible, the MTA utilizes favorable debt service savings to provide funding for the Capital Program. In the July Plan, the MTA diverted the debt service savings from lower interest rates (both realized and projected) and the debt service savings from the Hudson Yards lease securitization project to provide additional Capital funding. Total contributions to the Capital Program from these savings totaled $84 million in 2016, $81 million in 2017, $108 million in 2018, $121 million in 2019 and $134 million in 2020. Acceleration of Committed to Capital Contribution – As a result of favorable timing and other re-estimates, the MTA used $200 million of 2016 operating funds to accelerate a portion of its planned future Committed to Capital contributions. This acceleration will lower debt service payments over the Plan period and replace $150 million of the 2019 contribution and $50 million of the 2020 contribution to help fund, when needed, the necessary operational investments detailed in this Plan. Debt Service Savings from Acceleration of Contribution – The aforementioned acceleration of $150 million from the 2019 and $50 million from the planned 2020 Capital Contributions will defer the need to issue bonds and will result in lower debt service payments of approximately $12 million per year for the years 2017 to 2019 and $3 million for 2020, for total Plan savings of $39 million. Committed to Capital – DS Savings from Acceleration of Contributions – The debt service savings resulting from the acceleration of committed to capital contributions were also diverted to fund the Capital Program. Total contributions to the Capital Program from these savings amounted to $12 million per year from 2017 to 2019 and $3 million for 2020.
Policy Actions and MTA Re-estimates from the November 2016 Plan Acceleration of Committed to Capital Contribution – In this Plan, an additional $80 million of 2016 operating funds was used to accelerate Committed to Capital contributions previously scheduled for 2020. This acceleration will lower debt service payments over the Plan period. Debt Service Savings from Acceleration of Contribution – The aforementioned acceleration of $80 million from the 2020 Capital Contributions will defer the need to issue bonds and will result in lower debt service payments of approximately $5 million per year for the years 2017 to 2020, for total Plan savings of $20 million. Invest 2016 General Reserve to Reduce Pension Liability – Consistent with the MTA Board-approved policy to use non-recurring resources to make one-time payments towards long-term obligations that will reduce recurring annual expenses, the MTA will release the unexpended 2016 General Reserve balance of $145 million and use it to reduce the LIRR unfunded pension liability. This investment will lower the projected amortization payment of this unfunded liability by $16 million annually beginning in 2018. Debt Service Savings from Lower Variable Rates and New Refunding – Following the completion of November Plan Debt Service forecasts, the MTA initiated a bond refunding that was not included in the Plan and resulted in lower debt service expenses from lower rates. Savings of $6 million in 2016, $17 million in 2017, $18 million in 2018, $20 million in 2019 and $19 million in 2020 are now in the baseline forecast.
I-6
II. MTA Consolidated Financial Plan
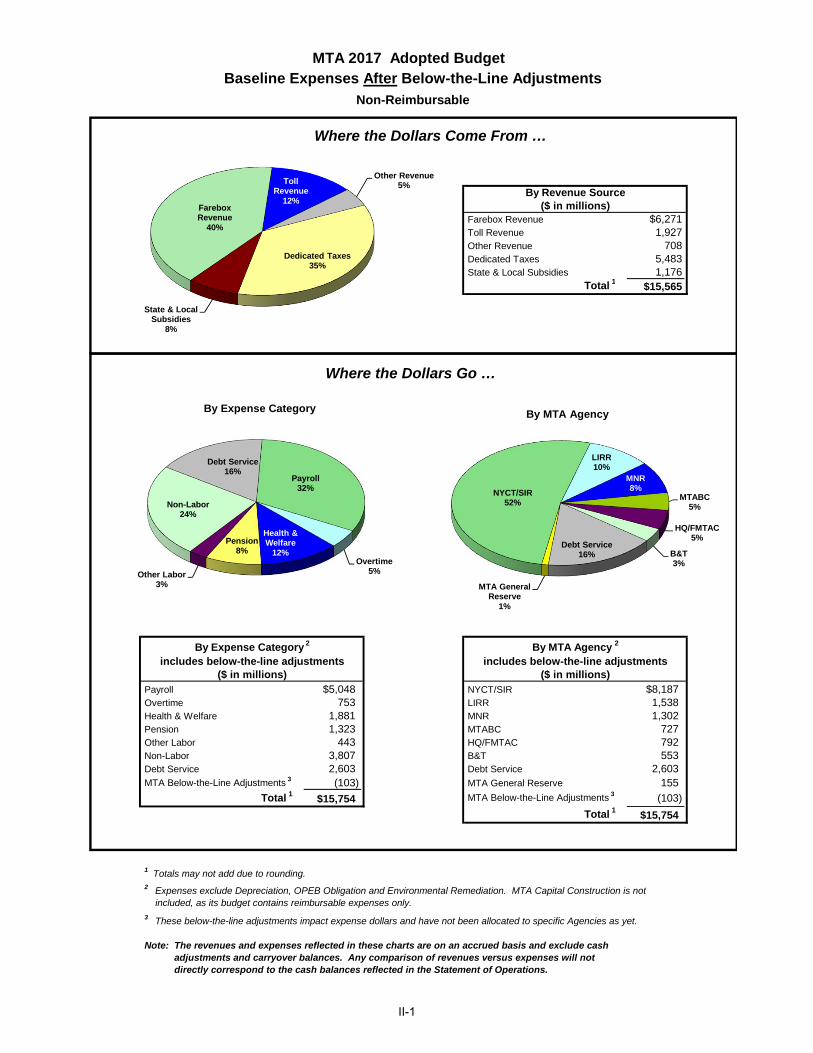
Farebox Revenue $6,271Toll Revenue 1,927Other Revenue 708Dedicated Taxes 5,483State & Local Subsidies 1,176
Total 1 $15,565
Payroll $5,048 NYCT/SIR $8,187Overtime 753 LIRR 1,538 Health & Welfare 1,881 MNR 1,302 Pension 1,323 MTABC 727 Other Labor 443 HQ/FMTAC 792 Non-Labor 3,807 B&T 553 Debt Service 2,603 Debt Service 2,603 MTA Below-the-Line Adjustments 3 (103) MTA General Reserve 155
Total 1 $15,754 MTA Below-the-Line Adjustments 3 (103)
Total 1 $15,754
($ in millions) ($ in millions)
Where the Dollars Come From …
MTA 2017 Adopted Budget Baseline Expenses After Below-the-Line Adjustments
Non-Reimbursable
includes below-the-line adjustments includes below-the-line adjustments
By Revenue Source($ in millions)
By Expense Category 2 By MTA Agency 2
Where the Dollars Go …
2 Expenses exclude Depreciation, OPEB Obligation and Environmental Remediation. MTA Capital Construction is not included, as its budget contains reimbursable expenses only.
3 These below-the-line adjustments impact expense dollars and have not been allocated to specific Agencies as yet.
1 Totals may not add due to rounding.
Note: The revenues and expenses reflected in these charts are on an accrued basis and exclude cash adjustments and carryover balances. Any comparison of revenues versus expenses will not directly correspond to the cash balances reflected in the Statement of Operations.
Farebox Revenue
40%
Toll Revenue
12%
Other Revenue5%
Dedicated Taxes35%
State & Local Subsidies
8%
Payroll32%
Overtime5%
Health &Welfare
12%
Pension8%
Other Labor3%
Non-Labor24%
Debt Service16%
By Expense Category
NYCT/SIR52%
LIRR10%
MNR8%
MTABC5%
HQ/FMTAC5%
B&T3%
Debt Service16%
MTA General Reserve
1%
By MTA Agency
II-1

[THIS PAGE INTENTIONALLY LEFT BLANK]
II-2
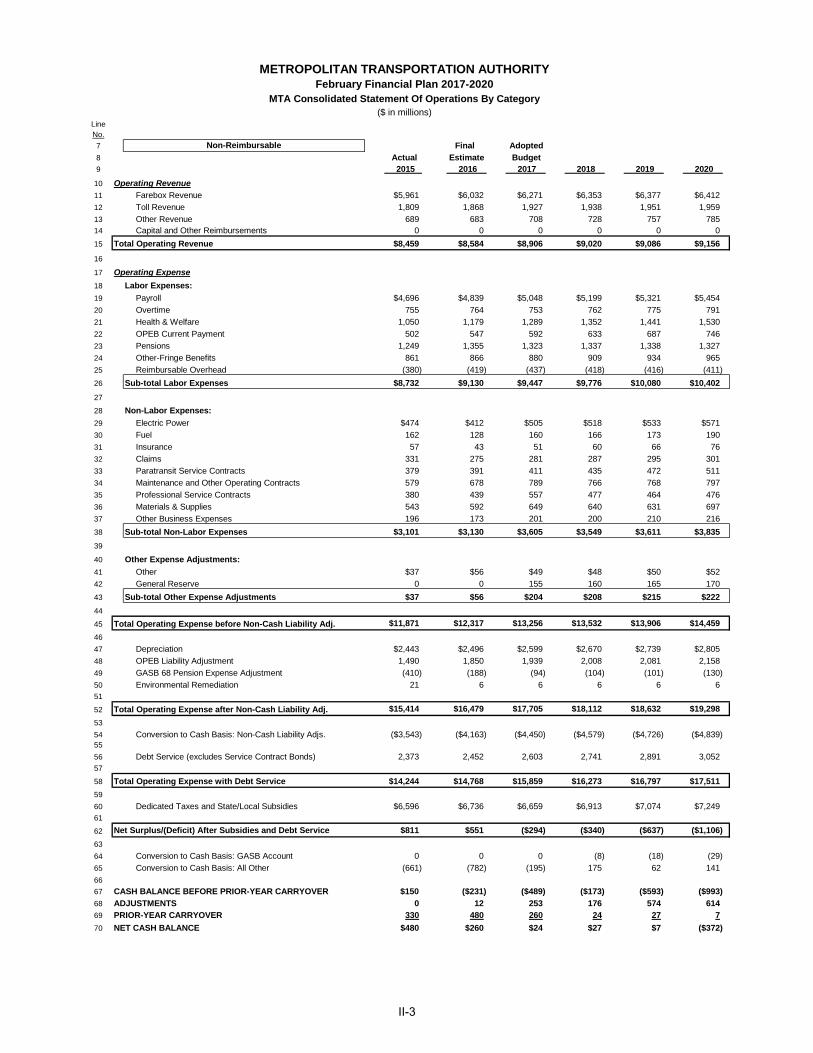
LineNo. 7 Final Adopted
8 Actual Estimate Budget 9 2015 2016 2017 2018 2019 2020
10 Operating Revenue
11 Farebox Revenue $5,961 $6,032 $6,271 $6,353 $6,377 $6,412
12 Toll Revenue 1,809 1,868 1,927 1,938 1,951 1,959
13 Other Revenue 689 683 708 728 757 785 14 Capital and Other Reimbursements 0 0 0 0 0 0
15 Total Operating Revenue $8,459 $8,584 $8,906 $9,020 $9,086 $9,156
16
17 Operating Expense
18 Labor Expenses:
19 Payroll $4,696 $4,839 $5,048 $5,199 $5,321 $5,454
20 Overtime 755 764 753 762 775 791
21 Health & Welfare 1,050 1,179 1,289 1,352 1,441 1,530
22 OPEB Current Payment 502 547 592 633 687 746
23 Pensions 1,249 1,355 1,323 1,337 1,338 1,327
24 Other-Fringe Benefits 861 866 880 909 934 965
25 Reimbursable Overhead (380) (419) (437) (418) (416) (411)
26 Sub-total Labor Expenses $8,732 $9,130 $9,447 $9,776 $10,080 $10,402
27
28 Non-Labor Expenses:
29 Electric Power $474 $412 $505 $518 $533 $571
30 Fuel 162 128 160 166 173 190
31 Insurance 57 43 51 60 66 76
32 Claims 331 275 281 287 295 301
33 Paratransit Service Contracts 379 391 411 435 472 511
34 Maintenance and Other Operating Contracts 579 678 789 766 768 797
35 Professional Service Contracts 380 439 557 477 464 476
36 Materials & Supplies 543 592 649 640 631 697
37 Other Business Expenses 196 173 201 200 210 216
38 Sub-total Non-Labor Expenses $3,101 $3,130 $3,605 $3,549 $3,611 $3,835
39
40 Other Expense Adjustments:
41 Other $37 $56 $49 $48 $50 $52
42 General Reserve 0 0 155 160 165 170
43 Sub-total Other Expense Adjustments $37 $56 $204 $208 $215 $222
44
45 Total Operating Expense before Non-Cash Liability Adj. $11,871 $12,317 $13,256 $13,532 $13,906 $14,459
46
47 Depreciation $2,443 $2,496 $2,599 $2,670 $2,739 $2,805
48 OPEB Liability Adjustment 1,490 1,850 1,939 2,008 2,081 2,158
49 GASB 68 Pension Expense Adjustment (410) (188) (94) (104) (101) (130)
50 Environmental Remediation 21 6 6 6 6 651
52 Total Operating Expense after Non-Cash Liability Adj. $15,414 $16,479 $17,705 $18,112 $18,632 $19,298
53
54 Conversion to Cash Basis: Non-Cash Liability Adjs. ($3,543) ($4,163) ($4,450) ($4,579) ($4,726) ($4,839)55
56 Debt Service (excludes Service Contract Bonds) 2,373 2,452 2,603 2,741 2,891 3,05257
58 Total Operating Expense with Debt Service $14,244 $14,768 $15,859 $16,273 $16,797 $17,511
59
60 Dedicated Taxes and State/Local Subsidies $6,596 $6,736 $6,659 $6,913 $7,074 $7,24961
62 Net Surplus/(Deficit) After Subsidies and Debt Service $811 $551 ($294) ($340) ($637) ($1,106)
63
64 Conversion to Cash Basis: GASB Account 0 0 0 (8) (18) (29)
65 Conversion to Cash Basis: All Other (661) (782) (195) 175 62 141
66
67 CASH BALANCE BEFORE PRIOR-YEAR CARRYOVER $150 ($231) ($489) ($173) ($593) ($993)
68 ADJUSTMENTS 0 12 253 176 574 614
69 PRIOR-YEAR CARRYOVER 330 480 260 24 27 7
70 NET CASH BALANCE $480 $260 $24 $27 $7 ($372)
($ in millions)
Non-Reimbursable
METROPOLITAN TRANSPORTATION AUTHORITYFebruary Financial Plan 2017-2020
MTA Consolidated Statement Of Operations By Category
II-3

Line
No. 7 Final Adopted 8 Actual Estimate Budget
9 2015 2016 2017 2018 2019 2020
10
11 Cash Balance Before Prior-Year Carry-over $150 ($231) ($489) ($173) ($593) ($993)
12
13 Fare/Toll Increases:
14 Fare/Toll Increase in March 2019 (4% Yield) - - - 277 326
15 Subsidy Impacts of 2019 Fare/Toll Increase - - - (11) (10)
16 Sub-Total $0 $0 $0 $266 $31617
18 MTA Efficiencies: 1
19 MTA Efficiencies - Not Yet Implemented - 2 16 20 12
20 Additional MTA Efficiencies - 2016 July Plan - 41 100 150 200
21 Additional MTA Efficiencies - 2017 February Plan - 25 50 50 50
22 Sub-Total $0 $68 $166 $220 $26223
24 Policy Actions:
25 Sandy Insurance Reimbursement for Business Interruption - 100 - - -
26 Reduced Debt Service from NYS Capital Funding Commitment - 12 38 38 38
27 Adjustments to Committed to Capital Contribution - 50 (50) 25 (25)
28 Debt Service Impact of Adjustments - - (3) - (1)
29 Sub-Total $0 $161 ($14) $63 $12
30
31 MTA Re-estimates:
32 Other MTA Re-estimates 12 24 24 24 24
33 Sub-Total $12 $24 $24 $24 $24
34
35 TOTAL ADJUSTMENTS $12 $253 $176 $574 $614
36
37 Prior-Year Carry-Over 330 480 260 24 27 738
39 Net Cash Surplus/(Deficit) $480 $260 $24 $27 $7 ($372)
METROPOLITAN TRANSPORTATION AUTHORITYFebruary Financial Plan 2017-2020
($ in millions)Plan Adjustments
II-4
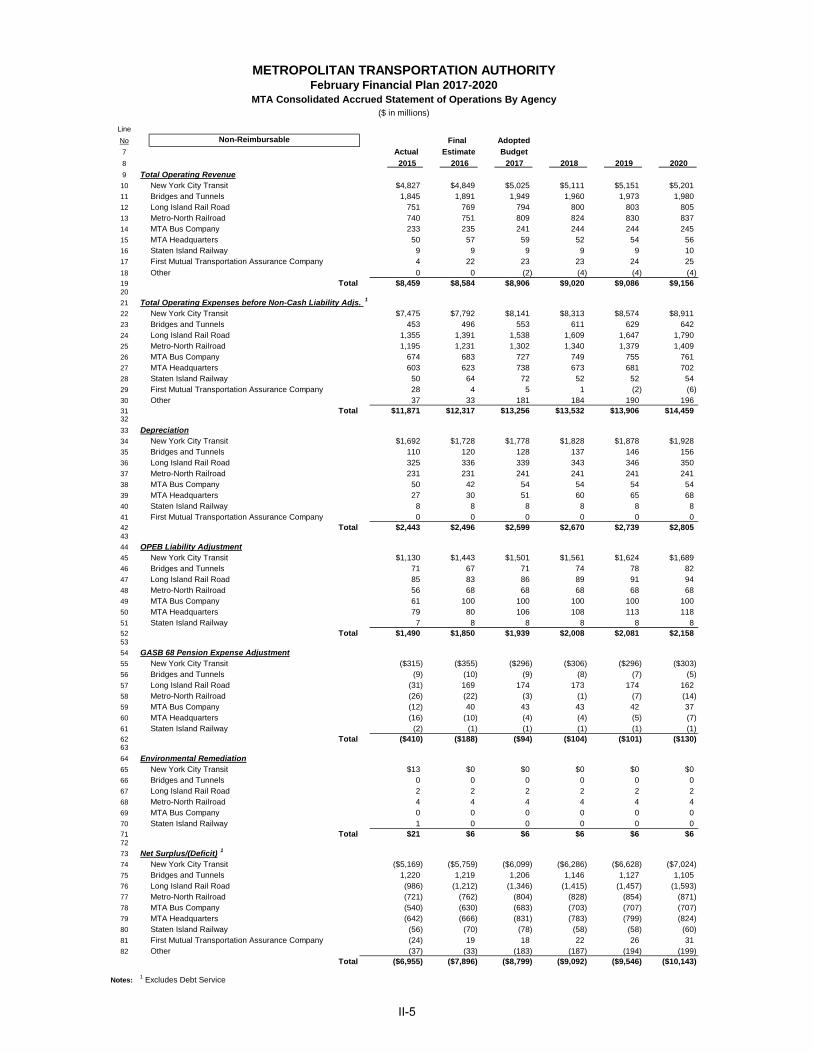
Line
No Non-Reimbursable Final Adopted
7 Actual Estimate Budget
8 2015 2016 2017 2018 2019 2020
9 Total Operating Revenue10 New York City Transit $4,827 $4,849 $5,025 $5,111 $5,151 $5,20111 Bridges and Tunnels 1,845 1,891 1,949 1,960 1,973 1,980 12 Long Island Rail Road 751 769 794 800 803 80513 Metro-North Railroad 740 751 809 824 830 83714 MTA Bus Company 233 235 241 244 244 24515 MTA Headquarters 50 57 59 52 54 5616 Staten Island Railway 9 9 9 9 9 1017 First Mutual Transportation Assurance Company 4 22 23 23 24 25
18 Other 0 0 (2) (4) (4) (4)19 Total $8,459 $8,584 $8,906 $9,020 $9,086 $9,15620
21 Total Operating Expenses before Non-Cash Liability Adjs. 1
22 New York City Transit $7,475 $7,792 $8,141 $8,313 $8,574 $8,91123 Bridges and Tunnels 453 496 553 611 629 64224 Long Island Rail Road 1,355 1,391 1,538 1,609 1,647 1,79025 Metro-North Railroad 1,195 1,231 1,302 1,340 1,379 1,40926 MTA Bus Company 674 683 727 749 755 76127 MTA Headquarters 603 623 738 673 681 70228 Staten Island Railway 50 64 72 52 52 5429 First Mutual Transportation Assurance Company 28 4 5 1 (2) (6)30 Other 37 33 181 184 190 19631 Total $11,871 $12,317 $13,256 $13,532 $13,906 $14,45932
33 Depreciation34 New York City Transit $1,692 $1,728 $1,778 $1,828 $1,878 $1,92835 Bridges and Tunnels 110 120 128 137 146 15636 Long Island Rail Road 325 336 339 343 346 35037 Metro-North Railroad 231 231 241 241 241 24138 MTA Bus Company 50 42 54 54 54 5439 MTA Headquarters 27 30 51 60 65 6840 Staten Island Railway 8 8 8 8 8 841 First Mutual Transportation Assurance Company 0 0 0 0 0 042 Total $2,443 $2,496 $2,599 $2,670 $2,739 $2,80543
44 OPEB Liability Adjustment45 New York City Transit $1,130 $1,443 $1,501 $1,561 $1,624 $1,68946 Bridges and Tunnels 71 67 71 74 78 8247 Long Island Rail Road 85 83 86 89 91 9448 Metro-North Railroad 56 68 68 68 68 6849 MTA Bus Company 61 100 100 100 100 10050 MTA Headquarters 79 80 106 108 113 11851 Staten Island Railway 7 8 8 8 8 852 Total $1,490 $1,850 $1,939 $2,008 $2,081 $2,15853
54 GASB 68 Pension Expense Adjustment55 New York City Transit ($315) ($355) ($296) ($306) ($296) ($303)56 Bridges and Tunnels (9) (10) (9) (8) (7) (5)57 Long Island Rail Road (31) 169 174 173 174 16258 Metro-North Railroad (26) (22) (3) (1) (7) (14)59 MTA Bus Company (12) 40 43 43 42 3760 MTA Headquarters (16) (10) (4) (4) (5) (7)61 Staten Island Railway (2) (1) (1) (1) (1) (1)62 Total ($410) ($188) ($94) ($104) ($101) ($130)63
64 Environmental Remediation65 New York City Transit $13 $0 $0 $0 $0 $066 Bridges and Tunnels 0 0 0 0 0 067 Long Island Rail Road 2 2 2 2 2 268 Metro-North Railroad 4 4 4 4 4 469 MTA Bus Company 0 0 0 0 0 070 Staten Island Railway 1 0 0 0 0 071 Total $21 $6 $6 $6 $6 $672
73 Net Surplus/(Deficit) 1
74 New York City Transit ($5,169) ($5,759) ($6,099) ($6,286) ($6,628) ($7,024)75 Bridges and Tunnels 1,220 1,219 1,206 1,146 1,127 1,10576 Long Island Rail Road (986) (1,212) (1,346) (1,415) (1,457) (1,593)77 Metro-North Railroad (721) (762) (804) (828) (854) (871)78 MTA Bus Company (540) (630) (683) (703) (707) (707)79 MTA Headquarters (642) (666) (831) (783) (799) (824)80 Staten Island Railway (56) (70) (78) (58) (58) (60)81 First Mutual Transportation Assurance Company (24) 19 18 22 26 3182 Other (37) (33) (183) (187) (194) (199)
Total ($6,955) ($7,896) ($8,799) ($9,092) ($9,546) ($10,143)
Notes: 1 Excludes Debt Service
METROPOLITAN TRANSPORTATION AUTHORITYFebruary Financial Plan 2017-2020
MTA Consolidated Accrued Statement of Operations By Agency($ in millions)
II-5

Line
No. 7 Cash Receipts and Expenditures Final Adopted
8 Actual Estimate Budget 9 2015 2016 2017 2018 2019 2020
10 Receipts
11 Farebox Revenue $6,001 $6,057 $6,280 $6,361 $6,385 $6,419
12 Other Operating Revenue 718 754 713 849 786 825
13 Capital and Other Reimbursements 1,863 1,866 2,125 1,913 1,866 1,823 14 Total Receipts $8,583 $8,677 $9,117 $9,124 $9,037 $9,068
15
16 Expenditures
17 Labor:
18 Payroll $5,245 $5,314 $5,583 $5,694 $5,810 $5,930
19 Overtime 955 952 897 892 904 922
20 Health and Welfare 1,109 1,202 1,328 1,385 1,472 1,560
21 OPEB Current Payment 496 532 581 622 676 734
22 Pensions 1,285 1,385 1,374 1,383 1,381 1,370
23 Other Fringe Benefits 795 830 857 870 885 908
24 Contribution to GASB Fund 0 0 0 8 18 29
25 Reimbursable Overhead 0 0 (0) 0 0 026 Total Labor Expenditures $9,886 $10,215 $10,621 $10,854 $11,146 $11,45427
28 Non-Labor:
29 Electric Power $485 $408 $501 $514 $528 $566
30 Fuel 165 126 158 164 170 186
31 Insurance 58 41 47 57 63 72
32 Claims 269 269 255 241 249 257
33 Paratransit Service Contracts 381 389 409 433 470 509
34 Maintenance and Other Operating Contracts 522 663 725 631 609 598
35 Professional Service Contracts 314 480 561 472 436 438
36 Materials & Supplies 727 706 772 763 728 800
37 Other Business Expenditures 213 191 197 185 196 19438 Total Non-Labor Expenditures $3,133 $3,274 $3,626 $3,460 $3,449 $3,622
39
40 Other Expenditure Adjustments:
41 Other $33 $133 $140 $148 $138 $158
42 General Reserve 0 0 155 160 165 17043 Total Other Expenditure Adjustments $33 $133 $295 $308 $303 $328
44
45 Total Expenditures $13,052 $13,621 $14,542 $14,622 $14,898 $15,404
46
47 Net Cash Deficit Before Subsidies and Debt Service ($4,469) ($4,944) ($5,425) ($5,497) ($5,862) (6,336)
48
49 Dedicated Taxes and State/Local Subsidies $6,357 $6,509 $6,851 $7,366 $7,425 $7,628
50 Debt Service (excludes Service Contract Bonds) ($1,738) ($1,796) ($1,916) ($2,042) ($2,156) (2,285)
51
52 CASH BALANCE BEFORE PRIOR-YEAR CARRY-OVER $150 ($231) ($489) ($173) ($593) ($993)
53 ADJUSTMENTS 0 12 253 176 574 614
54 PRIOR-YEAR CARRY-OVER 330 480 260 24 27 7
55 NET CASH BALANCE $480 $260 $24 $27 $7 ($372)
MTA Consolidated Cash Receipts and Expenditures($ in millions)
METROPOLITAN TRANSPORTATION AUTHORITYFebruary Financial Plan 2017-2020
II-6
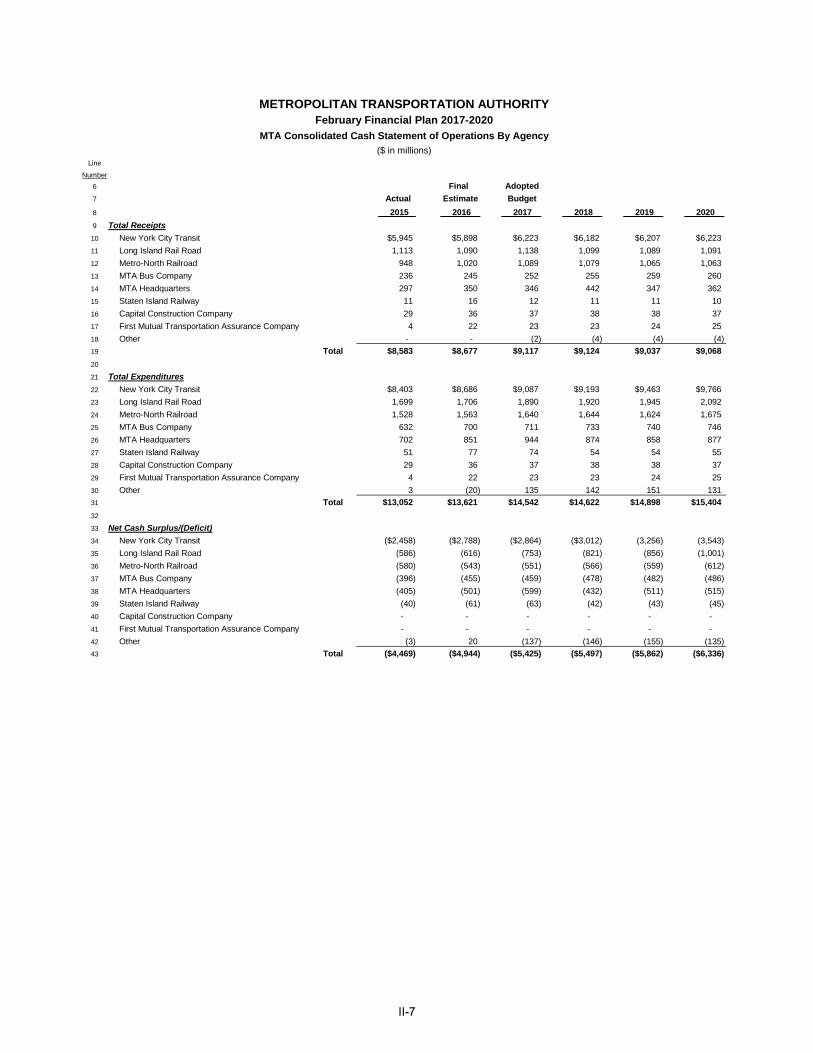
Line
Number 6 Final Adopted
7 Actual Estimate Budget
8 2015 2016 2017 2018 2019 2020
9 Total Receipts
10 New York City Transit $5,945 $5,898 $6,223 $6,182 $6,207 $6,223
11 Long Island Rail Road 1,113 1,090 1,138 1,099 1,089 1,091
12 Metro-North Railroad 948 1,020 1,089 1,079 1,065 1,063
13 MTA Bus Company 236 245 252 255 259 260
14 MTA Headquarters 297 350 346 442 347 362
15 Staten Island Railway 11 16 12 11 11 10
16 Capital Construction Company 29 36 37 38 38 37
17 First Mutual Transportation Assurance Company 4 22 23 23 24 25
18 Other - - (2) (4) (4) (4)
19 Total $8,583 $8,677 $9,117 $9,124 $9,037 $9,068
20
21 Total Expenditures
22 New York City Transit $8,403 $8,686 $9,087 $9,193 $9,463 $9,766
23 Long Island Rail Road 1,699 1,706 1,890 1,920 1,945 2,092
24 Metro-North Railroad 1,528 1,563 1,640 1,644 1,624 1,675
25 MTA Bus Company 632 700 711 733 740 746
26 MTA Headquarters 702 851 944 874 858 877
27 Staten Island Railway 51 77 74 54 54 55
28 Capital Construction Company 29 36 37 38 38 37
29 First Mutual Transportation Assurance Company 4 22 23 23 24 25
30 Other 3 (20) 135 142 151 131
31 Total $13,052 $13,621 $14,542 $14,622 $14,898 $15,404
32
33 Net Cash Surplus/(Deficit)
34 New York City Transit ($2,458) ($2,788) ($2,864) ($3,012) (3,256) (3,543)
35 Long Island Rail Road (586) (616) (753) (821) (856) (1,001)
36 Metro-North Railroad (580) (543) (551) (566) (559) (612)
37 MTA Bus Company (396) (455) (459) (478) (482) (486)
38 MTA Headquarters (405) (501) (599) (432) (511) (515)
39 Staten Island Railway (40) (61) (63) (42) (43) (45)
40 Capital Construction Company - - - - - -
41 First Mutual Transportation Assurance Company - - - - - -
42 Other (3) 20 (137) (146) (155) (135)
43 Total ($4,469) ($4,944) ($5,425) ($5,497) ($5,862) ($6,336)
METROPOLITAN TRANSPORTATION AUTHORITYFebruary Financial Plan 2017-2020
MTA Consolidated Cash Statement of Operations By Agency
($ in millions)
II-7
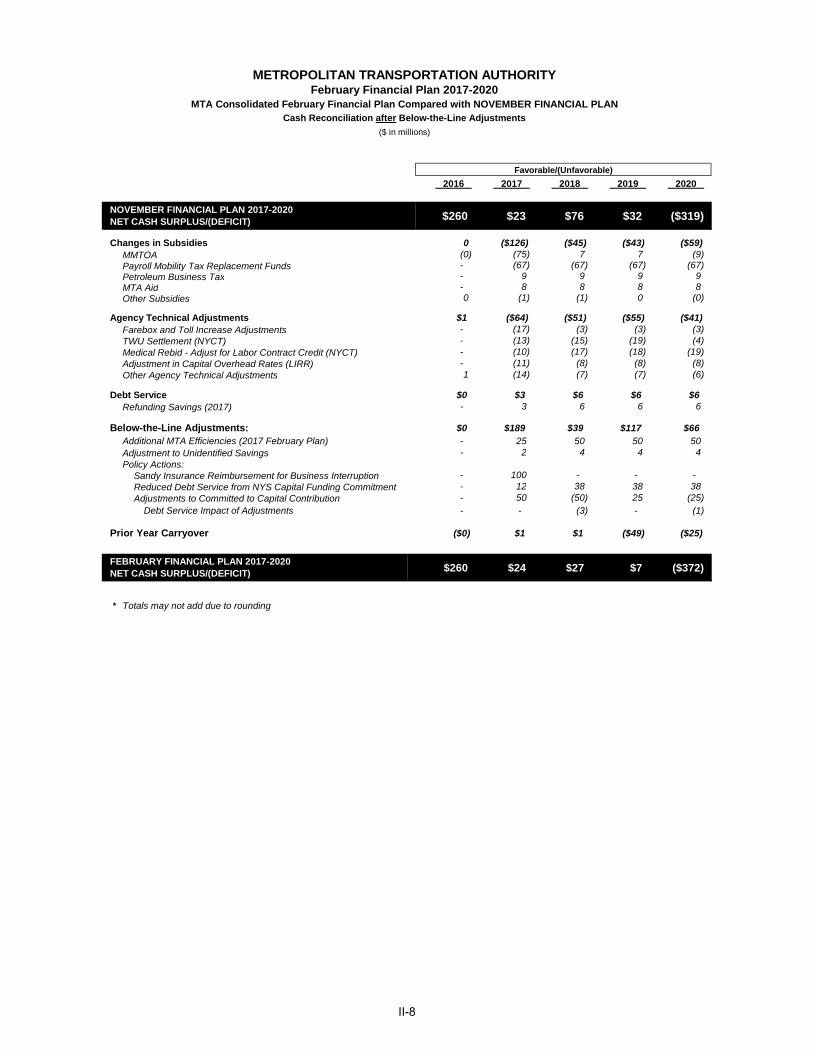
2016 2017 2018 2019 2020
$260 $23 $76 $32 ($319)
Changes in Subsidies 0 ($126) ($45) ($43) ($59)MMTOA (0) (75) 7 7 (9) Payroll Mobility Tax Replacement Funds - (67) (67) (67) (67) Petroleum Business Tax - 9 9 9 9 MTA Aid - 8 8 8 8 Other Subsidies 0 (1) (1) 0 (0)
Agency Technical Adjustments $1 ($64) ($51) ($55) ($41)Farebox and Toll Increase Adjustments - (17) (3) (3) (3) TWU Settlement (NYCT) - (13) (15) (19) (4) Medical Rebid - Adjust for Labor Contract Credit (NYCT) - (10) (17) (18) (19) Adjustment in Capital Overhead Rates (LIRR) - (11) (8) (8) (8) Other Agency Technical Adjustments 1 (14) (7) (7) (6)
Debt Service $0 $3 $6 $6 $6Refunding Savings (2017) - 3 6 6 6
Below-the-Line Adjustments: $0 $189 $39 $117 $66Additional MTA Efficiencies (2017 February Plan) - 25 50 50 50 Adjustment to Unidentified Savings - 2 4 4 4 Policy Actions:
Sandy Insurance Reimbursement for Business Interruption - 100 - - - Reduced Debt Service from NYS Capital Funding Commitment - 12 38 38 38 Adjustments to Committed to Capital Contribution - 50 (50) 25 (25)
Debt Service Impact of Adjustments - - (3) - (1)
Prior Year Carryover ($0) $1 $1 ($49) ($25)
$260 $24 $27 $7 ($372)
*
Favorable/(Unfavorable)
Totals may not add due to rounding
NOVEMBER FINANCIAL PLAN 2017-2020 NET CASH SURPLUS/(DEFICIT)
FEBRUARY FINANCIAL PLAN 2017-2020 NET CASH SURPLUS/(DEFICIT)
METROPOLITAN TRANSPORTATION AUTHORITYFebruary Financial Plan 2017-2020
($ in millions)
Cash Reconciliation after Below-the-Line Adjustments
MTA Consolidated February Financial Plan Compared with NOVEMBER FINANCIAL PLAN
II-8
Final Estimate
2016
Adopted Budget
2017Plan 2018
Plan 2019
Plan 2020
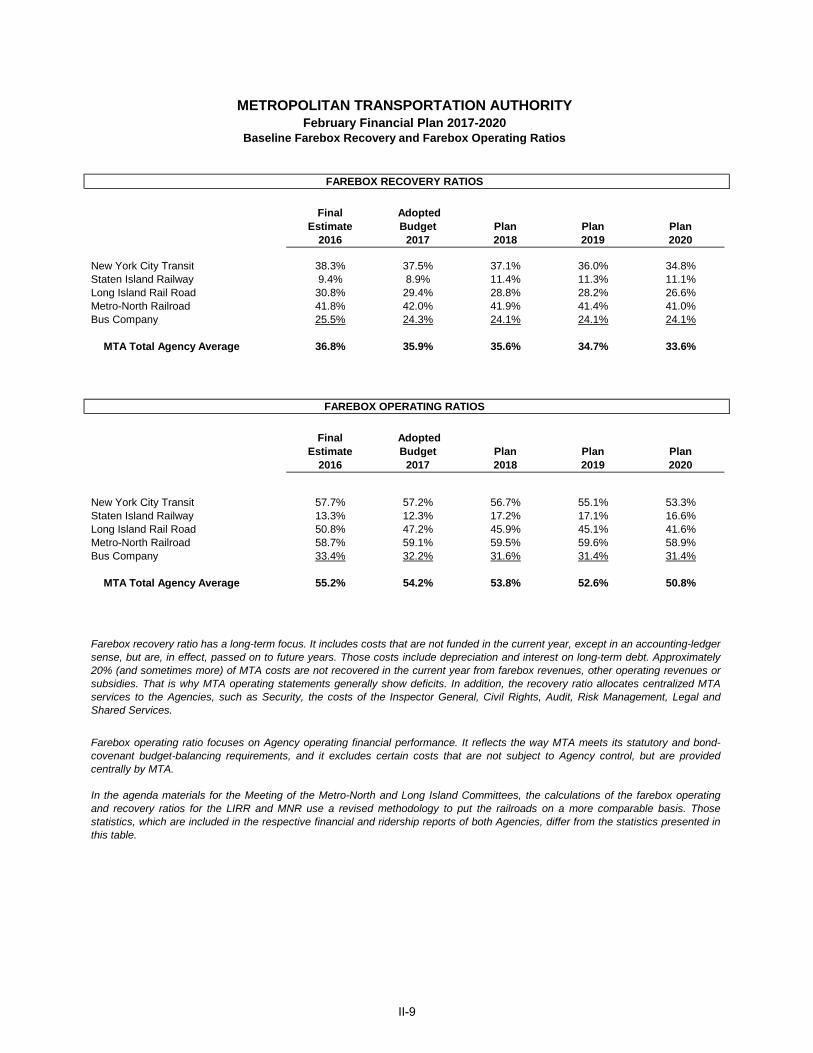
New York City Transit 38.3% 37.5% 37.1% 36.0% 34.8%Staten Island Railway 9.4% 8.9% 11.4% 11.3% 11.1%Long Island Rail Road 30.8% 29.4% 28.8% 28.2% 26.6%Metro-North Railroad 41.8% 42.0% 41.9% 41.4% 41.0%Bus Company 25.5% 24.3% 24.1% 24.1% 24.1%
MTA Total Agency Average 36.8% 35.9% 35.6% 34.7% 33.6%
Final Estimate
2016
Adopted Budget
2017Plan 2018
Plan 2019
Plan 2020
New York City Transit 57.7% 57.2% 56.7% 55.1% 53.3%Staten Island Railway 13.3% 12.3% 17.2% 17.1% 16.6%Long Island Rail Road 50.8% 47.2% 45.9% 45.1% 41.6%Metro-North Railroad 58.7% 59.1% 59.5% 59.6% 58.9%Bus Company 33.4% 32.2% 31.6% 31.4% 31.4%
MTA Total Agency Average 55.2% 54.2% 53.8% 52.6% 50.8%
Baseline Farebox Recovery and Farebox Operating RatiosFebruary Financial Plan 2017-2020
METROPOLITAN TRANSPORTATION AUTHORITY
FAREBOX RECOVERY RATIOS
FAREBOX OPERATING RATIOS
Farebox recovery ratio has a long-term focus. It includes costs that are not funded in the current year, except in an accounting-ledgersense, but are, in effect, passed on to future years. Those costs include depreciation and interest on long-term debt. Approximately20% (and sometimes more) of MTA costs are not recovered in the current year from farebox revenues, other operating revenues orsubsidies. That is why MTA operating statements generally show deficits. In addition, the recovery ratio allocates centralized MTAservices to the Agencies, such as Security, the costs of the Inspector General, Civil Rights, Audit, Risk Management, Legal andShared Services.
Farebox operating ratio focuses on Agency operating financial performance. It reflects the way MTA meets its statutory and bond-covenant budget-balancing requirements, and it excludes certain costs that are not subject to Agency control, but are providedcentrally by MTA.
In the agenda materials for the Meeting of the Metro-North and Long Island Committees, the calculations of the farebox operatingand recovery ratios for the LIRR and MNR use a revised methodology to put the railroads on a more comparable basis. Thosestatistics, which are included in the respective financial and ridership reports of both Agencies, differ from the statistics presented inthis table.
II-9

[THIS PAGE INTENTIONALLY LEFT BLANK]
II-10
III. Major Assumptions
Final Adopted
Estimate Budget
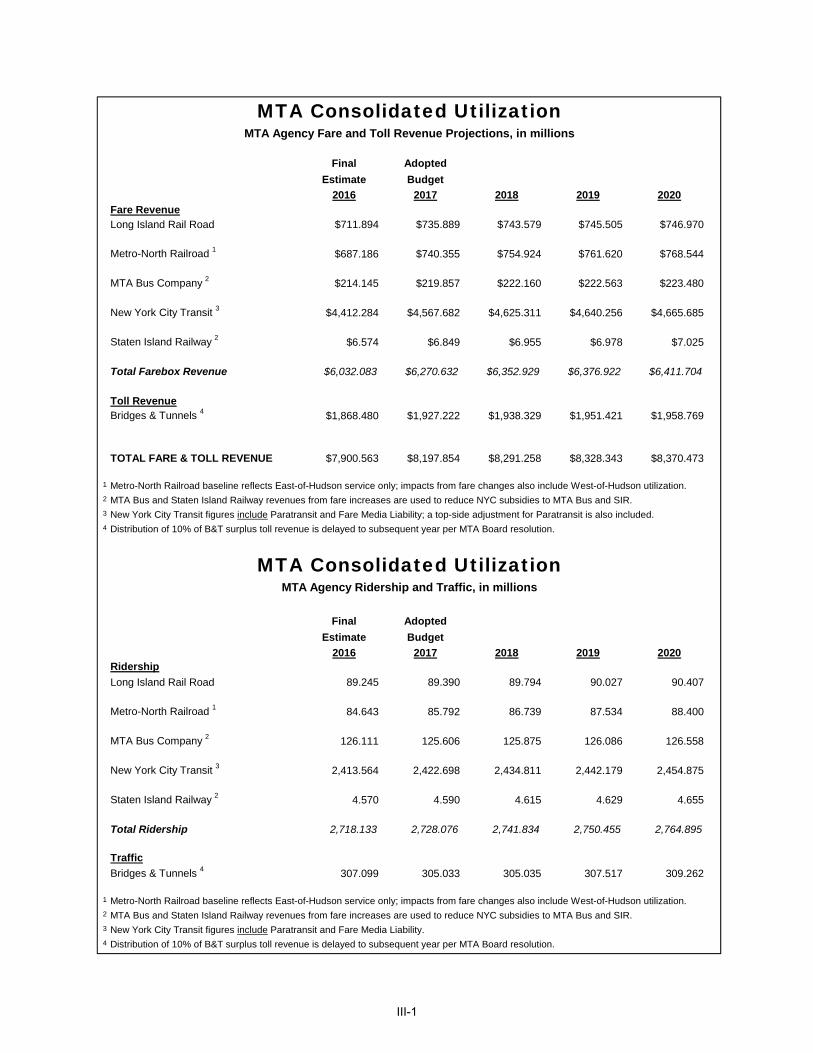
2016 2017 2018 2019 2020Fare RevenueLong Island Rail Road $711.894 $735.889 $743.579 $745.505 $746.970
Metro-North Railroad 1 $687.186 $740.355 $754.924 $761.620 $768.544
MTA Bus Company 2 $214.145 $219.857 $222.160 $222.563 $223.480
New York City Transit 3 $4,412.284 $4,567.682 $4,625.311 $4,640.256 $4,665.685
Staten Island Railway 2 $6.574 $6.849 $6.955 $6.978 $7.025
Total Farebox Revenue $6,032.083 $6,270.632 $6,352.929 $6,376.922 $6,411.704
Toll RevenueBridges & Tunnels 4 $1,868.480 $1,927.222 $1,938.329 $1,951.421 $1,958.769
TOTAL FARE & TOLL REVENUE $7,900.563 $8,197.854 $8,291.258 $8,328.343 $8,370.473
1
2
3
4
Final Adopted
Estimate Budget
2016 2017 2018 2019 2020Ridership
Long Island Rail Road 89.245 89.390 89.794 90.027 90.407
Metro-North Railroad 1 84.643 85.792 86.739 87.534 88.400
MTA Bus Company 2 126.111 125.606 125.875 126.086 126.558
New York City Transit 3 2,413.564 2,422.698 2,434.811 2,442.179 2,454.875
Staten Island Railway 2 4.570 4.590 4.615 4.629 4.655
Total Ridership 2,718.133 2,728.076 2,741.834 2,750.455 2,764.895
Traffic
Bridges & Tunnels 4 307.099 305.033 305.035 307.517 309.262
1
2
3
4
New York City Transit figures include Paratransit and Fare Media Liability.
Distribution of 10% of B&T surplus toll revenue is delayed to subsequent year per MTA Board resolution.
Distribution of 10% of B&T surplus toll revenue is delayed to subsequent year per MTA Board resolution.
MTA Consolidated UtilizationMTA Agency Ridership and Traffic, in millions
Metro-North Railroad baseline reflects East-of-Hudson service only; impacts from fare changes also include West-of-Hudson utilization.
MTA Bus and Staten Island Railway revenues from fare increases are used to reduce NYC subsidies to MTA Bus and SIR.
New York City Transit figures include Paratransit and Fare Media Liability; a top-side adjustment for Paratransit is also included.
MTA Consolidated UtilizationMTA Agency Fare and Toll Revenue Projections, in millions
Metro-North Railroad baseline reflects East-of-Hudson service only; impacts from fare changes also include West-of-Hudson utilization.
MTA Bus and Staten Island Railway revenues from fare increases are used to reduce NYC subsidies to MTA Bus and SIR.
III-1
Final Adopted
Actual Estimate Budget 2015 2016 2017 2018 2019 2020
Subsidies
Dedicated Taxes
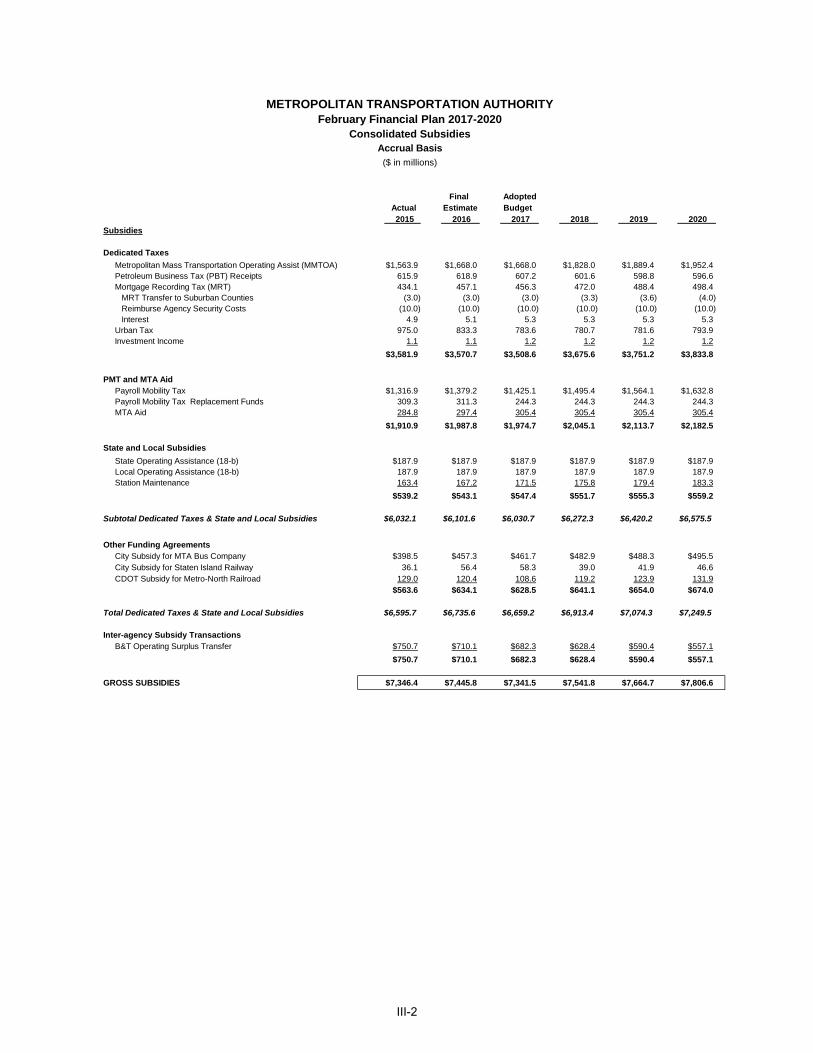
Metropolitan Mass Transportation Operating Assist (MMTOA) $1,563.9 $1,668.0 $1,668.0 $1,828.0 $1,889.4 $1,952.4Petroleum Business Tax (PBT) Receipts 615.9 618.9 607.2 601.6 598.8 596.6 Mortgage Recording Tax (MRT) 434.1 457.1 456.3 472.0 488.4 498.4 MRT Transfer to Suburban Counties (3.0) (3.0) (3.0) (3.3) (3.6) (4.0) Reimburse Agency Security Costs (10.0) (10.0) (10.0) (10.0) (10.0) (10.0) Interest 4.9 5.1 5.3 5.3 5.3 5.3 Urban Tax 975.0 833.3 783.6 780.7 781.6 793.9 Investment Income 1.1 1.1 1.2 1.2 1.2 1.2
$3,581.9 $3,570.7 $3,508.6 $3,675.6 $3,751.2 $3,833.8
PMT and MTA AidPayroll Mobility Tax $1,316.9 $1,379.2 $1,425.1 $1,495.4 $1,564.1 $1,632.8Payroll Mobility Tax Replacement Funds 309.3 311.3 244.3 244.3 244.3 244.3MTA Aid 284.8 297.4 305.4 305.4 305.4 305.4
$1,910.9 $1,987.8 $1,974.7 $2,045.1 $2,113.7 $2,182.5
State and Local Subsidies
State Operating Assistance (18-b) $187.9 $187.9 $187.9 $187.9 $187.9 $187.9Local Operating Assistance (18-b) 187.9 187.9 187.9 187.9 187.9 187.9Station Maintenance 163.4 167.2 171.5 175.8 179.4 183.3
$539.2 $543.1 $547.4 $551.7 $555.3 $559.2
$6,032.1 $6,101.6 $6,030.7 $6,272.3 $6,420.2 $6,575.5
City Subsidy for MTA Bus Company $398.5 $457.3 $461.7 $482.9 $488.3 $495.5City Subsidy for Staten Island Railway 36.1 56.4 58.3 39.0 41.9 46.6CDOT Subsidy for Metro-North Railroad 129.0 120.4 108.6 119.2 123.9 131.9
$563.6 $634.1 $628.5 $641.1 $654.0 $674.0
$6,595.7 $6,735.6 $6,659.2 $6,913.4 $7,074.3 $7,249.5
Inter-agency Subsidy TransactionsB&T Operating Surplus Transfer $750.7 $710.1 $682.3 $628.4 $590.4 $557.1
$750.7 $710.1 $682.3 $628.4 $590.4 $557.1
GROSS SUBSIDIES $7,346.4 $7,445.8 $7,341.5 $7,541.8 $7,664.7 $7,806.6
Accrual Basis
Consolidated SubsidiesFebruary Financial Plan 2017-2020
METROPOLITAN TRANSPORTATION AUTHORITY
Total Dedicated Taxes & State and Local Subsidies
Subtotal Dedicated Taxes & State and Local Subsidies
Other Funding Agreements
($ in millions)
III-2

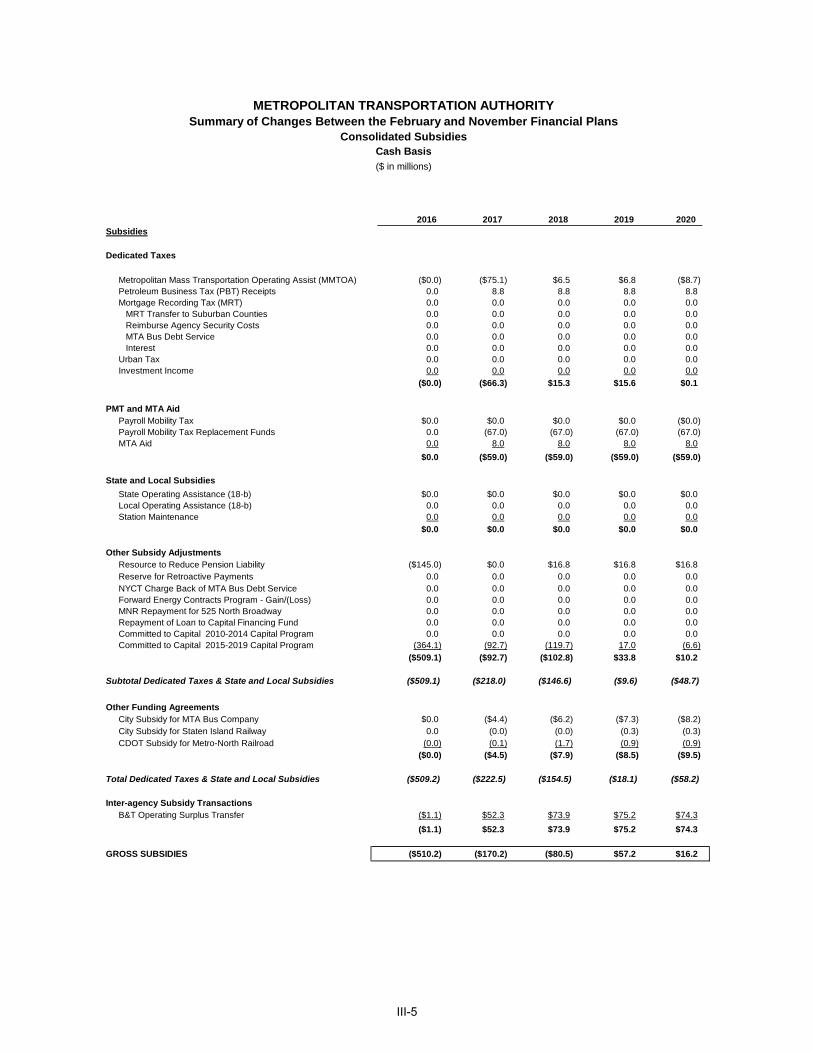
2016 2017 2018 2019 2020 Subsidies
Dedicated Taxes
Metropolitan Mass Transportation Operating Assist (MMTOA) ($0.0) ($75.1) $6.5 $6.8 ($8.7)Petroleum Business Tax (PBT) Receipts 0.7 8.8 8.8 8.8 8.8Mortgage Recording Tax (MRT) 0.0 0.0 0.0 0.0 0.0 MRT Transfer to Suburban Counties 0.0 0.0 0.0 0.0 0.0 Reimburse Agency Security Costs 0.0 0.0 0.0 0.0 0.0 Interest 0.0 0.0 0.0 0.0 0.0Urban Tax 0.0 0.0 0.0 0.0 0.0Investment Income 0.0 0.0 0.0 0.0 0.0
$0.7 ($66.3) $15.3 $15.6 $0.1
PMT and MTA AidPayroll Mobility Tax $0.0 $0.0 $0.0 $0.0 ($0.0)Payroll Mobility Tax Replacement Funds 0.0 (67.0) (67.0) (67.0) (67.0)MTA Aid 0.0 8.0 8.0 8.0 8.0
$0.0 ($59.0) ($59.0) ($59.0) ($59.0)
State and Local Subsidies
State Operating Assistance (18-b) $0.0 $0.0 $0.0 $0.0 $0.0Local Operating Assistance (18-b) 0.0 0.0 0.0 0.0 0.0Station Maintenance 0.0 0.0 0.0 0.0 0.0
$0.0 $0.0 $0.0 $0.0 $0.0
$0.7 ($125.3) ($43.7) ($43.4) ($58.9)
City Subsidy for MTA Bus Company $0.0 ($4.8) ($6.7) ($7.6) ($8.6)City Subsidy for Staten Island Railway (0.0) (0.0) (0.3) (0.3) (0.3)CDOT Subsidy for Metro-North Railroad (0.0) (0.1) (1.7) (0.9) (0.9)
($0.0) ($4.9) ($8.7) ($8.8) ($9.8)
$0.7 ($130.2) ($52.4) ($52.3) ($68.7)
Inter-agency Subsidy Transactions
B&T Operating Surplus Transfer ($1.2) $58.2 $75.7 $75.2 $74.2MTA Subsidy to Subsidiaries 0.0 0.0 0.0 0.0 0.0
($1.2) $58.2 $75.7 $75.2 $74.2
GROSS SUBSIDIES ($0.5) ($71.9) $23.2 $22.9 $5.6
Total Dedicated Taxes & State and Local Subsidies
METROPOLITAN TRANSPORTATION AUTHORITYSummary of Changes Between the February and November Financial Plans
Consolidated SubsidiesAccrual Basis
($ in millions)
Subtotal Dedicated Taxes & State and Local Subsidies
III-3

Final Adopted Actual Estimate Budget
2015 2016 2017 2018 2019 2020 Subsidies
Dedicated Taxes
Metropolitan Mass Transportation Operating Assist (MMTOA) $1,563.9 $1,668.0 $1,668.0 $1,828.0 $1,889.4 $1,952.4Petroleum Business Tax (PBT) Receipts 616.5 619.1 607.6 601.9 599.0 596.7Mortgage Recording Tax (MRT) 430.6 459.1 456.9 472.5 489.7 499.0 MRT Transfer to Suburban Counties (1.7) (3.0) (3.0) (3.0) (3.3) (3.6) Reimburse Agency Security Costs (10.0) (10.0) (10.0) (10.0) (10.0) (10.0) MTA Bus Debt Service (24.9) (24.9) (24.9) (23.8) (23.8) (23.8) Interest 4.9 5.1 5.3 5.3 5.3 5.3Urban Tax 940.6 837.8 783.9 780.7 780.7 791.8Investment Income 1.1 1.1 1.2 1.2 1.2 1.2
$3,520.9 $3,552.4 $3,485.1 $3,652.7 $3,728.3 $3,808.9
PMT and MTA Aid
Payroll Mobility Tax $1,316.9 $1,379.2 $1,425.1 $1,495.4 $1,564.1 $1,632.8Payroll Mobility Tax Replacement Funds 309.3 311.3 244.3 244.3 244.3 244.3MTA Aid 284.8 297.4 305.4 305.4 305.4 305.4
$1,910.9 $1,987.8 $1,974.7 $2,045.1 $2,113.7 $2,182.5
State and Local Subsidies
State Operating Assistance (18-b) $187.9 $187.9 $187.9 $187.9 $187.9 $187.9Local Operating Assistance (18-b) 182.3 187.9 187.9 187.9 187.9 187.9Station Maintenance 161.2 164.1 168.3 172.6 176.9 180.3
$531.4 $539.9 $544.1 $548.4 $552.8 $556.1
Other Subsidy AdjustmentsResource to Reduce Pension Liability ($140.0) ($75.0) $0.0 $23.3 $23.3 $23.3Reserve for Retroactive Payments 109.3 0.0 0.0 0.0 0.0 0.0NYCT Charge Back of MTA Bus Debt Service (11.5) (11.5) (11.5) (11.5) (11.5) (11.5)Forward Energy Contracts Program - Gain/(Loss) (42.2) (30.3) 0.6 0.8 0.0 0.0MNR Repayment for 525 North Broadway (2.4) (2.4) (2.4) (2.4) (2.4) (2.4)Repayment of Loan to Capital Financing Fund (100.0) 0.0 0.0 0.0 0.0 0.0Committed to Capital 2010-2014 Capital Program (38.1) 0.0 (73.0) (78.9) (49.7) 0.0Committed to Capital 2015-2019 Capital Program (721.9) (754.1) (442.8) (94.5) (172.2) (154.4)
($946.8) ($873.4) ($529.1) ($163.3) ($212.5) ($145.1)
$5,016.5 $5,206.8 $5,474.8 $6,083.0 $6,182.3 $6,402.5
City Subsidy for MTA Bus Company $438.3 $413.4 $526.4 $471.9 $485.5 $491.8City Subsidy for Staten Island Railway 33.4 36.1 56.4 58.3 39.0 41.9CDOT Subsidy for Metro-North Railroad 129.0 120.4 108.6 119.2 123.9 131.9
$600.6 $569.9 $691.4 $649.4 $648.4 $665.5
$5,617.1 $5,776.7 $6,166.2 $6,732.3 $6,830.7 $7,068.0
Inter-agency Subsidy Transactions
B&T Operating Surplus Transfer $740.1 $732.5 $685.0 $633.8 $594.2 $560.5
$740.1 $732.5 $685.0 $633.8 $594.2 $560.5
GROSS SUBSIDIES $6,357.2 $6,509.1 $6,851.2 $7,366.1 $7,424.9 $7,628.4
($ in millions)
Cash BasisConsolidated Subsidies
February Financial Plan 2017-2020
Total Dedicated Taxes & State and Local Subsidies
Subtotal Dedicated Taxes & State and Local Subsidies
Other Funding Agreements
METROPOLITAN TRANSPORTATION AUTHORITY
III-4
2016 2017 2018 2019 2020 Subsidies
Dedicated Taxes
Metropolitan Mass Transportation Operating Assist (MMTOA) ($0.0) ($75.1) $6.5 $6.8 ($8.7)Petroleum Business Tax (PBT) Receipts 0.0 8.8 8.8 8.8 8.8Mortgage Recording Tax (MRT) 0.0 0.0 0.0 0.0 0.0 MRT Transfer to Suburban Counties 0.0 0.0 0.0 0.0 0.0 Reimburse Agency Security Costs 0.0 0.0 0.0 0.0 0.0 MTA Bus Debt Service 0.0 0.0 0.0 0.0 0.0 Interest 0.0 0.0 0.0 0.0 0.0Urban Tax 0.0 0.0 0.0 0.0 0.0Investment Income 0.0 0.0 0.0 0.0 0.0
($0.0) ($66.3) $15.3 $15.6 $0.1
PMT and MTA AidPayroll Mobility Tax $0.0 $0.0 $0.0 $0.0 ($0.0)Payroll Mobility Tax Replacement Funds 0.0 (67.0) (67.0) (67.0) (67.0)MTA Aid 0.0 8.0 8.0 8.0 8.0
$0.0 ($59.0) ($59.0) ($59.0) ($59.0)
State and Local Subsidies
State Operating Assistance (18-b) $0.0 $0.0 $0.0 $0.0 $0.0Local Operating Assistance (18-b) 0.0 0.0 0.0 0.0 0.0Station Maintenance 0.0 0.0 0.0 0.0 0.0
$0.0 $0.0 $0.0 $0.0 $0.0
Other Subsidy AdjustmentsResource to Reduce Pension Liability ($145.0) $0.0 $16.8 $16.8 $16.8Reserve for Retroactive Payments 0.0 0.0 0.0 0.0 0.0NYCT Charge Back of MTA Bus Debt Service 0.0 0.0 0.0 0.0 0.0Forward Energy Contracts Program - Gain/(Loss) 0.0 0.0 0.0 0.0 0.0MNR Repayment for 525 North Broadway 0.0 0.0 0.0 0.0 0.0Repayment of Loan to Capital Financing Fund 0.0 0.0 0.0 0.0 0.0Committed to Capital 2010-2014 Capital Program 0.0 0.0 0.0 0.0 0.0Committed to Capital 2015-2019 Capital Program (364.1) (92.7) (119.7) 17.0 (6.6)
($509.1) ($92.7) ($102.8) $33.8 $10.2
($509.1) ($218.0) ($146.6) ($9.6) ($48.7)
City Subsidy for MTA Bus Company $0.0 ($4.4) ($6.2) ($7.3) ($8.2)City Subsidy for Staten Island Railway 0.0 (0.0) (0.0) (0.3) (0.3)CDOT Subsidy for Metro-North Railroad (0.0) (0.1) (1.7) (0.9) (0.9)
($0.0) ($4.5) ($7.9) ($8.5) ($9.5)
($509.2) ($222.5) ($154.5) ($18.1) ($58.2)
Inter-agency Subsidy TransactionsB&T Operating Surplus Transfer ($1.1) $52.3 $73.9 $75.2 $74.3
($1.1) $52.3 $73.9 $75.2 $74.3
GROSS SUBSIDIES ($510.2) ($170.2) ($80.5) $57.2 $16.2
Cash BasisConsolidated Subsidies
Summary of Changes Between the February and November Financial PlansMETROPOLITAN TRANSPORTATION AUTHORITY
Total Dedicated Taxes & State and Local Subsidies
Subtotal Dedicated Taxes & State and Local Subsidies
Other Funding Agreements
($ in millions)
III-5
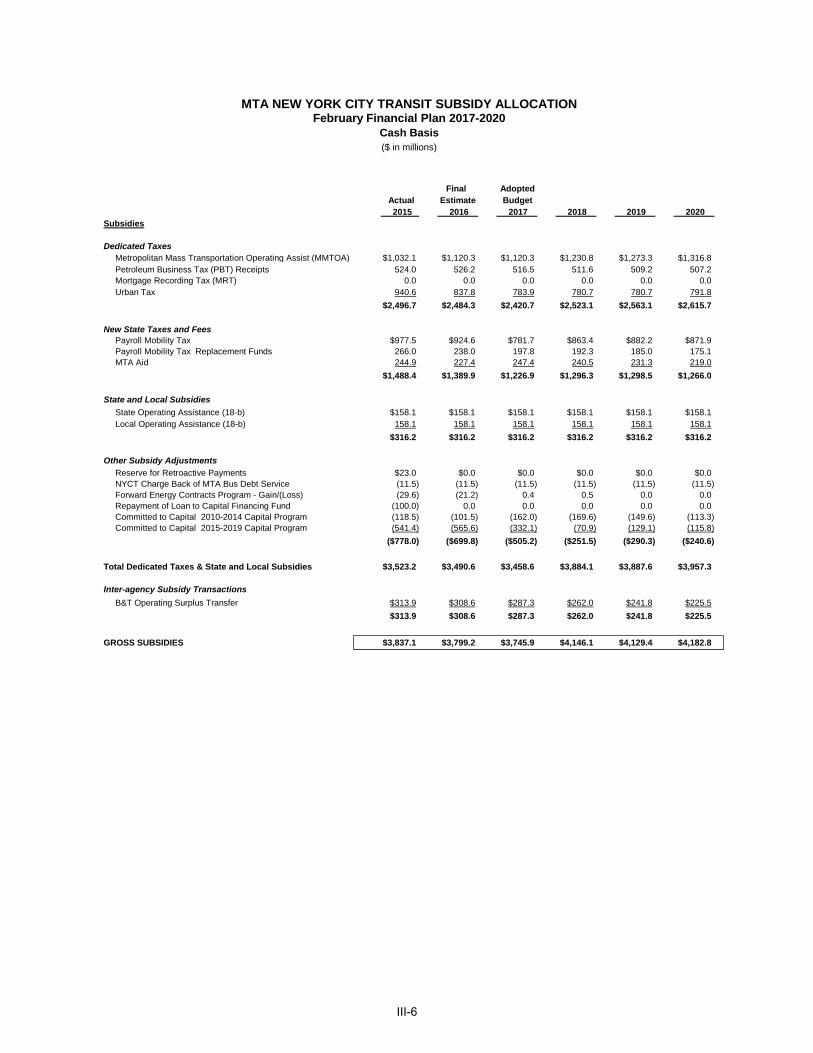
Final Adopted Actual Estimate Budget
2015 2016 2017 2018 2019 2020 Subsidies
Dedicated TaxesMetropolitan Mass Transportation Operating Assist (MMTOA) $1,032.1 $1,120.3 $1,120.3 $1,230.8 $1,273.3 $1,316.8Petroleum Business Tax (PBT) Receipts 524.0 526.2 516.5 511.6 509.2 507.2Mortgage Recording Tax (MRT) 0.0 0.0 0.0 0.0 0.0 0.0Urban Tax 940.6 837.8 783.9 780.7 780.7 791.8
$2,496.7 $2,484.3 $2,420.7 $2,523.1 $2,563.1 $2,615.7
New State Taxes and FeesPayroll Mobility Tax $977.5 $924.6 $781.7 $863.4 $882.2 $871.9Payroll Mobility Tax Replacement Funds 266.0 238.0 197.8 192.3 185.0 175.1MTA Aid 244.9 227.4 247.4 240.5 231.3 219.0
$1,488.4 $1,389.9 $1,226.9 $1,296.3 $1,298.5 $1,266.0
State and Local Subsidies
State Operating Assistance (18-b) $158.1 $158.1 $158.1 $158.1 $158.1 $158.1Local Operating Assistance (18-b) 158.1 158.1 158.1 158.1 158.1 158.1
$316.2 $316.2 $316.2 $316.2 $316.2 $316.2
Other Subsidy Adjustments
Reserve for Retroactive Payments $23.0 $0.0 $0.0 $0.0 $0.0 $0.0NYCT Charge Back of MTA Bus Debt Service (11.5) (11.5) (11.5) (11.5) (11.5) (11.5)Forward Energy Contracts Program - Gain/(Loss) (29.6) (21.2) 0.4 0.5 0.0 0.0Repayment of Loan to Capital Financing Fund (100.0) 0.0 0.0 0.0 0.0 0.0Committed to Capital 2010-2014 Capital Program (118.5) (101.5) (162.0) (169.6) (149.6) (113.3)Committed to Capital 2015-2019 Capital Program (541.4) (565.6) (332.1) (70.9) (129.1) (115.8)
($778.0) ($699.8) ($505.2) ($251.5) ($290.3) ($240.6)
$3,523.2 $3,490.6 $3,458.6 $3,884.1 $3,887.6 $3,957.3
Inter-agency Subsidy Transactions
B&T Operating Surplus Transfer $313.9 $308.6 $287.3 $262.0 $241.8 $225.5
$313.9 $308.6 $287.3 $262.0 $241.8 $225.5
GROSS SUBSIDIES $3,837.1 $3,799.2 $3,745.9 $4,146.1 $4,129.4 $4,182.8
Total Dedicated Taxes & State and Local Subsidies
($ in millions)
Cash BasisFebruary Financial Plan 2017-2020
MTA NEW YORK CITY TRANSIT SUBSIDY ALLOCATION
III-6
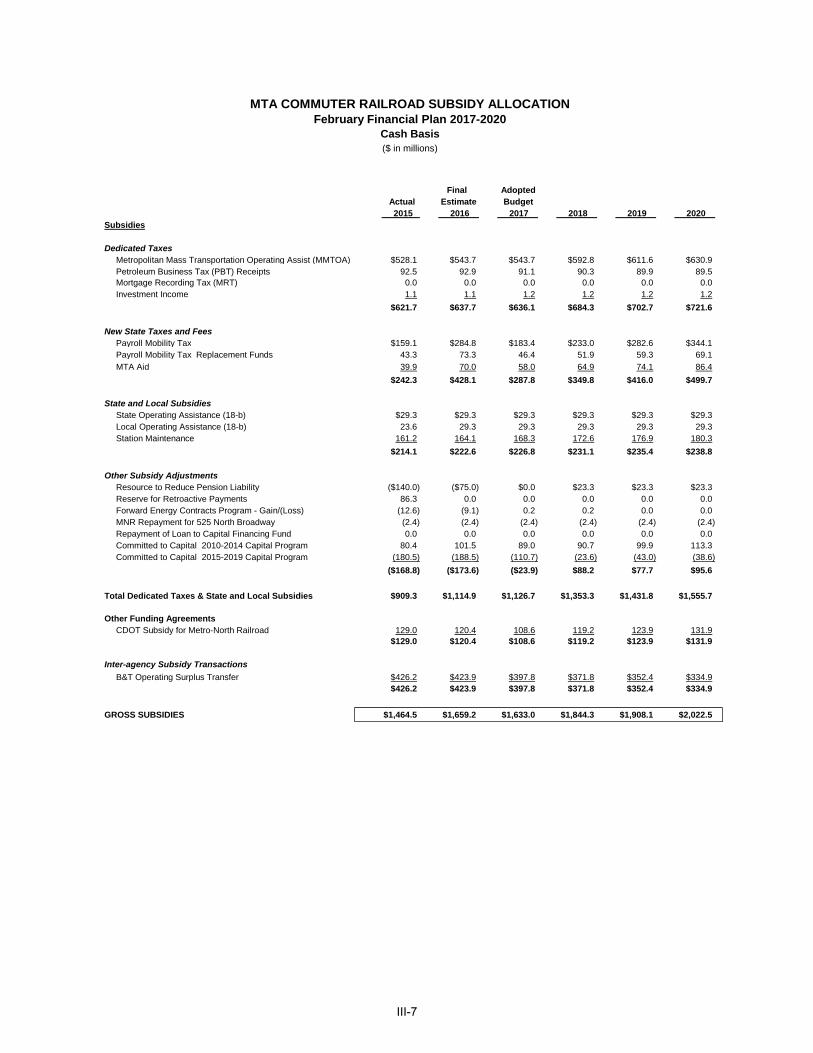
Final Adopted
Actual Estimate Budget 2015 2016 2017 2018 2019 2020
Subsidies
Dedicated TaxesMetropolitan Mass Transportation Operating Assist (MMTOA) $528.1 $543.7 $543.7 $592.8 $611.6 $630.9Petroleum Business Tax (PBT) Receipts 92.5 92.9 91.1 90.3 89.9 89.5Mortgage Recording Tax (MRT) 0.0 0.0 0.0 0.0 0.0 0.0Investment Income 1.1 1.1 1.2 1.2 1.2 1.2
$621.7 $637.7 $636.1 $684.3 $702.7 $721.6
New State Taxes and FeesPayroll Mobility Tax $159.1 $284.8 $183.4 $233.0 $282.6 $344.1Payroll Mobility Tax Replacement Funds 43.3 73.3 46.4 51.9 59.3 69.1
MTA Aid 39.9 70.0 58.0 64.9 74.1 86.4
$242.3 $428.1 $287.8 $349.8 $416.0 $499.7
State and Local SubsidiesState Operating Assistance (18-b) $29.3 $29.3 $29.3 $29.3 $29.3 $29.3Local Operating Assistance (18-b) 23.6 29.3 29.3 29.3 29.3 29.3Station Maintenance 161.2 164.1 168.3 172.6 176.9 180.3
$214.1 $222.6 $226.8 $231.1 $235.4 $238.8
Other Subsidy AdjustmentsResource to Reduce Pension Liability ($140.0) ($75.0) $0.0 $23.3 $23.3 $23.3Reserve for Retroactive Payments 86.3 0.0 0.0 0.0 0.0 0.0Forward Energy Contracts Program - Gain/(Loss) (12.6) (9.1) 0.2 0.2 0.0 0.0MNR Repayment for 525 North Broadway (2.4) (2.4) (2.4) (2.4) (2.4) (2.4)Repayment of Loan to Capital Financing Fund 0.0 0.0 0.0 0.0 0.0 0.0Committed to Capital 2010-2014 Capital Program 80.4 101.5 89.0 90.7 99.9 113.3Committed to Capital 2015-2019 Capital Program (180.5) (188.5) (110.7) (23.6) (43.0) (38.6)
($168.8) ($173.6) ($23.9) $88.2 $77.7 $95.6
$909.3 $1,114.9 $1,126.7 $1,353.3 $1,431.8 $1,555.7
CDOT Subsidy for Metro-North Railroad 129.0 120.4 108.6 119.2 123.9 131.9$129.0 $120.4 $108.6 $119.2 $123.9 $131.9
Inter-agency Subsidy Transactions
B&T Operating Surplus Transfer $426.2 $423.9 $397.8 $371.8 $352.4 $334.9$426.2 $423.9 $397.8 $371.8 $352.4 $334.9
GROSS SUBSIDIES $1,464.5 $1,659.2 $1,633.0 $1,844.3 $1,908.1 $2,022.5
MTA COMMUTER RAILROAD SUBSIDY ALLOCATION
Other Funding Agreements
Total Dedicated Taxes & State and Local Subsidies
($ in millions)
Cash BasisFebruary Financial Plan 2017-2020
III-7
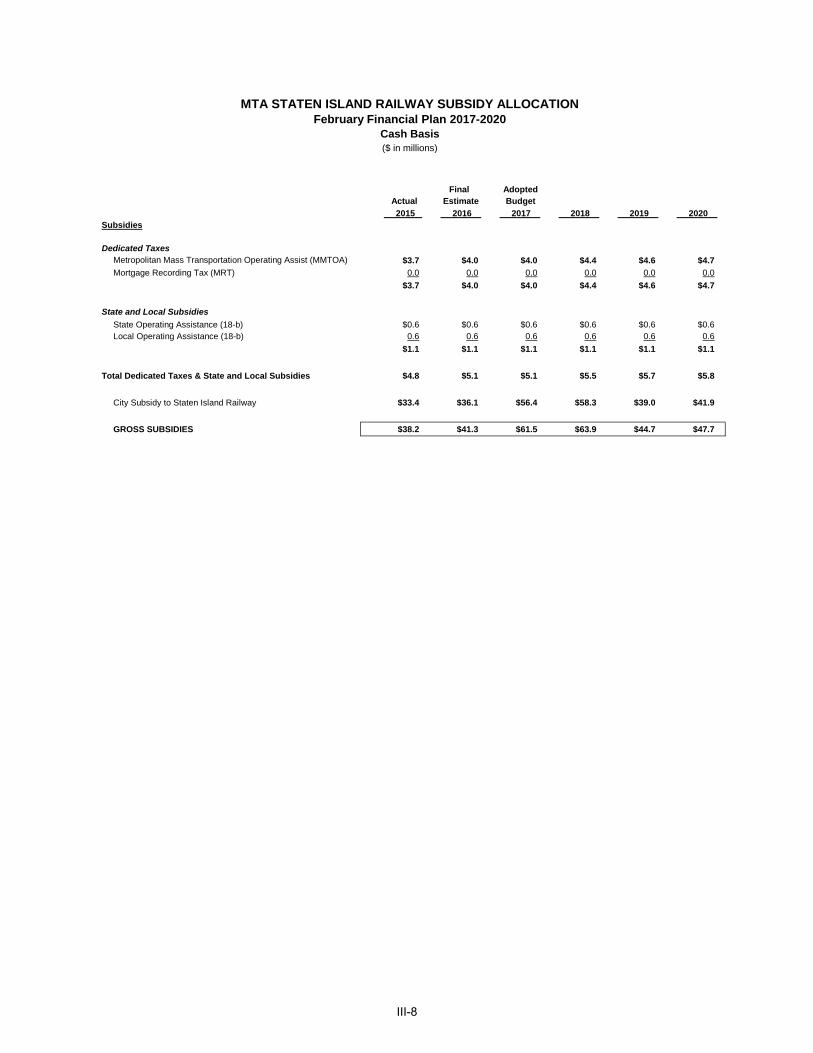
Final Adopted
Actual Estimate Budget
2015 2016 2017 2018 2019 2020 Subsidies
Dedicated TaxesMetropolitan Mass Transportation Operating Assist (MMTOA) $3.7 $4.0 $4.0 $4.4 $4.6 $4.7
Mortgage Recording Tax (MRT) 0.0 0.0 0.0 0.0 0.0 0.0
$3.7 $4.0 $4.0 $4.4 $4.6 $4.7
State and Local Subsidies
State Operating Assistance (18-b) $0.6 $0.6 $0.6 $0.6 $0.6 $0.6Local Operating Assistance (18-b) 0.6 0.6 0.6 0.6 0.6 0.6
$1.1 $1.1 $1.1 $1.1 $1.1 $1.1
$4.8 $5.1 $5.1 $5.5 $5.7 $5.8
City Subsidy to Staten Island Railway $33.4 $36.1 $56.4 $58.3 $39.0 $41.9
GROSS SUBSIDIES $38.2 $41.3 $61.5 $63.9 $44.7 $47.7
MTA STATEN ISLAND RAILWAY SUBSIDY ALLOCATION
Total Dedicated Taxes & State and Local Subsidies
($ in millions)
Cash BasisFebruary Financial Plan 2017-2020
III-8
Final Adopted
Actual Estimate Budget 2015 2016 2017 2018 2019 2020
Subsidies
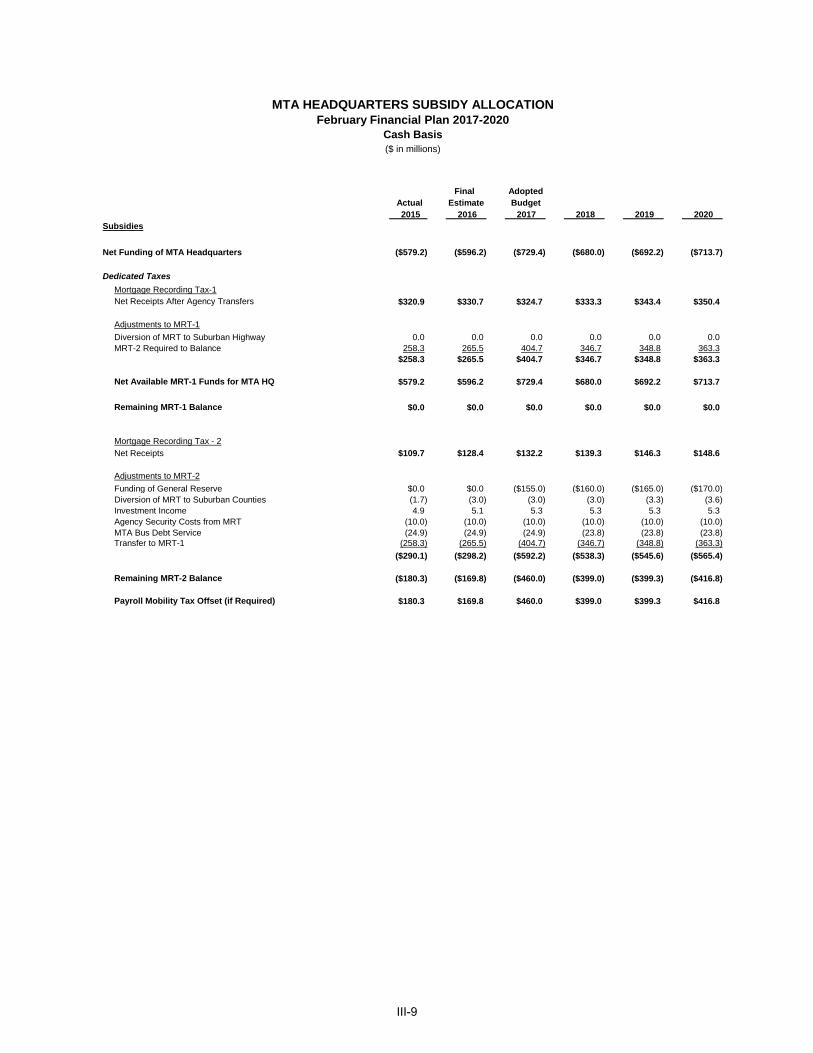
Net Funding of MTA Headquarters ($579.2) ($596.2) ($729.4) ($680.0) ($692.2) ($713.7)
Dedicated Taxes
Mortgage Recording Tax-1Net Receipts After Agency Transfers $320.9 $330.7 $324.7 $333.3 $343.4 $350.4
Adjustments to MRT-1
Diversion of MRT to Suburban Highway 0.0 0.0 0.0 0.0 0.0 0.0MRT-2 Required to Balance 258.3 265.5 404.7 346.7 348.8 363.3
$258.3 $265.5 $404.7 $346.7 $348.8 $363.3
Net Available MRT-1 Funds for MTA HQ $579.2 $596.2 $729.4 $680.0 $692.2 $713.7
Remaining MRT-1 Balance $0.0 $0.0 $0.0 $0.0 $0.0 $0.0
Mortgage Recording Tax - 2
Net Receipts $109.7 $128.4 $132.2 $139.3 $146.3 $148.6
Adjustments to MRT-2
Funding of General Reserve $0.0 $0.0 ($155.0) ($160.0) ($165.0) ($170.0)Diversion of MRT to Suburban Counties (1.7) (3.0) (3.0) (3.0) (3.3) (3.6)Investment Income 4.9 5.1 5.3 5.3 5.3 5.3Agency Security Costs from MRT (10.0) (10.0) (10.0) (10.0) (10.0) (10.0)MTA Bus Debt Service (24.9) (24.9) (24.9) (23.8) (23.8) (23.8)Transfer to MRT-1 (258.3) (265.5) (404.7) (346.7) (348.8) (363.3)
($290.1) ($298.2) ($592.2) ($538.3) ($545.6) ($565.4)
Remaining MRT-2 Balance ($180.3) ($169.8) ($460.0) ($399.0) ($399.3) ($416.8)
Payroll Mobility Tax Offset (if Required) $180.3 $169.8 $460.0 $399.0 $399.3 $416.8
($ in millions)
Cash BasisFebruary Financial Plan 2017-2020
MTA HEADQUARTERS SUBSIDY ALLOCATION
III-9
Final Adopted
Actual Estimate Budget 2015 2016 2017 2018 2019 2020
Subsidies
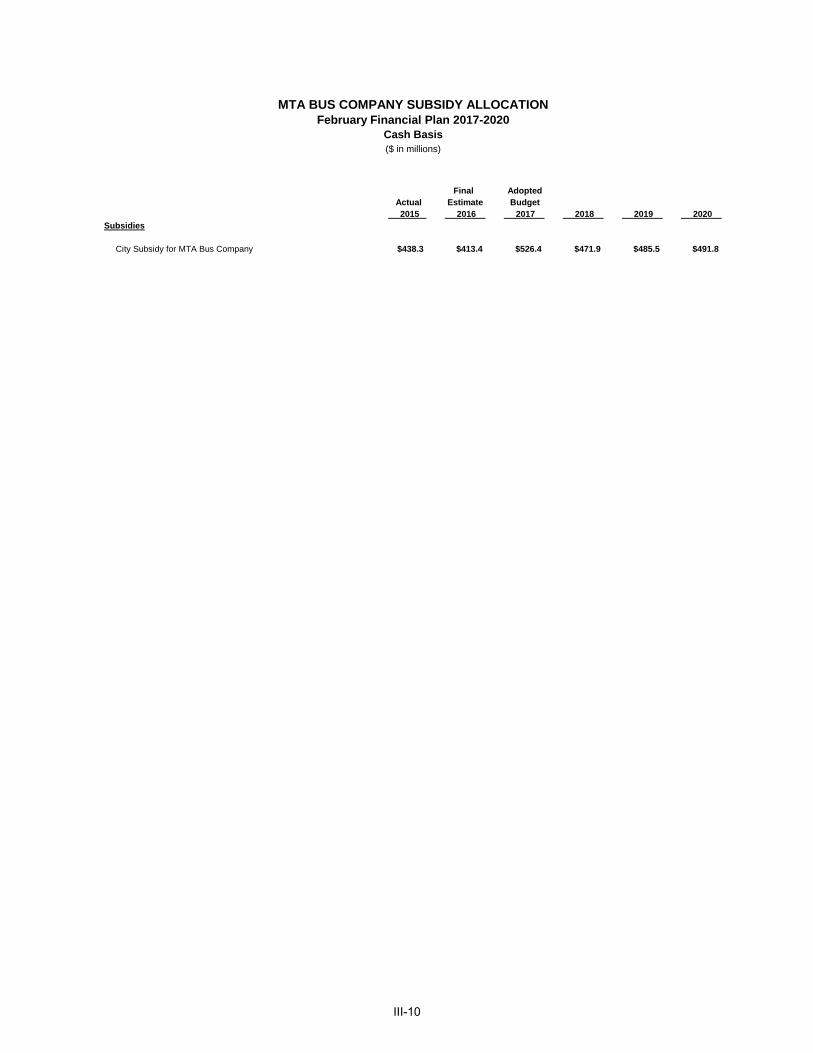
City Subsidy for MTA Bus Company $438.3 $413.4 $526.4 $471.9 $485.5 $491.8
($ in millions)
Cash BasisFebruary Financial Plan 2017-2020
MTA BUS COMPANY SUBSIDY ALLOCATION
III-10
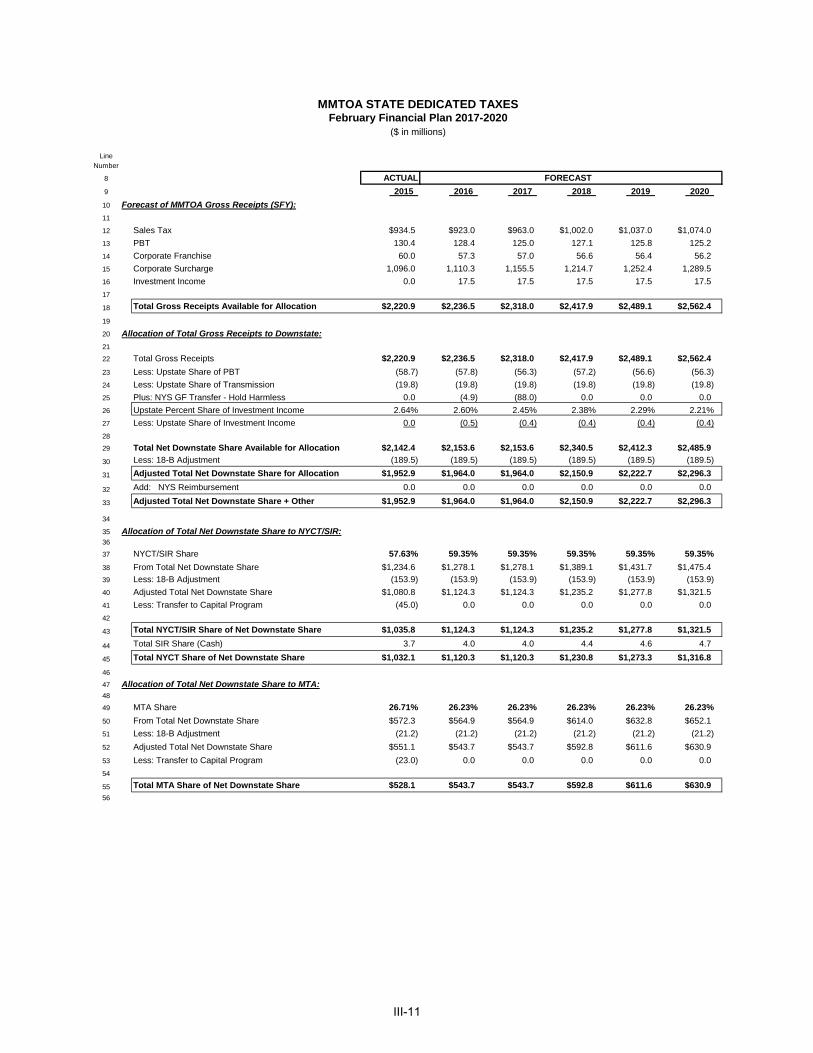
LineNumber
8 ACTUAL
9 2015 2016 2017 2018 2019 2020
10 Forecast of MMTOA Gross Receipts (SFY):
11
12 Sales Tax $934.5 $923.0 $963.0 $1,002.0 $1,037.0 $1,074.0
13 PBT 130.4 128.4 125.0 127.1 125.8 125.2
14 Corporate Franchise 60.0 57.3 57.0 56.6 56.4 56.2
15 Corporate Surcharge 1,096.0 1,110.3 1,155.5 1,214.7 1,252.4 1,289.5
16 Investment Income 0.0 17.5 17.5 17.5 17.5 17.5
17
18 Total Gross Receipts Available for Allocation $2,220.9 $2,236.5 $2,318.0 $2,417.9 $2,489.1 $2,562.4
19
20 Allocation of Total Gross Receipts to Downstate:
21
22 Total Gross Receipts $2,220.9 $2,236.5 $2,318.0 $2,417.9 $2,489.1 $2,562.4
23 Less: Upstate Share of PBT (58.7) (57.8) (56.3) (57.2) (56.6) (56.3)
24 Less: Upstate Share of Transmission (19.8) (19.8) (19.8) (19.8) (19.8) (19.8)
25 Plus: NYS GF Transfer - Hold Harmless 0.0 (4.9) (88.0) 0.0 0.0 0.0
26 Upstate Percent Share of Investment Income 2.64% 2.60% 2.45% 2.38% 2.29% 2.21%
27 Less: Upstate Share of Investment Income 0.0 (0.5) (0.4) (0.4) (0.4) (0.4)
28
29 Total Net Downstate Share Available for Allocation $2,142.4 $2,153.6 $2,153.6 $2,340.5 $2,412.3 $2,485.9
30 Less: 18-B Adjustment (189.5) (189.5) (189.5) (189.5) (189.5) (189.5)
31 Adjusted Total Net Downstate Share for Allocation $1,952.9 $1,964.0 $1,964.0 $2,150.9 $2,222.7 $2,296.3
32 Add: NYS Reimbursement 0.0 0.0 0.0 0.0 0.0 0.0
33 Adjusted Total Net Downstate Share + Other $1,952.9 $1,964.0 $1,964.0 $2,150.9 $2,222.7 $2,296.3
34
35 Allocation of Total Net Downstate Share to NYCT/SIR:36
37 NYCT/SIR Share 57.63% 59.35% 59.35% 59.35% 59.35% 59.35%
38 From Total Net Downstate Share $1,234.6 $1,278.1 $1,278.1 $1,389.1 $1,431.7 $1,475.4
39 Less: 18-B Adjustment (153.9) (153.9) (153.9) (153.9) (153.9) (153.9)
40 Adjusted Total Net Downstate Share $1,080.8 $1,124.3 $1,124.3 $1,235.2 $1,277.8 $1,321.5
41 Less: Transfer to Capital Program (45.0) 0.0 0.0 0.0 0.0 0.0
42
43 Total NYCT/SIR Share of Net Downstate Share $1,035.8 $1,124.3 $1,124.3 $1,235.2 $1,277.8 $1,321.5
44 Total SIR Share (Cash) 3.7 4.0 4.0 4.4 4.6 4.7
45 Total NYCT Share of Net Downstate Share $1,032.1 $1,120.3 $1,120.3 $1,230.8 $1,273.3 $1,316.8
46
47 Allocation of Total Net Downstate Share to MTA:48
49 MTA Share 26.71% 26.23% 26.23% 26.23% 26.23% 26.23%
50 From Total Net Downstate Share $572.3 $564.9 $564.9 $614.0 $632.8 $652.1
51 Less: 18-B Adjustment (21.2) (21.2) (21.2) (21.2) (21.2) (21.2)
52 Adjusted Total Net Downstate Share $551.1 $543.7 $543.7 $592.8 $611.6 $630.9
53 Less: Transfer to Capital Program (23.0) 0.0 0.0 0.0 0.0 0.0
54
55 Total MTA Share of Net Downstate Share $528.1 $543.7 $543.7 $592.8 $611.6 $630.9
56
($ in millions)
February Financial Plan 2017-2020MMTOA STATE DEDICATED TAXES
FORECAST
III-11
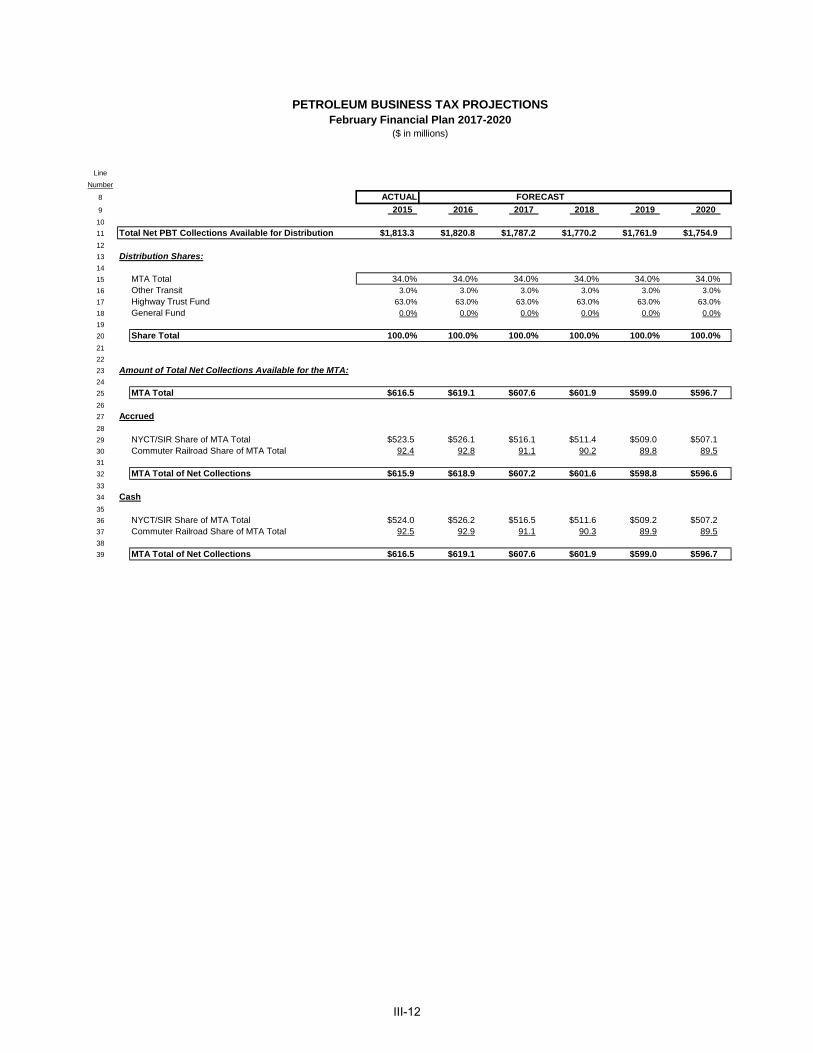
Line
Number
8 ACTUAL
9 2015 2016 2017 2018 2019 2020 10
11 Total Net PBT Collections Available for Distribution $1,813.3 $1,820.8 $1,787.2 $1,770.2 $1,761.9 $1,754.912
13 Distribution Shares:14
15 MTA Total 34.0% 34.0% 34.0% 34.0% 34.0% 34.0%16 Other Transit 3.0% 3.0% 3.0% 3.0% 3.0% 3.0%
17 Highway Trust Fund 63.0% 63.0% 63.0% 63.0% 63.0% 63.0%
18 General Fund 0.0% 0.0% 0.0% 0.0% 0.0% 0.0%
19
20 Share Total 100.0% 100.0% 100.0% 100.0% 100.0% 100.0%21
22
23 Amount of Total Net Collections Available for the MTA:24
25 MTA Total $616.5 $619.1 $607.6 $601.9 $599.0 $596.726
27 Accrued28
29 NYCT/SIR Share of MTA Total $523.5 $526.1 $516.1 $511.4 $509.0 $507.130 Commuter Railroad Share of MTA Total 92.4 92.8 91.1 90.2 89.8 89.531
32 MTA Total of Net Collections $615.9 $618.9 $607.2 $601.6 $598.8 $596.633
34 Cash35
36 NYCT/SIR Share of MTA Total $524.0 $526.2 $516.5 $511.6 $509.2 $507.237 Commuter Railroad Share of MTA Total 92.5 92.9 91.1 90.3 89.9 89.538
39 MTA Total of Net Collections $616.5 $619.1 $607.6 $601.9 $599.0 $596.7
($ in millions)February Financial Plan 2017-2020
PETROLEUM BUSINESS TAX PROJECTIONS
FORECAST
III-12
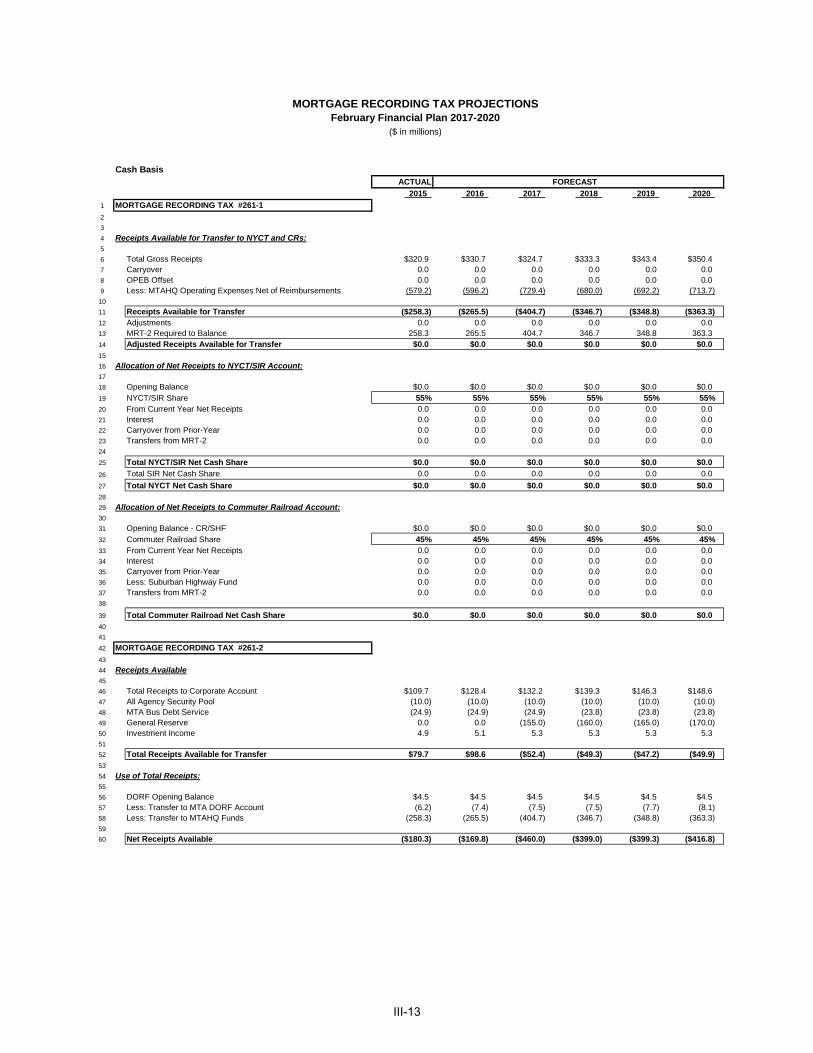
MORTGAGE RECORDING TAX PROJECTIONS
($ in millions)
February Financial Plan 2017-2020
Cash BasisACTUAL
2015 2016 2017 2018 2019 2020
1 MORTGAGE RECORDING TAX #261-1
2
3
4 Receipts Available for Transfer to NYCT and CRs:5
6 Total Gross Receipts $320.9 $330.7 $324.7 $333.3 $343.4 $350.47 Carryover 0.0 0.0 0.0 0.0 0.0 0.08 OPEB Offset 0.0 0.0 0.0 0.0 0.0 0.09 Less: MTAHQ Operating Expenses Net of Reimbursements (579.2) (596.2) (729.4) (680.0) (692.2) (713.7)
10
11 Receipts Available for Transfer ($258.3) ($265.5) ($404.7) ($346.7) ($348.8) ($363.3)12 Adjustments 0.0 0.0 0.0 0.0 0.0 0.013 MRT-2 Required to Balance 258.3 265.5 404.7 346.7 348.8 363.314 Adjusted Receipts Available for Transfer $0.0 $0.0 $0.0 $0.0 $0.0 $0.015
16 Allocation of Net Receipts to NYCT/SIR Account:17
18 Opening Balance $0.0 $0.0 $0.0 $0.0 $0.0 $0.019 NYCT/SIR Share 55% 55% 55% 55% 55% 55%20 From Current Year Net Receipts 0.0 0.0 0.0 0.0 0.0 0.021 Interest 0.0 0.0 0.0 0.0 0.0 0.022 Carryover from Prior-Year 0.0 0.0 0.0 0.0 0.0 0.023 Transfers from MRT-2 0.0 0.0 0.0 0.0 0.0 0.024
25 Total NYCT/SIR Net Cash Share $0.0 $0.0 $0.0 $0.0 $0.0 $0.0
26 Total SIR Net Cash Share 0.0 0.0 0.0 0.0 0.0 0.0
27 Total NYCT Net Cash Share $0.0 $0.0 $0.0 $0.0 $0.0 $0.028
29 Allocation of Net Receipts to Commuter Railroad Account:30
31 Opening Balance - CR/SHF $0.0 $0.0 $0.0 $0.0 $0.0 $0.032 Commuter Railroad Share 45% 45% 45% 45% 45% 45%33 From Current Year Net Receipts 0.0 0.0 0.0 0.0 0.0 0.034 Interest 0.0 0.0 0.0 0.0 0.0 0.035 Carryover from Prior-Year 0.0 0.0 0.0 0.0 0.0 0.036 Less: Suburban Highway Fund 0.0 0.0 0.0 0.0 0.0 0.037 Transfers from MRT-2 0.0 0.0 0.0 0.0 0.0 0.038
39 Total Commuter Railroad Net Cash Share $0.0 $0.0 $0.0 $0.0 $0.0 $0.040 41
42 MORTGAGE RECORDING TAX #261-2
43
44 Receipts Available45
46 Total Receipts to Corporate Account $109.7 $128.4 $132.2 $139.3 $146.3 $148.647 All Agency Security Pool (10.0) (10.0) (10.0) (10.0) (10.0) (10.0)48 MTA Bus Debt Service (24.9) (24.9) (24.9) (23.8) (23.8) (23.8)49 General Reserve 0.0 0.0 (155.0) (160.0) (165.0) (170.0)50 Investment Income 4.9 5.1 5.3 5.3 5.3 5.351
52 Total Receipts Available for Transfer $79.7 $98.6 ($52.4) ($49.3) ($47.2) ($49.9)53
54 Use of Total Receipts:55
56 DORF Opening Balance $4.5 $4.5 $4.5 $4.5 $4.5 $4.557 Less: Transfer to MTA DORF Account (6.2) (7.4) (7.5) (7.5) (7.7) (8.1)58 Less: Transfer to MTAHQ Funds (258.3) (265.5) (404.7) (346.7) (348.8) (363.3)59
60 Net Receipts Available ($180.3) ($169.8) ($460.0) ($399.0) ($399.3) ($416.8)
FORECAST
III-13
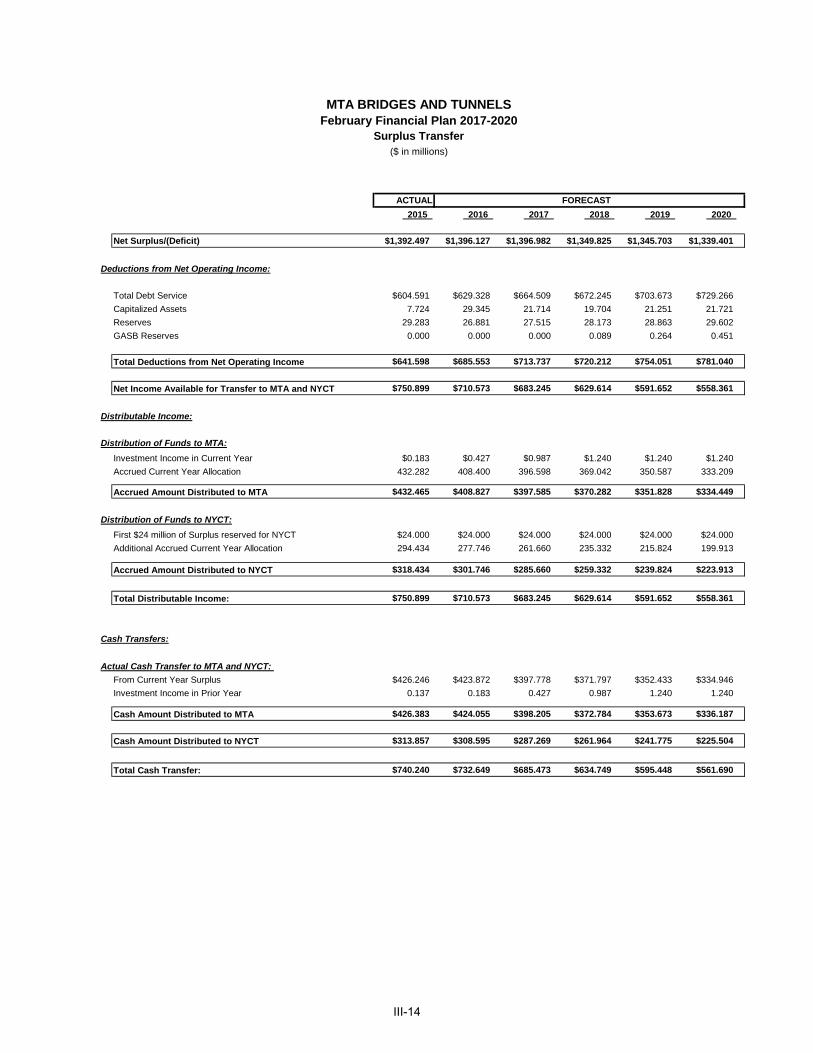
Surplus TransferFebruary Financial Plan 2017-2020MTA BRIDGES AND TUNNELS
($ in millions)
ACTUAL
2015 2016 2017 2018 2019 2020
Net Surplus/(Deficit) $1,392.497 $1,396.127 $1,396.982 $1,349.825 $1,345.703 $1,339.401
Deductions from Net Operating Income:
Total Debt Service $604.591 $629.328 $664.509 $672.245 $703.673 $729.266
Capitalized Assets 7.724 29.345 21.714 19.704 21.251 21.721
Reserves 29.283 26.881 27.515 28.173 28.863 29.602
GASB Reserves 0.000 0.000 0.000 0.089 0.264 0.451
Total Deductions from Net Operating Income $641.598 $685.553 $713.737 $720.212 $754.051 $781.040
Net Income Available for Transfer to MTA and NYCT $750.899 $710.573 $683.245 $629.614 $591.652 $558.361
Distributable Income:
Distribution of Funds to MTA:
Investment Income in Current Year $0.183 $0.427 $0.987 $1.240 $1.240 $1.240
Accrued Current Year Allocation 432.282 408.400 396.598 369.042 350.587 333.209
Accrued Amount Distributed to MTA $432.465 $408.827 $397.585 $370.282 $351.828 $334.449
Distribution of Funds to NYCT:
First $24 million of Surplus reserved for NYCT $24.000 $24.000 $24.000 $24.000 $24.000 $24.000
Additional Accrued Current Year Allocation 294.434 277.746 261.660 235.332 215.824 199.913
Accrued Amount Distributed to NYCT $318.434 $301.746 $285.660 $259.332 $239.824 $223.913
Total Distributable Income: $750.899 $710.573 $683.245 $629.614 $591.652 $558.361
Cash Transfers:
Actual Cash Transfer to MTA and NYCT:
From Current Year Surplus $426.246 $423.872 $397.778 $371.797 $352.433 $334.946
Investment Income in Prior Year 0.137 0.183 0.427 0.987 1.240 1.240
Cash Amount Distributed to MTA $426.383 $424.055 $398.205 $372.784 $353.673 $336.187
Cash Amount Distributed to NYCT $313.857 $308.595 $287.269 $261.964 $241.775 $225.504
Total Cash Transfer: $740.240 $732.649 $685.473 $634.749 $595.448 $561.690
FORECAST
III-14
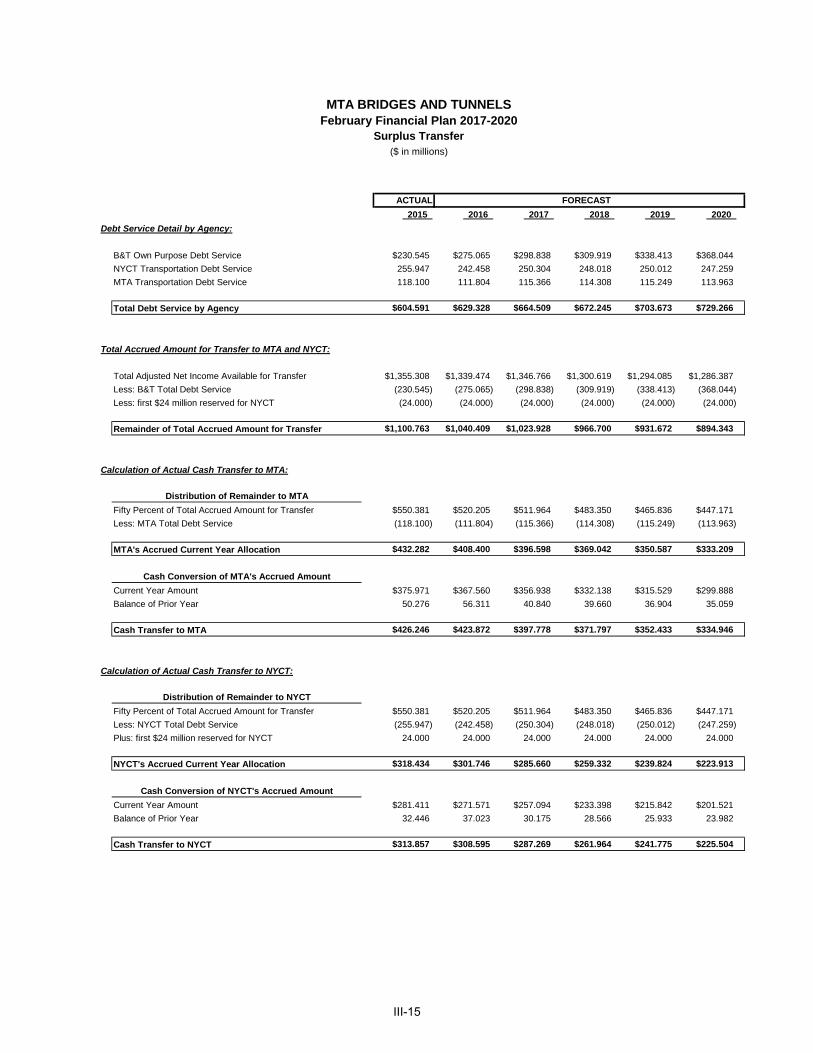
Surplus TransferFebruary Financial Plan 2017-2020MTA BRIDGES AND TUNNELS
($ in millions)
ACTUAL
2015 2016 2017 2018 2019 2020
Debt Service Detail by Agency:
B&T Own Purpose Debt Service $230.545 $275.065 $298.838 $309.919 $338.413 $368.044
NYCT Transportation Debt Service 255.947 242.458 250.304 248.018 250.012 247.259
MTA Transportation Debt Service 118.100 111.804 115.366 114.308 115.249 113.963
Total Debt Service by Agency $604.591 $629.328 $664.509 $672.245 $703.673 $729.266
Total Accrued Amount for Transfer to MTA and NYCT:
Total Adjusted Net Income Available for Transfer $1,355.308 $1,339.474 $1,346.766 $1,300.619 $1,294.085 $1,286.387
Less: B&T Total Debt Service (230.545) (275.065) (298.838) (309.919) (338.413) (368.044)
Less: first $24 million reserved for NYCT (24.000) (24.000) (24.000) (24.000) (24.000) (24.000)
Remainder of Total Accrued Amount for Transfer $1,100.763 $1,040.409 $1,023.928 $966.700 $931.672 $894.343
Calculation of Actual Cash Transfer to MTA:
Distribution of Remainder to MTA
Fifty Percent of Total Accrued Amount for Transfer $550.381 $520.205 $511.964 $483.350 $465.836 $447.171
Less: MTA Total Debt Service (118.100) (111.804) (115.366) (114.308) (115.249) (113.963)
MTA's Accrued Current Year Allocation $432.282 $408.400 $396.598 $369.042 $350.587 $333.209
Cash Conversion of MTA's Accrued Amount
Current Year Amount $375.971 $367.560 $356.938 $332.138 $315.529 $299.888
Balance of Prior Year 50.276 56.311 40.840 39.660 36.904 35.059
Cash Transfer to MTA $426.246 $423.872 $397.778 $371.797 $352.433 $334.946
Calculation of Actual Cash Transfer to NYCT:
Distribution of Remainder to NYCT
Fifty Percent of Total Accrued Amount for Transfer $550.381 $520.205 $511.964 $483.350 $465.836 $447.171
Less: NYCT Total Debt Service (255.947) (242.458) (250.304) (248.018) (250.012) (247.259)
Plus: first $24 million reserved for NYCT 24.000 24.000 24.000 24.000 24.000 24.000
NYCT's Accrued Current Year Allocation $318.434 $301.746 $285.660 $259.332 $239.824 $223.913
Cash Conversion of NYCT's Accrued Amount
Current Year Amount $281.411 $271.571 $257.094 $233.398 $215.842 $201.521
Balance of Prior Year 32.446 37.023 30.175 28.566 25.933 23.982
Cash Transfer to NYCT $313.857 $308.595 $287.269 $261.964 $241.775 $225.504
FORECAST
III-15
Line
Number ACTUAL
9 2015 2016 2017 2018 2019 2020
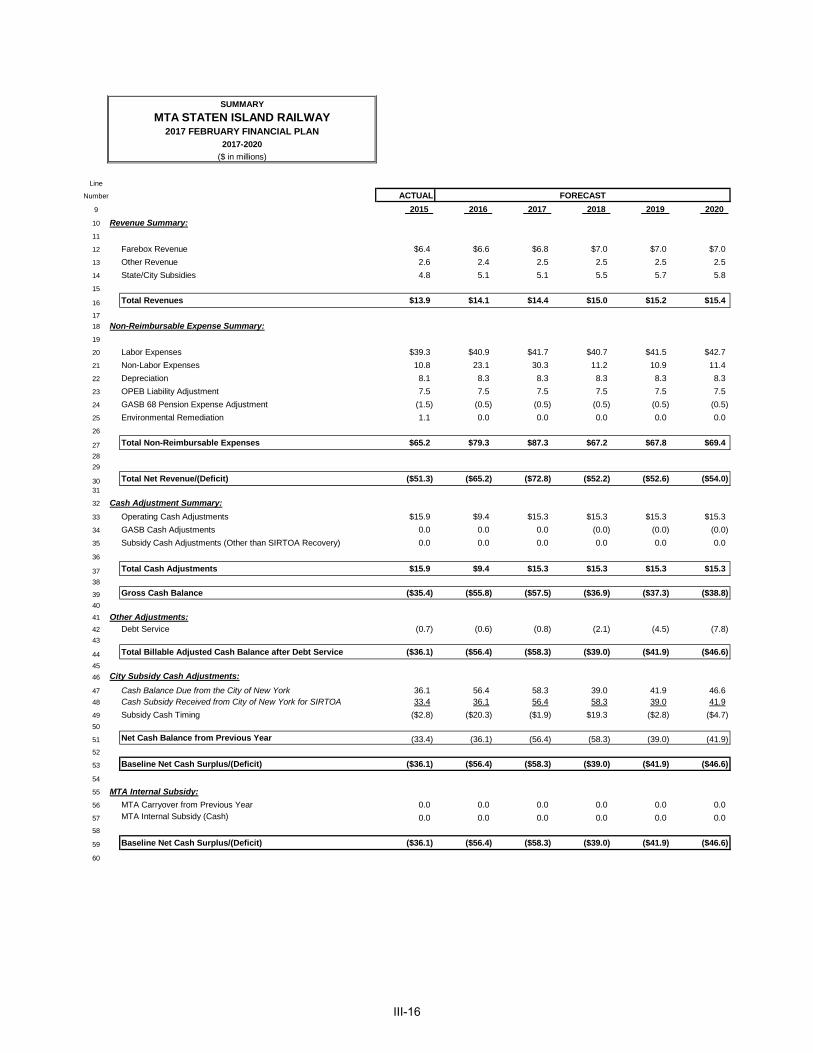
10 Revenue Summary:
11
12 Farebox Revenue $6.4 $6.6 $6.8 $7.0 $7.0 $7.0
13 Other Revenue 2.6 2.4 2.5 2.5 2.5 2.5
14 State/City Subsidies 4.8 5.1 5.1 5.5 5.7 5.8
15
16 Total Revenues $13.9 $14.1 $14.4 $15.0 $15.2 $15.4
17
18 Non-Reimbursable Expense Summary:
19
20 Labor Expenses $39.3 $40.9 $41.7 $40.7 $41.5 $42.7
21 Non-Labor Expenses 10.8 23.1 30.3 11.2 10.9 11.4
22 Depreciation 8.1 8.3 8.3 8.3 8.3 8.3
23 OPEB Liability Adjustment 7.5 7.5 7.5 7.5 7.5 7.5
24 GASB 68 Pension Expense Adjustment (1.5) (0.5) (0.5) (0.5) (0.5) (0.5)
25 Environmental Remediation 1.1 0.0 0.0 0.0 0.0 0.0
26
27 Total Non-Reimbursable Expenses $65.2 $79.3 $87.3 $67.2 $67.8 $69.4
28
29
30 Total Net Revenue/(Deficit) ($51.3) ($65.2) ($72.8) ($52.2) ($52.6) ($54.0)31
32 Cash Adjustment Summary:
33 Operating Cash Adjustments $15.9 $9.4 $15.3 $15.3 $15.3 $15.3
34 GASB Cash Adjustments 0.0 0.0 0.0 (0.0) (0.0) (0.0)
35 Subsidy Cash Adjustments (Other than SIRTOA Recovery) 0.0 0.0 0.0 0.0 0.0 0.0
36
37 Total Cash Adjustments $15.9 $9.4 $15.3 $15.3 $15.3 $15.3
38
39 Gross Cash Balance ($35.4) ($55.8) ($57.5) ($36.9) ($37.3) ($38.8)
40
41 Other Adjustments:
42 Debt Service (0.7) (0.6) (0.8) (2.1) (4.5) (7.8)43
44 Total Billable Adjusted Cash Balance after Debt Service ($36.1) ($56.4) ($58.3) ($39.0) ($41.9) ($46.6)
45
46 City Subsidy Cash Adjustments:
47 Cash Balance Due from the City of New York 36.1 56.4 58.3 39.0 41.9 46.648 Cash Subsidy Received from City of New York for SIRTOA 33.4 36.1 56.4 58.3 39.0 41.9
49 Subsidy Cash Timing ($2.8) ($20.3) ($1.9) $19.3 ($2.8) ($4.7)50
51 Net Cash Balance from Previous Year (33.4) (36.1) (56.4) (58.3) (39.0) (41.9)
52
53 Baseline Net Cash Surplus/(Deficit) ($36.1) ($56.4) ($58.3) ($39.0) ($41.9) ($46.6)
54
55 MTA Internal Subsidy:
56 MTA Carryover from Previous Year 0.0 0.0 0.0 0.0 0.0 0.0
57 MTA Internal Subsidy (Cash) 0.0 0.0 0.0 0.0 0.0 0.0
58
59 Baseline Net Cash Surplus/(Deficit) ($36.1) ($56.4) ($58.3) ($39.0) ($41.9) ($46.6)
60
SUMMARY
2017 FEBRUARY FINANCIAL PLAN2017-2020
($ in millions)
MTA STATEN ISLAND RAILWAY
FORECAST
III-16
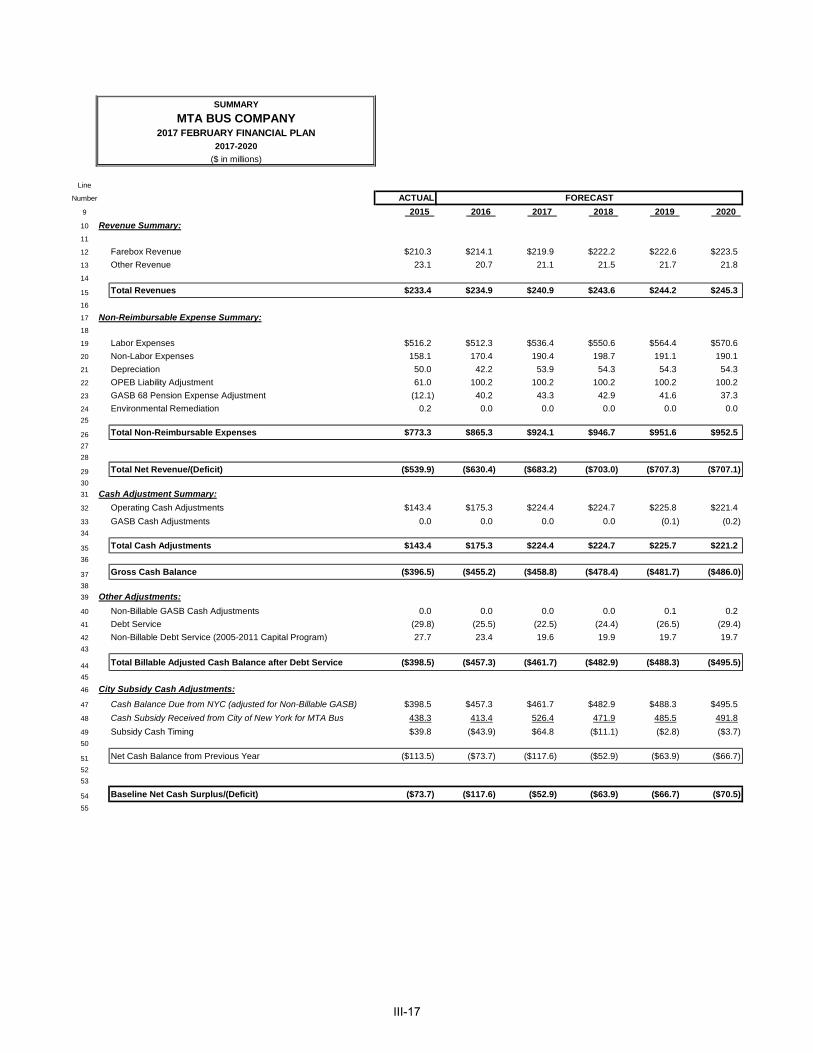
Line
Number ACTUAL
9 2015 2016 2017 2018 2019 2020
10 Revenue Summary:
11
12 Farebox Revenue $210.3 $214.1 $219.9 $222.2 $222.6 $223.5
13 Other Revenue 23.1 20.7 21.1 21.5 21.7 21.8
14
15 Total Revenues $233.4 $234.9 $240.9 $243.6 $244.2 $245.3
16
17 Non-Reimbursable Expense Summary:
18
19 Labor Expenses $516.2 $512.3 $536.4 $550.6 $564.4 $570.6
20 Non-Labor Expenses 158.1 170.4 190.4 198.7 191.1 190.1
21 Depreciation 50.0 42.2 53.9 54.3 54.3 54.3
22 OPEB Liability Adjustment 61.0 100.2 100.2 100.2 100.2 100.2
23 GASB 68 Pension Expense Adjustment (12.1) 40.2 43.3 42.9 41.6 37.3
24 Environmental Remediation 0.2 0.0 0.0 0.0 0.0 0.025
26 Total Non-Reimbursable Expenses $773.3 $865.3 $924.1 $946.7 $951.6 $952.5
27
28
29 Total Net Revenue/(Deficit) ($539.9) ($630.4) ($683.2) ($703.0) ($707.3) ($707.1)
30
31 Cash Adjustment Summary:
32 Operating Cash Adjustments $143.4 $175.3 $224.4 $224.7 $225.8 $221.4
33 GASB Cash Adjustments 0.0 0.0 0.0 0.0 (0.1) (0.2)34
35 Total Cash Adjustments $143.4 $175.3 $224.4 $224.7 $225.7 $221.2
36
37 Gross Cash Balance ($396.5) ($455.2) ($458.8) ($478.4) ($481.7) ($486.0)
38
39 Other Adjustments:
40 Non-Billable GASB Cash Adjustments 0.0 0.0 0.0 0.0 0.1 0.2
41 Debt Service (29.8) (25.5) (22.5) (24.4) (26.5) (29.4)
42 Non-Billable Debt Service (2005-2011 Capital Program) 27.7 23.4 19.6 19.9 19.7 19.7 43
44 Total Billable Adjusted Cash Balance after Debt Service ($398.5) ($457.3) ($461.7) ($482.9) ($488.3) ($495.5)
45
46 City Subsidy Cash Adjustments:
47 Cash Balance Due from NYC (adjusted for Non-Billable GASB) $398.5 $457.3 $461.7 $482.9 $488.3 $495.5
48 Cash Subsidy Received from City of New York for MTA Bus 438.3 413.4 526.4 471.9 485.5 491.8
49 Subsidy Cash Timing $39.8 ($43.9) $64.8 ($11.1) ($2.8) ($3.7)50
51 Net Cash Balance from Previous Year ($113.5) ($73.7) ($117.6) ($52.9) ($63.9) ($66.7)
52
53
54 Baseline Net Cash Surplus/(Deficit) ($73.7) ($117.6) ($52.9) ($63.9) ($66.7) ($70.5)
55
FORECAST
SUMMARY
2017 FEBRUARY FINANCIAL PLAN2017-2020
($ in millions)
MTA BUS COMPANY
III-17
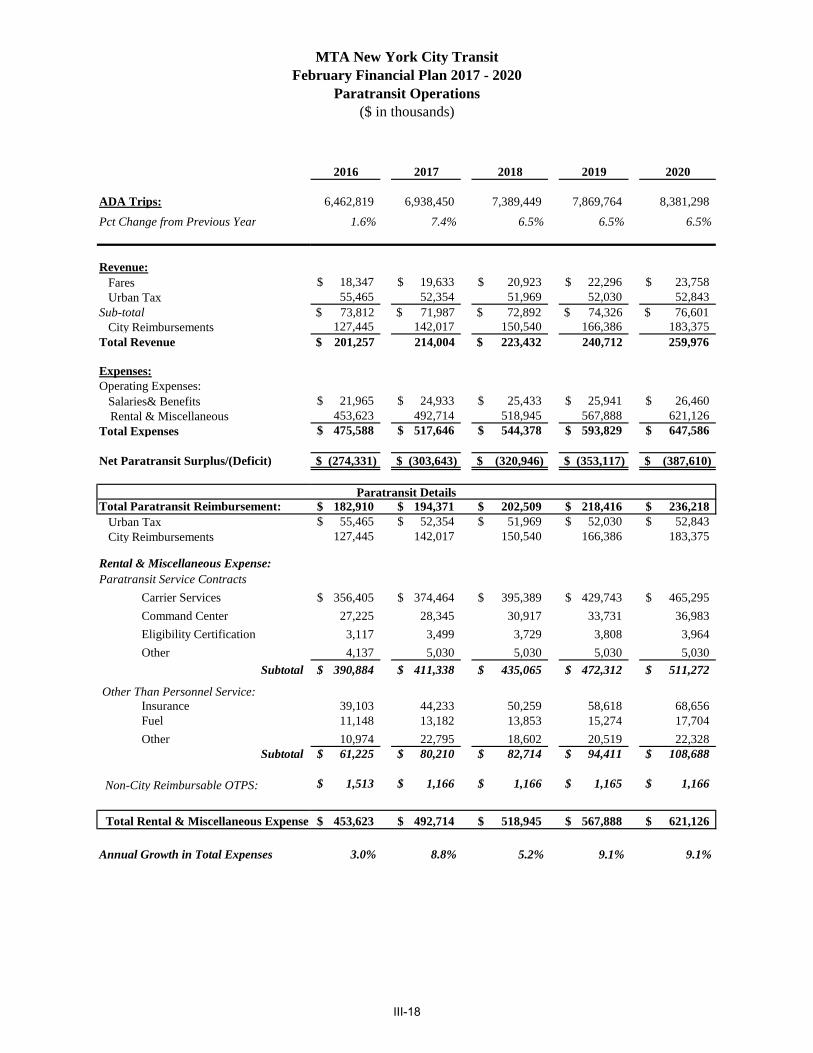
MTA New York City Transit February Financial Plan 2017 - 2020
Paratransit Operations($ in thousands)
ADA Trips:
Pct Change from Previous Year
Revenue: Fares Urban TaxSub-total City Reimbursements Total Revenue
Expenses:Operating Expenses: Salaries& Benefits Rental & Miscellaneous Total Expenses
Net Paratransit Surplus/(Deficit)
Total Paratransit Reimbursement: Urban Tax City Reimbursements
Rental & Miscellaneous Expense:Paratransit Service Contracts
Carrier Services
Command Center
Eligibility Certification
Other
Subtotal
Other Than Personnel Service: Insurance Fuel
Other Subtotal
Non-City Reimbursable OTPS:
Total Rental & Miscellaneous Expense
Annual Growth in Total Expenses
2016 2017 2018 2019 2020
6,462,819 6,938,450 7,389,449 7,869,764 8,381,298
1.6% 7.4% 6.5% 6.5% 6.5%
18,347$ 19,633$ 20,923$ 22,296$ 23,758$ 55,465 52,354 51,969 52,030 52,843
$ 73,812 $ 71,987 $ 72,892 $ 74,326 $ 76,601 127,445 142,017 150,540 166,386 183,375
$ 201,257 214,004 $ 223,432 240,712 259,976
21,965$ 24,933$ 25,433$ 25,941$ 26,460$ 453,623 492,714 518,945 567,888 621,126 475,588$ 517,646$ 544,378$ 593,829$ 647,586$
$ (274,331) $ (303,643) $ (320,946) $ (353,117) $ (387,610)
182,910$ 194,371$ 202,509$ 218,416$ 236,218$ 55,465$ 52,354$ 51,969$ 52,030$ 52,843$
127,445 142,017 150,540 166,386 183,375
356,405$ 374,464$ 395,389$ 429,743$ 465,295$
27,225 28,345 30,917 33,731 36,983
3,117 3,499 3,729 3,808 3,964
4,137 5,030 5,030 5,030 5,030
390,884$ 411,338$ 435,065$ 472,312$ 511,272$
39,103 44,233 50,259 58,618 68,656 11,148 13,182 13,853 15,274 17,704
10,974 22,795 18,602 20,519 22,328 61,225$ 80,210$ 82,714$ 94,411$ 108,688$
1,513$ 1,166$ 1,166$ 1,165$ 1,166$
453,623$ 492,714$ 518,945$ 567,888$ 621,126$
3.0% 8.8% 5.2% 9.1% 9.1%
Paratransit Details
III-18
[THIS PAGE INTENTIONALLY LEFT BLANK]
III-19
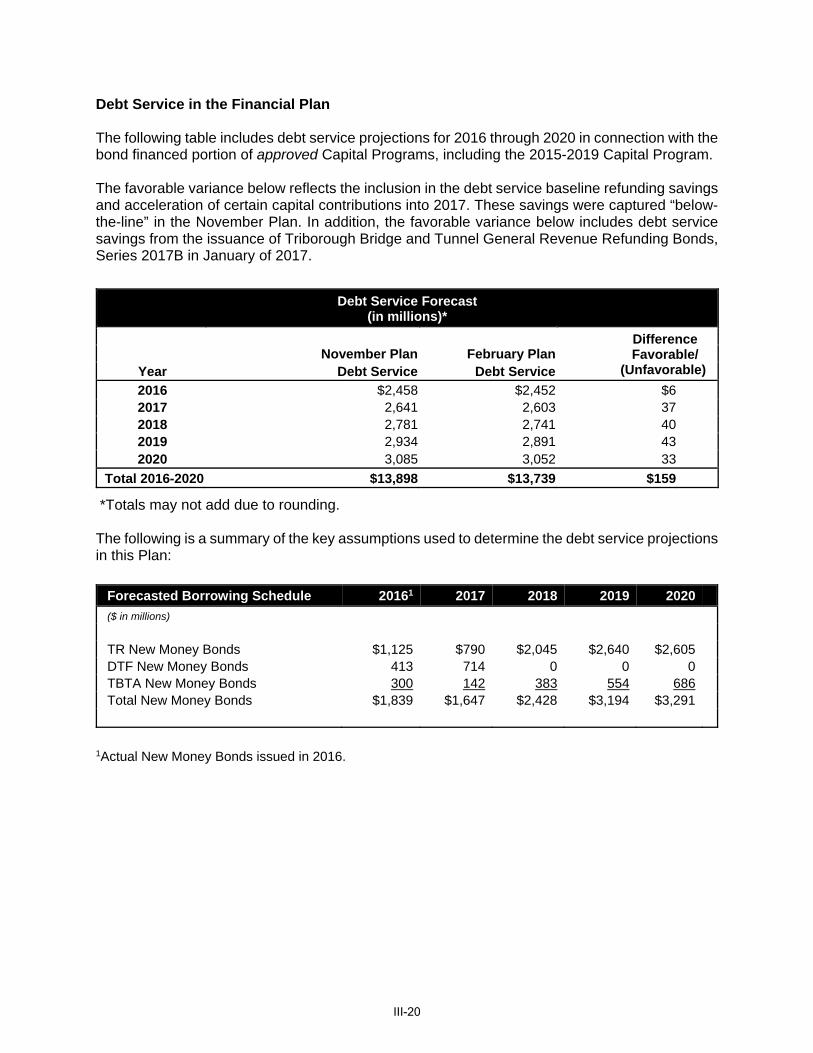
Debt Service in the Financial Plan The following table includes debt service projections for 2016 through 2020 in connection with the bond financed portion of approved Capital Programs, including the 2015-2019 Capital Program. The favorable variance below reflects the inclusion in the debt service baseline refunding savings and acceleration of certain capital contributions into 2017. These savings were captured “below-the-line” in the November Plan. In addition, the favorable variance below includes debt service savings from the issuance of Triborough Bridge and Tunnel General Revenue Refunding Bonds, Series 2017B in January of 2017.
Debt Service Forecast (in millions)*
Difference Favorable/
(Unfavorable) November Plan February Plan
Year Debt Service Debt Service
2016 $2,458 $2,452 $6 2017 2,641 2,603 37 2018 2,781 2,741 40 2019 2,934 2,891 43 2020 3,085 3,052 33
Total 2016-2020 $13,898 $13,739 $159
*Totals may not add due to rounding. The following is a summary of the key assumptions used to determine the debt service projections in this Plan:
Forecasted Borrowing Schedule 20161 2017 2018 2019 2020
($ in millions) TR New Money Bonds $1,125 $790 $2,045 $2,640 $2,605 DTF New Money Bonds 413 714 0 0 0 TBTA New Money Bonds 300 142 383 554 686 Total New Money Bonds $1,839 $1,647 $2,428 $3,194 $3,291
1Actual New Money Bonds issued in 2016.
III-20
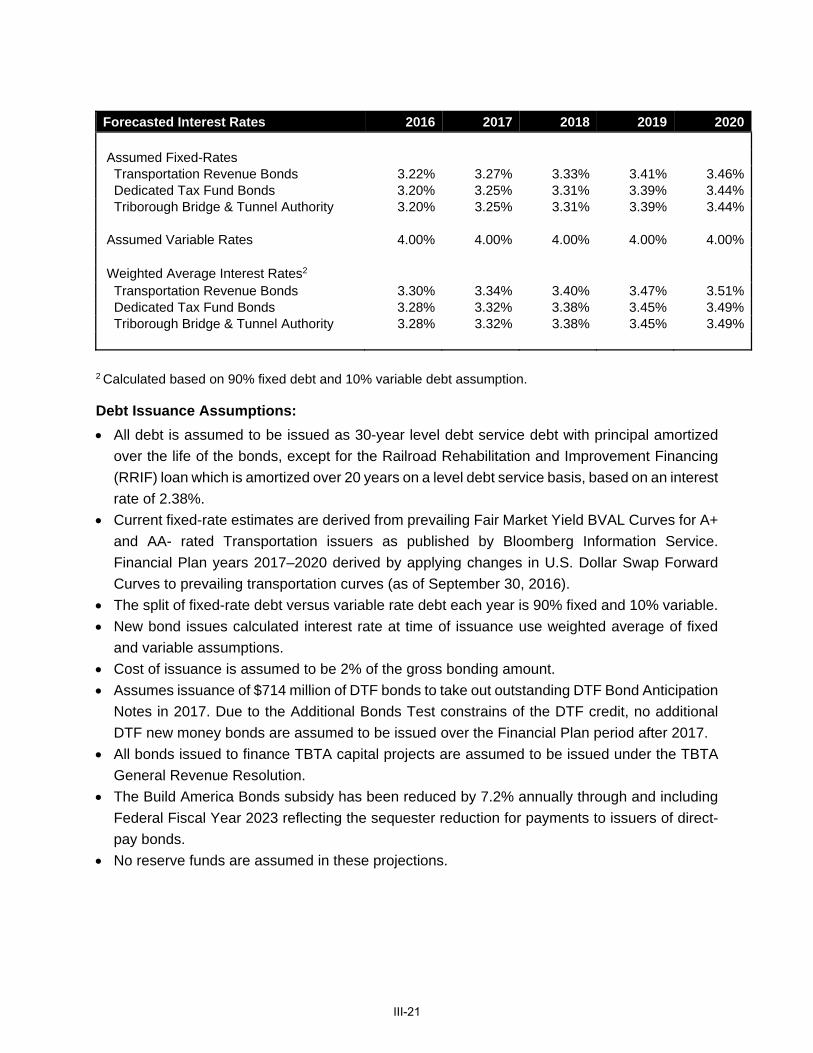
Forecasted Interest Rates 2016 2017 2018 2019 2020
Assumed Fixed-Rates Transportation Revenue Bonds 3.22% 3.27% 3.33% 3.41% 3.46% Dedicated Tax Fund Bonds 3.20% 3.25% 3.31% 3.39% 3.44% Triborough Bridge & Tunnel Authority 3.20% 3.25% 3.31% 3.39% 3.44% Assumed Variable Rates 4.00% 4.00% 4.00% 4.00% 4.00% Weighted Average Interest Rates2 Transportation Revenue Bonds 3.30% 3.34% 3.40% 3.47% 3.51% Dedicated Tax Fund Bonds 3.28% 3.32% 3.38% 3.45% 3.49% Triborough Bridge & Tunnel Authority 3.28% 3.32% 3.38% 3.45% 3.49%
2 Calculated based on 90% fixed debt and 10% variable debt assumption. Debt Issuance Assumptions:
All debt is assumed to be issued as 30-year level debt service debt with principal amortized
over the life of the bonds, except for the Railroad Rehabilitation and Improvement Financing
(RRIF) loan which is amortized over 20 years on a level debt service basis, based on an interest
rate of 2.38%.
Current fixed-rate estimates are derived from prevailing Fair Market Yield BVAL Curves for A+
and AA- rated Transportation issuers as published by Bloomberg Information Service.
Financial Plan years 2017–2020 derived by applying changes in U.S. Dollar Swap Forward
Curves to prevailing transportation curves (as of September 30, 2016).
The split of fixed-rate debt versus variable rate debt each year is 90% fixed and 10% variable.
New bond issues calculated interest rate at time of issuance use weighted average of fixed
and variable assumptions.
Cost of issuance is assumed to be 2% of the gross bonding amount.
Assumes issuance of $714 million of DTF bonds to take out outstanding DTF Bond Anticipation
Notes in 2017. Due to the Additional Bonds Test constrains of the DTF credit, no additional
DTF new money bonds are assumed to be issued over the Financial Plan period after 2017.
All bonds issued to finance TBTA capital projects are assumed to be issued under the TBTA
General Revenue Resolution.
The Build America Bonds subsidy has been reduced by 7.2% annually through and including
Federal Fiscal Year 2023 reflecting the sequester reduction for payments to issuers of direct-
pay bonds.
No reserve funds are assumed in these projections.
III-21
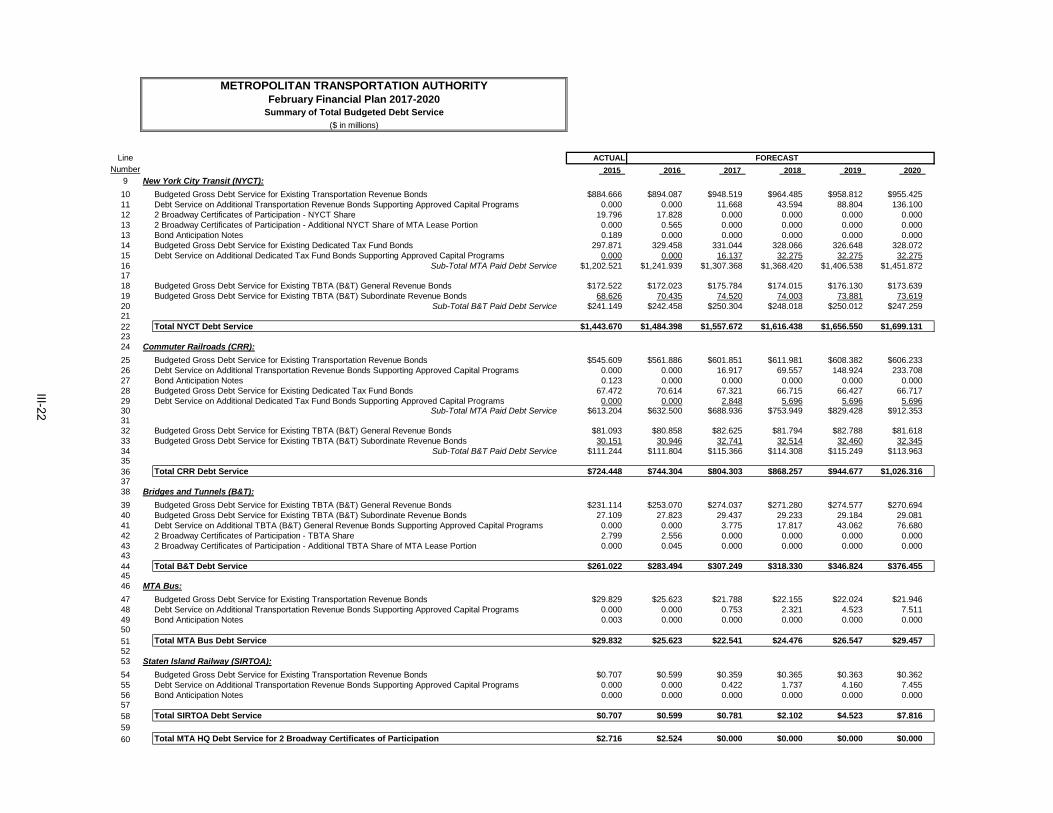
Line ACTUAL
Number 2015 2016 2017 2018 2019 2020 9 New York City Transit (NYCT):
10 Budgeted Gross Debt Service for Existing Transportation Revenue Bonds $884.666 $894.087 $948.519 $964.485 $958.812 $955.42511 Debt Service on Additional Transportation Revenue Bonds Supporting Approved Capital Programs 0.000 0.000 11.668 43.594 88.804 136.10012 2 Broadway Certificates of Participation - NYCT Share 19.796 17.828 0.000 0.000 0.000 0.00013 2 Broadway Certificates of Participation - Additional NYCT Share of MTA Lease Portion 0.000 0.565 0.000 0.000 0.000 0.00013 Bond Anticipation Notes 0.189 0.000 0.000 0.000 0.000 0.00014 Budgeted Gross Debt Service for Existing Dedicated Tax Fund Bonds 297.871 329.458 331.044 328.066 326.648 328.07215 Debt Service on Additional Dedicated Tax Fund Bonds Supporting Approved Capital Programs 0.000 0.000 16.137 32.275 32.275 32.27516 Sub-Total MTA Paid Debt Service $1,202.521 $1,241.939 $1,307.368 $1,368.420 $1,406.538 $1,451.8721718 Budgeted Gross Debt Service for Existing TBTA (B&T) General Revenue Bonds $172.522 $172.023 $175.784 $174.015 $176.130 $173.63919 Budgeted Gross Debt Service for Existing TBTA (B&T) Subordinate Revenue Bonds 68.626 70.435 74.520 74.003 73.881 73.61920 Sub-Total B&T Paid Debt Service $241.149 $242.458 $250.304 $248.018 $250.012 $247.2592122 Total NYCT Debt Service $1,443.670 $1,484.398 $1,557.672 $1,616.438 $1,656.550 $1,699.1312324 Commuter Railroads (CRR):
25 Budgeted Gross Debt Service for Existing Transportation Revenue Bonds $545.609 $561.886 $601.851 $611.981 $608.382 $606.23326 Debt Service on Additional Transportation Revenue Bonds Supporting Approved Capital Programs 0.000 0.000 16.917 69.557 148.924 233.70827 Bond Anticipation Notes 0.123 0.000 0.000 0.000 0.000 0.00028 Budgeted Gross Debt Service for Existing Dedicated Tax Fund Bonds 67.472 70.614 67.321 66.715 66.427 66.71729 Debt Service on Additional Dedicated Tax Fund Bonds Supporting Approved Capital Programs 0.000 0.000 2.848 5.696 5.696 5.69630 Sub-Total MTA Paid Debt Service $613.204 $632.500 $688.936 $753.949 $829.428 $912.3533132 Budgeted Gross Debt Service for Existing TBTA (B&T) General Revenue Bonds $81.093 $80.858 $82.625 $81.794 $82.788 $81.61833 Budgeted Gross Debt Service for Existing TBTA (B&T) Subordinate Revenue Bonds 30.151 30.946 32.741 32.514 32.460 32.34534 Sub-Total B&T Paid Debt Service $111.244 $111.804 $115.366 $114.308 $115.249 $113.9633536 Total CRR Debt Service $724.448 $744.304 $804.303 $868.257 $944.677 $1,026.3163738 Bridges and Tunnels (B&T):
39 Budgeted Gross Debt Service for Existing TBTA (B&T) General Revenue Bonds $231.114 $253.070 $274.037 $271.280 $274.577 $270.69440 Budgeted Gross Debt Service for Existing TBTA (B&T) Subordinate Revenue Bonds 27.109 27.823 29.437 29.233 29.184 29.08141 Debt Service on Additional TBTA (B&T) General Revenue Bonds Supporting Approved Capital Programs 0.000 0.000 3.775 17.817 43.062 76.68042 2 Broadway Certificates of Participation - TBTA Share 2.799 2.556 0.000 0.000 0.000 0.00043 2 Broadway Certificates of Participation - Additional TBTA Share of MTA Lease Portion 0.000 0.045 0.000 0.000 0.000 0.0004344 Total B&T Debt Service $261.022 $283.494 $307.249 $318.330 $346.824 $376.4554546 MTA Bus:
47 Budgeted Gross Debt Service for Existing Transportation Revenue Bonds $29.829 $25.623 $21.788 $22.155 $22.024 $21.94648 Debt Service on Additional Transportation Revenue Bonds Supporting Approved Capital Programs 0.000 0.000 0.753 2.321 4.523 7.51149 Bond Anticipation Notes 0.003 0.000 0.000 0.000 0.000 0.00050
51 Total MTA Bus Debt Service $29.832 $25.623 $22.541 $24.476 $26.547 $29.4575253 Staten Island Railway (SIRTOA):
54 Budgeted Gross Debt Service for Existing Transportation Revenue Bonds $0.707 $0.599 $0.359 $0.365 $0.363 $0.36255 Debt Service on Additional Transportation Revenue Bonds Supporting Approved Capital Programs 0.000 0.000 0.422 1.737 4.160 7.45556 Bond Anticipation Notes 0.000 0.000 0.000 0.000 0.000 0.0005758 Total SIRTOA Debt Service $0.707 $0.599 $0.781 $2.102 $4.523 $7.816
59
60 Total MTA HQ Debt Service for 2 Broadway Certificates of Participation $2.716 $2.524 $0.000 $0.000 $0.000 $0.000
METROPOLITAN TRANSPORTATION AUTHORITYFebruary Financial Plan 2017-2020
Summary of Total Budgeted Debt Service
($ in millions)
FORECAST
III-22
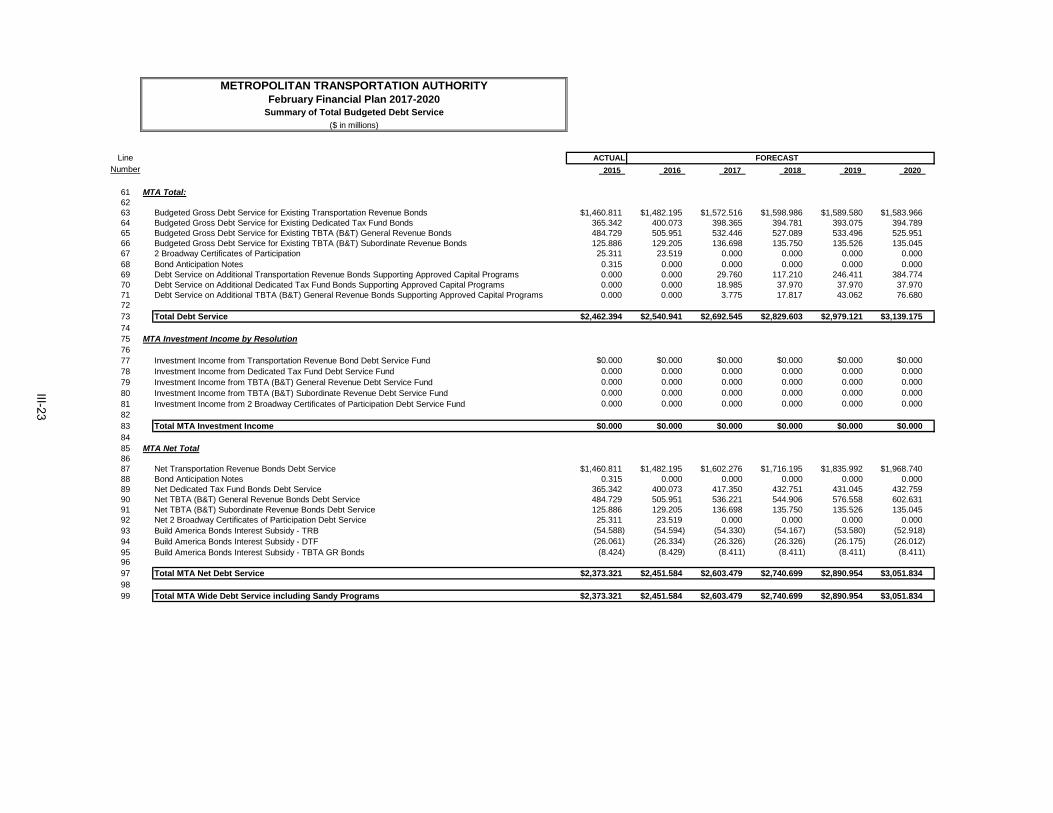
Line ACTUAL
Number 2015 2016 2017 2018 2019 2020
METROPOLITAN TRANSPORTATION AUTHORITYFebruary Financial Plan 2017-2020
Summary of Total Budgeted Debt Service
($ in millions)
FORECAST
61 MTA Total:6263 Budgeted Gross Debt Service for Existing Transportation Revenue Bonds $1,460.811 $1,482.195 $1,572.516 $1,598.986 $1,589.580 $1,583.96664 Budgeted Gross Debt Service for Existing Dedicated Tax Fund Bonds 365.342 400.073 398.365 394.781 393.075 394.78965 Budgeted Gross Debt Service for Existing TBTA (B&T) General Revenue Bonds 484.729 505.951 532.446 527.089 533.496 525.95166 Budgeted Gross Debt Service for Existing TBTA (B&T) Subordinate Revenue Bonds 125.886 129.205 136.698 135.750 135.526 135.04567 2 Broadway Certificates of Participation 25.311 23.519 0.000 0.000 0.000 0.00068 Bond Anticipation Notes 0.315 0.000 0.000 0.000 0.000 0.00069 Debt Service on Additional Transportation Revenue Bonds Supporting Approved Capital Programs 0.000 0.000 29.760 117.210 246.411 384.77470 Debt Service on Additional Dedicated Tax Fund Bonds Supporting Approved Capital Programs 0.000 0.000 18.985 37.970 37.970 37.97071 Debt Service on Additional TBTA (B&T) General Revenue Bonds Supporting Approved Capital Programs 0.000 0.000 3.775 17.817 43.062 76.6807273 Total Debt Service $2,462.394 $2,540.941 $2,692.545 $2,829.603 $2,979.121 $3,139.1757475 MTA Investment Income by Resolution7677 Investment Income from Transportation Revenue Bond Debt Service Fund $0.000 $0.000 $0.000 $0.000 $0.000 $0.00078 Investment Income from Dedicated Tax Fund Debt Service Fund 0.000 0.000 0.000 0.000 0.000 0.00079 Investment Income from TBTA (B&T) General Revenue Debt Service Fund 0.000 0.000 0.000 0.000 0.000 0.00080 Investment Income from TBTA (B&T) Subordinate Revenue Debt Service Fund 0.000 0.000 0.000 0.000 0.000 0.00081 Investment Income from 2 Broadway Certificates of Participation Debt Service Fund 0.000 0.000 0.000 0.000 0.000 0.0008283 Total MTA Investment Income $0.000 $0.000 $0.000 $0.000 $0.000 $0.0008485 MTA Net Total8687 Net Transportation Revenue Bonds Debt Service $1,460.811 $1,482.195 $1,602.276 $1,716.195 $1,835.992 $1,968.74088 Bond Anticipation Notes 0.315 0.000 0.000 0.000 0.000 0.00089 Net Dedicated Tax Fund Bonds Debt Service 365.342 400.073 417.350 432.751 431.045 432.75990 Net TBTA (B&T) General Revenue Bonds Debt Service 484.729 505.951 536.221 544.906 576.558 602.63191 Net TBTA (B&T) Subordinate Revenue Bonds Debt Service 125.886 129.205 136.698 135.750 135.526 135.04592 Net 2 Broadway Certificates of Participation Debt Service 25.311 23.519 0.000 0.000 0.000 0.00093 Build America Bonds Interest Subsidy - TRB (54.588) (54.594) (54.330) (54.167) (53.580) (52.918)94 Build America Bonds Interest Subsidy - DTF (26.061) (26.334) (26.326) (26.326) (26.175) (26.012)95 Build America Bonds Interest Subsidy - TBTA GR Bonds (8.424) (8.429) (8.411) (8.411) (8.411) (8.411)9697 Total MTA Net Debt Service $2,373.321 $2,451.584 $2,603.479 $2,740.699 $2,890.954 $3,051.8349899 Total MTA Wide Debt Service including Sandy Programs $2,373.321 $2,451.584 $2,603.479 $2,740.699 $2,890.954 $3,051.834
III-23

METROPOLITAN TRANSPORTATION AUTHORITY
Debt Affordability Statement (1)
$ in millions
Forecasted Debt Service and Borrowing Schedule Notes 2015 ACTL 2016 2017 2018 2019 2020
Combined MTA/TBTA Forecasted Debt Service Schedule 1, 2, 3 $2,348.0 $2,428.1 $2,603.5 $2,740.7 $2,891.0 $3,051.8
Forecasted New Money Bonds Issued 4 2,895.3 1,838.6 1,646.6 2,427.9 3,194.4 3,290.9
Forecasted Debt Service by Credit 9 Notes 2015 ACTL 2016 2017 2018 2019 2020
Transportation Revenue Bonds
Pledged Revenues 5 $13,114.0 $13,219.0 $13,361.7 $13,600.2 $13,764.6 $13,942.8
Debt Service 9 1,406.5 1,427.6 1,547.9 1,662.0 1,782.4 1,915.8
Debt Service as a % of Pledged Revenues 11% 11% 12% 12% 13% 14%
Dedicated Tax Fund Bonds
Pledged Revenues 6 $616.5 $619.1 $607.6 $601.9 $599.0 $596.7
Debt Service 9 339.3 373.7 391.0 406.4 404.9 406.7
Debt Service as a % of Pledged Revenues 55% 60% 64% 68% 68% 68%
Triborough Bridge and Tunnel Authority General Revenue Bonds
Pledged Revenues 7 $1,355.3 $1,339.5 $1,346.8 $1,300.6 $1,294.1 $1,286.4
Debt Service 9 476.3 497.5 527.8 536.5 568.1 594.2
Debt Service as a % of Total Pledged Revenues 35% 37% 39% 41% 44% 46%
Triborough Bridge and Tunnel Authority Subordinate Revenue Bonds
Pledged Revenues 8 $879.0 $842.0 $819.0 $764.1 $725.9 $692.2
Debt Service 9 125.9 129.2 136.7 135.7 135.5 135.0
Debt Service as a % of Total Pledged Revenues 14% 15% 17% 18% 19% 20%
Cumulative Debt Service (Excluding State Service Contract Bonds) Notes 2015 ACTL 2016 2017 2018 2019 2020
Total Debt Service 1, 2, 3 $2,348.0 $2,428.1 $2,603.5 $2,740.7 $2,891.0 $3,051.8
Fare and Toll Revenues $7,770.0 $7,900.6 $8,197.9 $8,291.3 $8,328.3 $8,370.5Total Debt Service as a % of Fare and Toll Revenue 30% 31% 32% 33% 35% 36%
Operating Revenues (including Fare and Toll Revenues) and Subsidies $15,055.0 $15,319.3 $15,565.4 $15,932.9 $16,159.9 $16,405.3Total Debt Service as a % of Operating Revenues and Subsidies 16% 16% 17% 17% 18% 19%
Non-Reimbursable Expenses with Non-Cash Liabilities $15,413.8 $16,479.3 $17,705.5 $18,111.6 $18,631.8 $19,298.5Total Debt Service as % of Non-reimbursable Expenses 15% 15% 15% 15% 16% 16%
Notes on the following page are integral to this table.
February Financial Plan 2017-2020
III-24
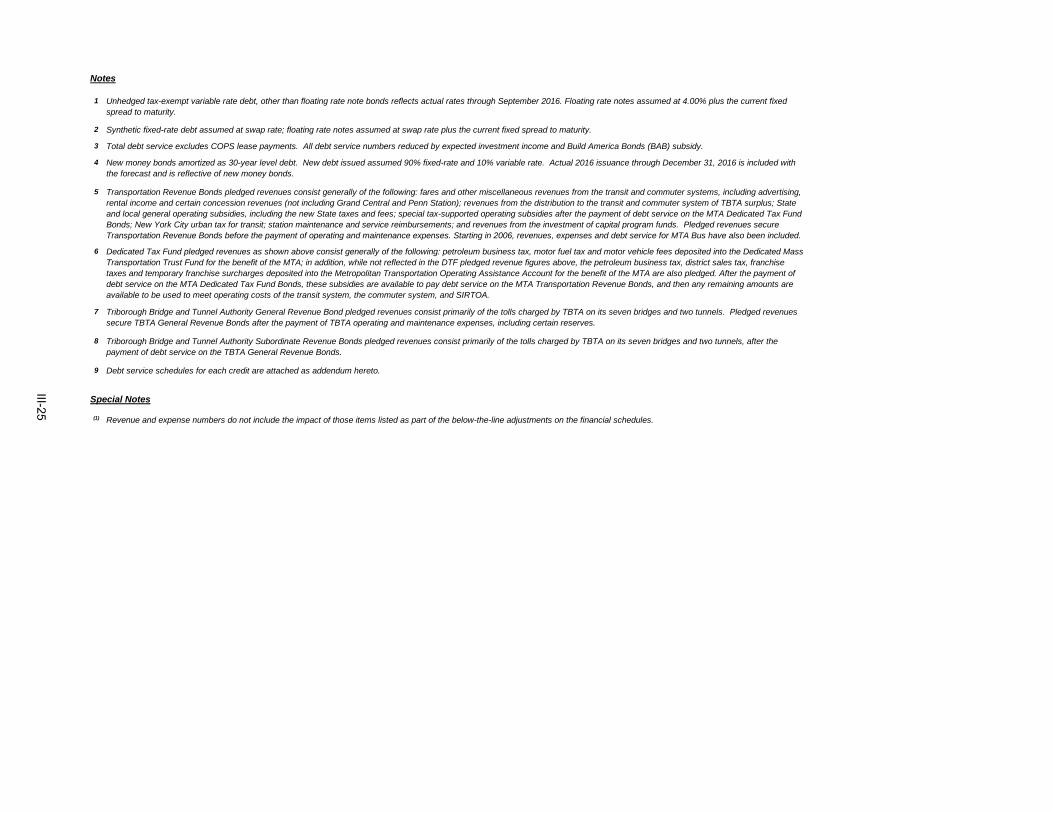
Notes
1
2
3
4
5
6
7
8
9
Special Notes
(1)
Unhedged tax-exempt variable rate debt, other than floating rate note bonds reflects actual rates through September 2016. Floating rate notes assumed at 4.00% plus the current fixed spread to maturity.
Debt service schedules for each credit are attached as addendum hereto.
Triborough Bridge and Tunnel Authority Subordinate Revenue Bonds pledged revenues consist primarily of the tolls charged by TBTA on its seven bridges and two tunnels, after the payment of debt service on the TBTA General Revenue Bonds.
Synthetic fixed-rate debt assumed at swap rate; floating rate notes assumed at swap rate plus the current fixed spread to maturity.
Revenue and expense numbers do not include the impact of those items listed as part of the below-the-line adjustments on the financial schedules.
Triborough Bridge and Tunnel Authority General Revenue Bond pledged revenues consist primarily of the tolls charged by TBTA on its seven bridges and two tunnels. Pledged revenues secure TBTA General Revenue Bonds after the payment of TBTA operating and maintenance expenses, including certain reserves.
Dedicated Tax Fund pledged revenues as shown above consist generally of the following: petroleum business tax, motor fuel tax and motor vehicle fees deposited into the Dedicated Mass Transportation Trust Fund for the benefit of the MTA; in addition, while not reflected in the DTF pledged revenue figures above, the petroleum business tax, district sales tax, franchise taxes and temporary franchise surcharges deposited into the Metropolitan Transportation Operating Assistance Account for the benefit of the MTA are also pledged. After the payment of debt service on the MTA Dedicated Tax Fund Bonds, these subsidies are available to pay debt service on the MTA Transportation Revenue Bonds, and then any remaining amounts are available to be used to meet operating costs of the transit system, the commuter system, and SIRTOA.
Transportation Revenue Bonds pledged revenues consist generally of the following: fares and other miscellaneous revenues from the transit and commuter systems, including advertising, rental income and certain concession revenues (not including Grand Central and Penn Station); revenues from the distribution to the transit and commuter system of TBTA surplus; State and local general operating subsidies, including the new State taxes and fees; special tax-supported operating subsidies after the payment of debt service on the MTA Dedicated Tax Fund Bonds; New York City urban tax for transit; station maintenance and service reimbursements; and revenues from the investment of capital program funds. Pledged revenues secure Transportation Revenue Bonds before the payment of operating and maintenance expenses. Starting in 2006, revenues, expenses and debt service for MTA Bus have also been included.
New money bonds amortized as 30-year level debt. New debt issued assumed 90% fixed-rate and 10% variable rate. Actual 2016 issuance through December 31, 2016 is included with the forecast and is reflective of new money bonds.
Total debt service excludes COPS lease payments. All debt service numbers reduced by expected investment income and Build America Bonds (BAB) subsidy.
III-25

METROPOLITAN TRANSPORTATION AUTHORITY (including Triborough Bridge and Tunnel Authority)Total Budgeted Annual Debt ServiceAll Issuance through December 31, 2016 ($ in millions)
Fiscal Year Existing DS Additional DS Combined Existing DS Additional DS Combined Existing DS Additional DS Combined Existing DS Additional DS Combined Existing DS Additional DS Combined
2016 1,427.6 - 1,427.6 373.7 - 373.7 497.5 - 497.5 129.2 - 129.2 2,428.1 - 2,428.1
2017 1,518.2 29.8 1,547.9 372.0 19.0 391.0 524.0 3.8 527.8 136.7 - 136.7 2,551.0 52.5 2,603.5
2018 1,544.8 117.2 1,662.0 368.5 38.0 406.4 518.7 17.8 536.5 135.7 - 135.7 2,567.7 173.0 2,740.7
2019 1,536.0 246.4 1,782.4 366.9 38.0 404.9 525.1 43.1 568.1 135.5 - 135.5 2,563.5 327.4 2,891.0
2020 1,531.0 384.8 1,915.8 368.8 38.0 406.7 517.5 76.7 594.2 135.0 - 135.0 2,552.4 499.4 3,051.8
2021 1,539.3 492.5 2,031.8 368.3 38.0 406.2 512.2 113.3 625.5 135.7 - 135.7 2,555.5 643.8 3,199.3
2022 1,532.0 549.4 2,081.5 365.5 38.0 403.5 488.3 147.1 635.4 135.2 - 135.2 2,521.1 734.5 3,255.6
2023 1,547.1 569.0 2,116.1 367.3 38.0 405.3 543.2 171.0 714.2 135.8 - 135.8 2,593.4 778.0 3,371.4
2024 1,535.0 572.7 2,107.7 366.8 38.0 404.7 505.4 179.1 684.5 135.9 - 135.9 2,543.0 789.8 3,332.8
2025 1,520.1 573.0 2,093.1 367.2 38.0 405.2 505.4 179.1 684.5 135.8 - 135.8 2,528.5 790.1 3,318.6
2026 1,548.0 573.1 2,121.1 364.4 38.0 402.3 504.7 179.1 683.8 136.0 - 136.0 2,553.1 790.2 3,343.3
2027 1,543.7 573.2 2,116.9 357.2 38.0 395.2 503.0 179.1 682.2 136.1 - 136.1 2,540.1 790.3 3,330.4
2028 1,539.7 573.2 2,112.8 365.6 38.0 403.6 515.2 179.1 694.3 136.4 - 136.4 2,556.9 790.3 3,347.1
2029 1,546.7 573.2 2,119.8 364.3 38.0 402.3 514.4 179.1 693.5 136.3 - 136.3 2,561.6 790.3 3,351.9
2030 1,542.2 573.2 2,115.4 365.9 38.0 403.9 516.6 179.1 695.7 136.5 - 136.5 2,561.2 790.3 3,351.4
2031 1,556.8 573.2 2,130.0 364.2 38.0 402.2 529.3 179.1 708.4 129.6 - 129.6 2,580.0 790.3 3,370.2
2032 1,483.2 573.2 2,056.4 365.7 38.0 403.7 423.6 179.1 602.7 76.5 - 76.5 2,349.0 790.3 3,139.2
2033 1,207.9 573.2 1,781.1 343.0 38.0 380.9 258.6 179.1 437.7 - - - 1,809.5 790.3 2,599.7
2034 1,209.1 573.2 1,782.2 199.9 38.0 237.9 267.7 179.1 446.8 - - - 1,676.7 790.3 2,466.9
2035 1,187.3 573.2 1,760.5 177.5 38.0 215.5 298.8 179.1 477.9 - - - 1,663.6 790.3 2,453.9
2036 1,027.0 573.2 1,600.1 322.4 38.0 360.4 293.4 179.1 472.5 - - - 1,642.7 790.3 2,433.0
2037 1,000.7 565.4 1,566.1 339.5 38.0 377.4 293.7 179.1 472.8 - - - 1,633.9 782.5 2,416.4
2038 934.2 539.3 1,473.6 328.1 38.0 366.1 271.7 179.1 450.8 - - - 1,534.0 756.4 2,290.5
2039 870.8 521.1 1,391.9 276.2 38.0 314.2 132.4 179.1 311.5 - - - 1,279.4 738.2 2,017.6
2040 766.5 521.1 1,287.6 37.8 38.0 75.8 89.6 179.1 268.7 - - - 893.9 738.2 1,632.1
2041 615.8 521.1 1,136.9 8.0 38.0 46.0 69.8 179.1 248.9 - - - 693.6 738.2 1,431.8
2042 552.4 521.1 1,073.5 8.0 38.0 46.0 68.0 179.1 247.1 - - - 628.4 738.2 1,366.6
2043 409.6 521.1 930.7 8.0 38.0 46.0 55.6 179.1 234.7 - - - 473.3 738.2 1,211.5
2044 267.1 521.1 788.2 8.0 38.0 46.0 50.7 179.1 229.9 - - - 325.8 738.2 1,064.0
2045 171.2 521.1 692.3 8.0 38.0 46.0 36.7 179.1 215.9 - - - 215.9 738.2 954.1
2046 120.0 521.1 641.1 8.0 38.0 46.0 30.6 179.1 209.7 - - - 158.6 738.2 896.8
2047 106.2 499.2 605.4 8.0 19.0 27.0 13.7 175.3 189.1 - - - 128.0 693.5 821.5
2048 98.4 437.7 536.1 8.0 - 8.0 13.7 161.3 175.0 - - - 120.1 599.0 719.2
2049 98.4 326.8 425.1 8.0 - 8.0 13.7 136.1 149.8 - - - 120.1 462.8 582.9
2050 94.6 188.4 283.0 8.0 - 8.0 12.0 102.4 114.4 - - - 114.6 290.8 405.5
2051 68.9 80.7 149.6 8.0 - 8.0 - 65.8 65.8 - - - 76.9 146.5 223.4
2052 68.9 23.7 92.6 8.0 - 8.0 - 32.0 32.0 - - - 76.9 55.7 132.6
2053 68.9 4.2 73.1 8.0 - 8.0 - 8.1 8.1 - - - 76.9 12.3 89.2
2054 68.9 0.5 69.4 8.0 - 8.0 - - - - - - 76.9 0.5 77.4
2055 66.9 0.1 8.0 - - - - - 74.9 0.1 75.1
2056 46.4 0.0 46.4 6.8 - 6.8 - - - - - - 53.2 0.0 53.2
Notes:
Does not include debt service for State Service Contract Bonds and Convention Center Bonds, which is paid by NY State. Also excludes COPS lease payments.
Includes interest budgeted for Transportation Revenue Bond Anticipation Notes.
Forecasted Investment Income is not included above.
Net of Build America Bonds subsidy.
Addendum to MTA Debt Affordability Statement
MTA and TBTA Debt ServiceTransportation Revenue Resolution Dedicated Tax Fund Resolution TBTA General Revenue Resolution TBTA Subordinate Resolution
III-26

2016 2017Final
EstimateAdoptedBudget 2018 2019 2020
Baseline Total Positions 71,809 72,784 72,293 72,240 72,171 NYC Transit 48,908 49,310 48,772 48,681 48,412 Long Island Rail Road 7,266 7,450 7,486 7,485 7,633 Metro-North Railroad 6,836 6,966 6,991 6,995 6,997 Bridges & Tunnels 1,578 1,589 1,589 1,591 1,597 Headquarters 2,918 3,073 3,077 3,101 3,155 Staten Island Railway 318 318 319 305 305 Capital Construction Company 140 139 139 139 139 Bus Company 3,845 3,939 3,920 3,943 3,933
Non-Reimbursable 64,502 65,086 65,234 65,347 65,645 NYC Transit 43,673 43,965 43,827 43,828 43,904 Long Island Rail Road 6,148 6,235 6,551 6,596 6,768 Metro-North Railroad 6,300 6,245 6,229 6,247 6,247 Bridges & Tunnels 1,491 1,502 1,502 1,504 1,510 Headquarters 2,781 2,936 2,940 2,964 3,018 Staten Island Railway 304 304 305 305 305 Capital Construction Company - - - - - Bus Company 3,805 3,899 3,880 3,903 3,893
Reimbursable 7,307 7,698 7,059 6,893 6,526 NYC Transit 5,235 5,345 4,945 4,853 4,508 Long Island Rail Road 1,118 1,215 935 889 865 Metro-North Railroad 536 721 762 748 750 Bridges & Tunnels 87 87 87 87 87 Headquarters 137 137 137 137 137 Staten Island Railway 14 14 14 - - Capital Construction Company 140 139 139 139 139 Bus Company 40 40 40 40 40
Total Full-Time 71,580 72,555 72,064 72,011 71,942 NYC Transit 48,695 49,097 48,559 48,468 48,199 Long Island Rail Road 7,266 7,450 7,486 7,485 7,633 Metro-North Railroad 6,835 6,965 6,990 6,994 6,996 Bridges & Tunnels 1,578 1,589 1,589 1,591 1,597 Headquarters 2,918 3,073 3,077 3,101 3,155 Staten Island Railway 318 318 319 305 305 Capital Construction Company 140 139 139 139 139 Bus Company 3,830 3,924 3,905 3,928 3,918
Total Full-Time-Equivalents 229 229 229 229 229 NYC Transit 213 213 213 213 213 Long Island Rail Road - - - - - Metro-North Railroad 1 1 1 1 1 Bridges & Tunnels - - - - - Headquarters - - - - - Staten Island Railway - - - - - Capital Construction Company - - - - - Bus Company 15 15 15 15 15
1 For 2016 and beyond, the table captures authorized positions at year end (December 31).1 2009 Actuals for NYCT are as per the MTA 2009 Year-end report and have not been re-cast to reflect the subsequent Subwaysreorganization.
METROPOLITAN TRANSPORTATION AUTHORITYFebruary Financial Plan 2017-2020
Baseline Total Non-Reimbursable - Reimbursable PositionsFull-Time Positions and Full Time Equivalents by Agency
Category
III-27
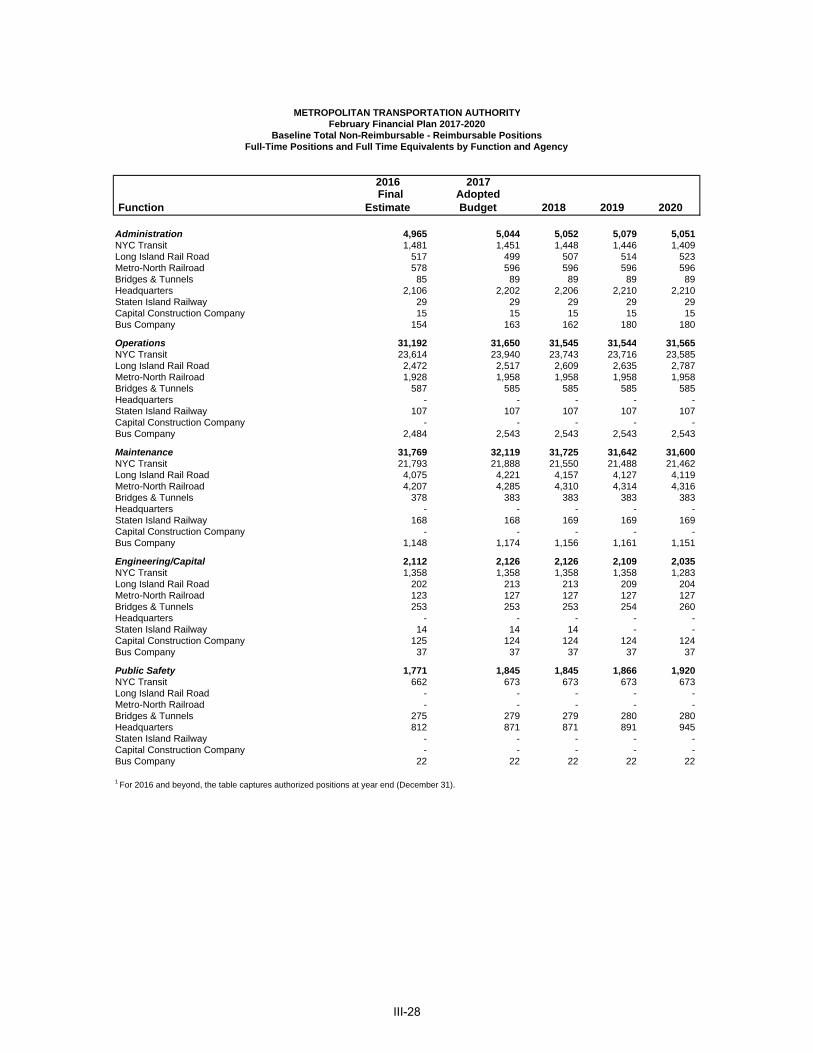
2016 2017
Function Final
Estimate AdoptedBudget 2018 2019 2020
Administration 4,965 5,044 5,052 5,079 5,051 NYC Transit 1,481 1,451 1,448 1,446 1,409 Long Island Rail Road 517 499 507 514 523 Metro-North Railroad 578 596 596 596 596 Bridges & Tunnels 85 89 89 89 89 Headquarters 2,106 2,202 2,206 2,210 2,210 Staten Island Railway 29 29 29 29 29 Capital Construction Company 15 15 15 15 15 Bus Company 154 163 162 180 180
Operations 31,192 31,650 31,545 31,544 31,565 NYC Transit 23,614 23,940 23,743 23,716 23,585 Long Island Rail Road 2,472 2,517 2,609 2,635 2,787 Metro-North Railroad 1,928 1,958 1,958 1,958 1,958 Bridges & Tunnels 587 585 585 585 585 Headquarters - - - - - Staten Island Railway 107 107 107 107 107 Capital Construction Company - - - - - Bus Company 2,484 2,543 2,543 2,543 2,543
Maintenance 31,769 32,119 31,725 31,642 31,600 NYC Transit 21,793 21,888 21,550 21,488 21,462 Long Island Rail Road 4,075 4,221 4,157 4,127 4,119 Metro-North Railroad 4,207 4,285 4,310 4,314 4,316 Bridges & Tunnels 378 383 383 383 383 Headquarters - - - - - Staten Island Railway 168 168 169 169 169 Capital Construction Company - - - - - Bus Company 1,148 1,174 1,156 1,161 1,151
Engineering/Capital 2,112 2,126 2,126 2,109 2,035 NYC Transit 1,358 1,358 1,358 1,358 1,283 Long Island Rail Road 202 213 213 209 204 Metro-North Railroad 123 127 127 127 127 Bridges & Tunnels 253 253 253 254 260 Headquarters - - - - - Staten Island Railway 14 14 14 - - Capital Construction Company 125 124 124 124 124 Bus Company 37 37 37 37 37
Public Safety 1,771 1,845 1,845 1,866 1,920 NYC Transit 662 673 673 673 673 Long Island Rail Road - - - - - Metro-North Railroad - - - - - Bridges & Tunnels 275 279 279 280 280 Headquarters 812 871 871 891 945 Staten Island Railway - - - - - Capital Construction Company - - - - - Bus Company 22 22 22 22 22
1 For 2016 and beyond, the table captures authorized positions at year end (December 31).1 2009 Actuals for NYCT are as per the MTA 2009 Year-end report and have not been re-cast to reflect the subsequent Subways
METROPOLITAN TRANSPORTATION AUTHORITYFebruary Financial Plan 2017-2020
Baseline Total Non-Reimbursable - Reimbursable PositionsFull-Time Positions and Full Time Equivalents by Function and Agency
III-28

FUNCTION/OCCUPATIONAL GROUP
2016 Final
Estimate
2017 Adopted Budget 2018 2019 2020
Administration Managers/Supervisors 1,559 1,543 1,541 1,537 1,518 Professional, Technical, Clerica 3,255 3,342 3,353 3,369 3,360 Operational Hourlies 151 159 158 173 173
Total Administration 4,965 5,044 5,052 5,079 5,051
Operations Managers/Supervisors 3,832 3,856 3,842 3,834 3,842 Professional, Technical, Clerica 890 898 900 899 897 Operational Hourlies 26,470 26,896 26,803 26,811 26,826
Total Operations 31,192 31,650 31,545 31,544 31,565
Maintenance Managers/Supervisors 5,635 5,694 5,584 5,566 5,554 Professional, Technical, Clerica 1,969 2,026 2,000 1,984 1,951 Operational Hourlies 24,165 24,399 24,141 24,092 24,095
Total Maintenance 31,769 32,119 31,725 31,642 31,600
Engineering/Capital Managers/Supervisors 602 607 607 601 540 Professional, Technical, Clerica 1,499 1,508 1,508 1,506 1,493 Operational Hourlies 11 11 11 2 2
Total Engineering/Capital 2,112 2,126 2,126 2,109 2,035
Public Safety Managers/Supervisors 508 517 517 517 531 Professional, Technical, Clerica 155 161 161 162 163 Operational Hourlies 1,108 1,167 1,167 1,187 1,226
Total Public Safety 1,771 1,845 1,845 1,866 1,920
Baseline Total Positions Managers/Supervisors 12,136 12,217 12,091 12,055 11,985 Professional, Technical, Clerica 7,768 7,935 7,922 7,920 7,864 Operational Hourlies 51,905 52,632 52,280 52,265 52,322
Baseline Total Positions 71,809 72,784 72,293 72,240 72,171
1 For 2016 and beyond, the table captures authorized positions at year end (December 31).
Metropolitan Transportation AuthorityFebruary Financial Plan 2017-2020
Baseline Total Full-time Positions and Full-time Equivalents by Function and Occupational GroupNon-Reimbursable and Reimbursable
III-29
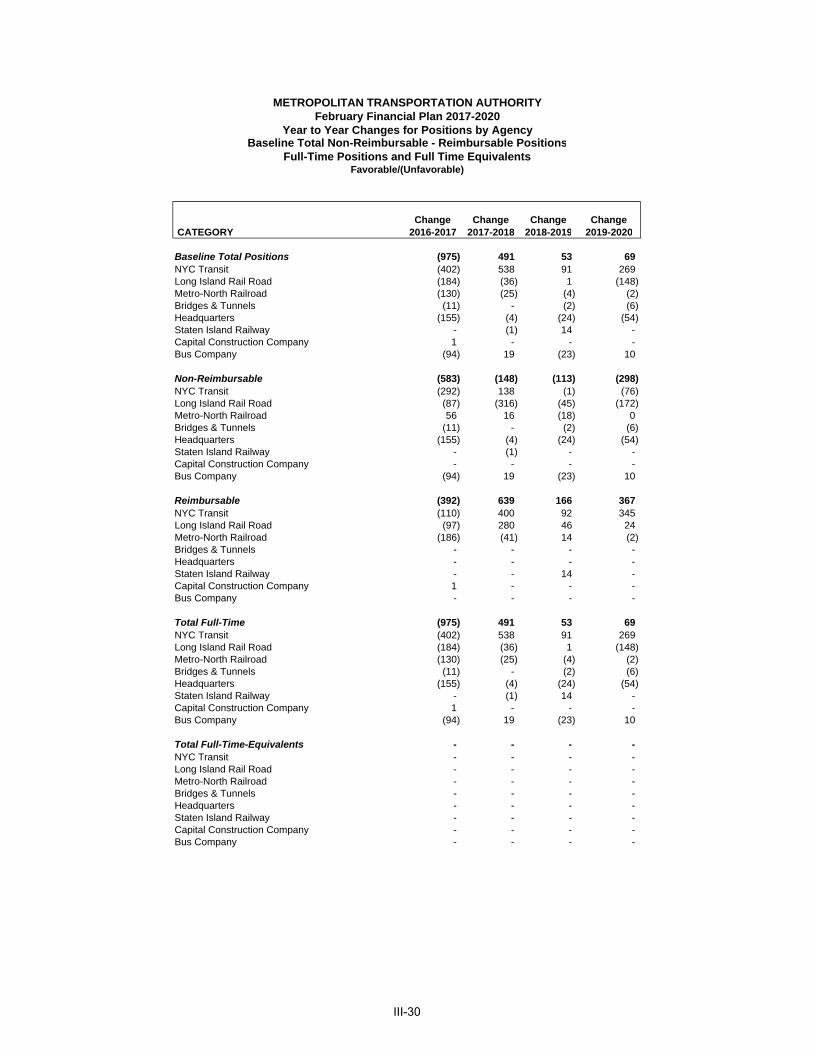
CATEGORY Change
2016-2017Change
2017-2018Change
2018-2019Change
2019-2020
Baseline Total Positions (975) 491 53 69 NYC Transit (402) 538 91 269 Long Island Rail Road (184) (36) 1 (148) Metro-North Railroad (130) (25) (4) (2) Bridges & Tunnels (11) - (2) (6) Headquarters (155) (4) (24) (54) Staten Island Railway - (1) 14 - Capital Construction Company 1 - - - Bus Company (94) 19 (23) 10
Non-Reimbursable (583) (148) (113) (298) NYC Transit (292) 138 (1) (76) Long Island Rail Road (87) (316) (45) (172) Metro-North Railroad 56 16 (18) 0 Bridges & Tunnels (11) - (2) (6) Headquarters (155) (4) (24) (54) Staten Island Railway - (1) - - Capital Construction Company - - - - Bus Company (94) 19 (23) 10
Reimbursable (392) 639 166 367 NYC Transit (110) 400 92 345 Long Island Rail Road (97) 280 46 24 Metro-North Railroad (186) (41) 14 (2) Bridges & Tunnels - - - - Headquarters - - - - Staten Island Railway - - 14 - Capital Construction Company 1 - - - Bus Company - - - -
Total Full-Time (975) 491 53 69 NYC Transit (402) 538 91 269 Long Island Rail Road (184) (36) 1 (148) Metro-North Railroad (130) (25) (4) (2) Bridges & Tunnels (11) - (2) (6) Headquarters (155) (4) (24) (54) Staten Island Railway - (1) 14 - Capital Construction Company 1 - - - Bus Company (94) 19 (23) 10
Total Full-Time-Equivalents - - - - NYC Transit - - - - Long Island Rail Road - - - - Metro-North Railroad - - - - Bridges & Tunnels - - - - Headquarters - - - - Staten Island Railway - - - - Capital Construction Company - - - - Bus Company - - - -
METROPOLITAN TRANSPORTATION AUTHORITYFebruary Financial Plan 2017-2020
Year to Year Changes for Positions by AgencyBaseline Total Non-Reimbursable - Reimbursable Positions
Full-Time Positions and Full Time EquivalentsFavorable/(Unfavorable)
III-30
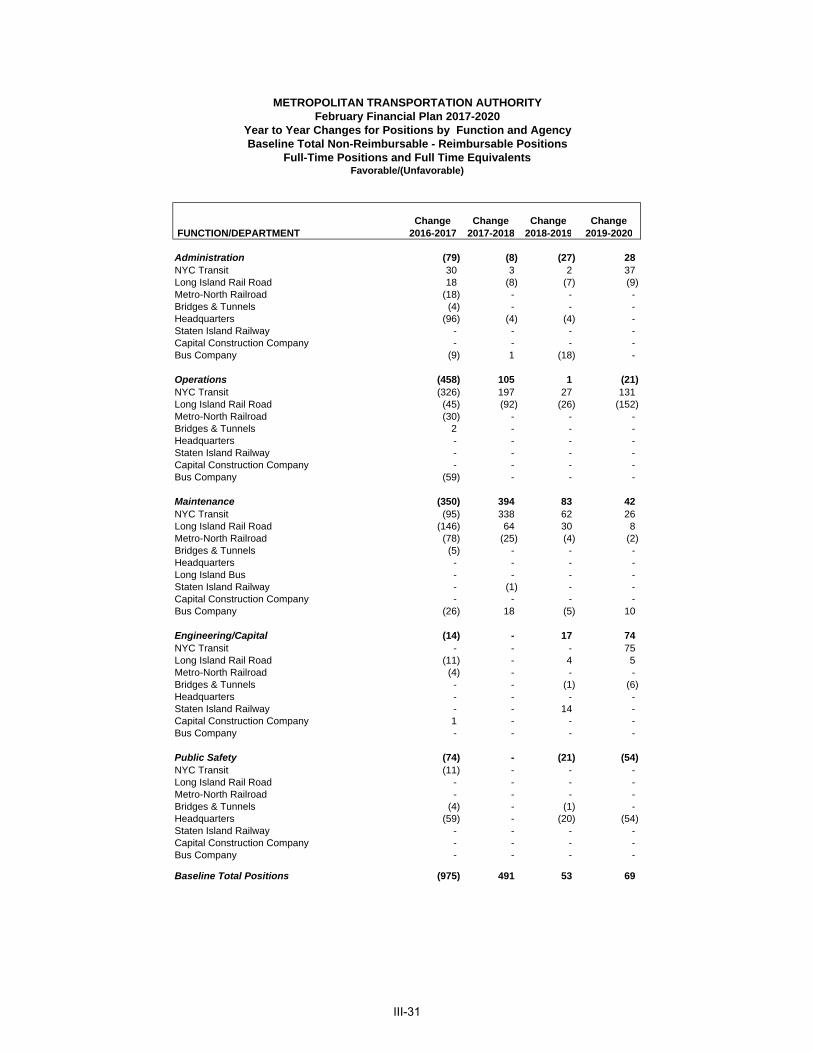
FUNCTION/DEPARTMENT Change
2016-2017Change
2017-2018Change
2018-2019Change
2019-2020
Administration (79) (8) (27) 28 NYC Transit 30 3 2 37 Long Island Rail Road 18 (8) (7) (9) Metro-North Railroad (18) - - - Bridges & Tunnels (4) - - - Headquarters (96) (4) (4) - Staten Island Railway - - - - Capital Construction Company - - - - Bus Company (9) 1 (18) -
Operations (458) 105 1 (21) NYC Transit (326) 197 27 131 Long Island Rail Road (45) (92) (26) (152) Metro-North Railroad (30) - - - Bridges & Tunnels 2 - - - Headquarters - - - - Staten Island Railway - - - - Capital Construction Company - - - - Bus Company (59) - - -
Maintenance (350) 394 83 42 NYC Transit (95) 338 62 26 Long Island Rail Road (146) 64 30 8 Metro-North Railroad (78) (25) (4) (2) Bridges & Tunnels (5) - - - Headquarters - - - - Long Island Bus - - - - Staten Island Railway - (1) - - Capital Construction Company - - - - Bus Company (26) 18 (5) 10
Engineering/Capital (14) - 17 74 NYC Transit - - - 75 Long Island Rail Road (11) - 4 5 Metro-North Railroad (4) - - - Bridges & Tunnels - - (1) (6) Headquarters - - - - Staten Island Railway - - 14 - Capital Construction Company 1 - - - Bus Company - - - -
Public Safety (74) - (21) (54) NYC Transit (11) - - - Long Island Rail Road - - - - Metro-North Railroad - - - - Bridges & Tunnels (4) - (1) - Headquarters (59) - (20) (54) Staten Island Railway - - - - Capital Construction Company - - - - Bus Company - - - -
Baseline Total Positions (975) 491 53 69
Favorable/(Unfavorable)
METROPOLITAN TRANSPORTATION AUTHORITYFebruary Financial Plan 2017-2020
Year to Year Changes for Positions by Function and AgencyBaseline Total Non-Reimbursable - Reimbursable Positions
Full-Time Positions and Full Time Equivalents
III-31
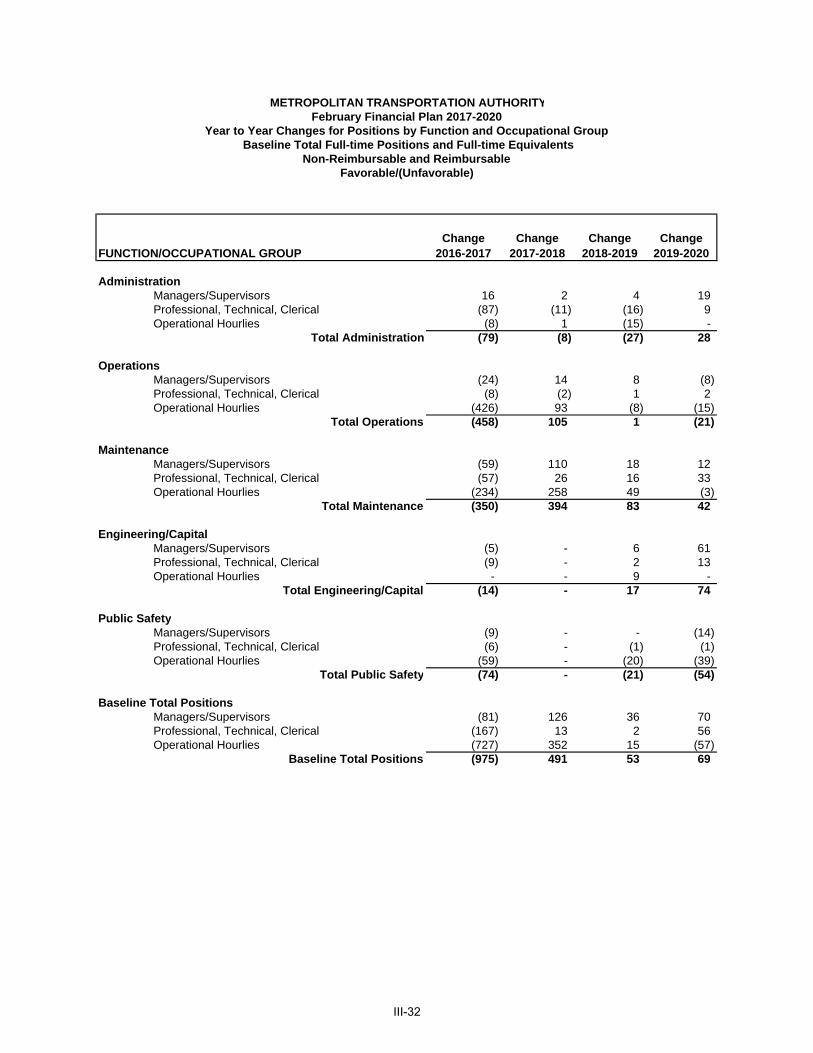
FUNCTION/OCCUPATIONAL GROUPChange
2016-2017Change
2017-2018Change
2018-2019Change
2019-2020
Administration Managers/Supervisors 16 2 4 19 Professional, Technical, Clerical (87) (11) (16) 9 Operational Hourlies (8) 1 (15) -
Total Administration (79) (8) (27) 28
Operations Managers/Supervisors (24) 14 8 (8) Professional, Technical, Clerical (8) (2) 1 2 Operational Hourlies (426) 93 (8) (15)
Total Operations (458) 105 1 (21)
Maintenance Managers/Supervisors (59) 110 18 12 Professional, Technical, Clerical (57) 26 16 33 Operational Hourlies (234) 258 49 (3)
Total Maintenance (350) 394 83 42
Engineering/Capital Managers/Supervisors (5) - 6 61 Professional, Technical, Clerical (9) - 2 13 Operational Hourlies - - 9 -
Total Engineering/Capital (14) - 17 74
Public Safety Managers/Supervisors (9) - - (14) Professional, Technical, Clerical (6) - (1) (1) Operational Hourlies (59) - (20) (39)
Total Public Safety (74) - (21) (54)
Baseline Total Positions Managers/Supervisors (81) 126 36 70 Professional, Technical, Clerical (167) 13 2 56 Operational Hourlies (727) 352 15 (57)
Baseline Total Positions (975) 491 53 69
METROPOLITAN TRANSPORTATION AUTHORITYFebruary Financial Plan 2017-2020
Year to Year Changes for Positions by Function and Occupational Group Baseline Total Full-time Positions and Full-time Equivalents
Non-Reimbursable and ReimbursableFavorable/(Unfavorable)
III-32
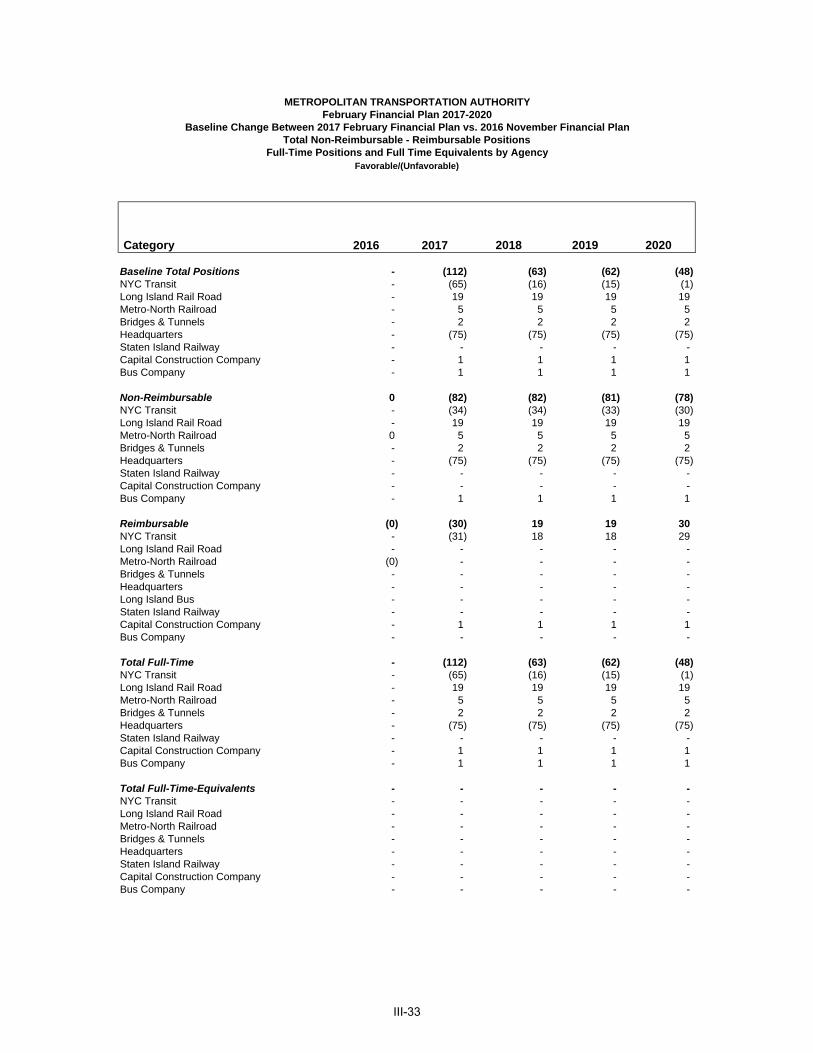
Category 2016 2017 2018 2019 2020
Baseline Total Positions - (112) (63) (62) (48) NYC Transit - (65) (16) (15) (1) Long Island Rail Road - 19 19 19 19 Metro-North Railroad - 5 5 5 5 Bridges & Tunnels - 2 2 2 2 Headquarters - (75) (75) (75) (75) Staten Island Railway - - - - - Capital Construction Company - 1 1 1 1 Bus Company - 1 1 1 1
Non-Reimbursable 0 (82) (82) (81) (78) NYC Transit - (34) (34) (33) (30) Long Island Rail Road - 19 19 19 19 Metro-North Railroad 0 5 5 5 5 Bridges & Tunnels - 2 2 2 2 Headquarters - (75) (75) (75) (75) Staten Island Railway - - - - - Capital Construction Company - - - - - Bus Company - 1 1 1 1
Reimbursable (0) (30) 19 19 30 NYC Transit - (31) 18 18 29 Long Island Rail Road - - - - - Metro-North Railroad (0) - - - - Bridges & Tunnels - - - - - Headquarters - - - - - Long Island Bus - - - - - Staten Island Railway - - - - - Capital Construction Company - 1 1 1 1 Bus Company - - - - -
Total Full-Time - (112) (63) (62) (48) NYC Transit - (65) (16) (15) (1) Long Island Rail Road - 19 19 19 19 Metro-North Railroad - 5 5 5 5 Bridges & Tunnels - 2 2 2 2 Headquarters - (75) (75) (75) (75) Staten Island Railway - - - - - Capital Construction Company - 1 1 1 1 Bus Company - 1 1 1 1
Total Full-Time-Equivalents - - - - - NYC Transit - - - - - Long Island Rail Road - - - - - Metro-North Railroad - - - - - Bridges & Tunnels - - - - - Headquarters - - - - - Staten Island Railway - - - - - Capital Construction Company - - - - - Bus Company - - - - -
Favorable/(Unfavorable)
METROPOLITAN TRANSPORTATION AUTHORITYFebruary Financial Plan 2017-2020
Baseline Change Between 2017 February Financial Plan vs. 2016 November Financial PlanTotal Non-Reimbursable - Reimbursable Positions
Full-Time Positions and Full Time Equivalents by Agency
III-33
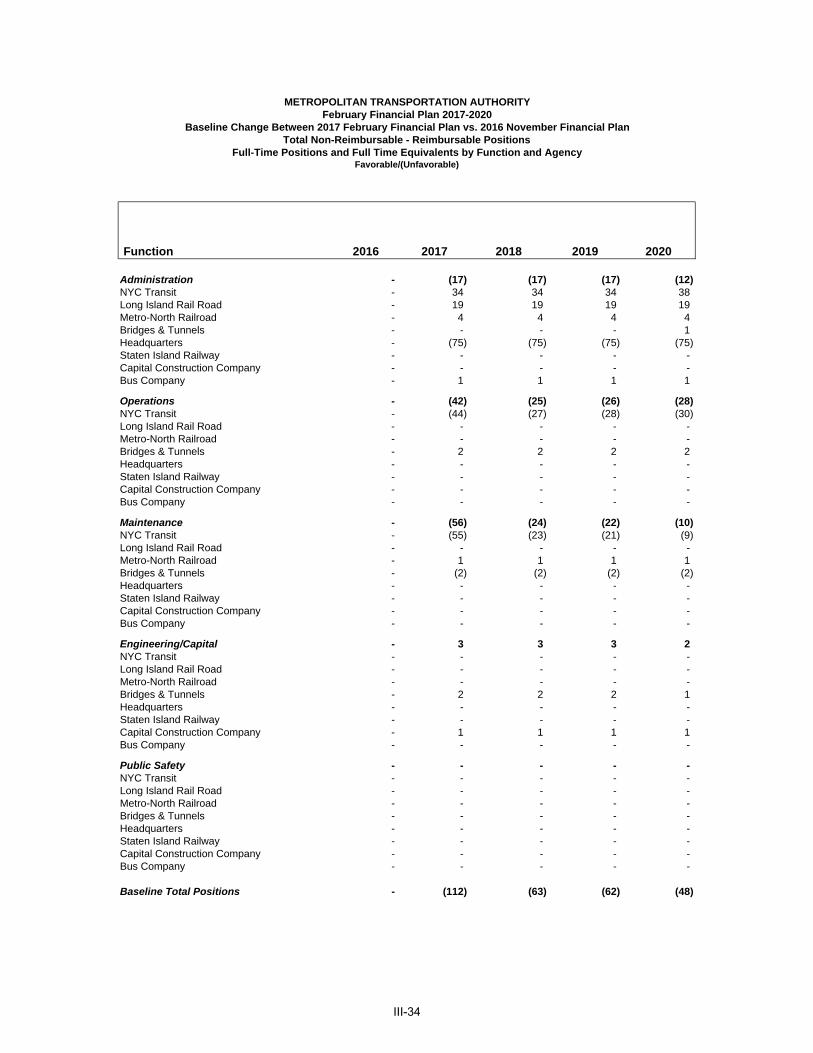
Function 2016 2017 2018 2019 2020
Administration - (17) (17) (17) (12) NYC Transit - 34 34 34 38 Long Island Rail Road - 19 19 19 19 Metro-North Railroad - 4 4 4 4 Bridges & Tunnels - - - - 1 Headquarters - (75) (75) (75) (75) Staten Island Railway - - - - - Capital Construction Company - - - - - Bus Company - 1 1 1 1
Operations - (42) (25) (26) (28) NYC Transit - (44) (27) (28) (30) Long Island Rail Road - - - - - Metro-North Railroad - - - - - Bridges & Tunnels - 2 2 2 2 Headquarters - - - - - Staten Island Railway - - - - - Capital Construction Company - - - - - Bus Company - - - - -
Maintenance - (56) (24) (22) (10) NYC Transit - (55) (23) (21) (9) Long Island Rail Road - - - - - Metro-North Railroad - 1 1 1 1 Bridges & Tunnels - (2) (2) (2) (2) Headquarters - - - - - Staten Island Railway - - - - - Capital Construction Company - - - - - Bus Company - - - - -
Engineering/Capital - 3 3 3 2 NYC Transit - - - - - Long Island Rail Road - - - - - Metro-North Railroad - - - - - Bridges & Tunnels - 2 2 2 1 Headquarters - - - - - Staten Island Railway - - - - - Capital Construction Company - 1 1 1 1 Bus Company - - - - -
Public Safety - - - - - NYC Transit - - - - - Long Island Rail Road - - - - - Metro-North Railroad - - - - - Bridges & Tunnels - - - - - Headquarters - - - - - Staten Island Railway - - - - - Capital Construction Company - - - - - Bus Company - - - - -
Baseline Total Positions - (112) (63) (62) (48)
Favorable/(Unfavorable)
METROPOLITAN TRANSPORTATION AUTHORITYFebruary Financial Plan 2017-2020
Baseline Change Between 2017 February Financial Plan vs. 2016 November Financial PlanTotal Non-Reimbursable - Reimbursable Positions
Full-Time Positions and Full Time Equivalents by Function and Agency
III-34
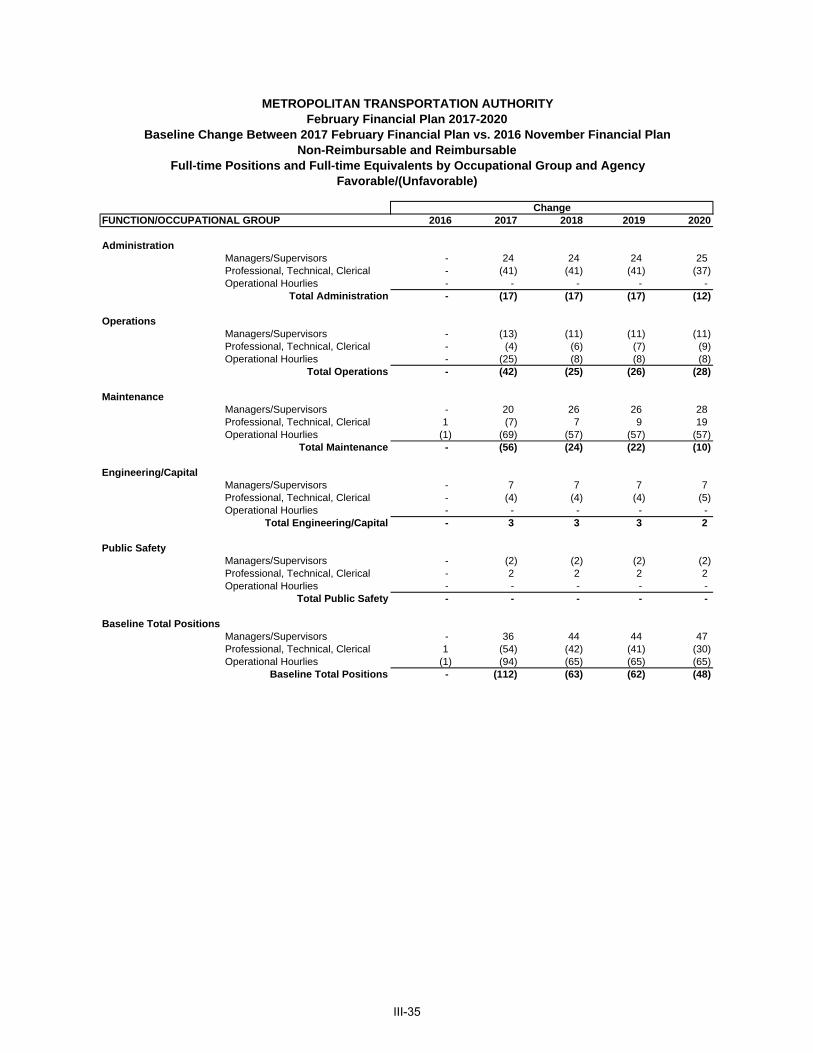
2016 2017 2018 2019 2020
Administration Managers/Supervisors - 24 24 24 25 Professional, Technical, Clerical - (41) (41) (41) (37) Operational Hourlies - - - - -
Total Administration - (17) (17) (17) (12)
Operations Managers/Supervisors - (13) (11) (11) (11) Professional, Technical, Clerical - (4) (6) (7) (9) Operational Hourlies - (25) (8) (8) (8)
Total Operations - (42) (25) (26) (28)
Maintenance Managers/Supervisors - 20 26 26 28 Professional, Technical, Clerical 1 (7) 7 9 19 Operational Hourlies (1) (69) (57) (57) (57)
Total Maintenance - (56) (24) (22) (10)
Engineering/Capital Managers/Supervisors - 7 7 7 7 Professional, Technical, Clerical - (4) (4) (4) (5) Operational Hourlies - - - - -
Total Engineering/Capital - 3 3 3 2
Public Safety Managers/Supervisors - (2) (2) (2) (2) Professional, Technical, Clerical - 2 2 2 2 Operational Hourlies - - - - -
Total Public Safety - - - - -
Baseline Total Positions Managers/Supervisors - 36 44 44 47 Professional, Technical, Clerical 1 (54) (42) (41) (30) Operational Hourlies (1) (94) (65) (65) (65)
Baseline Total Positions - (112) (63) (62) (48)
ChangeFUNCTION/OCCUPATIONAL GROUP
METROPOLITAN TRANSPORTATION AUTHORITYFebruary Financial Plan 2017-2020
Baseline Change Between 2017 February Financial Plan vs. 2016 November Financial PlanNon-Reimbursable and Reimbursable
Full-time Positions and Full-time Equivalents by Occupational Group and AgencyFavorable/(Unfavorable)
III-35

[THIS PAGE INTENTIONALLY LEFT BLANK]
III-36
IV. Other MTA Consolidated Materials
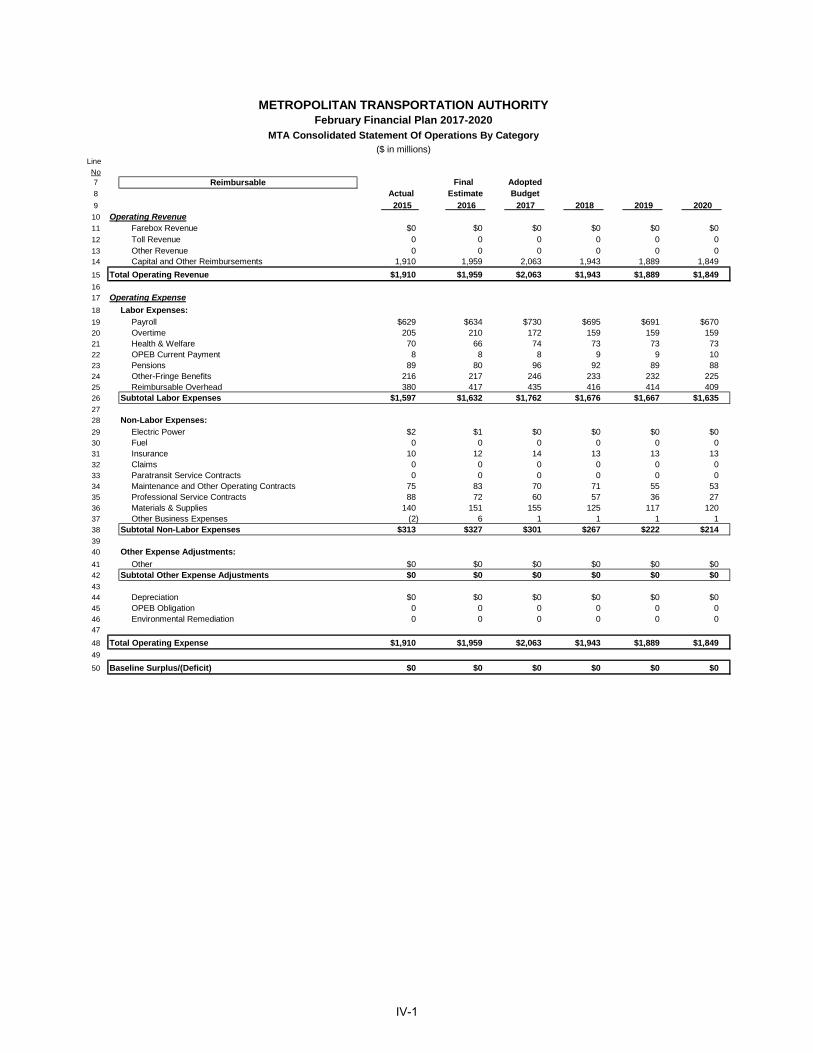
No7 Final Adopted 8 Actual Estimate Budget
9 2015 2016 2017 2018 2019 2020 10 Operating Revenue11 Farebox Revenue $0 $0 $0 $0 $0 $012 Toll Revenue 0 0 0 0 0 013 Other Revenue 0 0 0 0 0 014 Capital and Other Reimbursements 1,910 1,959 2,063 1,943 1,889 1,849
15 Total Operating Revenue $1,910 $1,959 $2,063 $1,943 $1,889 $1,849
16
17 Operating Expense
18 Labor Expenses:
19 Payroll $629 $634 $730 $695 $691 $67020 Overtime 205 210 172 159 159 15921 Health & Welfare 70 66 74 73 73 7322 OPEB Current Payment 8 8 8 9 9 1023 Pensions 89 80 96 92 89 8824 Other-Fringe Benefits 216 217 246 233 232 22525 Reimbursable Overhead 380 417 435 416 414 40926 Subtotal Labor Expenses $1,597 $1,632 $1,762 $1,676 $1,667 $1,63527
28 Non-Labor Expenses:
29 Electric Power $2 $1 $0 $0 $0 $030 Fuel 0 0 0 0 0 031 Insurance 10 12 14 13 13 1332 Claims 0 0 0 0 0 033 Paratransit Service Contracts 0 0 0 0 0 034 Maintenance and Other Operating Contracts 75 83 70 71 55 5335 Professional Service Contracts 88 72 60 57 36 2736 Materials & Supplies 140 151 155 125 117 12037 Other Business Expenses (2) 6 1 1 1 138 Subtotal Non-Labor Expenses $313 $327 $301 $267 $222 $21439
40 Other Expense Adjustments:
41 Other $0 $0 $0 $0 $0 $042 Subtotal Other Expense Adjustments $0 $0 $0 $0 $0 $043
44 Depreciation $0 $0 $0 $0 $0 $045 OPEB Obligation 0 0 0 0 0 046 Environmental Remediation 0 0 0 0 0 047
48 Total Operating Expense $1,910 $1,959 $2,063 $1,943 $1,889 $1,849
49
50 Baseline Surplus/(Deficit) $0 $0 $0 $0 $0 $0
METROPOLITAN TRANSPORTATION AUTHORITY
Reimbursable
MTA Consolidated Statement Of Operations By Category($ in millions)
Line
February Financial Plan 2017-2020
IV-1

No.
7 Final Adopted 8 Actual Estimate Budget 9 2015 2016 2017 2018 2019 2020 10 Operating Revenue11 Farebox Revenue $5,961 $6,032 $6,271 $6,353 $6,377 $6,41212 Toll Revenue 1,809 1,868 1,927 1,938 1,951 1,959 13 Other Revenue 689 683 708 728 757 785 14 Capital and Other Reimbursements 1,910 1,959 2,063 1,943 1,889 1,849
15 Total Operating Revenue $10,369 $10,542 $10,969 $10,962 $10,975 $11,005
16
17 Operating Expense
18 Labor Expenses:
19 Payroll $5,325 $5,473 $5,778 $5,895 $6,012 $6,12520 Overtime 960 974 925 921 933 95021 Health & Welfare 1,120 1,245 1,363 1,424 1,514 1,60322 OPEB Current Payment 509 555 600 642 697 75623 Pensions 1,338 1,434 1,419 1,429 1,427 1,41624 Other-Fringe Benefits 1,077 1,084 1,126 1,142 1,165 1,18925 Reimbursable Overhead 0 (2) (2) (2) (2) (1)26 Sub-total Labor Expenses $10,329 $10,762 $11,209 $11,451 $11,747 $12,03727
28 Non-Labor Expenses:
29 Electric Power $476 $413 $505 $518 $533 $57130 Fuel 162 128 161 166 173 19031 Insurance 67 55 64 73 79 9032 Claims 331 275 281 287 295 30133 Paratransit Service Contracts 379 391 411 435 472 51134 Maintenance and Other Operating Contracts 654 762 859 837 823 85035 Professional Service Contracts 468 511 617 533 499 50336 Materials & Supplies 683 743 805 765 748 81637 Other Business Expenses 194 179 202 201 211 21738 Sub-total Non-Labor Expenses $3,415 $3,457 $3,905 $3,816 $3,833 $4,04939
40 Other Expense Adjustments:
41 Other $37 $56 $49 $48 $50 $5242 General Reserve 0 0 155 160 165 17043 Sub-total Other Expense Adjustments $37 $56 $204 $208 $215 $22244
45 Total Operating Expense before Non-Cash Liability Adjs. $13,781 $14,275 $15,319 $15,475 $15,795 $16,308
46
47 Depreciation $2,443 $2,496 $2,599 $2,670 $2,739 $2,80548 OPEB Obligation 1,490 1,850 1,939 2,008 2,081 2,15849 GASB 68 Pension Expense Adjustment (410) (188) (94) (104) (101) (130)49 Environmental Remediation 21 6 6 6 6 650
51 Total Operating Expense $17,324 $18,438 $19,769 $20,054 $20,521 $21,147
52
53 Net Operating Deficit Before Subsidies and Debt Service ($6,955) ($7,896) ($8,799) ($9,092) ($9,546) ($10,143)
54
55 Conversion to Cash Basis: Non-Cash Liability Adjs. ($3,543) ($4,163) ($4,450) ($4,579) ($4,726) ($4,839)56
57 Debt Service (excludes Service Contract Bonds) 2,373 2,452 2,603 2,741 2,891 3,05258
59 Total Operating Expense with Debt Service $16,154 $16,727 $17,922 $18,216 $18,686 $19,360
60
61 Dedicated Taxes and State/Local Subsidies $6,596 $6,736 $6,659 $6,913 $7,074 $7,249
62
63 Net Deficit After Subsidies and Debt Service $811 $551 ($294) ($340) ($637) ($1,106)
64
65 Conversion to Cash Basis: GASB Account 0 0 0 (8) (18) (29)66 Conversion to Cash Basis: All Other (661) (782) (195) 175 62 14167
68 CASH BALANCE BEFORE PRIOR-YEAR CARRY-OVER $150 ($231) ($489) ($173) ($593) ($993)
69 ADJUSTMENTS 0 12 253 176 574 614
70 PRIOR-YEAR CARRY-OVER 330 480 260 24 27 7
71 NET CASH BALANCE $480 $260 $24 $27 $7 ($372)
METROPOLITAN TRANSPORTATION AUTHORITY
Non-Reimbursable / Reimbursable
MTA Consolidated Statement Of Operations By Category($ in millions)
Line
February Financial Plan 2017-2020
IV-2
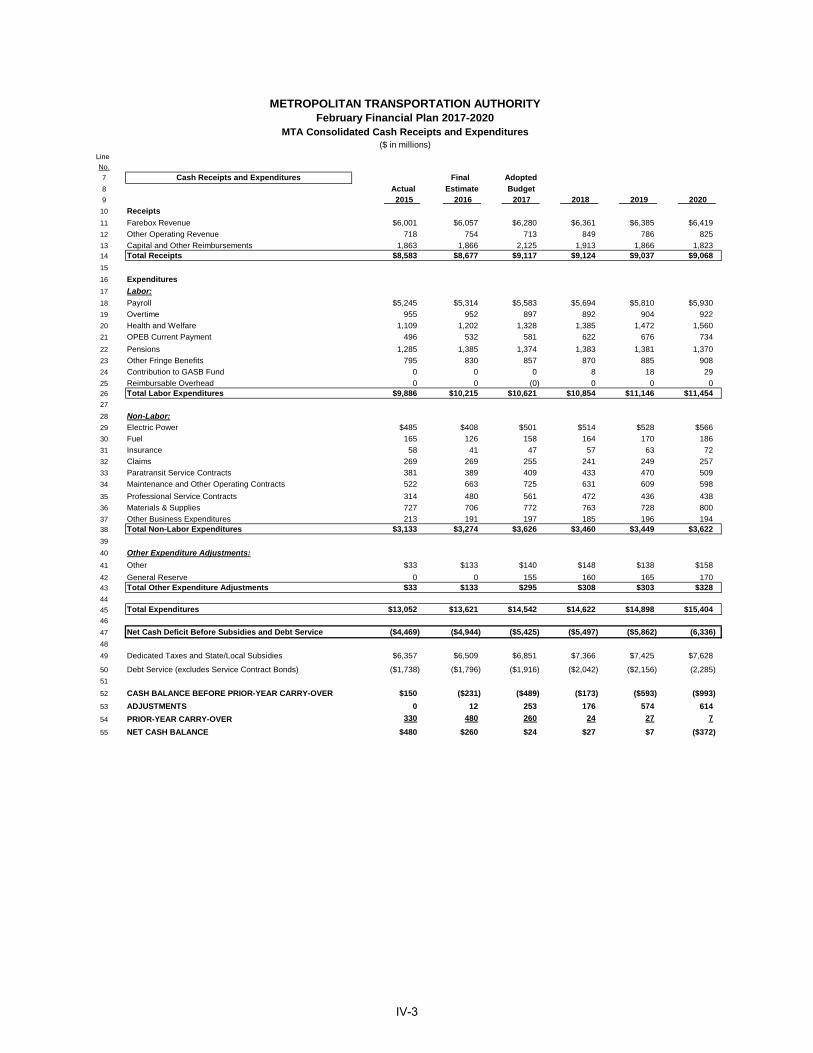
Line
No. 7 Cash Receipts and Expenditures Final Adopted
8 Actual Estimate Budget 9 2015 2016 2017 2018 2019 2020
10 Receipts
11 Farebox Revenue $6,001 $6,057 $6,280 $6,361 $6,385 $6,419
12 Other Operating Revenue 718 754 713 849 786 825
13 Capital and Other Reimbursements 1,863 1,866 2,125 1,913 1,866 1,823 14 Total Receipts $8,583 $8,677 $9,117 $9,124 $9,037 $9,068
15
16 Expenditures
17 Labor:
18 Payroll $5,245 $5,314 $5,583 $5,694 $5,810 $5,930
19 Overtime 955 952 897 892 904 922
20 Health and Welfare 1,109 1,202 1,328 1,385 1,472 1,560
21 OPEB Current Payment 496 532 581 622 676 734
22 Pensions 1,285 1,385 1,374 1,383 1,381 1,370
23 Other Fringe Benefits 795 830 857 870 885 908
24 Contribution to GASB Fund 0 0 0 8 18 29
25 Reimbursable Overhead 0 0 (0) 0 0 026 Total Labor Expenditures $9,886 $10,215 $10,621 $10,854 $11,146 $11,45427
28 Non-Labor:
29 Electric Power $485 $408 $501 $514 $528 $566
30 Fuel 165 126 158 164 170 186
31 Insurance 58 41 47 57 63 72
32 Claims 269 269 255 241 249 257
33 Paratransit Service Contracts 381 389 409 433 470 509
34 Maintenance and Other Operating Contracts 522 663 725 631 609 598
35 Professional Service Contracts 314 480 561 472 436 438
36 Materials & Supplies 727 706 772 763 728 800
37 Other Business Expenditures 213 191 197 185 196 19438 Total Non-Labor Expenditures $3,133 $3,274 $3,626 $3,460 $3,449 $3,622
39
40 Other Expenditure Adjustments:
41 Other $33 $133 $140 $148 $138 $158
42 General Reserve 0 0 155 160 165 17043 Total Other Expenditure Adjustments $33 $133 $295 $308 $303 $328
44
45 Total Expenditures $13,052 $13,621 $14,542 $14,622 $14,898 $15,404
46
47 Net Cash Deficit Before Subsidies and Debt Service ($4,469) ($4,944) ($5,425) ($5,497) ($5,862) (6,336)
48
49 Dedicated Taxes and State/Local Subsidies $6,357 $6,509 $6,851 $7,366 $7,425 $7,628
50 Debt Service (excludes Service Contract Bonds) ($1,738) ($1,796) ($1,916) ($2,042) ($2,156) (2,285)
51
52 CASH BALANCE BEFORE PRIOR-YEAR CARRY-OVER $150 ($231) ($489) ($173) ($593) ($993)
53 ADJUSTMENTS 0 12 253 176 574 614
54 PRIOR-YEAR CARRY-OVER 330 480 260 24 27 7
55 NET CASH BALANCE $480 $260 $24 $27 $7 ($372)
MTA Consolidated Cash Receipts and Expenditures($ in millions)
METROPOLITAN TRANSPORTATION AUTHORITYFebruary Financial Plan 2017-2020
IV-3

Final Adopted
Actual Estimate Budget
2015 2016 2017 2018 2019 2020
Depreciation
New York City Transit $1,692 $1,728 $1,778 $1,828 $1,878 $1,928
Long Island Rail Road 325 336 339 343 346 350
Metro-North Railroad 231 231 241 241 241 241
MTA Headquarters 27 30 51 60 65 68
MTA Bus Company 50 42 54 54 54 54
Staten Island Railway 8 8 8 8 8 8
Bridges & Tunnels 110 120 128 137 146 156
Sub-Total $2,443 $2,496 $2,599 $2,670 $2,739 $2,805
OPEB Liability Adjustment
New York City Transit $1,130 $1,443 $1,501 $1,561 $1,624 $1,689
Long Island Rail Road 85 83 86 89 91 94
Metro-North Railroad 56 68 68 68 68 68
MTA Headquarters 79 80 106 108 113 118
MTA Bus Company 61 100 100 100 100 100
Staten Island Railway 7 8 8 8 8 8
Bridges & Tunnels 71 67 71 74 78 82
Sub-Total $1,490 $1,850 $1,939 $2,008 $2,081 $2,158
GASB 68 Pension Expense Adjustment
New York City Transit ($315) ($355) ($296) ($306) ($296) ($303)
Long Island Rail Road (31) 169 174 173 174 162
Metro-North Railroad (26) (22) (3) (1) (7) (14)
MTA Headquarters (16) (10) (4) (4) (5) (7)
MTA Bus Company (12) 40 43 43 42 37
Staten Island Railway (2) (1) (1) (1) (1) (1)
Bridges & Tunnels (9) (10) (9) (8) (7) (5)
Sub-Total ($410) (188) (94) (104) (101) (130)
Environmental Remediation
New York City Transit $13 $0 $0 $0 $0 $0
Long Island Rail Road 2 2 2 2 2 2
Metro-North Railroad 4 4 4 4 4 4
MTA Bus Company 0 0 0 0 0 0
Staten Island Railway 1 0 0 0 0 0
Bridges & Tunnels 0 0 0 0 0 0
Sub-Total $21 $6 $6 $6 $6 $6
Net Operating Surplus/(Deficit)
New York City Transit $190 $154 $252 $191 $167 $167
Long Island Rail Road 18 6 (9) (12) (13) (16)
Metro-North Railroad (125) (62) (57) (50) (10) (40)
MTA Headquarters 148 65 80 188 116 131
MTA Bus Company 44 (7) 27 27 30 29
Staten Island Railway 1 (6) 0 (0) (0) (0)
First Mutual Transportation Assurance Company 24 (19) (18) (22) (26) (31)
Other 28 23 20 20 20 50
Sub-Total $328 $154 $295 $343 $284 $291
Subsidies
New York City Transit ($816) ($688) ($503) ($249) ($289) ($241)
Commuter Railroads (182) (161) (26) 88 77 94
MTA Headquarters (27) (23) (24) (23) (22) (23)
MTA Bus Company 40 (44) 65 (11) (3) (4)
Staten Island Railway (3) (20) (2) 19 (3) (5)
Sub-Total ($989) ($937) ($490) ($176) ($240) ($178)
Total Cash Conversion $2,882 $3,380 $4,254 $4,746 $4,770 $4,952
METROPOLITAN TRANSPORTATION AUTHORITYFebruary Financial Plan 2017-2020
Cash Conversion Detail($ in millions)
IV-4
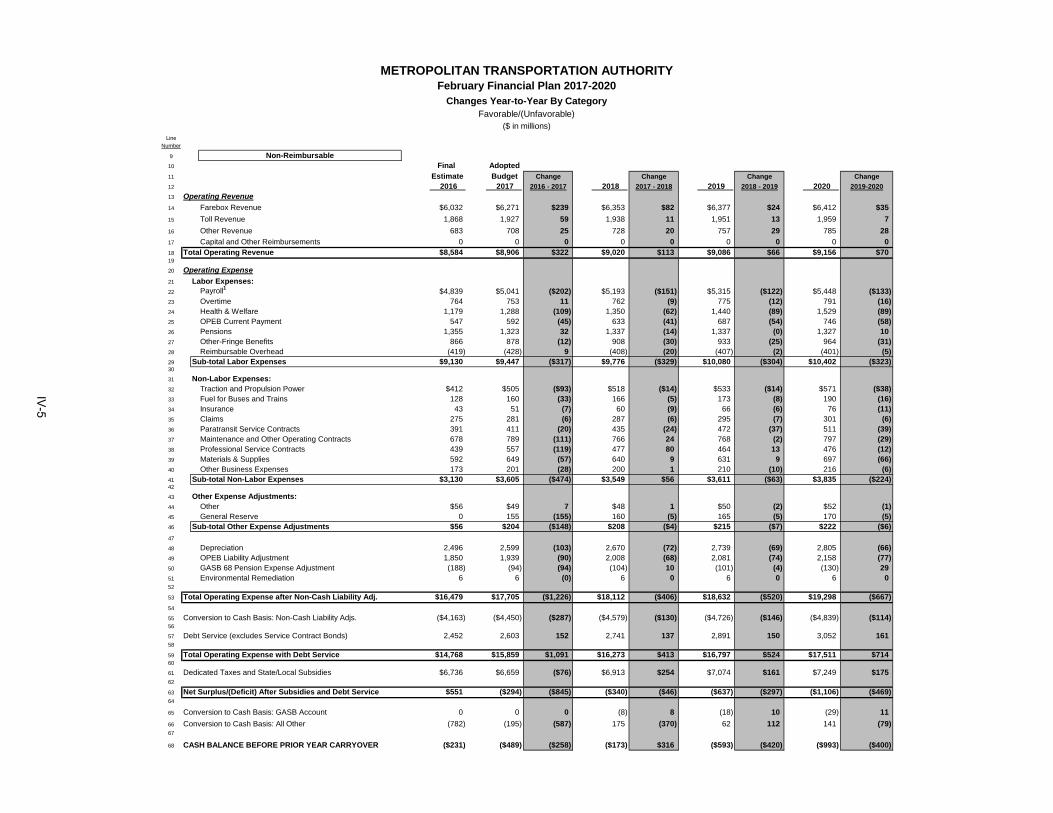
LineNumber
9 Non-Reimbursable 10 Final Adopted
11 Estimate Budget Change Change Change Change
12 2016 2017 2016 - 2017 2018 2017 - 2018 2019 2018 - 2019 2020 2019-2020
13 Operating Revenue
14 Farebox Revenue $6,032 $6,271 $239 $6,353 $82 $6,377 $24 $6,412 $35
15 Toll Revenue 1,868 1,927 59 1,938 11 1,951 13 1,959 7
16 Other Revenue 683 708 25 728 20 757 29 785 28
17 Capital and Other Reimbursements 0 0 0 0 0 0 0 0 018 Total Operating Revenue $8,584 $8,906 $322 $9,020 $113 $9,086 $66 $9,156 $7019
20 Operating Expense
21 Labor Expenses:22 Payroll1 $4,839 $5,041 ($202) $5,193 ($151) $5,315 ($122) $5,448 ($133)23 Overtime 764 753 11 762 (9) 775 (12) 791 (16)24 Health & Welfare 1,179 1,288 (109) 1,350 (62) 1,440 (89) 1,529 (89)25 OPEB Current Payment 547 592 (45) 633 (41) 687 (54) 746 (58)26 Pensions 1,355 1,323 32 1,337 (14) 1,337 (0) 1,327 1027 Other-Fringe Benefits 866 878 (12) 908 (30) 933 (25) 964 (31)28 Reimbursable Overhead (419) (428) 9 (408) (20) (407) (2) (401) (5)29 Sub-total Labor Expenses $9,130 $9,447 ($317) $9,776 ($329) $10,080 ($304) $10,402 ($323)30
31 Non-Labor Expenses:32 Traction and Propulsion Power $412 $505 ($93) $518 ($14) $533 ($14) $571 ($38)33 Fuel for Buses and Trains 128 160 (33) 166 (5) 173 (8) 190 (16)34 Insurance 43 51 (7) 60 (9) 66 (6) 76 (11)35 Claims 275 281 (6) 287 (6) 295 (7) 301 (6)36 Paratransit Service Contracts 391 411 (20) 435 (24) 472 (37) 511 (39)37 Maintenance and Other Operating Contracts 678 789 (111) 766 24 768 (2) 797 (29)38 Professional Service Contracts 439 557 (119) 477 80 464 13 476 (12)39 Materials & Supplies 592 649 (57) 640 9 631 9 697 (66)40 Other Business Expenses 173 201 (28) 200 1 210 (10) 216 (6)41 Sub-total Non-Labor Expenses $3,130 $3,605 ($474) $3,549 $56 $3,611 ($63) $3,835 ($224)42
43 Other Expense Adjustments:44 Other $56 $49 7 $48 1 $50 (2) $52 (1)45 General Reserve 0 155 (155) 160 (5) 165 (5) 170 (5)46 Sub-total Other Expense Adjustments $56 $204 ($148) $208 ($4) $215 ($7) $222 ($6)
47
48 Depreciation 2,496 2,599 (103) 2,670 (72) 2,739 (69) 2,805 (66)49 OPEB Liability Adjustment 1,850 1,939 (90) 2,008 (68) 2,081 (74) 2,158 (77)50 GASB 68 Pension Expense Adjustment (188) (94) (94) (104) 10 (101) (4) (130) 2951 Environmental Remediation 6 6 (0) 6 0 6 0 6 052
53 Total Operating Expense after Non-Cash Liability Adj. $16,479 $17,705 ($1,226) $18,112 ($406) $18,632 ($520) $19,298 ($667)
54
55 Conversion to Cash Basis: Non-Cash Liability Adjs. ($4,163) ($4,450) ($287) ($4,579) ($130) ($4,726) ($146) ($4,839) ($114)56
57 Debt Service (excludes Service Contract Bonds) 2,452 2,603 152 2,741 137 2,891 150 3,052 16158
59 Total Operating Expense with Debt Service $14,768 $15,859 $1,091 $16,273 $413 $16,797 $524 $17,511 $71460
61 Dedicated Taxes and State/Local Subsidies $6,736 $6,659 ($76) $6,913 $254 $7,074 $161 $7,249 $17562
63 Net Surplus/(Deficit) After Subsidies and Debt Service $551 ($294) ($845) ($340) ($46) ($637) ($297) ($1,106) ($469)64
65 Conversion to Cash Basis: GASB Account 0 0 0 (8) 8 (18) 10 (29) 11
66 Conversion to Cash Basis: All Other (782) (195) (587) 175 (370) 62 112 141 (79)67
68 CASH BALANCE BEFORE PRIOR YEAR CARRYOVER ($231) ($489) ($258) ($173) $316 ($593) ($420) ($993) ($400)
($ in millions)
Favorable/(Unfavorable)
Changes Year-to-Year By Category
February Financial Plan 2017-2020METROPOLITAN TRANSPORTATION AUTHORITY
IV-5
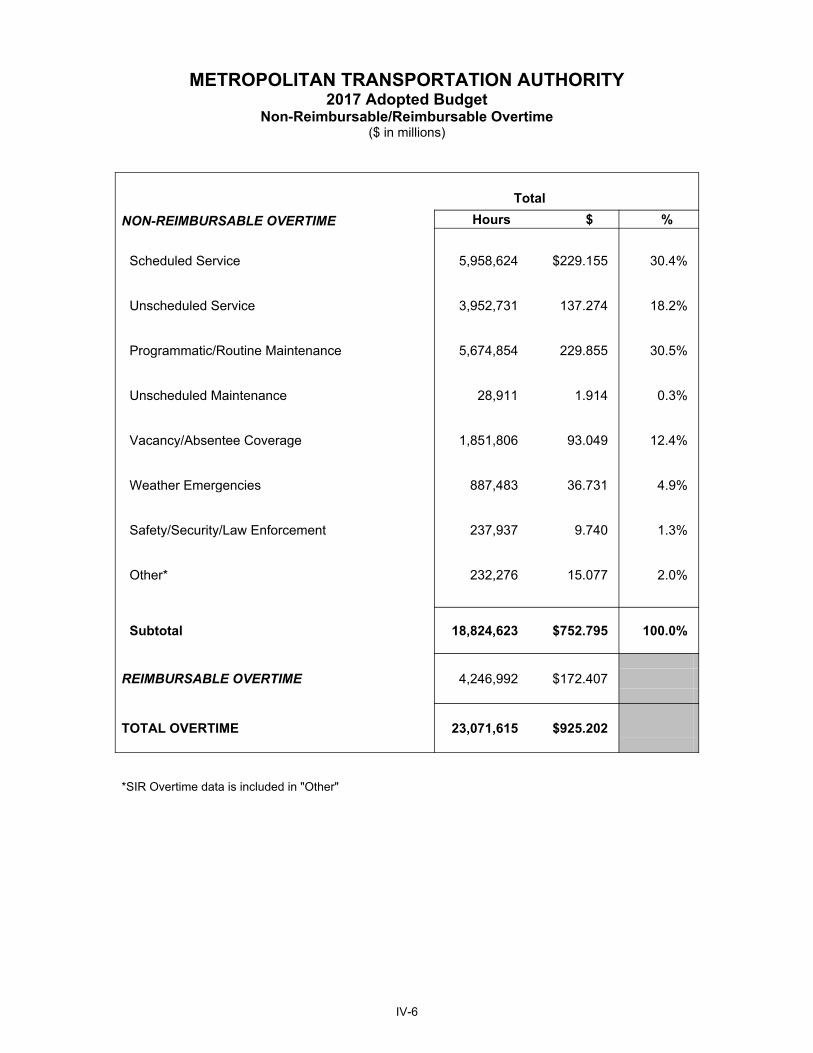
METROPOLITAN TRANSPORTATION AUTHORITY2017 Adopted Budget
Non-Reimbursable/Reimbursable Overtime($ in millions)
2017 2017
TotalNON-REIMBURSABLE OVERTIME Hours $ %
Scheduled Service 5,958,624 $229.155 30.4%
Unscheduled Service 3,952,731 137.274 18.2%
Programmatic/Routine Maintenance 5,674,854 229.855 30.5%
Unscheduled Maintenance 28,911 1.914 0.3%
Vacancy/Absentee Coverage 1,851,806 93.049 12.4%
Weather Emergencies 887,483 36.731 4.9%
Safety/Security/Law Enforcement 237,937 9.740 1.3%
Other* 232,276 15.077 2.0%
Subtotal 18,824,623 $752.795 100.0%
REIMBURSABLE OVERTIME 4,246,992 $172.407
TOTAL OVERTIME 23,071,615 $925.202
*SIR Overtime data is included in "Other"
IV-6
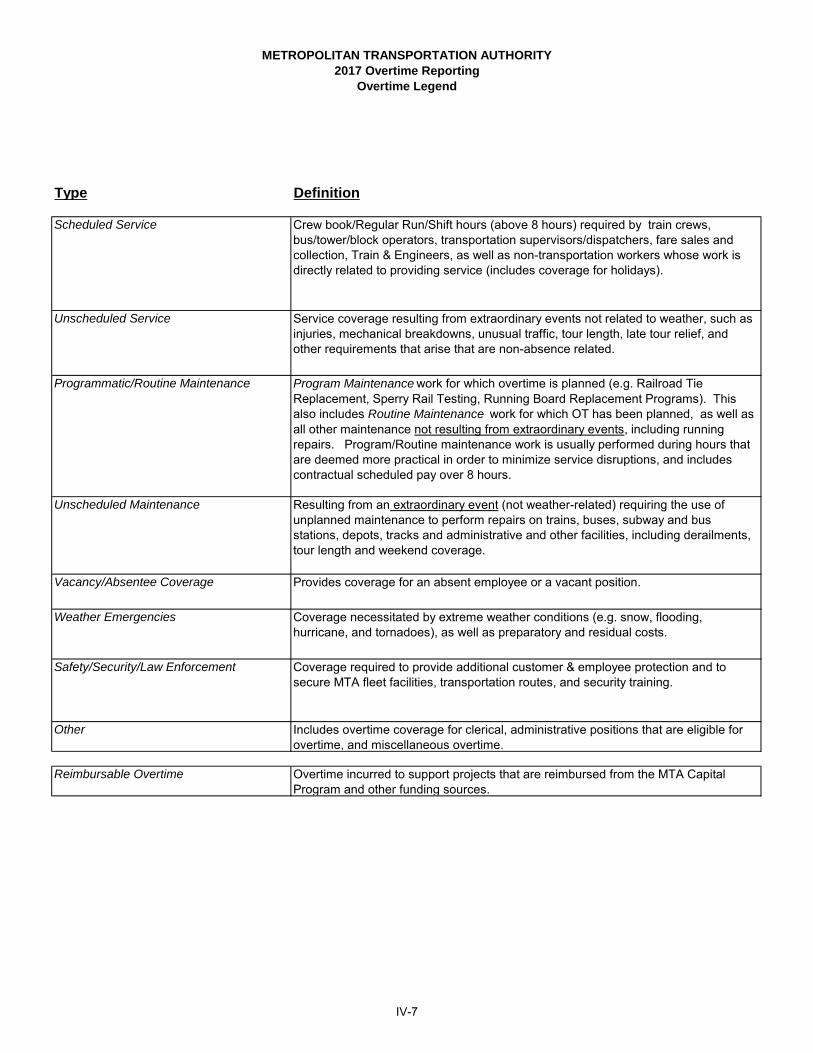
METROPOLITAN TRANSPORTATION AUTHORITY
2017 Overtime Reporting
Overtime Legend
Type Definition
Scheduled Service Crew book/Regular Run/Shift hours (above 8 hours) required by train crews, bus/tower/block operators, transportation supervisors/dispatchers, fare sales and collection, Train & Engineers, as well as non-transportation workers whose work is directly related to providing service (includes coverage for holidays).
Unscheduled Service Service coverage resulting from extraordinary events not related to weather, such as injuries, mechanical breakdowns, unusual traffic, tour length, late tour relief, and other requirements that arise that are non-absence related.
Programmatic/Routine Maintenance Program Maintenance work for which overtime is planned (e.g. Railroad Tie Replacement, Sperry Rail Testing, Running Board Replacement Programs). This also includes Routine Maintenance work for which OT has been planned, as well as all other maintenance not resulting from extraordinary events, including running repairs. Program/Routine maintenance work is usually performed during hours that are deemed more practical in order to minimize service disruptions, and includes contractual scheduled pay over 8 hours.
Unscheduled Maintenance Resulting from an extraordinary event (not weather-related) requiring the use of unplanned maintenance to perform repairs on trains, buses, subway and bus stations, depots, tracks and administrative and other facilities, including derailments, tour length and weekend coverage.
Vacancy/Absentee Coverage Provides coverage for an absent employee or a vacant position.
Weather Emergencies Coverage necessitated by extreme weather conditions (e.g. snow, flooding, hurricane, and tornadoes), as well as preparatory and residual costs.
Safety/Security/Law Enforcement Coverage required to provide additional customer & employee protection and to secure MTA fleet facilities, transportation routes, and security training.
Other Includes overtime coverage for clerical, administrative positions that are eligible for overtime, and miscellaneous overtime.
Reimbursable Overtime Overtime incurred to support projects that are reimbursed from the MTA Capital Program and other funding sources.
IV-7
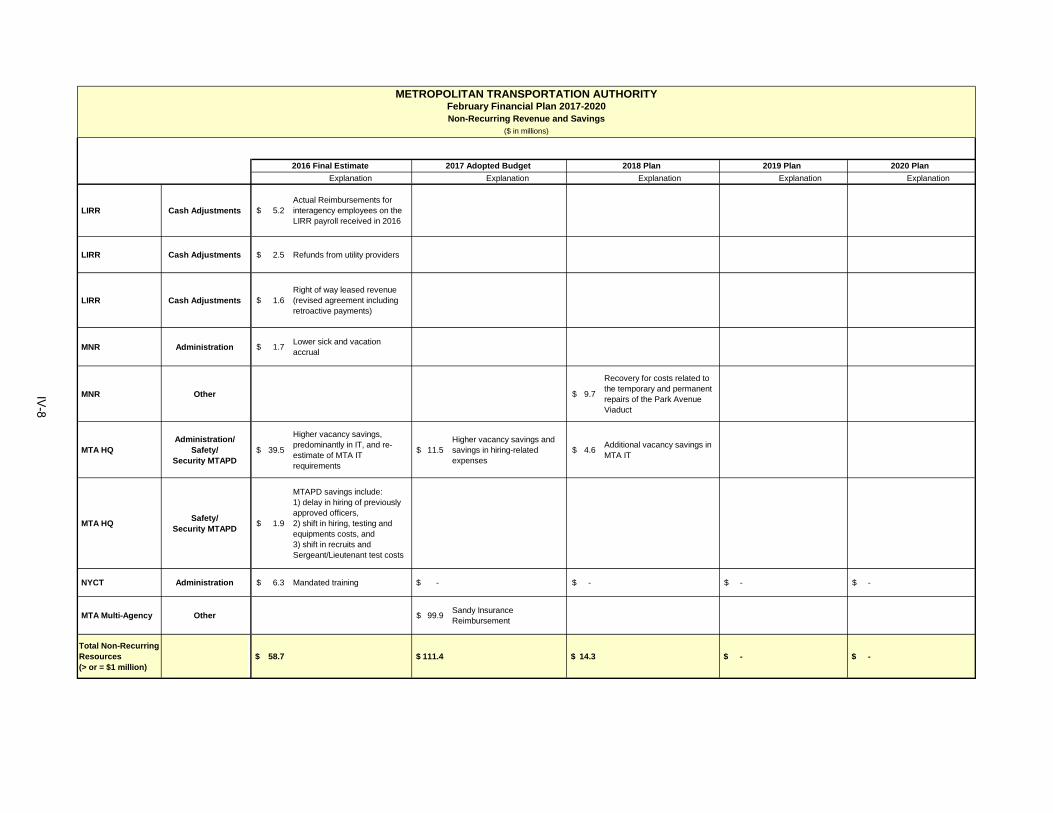
Explanation Explanation Explanation Explanation Explanation
LIRR Cash Adjustments 5.2$ Actual Reimbursements for interagency employees on the LIRR payroll received in 2016
LIRR Cash Adjustments 2.5$ Refunds from utility providers
LIRR Cash Adjustments 1.6$ Right of way leased revenue (revised agreement including retroactive payments)
MNR Administration 1.7$ Lower sick and vacation accrual
MNR Other 9.7$
Recovery for costs related to the temporary and permanent repairs of the Park Avenue Viaduct
MTA HQAdministration/
Safety/ Security MTAPD
39.5$
Higher vacancy savings, predominantly in IT, and re-estimate of MTA IT requirements
11.5$ Higher vacancy savings and savings in hiring-related expenses
4.6$ Additional vacancy savings in MTA IT
MTA HQSafety/
Security MTAPD1.9$
MTAPD savings include:1) delay in hiring of previously approved officers,2) shift in hiring, testing and equipments costs, and3) shift in recruits and Sergeant/Lieutenant test costs
NYCT Administration 6.3$ Mandated training -$ -$ -$ -$
MTA Multi-Agency Other 99.9$ Sandy Insurance Reimbursement
Total Non-Recurring Resources (> or = $1 million)
58.7$ 111.4$ 14.3$ -$ -$
METROPOLITAN TRANSPORTATION AUTHORITYFebruary Financial Plan 2017-2020Non-Recurring Revenue and Savings
($ in millions)
2020 Plan2019 Plan2018 Plan2016 Final Estimate 2017 Adopted Budget
IV-8
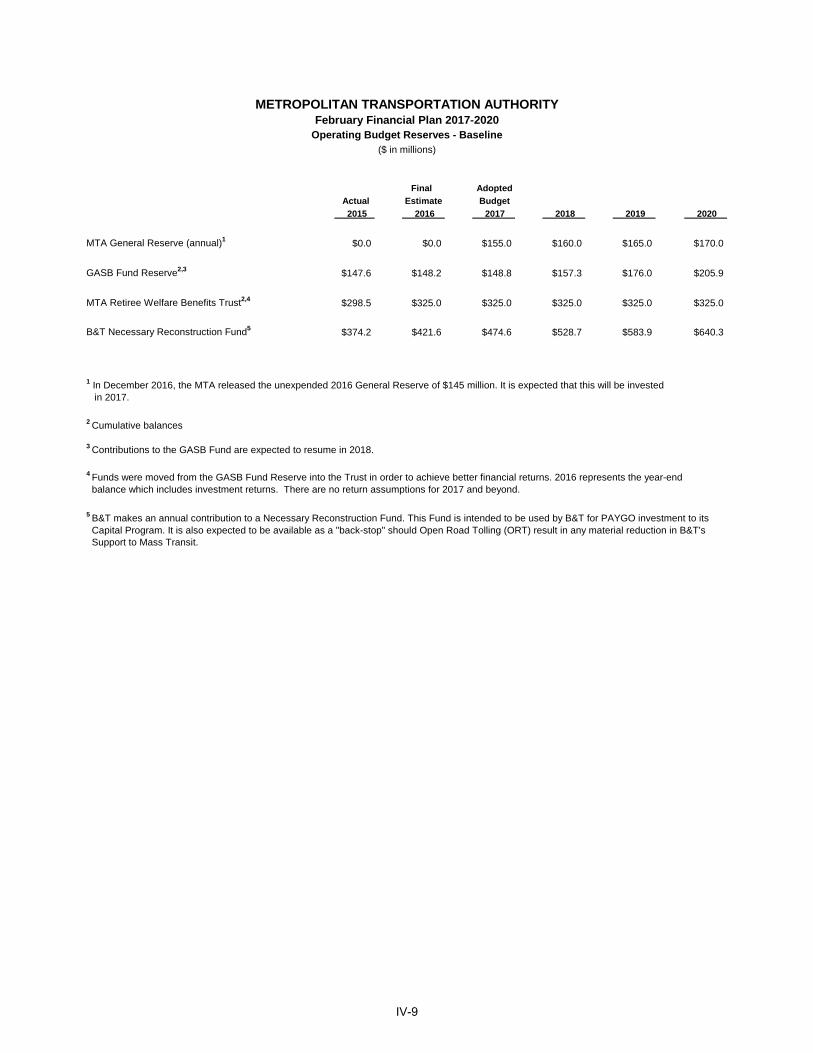
Final Adopted
Actual Estimate Budget
2015 2016 2017 2018 2019 2020
MTA General Reserve (annual)1 $0.0 $0.0 $155.0 $160.0 $165.0 $170.0
GASB Fund Reserve2,3 $147.6 $148.2 $148.8 $157.3 $176.0 $205.9
MTA Retiree Welfare Benefits Trust2,4 $298.5 $325.0 $325.0 $325.0 $325.0 $325.0
B&T Necessary Reconstruction Fund5 $374.2 $421.6 $474.6 $528.7 $583.9 $640.3
5 B&T makes an annual contribution to a Necessary Reconstruction Fund. This Fund is intended to be used by B&T for PAYGO investment to its Capital Program. It is also expected to be available as a "back-stop" should Open Road Tolling (ORT) result in any material reduction in B&T's Support to Mass Transit.
4 Funds were moved from the GASB Fund Reserve into the Trust in order to achieve better financial returns. 2016 represents the year-end balance which includes investment returns. There are no return assumptions for 2017 and beyond.
METROPOLITAN TRANSPORTATION AUTHORITYFebruary Financial Plan 2017-2020
Operating Budget Reserves - Baseline($ in millions)
1 In December 2016, the MTA released the unexpended 2016 General Reserve of $145 million. It is expected that this will be invested in 2017.
3 Contributions to the GASB Fund are expected to resume in 2018.
2 Cumulative balances
IV-9
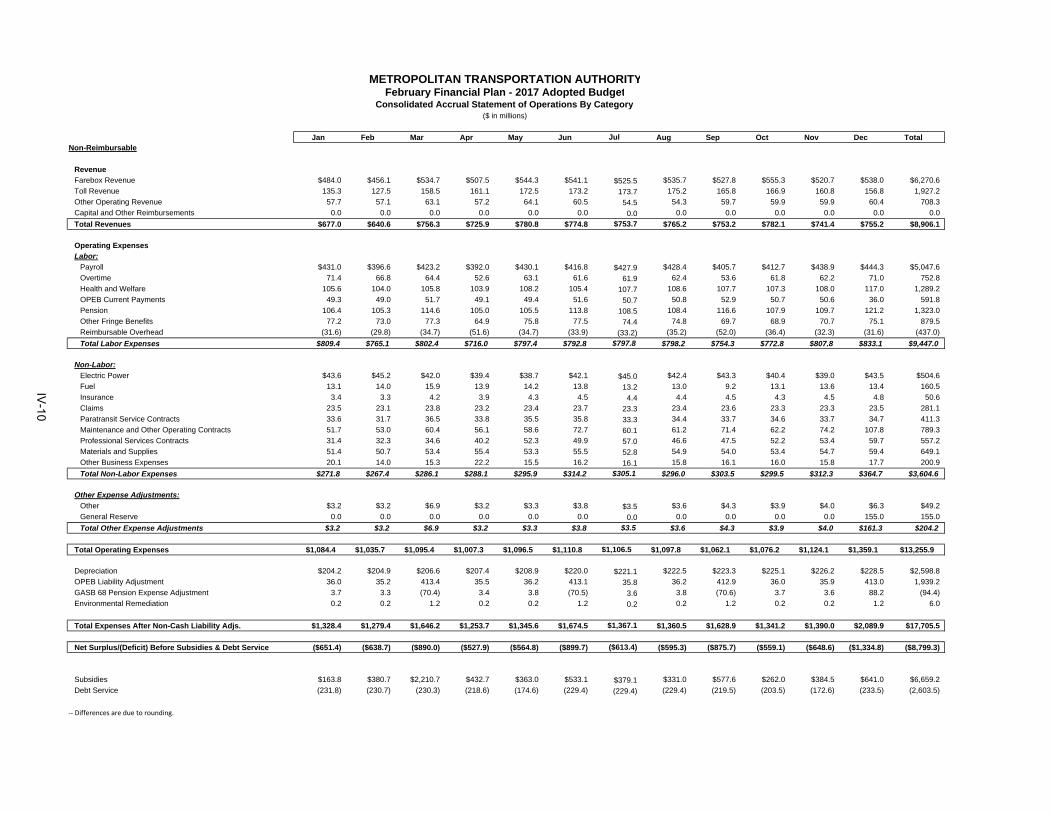
Jan Feb Mar Apr May Jun Aug Sep Oct Nov Dec TotalNon-Reimbursable
Revenue
Farebox Revenue $484.0 $456.1 $534.7 $507.5 $544.3 $541.1 $535.7 $527.8 $555.3 $520.7 $538.0 $6,270.6
Toll Revenue 135.3 127.5 158.5 161.1 172.5 173.2 175.2 165.8 166.9 160.8 156.8 1,927.2
Other Operating Revenue 57.7 57.1 63.1 57.2 64.1 60.5 54.3 59.7 59.9 59.9 60.4 708.3
Capital and Other Reimbursements 0.0 0.0 0.0 0.0 0.0 0.0 0.0 0.0 0.0 0.0 0.0 0.0
Total Revenues $677.0 $640.6 $756.3 $725.9 $780.8 $774.8 $765.2 $753.2 $782.1 $741.4 $755.2 $8,906.1
Operating Expenses
Labor:
Payroll $431.0 $396.6 $423.2 $392.0 $430.1 $416.8 $428.4 $405.7 $412.7 $438.9 $444.3 $5,047.6
Overtime 71.4 66.8 64.4 52.6 63.1 61.6 62.4 53.6 61.8 62.2 71.0 752.8
Health and Welfare 105.6 104.0 105.8 103.9 108.2 105.4 108.6 107.7 107.3 108.0 117.0 1,289.2
OPEB Current Payments 49.3 49.0 51.7 49.1 49.4 51.6 50.8 52.9 50.7 50.6 36.0 591.8
Pension 106.4 105.3 114.6 105.0 105.5 113.8 108.4 116.6 107.9 109.7 121.2 1,323.0
Other Fringe Benefits 77.2 73.0 77.3 64.9 75.8 77.5 74.8 69.7 68.9 70.7 75.1 879.5
Reimbursable Overhead (31.6) (29.8) (34.7) (51.6) (34.7) (33.9) (35.2) (52.0) (36.4) (32.3) (31.6) (437.0)
Total Labor Expenses $809.4 $765.1 $802.4 $716.0 $797.4 $792.8 $798.2 $754.3 $772.8 $807.8 $833.1 $9,447.0
Non-Labor:
Electric Power $43.6 $45.2 $42.0 $39.4 $38.7 $42.1 $42.4 $43.3 $40.4 $39.0 $43.5 $504.6
Fuel 13.1 14.0 15.9 13.9 14.2 13.8 13.0 9.2 13.1 13.6 13.4 160.5
Insurance 3.4 3.3 4.2 3.9 4.3 4.5 4.4 4.5 4.3 4.5 4.8 50.6
Claims 23.5 23.1 23.8 23.2 23.4 23.7 23.4 23.6 23.3 23.3 23.5 281.1
Paratransit Service Contracts 33.6 31.7 36.5 33.8 35.5 35.8 34.4 33.7 34.6 33.7 34.7 411.3
Maintenance and Other Operating Contracts 51.7 53.0 60.4 56.1 58.6 72.7 61.2 71.4 62.2 74.2 107.8 789.3
Professional Services Contracts 31.4 32.3 34.6 40.2 52.3 49.9 46.6 47.5 52.2 53.4 59.7 557.2
Materials and Supplies 51.4 50.7 53.4 55.4 53.3 55.5 54.9 54.0 53.4 54.7 59.4 649.1
Other Business Expenses 20.1 14.0 15.3 22.2 15.5 16.2 15.8 16.1 16.0 15.8 17.7 200.9
Total Non-Labor Expenses $271.8 $267.4 $286.1 $288.1 $295.9 $314.2 $296.0 $303.5 $299.5 $312.3 $364.7 $3,604.6
Other Expense Adjustments:
Other $3.2 $3.2 $6.9 $3.2 $3.3 $3.8 $3.6 $4.3 $3.9 $4.0 $6.3 $49.2
General Reserve 0.0 0.0 0.0 0.0 0.0 0.0 0.0 0.0 0.0 0.0 155.0 155.0
Total Other Expense Adjustments $3.2 $3.2 $6.9 $3.2 $3.3 $3.8 $3.6 $4.3 $3.9 $4.0 $161.3 $204.2
Total Operating Expenses $1,084.4 $1,035.7 $1,095.4 $1,007.3 $1,096.5 $1,110.8 $1,097.8 $1,062.1 $1,076.2 $1,124.1 $1,359.1 $13,255.9
Depreciation $204.2 $204.9 $206.6 $207.4 $208.9 $220.0 $222.5 $223.3 $225.1 $226.2 $228.5 $2,598.8
OPEB Liability Adjustment 36.0 35.2 413.4 35.5 36.2 413.1 36.2 412.9 36.0 35.9 413.0 1,939.2
GASB 68 Pension Expense Adjustment 3.7 3.3 (70.4) 3.4 3.8 (70.5) 3.8 (70.6) 3.7 3.6 88.2 (94.4)
Environmental Remediation 0.2 0.2 1.2 0.2 0.2 1.2 0.2 1.2 0.2 0.2 1.2 6.0
Total Expenses After Non-Cash Liability Adjs. $1,328.4 $1,279.4 $1,646.2 $1,253.7 $1,345.6 $1,674.5 $1,360.5 $1,628.9 $1,341.2 $1,390.0 $2,089.9 $17,705.5
Net Surplus/(Deficit) Before Subsidies & Debt Service ($651.4) ($638.7) ($890.0) ($527.9) ($564.8) ($899.7) ($595.3) ($875.7) ($559.1) ($648.6) ($1,334.8) ($8,799.3)
Subsidies $163.8 $380.7 $2,210.7 $432.7 $363.0 $533.1 $331.0 $577.6 $262.0 $384.5 $641.0 $6,659.2
Debt Service (231.8) (230.7) (230.3) (218.6) (174.6) (229.4) (229.4) (219.5) (203.5) (172.6) (233.5) (2,603.5)
Jul
$525.5
173.7
54.5
0.0 $753.7
$427.9
61.9
107.7
50.7
108.5
74.4
(33.2)$797.8
$45.0
13.2
4.4
23.3
33.3
60.1
57.0
52.8
16.1 $305.1
$3.5
0.2
0.0 $3.5
$1,106.5
$379.1
(229.4)
‐‐ Differences are due to rounding.
METROPOLITAN TRANSPORTATION AUTHORITYFebruary Financial Plan - 2017 Adopted Budget
Consolidated Accrual Statement of Operations By Category($ in millions)
$1,367.1
($613.4)
$221.1
35.8
3.6
IV-10
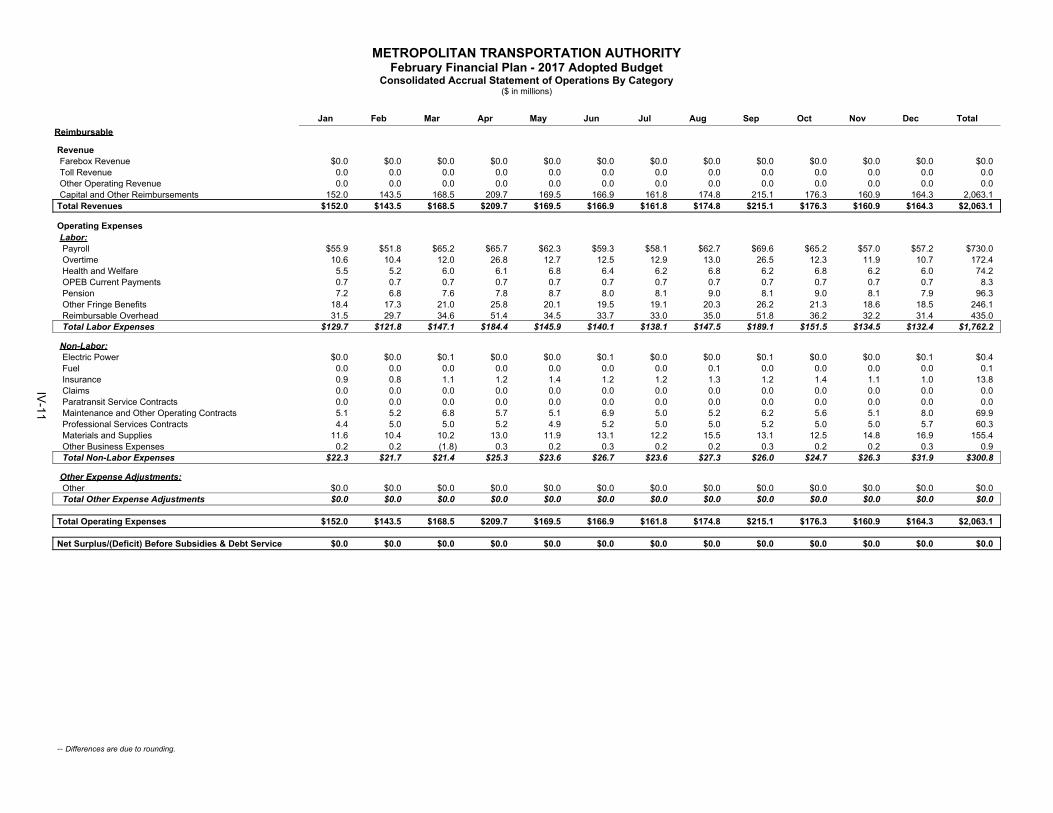
METROPOLITAN TRANSPORTATION AUTHORITYFebruary Financial Plan - 2017 Adopted Budget
Consolidated Accrual Statement of Operations By Category($ in millions)
-- Differences are due to rounding.
Jan Feb Mar Apr May Jun Jul Aug Sep Oct Nov Dec TotalReimbursable
RevenueFarebox Revenue $0.0 $0.0 $0.0 $0.0 $0.0 $0.0 $0.0 $0.0 $0.0 $0.0 $0.0 $0.0 $0.0 Toll Revenue 0.0 0.0 0.0 0.0 0.0 0.0 0.0 0.0 0.0 0.0 0.0 0.0 0.0 Other Operating Revenue 0.0 0.0 0.0 0.0 0.0 0.0 0.0 0.0 0.0 0.0 0.0 0.0 0.0 Capital and Other Reimbursements 152.0 143.5 168.5 209.7 169.5 166.9 161.8 174.8 215.1 176.3 160.9 164.3 2,063.1
Total Revenues $152.0 $143.5 $168.5 $209.7 $169.5 $166.9 $161.8 $174.8 $215.1 $176.3 $160.9 $164.3 $2,063.1
Operating ExpensesLabor:Payroll $55.9 $51.8 $65.2 $65.7 $62.3 $59.3 $58.1 $62.7 $69.6 $65.2 $57.0 $57.2 $730.0 Overtime 10.6 10.4 12.0 26.8 12.7 12.5 12.9 13.0 26.5 12.3 11.9 10.7 172.4 Health and Welfare 5.5 5.2 6.0 6.1 6.8 6.4 6.2 6.8 6.2 6.8 6.2 6.0 74.2 OPEB Current Payments 0.7 0.7 0.7 0.7 0.7 0.7 0.7 0.7 0.7 0.7 0.7 0.7 8.3 Pension 7.2 6.8 7.6 7.8 8.7 8.0 8.1 9.0 8.1 9.0 8.1 7.9 96.3 Other Fringe Benefits 18.4 17.3 21.0 25.8 20.1 19.5 19.1 20.3 26.2 21.3 18.6 18.5 246.1 Reimbursable Overhead 31.5 29.7 34.6 51.4 34.5 33.7 33.0 35.0 51.8 36.2 32.2 31.4 435.0 Total Labor Expenses $129.7 $121.8 $147.1 $184.4 $145.9 $140.1 $138.1 $147.5 $189.1 $151.5 $134.5 $132.4 $1,762.2
Non-Labor:Electric Power $0.0 $0.0 $0.1 $0.0 $0.0 $0.1 $0.0 $0.0 $0.1 $0.0 $0.0 $0.1 $0.4 Fuel 0.0 0.0 0.0 0.0 0.0 0.0 0.0 0.1 0.0 0.0 0.0 0.0 0.1 Insurance 0.9 0.8 1.1 1.2 1.4 1.2 1.2 1.3 1.2 1.4 1.1 1.0 13.8 Claims 0.0 0.0 0.0 0.0 0.0 0.0 0.0 0.0 0.0 0.0 0.0 0.0 0.0 Paratransit Service Contracts 0.0 0.0 0.0 0.0 0.0 0.0 0.0 0.0 0.0 0.0 0.0 0.0 0.0 Maintenance and Other Operating Contracts 5.1 5.2 6.8 5.7 5.1 6.9 5.0 5.2 6.2 5.6 5.1 8.0 69.9 Professional Services Contracts 4.4 5.0 5.0 5.2 4.9 5.2 5.0 5.0 5.2 5.0 5.0 5.7 60.3 Materials and Supplies 11.6 10.4 10.2 13.0 11.9 13.1 12.2 15.5 13.1 12.5 14.8 16.9 155.4 Other Business Expenses 0.2 0.2 (1.8) 0.3 0.2 0.3 0.2 0.2 0.3 0.2 0.2 0.3 0.9 Total Non-Labor Expenses $22.3 $21.7 $21.4 $25.3 $23.6 $26.7 $23.6 $27.3 $26.0 $24.7 $26.3 $31.9 $300.8
Other Expense Adjustments:Other $0.0 $0.0 $0.0 $0.0 $0.0 $0.0 $0.0 $0.0 $0.0 $0.0 $0.0 $0.0 $0.0 Total Other Expense Adjustments $0.0 $0.0 $0.0 $0.0 $0.0 $0.0 $0.0 $0.0 $0.0 $0.0 $0.0 $0.0 $0.0
Total Operating Expenses $152.0 $143.5 $168.5 $209.7 $169.5 $166.9 $161.8 $174.8 $215.1 $176.3 $160.9 $164.3 $2,063.1
Net Surplus/(Deficit) Before Subsidies & Debt Service $0.0 $0.0 $0.0 $0.0 $0.0 $0.0 $0.0 $0.0 $0.0 $0.0 $0.0 $0.0 $0.0
IV-11

Jan Feb Mar Apr May Jun Aug Sep Oct Nov Dec TotalNon-Reimbursable / Reimbursable
Revenue
Farebox Revenue $484.0 $456.1 $534.7 $507.5 $544.3 $541.1 $535.7 $527.8 $555.3 $520.7 $538.0 $6,270.6
Toll Revenue 135.3 127.5 158.5 161.1 172.5 173.2 175.2 165.8 166.9 160.8 156.8 1,927.2
Other Operating Revenue 57.7 57.1 63.1 57.2 64.1 60.5 54.3 59.7 59.9 59.9 60.4 708.3
Capital and Other Reimbursements 152.0 143.5 168.5 209.7 169.5 166.9 174.8 215.1 176.3 160.9 164.3 2,063.1
Total Revenues $829.0 $784.2 $924.8 $935.6 $950.3 $941.7 $940.0 $968.3 $958.3 $902.3 $919.4 $10,969.2
Operating Expenses
Labor:
Payroll $486.9 $448.5 $488.5 $457.7 $492.4 $476.1 $491.1 $475.2 $477.9 $495.8 $501.5 $5,777.6
Overtime 82.0 77.2 76.4 79.4 75.8 74.1 75.4 80.2 74.1 74.1 81.7 925.2
Health and Welfare 111.0 109.2 111.8 110.1 115.0 111.7 115.4 113.9 114.2 114.1 122.9 1,363.4
OPEB Current Payments 50.0 49.7 52.4 49.8 50.1 52.3 51.5 53.6 51.4 51.3 36.7 600.2
Pension 113.6 112.1 122.2 112.8 114.3 121.8 117.4 124.7 116.8 117.8 129.2 1,419.3
Other Fringe Benefits 95.6 90.4 98.3 90.8 95.9 97.1 95.2 95.9 90.1 89.3 93.6 1,125.6
Reimbursable Overhead (0.1) (0.1) (0.2) (0.2) (0.2) (0.2) (0.2) (0.2) (0.2) (0.2) (0.1) (2.0)
Total Labor Expenses $939.1 $886.9 $949.5 $900.4 $943.2 $933.0 $945.7 $943.4 $924.3 $942.3 $965.5 $11,209.3
Non-Labor:
Electric Power $43.6 $45.3 $42.1 $39.4 $38.7 $42.1 $42.4 $43.4 $40.4 $39.0 $43.6 $505.0
Fuel 13.1 14.0 15.9 13.9 14.2 13.8 13.0 9.2 13.1 13.6 13.4 160.6
Insurance 4.2 4.1 5.3 5.1 5.7 5.8 5.7 5.7 5.7 5.6 5.8 64.3
Claims 23.5 23.1 23.8 23.2 23.4 23.7 23.4 23.6 23.3 23.3 23.5 281.1
Paratransit Service Contracts 33.6 31.7 36.5 33.8 35.5 35.8 34.4 33.7 34.6 33.7 34.7 411.3
Maintenance and Other Operating Contracts 56.8 58.2 67.2 61.8 63.7 79.6 66.4 77.5 67.8 79.3 115.8 859.3
Professional Services Contracts 35.8 37.4 39.6 45.3 57.1 55.1 51.6 52.7 57.1 58.4 65.4 617.5
Materials and Supplies 63.1 61.1 63.7 68.4 65.3 68.6 70.4 67.2 65.9 69.5 76.4 804.5
Other Business Expenses 20.4 14.3 13.5 22.4 15.8 16.5 16.1 16.4 16.2 16.1 18.0 201.8
Total Non-Labor Expenses $294.1 $289.1 $307.5 $313.4 $319.4 $340.9 $323.3 $329.4 $324.2 $338.6 $396.6 $3,905.5
Other Expense Adjustments:
Other $3.2 $3.2 $6.9 $3.2 $3.3 $3.8 $3.6 $4.3 $3.9 $4.0 $6.3 $49.2
General Reserve 0.0 0.0 0.0 0.0 0.0 0.0 0.0 0.0 0.0 0.0 155.0 155.0
Total Other Expense Adjustments $3.2 $3.2 $6.9 $3.2 $3.3 $3.8 $3.6 $4.3 $3.9 $4.0 $161.3 $204.2
Total Operating Expenses $1,236.3 $1,179.2 $1,263.9 $1,217.0 $1,266.0 $1,277.7 $1,272.6 $1,277.1 $1,252.5 $1,285.0 $1,523.4 $15,319.0
Depreciation $204.2 $204.9 $206.6 $207.4 $208.9 $220.0 $222.5 $223.3 $225.1 $226.2 $228.5 $2,598.8
OPEB Liability Adjustment 36.0 35.2 413.4 35.5 36.2 413.1 36.2 412.9 36.0 35.9 413.0 1,939.2
GASB 68 Pension Expense Adjustment 3.7 3.3 (70.4) 3.4 3.8 (70.5) 3.8 (70.6) 3.7 3.6 88.2 (94.4)
Environmental Remediation 0.2 0.2 1.2 0.2 0.2 1.2 0.2 1.2 0.2 0.2 1.2 6.0
Total Expenses After Non-Cash Liability Adjs. $1,480.3 $1,422.9 $1,814.8 $1,463.4 $1,515.1 $1,841.4 $1,535.3 $1,844.0 $1,517.4 $1,550.9 $2,254.2 $19,768.5
Net Surplus/(Deficit) Before Subsidies & Debt Service ($651.4) ($638.7) ($890.0) ($527.9) ($564.8) ($899.7) ($595.3) ($875.7) ($559.1) ($648.6) ($1,334.8) ($8,799.3)
Subsidies $163.8 $380.7 $2,210.7 $432.7 $363.0 $533.1 $331.0 $577.6 $262.0 $384.5 $641.0 $6,659.2
Debt Service (231.8) (230.7) (230.3) (218.6) (174.6) (229.4) (229.4) (219.5) (203.5) (172.6) (233.5) (2,603.5)
Jul
$525.5
173.7
54.5
161.8 $915.5
$485.9
74.8
113.9
51.4
116.6
93.5
(0.2)$935.9
$45.0
13.3
5.5
23.3
33.3
65.1
61.9
65.1
16.4 $328.8
$3.5
0.2
0.0 $3.5
$1,268.2
$379.1
(229.4)
‐‐ Differences are due to rounding.
METROPOLITAN TRANSPORTATION AUTHORITYFebruary Financial Plan - 2017 Adopted Budget
Consolidated Accrual Statement of Operations By Category($ in millions)
$1,528.9
($613.4)
$221.1
35.8
3.6
IV-12
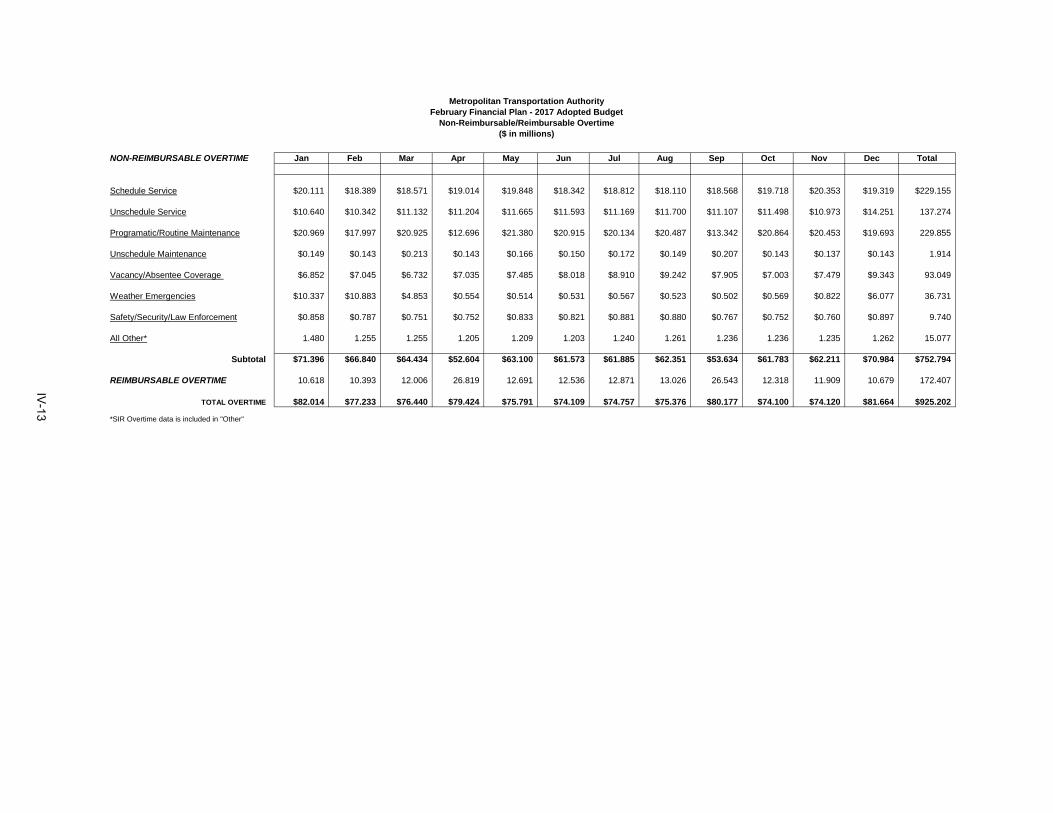
Metropolitan Transportation AuthorityFebruary Financial Plan - 2017 Adopted Budget
Non-Reimbursable/Reimbursable Overtime($ in millions)
NON-REIMBURSABLE OVERTIME Jan
Schedule Service $20.111 $18.389 $18.571 $19.014 $19.848 $18.342 $18.812 $18.110 $18.568 $19.718 $20.353 $19.319 $229.155
Unschedule Service $10.640 $10.342 $11.132 $11.204 $11.665 $11.593 $11.169 $11.700 $11.107 $11.498 $10.973 $14.251 137.274
Programatic/Routine Maintenance $20.969 $17.997 $20.925 $12.696 $21.380 $20.915 $20.134 $20.487 $13.342 $20.864 $20.453 $19.693 229.855
Unschedule Maintenance $0.149 $0.143 $0.213 $0.143 $0.166 $0.150 $0.172 $0.149 $0.207 $0.143 $0.137 $0.143 1.914
Vacancy/Absentee Coverage $6.852 $7.045 $6.732 $7.035 $7.485 $8.018 $8.910 $9.242 $7.905 $7.003 $7.479 $9.343 93.049
Weather Emergencies $10.337 $10.883 $4.853 $0.554 $0.514 $0.531 $0.567 $0.523 $0.502 $0.569 $0.822 $6.077 36.731
Safety/Security/Law Enforcement $0.858 $0.787 $0.751 $0.752 $0.833 $0.821 $0.881 $0.880 $0.767 $0.752 $0.760 $0.897 9.740
All Other* 1.480 1.255 1.255 1.205 1.209 1.203 1.240 1.261 1.236 1.236 1.235 1.262 15.077
Subtotal $71.396 $66.840 $64.434 $52.604 $63.100 $61.573 $61.885 $62.351 $53.634 $61.783 $62.211 $70.984 $752.794
REIMBURSABLE OVERTIME 10.618 10.393 12.006 26.819 12.691 12.536 12.871 13.026 26.543 12.318 11.909 10.679 172.407
TOTAL OVERTIME $82.014 $77.233 $76.440 $79.424 $75.791 $74.109 $74.757 $75.376 $80.177 $74.100 $74.120 $81.664 $925.202
*SIR Overtime data is included in "Other"
TotalFeb Mar Apr May Jun Jul Aug Sep Oct Nov Dec
IV-13
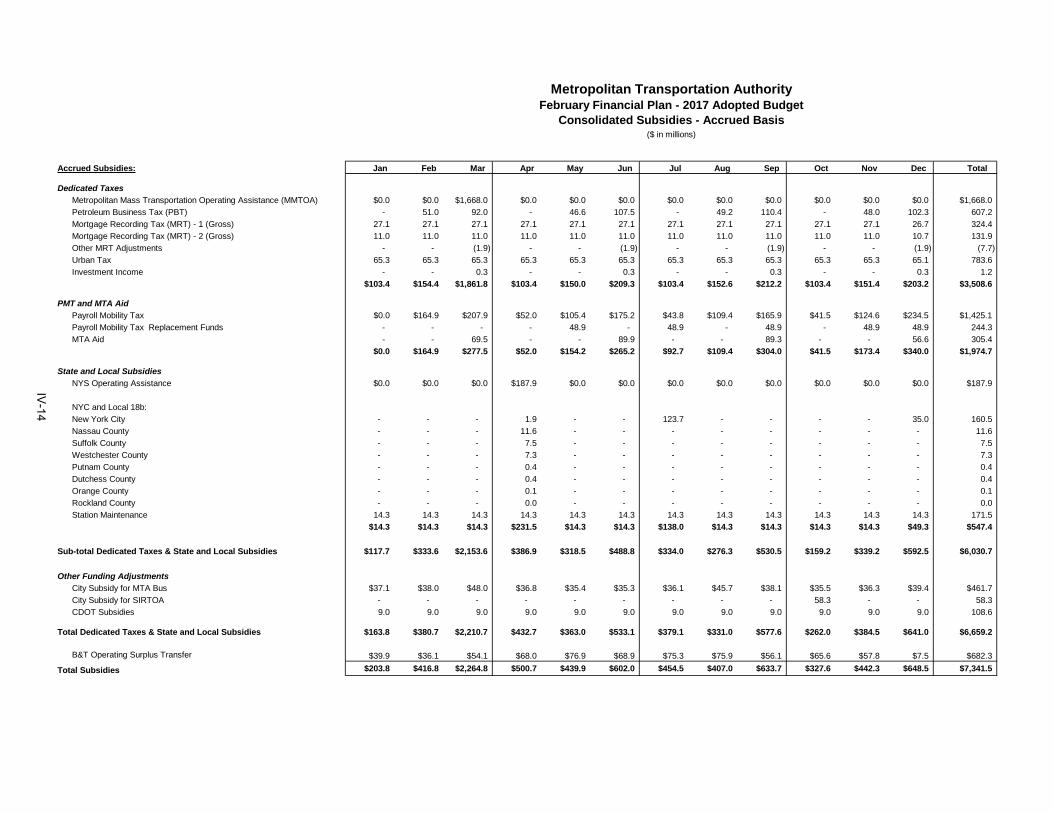
Accrued Subsidies: Jan Feb Mar Apr May Jun Jul Aug Sep Oct Nov Dec Total
Dedicated Taxes
Metropolitan Mass Transportation Operating Assistance (MMTOA) $0.0 $0.0 $1,668.0 $0.0 $0.0 $0.0 $0.0 $0.0 $0.0 $0.0 $0.0 $0.0 $1,668.0
Petroleum Business Tax (PBT) - 51.0 92.0 - 46.6 107.5 - 49.2 110.4 - 48.0 102.3 607.2
Mortgage Recording Tax (MRT) - 1 (Gross) 27.1 27.1 27.1 27.1 27.1 27.1 27.1 27.1 27.1 27.1 27.1 26.7 324.4
Mortgage Recording Tax (MRT) - 2 (Gross) 11.0 11.0 11.0 11.0 11.0 11.0 11.0 11.0 11.0 11.0 11.0 10.7 131.9
Other MRT Adjustments - - (1.9) - - (1.9) - - (1.9) - - (1.9) (7.7)
Urban Tax 65.3 65.3 65.3 65.3 65.3 65.3 65.3 65.3 65.3 65.3 65.3 65.1 783.6
Investment Income - - 0.3 - - 0.3 - - 0.3 - - 0.3 1.2
$103.4 $154.4 $1,861.8 $103.4 $150.0 $209.3 $103.4 $152.6 $212.2 $103.4 $151.4 $203.2 $3,508.6
PMT and MTA Aid
Payroll Mobility Tax $0.0 $164.9 $207.9 $52.0 $105.4 $175.2 $43.8 $109.4 $165.9 $41.5 $124.6 $234.5 $1,425.1
Payroll Mobility Tax Replacement Funds - - - - 48.9 - 48.9 - 48.9 - 48.9 48.9 244.3
MTA Aid - - 69.5 - - 89.9 - - 89.3 - - 56.6 305.4
$0.0 $164.9 $277.5 $52.0 $154.2 $265.2 $92.7 $109.4 $304.0 $41.5 $173.4 $340.0 $1,974.7
State and Local Subsidies
NYS Operating Assistance $0.0 $0.0 $0.0 $187.9 $0.0 $0.0 $0.0 $0.0 $0.0 $0.0 $0.0 $0.0 $187.9
NYC and Local 18b:
New York City - - - 1.9 - - 123.7 - - - - 35.0 160.5
Nassau County - - - 11.6 - - - - - - - - 11.6
Suffolk County - - - 7.5 - - - - - - - - 7.5
Westchester County - - - 7.3 - - - - - - - - 7.3
Putnam County - - - 0.4 - - - - - - - - 0.4
Dutchess County - - - 0.4 - - - - - - - - 0.4
Orange County - - - 0.1 - - - - - - - - 0.1
Rockland County - - - 0.0 - - - - - - - - 0.0
Station Maintenance 14.3 14.3 14.3 14.3 14.3 14.3 14.3 14.3 14.3 14.3 14.3 14.3 171.5
$14.3 $14.3 $14.3 $231.5 $14.3 $14.3 $138.0 $14.3 $14.3 $14.3 $14.3 $49.3 $547.4
Sub-total Dedicated Taxes & State and Local Subsidies $117.7 $333.6 $2,153.6 $386.9 $318.5 $488.8 $334.0 $276.3 $530.5 $159.2 $339.2 $592.5 $6,030.7
Other Funding Adjustments
City Subsidy for MTA Bus $37.1 $38.0 $48.0 $36.8 $35.4 $35.3 $36.1 $45.7 $38.1 $35.5 $36.3 $39.4 $461.7
City Subsidy for SIRTOA - - - - - - - - - 58.3 - - 58.3
CDOT Subsidies 9.0 9.0 9.0 9.0 9.0 9.0 9.0 9.0 9.0 9.0 9.0 9.0 108.6
Total Dedicated Taxes & State and Local Subsidies $163.8 $380.7 $2,210.7 $432.7 $363.0 $533.1 $379.1 $331.0 $577.6 $262.0 $384.5 $641.0 $6,659.2
B&T Operating Surplus Transfer $39.9 $36.1 $54.1 $68.0 $76.9 $68.9 $75.3 $75.9 $56.1 $65.6 $57.8 $7.5 $682.3
Total Subsidies $203.8 $416.8 $2,264.8 $500.7 $439.9 $602.0 $454.5 $407.0 $633.7 $327.6 $442.3 $648.5 $7,341.5
Metropolitan Transportation AuthorityFebruary Financial Plan - 2017 Adopted Budget
Consolidated Subsidies - Accrued Basis($ in millions)
IV-14
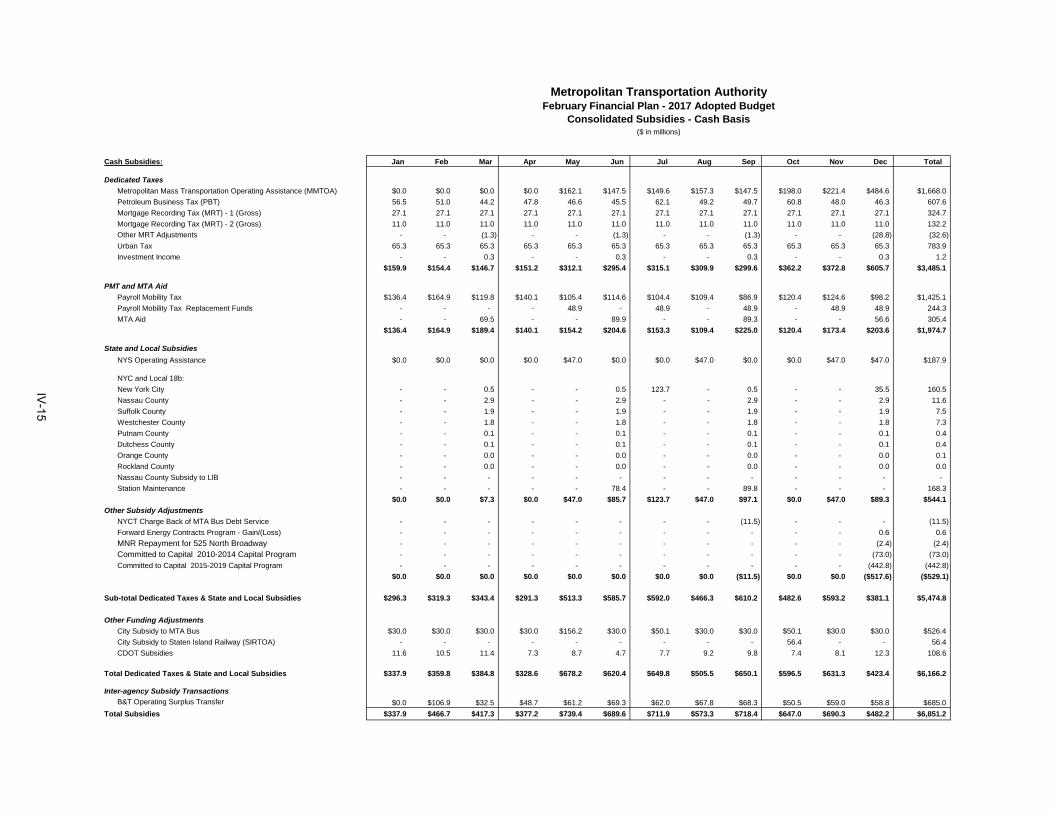
Cash Subsidies: Jan Feb Mar Apr May Jun Jul Aug Sep Oct Nov Dec Total
Dedicated Taxes
Metropolitan Mass Transportation Operating Assistance (MMTOA) $0.0 $0.0 $0.0 $0.0 $162.1 $147.5 $149.6 $157.3 $147.5 $198.0 $221.4 $484.6 $1,668.0
Petroleum Business Tax (PBT) 56.5 51.0 44.2 47.8 46.6 45.5 62.1 49.2 49.7 60.8 48.0 46.3 607.6
Mortgage Recording Tax (MRT) - 1 (Gross) 27.1 27.1 27.1 27.1 27.1 27.1 27.1 27.1 27.1 27.1 27.1 27.1 324.7
Mortgage Recording Tax (MRT) - 2 (Gross) 11.0 11.0 11.0 11.0 11.0 11.0 11.0 11.0 11.0 11.0 11.0 11.0 132.2
Other MRT Adjustments - - (1.3) - - (1.3) - - (1.3) - - (28.8) (32.6)
Urban Tax 65.3 65.3 65.3 65.3 65.3 65.3 65.3 65.3 65.3 65.3 65.3 65.3 783.9
Investment Income - - 0.3 - - 0.3 - - 0.3 - - 0.3 1.2
$159.9 $154.4 $146.7 $151.2 $312.1 $295.4 $315.1 $309.9 $299.6 $362.2 $372.8 $605.7 $3,485.1
PMT and MTA Aid
Payroll Mobility Tax $136.4 $164.9 $119.8 $140.1 $105.4 $114.6 $104.4 $109.4 $86.9 $120.4 $124.6 $98.2 $1,425.1
Payroll Mobility Tax Replacement Funds - - - - 48.9 - 48.9 - 48.9 - 48.9 48.9 244.3
MTA Aid - - 69.5 - - 89.9 - - 89.3 - - 56.6 305.4
$136.4 $164.9 $189.4 $140.1 $154.2 $204.6 $153.3 $109.4 $225.0 $120.4 $173.4 $203.6 $1,974.7
State and Local Subsidies
NYS Operating Assistance $0.0 $0.0 $0.0 $0.0 $47.0 $0.0 $0.0 $47.0 $0.0 $0.0 $47.0 $47.0 $187.9
NYC and Local 18b:
New York City - - 0.5 - - 0.5 123.7 - 0.5 - - 35.5 160.5
Nassau County - - 2.9 - - 2.9 - - 2.9 - - 2.9 11.6
Suffolk County - - 1.9 - - 1.9 - - 1.9 - - 1.9 7.5
Westchester County - - 1.8 - - 1.8 - - 1.8 - - 1.8 7.3
Putnam County - - 0.1 - - 0.1 - - 0.1 - - 0.1 0.4
Dutchess County - - 0.1 - - 0.1 - - 0.1 - - 0.1 0.4
Orange County - - 0.0 - - 0.0 - - 0.0 - - 0.0 0.1
Rockland County - - 0.0 - - 0.0 - - 0.0 - - 0.0 0.0
Nassau County Subsidy to LIB - - - - - - - - - - - - -
Station Maintenance - - - - - 78.4 - - 89.8 - - - 168.3
$0.0 $0.0 $7.3 $0.0 $47.0 $85.7 $123.7 $47.0 $97.1 $0.0 $47.0 $89.3 $544.1
Other Subsidy Adjustments
NYCT Charge Back of MTA Bus Debt Service - - - - - - - - (11.5) - - - (11.5)
Forward Energy Contracts Program - Gain/(Loss) - - - - - - - - - - - 0.6 0.6
MNR Repayment for 525 North Broadway - - - - - - - - - - - (2.4) (2.4)
Committed to Capital 2010-2014 Capital Program - - - - - - - - - - - (73.0) (73.0)
Committed to Capital 2015-2019 Capital Program - - - - - - - - - - - (442.8) (442.8)
$0.0 $0.0 $0.0 $0.0 $0.0 $0.0 $0.0 $0.0 ($11.5) $0.0 $0.0 ($517.6) ($529.1)
Sub-total Dedicated Taxes & State and Local Subsidies $296.3 $319.3 $343.4 $291.3 $513.3 $585.7 $592.0 $466.3 $610.2 $482.6 $593.2 $381.1 $5,474.8
Other Funding Adjustments
City Subsidy to MTA Bus $30.0 $30.0 $30.0 $30.0 $156.2 $30.0 $50.1 $30.0 $30.0 $50.1 $30.0 $30.0 $526.4
City Subsidy to Staten Island Railway (SIRTOA) - - - - - - - - - 56.4 - - 56.4
CDOT Subsidies 11.6 10.5 11.4 7.3 8.7 4.7 7.7 9.2 9.8 7.4 8.1 12.3 108.6
Total Dedicated Taxes & State and Local Subsidies $337.9 $359.8 $384.8 $328.6 $678.2 $620.4 $649.8 $505.5 $650.1 $596.5 $631.3 $423.4 $6,166.2
Inter-agency Subsidy Transactions
B&T Operating Surplus Transfer $0.0 $106.9 $32.5 $48.7 $61.2 $69.3 $62.0 $67.8 $68.3 $50.5 $59.0 $58.8 $685.0
Total Subsidies $337.9 $466.7 $417.3 $377.2 $739.4 $689.6 $711.9 $573.3 $718.4 $647.0 $690.3 $482.2 $6,851.2
Metropolitan Transportation AuthorityFebruary Financial Plan - 2017 Adopted Budget
Consolidated Subsidies - Cash Basis($ in millions)
IV-15
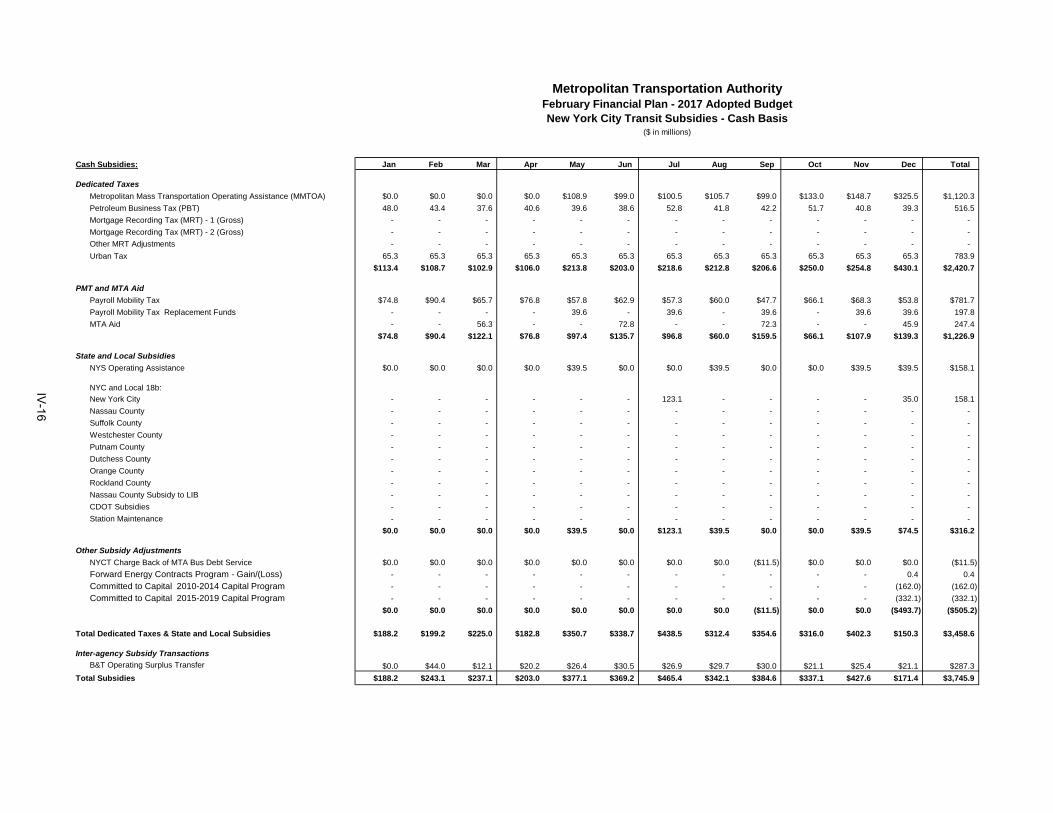
Cash Subsidies: Jan Feb Mar Apr May Jun Jul Aug Sep Oct Nov Dec Total
Dedicated Taxes
Metropolitan Mass Transportation Operating Assistance (MMTOA) $0.0 $0.0 $0.0 $0.0 $108.9 $99.0 $100.5 $105.7 $99.0 $133.0 $148.7 $325.5 $1,120.3
Petroleum Business Tax (PBT) 48.0 43.4 37.6 40.6 39.6 38.6 52.8 41.8 42.2 51.7 40.8 39.3 516.5
Mortgage Recording Tax (MRT) - 1 (Gross) - - - - - - - - - - - - -
Mortgage Recording Tax (MRT) - 2 (Gross) - - - - - - - - - - - - -
Other MRT Adjustments - - - - - - - - - - - - -
Urban Tax 65.3 65.3 65.3 65.3 65.3 65.3 65.3 65.3 65.3 65.3 65.3 65.3 783.9
$113.4 $108.7 $102.9 $106.0 $213.8 $203.0 $218.6 $212.8 $206.6 $250.0 $254.8 $430.1 $2,420.7
PMT and MTA Aid
Payroll Mobility Tax $74.8 $90.4 $65.7 $76.8 $57.8 $62.9 $57.3 $60.0 $47.7 $66.1 $68.3 $53.8 $781.7
Payroll Mobility Tax Replacement Funds - - - - 39.6 - 39.6 - 39.6 - 39.6 39.6 197.8
MTA Aid - - 56.3 - - 72.8 - - 72.3 - - 45.9 247.4
$74.8 $90.4 $122.1 $76.8 $97.4 $135.7 $96.8 $60.0 $159.5 $66.1 $107.9 $139.3 $1,226.9
State and Local Subsidies
NYS Operating Assistance $0.0 $0.0 $0.0 $0.0 $39.5 $0.0 $0.0 $39.5 $0.0 $0.0 $39.5 $39.5 $158.1
NYC and Local 18b:
New York City - - - - - - 123.1 - - - - 35.0 158.1
Nassau County - - - - - - - - - - - - -
Suffolk County - - - - - - - - - - - - -
Westchester County - - - - - - - - - - - - -
Putnam County - - - - - - - - - - - - -
Dutchess County - - - - - - - - - - - - -
Orange County - - - - - - - - - - - - -
Rockland County - - - - - - - - - - - - -
Nassau County Subsidy to LIB - - - - - - - - - - - - -
CDOT Subsidies - - - - - - - - - - - - -
Station Maintenance - - - - - - - - - - - - -
$0.0 $0.0 $0.0 $0.0 $39.5 $0.0 $123.1 $39.5 $0.0 $0.0 $39.5 $74.5 $316.2
Other Subsidy Adjustments
NYCT Charge Back of MTA Bus Debt Service $0.0 $0.0 $0.0 $0.0 $0.0 $0.0 $0.0 $0.0 ($11.5) $0.0 $0.0 $0.0 ($11.5)
Forward Energy Contracts Program - Gain/(Loss) - - - - - - - - - - - 0.4 0.4
Committed to Capital 2010-2014 Capital Program - - - - - - - - - - - (162.0) (162.0)
Committed to Capital 2015-2019 Capital Program - - - - - - - - - - - (332.1) (332.1)
$0.0 $0.0 $0.0 $0.0 $0.0 $0.0 $0.0 $0.0 ($11.5) $0.0 $0.0 ($493.7) ($505.2)
Total Dedicated Taxes & State and Local Subsidies $188.2 $199.2 $225.0 $182.8 $350.7 $338.7 $438.5 $312.4 $354.6 $316.0 $402.3 $150.3 $3,458.6
Inter-agency Subsidy Transactions
B&T Operating Surplus Transfer $0.0 $44.0 $12.1 $20.2 $26.4 $30.5 $26.9 $29.7 $30.0 $21.1 $25.4 $21.1 $287.3
Total Subsidies $188.2 $243.1 $237.1 $203.0 $377.1 $369.2 $465.4 $342.1 $384.6 $337.1 $427.6 $171.4 $3,745.9
($ in millions)
Metropolitan Transportation AuthorityFebruary Financial Plan - 2017 Adopted BudgetNew York City Transit Subsidies - Cash Basis
IV-16
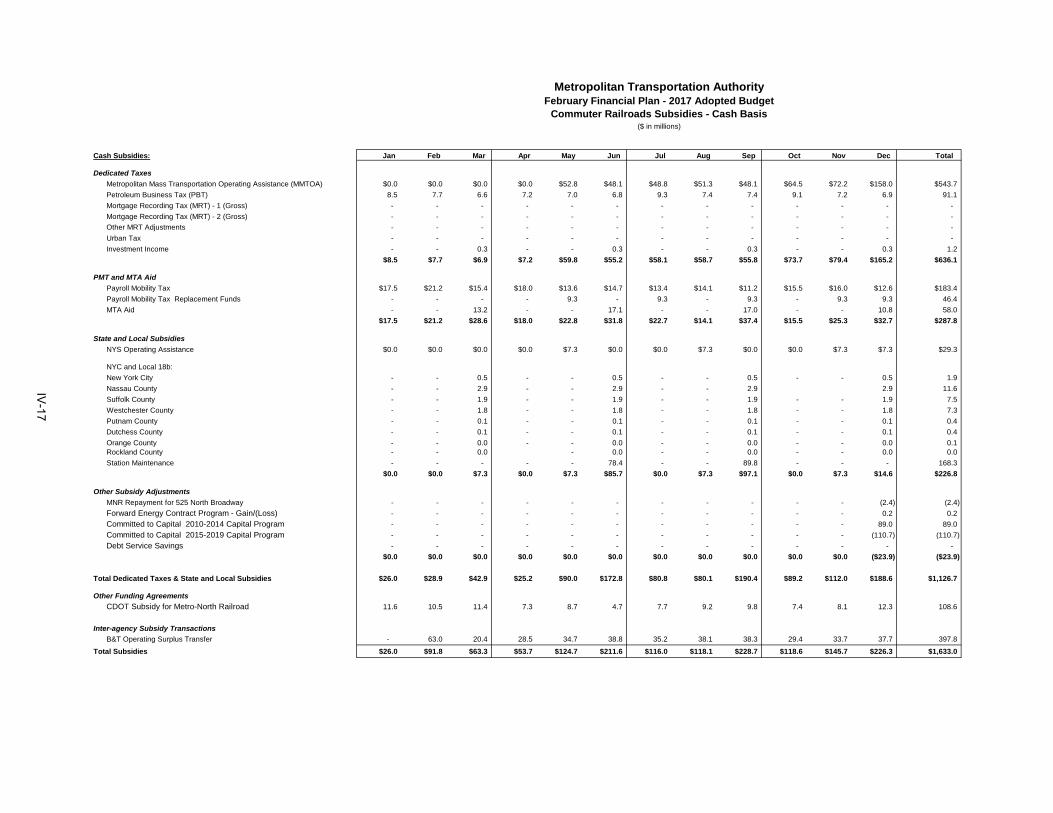
Cash Subsidies: Jan Feb Mar Apr May Jun Jul Aug Sep Oct Nov Dec Total
Dedicated Taxes
Metropolitan Mass Transportation Operating Assistance (MMTOA) $0.0 $0.0 $0.0 $0.0 $52.8 $48.1 $48.8 $51.3 $48.1 $64.5 $72.2 $158.0 $543.7
Petroleum Business Tax (PBT) 8.5 7.7 6.6 7.2 7.0 6.8 9.3 7.4 7.4 9.1 7.2 6.9 91.1
Mortgage Recording Tax (MRT) - 1 (Gross) - - - - - - - - - - - - -
Mortgage Recording Tax (MRT) - 2 (Gross) - - - - - - - - - - - - -
Other MRT Adjustments - - - - - - - - - - - - -
Urban Tax - - - - - - - - - - - - -
Investment Income - - 0.3 - - 0.3 - - 0.3 - - 0.3 1.2
$8.5 $7.7 $6.9 $7.2 $59.8 $55.2 $58.1 $58.7 $55.8 $73.7 $79.4 $165.2 $636.1
PMT and MTA Aid
Payroll Mobility Tax $17.5 $21.2 $15.4 $18.0 $13.6 $14.7 $13.4 $14.1 $11.2 $15.5 $16.0 $12.6 $183.4
Payroll Mobility Tax Replacement Funds - - - - 9.3 - 9.3 - 9.3 - 9.3 9.3 46.4
MTA Aid - - 13.2 - - 17.1 - - 17.0 - - 10.8 58.0
$17.5 $21.2 $28.6 $18.0 $22.8 $31.8 $22.7 $14.1 $37.4 $15.5 $25.3 $32.7 $287.8
State and Local Subsidies
NYS Operating Assistance $0.0 $0.0 $0.0 $0.0 $7.3 $0.0 $0.0 $7.3 $0.0 $0.0 $7.3 $7.3 $29.3
NYC and Local 18b:
New York City - - 0.5 - - 0.5 - - 0.5 - - 0.5 1.9
Nassau County - - 2.9 - - 2.9 - - 2.9 2.9 11.6
Suffolk County - - 1.9 - - 1.9 - - 1.9 - - 1.9 7.5
Westchester County - - 1.8 - - 1.8 - - 1.8 - - 1.8 7.3
Putnam County - - 0.1 - - 0.1 - - 0.1 - - 0.1 0.4
Dutchess County - - 0.1 - - 0.1 - - 0.1 - - 0.1 0.4
Orange County - - 0.0 - - 0.0 - - 0.0 - - 0.0 0.1 Rockland County - - 0.0 - 0.0 - - 0.0 - - 0.0 0.0
Station Maintenance - - - - - 78.4 - - 89.8 - - - 168.3
$0.0 $0.0 $7.3 $0.0 $7.3 $85.7 $0.0 $7.3 $97.1 $0.0 $7.3 $14.6 $226.8
Other Subsidy Adjustments
MNR Repayment for 525 North Broadway - - - - - - - - - - - (2.4) (2.4)
Forward Energy Contract Program - Gain/(Loss) - - - - - - - - - - - 0.2 0.2
Committed to Capital 2010-2014 Capital Program - - - - - - - - - - - 89.0 89.0
Committed to Capital 2015-2019 Capital Program - - - - - - - - - - - (110.7) (110.7)
Debt Service Savings - - - - - - - - - - - - -
$0.0 $0.0 $0.0 $0.0 $0.0 $0.0 $0.0 $0.0 $0.0 $0.0 $0.0 ($23.9) ($23.9)
Total Dedicated Taxes & State and Local Subsidies $26.0 $28.9 $42.9 $25.2 $90.0 $172.8 $80.8 $80.1 $190.4 $89.2 $112.0 $188.6 $1,126.7
Other Funding Agreements
CDOT Subsidy for Metro-North Railroad 11.6 10.5 11.4 7.3 8.7 4.7 7.7 9.2 9.8 7.4 8.1 12.3 108.6
Inter-agency Subsidy Transactions
B&T Operating Surplus Transfer - 63.0 20.4 28.5 34.7 38.8 35.2 38.1 38.3 29.4 33.7 37.7 397.8
Total Subsidies $26.0 $91.8 $63.3 $53.7 $124.7 $211.6 $116.0 $118.1 $228.7 $118.6 $145.7 $226.3 $1,633.0
($ in millions)
Metropolitan Transportation AuthorityFebruary Financial Plan - 2017 Adopted Budget
Commuter Railroads Subsidies - Cash Basis
IV-17
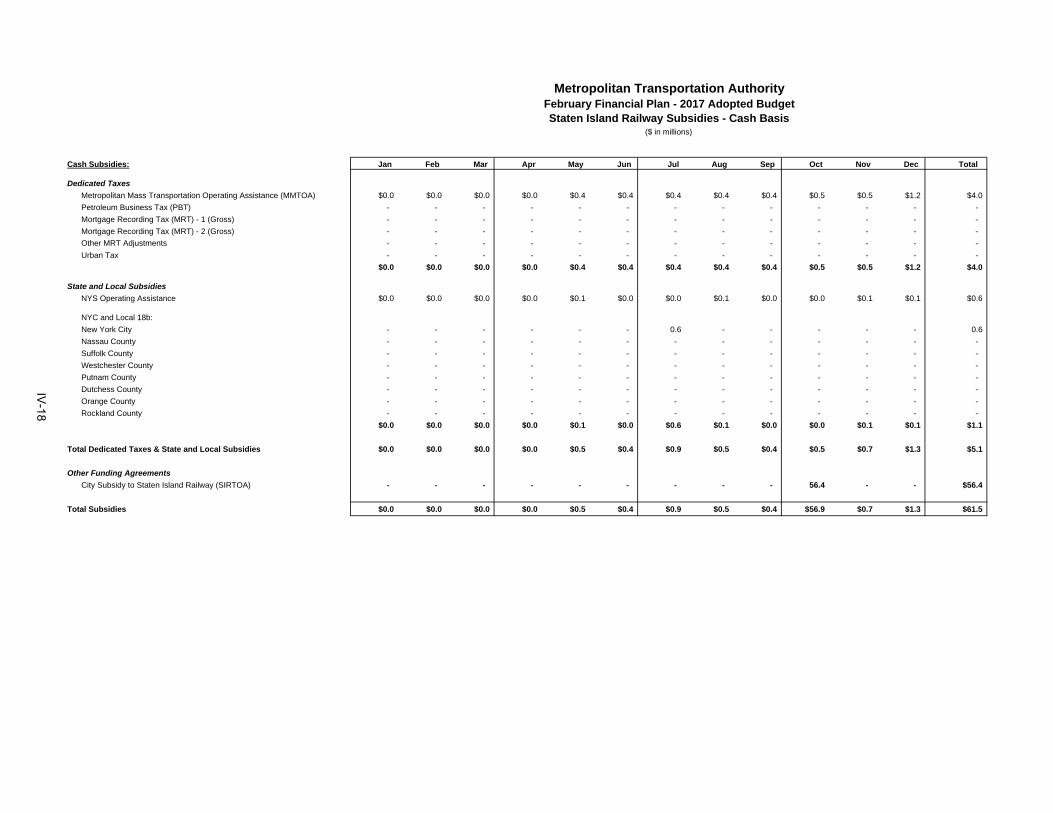
Cash Subsidies: Jan Feb Mar Apr May Jun Jul Aug Sep Oct Nov Dec Total
Dedicated Taxes
Metropolitan Mass Transportation Operating Assistance (MMTOA) $0.0 $0.0 $0.0 $0.0 $0.4 $0.4 $0.4 $0.4 $0.4 $0.5 $0.5 $1.2 $4.0
Petroleum Business Tax (PBT) - - - - - - - - - - - - -
Mortgage Recording Tax (MRT) - 1 (Gross) - - - - - - - - - - - - -
Mortgage Recording Tax (MRT) - 2 (Gross) - - - - - - - - - - - - -
Other MRT Adjustments - - - - - - - - - - - - -
Urban Tax - - - - - - - - - - - - -
$0.0 $0.0 $0.0 $0.0 $0.4 $0.4 $0.4 $0.4 $0.4 $0.5 $0.5 $1.2 $4.0
State and Local Subsidies
NYS Operating Assistance $0.0 $0.0 $0.0 $0.0 $0.1 $0.0 $0.0 $0.1 $0.0 $0.0 $0.1 $0.1 $0.6
NYC and Local 18b:
New York City - - - - - - 0.6 - - - - - 0.6
Nassau County - - - - - - - - - - - - -
Suffolk County - - - - - - - - - - - - -
Westchester County - - - - - - - - - - - - -
Putnam County - - - - - - - - - - - - -
Dutchess County - - - - - - - - - - - - -
Orange County - - - - - - - - - - - - -
Rockland County - - - - - - - - - - - - -
$0.0 $0.0 $0.0 $0.0 $0.1 $0.0 $0.6 $0.1 $0.0 $0.0 $0.1 $0.1 $1.1
Total Dedicated Taxes & State and Local Subsidies $0.0 $0.0 $0.0 $0.0 $0.5 $0.4 $0.9 $0.5 $0.4 $0.5 $0.7 $1.3 $5.1
Other Funding Agreements
City Subsidy to Staten Island Railway (SIRTOA) - - - - - - - - - 56.4 - - $56.4
Total Subsidies $0.0 $0.0 $0.0 $0.0 $0.5 $0.4 $0.9 $0.5 $0.4 $56.9 $0.7 $1.3 $61.5
($ in millions)
Metropolitan Transportation AuthorityFebruary Financial Plan - 2017 Adopted BudgetStaten Island Railway Subsidies - Cash Basis
IV-18
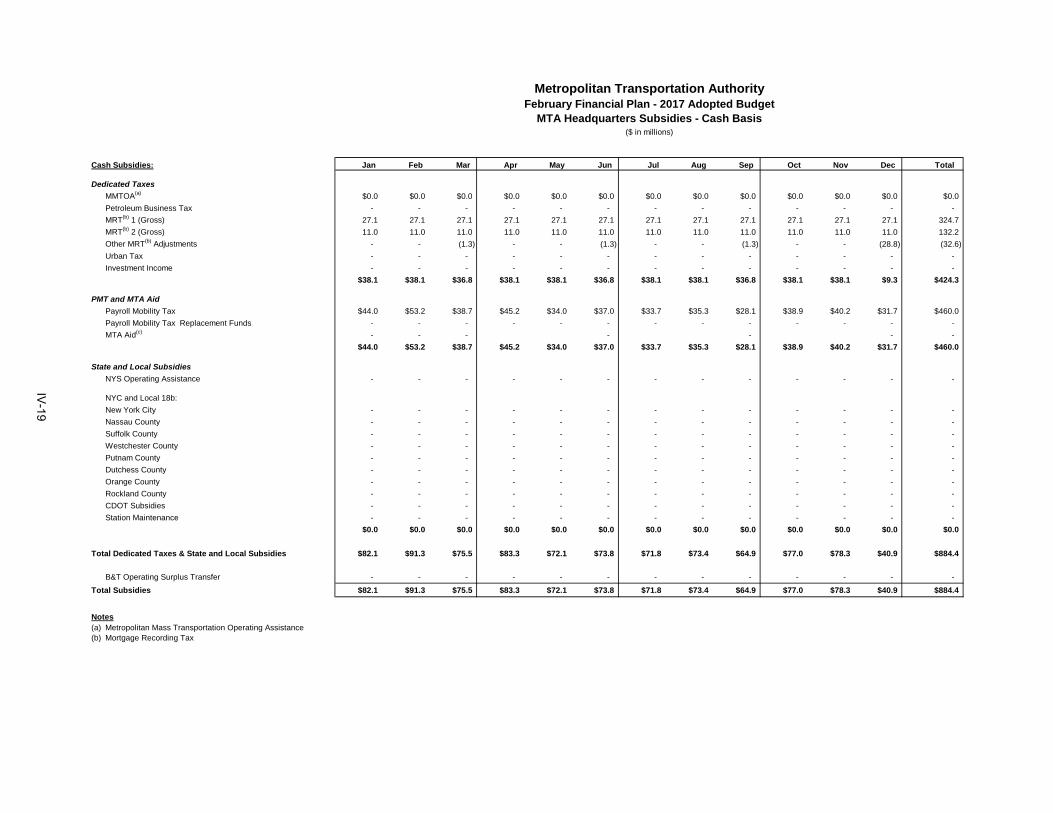
Cash Subsidies: Jan Feb Mar Apr May Jun Jul Aug Sep Oct Nov Dec Total
Dedicated Taxes
MMTOA(a) $0.0 $0.0 $0.0 $0.0 $0.0 $0.0 $0.0 $0.0 $0.0 $0.0 $0.0 $0.0 $0.0
Petroleum Business Tax - - - - - - - - - - - - -
MRT(b) 1 (Gross) 27.1 27.1 27.1 27.1 27.1 27.1 27.1 27.1 27.1 27.1 27.1 27.1 324.7
MRT(b) 2 (Gross) 11.0 11.0 11.0 11.0 11.0 11.0 11.0 11.0 11.0 11.0 11.0 11.0 132.2
Other MRT(b) Adjustments - - (1.3) - - (1.3) - - (1.3) - - (28.8) (32.6)
Urban Tax - - - - - - - - - - - - -
Investment Income - - - - - - - - - - - - -
$38.1 $38.1 $36.8 $38.1 $38.1 $36.8 $38.1 $38.1 $36.8 $38.1 $38.1 $9.3 $424.3
PMT and MTA Aid
Payroll Mobility Tax $44.0 $53.2 $38.7 $45.2 $34.0 $37.0 $33.7 $35.3 $28.1 $38.9 $40.2 $31.7 $460.0
Payroll Mobility Tax Replacement Funds - - - - - - - - - - - - -
MTA Aid(c) - - - - - - -
$44.0 $53.2 $38.7 $45.2 $34.0 $37.0 $33.7 $35.3 $28.1 $38.9 $40.2 $31.7 $460.0
State and Local Subsidies
NYS Operating Assistance - - - - - - - - - - - - -
NYC and Local 18b:
New York City - - - - - - - - - - - - -
Nassau County - - - - - - - - - - - - -
Suffolk County - - - - - - - - - - - - -
Westchester County - - - - - - - - - - - - -
Putnam County - - - - - - - - - - - - -
Dutchess County - - - - - - - - - - - - -
Orange County - - - - - - - - - - - - -
Rockland County - - - - - - - - - - - - -
CDOT Subsidies - - - - - - - - - - - - -
Station Maintenance - - - - - - - - - - - - -
$0.0 $0.0 $0.0 $0.0 $0.0 $0.0 $0.0 $0.0 $0.0 $0.0 $0.0 $0.0 $0.0
Total Dedicated Taxes & State and Local Subsidies $82.1 $91.3 $75.5 $83.3 $72.1 $73.8 $71.8 $73.4 $64.9 $77.0 $78.3 $40.9 $884.4
B&T Operating Surplus Transfer - - - - - - - - - - - - -
Total Subsidies $82.1 $91.3 $75.5 $83.3 $72.1 $73.8 $71.8 $73.4 $64.9 $77.0 $78.3 $40.9 $884.4
Notes(a) Metropolitan Mass Transportation Operating Assistance(b) Mortgage Recording Tax
($ in millions)
Metropolitan Transportation AuthorityFebruary Financial Plan - 2017 Adopted Budget
MTA Headquarters Subsidies - Cash Basis
IV-19

Cash Subsidies: Jan Feb Mar Apr May Jun Jul Aug Sep Oct Nov Dec Total
City Subsidy to MTA Bus $30.0 $30.0 $30.0 $30.0 $156.2 $30.0 $50.1 $30.0 $30.0 $50.1 $30.0 $30.0 $526.4
($ in millions)
Metropolitan Transportation AuthorityFebruary Financial Plan - 2017 Adopted Budget
MTA Bus Company Subsidies - Cash Basis
IV-20
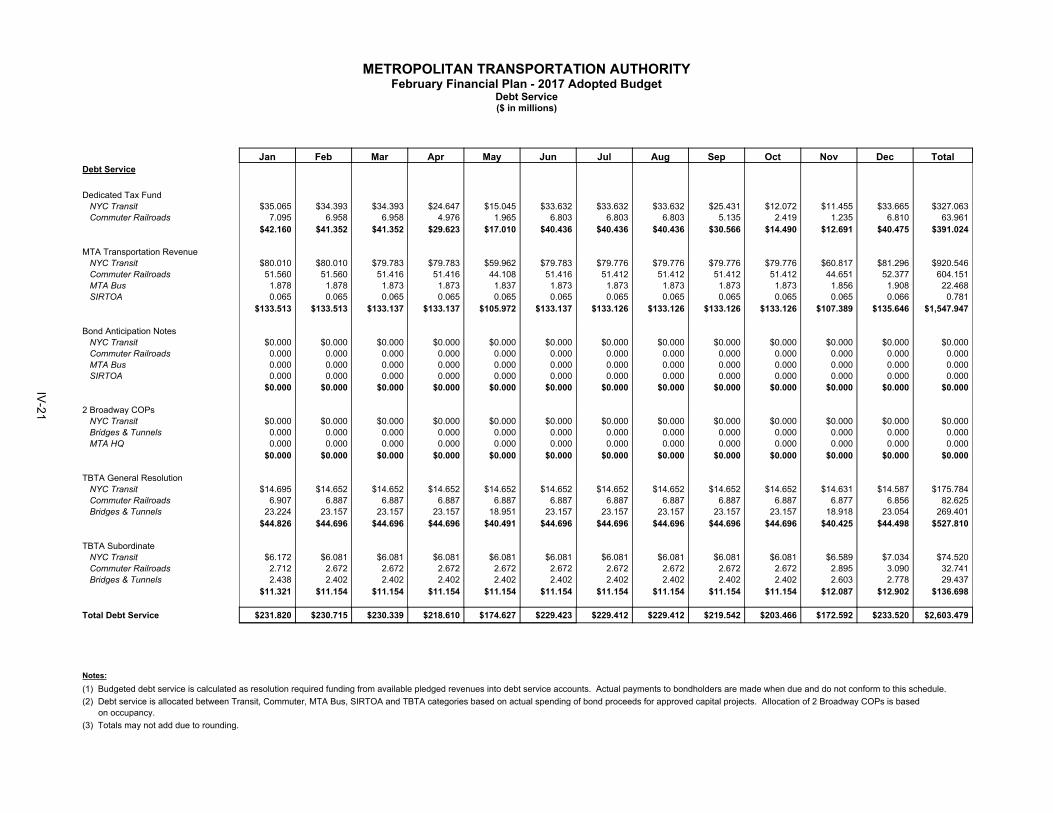
METROPOLITAN TRANSPORTATION AUTHORITYFebruary Financial Plan - 2017 Adopted Budget
Debt Service($ in millions)
Budget
Jan Feb Mar Apr May Jun Jul Aug Sep Oct Nov Dec TotalDebt Service
Dedicated Tax Fund NYC Transit $35.065 $34.393 $34.393 $24.647 $15.045 $33.632 $33.632 $33.632 $25.431 $12.072 $11.455 $33.665 $327.063 Commuter Railroads 7.095 6.958 6.958 4.976 1.965 6.803 6.803 6.803 5.135 2.419 1.235 6.810 63.961
$42.160 $41.352 $41.352 $29.623 $17.010 $40.436 $40.436 $40.436 $30.566 $14.490 $12.691 $40.475 $391.024
MTA Transportation Revenue NYC Transit $80.010 $80.010 $79.783 $79.783 $59.962 $79.783 $79.776 $79.776 $79.776 $79.776 $60.817 $81.296 $920.546 Commuter Railroads 51.560 51.560 51.416 51.416 44.108 51.416 51.412 51.412 51.412 51.412 44.651 52.377 604.151 MTA Bus 1.878 1.878 1.873 1.873 1.837 1.873 1.873 1.873 1.873 1.873 1.856 1.908 22.468 SIRTOA 0.065 0.065 0.065 0.065 0.065 0.065 0.065 0.065 0.065 0.065 0.065 0.066 0.781 NYC Transit $133.513 $133.513 $133.137 $133.137 $105.972 $133.137 $133.126 $133.126 $133.126 $133.126 $107.389 $135.646 $1,547.947
Bond Anticipation Notes NYC Transit $0.000 $0.000 $0.000 $0.000 $0.000 $0.000 $0.000 $0.000 $0.000 $0.000 $0.000 $0.000 $0.000 Commuter Railroads 0.000 0.000 0.000 0.000 0.000 0.000 0.000 0.000 0.000 0.000 0.000 0.000 0.000 MTA Bus 0.000 0.000 0.000 0.000 0.000 0.000 0.000 0.000 0.000 0.000 0.000 0.000 0.000 SIRTOA 0.000 0.000 0.000 0.000 0.000 0.000 0.000 0.000 0.000 0.000 0.000 0.000 0.000
NYC Transit $0.000 $0.000 $0.000 $0.000 $0.000 $0.000 $0.000 $0.000 $0.000 $0.000 $0.000 $0.000 $0.000
2 Broadway COPs NYC Transit $0.000 $0.000 $0.000 $0.000 $0.000 $0.000 $0.000 $0.000 $0.000 $0.000 $0.000 $0.000 $0.000 Bridges & Tunnels 0.000 0.000 0.000 0.000 0.000 0.000 0.000 0.000 0.000 0.000 0.000 0.000 0.000 MTA HQ 0.000 0.000 0.000 0.000 0.000 0.000 0.000 0.000 0.000 0.000 0.000 0.000 0.000
NYC Transit $0.000 $0.000 $0.000 $0.000 $0.000 $0.000 $0.000 $0.000 $0.000 $0.000 $0.000 $0.000 $0.000
TBTA General Resolution NYC Transit $14.695 $14.652 $14.652 $14.652 $14.652 $14.652 $14.652 $14.652 $14.652 $14.652 $14.631 $14.587 $175.784 Commuter Railroads 6.907 6.887 6.887 6.887 6.887 6.887 6.887 6.887 6.887 6.887 6.877 6.856 82.625 Bridges & Tunnels 23.224 23.157 23.157 23.157 18.951 23.157 23.157 23.157 23.157 23.157 18.918 23.054 269.401
NYC Transit $44.826 $44.696 $44.696 $44.696 $40.491 $44.696 $44.696 $44.696 $44.696 $44.696 $40.425 $44.498 $527.810
TBTA Subordinate NYC Transit $6.172 $6.081 $6.081 $6.081 $6.081 $6.081 $6.081 $6.081 $6.081 $6.081 $6.589 $7.034 $74.520 Commuter Railroads 2.712 2.672 2.672 2.672 2.672 2.672 2.672 2.672 2.672 2.672 2.895 3.090 32.741 Bridges & Tunnels 2.438 2.402 2.402 2.402 2.402 2.402 2.402 2.402 2.402 2.402 2.603 2.778 29.437
$11.321 $11.154 $11.154 $11.154 $11.154 $11.154 $11.154 $11.154 $11.154 $11.154 $12.087 $12.902 $136.698
Total Debt Service $231.820 $230.715 $230.339 $218.610 $174.627 $229.423 $229.412 $229.412 $219.542 $203.466 $172.592 $233.520 $2,603.479
Notes:(1) Budgeted debt service is calculated as resolution required funding from available pledged revenues into debt service accounts. Actual payments to bondholders are made when due and do not conform to this schedule.(2) Debt service is allocated between Transit, Commuter, MTA Bus, SIRTOA and TBTA categories based on actual spending of bond proceeds for approved capital projects. Allocation of 2 Broadway COPs is based
on occupancy.(3) Totals may not add due to rounding.
IV-21
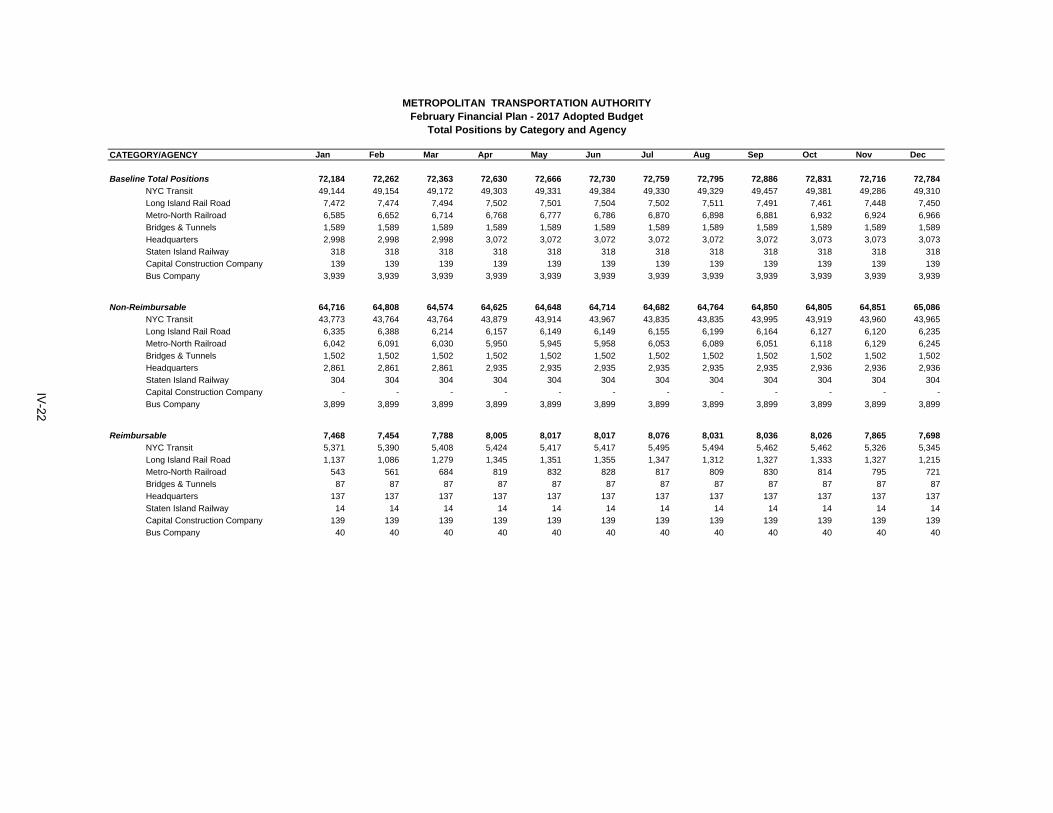
Jan Feb Mar Apr May Jun Jul Aug Sep Oct Nov Dec
Baseline Total Positions 72,184 72,262 72,363 72,630 72,666 72,730 72,759 72,795 72,886 72,831 72,716 72,784
NYC Transit 49,144 49,154 49,172 49,303 49,331 49,384 49,330 49,329 49,457 49,381 49,286 49,310
Long Island Rail Road 7,472 7,474 7,494 7,502 7,501 7,504 7,502 7,511 7,491 7,461 7,448 7,450
Metro-North Railroad 6,585 6,652 6,714 6,768 6,777 6,786 6,870 6,898 6,881 6,932 6,924 6,966
Bridges & Tunnels 1,589 1,589 1,589 1,589 1,589 1,589 1,589 1,589 1,589 1,589 1,589 1,589
Headquarters 2,998 2,998 2,998 3,072 3,072 3,072 3,072 3,072 3,072 3,073 3,073 3,073
Staten Island Railway 318 318 318 318 318 318 318 318 318 318 318 318
Capital Construction Company 139 139 139 139 139 139 139 139 139 139 139 139
Bus Company 3,939 3,939 3,939 3,939 3,939 3,939 3,939 3,939 3,939 3,939 3,939 3,939
Non-Reimbursable 64,716 64,808 64,574 64,625 64,648 64,714 64,682 64,764 64,850 64,805 64,851 65,086
NYC Transit 43,773 43,764 43,764 43,879 43,914 43,967 43,835 43,835 43,995 43,919 43,960 43,965
Long Island Rail Road 6,335 6,388 6,214 6,157 6,149 6,149 6,155 6,199 6,164 6,127 6,120 6,235
Metro-North Railroad 6,042 6,091 6,030 5,950 5,945 5,958 6,053 6,089 6,051 6,118 6,129 6,245
Bridges & Tunnels 1,502 1,502 1,502 1,502 1,502 1,502 1,502 1,502 1,502 1,502 1,502 1,502
Headquarters 2,861 2,861 2,861 2,935 2,935 2,935 2,935 2,935 2,935 2,936 2,936 2,936
Staten Island Railway 304 304 304 304 304 304 304 304 304 304 304 304
Capital Construction Company - - - - - - - - - - - -
Bus Company 3,899 3,899 3,899 3,899 3,899 3,899 3,899 3,899 3,899 3,899 3,899 3,899
Reimbursable 7,468 7,454 7,788 8,005 8,017 8,017 8,076 8,031 8,036 8,026 7,865 7,698
NYC Transit 5,371 5,390 5,408 5,424 5,417 5,417 5,495 5,494 5,462 5,462 5,326 5,345
Long Island Rail Road 1,137 1,086 1,279 1,345 1,351 1,355 1,347 1,312 1,327 1,333 1,327 1,215
Metro-North Railroad 543 561 684 819 832 828 817 809 830 814 795 721
Bridges & Tunnels 87 87 87 87 87 87 87 87 87 87 87 87
Headquarters 137 137 137 137 137 137 137 137 137 137 137 137
Staten Island Railway 14 14 14 14 14 14 14 14 14 14 14 14
Capital Construction Company 139 139 139 139 139 139 139 139 139 139 139 139
Bus Company 40 40 40 40 40 40 40 40 40 40 40 40
CATEGORY/AGENCY
METROPOLITAN TRANSPORTATION AUTHORITYFebruary Financial Plan - 2017 Adopted Budget
Total Positions by Category and Agency
IV-22
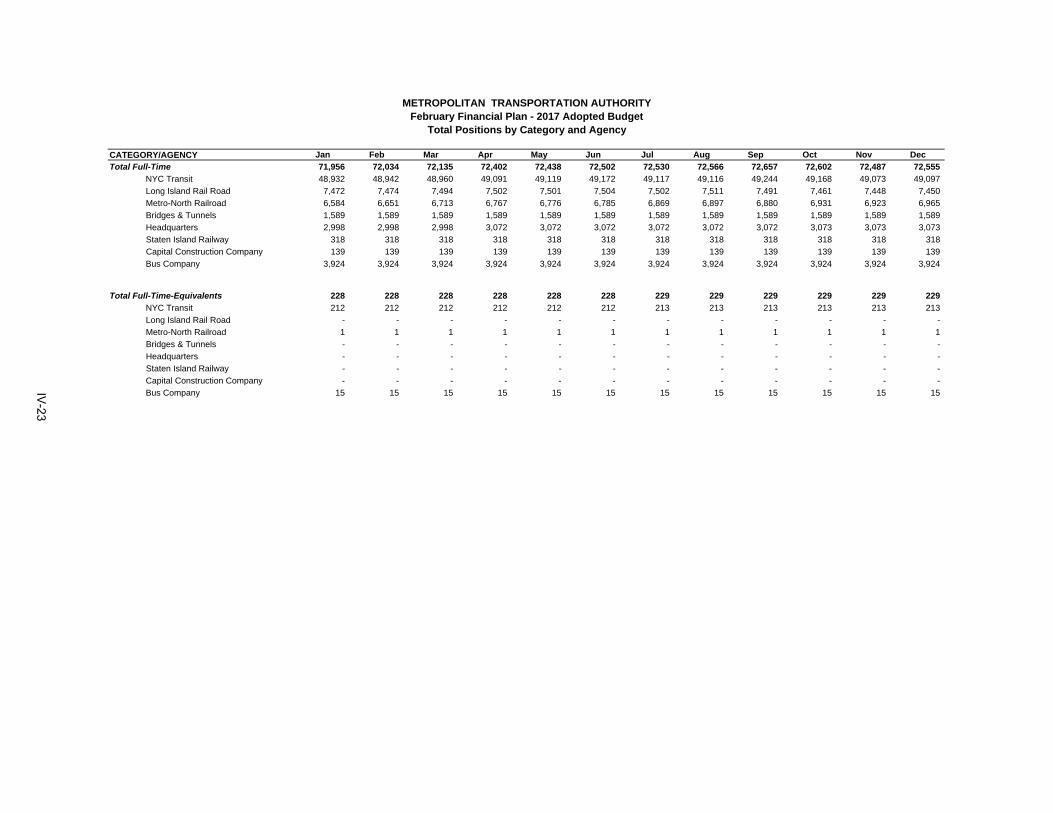
Jan Feb Mar Apr May Jun Jul Aug Sep Oct Nov DecCATEGORY/AGENCY
METROPOLITAN TRANSPORTATION AUTHORITYFebruary Financial Plan - 2017 Adopted Budget
Total Positions by Category and Agency
Total Full-Time 71,956 72,034 72,135 72,402 72,438 72,502 72,530 72,566 72,657 72,602 72,487 72,555
NYC Transit 48,932 48,942 48,960 49,091 49,119 49,172 49,117 49,116 49,244 49,168 49,073 49,097
Long Island Rail Road 7,472 7,474 7,494 7,502 7,501 7,504 7,502 7,511 7,491 7,461 7,448 7,450
Metro-North Railroad 6,584 6,651 6,713 6,767 6,776 6,785 6,869 6,897 6,880 6,931 6,923 6,965
Bridges & Tunnels 1,589 1,589 1,589 1,589 1,589 1,589 1,589 1,589 1,589 1,589 1,589 1,589
Headquarters 2,998 2,998 2,998 3,072 3,072 3,072 3,072 3,072 3,072 3,073 3,073 3,073
Staten Island Railway 318 318 318 318 318 318 318 318 318 318 318 318
Capital Construction Company 139 139 139 139 139 139 139 139 139 139 139 139
Bus Company 3,924 3,924 3,924 3,924 3,924 3,924 3,924 3,924 3,924 3,924 3,924 3,924
Total Full-Time-Equivalents 228 228 228 228 228 228 229 229 229 229 229 229
NYC Transit 212 212 212 212 212 212 213 213 213 213 213 213
Long Island Rail Road - - - - - - - - - - - -
Metro-North Railroad 1 1 1 1 1 1 1 1 1 1 1 1
Bridges & Tunnels - - - - - - - - - - - -
Headquarters - - - - - - - - - - - -
Staten Island Railway - - - - - - - - - - - -
Capital Construction Company - - - - - - - - - - - -
Bus Company 15 15 15 15 15 15 15 15 15 15 15 15 IV-23
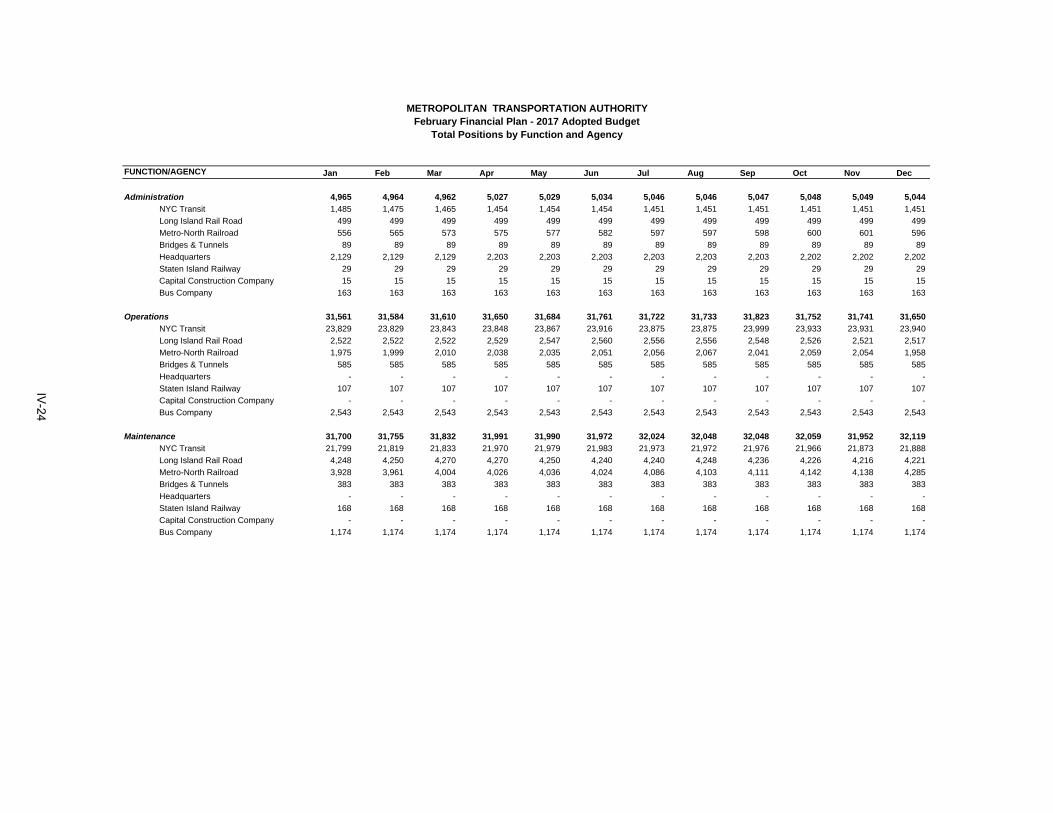
Jan Feb Mar Apr May Jun Jul Aug Sep Oct Nov Dec
Administration 4,965 4,964 4,962 5,027 5,029 5,034 5,046 5,046 5,047 5,048 5,049 5,044
NYC Transit 1,485 1,475 1,465 1,454 1,454 1,454 1,451 1,451 1,451 1,451 1,451 1,451
Long Island Rail Road 499 499 499 499 499 499 499 499 499 499 499 499
Metro-North Railroad 556 565 573 575 577 582 597 597 598 600 601 596
Bridges & Tunnels 89 89 89 89 89 89 89 89 89 89 89 89
Headquarters 2,129 2,129 2,129 2,203 2,203 2,203 2,203 2,203 2,203 2,202 2,202 2,202
Staten Island Railway 29 29 29 29 29 29 29 29 29 29 29 29
Capital Construction Company 15 15 15 15 15 15 15 15 15 15 15 15
Bus Company 163 163 163 163 163 163 163 163 163 163 163 163
Operations 31,561 31,584 31,610 31,650 31,684 31,761 31,722 31,733 31,823 31,752 31,741 31,650
NYC Transit 23,829 23,829 23,843 23,848 23,867 23,916 23,875 23,875 23,999 23,933 23,931 23,940
Long Island Rail Road 2,522 2,522 2,522 2,529 2,547 2,560 2,556 2,556 2,548 2,526 2,521 2,517
Metro-North Railroad 1,975 1,999 2,010 2,038 2,035 2,051 2,056 2,067 2,041 2,059 2,054 1,958
Bridges & Tunnels 585 585 585 585 585 585 585 585 585 585 585 585
Headquarters - - - - - - - - - - - -
Staten Island Railway 107 107 107 107 107 107 107 107 107 107 107 107
Capital Construction Company - - - - - - - - - - - -
Bus Company 2,543 2,543 2,543 2,543 2,543 2,543 2,543 2,543 2,543 2,543 2,543 2,543
Maintenance 31,700 31,755 31,832 31,991 31,990 31,972 32,024 32,048 32,048 32,059 31,952 32,119
NYC Transit 21,799 21,819 21,833 21,970 21,979 21,983 21,973 21,972 21,976 21,966 21,873 21,888
Long Island Rail Road 4,248 4,250 4,270 4,270 4,250 4,240 4,240 4,248 4,236 4,226 4,216 4,221
Metro-North Railroad 3,928 3,961 4,004 4,026 4,036 4,024 4,086 4,103 4,111 4,142 4,138 4,285
Bridges & Tunnels 383 383 383 383 383 383 383 383 383 383 383 383
Headquarters - - - - - - - - - - - -
Staten Island Railway 168 168 168 168 168 168 168 168 168 168 168 168
Capital Construction Company - - - - - - - - - - - -
Bus Company 1,174 1,174 1,174 1,174 1,174 1,174 1,174 1,174 1,174 1,174 1,174 1,174
METROPOLITAN TRANSPORTATION AUTHORITYFebruary Financial Plan - 2017 Adopted Budget
Total Positions by Function and Agency
FUNCTION/AGENCY
IV-24
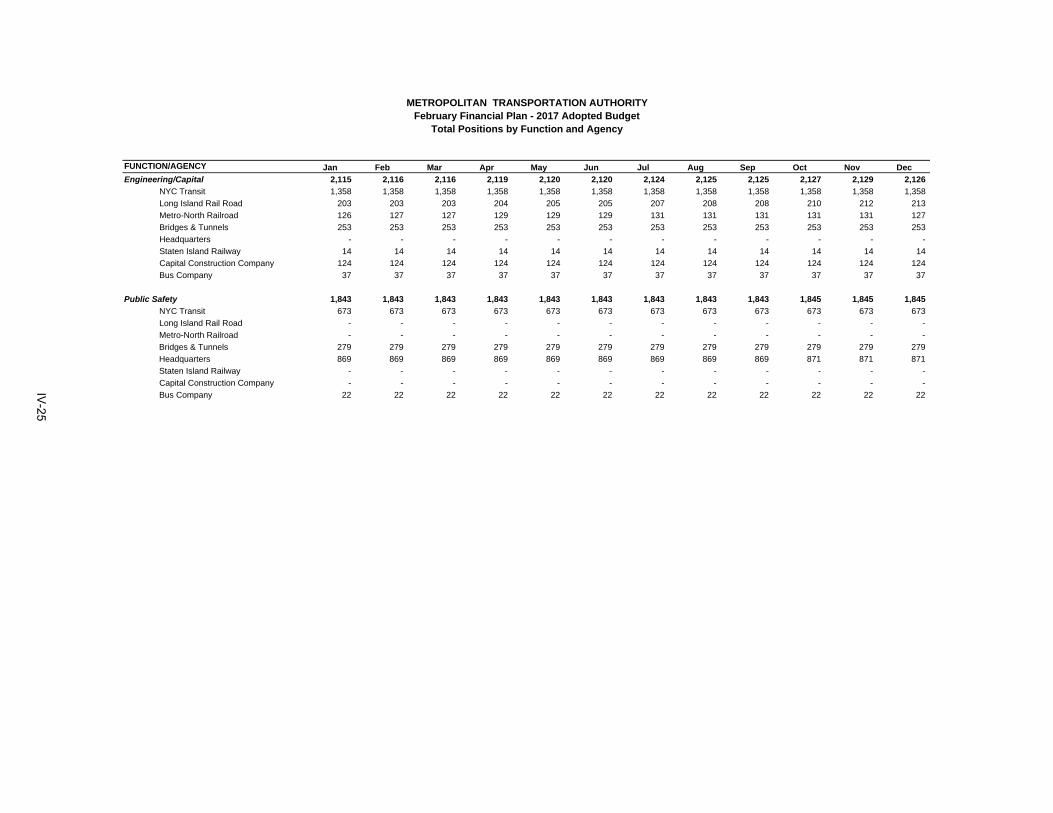
Jan Feb Mar Apr May Jun Jul Aug Sep Oct Nov Dec
METROPOLITAN TRANSPORTATION AUTHORITYFebruary Financial Plan - 2017 Adopted Budget
Total Positions by Function and Agency
FUNCTION/AGENCY
Engineering/Capital 2,115 2,116 2,116 2,119 2,120 2,120 2,124 2,125 2,125 2,127 2,129 2,126
NYC Transit 1,358 1,358 1,358 1,358 1,358 1,358 1,358 1,358 1,358 1,358 1,358 1,358
Long Island Rail Road 203 203 203 204 205 205 207 208 208 210 212 213
Metro-North Railroad 126 127 127 129 129 129 131 131 131 131 131 127
Bridges & Tunnels 253 253 253 253 253 253 253 253 253 253 253 253
Headquarters - - - - - - - - - - - -
Staten Island Railway 14 14 14 14 14 14 14 14 14 14 14 14
Capital Construction Company 124 124 124 124 124 124 124 124 124 124 124 124
Bus Company 37 37 37 37 37 37 37 37 37 37 37 37
Public Safety 1,843 1,843 1,843 1,843 1,843 1,843 1,843 1,843 1,843 1,845 1,845 1,845
NYC Transit 673 673 673 673 673 673 673 673 673 673 673 673
Long Island Rail Road - - - - - - - - - - - -
Metro-North Railroad - - - - - - - - - - - -
Bridges & Tunnels 279 279 279 279 279 279 279 279 279 279 279 279
Headquarters 869 869 869 869 869 869 869 869 869 871 871 871
Staten Island Railway - - - - - - - - - - - -
Capital Construction Company - - - - - - - - - - - -
Bus Company 22 22 22 22 22 22 22 22 22 22 22 22
IV-25
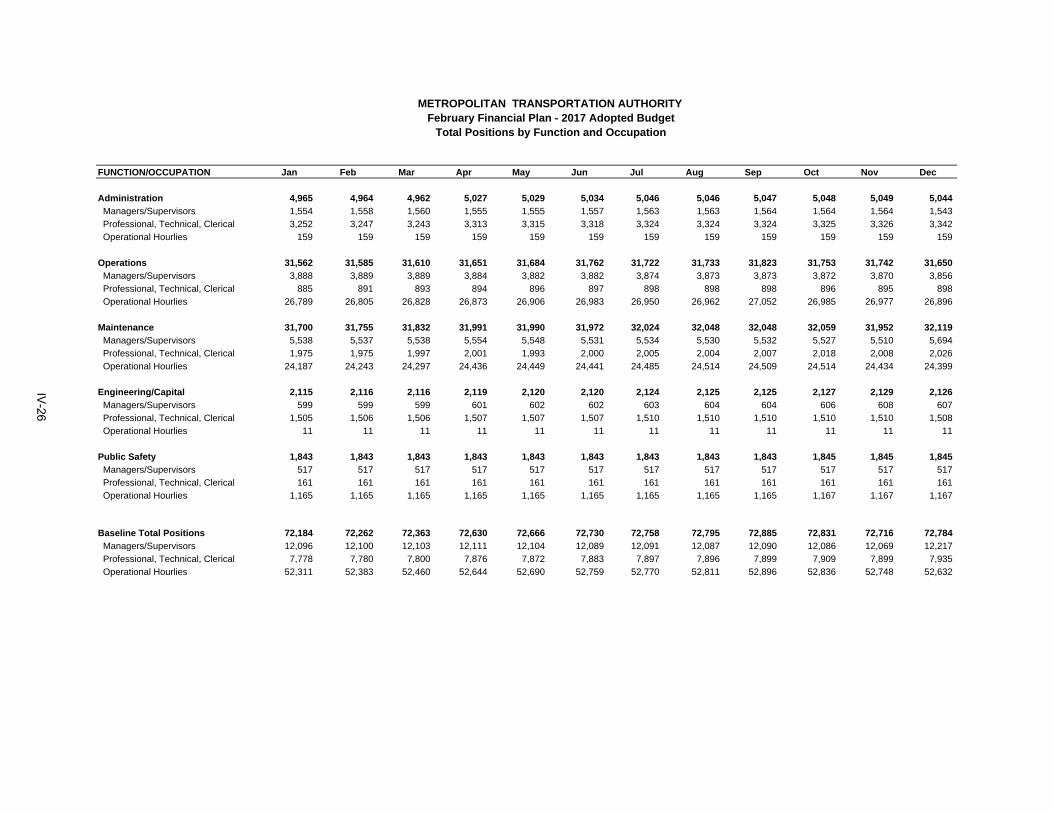
FUNCTION/OCCUPATION Jan Feb Mar Apr May Jun Jul Aug Sep Oct Nov Dec
Administration 4,965 4,964 4,962 5,027 5,029 5,034 5,046 5,046 5,047 5,048 5,049 5,044
Managers/Supervisors 1,554 1,558 1,560 1,555 1,555 1,557 1,563 1,563 1,564 1,564 1,564 1,543
Professional, Technical, Clerical 3,252 3,247 3,243 3,313 3,315 3,318 3,324 3,324 3,324 3,325 3,326 3,342
Operational Hourlies 159 159 159 159 159 159 159 159 159 159 159 159
Operations 31,562 31,585 31,610 31,651 31,684 31,762 31,722 31,733 31,823 31,753 31,742 31,650
Managers/Supervisors 3,888 3,889 3,889 3,884 3,882 3,882 3,874 3,873 3,873 3,872 3,870 3,856
Professional, Technical, Clerical 885 891 893 894 896 897 898 898 898 896 895 898
Operational Hourlies 26,789 26,805 26,828 26,873 26,906 26,983 26,950 26,962 27,052 26,985 26,977 26,896
Maintenance 31,700 31,755 31,832 31,991 31,990 31,972 32,024 32,048 32,048 32,059 31,952 32,119
Managers/Supervisors 5,538 5,537 5,538 5,554 5,548 5,531 5,534 5,530 5,532 5,527 5,510 5,694
Professional, Technical, Clerical 1,975 1,975 1,997 2,001 1,993 2,000 2,005 2,004 2,007 2,018 2,008 2,026
Operational Hourlies 24,187 24,243 24,297 24,436 24,449 24,441 24,485 24,514 24,509 24,514 24,434 24,399
Engineering/Capital 2,115 2,116 2,116 2,119 2,120 2,120 2,124 2,125 2,125 2,127 2,129 2,126
Managers/Supervisors 599 599 599 601 602 602 603 604 604 606 608 607
Professional, Technical, Clerical 1,505 1,506 1,506 1,507 1,507 1,507 1,510 1,510 1,510 1,510 1,510 1,508
Operational Hourlies 11 11 11 11 11 11 11 11 11 11 11 11
Public Safety 1,843 1,843 1,843 1,843 1,843 1,843 1,843 1,843 1,843 1,845 1,845 1,845
Managers/Supervisors 517 517 517 517 517 517 517 517 517 517 517 517
Professional, Technical, Clerical 161 161 161 161 161 161 161 161 161 161 161 161
Operational Hourlies 1,165 1,165 1,165 1,165 1,165 1,165 1,165 1,165 1,165 1,167 1,167 1,167
Baseline Total Positions 72,184 72,262 72,363 72,630 72,666 72,730 72,758 72,795 72,885 72,831 72,716 72,784
Managers/Supervisors 12,096 12,100 12,103 12,111 12,104 12,089 12,091 12,087 12,090 12,086 12,069 12,217
Professional, Technical, Clerical 7,778 7,780 7,800 7,876 7,872 7,883 7,897 7,896 7,899 7,909 7,899 7,935
Operational Hourlies 52,311 52,383 52,460 52,644 52,690 52,759 52,770 52,811 52,896 52,836 52,748 52,632
METROPOLITAN TRANSPORTATION AUTHORITYFebruary Financial Plan - 2017 Adopted Budget
Total Positions by Function and Occupation
IV-26
V. MTA Capital Program Information
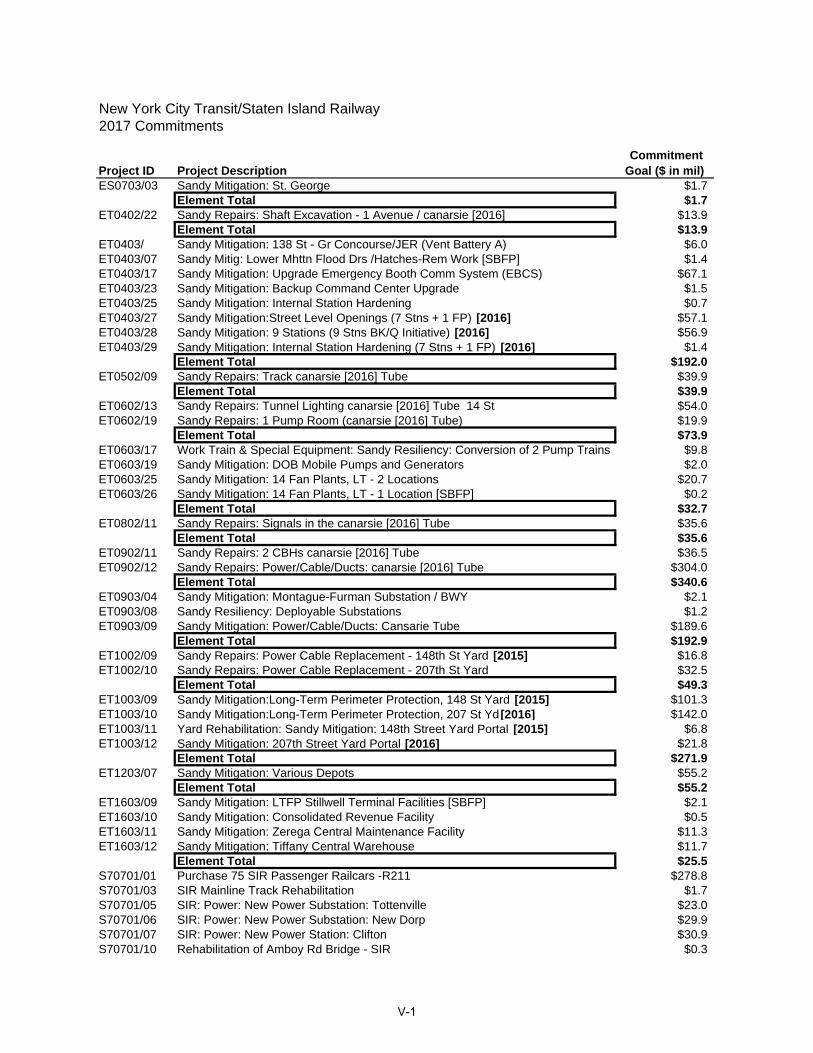
New York City Transit/Staten Island Railway2017 Commitments
Project ID Project Description CommitmentGoal ($ in mil)
ES0703/03 Sandy Mitigation: St. George $1.7Element Total $1.7
ET0402/22 Sandy Repairs: Shaft Excavation - 1 Avenue / canarsie [2016] $13.9Element Total $13.9
ET0403/ Sandy Mitigation: 138 St - Gr Concourse/JER (Vent Battery A) $6.0ET0403/07 Sandy Mitig: Lower Mhttn Flood Drs /Hatches-Rem Work [SBFP] $1.4ET0403/17 Sandy Mitigation: Upgrade Emergency Booth Comm System (EBCS) $67.1ET0403/23 Sandy Mitigation: Backup Command Center Upgrade $1.5ET0403/25 Sandy Mitigation: Internal Station Hardening $0.7ET0403/27 Sandy Mitigation:Street Level Openings (7 Stns + 1 FP) [2016] $57.1ET0403/28 Sandy Mitigation: 9 Stations (9 Stns BK/Q Initiative) [2016] $56.9ET0403/29 Sandy Mitigation: Internal Station Hardening (7 Stns + 1 FP) [2016] $1.4
Element Total $192.0ET0502/09 Sandy Repairs: Track canarsie [2016] Tube $39.9
Element Total $39.9ET0602/13 Sandy Repairs: Tunnel Lighting canarsie [2016] Tube 14 St $54.0ET0602/19 Sandy Repairs: 1 Pump Room (canarsie [2016] Tube) $19.9
Element Total $73.9ET0603/17 Work Train & Special Equipment: Sandy Resiliency: Conversion of 2 Pump Trains $9.8ET0603/19 Sandy Mitigation: DOB Mobile Pumps and Generators $2.0ET0603/25 Sandy Mitigation: 14 Fan Plants, LT - 2 Locations $20.7ET0603/26 Sandy Mitigation: 14 Fan Plants, LT - 1 Location [SBFP] $0.2
Element Total $32.7ET0802/11 Sandy Repairs: Signals in the canarsie [2016] Tube $35.6
Element Total $35.6ET0902/11 Sandy Repairs: 2 CBHs canarsie [2016] Tube $36.5ET0902/12 Sandy Repairs: Power/Cable/Ducts: canarsie [2016] Tube $304.0
Element Total $340.6ET0903/04 Sandy Mitigation: Montague-Furman Substation / BWY $2.1ET0903/08 Sandy Resiliency: Deployable Substations $1.2ET0903/09 Sandy Mitigation: Power/Cable/Ducts: Cansarie Tube $189.6
Element Total $192.9ET1002/09 Sandy Repairs: Power Cable Replacement - 148th St Yard [2015] $16.8ET1002/10 Sandy Repairs: Power Cable Replacement - 207th St Yard $32.5
Element Total $49.3ET1003/09 Sandy Mitigation:Long-Term Perimeter Protection, 148 St Yard [2015] $101.3ET1003/10 Sandy Mitigation:Long-Term Perimeter Protection, 207 St Yd [2016] $142.0ET1003/11 Yard Rehabilitation: Sandy Mitigation: 148th Street Yard Portal [2015] $6.8ET1003/12 Sandy Mitigation: 207th Street Yard Portal [2016] $21.8
Element Total $271.9ET1203/07 Sandy Mitigation: Various Depots $55.2
Element Total $55.2ET1603/09 Sandy Mitigation: LTFP Stillwell Terminal Facilities [SBFP] $2.1ET1603/10 Sandy Mitigation: Consolidated Revenue Facility $0.5ET1603/11 Sandy Mitigation: Zerega Central Maintenance Facility $11.3ET1603/12 Sandy Mitigation: Tiffany Central Warehouse $11.7
Element Total $25.5S70701/01 Purchase 75 SIR Passenger Railcars -R211 $278.8S70701/03 SIR Mainline Track Rehabilitation $1.7S70701/05 SIR: Power: New Power Substation: Tottenville $23.0S70701/06 SIR: Power: New Power Substation: New Dorp $29.9S70701/07 SIR: Power: New Power Station: Clifton $30.9S70701/10 Rehabilitation of Amboy Rd Bridge - SIR $0.3
V-1
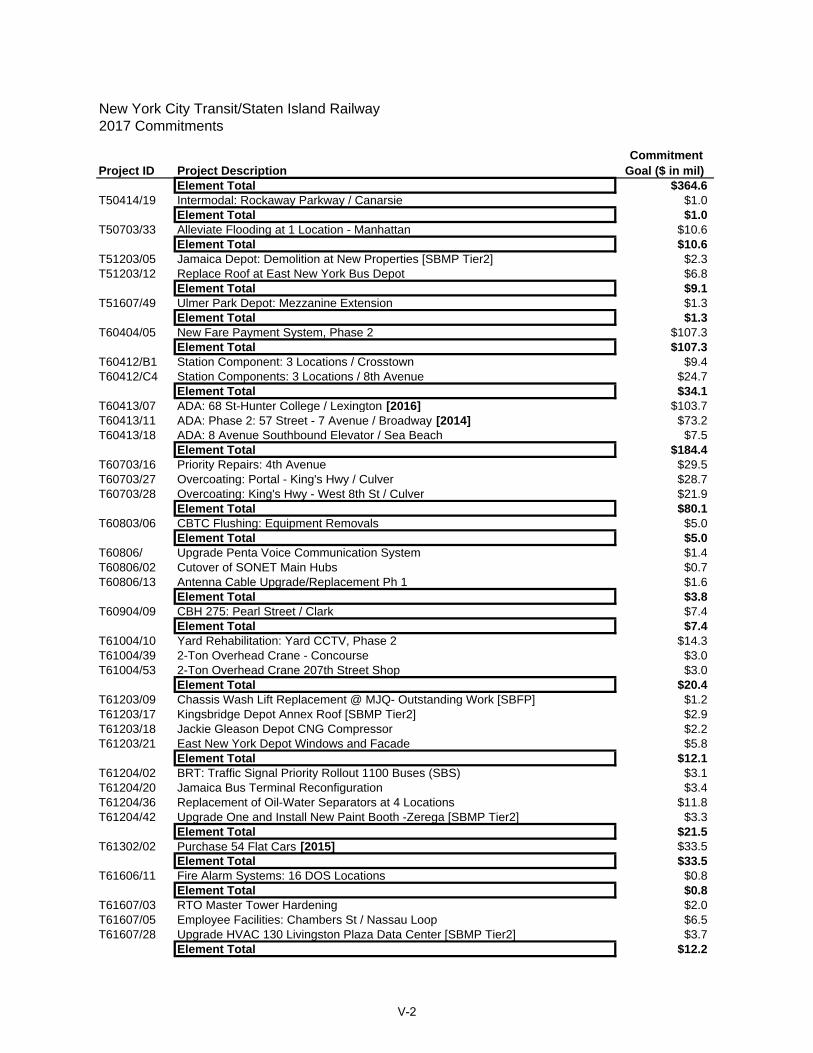
New York City Transit/Staten Island Railway2017 Commitments
Project ID Project Description CommitmentGoal ($ in mil)
Element Total $364.6T50414/19 Intermodal: Rockaway Parkway / Canarsie $1.0
Element Total $1.0T50703/33 Alleviate Flooding at 1 Location - Manhattan $10.6
Element Total $10.6T51203/05 Jamaica Depot: Demolition at New Properties [SBMP Tier2] $2.3T51203/12 Replace Roof at East New York Bus Depot $6.8
Element Total $9.1T51607/49 Ulmer Park Depot: Mezzanine Extension $1.3
Element Total $1.3T60404/05 New Fare Payment System, Phase 2 $107.3
Element Total $107.3T60412/B1 Station Component: 3 Locations / Crosstown $9.4T60412/C4 Station Components: 3 Locations / 8th Avenue $24.7
Element Total $34.1T60413/07 ADA: 68 St-Hunter College / Lexington [2016] $103.7T60413/11 ADA: Phase 2: 57 Street - 7 Avenue / Broadway [2014] $73.2T60413/18 ADA: 8 Avenue Southbound Elevator / Sea Beach $7.5
Element Total $184.4T60703/16 Priority Repairs: 4th Avenue $29.5T60703/27 Overcoating: Portal - King's Hwy / Culver $28.7T60703/28 Overcoating: King's Hwy - West 8th St / Culver $21.9
Element Total $80.1T60803/06 CBTC Flushing: Equipment Removals $5.0
Element Total $5.0T60806/ Upgrade Penta Voice Communication System $1.4T60806/02 Cutover of SONET Main Hubs $0.7T60806/13 Antenna Cable Upgrade/Replacement Ph 1 $1.6
Element Total $3.8T60904/09 CBH 275: Pearl Street / Clark $7.4
Element Total $7.4T61004/10 Yard Rehabilitation: Yard CCTV, Phase 2 $14.3T61004/39 2-Ton Overhead Crane - Concourse $3.0T61004/53 2-Ton Overhead Crane 207th Street Shop $3.0
Element Total $20.4T61203/09 Chassis Wash Lift Replacement @ MJQ- Outstanding Work [SBFP] $1.2T61203/17 Kingsbridge Depot Annex Roof [SBMP Tier2] $2.9T61203/18 Jackie Gleason Depot CNG Compressor $2.2T61203/21 East New York Depot Windows and Facade $5.8
Element Total $12.1T61204/02 BRT: Traffic Signal Priority Rollout 1100 Buses (SBS) $3.1T61204/20 Jamaica Bus Terminal Reconfiguration $3.4T61204/36 Replacement of Oil-Water Separators at 4 Locations $11.8T61204/42 Upgrade One and Install New Paint Booth -Zerega [SBMP Tier2] $3.3
Element Total $21.5T61302/02 Purchase 54 Flat Cars [2015] $33.5
Element Total $33.5T61606/11 Fire Alarm Systems: 16 DOS Locations $0.8
Element Total $0.8T61607/03 RTO Master Tower Hardening $2.0T61607/05 Employee Facilities: Chambers St / Nassau Loop $6.5T61607/28 Upgrade HVAC 130 Livingston Plaza Data Center [SBMP Tier2] $3.7
Element Total $12.2
V-2
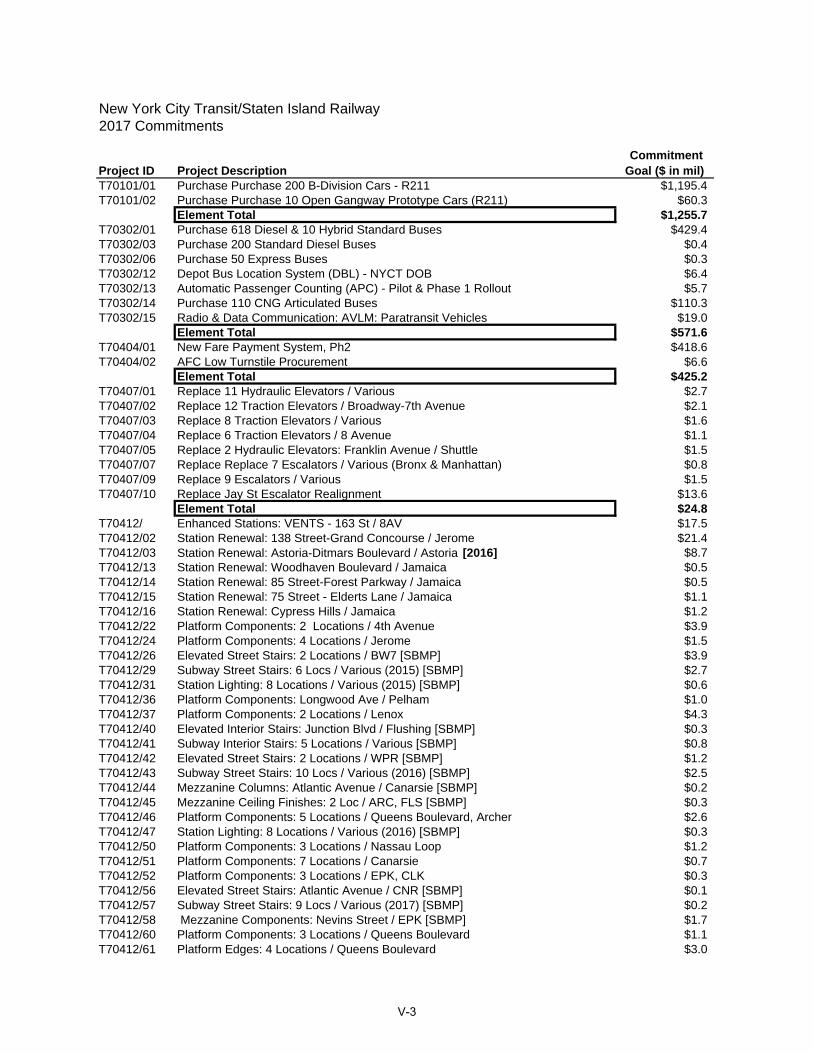
New York City Transit/Staten Island Railway2017 Commitments
Project ID Project Description CommitmentGoal ($ in mil)
T70101/01 Purchase Purchase 200 B-Division Cars - R211 $1,195.4T70101/02 Purchase Purchase 10 Open Gangway Prototype Cars (R211) $60.3
Element Total $1,255.7T70302/01 Purchase 618 Diesel & 10 Hybrid Standard Buses $429.4T70302/03 Purchase 200 Standard Diesel Buses $0.4T70302/06 Purchase 50 Express Buses $0.3T70302/12 Depot Bus Location System (DBL) - NYCT DOB $6.4T70302/13 Automatic Passenger Counting (APC) - Pilot & Phase 1 Rollout $5.7T70302/14 Purchase 110 CNG Articulated Buses $110.3T70302/15 Radio & Data Communication: AVLM: Paratransit Vehicles $19.0
Element Total $571.6T70404/01 New Fare Payment System, Ph2 $418.6T70404/02 AFC Low Turnstile Procurement $6.6
Element Total $425.2T70407/01 Replace 11 Hydraulic Elevators / Various $2.7T70407/02 Replace 12 Traction Elevators / Broadway-7th Avenue $2.1T70407/03 Replace 8 Traction Elevators / Various $1.6T70407/04 Replace 6 Traction Elevators / 8 Avenue $1.1T70407/05 Replace 2 Hydraulic Elevators: Franklin Avenue / Shuttle $1.5T70407/07 Replace Replace 7 Escalators / Various (Bronx & Manhattan) $0.8T70407/09 Replace 9 Escalators / Various $1.5T70407/10 Replace Jay St Escalator Realignment $13.6
Element Total $24.8T70412/ Enhanced Stations: VENTS - 163 St / 8AV $17.5T70412/02 Station Renewal: 138 Street-Grand Concourse / Jerome $21.4T70412/03 Station Renewal: Astoria-Ditmars Boulevard / Astoria [2016] $8.7T70412/13 Station Renewal: Woodhaven Boulevard / Jamaica $0.5T70412/14 Station Renewal: 85 Street-Forest Parkway / Jamaica $0.5T70412/15 Station Renewal: 75 Street - Elderts Lane / Jamaica $1.1T70412/16 Station Renewal: Cypress Hills / Jamaica $1.2T70412/22 Platform Components: 2 Locations / 4th Avenue $3.9T70412/24 Platform Components: 4 Locations / Jerome $1.5T70412/26 Elevated Street Stairs: 2 Locations / BW7 [SBMP] $3.9T70412/29 Subway Street Stairs: 6 Locs / Various (2015) [SBMP] $2.7T70412/31 Station Lighting: 8 Locations / Various (2015) [SBMP] $0.6T70412/36 Platform Components: Longwood Ave / Pelham $1.0T70412/37 Platform Components: 2 Locations / Lenox $4.3T70412/40 Elevated Interior Stairs: Junction Blvd / Flushing [SBMP] $0.3T70412/41 Subway Interior Stairs: 5 Locations / Various [SBMP] $0.8T70412/42 Elevated Street Stairs: 2 Locations / WPR [SBMP] $1.2T70412/43 Subway Street Stairs: 10 Locs / Various (2016) [SBMP] $2.5T70412/44 Mezzanine Columns: Atlantic Avenue / Canarsie [SBMP] $0.2T70412/45 Mezzanine Ceiling Finishes: 2 Loc / ARC, FLS [SBMP] $0.3T70412/46 Platform Components: 5 Locations / Queens Boulevard, Archer $2.6T70412/47 Station Lighting: 8 Locations / Various (2016) [SBMP] $0.3T70412/50 Platform Components: 3 Locations / Nassau Loop $1.2T70412/51 Platform Components: 7 Locations / Canarsie $0.7T70412/52 Platform Components: 3 Locations / EPK, CLK $0.3T70412/56 Elevated Street Stairs: Atlantic Avenue / CNR [SBMP] $0.1T70412/57 Subway Street Stairs: 9 Locs / Various (2017) [SBMP] $0.2T70412/58 Mezzanine Components: Nevins Street / EPK [SBMP] $1.7T70412/60 Platform Components: 3 Locations / Queens Boulevard $1.1T70412/61 Platform Edges: 4 Locations / Queens Boulevard $3.0
V-3

New York City Transit/Staten Island Railway2017 Commitments
Project ID Project Description CommitmentGoal ($ in mil)
T70412/62 Station Lighting: 8 Locations / Various (2017) [SBMP] $2.4T70412/63 Platform Components: 3 Locations / Nostrand $0.4T70412/66 Platform Components: 9 Locations / 8th Avenue $1.9T70412/67 Platform Components: 11 Locations / Broadway-7th Avenue $0.9T70412/70 Subway Interior Stairs: 7 Locations / 8AV, BW7 [SBMP] $1.1T70412/71 Elevated Street Stairs: 2 Locations / Brighton [SBMP] $0.2T70412/72 Subway Street Stairs: 4 Locs / 8AV, BW7 (2018) [SBMP] $0.3T70412/78 Platform Edges: 2 Locations / White Plains Road $0.3T70412/80 Elevated Interior Stairs: 4 Av-9 St / 6 AV [SBMP] $0.1T70412/81 Subway Interior Stairs: 8 Locations / 8AV, WPR [SBMP] $1.4T70412/82 Elevated Street Stairs: 3 Locations / WPR [SBMP] $0.0T70412/83 Subway Street Stairs: 50 St 8AV [SBMP] $0.3T70412/84 Mezzanine Components: 4 Locations / 8AV, WPR [SBMP] $0.2T70412/85 Mezzanine Floors: 23 Street / 8 Avenue [SBMP] $0.2T70412/91 Subway Interior Stairs: Canal Street (UL & LL) / BWY [SBMP] $3.7T70412/A1 Elevated Street Stairs: 238th St / Broadway (S1) [SBMP] $1.4T70412/A2 Elevated Street Stairs: 215th St / Broadway (S2/S4) [SBMP] $2.0T70412/A3 Elevated Street Stairs: 215th St / Broadway (S1/S3) [SBMP] $2.0T70412/A4 Elevated Street Stairs: 238th St / Bway (S2/S3) [SBMP Tier2] $2.0T70412/B1 Subway Stairs: 34 St-Herald Sq / Broadway (S2/M1) [SBMP] $0.7T70412/B2 Subway Stairs: 34 St-Herald Sq / Bdwy (S7/M7) [SBMP] $1.1T70412/B3 Subway Stairs: 59 St / 4th Ave (S1/M1) [SBMP] $0.8
Element Total $108.5T70413/01 ADA: Bedford Avenue / canarsie [2016] $98.4T70413/03 ADA: Bedford Park Boulevard / Concourse $39.8T70413/04 ADA: 86 Street / 4th Avenue $27.2T70413/05 ADA: Gun Hill Rd / Dyre $37.8T70413/06 ADA: Eastern Parkway-Brooklyn Museum / EPK $2.1T70413/07 ADA: Times Square, Phase 3 - Shuttle $4.4T70413/08 ADA: Chambers Street / Nassau Loop $1.5T70413/09 ADA: Greenpoint Avenue / Crosstown $1.9T70413/10 ADA: 59 Street / 4th Avenue $2.3T70413/11 ADA: Canarsie-Rockaway Pkwy / Canarsie $0.1T70413/12 ADA: 1 Avenue / canarsie [2016] $27.2T70413/17 ADA: Systemwide Study $10.0T70413/20 ADA: Court Square / Crosstown (Stairs Phase) $11.7
Element Total $264.4T70414/02 Access Improvements: Grand Central: Phase 2 $66.7T70414/03 Station Entrance: 8 Avenue / Sea Beach $14.1T70414/04 Station Reconstruction: Times Square, Phase 3 - Shuttle $0.5T70414/06 Station Entrance Railings: Station Railings - 2015-2019 $3.5T70414/08 Water Condition Remedy - 2017 $0.2T70414/11 New Stairs: 2 Locations / canarsie [2016] $10.7
Element Total $95.7T70502/03 Mainline Track - 2017 DES/EFA $3.5T70502/04 Mainline Track Replacement - 2018 $2.2T70502/14 Track Force Account - 2017 $35.0T70502/40 Mainline Track Replacement 2016 / Canarsie Tube $54.6T70502/51 Mainline Track Replacement 2017 / Brighton $6.8T70502/52 Mainline Track Replacement 2017 / Sea Beach $3.8T70502/53 Mainline Track Replacement 2017 / Broadway $5.5T70502/54 Mainline Track Replacement 2017 / 4th Avenue $2.7T70502/55 Mainline Track Replacement 2017 / Canarsie $13.5
V-4
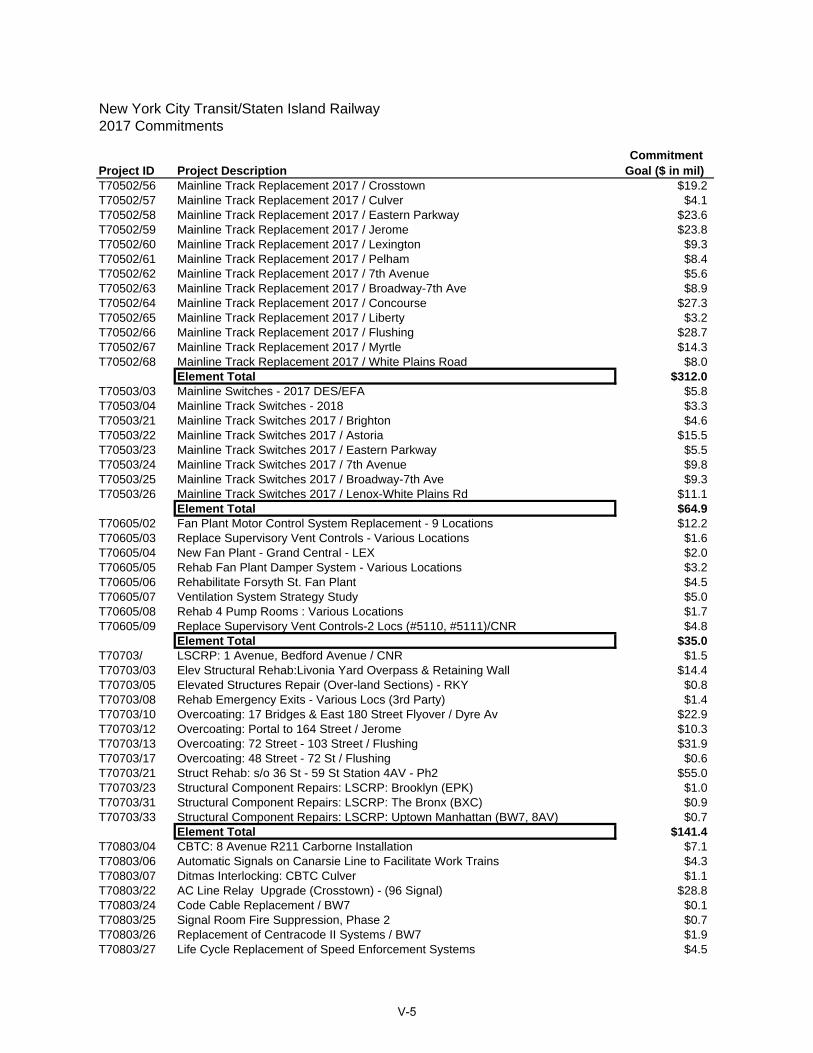
New York City Transit/Staten Island Railway2017 Commitments
Project ID Project Description CommitmentGoal ($ in mil)
T70502/56 Mainline Track Replacement 2017 / Crosstown $19.2T70502/57 Mainline Track Replacement 2017 / Culver $4.1T70502/58 Mainline Track Replacement 2017 / Eastern Parkway $23.6T70502/59 Mainline Track Replacement 2017 / Jerome $23.8T70502/60 Mainline Track Replacement 2017 / Lexington $9.3T70502/61 Mainline Track Replacement 2017 / Pelham $8.4T70502/62 Mainline Track Replacement 2017 / 7th Avenue $5.6T70502/63 Mainline Track Replacement 2017 / Broadway-7th Ave $8.9T70502/64 Mainline Track Replacement 2017 / Concourse $27.3T70502/65 Mainline Track Replacement 2017 / Liberty $3.2T70502/66 Mainline Track Replacement 2017 / Flushing $28.7T70502/67 Mainline Track Replacement 2017 / Myrtle $14.3T70502/68 Mainline Track Replacement 2017 / White Plains Road $8.0
Element Total $312.0T70503/03 Mainline Switches - 2017 DES/EFA $5.8T70503/04 Mainline Track Switches - 2018 $3.3T70503/21 Mainline Track Switches 2017 / Brighton $4.6T70503/22 Mainline Track Switches 2017 / Astoria $15.5T70503/23 Mainline Track Switches 2017 / Eastern Parkway $5.5T70503/24 Mainline Track Switches 2017 / 7th Avenue $9.8T70503/25 Mainline Track Switches 2017 / Broadway-7th Ave $9.3T70503/26 Mainline Track Switches 2017 / Lenox-White Plains Rd $11.1
Element Total $64.9T70605/02 Fan Plant Motor Control System Replacement - 9 Locations $12.2T70605/03 Replace Supervisory Vent Controls - Various Locations $1.6T70605/04 New Fan Plant - Grand Central - LEX $2.0T70605/05 Rehab Fan Plant Damper System - Various Locations $3.2T70605/06 Rehabilitate Forsyth St. Fan Plant $4.5T70605/07 Ventilation System Strategy Study $5.0T70605/08 Rehab 4 Pump Rooms : Various Locations $1.7T70605/09 Replace Supervisory Vent Controls-2 Locs (#5110, #5111)/CNR $4.8
Element Total $35.0T70703/ LSCRP: 1 Avenue, Bedford Avenue / CNR $1.5T70703/03 Elev Structural Rehab:Livonia Yard Overpass & Retaining Wall $14.4T70703/05 Elevated Structures Repair (Over-land Sections) - RKY $0.8T70703/08 Rehab Emergency Exits - Various Locs (3rd Party) $1.4T70703/10 Overcoating: 17 Bridges & East 180 Street Flyover / Dyre Av $22.9T70703/12 Overcoating: Portal to 164 Street / Jerome $10.3T70703/13 Overcoating: 72 Street - 103 Street / Flushing $31.9T70703/17 Overcoating: 48 Street - 72 St / Flushing $0.6T70703/21 Struct Rehab: s/o 36 St - 59 St Station 4AV - Ph2 $55.0T70703/23 Structural Component Repairs: LSCRP: Brooklyn (EPK) $1.0T70703/31 Structural Component Repairs: LSCRP: The Bronx (BXC) $0.9T70703/33 Structural Component Repairs: LSCRP: Uptown Manhattan (BW7, 8AV) $0.7
Element Total $141.4T70803/04 CBTC: 8 Avenue R211 Carborne Installation $7.1T70803/06 Automatic Signals on Canarsie Line to Facilitate Work Trains $4.3T70803/07 Ditmas Interlocking: CBTC Culver $1.1T70803/22 AC Line Relay Upgrade (Crosstown) - (96 Signal) $28.8T70803/24 Code Cable Replacement / BW7 $0.1T70803/25 Signal Room Fire Suppression, Phase 2 $0.7T70803/26 Replacement of Centracode II Systems / BW7 $1.9T70803/27 Life Cycle Replacement of Speed Enforcement Systems $4.5
V-5
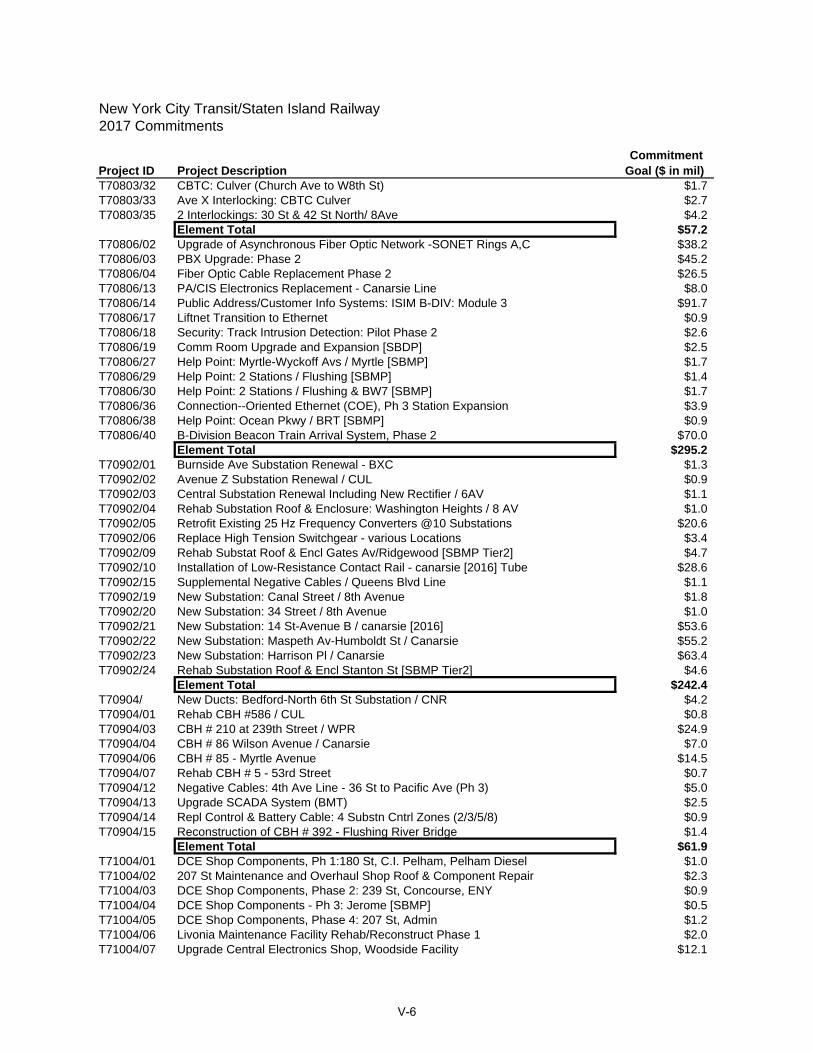
New York City Transit/Staten Island Railway2017 Commitments
Project ID Project Description CommitmentGoal ($ in mil)
T70803/32 CBTC: Culver (Church Ave to W8th St) $1.7T70803/33 Ave X Interlocking: CBTC Culver $2.7T70803/35 2 Interlockings: 30 St & 42 St North/ 8Ave $4.2
Element Total $57.2T70806/02 Upgrade of Asynchronous Fiber Optic Network -SONET Rings A,C $38.2T70806/03 PBX Upgrade: Phase 2 $45.2T70806/04 Fiber Optic Cable Replacement Phase 2 $26.5T70806/13 PA/CIS Electronics Replacement - Canarsie Line $8.0T70806/14 Public Address/Customer Info Systems: ISIM B-DIV: Module 3 $91.7T70806/17 Liftnet Transition to Ethernet $0.9T70806/18 Security: Track Intrusion Detection: Pilot Phase 2 $2.6T70806/19 Comm Room Upgrade and Expansion [SBDP] $2.5T70806/27 Help Point: Myrtle-Wyckoff Avs / Myrtle [SBMP] $1.7T70806/29 Help Point: 2 Stations / Flushing [SBMP] $1.4T70806/30 Help Point: 2 Stations / Flushing & BW7 [SBMP] $1.7T70806/36 Connection--Oriented Ethernet (COE), Ph 3 Station Expansion $3.9T70806/38 Help Point: Ocean Pkwy / BRT [SBMP] $0.9T70806/40 B-Division Beacon Train Arrival System, Phase 2 $70.0
Element Total $295.2T70902/01 Burnside Ave Substation Renewal - BXC $1.3T70902/02 Avenue Z Substation Renewal / CUL $0.9T70902/03 Central Substation Renewal Including New Rectifier / 6AV $1.1T70902/04 Rehab Substation Roof & Enclosure: Washington Heights / 8 AV $1.0T70902/05 Retrofit Existing 25 Hz Frequency Converters @10 Substations $20.6T70902/06 Replace High Tension Switchgear - various Locations $3.4T70902/09 Rehab Substat Roof & Encl Gates Av/Ridgewood [SBMP Tier2] $4.7T70902/10 Installation of Low-Resistance Contact Rail - canarsie [2016] Tube $28.6T70902/15 Supplemental Negative Cables / Queens Blvd Line $1.1T70902/19 New Substation: Canal Street / 8th Avenue $1.8T70902/20 New Substation: 34 Street / 8th Avenue $1.0T70902/21 New Substation: 14 St-Avenue B / canarsie [2016] $53.6T70902/22 New Substation: Maspeth Av-Humboldt St / Canarsie $55.2T70902/23 New Substation: Harrison Pl / Canarsie $63.4T70902/24 Rehab Substation Roof & Encl Stanton St [SBMP Tier2] $4.6
Element Total $242.4T70904/ New Ducts: Bedford-North 6th St Substation / CNR $4.2T70904/01 Rehab CBH #586 / CUL $0.8T70904/03 CBH # 210 at 239th Street / WPR $24.9T70904/04 CBH # 86 Wilson Avenue / Canarsie $7.0T70904/06 CBH # 85 - Myrtle Avenue $14.5T70904/07 Rehab CBH # 5 - 53rd Street $0.7T70904/12 Negative Cables: 4th Ave Line - 36 St to Pacific Ave (Ph 3) $5.0T70904/13 Upgrade SCADA System (BMT) $2.5T70904/14 Repl Control & Battery Cable: 4 Substn Cntrl Zones (2/3/5/8) $0.9T70904/15 Reconstruction of CBH # 392 - Flushing River Bridge $1.4
Element Total $61.9T71004/01 DCE Shop Components, Ph 1:180 St, C.I. Pelham, Pelham Diesel $1.0T71004/02 207 St Maintenance and Overhaul Shop Roof & Component Repair $2.3T71004/03 DCE Shop Components, Phase 2: 239 St, Concourse, ENY $0.9T71004/04 DCE Shop Components - Ph 3: Jerome [SBMP] $0.5T71004/05 DCE Shop Components, Phase 4: 207 St, Admin $1.2T71004/06 Livonia Maintenance Facility Rehab/Reconstruct Phase 1 $2.0T71004/07 Upgrade Central Electronics Shop, Woodside Facility $12.1
V-6
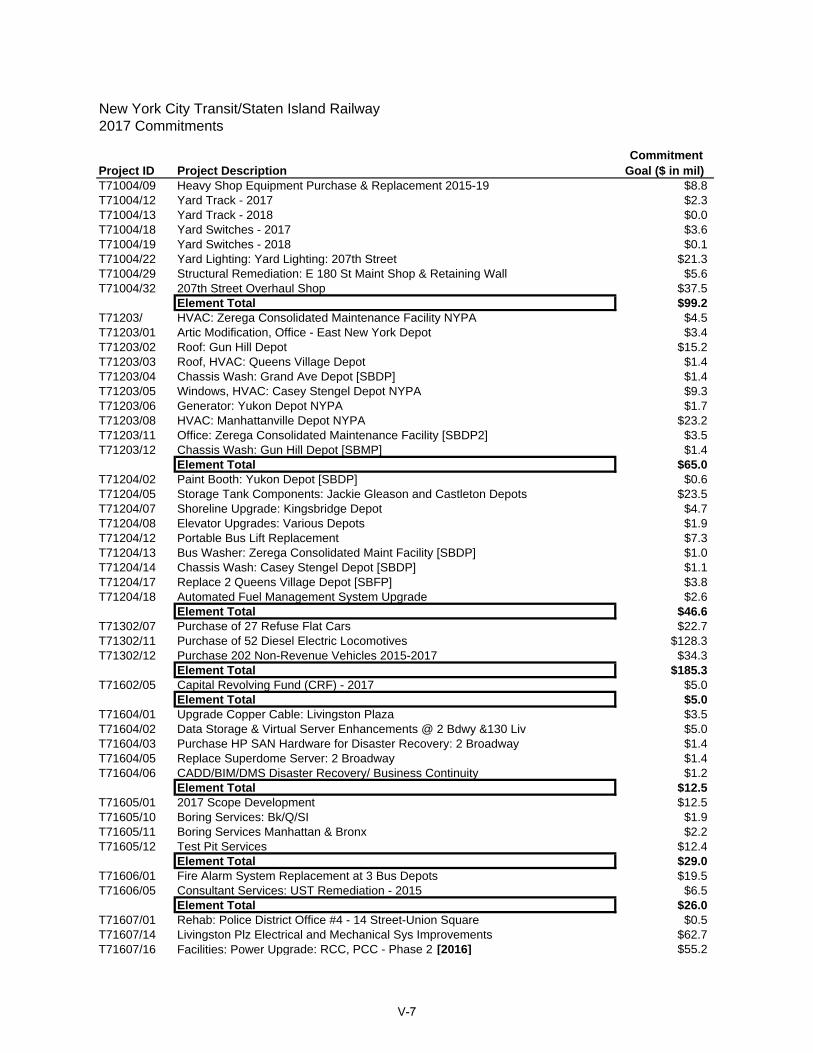
New York City Transit/Staten Island Railway2017 Commitments
Project ID Project Description CommitmentGoal ($ in mil)
T71004/09 Heavy Shop Equipment Purchase & Replacement 2015-19 $8.8T71004/12 Yard Track - 2017 $2.3T71004/13 Yard Track - 2018 $0.0T71004/18 Yard Switches - 2017 $3.6T71004/19 Yard Switches - 2018 $0.1T71004/22 Yard Lighting: Yard Lighting: 207th Street $21.3T71004/29 Structural Remediation: E 180 St Maint Shop & Retaining Wall $5.6T71004/32 207th Street Overhaul Shop $37.5
Element Total $99.2T71203/ HVAC: Zerega Consolidated Maintenance Facility NYPA $4.5T71203/01 Artic Modification, Office - East New York Depot $3.4T71203/02 Roof: Gun Hill Depot $15.2T71203/03 Roof, HVAC: Queens Village Depot $1.4T71203/04 Chassis Wash: Grand Ave Depot [SBDP] $1.4T71203/05 Windows, HVAC: Casey Stengel Depot NYPA $9.3T71203/06 Generator: Yukon Depot NYPA $1.7T71203/08 HVAC: Manhattanville Depot NYPA $23.2T71203/11 Office: Zerega Consolidated Maintenance Facility [SBDP2] $3.5T71203/12 Chassis Wash: Gun Hill Depot [SBMP] $1.4
Element Total $65.0T71204/02 Paint Booth: Yukon Depot [SBDP] $0.6T71204/05 Storage Tank Components: Jackie Gleason and Castleton Depots $23.5T71204/07 Shoreline Upgrade: Kingsbridge Depot $4.7T71204/08 Elevator Upgrades: Various Depots $1.9T71204/12 Portable Bus Lift Replacement $7.3T71204/13 Bus Washer: Zerega Consolidated Maint Facility [SBDP] $1.0T71204/14 Chassis Wash: Casey Stengel Depot [SBDP] $1.1T71204/17 Replace 2 Queens Village Depot [SBFP] $3.8T71204/18 Automated Fuel Management System Upgrade $2.6
Element Total $46.6T71302/07 Purchase of 27 Refuse Flat Cars $22.7T71302/11 Purchase of 52 Diesel Electric Locomotives $128.3T71302/12 Purchase 202 Non-Revenue Vehicles 2015-2017 $34.3
Element Total $185.3T71602/05 Capital Revolving Fund (CRF) - 2017 $5.0
Element Total $5.0T71604/01 Upgrade Copper Cable: Livingston Plaza $3.5T71604/02 Data Storage & Virtual Server Enhancements @ 2 Bdwy &130 Liv $5.0T71604/03 Purchase HP SAN Hardware for Disaster Recovery: 2 Broadway $1.4T71604/05 Replace Superdome Server: 2 Broadway $1.4T71604/06 CADD/BIM/DMS Disaster Recovery/ Business Continuity $1.2
Element Total $12.5T71605/01 2017 Scope Development $12.5T71605/10 Boring Services: Bk/Q/SI $1.9T71605/11 Boring Services Manhattan & Bronx $2.2T71605/12 Test Pit Services $12.4
Element Total $29.0T71606/01 Fire Alarm System Replacement at 3 Bus Depots $19.5T71606/05 Consultant Services: UST Remediation - 2015 $6.5
Element Total $26.0T71607/01 Rehab: Police District Office #4 - 14 Street-Union Square $0.5T71607/14 Livingston Plz Electrical and Mechanical Sys Improvements $62.7T71607/16 Facilities: Power Upgrade: RCC, PCC - Phase 2 [2016] $55.2
V-7
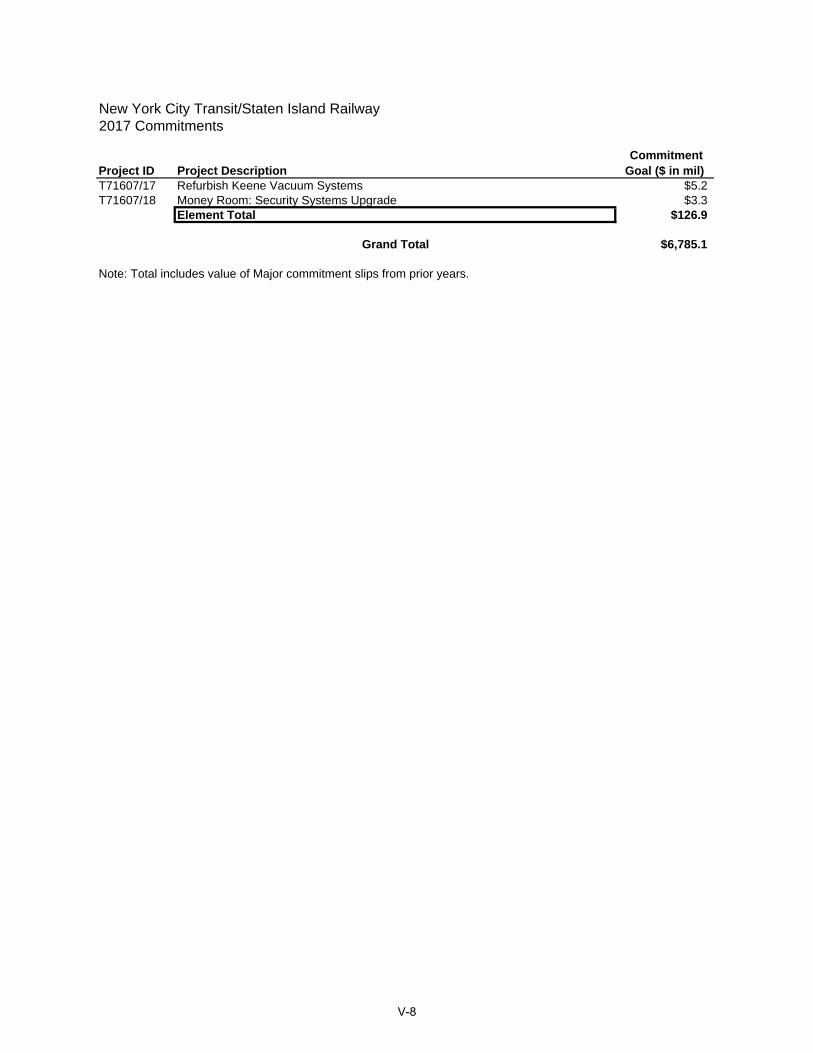
New York City Transit/Staten Island Railway2017 Commitments
Project ID Project Description CommitmentGoal ($ in mil)
T71607/17 Refurbish Keene Vacuum Systems $5.2T71607/18 Money Room: Security Systems Upgrade $3.3
Element Total $126.9
Grand Total $6,785.1
Note: Total includes value of Major commitment slips from prior years.
V-8
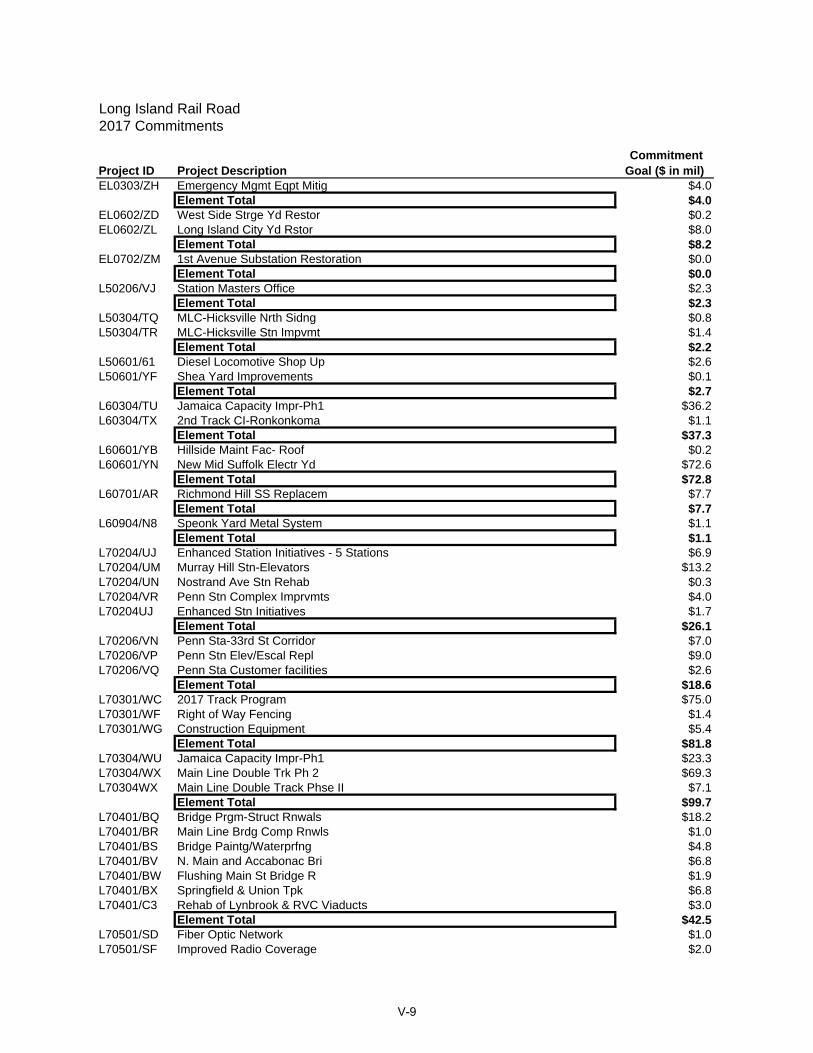
Long Island Rail Road2017 Commitments
Project ID Project Description CommitmentGoal ($ in mil)
EL0303/ZH Emergency Mgmt Eqpt Mitig $4.0Element Total $4.0
EL0602/ZD West Side Strge Yd Restor $0.2EL0602/ZL Long Island City Yd Rstor $8.0
Element Total $8.2EL0702/ZM 1st Avenue Substation Restoration $0.0
Element Total $0.0L50206/VJ Station Masters Office $2.3
Element Total $2.3L50304/TQ MLC-Hicksville Nrth Sidng $0.8L50304/TR MLC-Hicksville Stn Impvmt $1.4
Element Total $2.2L50601/61 Diesel Locomotive Shop Up $2.6L50601/YF Shea Yard Improvements $0.1
Element Total $2.7L60304/TU Jamaica Capacity Impr-Ph1 $36.2L60304/TX 2nd Track CI-Ronkonkoma $1.1
Element Total $37.3L60601/YB Hillside Maint Fac- Roof $0.2L60601/YN New Mid Suffolk Electr Yd $72.6
Element Total $72.8L60701/AR Richmond Hill SS Replacem $7.7
Element Total $7.7L60904/N8 Speonk Yard Metal System $1.1
Element Total $1.1L70204/UJ Enhanced Station Initiatives - 5 Stations $6.9L70204/UM Murray Hill Stn-Elevators $13.2L70204/UN Nostrand Ave Stn Rehab $0.3L70204/VR Penn Stn Complex Imprvmts $4.0L70204UJ Enhanced Stn Initiatives $1.7
Element Total $26.1L70206/VN Penn Sta-33rd St Corridor $7.0L70206/VP Penn Stn Elev/Escal Repl $9.0L70206/VQ Penn Sta Customer facilities $2.6
Element Total $18.6L70301/WC 2017 Track Program $75.0L70301/WF Right of Way Fencing $1.4L70301/WG Construction Equipment $5.4
Element Total $81.8L70304/WU Jamaica Capacity Impr-Ph1 $23.3L70304/WX Main Line Double Trk Ph 2 $69.3L70304WX Main Line Double Track Phse II $7.1
Element Total $99.7L70401/BQ Bridge Prgm-Struct Rnwals $18.2L70401/BR Main Line Brdg Comp Rnwls $1.0L70401/BS Bridge Paintg/Waterprfng $4.8L70401/BV N. Main and Accabonac Bri $6.8L70401/BW Flushing Main St Bridge R $1.9L70401/BX Springfield & Union Tpk $6.8L70401/C3 Rehab of Lynbrook & RVC Viaducts $3.0
Element Total $42.5L70501/SD Fiber Optic Network $1.0L70501/SF Improved Radio Coverage $2.0
V-9

Long Island Rail Road2017 Commitments
Project ID Project Description CommitmentGoal ($ in mil)
L70501/SJ Public Address System $2.5L70501/SN Penn Sta Radio Retrofit/ERT Antenna $3.4L70501/SQ Atlantic Tunnel Intrusion Alarm $0.5L70501SN Penn Sta Radio Retrofit/ERT Antenna $0.1
Element Total $9.6L70502/LK Positive Train Control $61.2L70502/LP Lightning Protection $4.7
Element Total $65.9L70601/YG Diesel Locomotive Shop Impr $106.1L70601/YR Yard Improvements $51.3
Element Total $157.4L70701/XA Substation Replacements $8.0L70701/XB Substation Components $7.2L70701/XJ Substation Battery Repl $0.0L70701/XK Signal Pwr Motor Genratr $2.0L70701/XP Atlantic Ave Tunnel Lighting $4.3
Element Total $21.5L70904/NQ Program Administration $21.2
Element Total $21.2N40905/FV Lynbrook Stn Improvements $2.5
Element Total $2.5
Grand Total $685.2
Note: Total includes value of Major commitment slips from prior years.
V-10
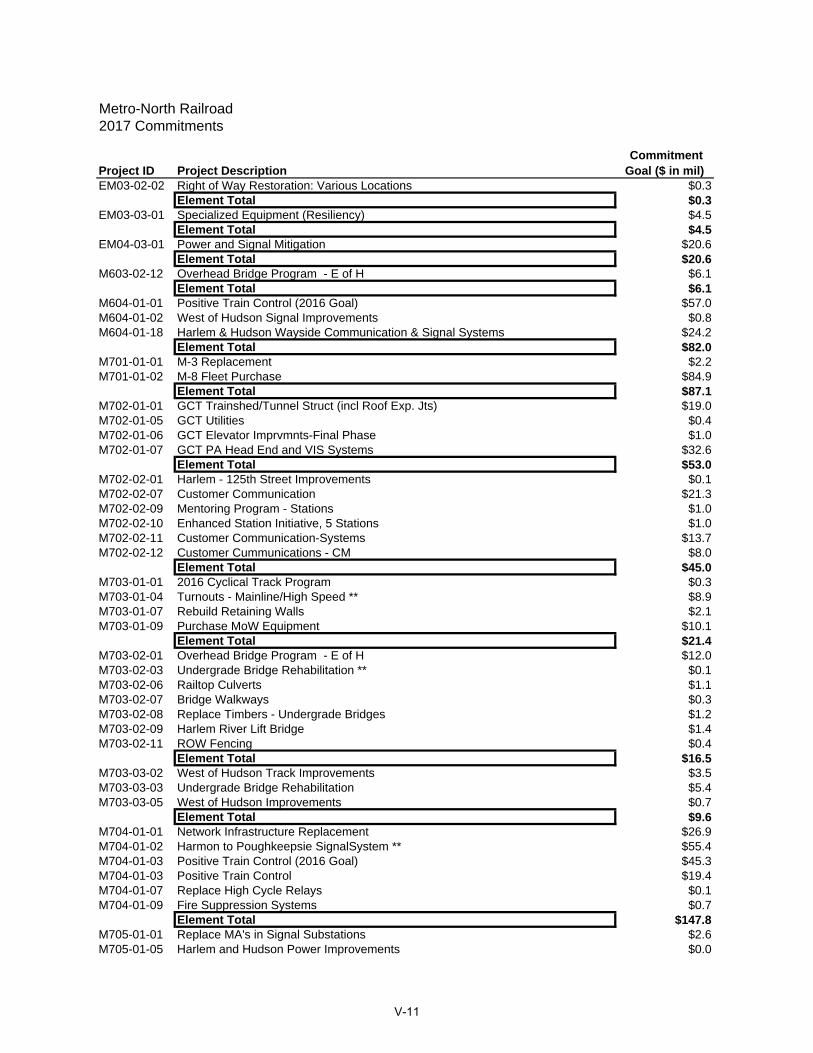
Metro-North Railroad2017 Commitments
Project ID Project Description CommitmentGoal ($ in mil)
EM03-02-02 Right of Way Restoration: Various Locations $0.3Element Total $0.3
EM03-03-01 Specialized Equipment (Resiliency) $4.5Element Total $4.5
EM04-03-01 Power and Signal Mitigation $20.6Element Total $20.6
M603-02-12 Overhead Bridge Program - E of H $6.1Element Total $6.1
M604-01-01 Positive Train Control (2016 Goal) $57.0M604-01-02 West of Hudson Signal Improvements $0.8M604-01-18 Harlem & Hudson Wayside Communication & Signal Systems $24.2
Element Total $82.0M701-01-01 M-3 Replacement $2.2M701-01-02 M-8 Fleet Purchase $84.9
Element Total $87.1M702-01-01 GCT Trainshed/Tunnel Struct (incl Roof Exp. Jts) $19.0M702-01-05 GCT Utilities $0.4M702-01-06 GCT Elevator Imprvmnts-Final Phase $1.0M702-01-07 GCT PA Head End and VIS Systems $32.6
Element Total $53.0M702-02-01 Harlem - 125th Street Improvements $0.1M702-02-07 Customer Communication $21.3M702-02-09 Mentoring Program - Stations $1.0M702-02-10 Enhanced Station Initiative, 5 Stations $1.0M702-02-11 Customer Communication-Systems $13.7M702-02-12 Customer Cummunications - CM $8.0
Element Total $45.0M703-01-01 2016 Cyclical Track Program $0.3M703-01-04 Turnouts - Mainline/High Speed ** $8.9M703-01-07 Rebuild Retaining Walls $2.1M703-01-09 Purchase MoW Equipment $10.1
Element Total $21.4M703-02-01 Overhead Bridge Program - E of H $12.0M703-02-03 Undergrade Bridge Rehabilitation ** $0.1M703-02-06 Railtop Culverts $1.1M703-02-07 Bridge Walkways $0.3M703-02-08 Replace Timbers - Undergrade Bridges $1.2M703-02-09 Harlem River Lift Bridge $1.4M703-02-11 ROW Fencing $0.4
Element Total $16.5M703-03-02 West of Hudson Track Improvements $3.5M703-03-03 Undergrade Bridge Rehabilitation $5.4M703-03-05 West of Hudson Improvements $0.7
Element Total $9.6M704-01-01 Network Infrastructure Replacement $26.9M704-01-02 Harmon to Poughkeepsie SignalSystem ** $55.4M704-01-03 Positive Train Control (2016 Goal) $45.3M704-01-03 Positive Train Control $19.4M704-01-07 Replace High Cycle Relays $0.1M704-01-09 Fire Suppression Systems $0.7
Element Total $147.8M705-01-01 Replace MA's in Signal Substations $2.6M705-01-05 Harlem and Hudson Power Improvements $0.0
V-11
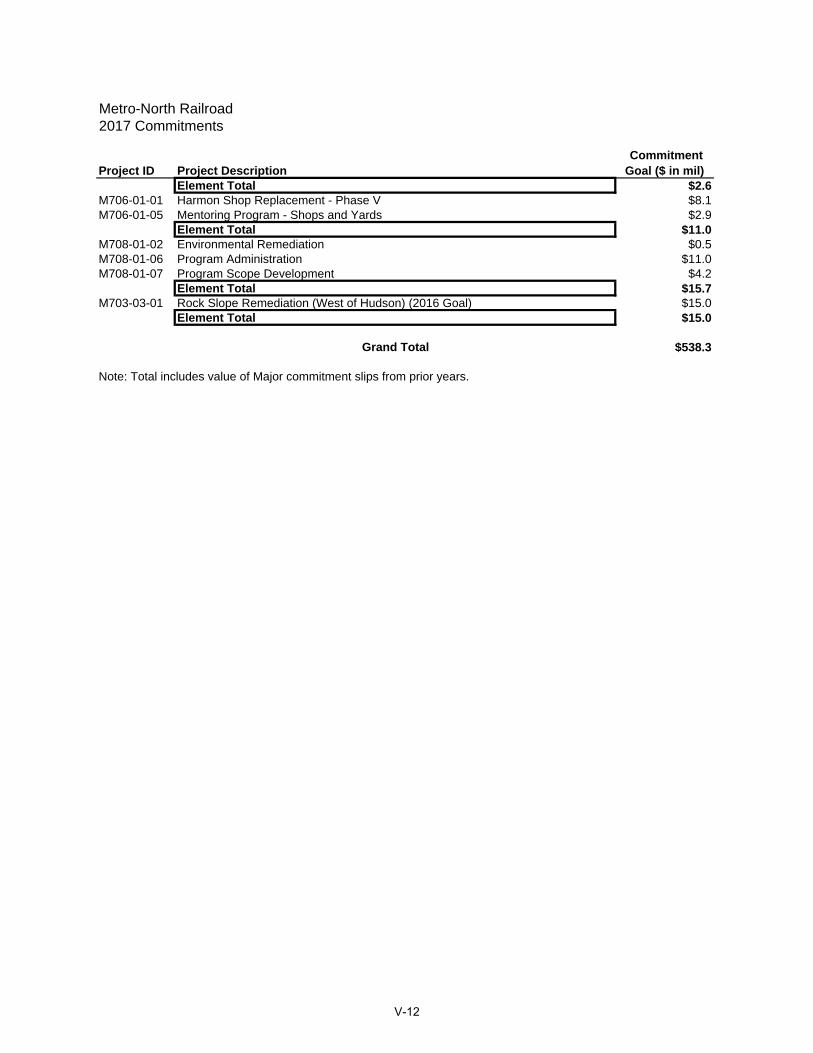
Metro-North Railroad2017 Commitments
Project ID Project Description CommitmentGoal ($ in mil)
Element Total $2.6M706-01-01 Harmon Shop Replacement - Phase V $8.1M706-01-05 Mentoring Program - Shops and Yards $2.9
Element Total $11.0M708-01-02 Environmental Remediation $0.5M708-01-06 Program Administration $11.0M708-01-07 Program Scope Development $4.2
Element Total $15.7M703-03-01 Rock Slope Remediation (West of Hudson) (2016 Goal) $15.0
Element Total $15.0
Grand Total $538.3
Note: Total includes value of Major commitment slips from prior years.
V-12

MTA Bus Company2017 Commitments
Project ID Project Description CommitmentGoal ($ in mil)
U6030204 Security: JFK & Spring Creek $9.2U6030214 Storage Room Expansion - Baisley Park $3.0U6030210 Bus Wash - Spring Creek $2.5U6030229 Bus Wash - College Point $4.8U6030231 Bus Wash - Far Rockaway $1.3
Element Total $20.8U7030207 Depot Rehab: Windows - LaGuardia $3.3U7030207 Depot Rehab: Windows - Baisley Park $2.2U7030208 Depot Component: Spring Creek Roof $2.5
Element Total $8.0
Grand Total $28.8
V-13
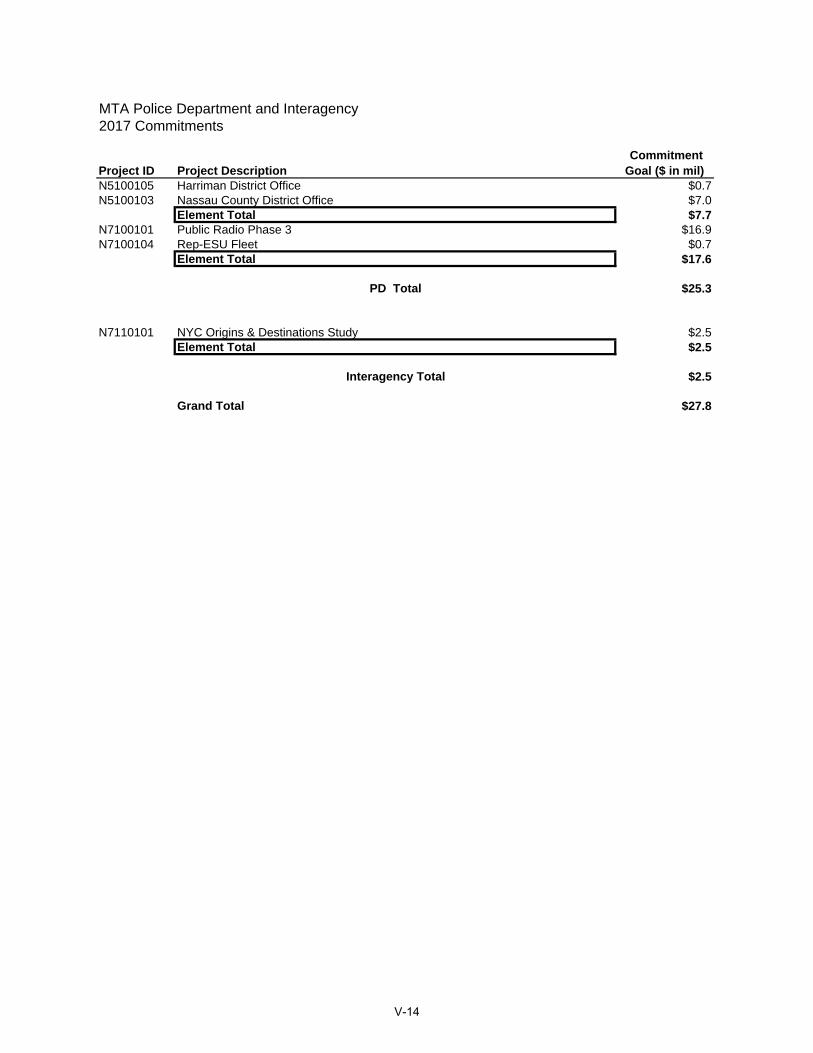
MTA Police Department and Interagency2017 Commitments
Project ID Project Description CommitmentGoal ($ in mil)
N5100105 Harriman District Office $0.7N5100103 Nassau County District Office $7.0
Element Total $7.7N7100101 Public Radio Phase 3 $16.9N7100104 Rep-ESU Fleet $0.7
Element Total $17.6
PD Total $25.3
N7110101 NYC Origins & Destinations Study $2.5Element Total $2.5
Interagency Total $2.5
Grand Total $27.8
V-14
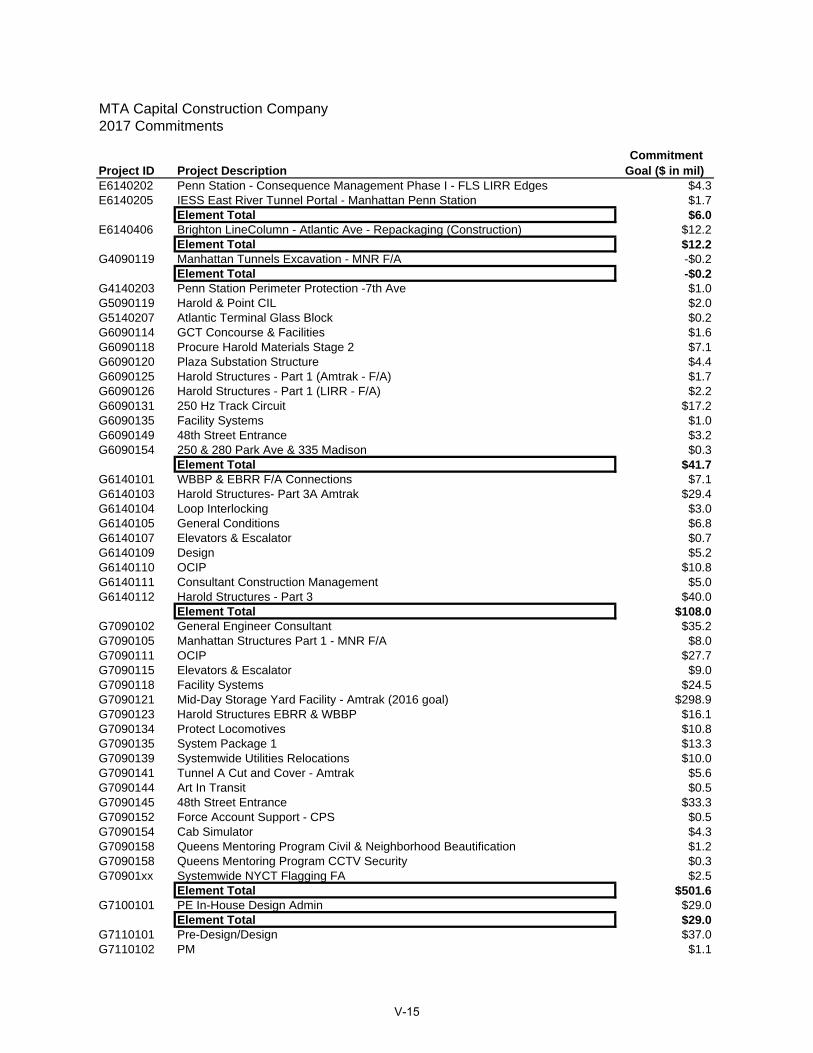
MTA Capital Construction Company2017 Commitments
Project ID Project Description CommitmentGoal ($ in mil)
E6140202 Penn Station - Consequence Management Phase I - FLS LIRR Edges $4.3E6140205 IESS East River Tunnel Portal - Manhattan Penn Station $1.7
Element Total $6.0E6140406 Brighton LineColumn - Atlantic Ave - Repackaging (Construction) $12.2
Element Total $12.2G4090119 Manhattan Tunnels Excavation - MNR F/A -$0.2
Element Total -$0.2G4140203 Penn Station Perimeter Protection -7th Ave $1.0G5090119 Harold & Point CIL $2.0G5140207 Atlantic Terminal Glass Block $0.2G6090114 GCT Concourse & Facilities $1.6G6090118 Procure Harold Materials Stage 2 $7.1G6090120 Plaza Substation Structure $4.4G6090125 Harold Structures - Part 1 (Amtrak - F/A) $1.7G6090126 Harold Structures - Part 1 (LIRR - F/A) $2.2G6090131 250 Hz Track Circuit $17.2G6090135 Facility Systems $1.0G6090149 48th Street Entrance $3.2G6090154 250 & 280 Park Ave & 335 Madison $0.3
Element Total $41.7G6140101 WBBP & EBRR F/A Connections $7.1G6140103 Harold Structures- Part 3A Amtrak $29.4G6140104 Loop Interlocking $3.0G6140105 General Conditions $6.8G6140107 Elevators & Escalator $0.7G6140109 Design $5.2G6140110 OCIP $10.8G6140111 Consultant Construction Management $5.0G6140112 Harold Structures - Part 3 $40.0
Element Total $108.0G7090102 General Engineer Consultant $35.2G7090105 Manhattan Structures Part 1 - MNR F/A $8.0G7090111 OCIP $27.7G7090115 Elevators & Escalator $9.0G7090118 Facility Systems $24.5G7090121 Mid-Day Storage Yard Facility - Amtrak (2016 goal) $298.9G7090123 Harold Structures EBRR & WBBP $16.1G7090134 Protect Locomotives $10.8G7090135 System Package 1 $13.3G7090139 Systemwide Utilities Relocations $10.0G7090141 Tunnel A Cut and Cover - Amtrak $5.6G7090144 Art In Transit $0.5G7090145 48th Street Entrance $33.3G7090152 Force Account Support - CPS $0.5G7090154 Cab Simulator $4.3G7090158 Queens Mentoring Program Civil & Neighborhood Beautification $1.2G7090158 Queens Mentoring Program CCTV Security $0.3G70901xx Systemwide NYCT Flagging FA $2.5
Element Total $501.6G7100101 PE In-House Design Admin $29.0
Element Total $29.0G7110101 Pre-Design/Design $37.0G7110102 PM $1.1
V-15
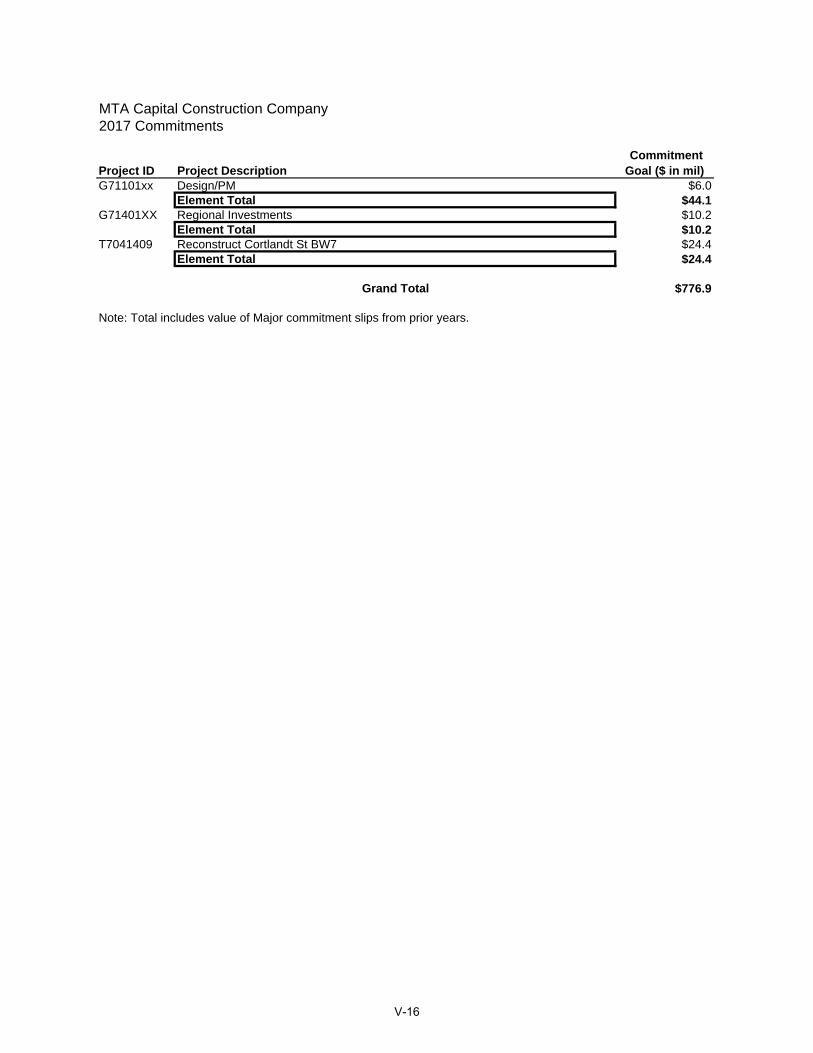
MTA Capital Construction Company2017 Commitments
Project ID Project Description CommitmentGoal ($ in mil)
G71101xx Design/PM $6.0Element Total $44.1
G71401XX Regional Investments $10.2Element Total $10.2
T7041409 Reconstruct Cortlandt St BW7 $24.4Element Total $24.4
Grand Total $776.9
Note: Total includes value of Major commitment slips from prior years.
V-16

MTA Bridges & Tunnels2017 Commitments
Project ID Project Description CommitmentGoal ($ in mil)
D505QM01 Service Building Rehab. $1.4Element Total $1.4
D601TN52 Miscellaneous Structural Rehabilitation $8.1Element Total $8.1
D701HH89 Skewback Retrofit $87.0Element Total $87.0
D701RK19 Seismic/Wind Retrofit & Structural Rehab Ph1 $3.5D701RK20 Cable Inspection and Rehabilitation $3.1D701RK22 Interim Repairs - FDR Ramp $23.3D701RK70 Miscellaneous Structural Rehabilitation $3.7
Element Total $33.6D701VN32 Steel Repair & Concrete Rehabilitation $0.1D701VN34 Main Cable & Suspender Rope Testing - Phase 1 $39.2
Element Total $39.3D702RK23 Construction of New Harlem River Drive Ramp $0.5D702RK65 Interim Repairs - RFK $12.8
Element Total $13.3D702TN55 Study for Bx/Queens Approach Viaduct Replacement $11.3
Element Total $11.3D702VN80 Prelim Design for Suspended Span Lower Level Deck $0.1
Element Total $0.1D703AW65 Toll Collection System Rehab. $3.5
Element Total $3.5D703BW63 Open Road Tolling Initiative - BW Bridge $2.1
Element Total $2.1D703CB63 Open Road Tolling Initiative - CB Bridge $12.0
Element Total $12.0D703HH88 Toll Plazas & Southbound Approach Reconstruction $76.6
Element Total $76.6D703MP63 Open Road Tolling Initiative - MP Bridge $13.3
Element Total $13.3D703RK63 Open Road Tolling Initiative - RFK Bridge $41.0
Element Total $41.0D703VN63 Open Road Tolling Initiative - VN Bridge $23.5
Element Total $23.5D704AW81 Installation of Digital Roadway Signage at all Facilities $0.5
Element Total $0.5D704BW39 Install Electronic Monitoring & Detection Systems $26.7
Element Total $26.7D704HC07 Rehabilitation of HCT Ventilation Systems $0.8
Element Total $0.8D704HH13 Replacement of Facility Lighting System $14.3
Element Total $14.3D704RK07 Electrical/Mechanical Rehab of HR Lift Span $19.6D704RK21 Installation of Fire Standpipe & Upgrade of Fire Protection System (2016 Goal) $17.0D704RK60 Install Electronic Monitoring & Detection Systems $38.5
Element Total $75.2D704TN27 Install Service Building Alarm Systems & Upgrades (SBMP) $1.2
Element Total $1.2D705AW66 Operations Command Center Rehab/Replacement $10.7
Element Total $10.7D705RK58 Rehab Robert Moses Bldg & Ancillary Facilities $2.8
Element Total $2.8
V-17
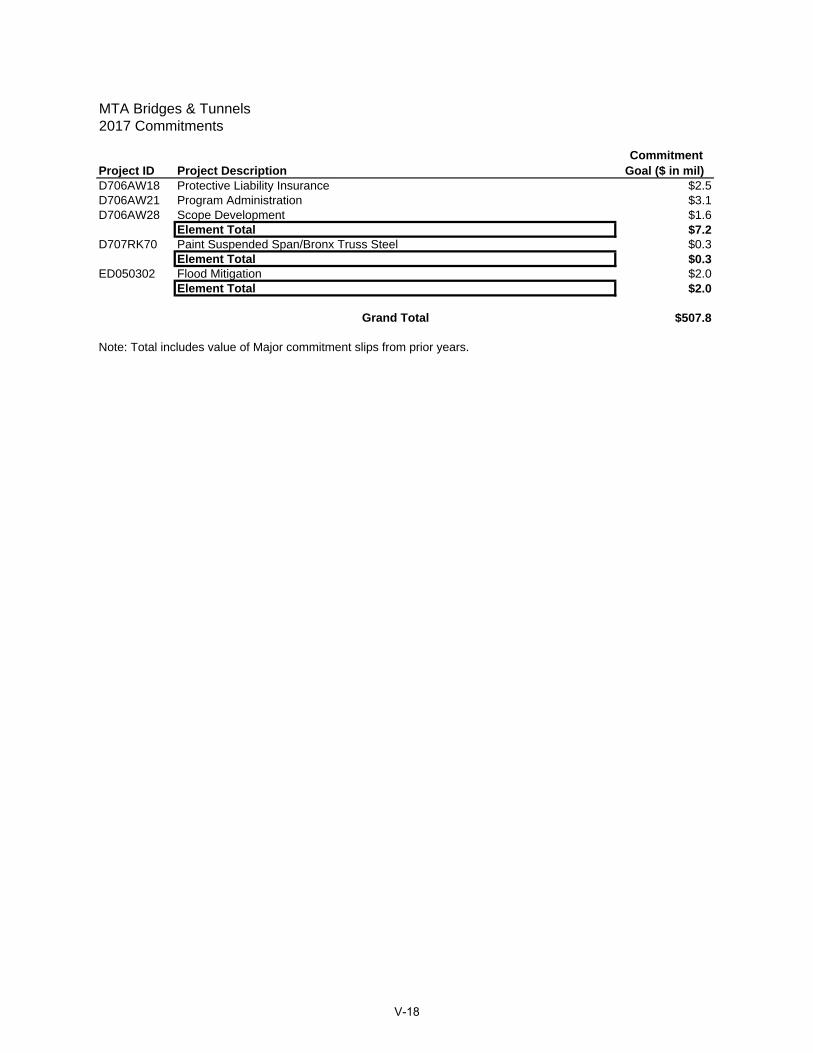
MTA Bridges & Tunnels2017 Commitments
Project ID Project Description CommitmentGoal ($ in mil)
D706AW18 Protective Liability Insurance $2.5D706AW21 Program Administration $3.1D706AW28 Scope Development $1.6
Element Total $7.2D707RK70 Paint Suspended Span/Bronx Truss Steel $0.3
Element Total $0.3ED050302 Flood Mitigation $2.0
Element Total $2.0
Grand Total $507.8
Note: Total includes value of Major commitment slips from prior years.
V-18
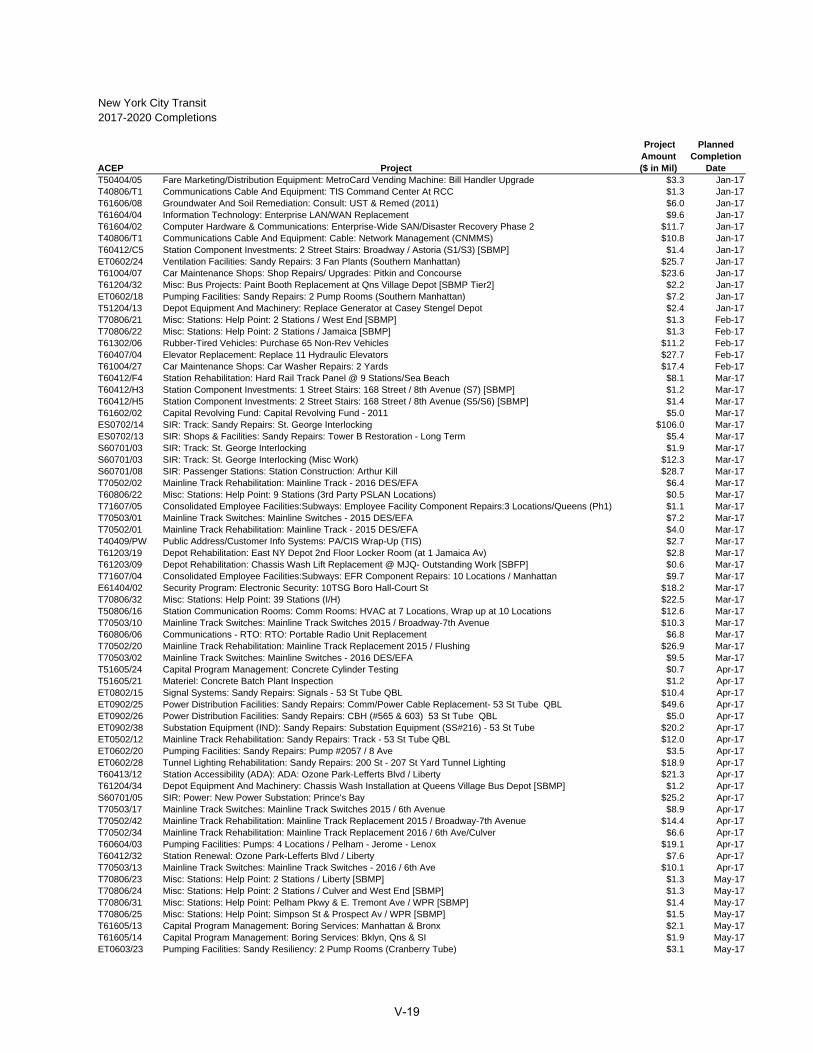
New York City Transit2017-2020 Completions
ACEP Project
ProjectAmount($ in Mil)
PlannedCompletion
DateT50404/05 Fare Marketing/Distribution Equipment: MetroCard Vending Machine: Bill Handler Upgrade $3.3 Jan-17T40806/T1 Communications Cable And Equipment: TIS Command Center At RCC $1.3 Jan-17T61606/08 Groundwater And Soil Remediation: Consult: UST & Remed (2011) $6.0 Jan-17T61604/04 Information Technology: Enterprise LAN/WAN Replacement $9.6 Jan-17T61604/02 Computer Hardware & Communications: Enterprise-Wide SAN/Disaster Recovery Phase 2 $11.7 Jan-17T40806/T1 Communications Cable And Equipment: Cable: Network Management (CNMMS) $10.8 Jan-17T60412/C5 Station Component Investments: 2 Street Stairs: Broadway / Astoria (S1/S3) [SBMP] $1.4 Jan-17ET0602/24 Ventilation Facilities: Sandy Repairs: 3 Fan Plants (Southern Manhattan) $25.7 Jan-17T61004/07 Car Maintenance Shops: Shop Repairs/ Upgrades: Pitkin and Concourse $23.6 Jan-17T61204/32 Misc: Bus Projects: Paint Booth Replacement at Qns Village Depot [SBMP Tier2] $2.2 Jan-17ET0602/18 Pumping Facilities: Sandy Repairs: 2 Pump Rooms (Southern Manhattan) $7.2 Jan-17T51204/13 Depot Equipment And Machinery: Replace Generator at Casey Stengel Depot $2.4 Jan-17T70806/21 Misc: Stations: Help Point: 2 Stations / West End [SBMP] $1.3 Feb-17T70806/22 Misc: Stations: Help Point: 2 Stations / Jamaica [SBMP] $1.3 Feb-17T61302/06 Rubber-Tired Vehicles: Purchase 65 Non-Rev Vehicles $11.2 Feb-17T60407/04 Elevator Replacement: Replace 11 Hydraulic Elevators $27.7 Feb-17T61004/27 Car Maintenance Shops: Car Washer Repairs: 2 Yards $17.4 Feb-17T60412/F4 Station Rehabilitation: Hard Rail Track Panel @ 9 Stations/Sea Beach $8.1 Mar-17T60412/H3 Station Component Investments: 1 Street Stairs: 168 Street / 8th Avenue (S7) [SBMP] $1.2 Mar-17T60412/H5 Station Component Investments: 2 Street Stairs: 168 Street / 8th Avenue (S5/S6) [SBMP] $1.4 Mar-17T61602/02 Capital Revolving Fund: Capital Revolving Fund - 2011 $5.0 Mar-17ES0702/14 SIR: Track: Sandy Repairs: St. George Interlocking $106.0 Mar-17ES0702/13 SIR: Shops & Facilities: Sandy Repairs: Tower B Restoration - Long Term $5.4 Mar-17S60701/03 SIR: Track: St. George Interlocking $1.9 Mar-17S60701/03 SIR: Track: St. George Interlocking (Misc Work) $12.3 Mar-17S60701/08 SIR: Passenger Stations: Station Construction: Arthur Kill $28.7 Mar-17T70502/02 Mainline Track Rehabilitation: Mainline Track - 2016 DES/EFA $6.4 Mar-17T60806/22 Misc: Stations: Help Point: 9 Stations (3rd Party PSLAN Locations) $0.5 Mar-17T71607/05 Consolidated Employee Facilities:Subways: Employee Facility Component Repairs:3 Locations/Queens (Ph1) $1.1 Mar-17T70503/01 Mainline Track Switches: Mainline Switches - 2015 DES/EFA $7.2 Mar-17T70502/01 Mainline Track Rehabilitation: Mainline Track - 2015 DES/EFA $4.0 Mar-17T40409/PW Public Address/Customer Info Systems: PA/CIS Wrap-Up (TIS) $2.7 Mar-17T61203/19 Depot Rehabilitation: East NY Depot 2nd Floor Locker Room (at 1 Jamaica Av) $2.8 Mar-17T61203/09 Depot Rehabilitation: Chassis Wash Lift Replacement @ MJQ- Outstanding Work [SBFP] $0.6 Mar-17T71607/04 Consolidated Employee Facilities:Subways: EFR Component Repairs: 10 Locations / Manhattan $9.7 Mar-17E61404/02 Security Program: Electronic Security: 10TSG Boro Hall-Court St $18.2 Mar-17T70806/32 Misc: Stations: Help Point: 39 Stations (I/H) $22.5 Mar-17T50806/16 Station Communication Rooms: Comm Rooms: HVAC at 7 Locations, Wrap up at 10 Locations $12.6 Mar-17T70503/10 Mainline Track Switches: Mainline Track Switches 2015 / Broadway-7th Avenue $10.3 Mar-17T60806/06 Communications - RTO: RTO: Portable Radio Unit Replacement $6.8 Mar-17T70502/20 Mainline Track Rehabilitation: Mainline Track Replacement 2015 / Flushing $26.9 Mar-17T70503/02 Mainline Track Switches: Mainline Switches - 2016 DES/EFA $9.5 Mar-17T51605/24 Capital Program Management: Concrete Cylinder Testing $0.7 Apr-17T51605/21 Materiel: Concrete Batch Plant Inspection $1.2 Apr-17ET0802/15 Signal Systems: Sandy Repairs: Signals - 53 St Tube QBL $10.4 Apr-17ET0902/25 Power Distribution Facilities: Sandy Repairs: Comm/Power Cable Replacement- 53 St Tube QBL $49.6 Apr-17ET0902/26 Power Distribution Facilities: Sandy Repairs: CBH (#565 & 603) 53 St Tube QBL $5.0 Apr-17ET0902/38 Substation Equipment (IND): Sandy Repairs: Substation Equipment (SS#216) - 53 St Tube $20.2 Apr-17ET0502/12 Mainline Track Rehabilitation: Sandy Repairs: Track - 53 St Tube QBL $12.0 Apr-17ET0602/20 Pumping Facilities: Sandy Repairs: Pump #2057 / 8 Ave $3.5 Apr-17ET0602/28 Tunnel Lighting Rehabilitation: Sandy Repairs: 200 St - 207 St Yard Tunnel Lighting $18.9 Apr-17T60413/12 Station Accessibility (ADA): ADA: Ozone Park-Lefferts Blvd / Liberty $21.3 Apr-17T61204/34 Depot Equipment And Machinery: Chassis Wash Installation at Queens Village Bus Depot [SBMP] $1.2 Apr-17S60701/05 SIR: Power: New Power Substation: Prince's Bay $25.2 Apr-17T70503/17 Mainline Track Switches: Mainline Track Switches 2015 / 6th Avenue $8.9 Apr-17T70502/42 Mainline Track Rehabilitation: Mainline Track Replacement 2015 / Broadway-7th Avenue $14.4 Apr-17T70502/34 Mainline Track Rehabilitation: Mainline Track Replacement 2016 / 6th Ave/Culver $6.6 Apr-17T60604/03 Pumping Facilities: Pumps: 4 Locations / Pelham - Jerome - Lenox $19.1 Apr-17T60412/32 Station Renewal: Ozone Park-Lefferts Blvd / Liberty $7.6 Apr-17T70503/13 Mainline Track Switches: Mainline Track Switches - 2016 / 6th Ave $10.1 Apr-17T70806/23 Misc: Stations: Help Point: 2 Stations / Liberty [SBMP] $1.3 May-17T70806/24 Misc: Stations: Help Point: 2 Stations / Culver and West End [SBMP] $1.3 May-17T70806/31 Misc: Stations: Help Point: Pelham Pkwy & E. Tremont Ave / WPR [SBMP] $1.4 May-17T70806/25 Misc: Stations: Help Point: Simpson St & Prospect Av / WPR [SBMP] $1.5 May-17T61605/13 Capital Program Management: Boring Services: Manhattan & Bronx $2.1 May-17T61605/14 Capital Program Management: Boring Services: Bklyn, Qns & SI $1.9 May-17ET0603/23 Pumping Facilities: Sandy Resiliency: 2 Pump Rooms (Cranberry Tube) $3.1 May-17
V-19

New York City Transit2017-2020 Completions
ACEP Project
ProjectAmount($ in Mil)
PlannedCompletion
DateET0602/30 Pumping Facilities: Sandy Repairs: 2 Pump Rooms (Cranberry Tube) $11.0 May-17T70414/03 Misc: Stations: Station Entrance: 8 Avenue/Sea Beach (Stair P6) $0.2 May-17ET0602/31 Ventilation Facilities: Sandy Repairs: Fan Plant (#6330, #6332)/Cranberry Tube $15.6 May-17ET0802/14 Signal Systems: Sandy Repairs: Signals in the Cranberry Tube $15.0 May-17ET0902/32 Power Distribution Facilities: Sandy Repairs: CBH #502/Cranberry Tube $3.4 May-17ET0902/33 Substation Equipment (IND): Sandy Repairs: Substation Equipment (SS#90)/ Cranberry Tube $3.9 May-17ET0902/20 Power Distribution Facilities: Sandy Repairs: Comm/Power Cable - Cranberry Tube $54.2 May-17ET0403/15 Misc: Stations: Sandy Mitigation: Hatches (5 of 8 Stations) [SBFP] $3.8 May-17T71204/03 Misc: Bus Projects: Bus Rapid Transit: Advance 240 MFCs $5.5 May-17T71004/11 Yard Track Rehabilitation: Yard Track - 2016 $3.1 May-17T71004/16 Yard Switches: Yard Switches - 2015 $2.7 May-17T70503/16 Mainline Track Switches: Mainline Track Switches - 2016 / Queens Blvd $18.4 May-17T71604/05 Information Technology: Replace Superdome Server: 2 Broadway $1.4 Jun-17ET0603/13 Pumping Facilities: Sandy Mitigation: 2 Pump Rooms, Joralemon Tube $7.4 Jun-17T61204/33 Depot Equipment And Machinery: Removal of In-ground Lifts at 5 Depots $2.4 Jun-17ET0502/13 Mainline Track Rehabilitation: Sandy Repairs: South Ferry Track $18.8 Jun-17T70502/18 Mainline Track Rehabilitation: Mainline Track Replacement 2015 / Queens Blvd $78.6 Jun-17T70502/46 Mainline Track Rehabilitation: Mainline Track Replacement 2016 / 8th Avenue $55.8 Jun-17ET0602/27 Tunnel Lighting Rehabilitation: Sandy Repairs: South Ferry Tunnel Lighting $9.2 Jun-17T70502/21 Mainline Track Rehabilitation: Mainline Track Replacement 2015 / 8th Avenue $60.4 Jun-17ET0902/35 Power Distribution Facilities: Sandy Repairs: South Ferry CBHs # 367 & 368 $18.9 Jun-17T70503/19 Mainline Track Switches: Mainline Track Switches 2016 / Broadway-7th Avenue $8.9 Jun-17ET0802/01 Signal Systems: Sandy Repairs: South Ferry Interlocking $66.5 Jun-17ET0402/13 Misc: Stations: Sandy Repairs: South Ferry Station Complex $190.1 Jun-17T70502/08 Welded Rail: Continuous Welded Rail - 2016 / Queens Blvd $27.4 Jun-17ET1602/11 Consolidated Employee Facilities:Subways: Sandy Repairs: Employee Facilty at Whitehall Station BWY $2.8 Jun-17T41204/01 Radio & Data Communication: AVLM: Paratransit - 2,273 Vehicles $39.2 Jun-17T70502/13 Mainline Track Rehabilitation: Track Force Account - 2016 $35.0 Jun-17T70803/21 Signal Systems: AC to DC Line Relay Conversions Phase 2 / FUL $13.6 Jun-17T71604/03 Computer Hardware & Communications: Purchase HP SAN Hardware for Disaster Recovery: 2 Broadway $1.4 Jun-17T61607/27 Maintenance Of Way: RTO Facility Hardening: South Ferry Terminal BW7 $1.2 Jun-17T70502/30 Mainline Track Rehabilitation: Mainline Track Replacement 2016 / Brighton $22.4 Jun-17T70503/09 Mainline Track Switches: Mainline Track Switches 2015 / 8th Avenue $2.9 Jun-17T70502/33 Mainline Track Rehabilitation: Mainline Track Replacement 2016 / Dyre $13.8 Jun-17T61602/01 Capital Revolving Fund: Capital Revolving Fund - 2010 $5.0 Jun-17T60806/21 Communications Cable And Equipment: Passenger Station LAN: 30 Stations $26.5 Jun-17ET0902/21 Power Distribution Facilities: Sandy Repairs: Comm/Power Cable & Ducts - Joralemon Tube $59.7 Jun-17T70502/17 Mainline Track Rehabilitation: Mainline Track Replacement 2015 / Brighton $16.0 Jun-17T70502/07 Welded Rail: Continuous Welded Rail 2015 / QBL $19.9 Jun-17T70502/19 Mainline Track Rehabilitation: Mainline Track Replacement 2015 / West End $7.0 Jun-17ET0602/23 Ventilation Facilities: Sandy Repairs: Fan Plant South Ferry $7.3 Jun-17T70502/32 Mainline Track Rehabilitation: Mainline Track Replacement 2016 / Queens Blvd $46.8 Jun-17T70502/37 Mainline Track Rehabilitation: Mainline Track Replacement 2016 / Pelham $7.1 Jun-17ET0502/16 Mainline Track Switches: Sandy Repairs: Mainline Switches South Ferry $6.8 Jun-17T30803/CN Mainline Track Rehabilitation: CBTC Canarsie: I/H Track Wrap-Up $5.2 Jun-17T70503/12 Mainline Track Switches: Mainline Track Switches - 2016 / Jamaica $5.3 Jun-17ET1602/12 Water Conditions Remedy: Sandy Repair: South Ferry Leak Mitigation $11.3 Jun-17T60302/26 Misc: Bus Projects: DOB: Integrated Asset Management Planning System (EAM) $7.0 Jun-17ET0602/16 Tunnel Lighting Rehabilitation: Sandy Repairs: Tunnel Lighting - Joralemon Tube $44.5 Jun-17ET0602/17 Pumping Facilities: Sandy Repairs: 1 Pump Room (South Ferry) $5.4 Jun-17T70503/18 Mainline Track Switches: Mainline Track Switches - 2016 / 8th Ave $6.8 Jun-17T61607/13 Consolidated Employee Facilities:Subways: 207 Street / 8th Avenue $8.8 Jun-17ET0902/18 Substation Equipment (IRT-BMT): Sandy Repairs: Substation Equipment - Joralemon Tube $5.6 Jun-17T70502/43 Mainline Track Rehabilitation: Mainline Track Replacement 2015 / Dyre $4.1 Jun-17T50803/32 Signal Systems: Alstom Relay Replacement - Room @ 211th St/BW $0.2 Jun-17T60412/49 Station Renewal: Sutter Avenue-Rutland Road / New Lots $13.2 Jun-17T71604/02 Computer Hardware & Communications: Data Storage & Virtual Server Enhancements @ 2 Bdwy &130 Liv $5.0 Jun-17T60412/50 Station Renewal: Van Siclen Avenue / New Lots $14.4 Jun-17T60412/92 Station Component Investments: New Lots Av Station / New Lots Line $3.5 Jun-17T60412/48 Station Renewal: Junius Street / New Lots $13.3 Jun-17T60412/45 Station Renewal: Pennsylvania Avenue / New Lots $13.6 Jun-17T60412/47 Station Renewal: Saratoga Avenue / New Lots $13.1 Jun-17T60412/46 Station Renewal: Rockaway Avenue / New Lots $13.5 Jun-17T71604/06 Computer Hardware & Communications: CADD/BIM/DMS Disaster Recovery/ Business Continuity $1.2 Jul-17T60414/05 Misc: Stations: New Stair P16: Grand-Central-42 Street / Lexington $1.0 Jul-17T60414/05 Misc: Stations: Access Improvements: Grand Central / LEX $22.3 Jul-17T70806/28 Misc: Stations: Help Point: 2 Stations / Jerome [SBMP] $1.3 Jul-17
V-20

New York City Transit2017-2020 Completions
ACEP Project
ProjectAmount($ in Mil)
PlannedCompletion
DateT60803/13 Signal Systems: Dyre Avenue Line Signals $226.1 Jul-17T70502/45 Mainline Track Rehabilitation: Mainline Track Replacement 2016 / Flushing $7.7 Jul-17T70502/31 Mainline Track Rehabilitation: Mainline Track Replacement 2016 / Jamaica $18.7 Jul-17T70502/38 Mainline Track Rehabilitation: Mainline Track Replacement 2016 / WPR $6.3 Jul-17T60806/20 Station Communication Rooms: Hydrogen Gas Ventilation: 19 Communications Rooms $10.9 Jul-17T70502/47 Mainline Track Rehabilitation: Mainline Track Replacement 2016 / Lenox-White Plains Rd $1.1 Jul-17T61605/15 Capital Program Management: Test Pits Contract (2014) $5.4 Jul-17T61004/52 Mainline Track Rehabilitation: Integrated Wheel/Rail Monitoring and Analytics $4.6 Jul-17T61604/02 Computer Hardware & Communications: Replace Server Hardware: RCC and BCC $3.2 Aug-17T70502/36 Welded Rail: Continuous Welded Rail 2016 / 8th Ave $61.5 Aug-17T71004/17 Yard Switches: Yard Switches - 2016 $4.7 Aug-17T50414/26 Public Address/Customer Info Systems: PA/CIS: B Division Furnish/Deliver CIS 89 Stations $8.4 Aug-17T70502/28 Welded Rail: Continuous Welded Rail 2015 / 8th Ave $44.5 Aug-17T70806/26 Misc: Stations: Help Point: West 8 St / CIT [SBMP] $1.0 Aug-17T60703/32 Line Structure Overcoating: Bridge Work at Dyre Ave Station $2.6 Sep-17T60412/A4 Station Component Investments: Eastchester-Dyre Av / Dyre $25.7 Sep-17T61606/10 Asbestos Abatement: Asbestos/Lead: Air Monitor $9.1 Sep-17T61606/04 Asbestos Abatement: Asbestos Disposal $0.9 Sep-17T61606/09 Asbestos Abatement: Asbestos Abatement - 2013 $9.7 Sep-17ET0402/17 Fare Marketing/Distribution Equipment: Sandy Repairs: Purchase and Install AFC Equipment $12.0 Sep-17T51302/10 Rubber-Tired Vehicles: Diesel Particulate Filters: Non-Rev Fleet $5.0 Sep-17T70302/02 New Buses: 138 Standard CNG Buses $85.1 Sep-17T40803/CI Mainline Track Rehabilitation: SSI Bergen: I/H Track Wrap-Up $1.8 Sep-17E61404/03 Security Program: Electronic Security: 10TSG Atlantic/Pacific $24.3 Sep-17ET0403/07 Misc: Stations: Sandy Mitig: Lower Mhttn Flood Drs /Hatches-Rem Work [SBFP] $1.4 Sep-17T70502/63 Mainline Track Rehabilitation: Mainline Track Replacement 2017 / Broadway-7th Ave $8.9 Sep-17ET0403/14 Misc: Stations: Sandy Mitigation:Stairwell Prot (Flexgates) - 6 of 8 Station $18.7 Sep-17T60302/29 Radio & Data Communication: Digital Information Signs: 3 Route Pilot $3.0 Sep-17T60404/10 Fare Control Modernization: Passenger Station LAN: 6 Stations $6.1 Oct-17T61607/20 Maintenance Of Way: RTO Facilities Hardening Ph 2 $11.6 Oct-17T60604/04 Pumping Facilities: Pumps: 2 Locations - Manhattan $13.3 Oct-17T61204/22 Depot Rehabilitation: Manhattanville: Comprehensive Facade Repairs $21.9 Oct-17T70806/29 Misc: Stations: Help Point: 2 Stations / Flushing [SBMP] $1.4 Nov-17T60407/05 Elevator Replacement: 7 Hydraulic Elevators / Lexington $29.3 Nov-17T61607/28 Facilities: Upgrade HVAC 130 Livingston Plaza Data Center [SBMP Tier2] $3.9 Nov-17T71204/15 Bus Washers: Replace 2 Bus Washers: Fresh Pond Depot [SBDP Tier2] $3.1 Nov-17T50803/08 Communication-Based Train Control: CBTC Flushing Line $384.8 Nov-17T60302/34 New Buses: 139 Articulated Buses (New Flyer) $120.3 Nov-17T70412/98 Enhanced Stations Initiatives: Enhanced Stations: (Pkg #1) - Prospect Ave / 4th Ave $31.5 Nov-17T61204/29 Radio & Data Communication: Bus Command Center Construction - NYCT $59.5 Nov-17T60803/06 Communication-Based Train Control: CBTC Flushing: Additional Support Costs $152.6 Nov-17T60412/95 Station Component Investments: Station Ventilators: Ph 6 - 5 Loc / Upper Manhattan & Bronx $5.9 Nov-17T60404/11 Communications Cable And Equipment: Passenger Station LAN: 188 Stations (Transit Wireless) $61.1 Nov-17T70412/99 Enhanced Stations Initiatives: Enhanced Stations: (Pkg #1) - 53 St / 4th Ave $34.2 Nov-17T70412/97 Enhanced Stations Initiatives: Enhanced Stations: (Pkg #1) - Bay Ridge Avenue / 4th Avenue $34.7 Nov-17T70503/11 Mainline Track Switches: Mainline Track Switches 2015 / Dyre $7.6 Dec-17T61004/25 Car Maintenance Shops: 207 St Overhaul: Equipment for Car HVAC Repair & Maintenance $2.2 Dec-17T61004/39 Car Maintenance Shops: 2-Ton Overhead Crane - Concourse $3.0 Dec-17T60902/07 Substation Enclosures (IRT-BMT): Roof and Enclosure: Concourse E. 144th St [SBMP] $1.4 Dec-17T61004/53 Car Maintenance Shops: 2-Ton Overhead Crane 207th Street Shop $3.0 Dec-17T51203/05 New Depots & Facilities: Jamaica Depot: Demolition at New Properties [SBMP Tier2] $0.1 Dec-17T70503/15 Mainline Track Switches: Mainline Track Switches - 2016 / Dyre $4.9 Dec-17T70502/55 Mainline Track Rehabilitation: Mainline Track Replacement 2017 / Canarsie $13.5 Dec-17T70502/23 Mainline Track Rehabilitation: Mainline Track Replacement 2015 / Pelham $3.5 Dec-17T71605/08 Capital Program Management: Construction Support Reserve 2016 $6.5 Dec-17T70414/05 Misc: Stations: Water Condition Remedy - 2015 $3.8 Dec-17T60703/06 Demolition Of Abandoned Structures: Demolition of Abandoned Structures - Various - Ph1 $15.2 Dec-17T71605/05 Capital Program Management: GO Support - Traffic Checkers 2017 $9.0 Dec-17T61203/11 Depot Rehabilitation: Upgrade 3rd Floor HVAC & Rehab Office - ENY $4.8 Dec-17T70806/20 Misc: Stations: Help Point: 23 Stations (Transit Wireless) $9.6 Dec-17T70502/22 Mainline Track Rehabilitation: Mainline Track Replacement 2015 / Jerome $6.4 Dec-17T70502/68 Mainline Track Rehabilitation: Mainline Track Replacement 2017 / White Plains Road $8.0 Dec-17T70703/30 Line Structure Rehabilitation: Rehabilitation of Emergency Exits - 2 Locations $7.0 Dec-17T71204/13 Depot Equipment And Machinery: Bus Washer: Zerega Consolidated Maint Facility [SBDP] $1.3 Jan-18T60806/31 Public Address/Customer Info Systems: ISIM B-Div Module 2: Comm Room Upgrades $2.5 Jan-18T60806/05 Station Communication Rooms: Comm Room Upgrade And Expansion-Phase 1 $15.4 Jan-18T60412/43 Station Renewal: Ditmas Avenue / Culver $21.0 Jan-18
V-21

New York City Transit2017-2020 Completions
ACEP Project
ProjectAmount($ in Mil)
PlannedCompletion
DateT60412/42 Station Renewal: 18 Avenue / Culver $19.6 Jan-18T60412/38 Station Renewal: Avenue X / Culver $19.5 Jan-18T60412/39 Station Renewal: Avenue U / Culver $16.8 Jan-18T60412/81 Station Component Investments: 2 Locations / Culver $21.3 Jan-18T60412/41 Station Renewal: Bay Parkway / Culver $14.2 Jan-18T60412/44 Station Renewal: Avenue I / Culver $17.0 Jan-18N61201/03 MN: Miscellaneous: Tappan Zee Bridge Rail Study $0.9 Jan-18T60412/40 Station Renewal: Avenue P / Culver $15.3 Jan-18T70806/05 Communications Cable And Equipment: Copper Cable Upgrade/Replacement Phase 4 $12.1 Jan-18T61606/06 Fire Protection: Fire Alarm: 207 Street Overhaul Shop $12.8 Jan-18E61402/04 Security Program: Penn Stn: Perim Protection-Ph III-31/33 St Ldng Dcks $8.6 Jan-18T50806/15 Public Address/Customer Info Systems: PA/CIS: 45 Stns: Furnish-Install Cabinets $21.4 Jan-18T60404/01 Fare Control Modernization: AFC Replacement, Phase 2: Electronic Boards $30.0 Jan-18T60302/18 Fare Control Modernization: Replace Integrated Farebox Unit (IFU) Components, Phase 2 $21.9 Jan-18T60902/06 Misc: Power: Substation Hatchways: Phase 3 $11.3 Jan-18ET0603/06 Ventilation Facilities: Sandy Mitigation: 14 Fan Plants, NT -Above Grade Prot,6 Locs $6.5 Jan-18T60806/04 Public Address/Customer Info Systems: PA/CIS: 45 Stations: Install Cable $56.0 Jan-18T50806/15 Public Address/Customer Info Systems: PA/CIS: 44 Stns: Furnish-Install Cabinets $20.5 Jan-18T61606/07 Groundwater And Soil Remediation: Groundwater & Soil Remed - 2011 $6.5 Feb-18T60412/G5 Station Component Investments: Station Ventilators: Ph 8 - 3 Loc / Southeast Brooklyn $6.5 Feb-18T60414/12 Station Reconstruction: Reconstruct Cortlandt St Station BW7 $158.4 Feb-18T60412/H7 Station Component Investments: Station Ventilators: Ph 9 - 2 Loc / Southwest Brooklyn $2.9 Feb-18ET1603/09 Consolidated Employee Facilities:Subways: Sandy Mitigation: NTFP Stillwell Terminal Facilities [SBFP] $0.6 Feb-18T70703/12 Line Structure Overcoating: Portal to 164 Street / Jerome $11.0 Feb-18ET0403/18 Misc: Stations: Sandy Mitigation: Coastal Storm MCD $10.4 Feb-18T71204/07 Depot Rehabilitation: Shoreline Upgrade: Kingsbridge Depot $5.5 Feb-18T60803/10 Signal Systems: 2 Interlockings: Union Turnpike & 71 Av $297.8 Feb-18T60412/F2 Station Component Investments: Station Ventilators: Ph 7 - 8 Loc /Lower Manhattan $5.1 Feb-18T71204/14 Depot Equipment And Machinery: Chassis Wash: Casey Stengel Depot [SBDP] $1.2 Mar-18T60603/04 Ventilation Facilities: Vent Plant: 46th Street-Northern Blvd / Queens Blvd Line $87.4 Mar-18T71004/29 Car Maintenance Shops: Structural Remediation: E 180 St Maint Shop & Retaining Wall $6.1 Mar-18T60412/C8 Station Component Investments: 5 Street Stairs: Rector Street / Broadway (SB) [SBMP Tier2] $3.9 Mar-18EU0302/01 Depot Rehabilitation: Sandy Repairs: Depot Rehabilitation, Far Rockaway $15.0 Mar-18T60302/35 New Buses: 92 Articulated Buses (Nova) $81.9 Mar-18T70806/18 Security: Track Intrusion Detection: Pilot Phase 2 $2.6 Mar-18T61203/18 Depot Rehabilitation: Jackie Gleason Depot CNG Compressor $2.4 Apr-18T61204/02 Misc: Bus Projects: BRT: Traffic Signal Priority Rollout 1100 Buses (SBS) $3.1 Apr-18T61605/11 Capital Program Management: Concrete Batch Plant (2012) $1.3 Apr-18T61602/03 Capital Revolving Fund: Capital Revolving Fund - 2012 $5.0 Apr-18T71604/01 Information Technology: Upgrade Copper Cable: Livingston Plaza $3.6 Apr-18T70407/10 Escalator Replacement: Jay St Escalator Realignment $15.0 Apr-18T70902/09 Substation Enclosures (IRT-BMT): Rehab Substat Roof & Encl Gates Av/Ridgewood [SBMP Tier2] $5.6 Apr-18T61602/04 Capital Revolving Fund: Capital Revolving Fund - 2013 $5.0 Apr-18T61607/19 Roofing Repair & Replacement: DOS Roof Replacement Phase 4 $16.4 Apr-18T70902/08 Substation Enclosures (IRT-BMT): Rehab Substation Roof & Enclosure: Jerome/E 162 St $8.0 Apr-18T60603/05 Ventilation Facilities: Replace Vent Controls: 22 Locations $16.2 Apr-18T60806/23 Communications Cable And Equipment: Passenger Station LAN: Solarwinds Network Management System $5.0 Apr-18T61004/10 Yard Rehabilitation: Yard CCTV, Phase 2 $3.1 Apr-18T61602/09 Owner-Controlled Insurance Program: 2012-2014 Owner Controlled Insurance Program $101.4 Apr-18T51203/12 Depot Rehabilitation: Replace Roof at East New York Bus Depot $6.8 May-18T70902/24 Substation Enclosures (IRT-BMT): Rehab Substation Roof & Encl Stanton St [SBMP Tier2] $5.3 May-18T71004/12 Yard Track Rehabilitation: Yard Track - 2017 $2.3 May-18T60302/32 Radio & Data Communication: Digital Information Signs: Depot Wi-Fi $3.2 May-18T61204/42 Misc: Bus Projects: Upgrade One and Install New Paint Booth -Zerega [SBMP Tier2] $0.3 May-18T71203/04 Depot Equipment And Machinery: Chassis Wash: Grand Ave Depot [SBDP] $2.6 May-18T70502/51 Mainline Track Rehabilitation: Mainline Track Replacement 2017 / Brighton $6.8 May-18T60602/03 Tunnel Lighting Rehabilitation: 36 St To Jackson-Roosevelt / Queens Blvd $52.2 Jun-18T70803/19 Maintenance Of Way: Signal Circuit Modifications Phase 6 - Part 1 $15.2 Jun-18T61204/20 Misc: Bus Projects: Jamaica Bus Terminal Reconfiguration $3.4 Jun-18T70502/14 Mainline Track Rehabilitation: Track Force Account - 2017 $35.0 Jun-18T70414/03 Misc: Stations: Station Entrance: 8 Avenue / Sea Beach $14.9 Jul-18T61302/07 Work Train & Special Equipment: Purchase 3 Vacuum Trains $34.7 Jul-18T61605/12 Capital Program Management: Concrete Cylinder Testing (2012) $0.8 Aug-18T61204/02 Misc: Bus Projects: BRT - Bus Rapid Transit 2010-2014 (SBS) $25.4 Aug-18T70412/22 Station Component Investments: Platform Components: 2 Locations / 4th Avenue $5.4 Aug-18T71204/05 Misc: Bus Projects: Storage Tank Components: Jackie Gleason and Castleton Depots $7.9 Aug-18T60806/58 Communication Equipment: Police: Police Radio System: Enhanced Coverage $4.5 Aug-18
V-22
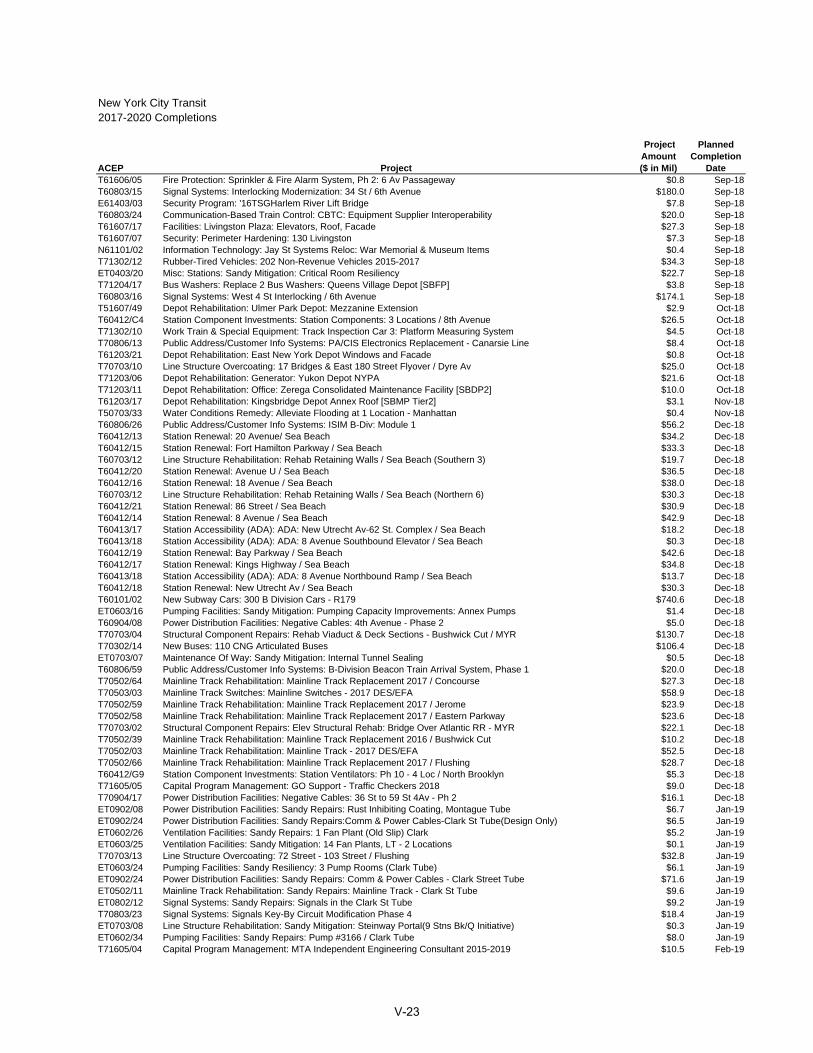
New York City Transit2017-2020 Completions
ACEP Project
ProjectAmount($ in Mil)
PlannedCompletion
DateT61606/05 Fire Protection: Sprinkler & Fire Alarm System, Ph 2: 6 Av Passageway $0.8 Sep-18T60803/15 Signal Systems: Interlocking Modernization: 34 St / 6th Avenue $180.0 Sep-18E61403/03 Security Program: '16TSGHarlem River Lift Bridge $7.8 Sep-18T60803/24 Communication-Based Train Control: CBTC: Equipment Supplier Interoperability $20.0 Sep-18T61607/17 Facilities: Livingston Plaza: Elevators, Roof, Facade $27.3 Sep-18T61607/07 Security: Perimeter Hardening: 130 Livingston $7.3 Sep-18N61101/02 Information Technology: Jay St Systems Reloc: War Memorial & Museum Items $0.4 Sep-18T71302/12 Rubber-Tired Vehicles: 202 Non-Revenue Vehicles 2015-2017 $34.3 Sep-18ET0403/20 Misc: Stations: Sandy Mitigation: Critical Room Resiliency $22.7 Sep-18T71204/17 Bus Washers: Replace 2 Bus Washers: Queens Village Depot [SBFP] $3.8 Sep-18T60803/16 Signal Systems: West 4 St Interlocking / 6th Avenue $174.1 Sep-18T51607/49 Depot Rehabilitation: Ulmer Park Depot: Mezzanine Extension $2.9 Oct-18T60412/C4 Station Component Investments: Station Components: 3 Locations / 8th Avenue $26.5 Oct-18T71302/10 Work Train & Special Equipment: Track Inspection Car 3: Platform Measuring System $4.5 Oct-18T70806/13 Public Address/Customer Info Systems: PA/CIS Electronics Replacement - Canarsie Line $8.4 Oct-18T61203/21 Depot Rehabilitation: East New York Depot Windows and Facade $0.8 Oct-18T70703/10 Line Structure Overcoating: 17 Bridges & East 180 Street Flyover / Dyre Av $25.0 Oct-18T71203/06 Depot Rehabilitation: Generator: Yukon Depot NYPA $21.6 Oct-18T71203/11 Depot Rehabilitation: Office: Zerega Consolidated Maintenance Facility [SBDP2] $10.0 Oct-18T61203/17 Depot Rehabilitation: Kingsbridge Depot Annex Roof [SBMP Tier2] $3.1 Nov-18T50703/33 Water Conditions Remedy: Alleviate Flooding at 1 Location - Manhattan $0.4 Nov-18T60806/26 Public Address/Customer Info Systems: ISIM B-Div: Module 1 $56.2 Dec-18T60412/13 Station Renewal: 20 Avenue/ Sea Beach $34.2 Dec-18T60412/15 Station Renewal: Fort Hamilton Parkway / Sea Beach $33.3 Dec-18T60703/12 Line Structure Rehabilitation: Rehab Retaining Walls / Sea Beach (Southern 3) $19.7 Dec-18T60412/20 Station Renewal: Avenue U / Sea Beach $36.5 Dec-18T60412/16 Station Renewal: 18 Avenue / Sea Beach $38.0 Dec-18T60703/12 Line Structure Rehabilitation: Rehab Retaining Walls / Sea Beach (Northern 6) $30.3 Dec-18T60412/21 Station Renewal: 86 Street / Sea Beach $30.9 Dec-18T60412/14 Station Renewal: 8 Avenue / Sea Beach $42.9 Dec-18T60413/17 Station Accessibility (ADA): ADA: New Utrecht Av-62 St. Complex / Sea Beach $18.2 Dec-18T60413/18 Station Accessibility (ADA): ADA: 8 Avenue Southbound Elevator / Sea Beach $0.3 Dec-18T60412/19 Station Renewal: Bay Parkway / Sea Beach $42.6 Dec-18T60412/17 Station Renewal: Kings Highway / Sea Beach $34.8 Dec-18T60413/18 Station Accessibility (ADA): ADA: 8 Avenue Northbound Ramp / Sea Beach $13.7 Dec-18T60412/18 Station Renewal: New Utrecht Av / Sea Beach $30.3 Dec-18T60101/02 New Subway Cars: 300 B Division Cars - R179 $740.6 Dec-18ET0603/16 Pumping Facilities: Sandy Mitigation: Pumping Capacity Improvements: Annex Pumps $1.4 Dec-18T60904/08 Power Distribution Facilities: Negative Cables: 4th Avenue - Phase 2 $5.0 Dec-18T70703/04 Structural Component Repairs: Rehab Viaduct & Deck Sections - Bushwick Cut / MYR $130.7 Dec-18T70302/14 New Buses: 110 CNG Articulated Buses $106.4 Dec-18ET0703/07 Maintenance Of Way: Sandy Mitigation: Internal Tunnel Sealing $0.5 Dec-18T60806/59 Public Address/Customer Info Systems: B-Division Beacon Train Arrival System, Phase 1 $20.0 Dec-18T70502/64 Mainline Track Rehabilitation: Mainline Track Replacement 2017 / Concourse $27.3 Dec-18T70503/03 Mainline Track Switches: Mainline Switches - 2017 DES/EFA $58.9 Dec-18T70502/59 Mainline Track Rehabilitation: Mainline Track Replacement 2017 / Jerome $23.9 Dec-18T70502/58 Mainline Track Rehabilitation: Mainline Track Replacement 2017 / Eastern Parkway $23.6 Dec-18T70703/02 Structural Component Repairs: Elev Structural Rehab: Bridge Over Atlantic RR - MYR $22.1 Dec-18T70502/39 Mainline Track Rehabilitation: Mainline Track Replacement 2016 / Bushwick Cut $10.2 Dec-18T70502/03 Mainline Track Rehabilitation: Mainline Track - 2017 DES/EFA $52.5 Dec-18T70502/66 Mainline Track Rehabilitation: Mainline Track Replacement 2017 / Flushing $28.7 Dec-18T60412/G9 Station Component Investments: Station Ventilators: Ph 10 - 4 Loc / North Brooklyn $5.3 Dec-18T71605/05 Capital Program Management: GO Support - Traffic Checkers 2018 $9.0 Dec-18T70904/17 Power Distribution Facilities: Negative Cables: 36 St to 59 St 4Av - Ph 2 $16.1 Dec-18ET0902/08 Power Distribution Facilities: Sandy Repairs: Rust Inhibiting Coating, Montague Tube $6.7 Jan-19ET0902/24 Power Distribution Facilities: Sandy Repairs:Comm & Power Cables-Clark St Tube(Design Only) $6.5 Jan-19ET0602/26 Ventilation Facilities: Sandy Repairs: 1 Fan Plant (Old Slip) Clark $5.2 Jan-19ET0603/25 Ventilation Facilities: Sandy Mitigation: 14 Fan Plants, LT - 2 Locations $0.1 Jan-19T70703/13 Line Structure Overcoating: 72 Street - 103 Street / Flushing $32.8 Jan-19ET0603/24 Pumping Facilities: Sandy Resiliency: 3 Pump Rooms (Clark Tube) $6.1 Jan-19ET0902/24 Power Distribution Facilities: Sandy Repairs: Comm & Power Cables - Clark Street Tube $71.6 Jan-19ET0502/11 Mainline Track Rehabilitation: Sandy Repairs: Mainline Track - Clark St Tube $9.6 Jan-19ET0802/12 Signal Systems: Sandy Repairs: Signals in the Clark St Tube $9.2 Jan-19T70803/23 Signal Systems: Signals Key-By Circuit Modification Phase 4 $18.4 Jan-19ET0703/08 Line Structure Rehabilitation: Sandy Mitigation: Steinway Portal(9 Stns Bk/Q Initiative) $0.3 Jan-19ET0602/34 Pumping Facilities: Sandy Repairs: Pump #3166 / Clark Tube $8.0 Jan-19T71605/04 Capital Program Management: MTA Independent Engineering Consultant 2015-2019 $10.5 Feb-19
V-23
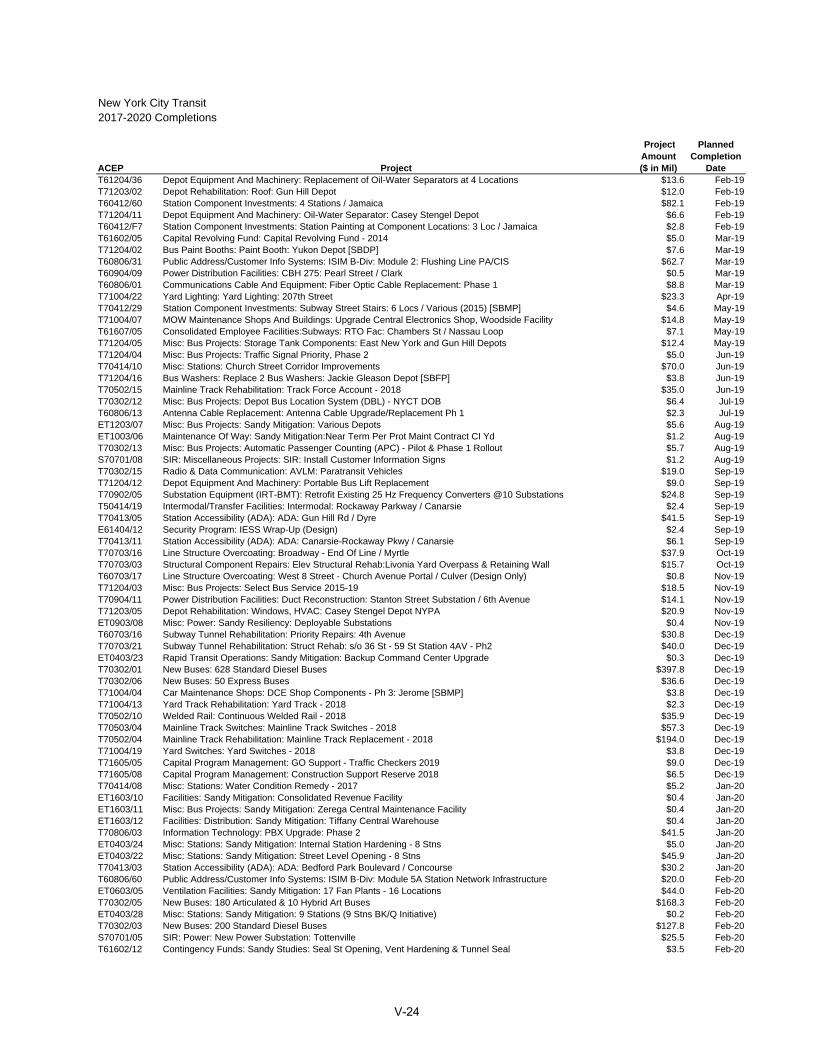
New York City Transit2017-2020 Completions
ACEP Project
ProjectAmount($ in Mil)
PlannedCompletion
DateT61204/36 Depot Equipment And Machinery: Replacement of Oil-Water Separators at 4 Locations $13.6 Feb-19T71203/02 Depot Rehabilitation: Roof: Gun Hill Depot $12.0 Feb-19T60412/60 Station Component Investments: 4 Stations / Jamaica $82.1 Feb-19T71204/11 Depot Equipment And Machinery: Oil-Water Separator: Casey Stengel Depot $6.6 Feb-19T60412/F7 Station Component Investments: Station Painting at Component Locations: 3 Loc / Jamaica $2.8 Feb-19T61602/05 Capital Revolving Fund: Capital Revolving Fund - 2014 $5.0 Mar-19T71204/02 Bus Paint Booths: Paint Booth: Yukon Depot [SBDP] $7.6 Mar-19T60806/31 Public Address/Customer Info Systems: ISIM B-Div: Module 2: Flushing Line PA/CIS $62.7 Mar-19T60904/09 Power Distribution Facilities: CBH 275: Pearl Street / Clark $0.5 Mar-19T60806/01 Communications Cable And Equipment: Fiber Optic Cable Replacement: Phase 1 $8.8 Mar-19T71004/22 Yard Lighting: Yard Lighting: 207th Street $23.3 Apr-19T70412/29 Station Component Investments: Subway Street Stairs: 6 Locs / Various (2015) [SBMP] $4.6 May-19T71004/07 MOW Maintenance Shops And Buildings: Upgrade Central Electronics Shop, Woodside Facility $14.8 May-19T61607/05 Consolidated Employee Facilities:Subways: RTO Fac: Chambers St / Nassau Loop $7.1 May-19T71204/05 Misc: Bus Projects: Storage Tank Components: East New York and Gun Hill Depots $12.4 May-19T71204/04 Misc: Bus Projects: Traffic Signal Priority, Phase 2 $5.0 Jun-19T70414/10 Misc: Stations: Church Street Corridor Improvements $70.0 Jun-19T71204/16 Bus Washers: Replace 2 Bus Washers: Jackie Gleason Depot [SBFP] $3.8 Jun-19T70502/15 Mainline Track Rehabilitation: Track Force Account - 2018 $35.0 Jun-19T70302/12 Misc: Bus Projects: Depot Bus Location System (DBL) - NYCT DOB $6.4 Jul-19T60806/13 Antenna Cable Replacement: Antenna Cable Upgrade/Replacement Ph 1 $2.3 Jul-19ET1203/07 Misc: Bus Projects: Sandy Mitigation: Various Depots $5.6 Aug-19ET1003/06 Maintenance Of Way: Sandy Mitigation:Near Term Per Prot Maint Contract CI Yd $1.2 Aug-19T70302/13 Misc: Bus Projects: Automatic Passenger Counting (APC) - Pilot & Phase 1 Rollout $5.7 Aug-19S70701/08 SIR: Miscellaneous Projects: SIR: Install Customer Information Signs $1.2 Aug-19T70302/15 Radio & Data Communication: AVLM: Paratransit Vehicles $19.0 Sep-19T71204/12 Depot Equipment And Machinery: Portable Bus Lift Replacement $9.0 Sep-19T70902/05 Substation Equipment (IRT-BMT): Retrofit Existing 25 Hz Frequency Converters @10 Substations $24.8 Sep-19T50414/19 Intermodal/Transfer Facilities: Intermodal: Rockaway Parkway / Canarsie $2.4 Sep-19T70413/05 Station Accessibility (ADA): ADA: Gun Hill Rd / Dyre $41.5 Sep-19E61404/12 Security Program: IESS Wrap-Up (Design) $2.4 Sep-19T70413/11 Station Accessibility (ADA): ADA: Canarsie-Rockaway Pkwy / Canarsie $6.1 Sep-19T70703/16 Line Structure Overcoating: Broadway - End Of Line / Myrtle $37.9 Oct-19T70703/03 Structural Component Repairs: Elev Structural Rehab:Livonia Yard Overpass & Retaining Wall $15.7 Oct-19T60703/17 Line Structure Overcoating: West 8 Street - Church Avenue Portal / Culver (Design Only) $0.8 Nov-19T71204/03 Misc: Bus Projects: Select Bus Service 2015-19 $18.5 Nov-19T70904/11 Power Distribution Facilities: Duct Reconstruction: Stanton Street Substation / 6th Avenue $14.1 Nov-19T71203/05 Depot Rehabilitation: Windows, HVAC: Casey Stengel Depot NYPA $20.9 Nov-19ET0903/08 Misc: Power: Sandy Resiliency: Deployable Substations $0.4 Nov-19T60703/16 Subway Tunnel Rehabilitation: Priority Repairs: 4th Avenue $30.8 Dec-19T70703/21 Subway Tunnel Rehabilitation: Struct Rehab: s/o 36 St - 59 St Station 4AV - Ph2 $40.0 Dec-19ET0403/23 Rapid Transit Operations: Sandy Mitigation: Backup Command Center Upgrade $0.3 Dec-19T70302/01 New Buses: 628 Standard Diesel Buses $397.8 Dec-19T70302/06 New Buses: 50 Express Buses $36.6 Dec-19T71004/04 Car Maintenance Shops: DCE Shop Components - Ph 3: Jerome [SBMP] $3.8 Dec-19T71004/13 Yard Track Rehabilitation: Yard Track - 2018 $2.3 Dec-19T70502/10 Welded Rail: Continuous Welded Rail - 2018 $35.9 Dec-19T70503/04 Mainline Track Switches: Mainline Track Switches - 2018 $57.3 Dec-19T70502/04 Mainline Track Rehabilitation: Mainline Track Replacement - 2018 $194.0 Dec-19T71004/19 Yard Switches: Yard Switches - 2018 $3.8 Dec-19T71605/05 Capital Program Management: GO Support - Traffic Checkers 2019 $9.0 Dec-19T71605/08 Capital Program Management: Construction Support Reserve 2018 $6.5 Dec-19T70414/08 Misc: Stations: Water Condition Remedy - 2017 $5.2 Jan-20ET1603/10 Facilities: Sandy Mitigation: Consolidated Revenue Facility $0.4 Jan-20ET1603/11 Misc: Bus Projects: Sandy Mitigation: Zerega Central Maintenance Facility $0.4 Jan-20ET1603/12 Facilities: Distribution: Sandy Mitigation: Tiffany Central Warehouse $0.4 Jan-20T70806/03 Information Technology: PBX Upgrade: Phase 2 $41.5 Jan-20ET0403/24 Misc: Stations: Sandy Mitigation: Internal Station Hardening - 8 Stns $5.0 Jan-20ET0403/22 Misc: Stations: Sandy Mitigation: Street Level Opening - 8 Stns $45.9 Jan-20T70413/03 Station Accessibility (ADA): ADA: Bedford Park Boulevard / Concourse $30.2 Jan-20T60806/60 Public Address/Customer Info Systems: ISIM B-Div: Module 5A Station Network Infrastructure $20.0 Feb-20ET0603/05 Ventilation Facilities: Sandy Mitigation: 17 Fan Plants - 16 Locations $44.0 Feb-20T70302/05 New Buses: 180 Articulated & 10 Hybrid Art Buses $168.3 Feb-20ET0403/28 Misc: Stations: Sandy Mitigation: 9 Stations (9 Stns BK/Q Initiative) $0.2 Feb-20T70302/03 New Buses: 200 Standard Diesel Buses $127.8 Feb-20S70701/05 SIR: Power: New Power Substation: Tottenville $25.5 Feb-20T61602/12 Contingency Funds: Sandy Studies: Seal St Opening, Vent Hardening & Tunnel Seal $3.5 Feb-20
V-24
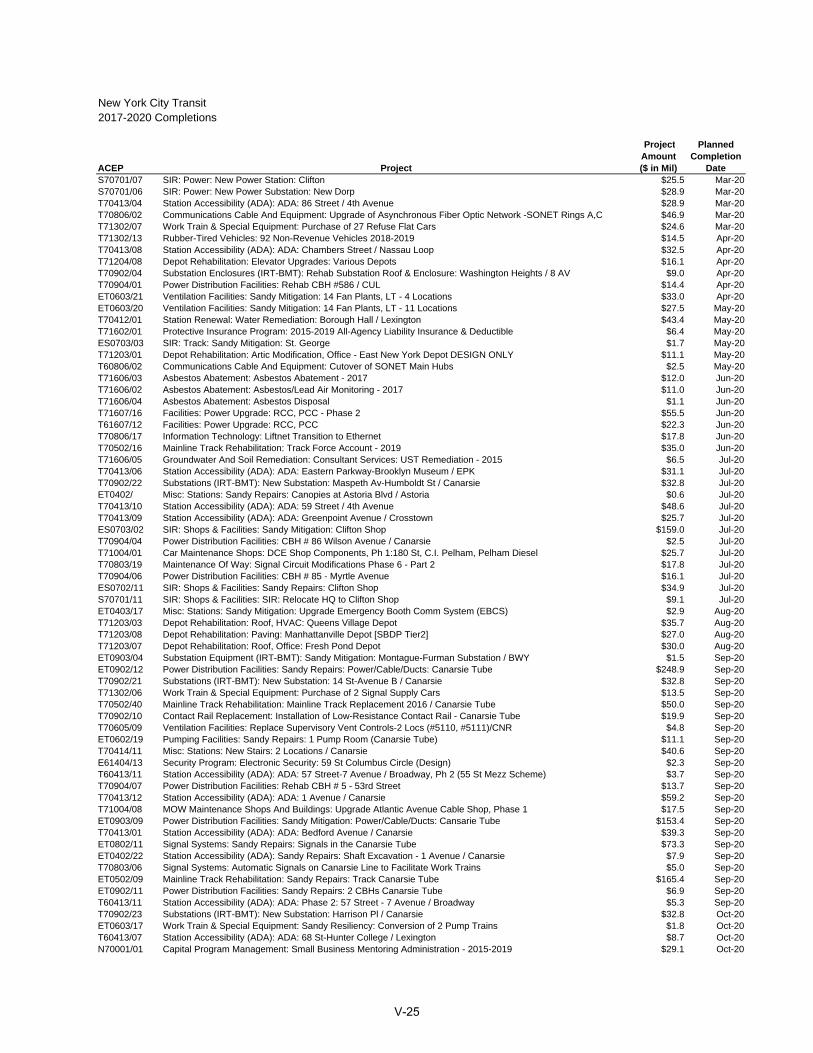
New York City Transit2017-2020 Completions
ACEP Project
ProjectAmount($ in Mil)
PlannedCompletion
DateS70701/07 SIR: Power: New Power Station: Clifton $25.5 Mar-20S70701/06 SIR: Power: New Power Substation: New Dorp $28.9 Mar-20T70413/04 Station Accessibility (ADA): ADA: 86 Street / 4th Avenue $28.9 Mar-20T70806/02 Communications Cable And Equipment: Upgrade of Asynchronous Fiber Optic Network -SONET Rings A,C $46.9 Mar-20T71302/07 Work Train & Special Equipment: Purchase of 27 Refuse Flat Cars $24.6 Mar-20T71302/13 Rubber-Tired Vehicles: 92 Non-Revenue Vehicles 2018-2019 $14.5 Apr-20T70413/08 Station Accessibility (ADA): ADA: Chambers Street / Nassau Loop $32.5 Apr-20T71204/08 Depot Rehabilitation: Elevator Upgrades: Various Depots $16.1 Apr-20T70902/04 Substation Enclosures (IRT-BMT): Rehab Substation Roof & Enclosure: Washington Heights / 8 AV $9.0 Apr-20T70904/01 Power Distribution Facilities: Rehab CBH #586 / CUL $14.4 Apr-20ET0603/21 Ventilation Facilities: Sandy Mitigation: 14 Fan Plants, LT - 4 Locations $33.0 Apr-20ET0603/20 Ventilation Facilities: Sandy Mitigation: 14 Fan Plants, LT - 11 Locations $27.5 May-20T70412/01 Station Renewal: Water Remediation: Borough Hall / Lexington $43.4 May-20T71602/01 Protective Insurance Program: 2015-2019 All-Agency Liability Insurance & Deductible $6.4 May-20ES0703/03 SIR: Track: Sandy Mitigation: St. George $1.7 May-20T71203/01 Depot Rehabilitation: Artic Modification, Office - East New York Depot DESIGN ONLY $11.1 May-20T60806/02 Communications Cable And Equipment: Cutover of SONET Main Hubs $2.5 May-20T71606/03 Asbestos Abatement: Asbestos Abatement - 2017 $12.0 Jun-20T71606/02 Asbestos Abatement: Asbestos/Lead Air Monitoring - 2017 $11.0 Jun-20T71606/04 Asbestos Abatement: Asbestos Disposal $1.1 Jun-20T71607/16 Facilities: Power Upgrade: RCC, PCC - Phase 2 $55.5 Jun-20T61607/12 Facilities: Power Upgrade: RCC, PCC $22.3 Jun-20T70806/17 Information Technology: Liftnet Transition to Ethernet $17.8 Jun-20T70502/16 Mainline Track Rehabilitation: Track Force Account - 2019 $35.0 Jun-20T71606/05 Groundwater And Soil Remediation: Consultant Services: UST Remediation - 2015 $6.5 Jul-20T70413/06 Station Accessibility (ADA): ADA: Eastern Parkway-Brooklyn Museum / EPK $31.1 Jul-20T70902/22 Substations (IRT-BMT): New Substation: Maspeth Av-Humboldt St / Canarsie $32.8 Jul-20ET0402/ Misc: Stations: Sandy Repairs: Canopies at Astoria Blvd / Astoria $0.6 Jul-20T70413/10 Station Accessibility (ADA): ADA: 59 Street / 4th Avenue $48.6 Jul-20T70413/09 Station Accessibility (ADA): ADA: Greenpoint Avenue / Crosstown $25.7 Jul-20ES0703/02 SIR: Shops & Facilities: Sandy Mitigation: Clifton Shop $159.0 Jul-20T70904/04 Power Distribution Facilities: CBH # 86 Wilson Avenue / Canarsie $2.5 Jul-20T71004/01 Car Maintenance Shops: DCE Shop Components, Ph 1:180 St, C.I. Pelham, Pelham Diesel $25.7 Jul-20T70803/19 Maintenance Of Way: Signal Circuit Modifications Phase 6 - Part 2 $17.8 Jul-20T70904/06 Power Distribution Facilities: CBH # 85 - Myrtle Avenue $16.1 Jul-20ES0702/11 SIR: Shops & Facilities: Sandy Repairs: Clifton Shop $34.9 Jul-20S70701/11 SIR: Shops & Facilities: SIR: Relocate HQ to Clifton Shop $9.1 Jul-20ET0403/17 Misc: Stations: Sandy Mitigation: Upgrade Emergency Booth Comm System (EBCS) $2.9 Aug-20T71203/03 Depot Rehabilitation: Roof, HVAC: Queens Village Depot $35.7 Aug-20T71203/08 Depot Rehabilitation: Paving: Manhattanville Depot [SBDP Tier2] $27.0 Aug-20T71203/07 Depot Rehabilitation: Roof, Office: Fresh Pond Depot $30.0 Aug-20ET0903/04 Substation Equipment (IRT-BMT): Sandy Mitigation: Montague-Furman Substation / BWY $1.5 Sep-20ET0902/12 Power Distribution Facilities: Sandy Repairs: Power/Cable/Ducts: Canarsie Tube $248.9 Sep-20T70902/21 Substations (IRT-BMT): New Substation: 14 St-Avenue B / Canarsie $32.8 Sep-20T71302/06 Work Train & Special Equipment: Purchase of 2 Signal Supply Cars $13.5 Sep-20T70502/40 Mainline Track Rehabilitation: Mainline Track Replacement 2016 / Canarsie Tube $50.0 Sep-20T70902/10 Contact Rail Replacement: Installation of Low-Resistance Contact Rail - Canarsie Tube $19.9 Sep-20T70605/09 Ventilation Facilities: Replace Supervisory Vent Controls-2 Locs (#5110, #5111)/CNR $4.8 Sep-20ET0602/19 Pumping Facilities: Sandy Repairs: 1 Pump Room (Canarsie Tube) $11.1 Sep-20T70414/11 Misc: Stations: New Stairs: 2 Locations / Canarsie $40.6 Sep-20E61404/13 Security Program: Electronic Security: 59 St Columbus Circle (Design) $2.3 Sep-20T60413/11 Station Accessibility (ADA): ADA: 57 Street-7 Avenue / Broadway, Ph 2 (55 St Mezz Scheme) $3.7 Sep-20T70904/07 Power Distribution Facilities: Rehab CBH # 5 - 53rd Street $13.7 Sep-20T70413/12 Station Accessibility (ADA): ADA: 1 Avenue / Canarsie $59.2 Sep-20T71004/08 MOW Maintenance Shops And Buildings: Upgrade Atlantic Avenue Cable Shop, Phase 1 $17.5 Sep-20ET0903/09 Power Distribution Facilities: Sandy Mitigation: Power/Cable/Ducts: Cansarie Tube $153.4 Sep-20T70413/01 Station Accessibility (ADA): ADA: Bedford Avenue / Canarsie $39.3 Sep-20ET0802/11 Signal Systems: Sandy Repairs: Signals in the Canarsie Tube $73.3 Sep-20ET0402/22 Station Accessibility (ADA): Sandy Repairs: Shaft Excavation - 1 Avenue / Canarsie $7.9 Sep-20T70803/06 Signal Systems: Automatic Signals on Canarsie Line to Facilitate Work Trains $5.0 Sep-20ET0502/09 Mainline Track Rehabilitation: Sandy Repairs: Track Canarsie Tube $165.4 Sep-20ET0902/11 Power Distribution Facilities: Sandy Repairs: 2 CBHs Canarsie Tube $6.9 Sep-20T60413/11 Station Accessibility (ADA): ADA: Phase 2: 57 Street - 7 Avenue / Broadway $5.3 Sep-20T70902/23 Substations (IRT-BMT): New Substation: Harrison Pl / Canarsie $32.8 Oct-20ET0603/17 Work Train & Special Equipment: Sandy Resiliency: Conversion of 2 Pump Trains $1.8 Oct-20T60413/07 Station Accessibility (ADA): ADA: 68 St-Hunter College / Lexington $8.7 Oct-20N70001/01 Capital Program Management: Small Business Mentoring Administration - 2015-2019 $29.1 Oct-20
V-25
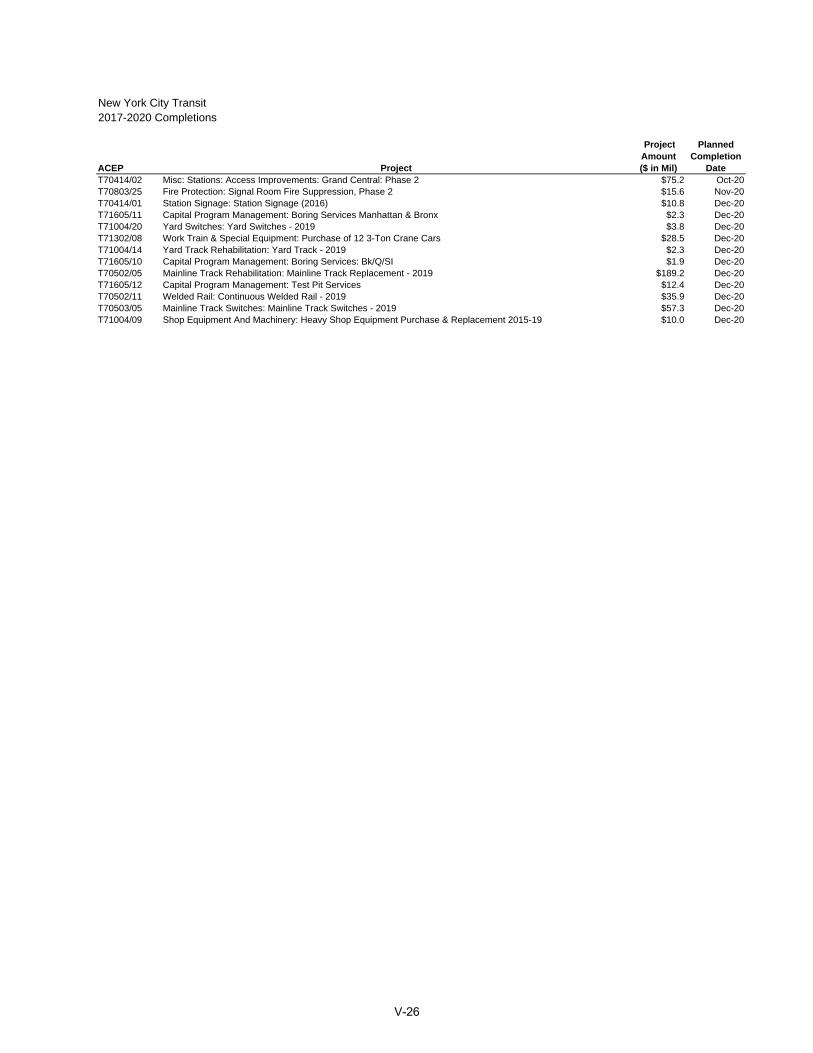
New York City Transit2017-2020 Completions
ACEP Project
ProjectAmount($ in Mil)
PlannedCompletion
DateT70414/02 Misc: Stations: Access Improvements: Grand Central: Phase 2 $75.2 Oct-20T70803/25 Fire Protection: Signal Room Fire Suppression, Phase 2 $15.6 Nov-20T70414/01 Station Signage: Station Signage (2016) $10.8 Dec-20T71605/11 Capital Program Management: Boring Services Manhattan & Bronx $2.3 Dec-20T71004/20 Yard Switches: Yard Switches - 2019 $3.8 Dec-20T71302/08 Work Train & Special Equipment: Purchase of 12 3-Ton Crane Cars $28.5 Dec-20T71004/14 Yard Track Rehabilitation: Yard Track - 2019 $2.3 Dec-20T71605/10 Capital Program Management: Boring Services: Bk/Q/SI $1.9 Dec-20T70502/05 Mainline Track Rehabilitation: Mainline Track Replacement - 2019 $189.2 Dec-20T71605/12 Capital Program Management: Test Pit Services $12.4 Dec-20T70502/11 Welded Rail: Continuous Welded Rail - 2019 $35.9 Dec-20T70503/05 Mainline Track Switches: Mainline Track Switches - 2019 $57.3 Dec-20T71004/09 Shop Equipment And Machinery: Heavy Shop Equipment Purchase & Replacement 2015-19 $10.0 Dec-20
V-26
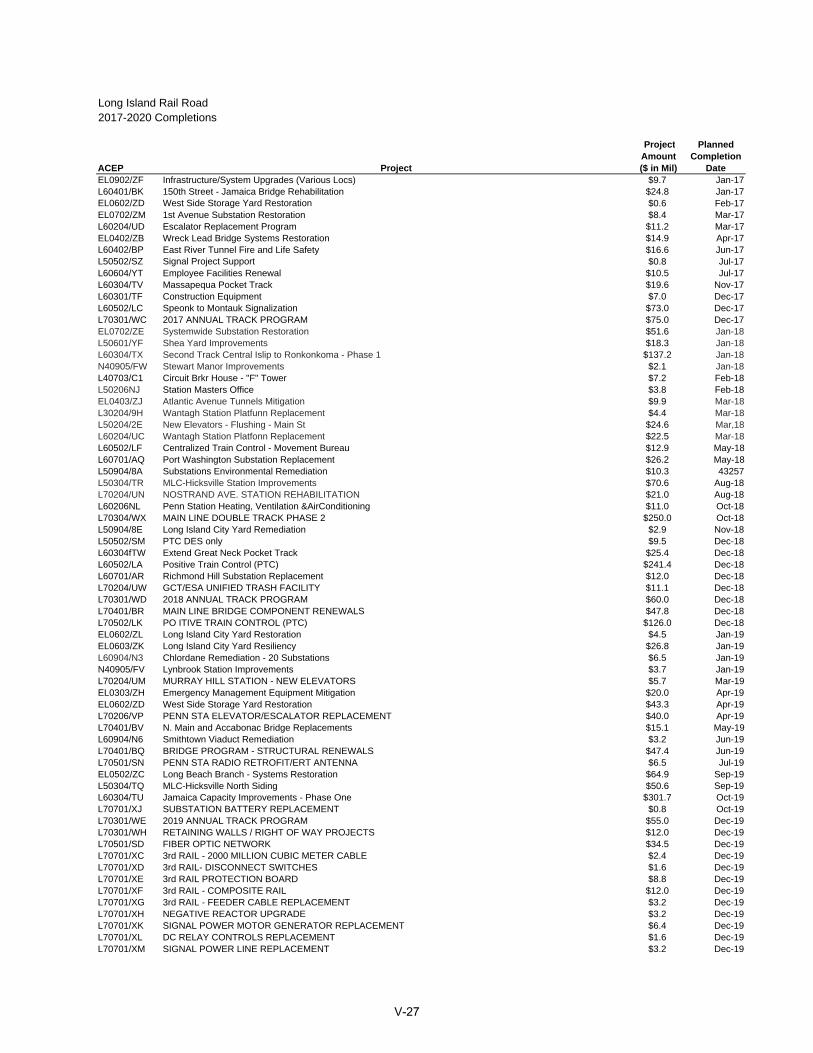
2017-2020 Completions
ACEP Project
ProjectAmount($ in Mil)
PlannedCompletion
DateEL0902/ZF Infrastructure/System Upgrades (Various Locs) $9.7 Jan-17L60401/BK 150th Street - Jamaica Bridge Rehabilitation $24.8 Jan-17EL0602/ZD West Side Storage Yard Restoration $0.6 Feb-17EL0702/ZM 1st Avenue Substation Restoration $8.4 Mar-17L60204/UD Escalator Replacement Program $11.2 Mar-17EL0402/ZB Wreck Lead Bridge Systems Restoration $14.9 Apr-17L60402/BP East River Tunnel Fire and Life Safety $16.6 Jun-17L50502/SZ Signal Project Support $0.8 Jul-17L60604/YT Employee Facilities Renewal $10.5 Jul-17L60304/TV Massapequa Pocket Track $19.6 Nov-17L60301/TF Construction Equipment $7.0 Dec-17L60502/LC Speonk to Montauk Signalization $73.0 Dec-17L70301/WC 2017 ANNUAL TRACK PROGRAM $75.0 Dec-17EL0702/ZE Systemwide Substation Restoration $51.6 Jan-18L50601/YF Shea Yard Improvements $18.3 Jan-18L60304/TX Second Track Central Islip to Ronkonkoma - Phase 1 $137.2 Jan-18N40905/FW Stewart Manor Improvements $2.1 Jan-18L40703/C1 Circuit Brkr House - "F" Tower $7.2 Feb-18L50206NJ Station Masters Office $3.8 Feb-18EL0403/ZJ Atlantic Avenue Tunnels Mitigation $9.9 Mar-18L30204/9H Wantagh Station Platfunn Replacement $4.4 Mar-18L50204/2E New Elevators - Flushing - Main St $24.6 Mar,18L60204/UC Wantagh Station Platfonn Replacement $22.5 Mar-18L60502/LF Centralized Train Control - Movement Bureau $12.9 May-18L60701/AQ Port Washington Substation Replacement $26.2 May-18L50904/8A Substations Environmental Remediation $10.3 43257L50304/TR MLC-Hicksville Station Improvements $70.6 Aug-18L70204/UN NOSTRAND AVE. STATION REHABILITATION $21.0 Aug-18L60206NL Penn Station Heating, Ventilation &AirConditioning $11.0 Oct-18L70304/WX MAIN LINE DOUBLE TRACK PHASE 2 $250.0 Oct-18L50904/8E Long Island City Yard Remediation $2.9 Nov-18L50502/SM PTC DES only $9.5 Dec-18L60304fTW Extend Great Neck Pocket Track $25.4 Dec-18L60502/LA Positive Train Control (PTC) $241.4 Dec-18L60701/AR Richmond Hill Substation Replacement $12.0 Dec-18L70204/UW GCT/ESA UNIFIED TRASH FACILITY $11.1 Dec-18L70301/WD 2018 ANNUAL TRACK PROGRAM $60.0 Dec-18L70401/BR MAIN LINE BRIDGE COMPONENT RENEWALS $47.8 Dec-18L70502/LK PO ITIVE TRAIN CONTROL (PTC) $126.0 Dec-18EL0602/ZL Long Island City Yard Restoration $4.5 Jan-19EL0603/ZK Long Island City Yard Resiliency $26.8 Jan-19L60904/N3 Chlordane Remediation - 20 Substations $6.5 Jan-19N40905/FV Lynbrook Station Improvements $3.7 Jan-19L70204/UM MURRAY HILL STATION - NEW ELEVATORS $5.7 Mar-19EL0303/ZH Emergency Management Equipment Mitigation $20.0 Apr-19EL0602/ZD West Side Storage Yard Restoration $43.3 Apr-19L70206/VP PENN STA ELEVATOR/ESCALATOR REPLACEMENT $40.0 Apr-19L70401/BV N. Main and Accabonac Bridge Replacements $15.1 May-19L60904/N6 Smithtown Viaduct Remediation $3.2 Jun-19L70401/BQ BRIDGE PROGRAM - STRUCTURAL RENEWALS $47.4 Jun-19L70501/SN PENN STA RADIO RETROFIT/ERT ANTENNA $6.5 Jul-19EL0502/ZC Long Beach Branch - Systems Restoration $64.9 Sep-19L50304/TQ MLC-Hicksville North Siding $50.6 Sep-19L60304/TU Jamaica Capacity Improvements - Phase One $301.7 Oct-19L70701/XJ SUBSTATION BATTERY REPLACEMENT $0.8 Oct-19L70301/WE 2019 ANNUAL TRACK PROGRAM $55.0 Dec-19L70301/WH RETAINING WALLS / RIGHT OF WAY PROJECTS $12.0 Dec-19L70501/SD FIBER OPTIC NETWORK $34.5 Dec-19L70701/XC 3rd RAIL - 2000 MILLION CUBIC METER CABLE $2.4 Dec-19L70701/XD 3rd RAIL- DISCONNECT SWITCHES $1.6 Dec-19L70701/XE 3rd RAIL PROTECTION BOARD $8.8 Dec-19L70701/XF 3rd RAIL - COMPOSITE RAIL $12.0 Dec-19L70701/XG 3rd RAIL - FEEDER CABLE REPLACEMENT $3.2 Dec-19L70701/XH NEGATIVE REACTOR UPGRADE $3.2 Dec-19L70701/XK SIGNAL POWER MOTOR GENERATOR REPLACEMENT $6.4 Dec-19L70701/XL DC RELAY CONTROLS REPLACEMENT $1.6 Dec-19L70701/XM SIGNAL POWER LINE REPLACEMENT $3.2 Dec-19
Long Island Rail Road
V-27
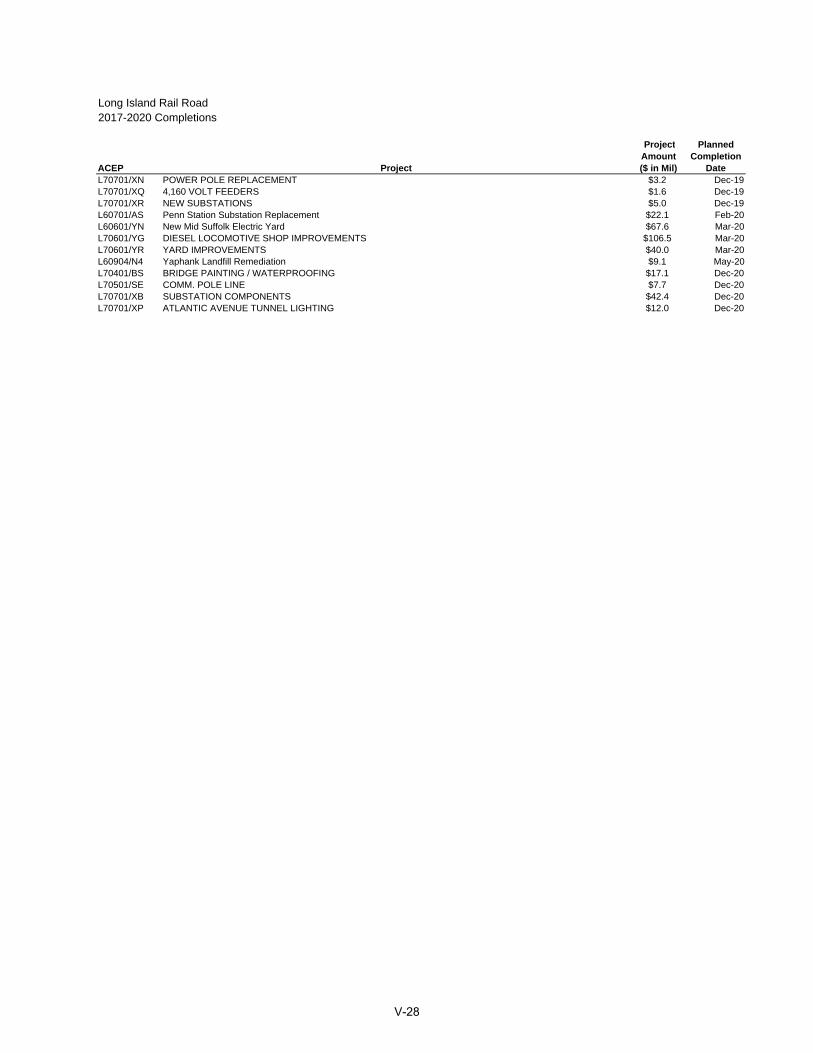
2017-2020 Completions
ACEP Project
ProjectAmount($ in Mil)
PlannedCompletion
Date
Long Island Rail Road
L70701/XN POWER POLE REPLACEMENT $3.2 Dec-19L70701/XQ 4,160 VOLT FEEDERS $1.6 Dec-19L70701/XR NEW SUBSTATIONS $5.0 Dec-19L60701/AS Penn Station Substation Replacement $22.1 Feb-20L60601/YN New Mid Suffolk Electric Yard $67.6 Mar-20L70601/YG DIESEL LOCOMOTIVE SHOP IMPROVEMENTS $106.5 Mar-20L70601/YR YARD IMPROVEMENTS $40.0 Mar-20L60904/N4 Yaphank Landfill Remediation $9.1 May-20L70401/BS BRIDGE PAINTING / WATERPROOFING $17.1 Dec-20L70501/SE COMM. POLE LINE $7.7 Dec-20L70701/XB SUBSTATION COMPONENTS $42.4 Dec-20L70701/XP ATLANTIC AVENUE TUNNEL LIGHTING $12.0 Dec-20
V-28
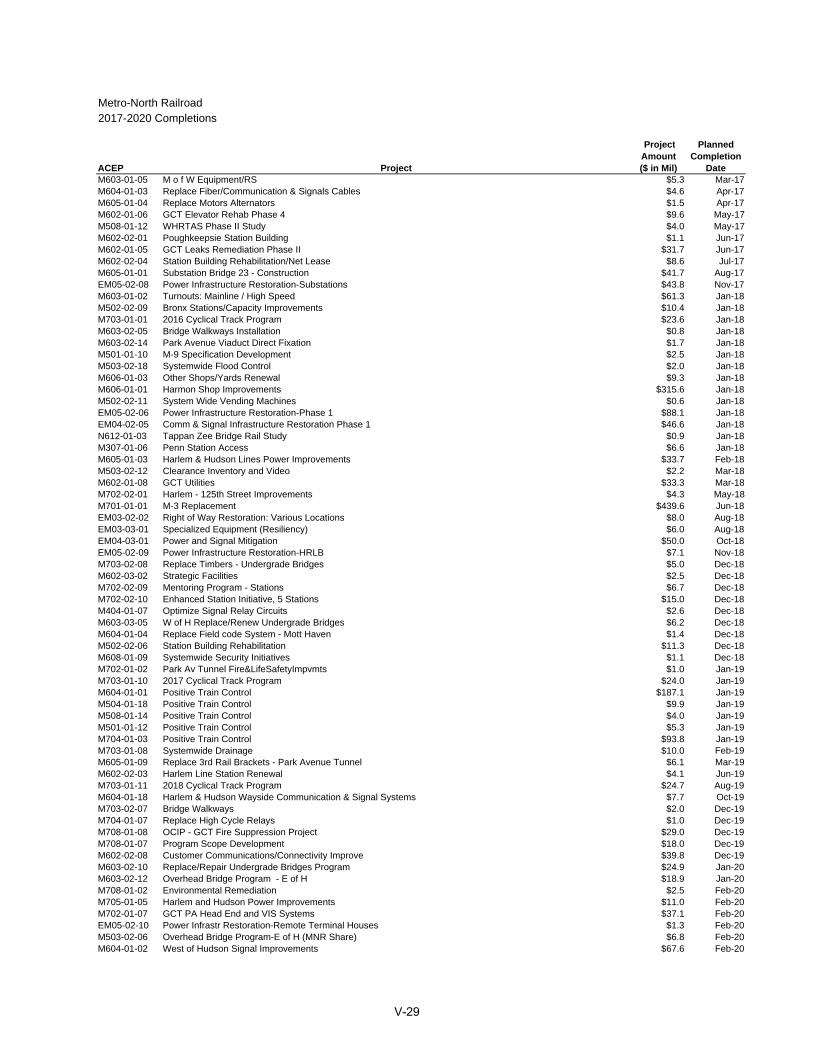
2017-2020 Completions
ACEP Project
ProjectAmount($ in Mil)
PlannedCompletion
DateM603-01-05 M o f W Equipment/RS $5.3 Mar-17M604-01-03 Replace Fiber/Communication & Signals Cables $4.6 Apr-17M605-01-04 Replace Motors Alternators $1.5 Apr-17M602-01-06 GCT Elevator Rehab Phase 4 $9.6 May-17M508-01-12 WHRTAS Phase II Study $4.0 May-17M602-02-01 Poughkeepsie Station Building $1.1 Jun-17M602-01-05 GCT Leaks Remediation Phase II $31.7 Jun-17M602-02-04 Station Building Rehabilitation/Net Lease $8.6 Jul-17M605-01-01 Substation Bridge 23 - Construction $41.7 Aug-17EM05-02-08 Power Infrastructure Restoration-Substations $43.8 Nov-17M603-01-02 Turnouts: Mainline / High Speed $61.3 Jan-18M502-02-09 Bronx Stations/Capacity Improvements $10.4 Jan-18M703-01-01 2016 Cyclical Track Program $23.6 Jan-18M603-02-05 Bridge Walkways Installation $0.8 Jan-18M603-02-14 Park Avenue Viaduct Direct Fixation $1.7 Jan-18M501-01-10 M-9 Specification Development $2.5 Jan-18M503-02-18 Systemwide Flood Control $2.0 Jan-18M606-01-03 Other Shops/Yards Renewal $9.3 Jan-18M606-01-01 Harmon Shop Improvements $315.6 Jan-18M502-02-11 System Wide Vending Machines $0.6 Jan-18EM05-02-06 Power Infrastructure Restoration-Phase 1 $88.1 Jan-18EM04-02-05 Comm & Signal Infrastructure Restoration Phase 1 $46.6 Jan-18N612-01-03 Tappan Zee Bridge Rail Study $0.9 Jan-18M307-01-06 Penn Station Access $6.6 Jan-18M605-01-03 Harlem & Hudson Lines Power Improvements $33.7 Feb-18M503-02-12 Clearance Inventory and Video $2.2 Mar-18M602-01-08 GCT Utilities $33.3 Mar-18M702-02-01 Harlem - 125th Street Improvements $4.3 May-18M701-01-01 M-3 Replacement $439.6 Jun-18EM03-02-02 Right of Way Restoration: Various Locations $8.0 Aug-18EM03-03-01 Specialized Equipment (Resiliency) $6.0 Aug-18EM04-03-01 Power and Signal Mitigation $50.0 Oct-18EM05-02-09 Power Infrastructure Restoration-HRLB $7.1 Nov-18M703-02-08 Replace Timbers - Undergrade Bridges $5.0 Dec-18M602-03-02 Strategic Facilities $2.5 Dec-18M702-02-09 Mentoring Program - Stations $6.7 Dec-18M702-02-10 Enhanced Station Initiative, 5 Stations $15.0 Dec-18M404-01-07 Optimize Signal Relay Circuits $2.6 Dec-18M603-03-05 W of H Replace/Renew Undergrade Bridges $6.2 Dec-18M604-01-04 Replace Field code System - Mott Haven $1.4 Dec-18M502-02-06 Station Building Rehabilitation $11.3 Dec-18M608-01-09 Systemwide Security Initiatives $1.1 Dec-18M702-01-02 Park Av Tunnel Fire&LifeSafetyImpvmts $1.0 Jan-19M703-01-10 2017 Cyclical Track Program $24.0 Jan-19M604-01-01 Positive Train Control $187.1 Jan-19M504-01-18 Positive Train Control $9.9 Jan-19M508-01-14 Positive Train Control $4.0 Jan-19M501-01-12 Positive Train Control $5.3 Jan-19M704-01-03 Positive Train Control $93.8 Jan-19M703-01-08 Systemwide Drainage $10.0 Feb-19M605-01-09 Replace 3rd Rail Brackets - Park Avenue Tunnel $6.1 Mar-19M602-02-03 Harlem Line Station Renewal $4.1 Jun-19M703-01-11 2018 Cyclical Track Program $24.7 Aug-19M604-01-18 Harlem & Hudson Wayside Communication & Signal Systems $7.7 Oct-19M703-02-07 Bridge Walkways $2.0 Dec-19M704-01-07 Replace High Cycle Relays $1.0 Dec-19M708-01-08 OCIP - GCT Fire Suppression Project $29.0 Dec-19M708-01-07 Program Scope Development $18.0 Dec-19M602-02-08 Customer Communications/Connectivity Improve $39.8 Dec-19M603-02-10 Replace/Repair Undergrade Bridges Program $24.9 Jan-20M603-02-12 Overhead Bridge Program - E of H $18.9 Jan-20M708-01-02 Environmental Remediation $2.5 Feb-20M705-01-05 Harlem and Hudson Power Improvements $11.0 Feb-20M702-01-07 GCT PA Head End and VIS Systems $37.1 Feb-20EM05-02-10 Power Infrastr Restoration-Remote Terminal Houses $1.3 Feb-20M503-02-06 Overhead Bridge Program-E of H (MNR Share) $6.8 Feb-20M604-01-02 West of Hudson Signal Improvements $67.6 Feb-20
Metro-North Railroad
V-29
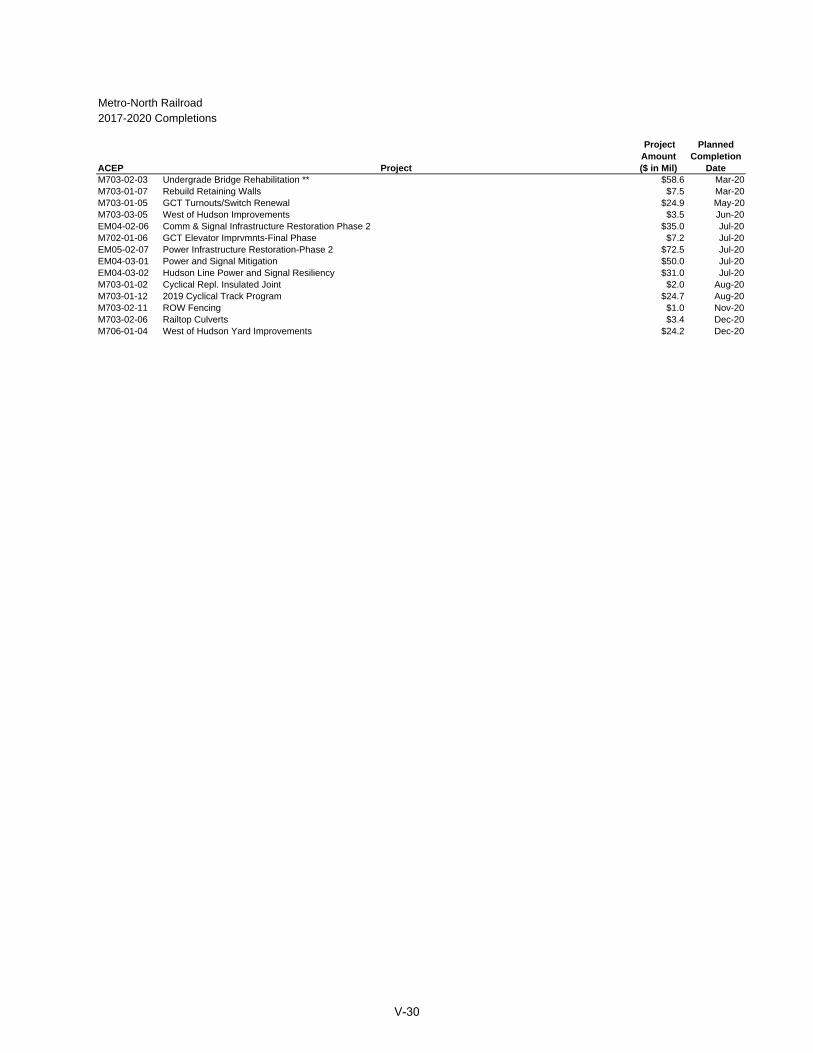
2017-2020 Completions
ACEP Project
ProjectAmount($ in Mil)
PlannedCompletion
Date
Metro-North Railroad
M703-02-03 Undergrade Bridge Rehabilitation ** $58.6 Mar-20M703-01-07 Rebuild Retaining Walls $7.5 Mar-20M703-01-05 GCT Turnouts/Switch Renewal $24.9 May-20M703-03-05 West of Hudson Improvements $3.5 Jun-20EM04-02-06 Comm & Signal Infrastructure Restoration Phase 2 $35.0 Jul-20M702-01-06 GCT Elevator Imprvmnts-Final Phase $7.2 Jul-20EM05-02-07 Power Infrastructure Restoration-Phase 2 $72.5 Jul-20EM04-03-01 Power and Signal Mitigation $50.0 Jul-20EM04-03-02 Hudson Line Power and Signal Resiliency $31.0 Jul-20M703-01-02 Cyclical Repl. Insulated Joint $2.0 Aug-20M703-01-12 2019 Cyclical Track Program $24.7 Aug-20M703-02-11 ROW Fencing $1.0 Nov-20M703-02-06 Railtop Culverts $3.4 Dec-20M706-01-04 West of Hudson Yard Improvements $24.2 Dec-20
V-30
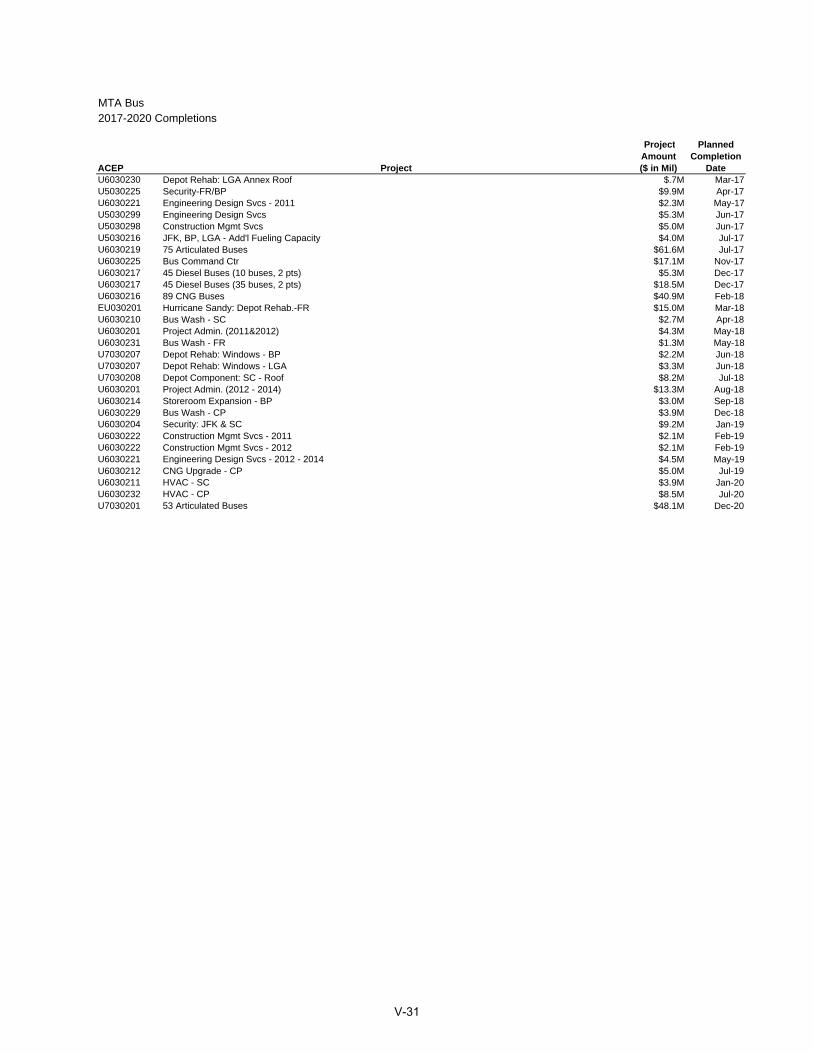
2017-2020 Completions
ACEP Project
ProjectAmount($ in Mil)
PlannedCompletion
DateU6030230 Depot Rehab: LGA Annex Roof $.7M Mar-17U5030225 Security-FR/BP $9.9M Apr-17U6030221 Engineering Design Svcs - 2011 $2.3M May-17U5030299 Engineering Design Svcs $5.3M Jun-17U5030298 Construction Mgmt Svcs $5.0M Jun-17U5030216 JFK, BP, LGA - Add'l Fueling Capacity $4.0M Jul-17U6030219 75 Articulated Buses $61.6M Jul-17U6030225 Bus Command Ctr $17.1M Nov-17U6030217 45 Diesel Buses (10 buses, 2 pts) $5.3M Dec-17U6030217 45 Diesel Buses (35 buses, 2 pts) $18.5M Dec-17U6030216 89 CNG Buses $40.9M Feb-18EU030201 Hurricane Sandy: Depot Rehab.-FR $15.0M Mar-18U6030210 Bus Wash - SC $2.7M Apr-18U6030201 Project Admin. (2011&2012) $4.3M May-18U6030231 Bus Wash - FR $1.3M May-18U7030207 Depot Rehab: Windows - BP $2.2M Jun-18U7030207 Depot Rehab: Windows - LGA $3.3M Jun-18U7030208 Depot Component: SC - Roof $8.2M Jul-18U6030201 Project Admin. (2012 - 2014) $13.3M Aug-18U6030214 Storeroom Expansion - BP $3.0M Sep-18U6030229 Bus Wash - CP $3.9M Dec-18U6030204 Security: JFK & SC $9.2M Jan-19U6030222 Construction Mgmt Svcs - 2011 $2.1M Feb-19U6030222 Construction Mgmt Svcs - 2012 $2.1M Feb-19U6030221 Engineering Design Svcs - 2012 - 2014 $4.5M May-19U6030212 CNG Upgrade - CP $5.0M Jul-19U6030211 HVAC - SC $3.9M Jan-20U6030232 HVAC - CP $8.5M Jul-20U7030201 53 Articulated Buses $48.1M Dec-20
MTA Bus
V-31
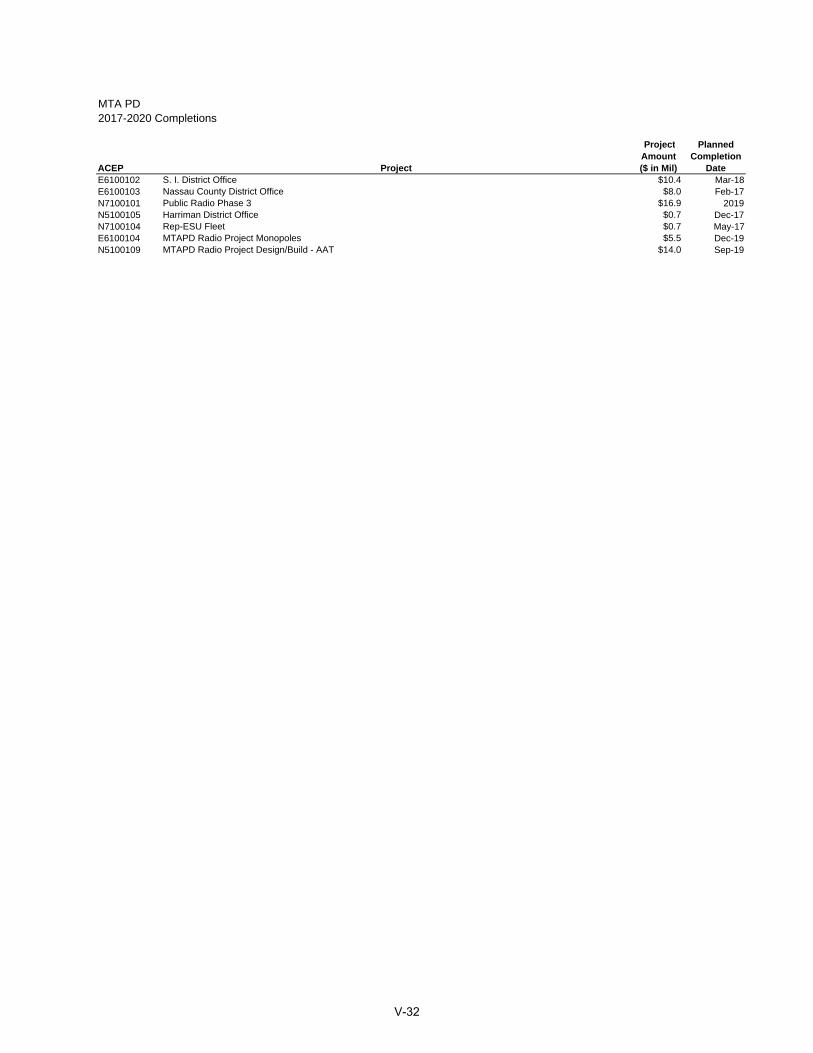
MTA PD 2017-2020 Completions
ACEP Project
ProjectAmount($ in Mil)
PlannedCompletion
DateE6100102 S. I. District Office $10.4 Mar-18E6100103 Nassau County District Office $8.0 Feb-17N7100101 Public Radio Phase 3 $16.9 2019N5100105 Harriman District Office $0.7 Dec-17N7100104 Rep-ESU Fleet $0.7 May-17E6100104 MTAPD Radio Project Monopoles $5.5 Dec-19N5100109 MTAPD Radio Project Design/Build - AAT $14.0 Sep-19
V-32
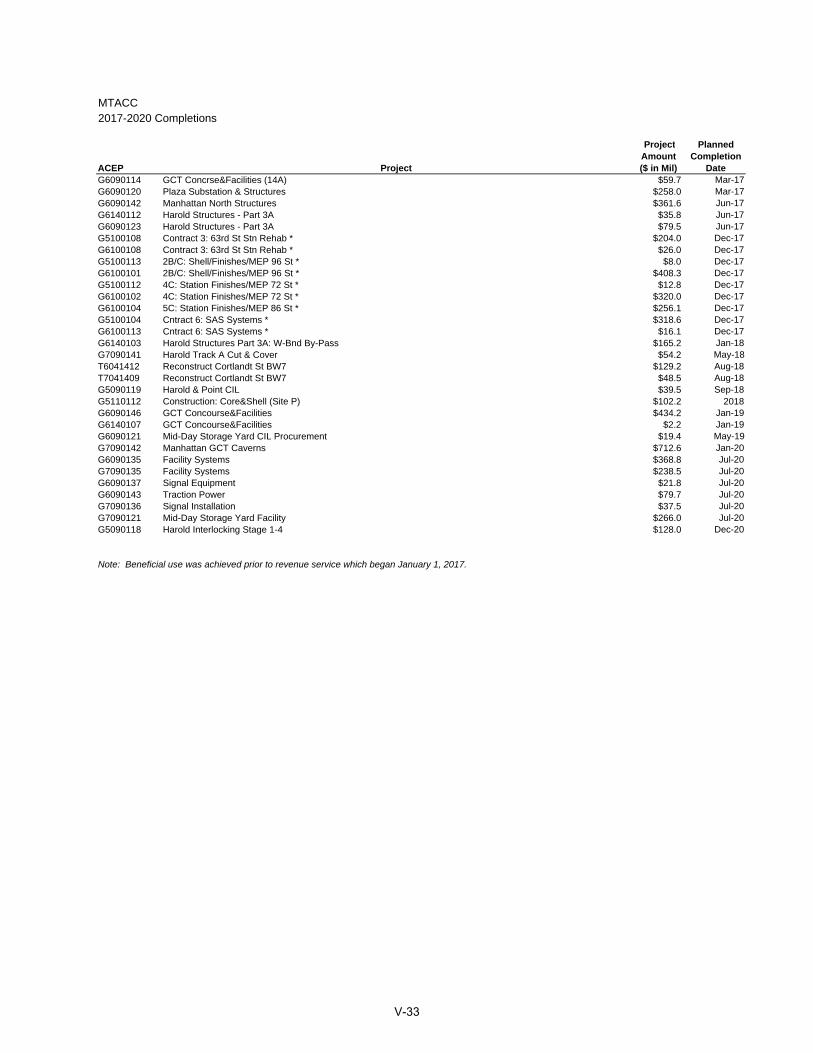
2017-2020 Completions
ACEP Project
ProjectAmount($ in Mil)
PlannedCompletion
DateG6090114 GCT Concrse&Facilities (14A) $59.7 Mar-17G6090120 Plaza Substation & Structures $258.0 Mar-17G6090142 Manhattan North Structures $361.6 Jun-17G6140112 Harold Structures - Part 3A $35.8 Jun-17G6090123 Harold Structures - Part 3A $79.5 Jun-17G5100108 Contract 3: 63rd St Stn Rehab * $204.0 Dec-17G6100108 Contract 3: 63rd St Stn Rehab * $26.0 Dec-17G5100113 2B/C: Shell/Finishes/MEP 96 St * $8.0 Dec-17G6100101 2B/C: Shell/Finishes/MEP 96 St * $408.3 Dec-17G5100112 4C: Station Finishes/MEP 72 St * $12.8 Dec-17G6100102 4C: Station Finishes/MEP 72 St * $320.0 Dec-17G6100104 5C: Station Finishes/MEP 86 St * $256.1 Dec-17G5100104 Cntract 6: SAS Systems * $318.6 Dec-17G6100113 Cntract 6: SAS Systems * $16.1 Dec-17G6140103 Harold Structures Part 3A: W-Bnd By-Pass $165.2 Jan-18G7090141 Harold Track A Cut & Cover $54.2 May-18T6041412 Reconstruct Cortlandt St BW7 $129.2 Aug-18T7041409 Reconstruct Cortlandt St BW7 $48.5 Aug-18G5090119 Harold & Point CIL $39.5 Sep-18G5110112 Construction: Core&Shell (Site P) $102.2 2018G6090146 GCT Concourse&Facilities $434.2 Jan-19G6140107 GCT Concourse&Facilities $2.2 Jan-19G6090121 Mid-Day Storage Yard CIL Procurement $19.4 May-19G7090142 Manhattan GCT Caverns $712.6 Jan-20G6090135 Facility Systems $368.8 Jul-20G7090135 Facility Systems $238.5 Jul-20G6090137 Signal Equipment $21.8 Jul-20G6090143 Traction Power $79.7 Jul-20G7090136 Signal Installation $37.5 Jul-20G7090121 Mid-Day Storage Yard Facility $266.0 Jul-20G5090118 Harold Interlocking Stage 1-4 $128.0 Dec-20
Note: Beneficial use was achieved prior to revenue service which began January 1, 2017.
MTACC
V-33
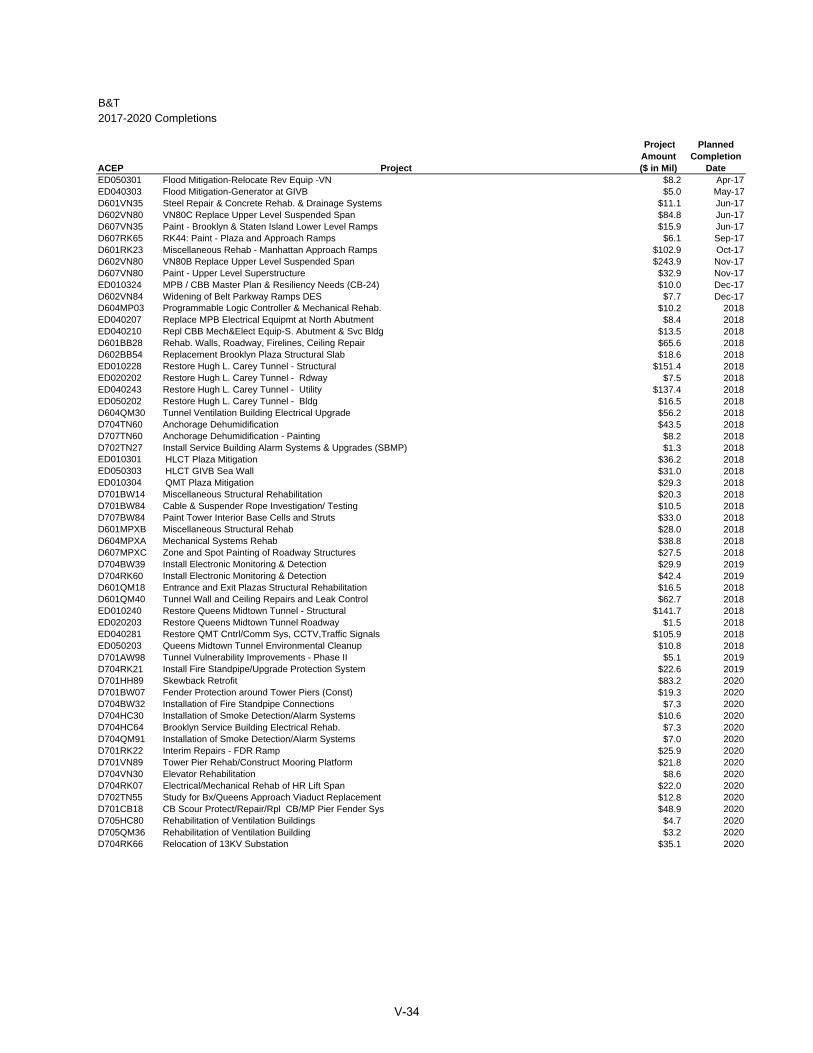
B&T 2017-2020 Completions
ACEP Project
ProjectAmount($ in Mil)
PlannedCompletion
DateED050301 Flood Mitigation-Relocate Rev Equip -VN $8.2 Apr-17ED040303 Flood Mitigation-Generator at GIVB $5.0 May-17D601VN35 Steel Repair & Concrete Rehab. & Drainage Systems $11.1 Jun-17D602VN80 VN80C Replace Upper Level Suspended Span $84.8 Jun-17D607VN35 Paint - Brooklyn & Staten Island Lower Level Ramps $15.9 Jun-17D607RK65 RK44: Paint - Plaza and Approach Ramps $6.1 Sep-17D601RK23 Miscellaneous Rehab - Manhattan Approach Ramps $102.9 Oct-17D602VN80 VN80B Replace Upper Level Suspended Span $243.9 Nov-17D607VN80 Paint - Upper Level Superstructure $32.9 Nov-17ED010324 MPB / CBB Master Plan & Resiliency Needs (CB-24) $10.0 Dec-17D602VN84 Widening of Belt Parkway Ramps DES $7.7 Dec-17D604MP03 Programmable Logic Controller & Mechanical Rehab. $10.2 2018ED040207 Replace MPB Electrical Equipmt at North Abutment $8.4 2018ED040210 Repl CBB Mech&Elect Equip-S. Abutment & Svc Bldg $13.5 2018D601BB28 Rehab. Walls, Roadway, Firelines, Ceiling Repair $65.6 2018D602BB54 Replacement Brooklyn Plaza Structural Slab $18.6 2018ED010228 Restore Hugh L. Carey Tunnel - Structural $151.4 2018ED020202 Restore Hugh L. Carey Tunnel - Rdway $7.5 2018ED040243 Restore Hugh L. Carey Tunnel - Utility $137.4 2018ED050202 Restore Hugh L. Carey Tunnel - Bldg $16.5 2018D604QM30 Tunnel Ventilation Building Electrical Upgrade $56.2 2018D704TN60 Anchorage Dehumidification $43.5 2018D707TN60 Anchorage Dehumidification - Painting $8.2 2018D702TN27 Install Service Building Alarm Systems & Upgrades (SBMP) $1.3 2018ED010301 HLCT Plaza Mitigation $36.2 2018ED050303 HLCT GIVB Sea Wall $31.0 2018ED010304 QMT Plaza Mitigation $29.3 2018D701BW14 Miscellaneous Structural Rehabilitation $20.3 2018D701BW84 Cable & Suspender Rope Investigation/ Testing $10.5 2018D707BW84 Paint Tower Interior Base Cells and Struts $33.0 2018D601MPXB Miscellaneous Structural Rehab $28.0 2018D604MPXA Mechanical Systems Rehab $38.8 2018D607MPXC Zone and Spot Painting of Roadway Structures $27.5 2018D704BW39 Install Electronic Monitoring & Detection $29.9 2019D704RK60 Install Electronic Monitoring & Detection $42.4 2019D601QM18 Entrance and Exit Plazas Structural Rehabilitation $16.5 2018D601QM40 Tunnel Wall and Ceiling Repairs and Leak Control $62.7 2018ED010240 Restore Queens Midtown Tunnel - Structural $141.7 2018ED020203 Restore Queens Midtown Tunnel Roadway $1.5 2018ED040281 Restore QMT Cntrl/Comm Sys, CCTV,Traffic Signals $105.9 2018ED050203 Queens Midtown Tunnel Environmental Cleanup $10.8 2018D701AW98 Tunnel Vulnerability Improvements - Phase II $5.1 2019D704RK21 Install Fire Standpipe/Upgrade Protection System $22.6 2019D701HH89 Skewback Retrofit $83.2 2020D701BW07 Fender Protection around Tower Piers (Const) $19.3 2020D704BW32 Installation of Fire Standpipe Connections $7.3 2020D704HC30 Installation of Smoke Detection/Alarm Systems $10.6 2020D704HC64 Brooklyn Service Building Electrical Rehab. $7.3 2020D704QM91 Installation of Smoke Detection/Alarm Systems $7.0 2020D701RK22 Interim Repairs - FDR Ramp $25.9 2020D701VN89 Tower Pier Rehab/Construct Mooring Platform $21.8 2020D704VN30 Elevator Rehabilitation $8.6 2020D704RK07 Electrical/Mechanical Rehab of HR Lift Span $22.0 2020D702TN55 Study for Bx/Queens Approach Viaduct Replacement $12.8 2020D701CB18 CB Scour Protect/Repair/Rpl CB/MP Pier Fender Sys $48.9 2020D705HC80 Rehabilitation of Ventilation Buildings $4.7 2020D705QM36 Rehabilitation of Ventilation Building $3.2 2020D704RK66 Relocation of 13KV Substation $35.1 2020
V-34
OPERATING IMPACTS EXCEEDING $1 MILLION FOR CAPITAL PROJECTS REACHING BENEFICIAL USE 2017-2020
NEW YORK CITY TRANSIT CAPITAL PROJECTS
Project: Second Avenue Subway Phase I. MTA Capital Construction is managing construction of the Second Avenue Subway on Manhattan’s east side from 125th Street to the Financial District in Lower Manhattan. The first phase of this four-phase project will utilize an existing tunnel under Central Park from 57th Street/Seventh Avenue on the Broadway Line to 63rd Street/Lexington. From 63rd Street, a new tunnel will be built along Second Avenue between 63rd Street and 96th Street. The first phase will be served by an extension of the Q Line and have new stations at 63rd Street/Lexington (connection to F train), 72nd Street, 86th Street and finally 96th Street and began revenue service on January 1, 2017. This will result in $45.4 million in additional annual expenses. Project: Flushing CBTC. This project is to overlay a new state of the art Communications Based Train Control (CBTC) system in the automatic signal area of the Flushing Line. The Flushing line is the second line to undergo an upgrade to CBTC within the transit system. The project will also replace obsolete air operated 25 Hz fixed-block signal systems with 60 Hz electric equipment in the Times Square Interlocking and install a new solid state interlocking (SSI) at 1st Avenue. Installation is projected for substantial completion in 2017. This project will have a multi-million dollar operating impact. Project: Queens Boulevard CBTC. This project consists of adding a Communications Based Train Control (CBTC) system to the Queens Boulevard line. The new signal system shall be designed primarily for CBTC only operations with the capability to permit non-CBTC trains to safely operate through the CBTC territory. The Queens Boulevard line is the third line to undergo an upgrade to CBTC within the transit system. Installation is projected for substantial completion in 2021. This project will have a multi-million dollar operating impact. Project: Help Point Installation. Plan is to install 2,700 Help Point Units in stations. These units provide customers with the ability to make quick voice calls for emergency as well as information related needs. Each station will have several staged Help Points for customer convenience and safety. The total annual cost at completion is projected to be $1.5M. Project: Passenger Station LAN (PSLAN). The purpose of the PSLAN is to provide IP network connectivity throughout passenger stations across the subway system. The proposed work under this project will be to furnish and install LAN infrastructure for passenger stations, which can be used as an access network for all IP applications. Applications include New Fare Payment System, Help Point, IP intercoms, IP phones, workstations, IP cameras etc. The total annual operating impact is currently still undetermined. Project: ISIM-B. In recent times, NYCT has modernized the real time tracking and operations of the A Division subway lines. NYCT is looking to implement similar capabilities across the B division, including long term capability to centrally control both traditional fixed block signal and CBTC systems. ISIM-B will be comprised of several phases in which NYCT will bring the B division modern tracking and operating standards. The operating budget impact of this project is still under review. Project: Bus Radio & Command Center Upgrade. The Bus Radio Upgrade operating budget impact is currently under review and the cost of the increased maintenance needs for the upgraded radio consoles based on existing radio maintenance efforts is being evaluated. Areas include Bus Depots for MTA and NYCT, the Central Electronics Shop repairs, and Network Operations Support as well as the
V-35

maintenance of the new Bus Command Center consoles and radio sites. Construction completion is currently estimated to be late-2017. Total annual operating impact is currently still undetermined. Project: Public Address/Customer Information – 89 Stations B Division. This project will install public address speakers and visual information delivered by Customer Information Screens at 89 stations and 2 pilot stations. Impacts are projected to begin in 2017 when much of the equipment would be installed or shortly thereafter. An annual total increase of $3.3 million is expected. LONG ISLAND RAIL ROAD CAPITAL PROJECTS Project: East Side Access. This project will expand LIRR service into Grand Central Terminal. The construction includes new tunnel and track along with related right-of-way equipment, vent plants, substations, and a new terminal station with elevators, escalators, and HVAC. The project also includes 236 new rail cars and will introduce an expanded train service plan to support Opening Day. Operating budget increases will begin before opening day. Project: Main Line Second Track. The 17.9-mile LIRR Main Line between Ronkonkoma and Farmingdale comprises12.6 miles of single electrified track and 5.3 miles of double electrified track. The projects calls for the addition of a second track and crossovers in the remaining single-track segments of the ROW. The project also includes new, unimproved maintenance roadways parallel to the tracks within the ROW in certain locations, new side-platforms at existing stations (Wyandanch and Pinelawn) and some new retaining walls where required. Construction is underway for Phase 1 from Ronkonkoma to west of Central Islip. Phase 2 begins in the Central Islip area and continues west to Farmingdale and will be divided into east and west segments. Headcount increase is required for Track, Signal and Power maintenance. As the project is being phased in, the full need will not be required until the full project is completed. At completion in 2018 the project is expected to have an operating budget impact of cost of $1.25M. Project: Positive Train Control (PTC). This project is for the installation of a PTC system for the LIRR. It is an integrated command, control, communication, and geographic information system designed to prevent train-to-train collisions, over-speed derailments, incursions into established work zone limits, and the movement of a train through a switch left in the wrong position. PTC is composed of five core elements: On-Board Equipment, a Wireless Communication Network, Central Servers, a Dispatching System, and Wayside Equipment. The full operating budget impact has not been identified. However, because of the assets and equipment that will need to be operated and maintained, it is expected that PTC will have an operating budget impact of at least $3 million a year. METRO-NORTH RAILROAD CAPITAL PROJECTS Project: M-8 New Haven Line Purchase. This project is for the design, manufacture, test and delivery of the New Haven Line M8 EMU Cars. The first one hundred cars will be utilized to supplement the existing fleet to fill out trains and reduce standees. The base contract for 210 cars and the first option for 90 additional cars were awarded on August 21, 2006. Two additional options 42 and 38 cars respectively. A change order was executed for 25 Single Cars for a total of 405 cars. Anticipated steady-state Operating Budget Impact of approximately $4 million (NYS portion) once all 405 cars are in service. Project: Positive Train Control (PTC). Installation of a PTC system is mandated by the Federal Rail Safety Improvement Act of 2008. PTC is an integrated command, control, communication, and geographic information system designed to prevent train-to-train collisions, over-speed derailments,
V-36

incursions into established work zone limits, and the movement of a train through a switch left in the wrong position. It is composed five core elements: On-Board Equipment, a Wireless Communication Network, Central Servers, a Dispatching System, and Wayside Equipment. There is an anticipated steady-state Operating Budget Impact of approximately $4 million in costs for this project (NYS portion). Project: West of Hudson Signal Improvements. The purpose of this project is to install a new 100 Hz Cab Signal system replacing existing antiquated signal system for the West of Hudson Port Jervis Line between Suffern, NY (MP 31.3) and Sparrowbush, NY (MP 89.9). This system will be consistent with NORAC (Northeast Operating Rules Advisory Committee) and NJT (New Jersey Transit) operating rules. This project will extend existing cab signal system from NJT territory (south of Suffern) into MNR territory up to the division post at MP 89.9. This line consists of nine interlockings and four highway grade crossings. MNR rolling stock operated by NJT is already equipped with cab signal system due to its operation south of Suffern. PTC equipment for West of Hudson will be procured as options on New Jersey Transit PTC contract. The West of Hudson Signal Improvements project anticipates a steady-state Operating Budget Impact of approximately $1 million (NYS portion). Project: Harmon Shop Replacement – Phase V. The project involves the continuation of MTA Metro-North Railroad’s Harmon Shop Replacement Program. Phase V is a two-stage program to design and construct a new Electric Car Shop with a Consist Shop Facility and new Running Repair and Support Shop to replace the existing Harmon Old Main Shop Building. There is a potential for annual savings in excess of $1 million that could be realized in facility and equipment maintenance and train operations costs. MTA POLICE DEPARTMENT CAPITAL PROJECTS Project: Upgrade Police Radio System. This project provides for the upgrade and enhancement of the MTAPD radio system and associated infrastructure through strategic partnerships with local and state agencies, as well as the installation of contemporary equipment and technologies throughout the 14 counties served by the MTAPD. It is expected that at completion the project will result in increased maintenance expenses of approximately $4.4 million or more per year. These expenses will be partially offset by an estimated $2.4 million per year of savings as MTAPD moves from 2 person patrols to 1 person patrols in districts outside of New York City. Full budget impacts of the project are expected after 2018. MTA BRIDGES AND TUNNELS Project: Implementation of Cashless Open Road Tolling (ORT). This project is constructing ORT gantries at all MTA crossings (two Tunnels and seven Bridges), as well as installing, integrating and testing all hardware and software to ensure the accuracy of the tolling systems. In addition, toll booths at all facilities are being removed. ORT is the next generation of tolling technology and its implementation will enhance the travel experience of customers at all TBTA facilities. This will result in $77.2 million in additional annual expenses in 2018 upon full implementation of ORT agency-wide. MTA SYSTEM-WIDE Project: Enterprise Asset Management. This project, which has already begun, will not be completed until after 2020. It is expected that the project will result in significant operating budget impacts leading up to and after its full implementation.
V-37

OTHER AGENCIES MTA Bus has no capital projects entering beneficial use in 2017-2020 that have impacts on the operating budget over $1 million.
V-38
VI. Agency Financial Plans and 12-Month Allocations
Bridges and Tunnels

MTA BRIDGES AND TUNNELS FEBRUARY FINANCIAL PLAN 2017-2020
2016 FINAL ESTIMATE AND 2017 ADOPTED BUDGET
In accordance with MTA-approved budget procedures, the following information presents MTA Bridges and Tunnels' (B&T) 2016 Final Estimate, 2017 Adopted Budget and the Financial Plan for 2017-2020. The Adopted Budget reflects the inclusion of MTA Adjustments that were presented in the December Plan and adopted by the Board in December 2016, as well as other technical adjustments. These adjustments are presented on the attached reconciliations from the November Financial Plan. The adjustments that impact B&T's net surplus are described below:
An average 4% toll increase was approved at the January 2017 MTA Board meeting and will go into effect on March 19,2017, generates additional revenue of $55.7 million in 2017, $68.2 million in 2018, $68.7 million in 2019, and $69.0 million in 2020;
A technical adjustment to fund additional credit card fees from higher E-ZPass tolls associated with the toll increase raises expenses by $0.9 million in 2017 and by $1.2 million each year thereafter;
The transfer of funding previously included below-the-line in the MTA Consolidated Financial Plan for the initial design of the Governor's LED Bridge Lighting Initiative increases B&T's expense baseline by $3.0 million in 2016 and by $2.4 million in 2017;
A revision in fuel price forecasts subsequent to the provision of November Plan instructions results in fuel expense decrease of $9 thousand in 2016 and increases between $8 thousand and $31 thousand each year thereafter;
Effective January 2017, non-core Agency procurement functions will be consolidated into a centralized organizational structure at MTA Headquarters (HQ). This consolidation is expected to yield contract savings and other efficiency savings. The Plan has captured some preliminary contract savings. The February Plan reflects a shift of two authorized positions in support of centralized operations from B&T to HQ. It is expected that all related positions will be transferred during the first six months of 2017. For the monthly reporting of expenses and positions, the Plan assumes an effective shift date of April 1, 2017. This is the projected median transfer date, with half of the transfers presumed to take place by then; thereby approximating average expense and headcount levels over the first six months of 2017. While the labor cost of these employees will be assumed by HQ, they are expected to be billed back and expensed within each Agencies’ Professional Services.
The attached also includes schedules detailing the monthly allocation of financial, including overtime, and headcount and utilization data based on the 2017 Adopted Budget for the purpose of reporting actual results on a monthly basis to the Board.
VI-1
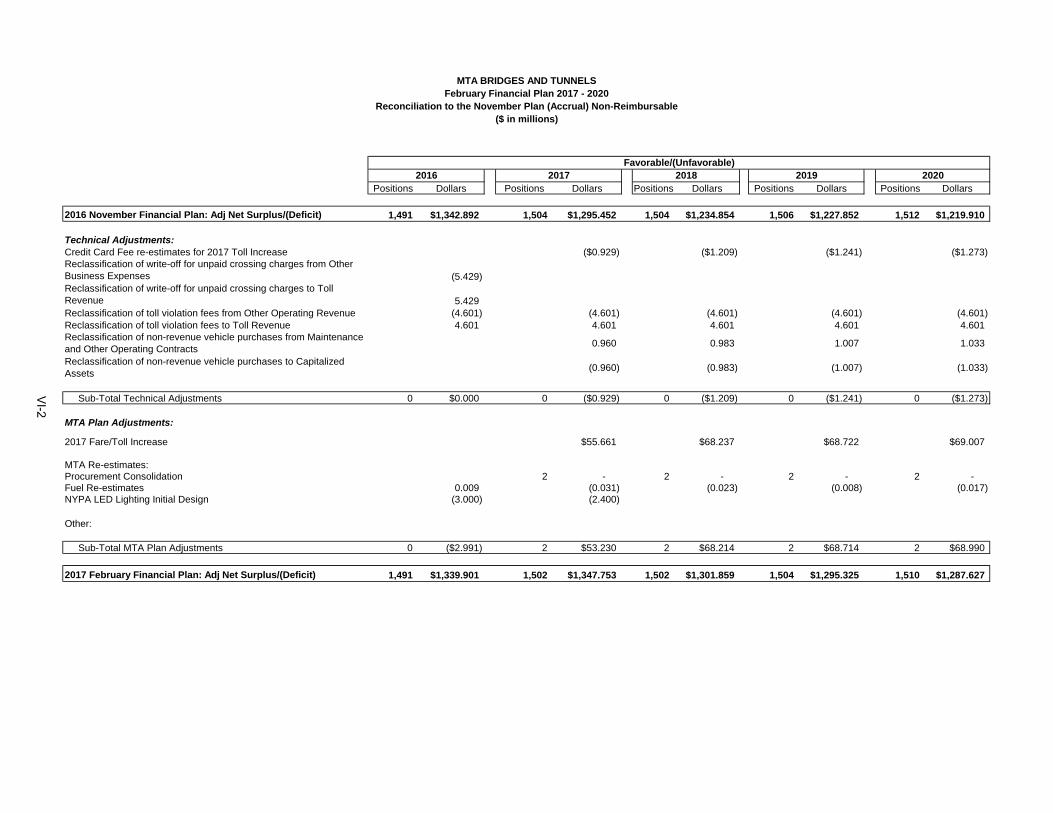
Positions Dollars Positions Dollars Positions Dollars Positions Dollars Positions Dollars
2016 November Financial Plan: Adj Net Surplus/(Deficit) 1,491 $1,342.892 1,504 $1,295.452 1,504 $1,234.854 1,506 $1,227.852 1,512 $1,219.910
Technical Adjustments:Credit Card Fee re-estimates for 2017 Toll Increase ($0.929) ($1.209) ($1.241) ($1.273)Reclassification of write-off for unpaid crossing charges from Other Business Expenses (5.429) Reclassification of write-off for unpaid crossing charges to Toll Revenue 5.429 Reclassification of toll violation fees from Other Operating Revenue (4.601) (4.601) (4.601) (4.601) (4.601) Reclassification of toll violation fees to Toll Revenue 4.601 4.601 4.601 4.601 4.601 Reclassification of non-revenue vehicle purchases from Maintenance and Other Operating Contracts
0.960 0.983 1.007 1.033
Reclassification of non-revenue vehicle purchases to Capitalized Assets
(0.960) (0.983) (1.007) (1.033)
Sub-Total Technical Adjustments 0 $0.000 0 ($0.929) 0 ($1.209) 0 ($1.241) 0 ($1.273)
MTA Plan Adjustments:
2017 Fare/Toll Increase $55.661 $68.237 $68.722 $69.007
MTA Re-estimates:Procurement Consolidation 2 - 2 - 2 - 2 - Fuel Re-estimates 0.009 (0.031) (0.023) (0.008) (0.017) NYPA LED Lighting Initial Design (3.000) (2.400)
Other:
Sub-Total MTA Plan Adjustments 0 ($2.991) 2 $53.230 2 $68.214 2 $68.714 2 $68.990
2017 February Financial Plan: Adj Net Surplus/(Deficit) 1,491 $1,339.901 1,502 $1,347.753 1,502 $1,301.859 1,504 $1,295.325 1,510 $1,287.627
MTA BRIDGES AND TUNNELSFebruary Financial Plan 2017 - 2020
Reconciliation to the November Plan (Accrual) Non-Reimbursable($ in millions)
Favorable/(Unfavorable)2016 2017 2018 2019 2020
VI-2
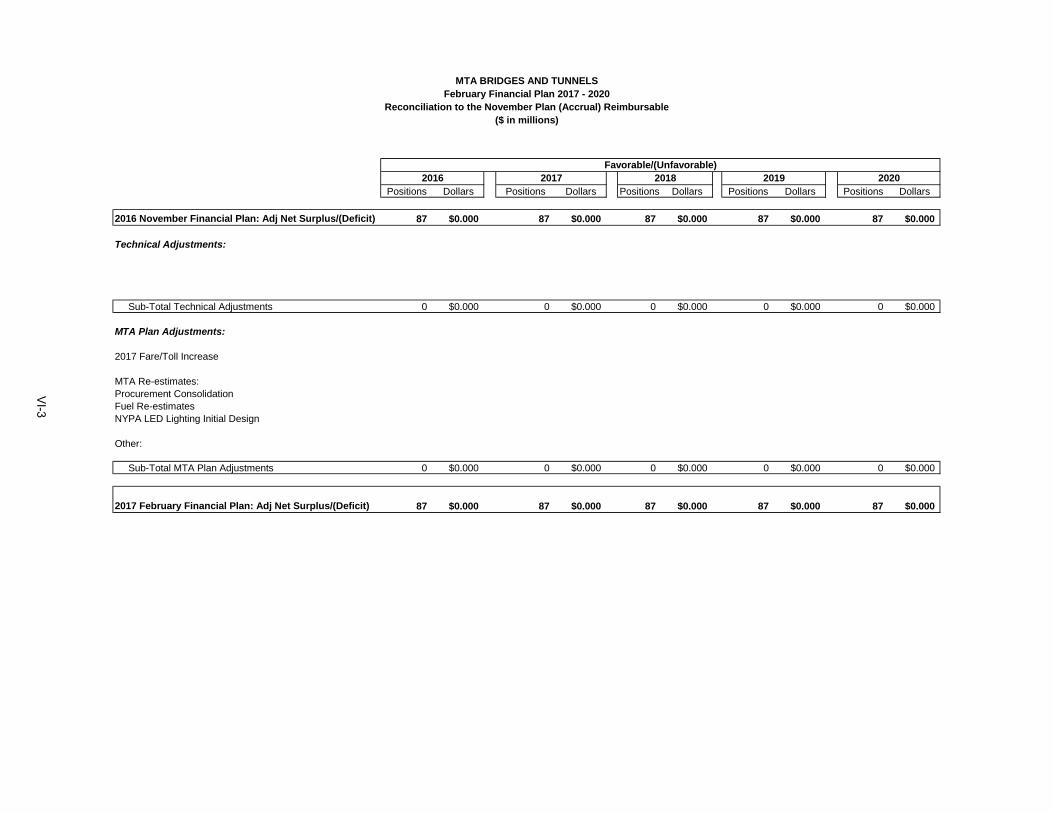
Positions Dollars Positions Dollars Positions Dollars Positions Dollars Positions Dollars
2016 November Financial Plan: Adj Net Surplus/(Deficit) 87 $0.000 87 $0.000 87 $0.000 87 $0.000 87 $0.000
Technical Adjustments:
Sub-Total Technical Adjustments 0 $0.000 0 $0.000 0 $0.000 0 $0.000 0 $0.000
MTA Plan Adjustments:
2017 Fare/Toll Increase
MTA Re-estimates:Procurement ConsolidationFuel Re-estimatesNYPA LED Lighting Initial Design
Other:
Sub-Total MTA Plan Adjustments 0 $0.000 0 $0.000 0 $0.000 0 $0.000 0 $0.000
2017 February Financial Plan: Adj Net Surplus/(Deficit) 87 $0.000 87 $0.000 87 $0.000 87 $0.000 87 $0.000
MTA BRIDGES AND TUNNELSFebruary Financial Plan 2017 - 2020
Reconciliation to the November Plan (Accrual) Reimbursable($ in millions)
Favorable/(Unfavorable)2016 2017 2018 2019 2020
VI-3

NON-REIMBURSABLE
2016 2017
Final Adopted
Estimate Budget 2018 2019 2020
Operating Revenue
Vehicle Toll Revenue $1,868.480 $1,927.222 $1,938.329 $1,951.421 $1,958.769
Other Operating Revenue 22.926 21.619 21.619 21.619 21.619
Capital and Other Reimbursements 0.000 0.000 0.000 0.000 0.000
Investment Income 0.427 0.987 1.240 1.240 1.240
Total Revenue $1,891.832 $1,949.828 $1,961.188 $1,974.280 $1,981.628
Operating Expenses
Labor:
Payroll $124.397 $141.608 $144.664 $150.593 $150.530
Overtime 26.309 26.658 27.190 27.740 28.3
Health and Welfare 24.854 31.044 31.554 32.774 34.0
OPEB Current Payment 18.153 19.424 19.871 20.745 21.7
Pensions 41.812 41.182 41.891 41.520 40.8
Other Fringe Benefits 17.681 18.936 19.291 21.210 22.0
Reimbursable Overhead (5.123) (5.368) (5.151) (5.150) (5.148)
Total Labor Expenses $248.084 $273.483 $279.309 $289.432 $292.152
Non-Labor:
Electric Power $4.966 $5.971 $6.221 $6.488 $6.961
Fuel 1.436 1.805 1.890 1.967 2.178
Insurance 14.855 15.617 16.323 17.081 17.886
Claims 0.000 0.000 0.000 0.000 0.000
Paratransit Service Contracts 0.000 0.000 0.000 0.000 0.000
Maintenance and Other Operating Contracts 151.154 176.077 226.425 230.883 237.984
Professional Service Contracts 39.450 40.885 40.914 41.410 42.513
Materials & Supplies 4.049 4.212 4.319 4.425 4.538
Other Business Expenses 31.712 34.795 35.962 36.890 38.016
Total Non-Labor Expenses $247.621 $279.363 $332.054 $339.145 $350.075
Other Expense Adjustments:
Other $0.000 $0.000 $0.000 $0.000 $0.000
Total Other Expense Adjustments $0.000 $0.000 $0.000 $0.000 $0.000
Total Expenses Before Depreciation and GASB Adjs. $495.706 $552.846 $611.363 $628.577 $642.227
Add: Depreciation $119.521 $127.853 $136.766 $146.300 $156.499
Add: OPEB Obligation 67.291 70.656 74.189 77.898 81.793
Add: GASB 68 Pension Adjustment (10.409) (8.740) (8.423) (6.772) (4.672)
Add: Environmental Remediation 0.000 0.000 0.000 0.000 0.000
Total Expenses After Depreciation and GASB Adjs. $672.108 $742.615 $813.895 $846.003 $875.847
Less: Depreciation $119.521 $127.853 $136.766 $146.300 $156.499
Less: OPEB Obligation 67.291 70.656 74.189 77.898 81.793
Less: GASB 68 Pension Adjustment (10.409) (8.740) (8.423) (6.772) (4.672)
Total Expenses $495.706 $552.846 $611.363 $628.577 $642.227
Net Surplus/(Deficit) $1,396.127 $1,396.982 $1,349.825 $1,345.703 $1,339.401
February Financial Plan 2017-2020Accrual Statement of Operations by Category
($ in millions)
MTA BRIDGES AND TUNNELS
VI-4
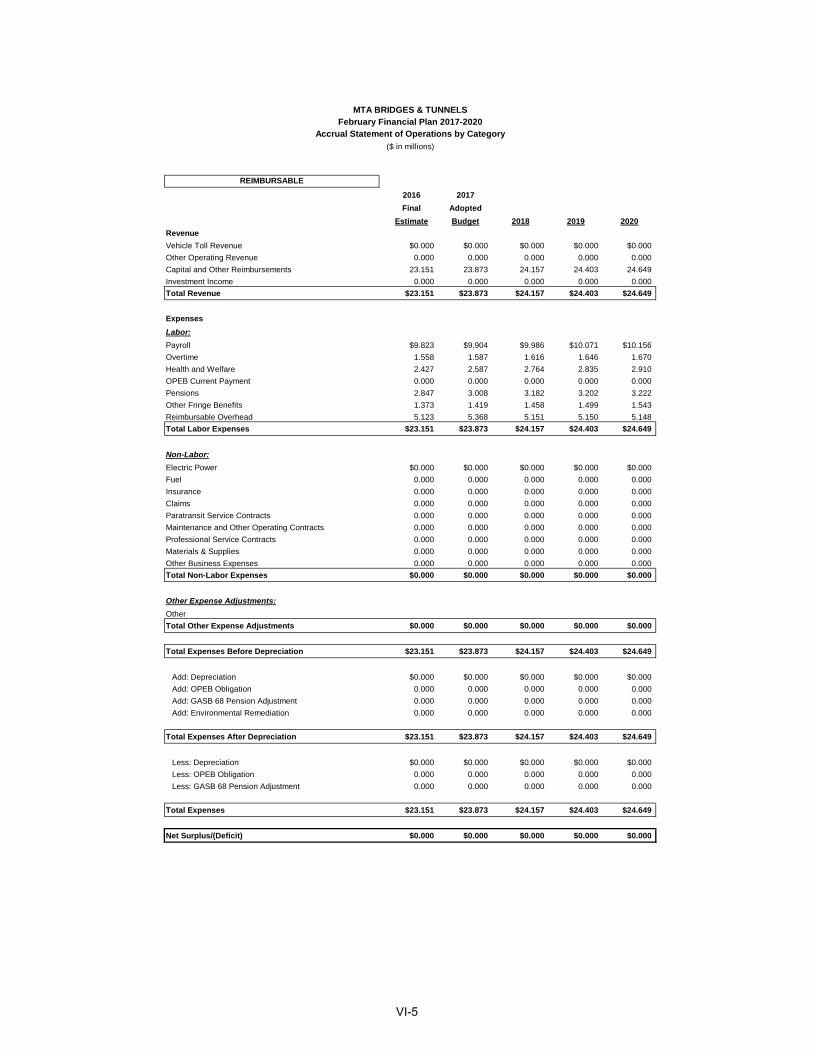
REIMBURSABLE
2016 2017
Final Adopted
Estimate Budget 2018 2019 2020
Revenue
Vehicle Toll Revenue $0.000 $0.000 $0.000 $0.000 $0.000
Other Operating Revenue 0.000 0.000 0.000 0.000 0.000
Capital and Other Reimbursements 23.151 23.873 24.157 24.403 24.649
Investment Income 0.000 0.000 0.000 0.000 0.000
Total Revenue $23.151 $23.873 $24.157 $24.403 $24.649
Expenses
Labor:
Payroll $9.823 $9.904 $9.986 $10.071 $10.156
Overtime 1.558 1.587 1.616 1.646 1.670
Health and Welfare 2.427 2.587 2.764 2.835 2.910
OPEB Current Payment 0.000 0.000 0.000 0.000 0.000
Pensions 2.847 3.008 3.182 3.202 3.222
Other Fringe Benefits 1.373 1.419 1.458 1.499 1.543
Reimbursable Overhead 5.123 5.368 5.151 5.150 5.148
Total Labor Expenses $23.151 $23.873 $24.157 $24.403 $24.649
Non-Labor:
Electric Power $0.000 $0.000 $0.000 $0.000 $0.000
Fuel 0.000 0.000 0.000 0.000 0.000
Insurance 0.000 0.000 0.000 0.000 0.000
Claims 0.000 0.000 0.000 0.000 0.000
Paratransit Service Contracts 0.000 0.000 0.000 0.000 0.000
Maintenance and Other Operating Contracts 0.000 0.000 0.000 0.000 0.000
Professional Service Contracts 0.000 0.000 0.000 0.000 0.000
Materials & Supplies 0.000 0.000 0.000 0.000 0.000
Other Business Expenses 0.000 0.000 0.000 0.000 0.000
Total Non-Labor Expenses $0.000 $0.000 $0.000 $0.000 $0.000
Other Expense Adjustments:
Other
Total Other Expense Adjustments $0.000 $0.000 $0.000 $0.000 $0.000
Total Expenses Before Depreciation $23.151 $23.873 $24.157 $24.403 $24.649
Add: Depreciation $0.000 $0.000 $0.000 $0.000 $0.000
Add: OPEB Obligation 0.000 0.000 0.000 0.000 0.000
Add: GASB 68 Pension Adjustment 0.000 0.000 0.000 0.000 0.000
Add: Environmental Remediation 0.000 0.000 0.000 0.000 0.000
Total Expenses After Depreciation $23.151 $23.873 $24.157 $24.403 $24.649
Less: Depreciation $0.000 $0.000 $0.000 $0.000 $0.000
Less: OPEB Obligation 0.000 0.000 0.000 0.000 0.000
Less: GASB 68 Pension Adjustment 0.000 0.000 0.000 0.000 0.000
Total Expenses $23.151 $23.873 $24.157 $24.403 $24.649
Net Surplus/(Deficit) $0.000 $0.000 $0.000 $0.000 $0.000
MTA BRIDGES & TUNNELSFebruary Financial Plan 2017-2020
Accrual Statement of Operations by Category
($ in millions)
VI-5
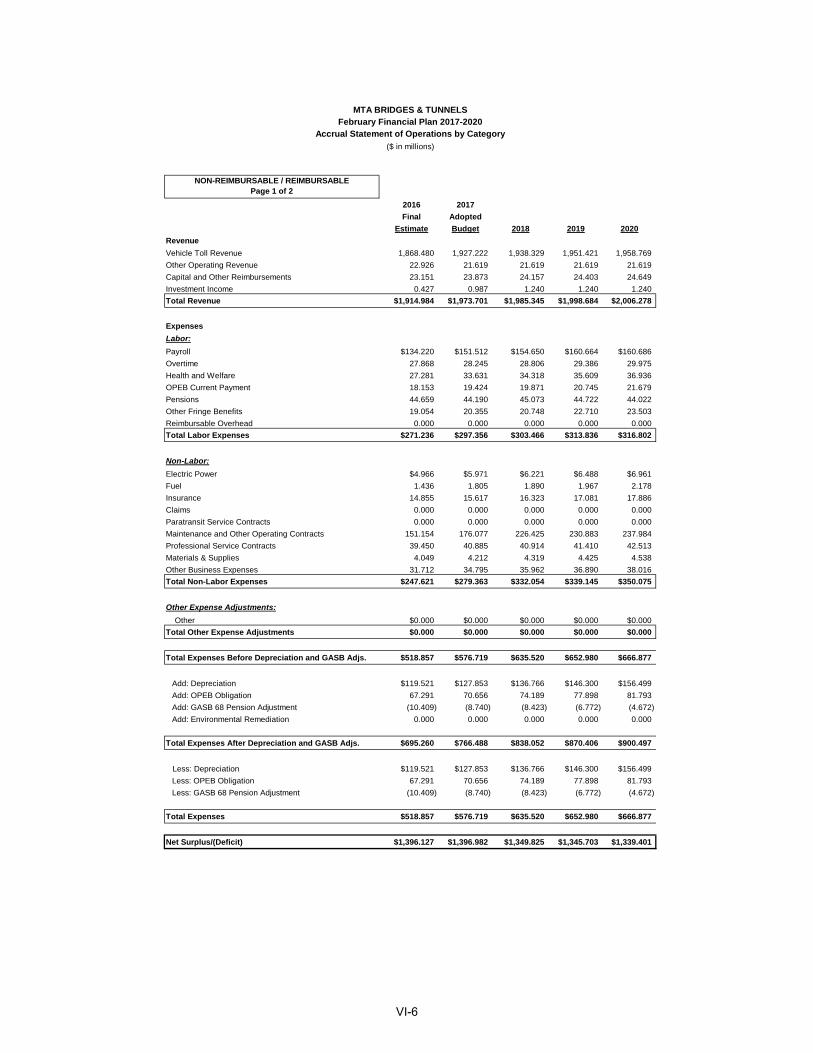
NON-REIMBURSABLE / REIMBURSABLEPage 1 of 2
2016 2017
Final Adopted
Estimate Budget 2018 2019 2020
Revenue
Vehicle Toll Revenue 1,868.480 1,927.222 1,938.329 1,951.421 1,958.769
Other Operating Revenue 22.926 21.619 21.619 21.619 21.619
Capital and Other Reimbursements 23.151 23.873 24.157 24.403 24.649
Investment Income 0.427 0.987 1.240 1.240 1.240
Total Revenue $1,914.984 $1,973.701 $1,985.345 $1,998.684 $2,006.278
Expenses
Labor:
Payroll $134.220 $151.512 $154.650 $160.664 $160.686
Overtime 27.868 28.245 28.806 29.386 29.975
Health and Welfare 27.281 33.631 34.318 35.609 36.936
OPEB Current Payment 18.153 19.424 19.871 20.745 21.679
Pensions 44.659 44.190 45.073 44.722 44.022
Other Fringe Benefits 19.054 20.355 20.748 22.710 23.503
Reimbursable Overhead 0.000 0.000 0.000 0.000 0.000
Total Labor Expenses $271.236 $297.356 $303.466 $313.836 $316.802
Non-Labor:
Electric Power $4.966 $5.971 $6.221 $6.488 $6.961
Fuel 1.436 1.805 1.890 1.967 2.178
Insurance 14.855 15.617 16.323 17.081 17.886
Claims 0.000 0.000 0.000 0.000 0.000
Paratransit Service Contracts 0.000 0.000 0.000 0.000 0.000
Maintenance and Other Operating Contracts 151.154 176.077 226.425 230.883 237.984
Professional Service Contracts 39.450 40.885 40.914 41.410 42.513
Materials & Supplies 4.049 4.212 4.319 4.425 4.538
Other Business Expenses 31.712 34.795 35.962 36.890 38.016
Total Non-Labor Expenses $247.621 $279.363 $332.054 $339.145 $350.075
Other Expense Adjustments:
Other $0.000 $0.000 $0.000 $0.000 $0.000
Total Other Expense Adjustments $0.000 $0.000 $0.000 $0.000 $0.000
Total Expenses Before Depreciation and GASB Adjs. $518.857 $576.719 $635.520 $652.980 $666.877
Add: Depreciation $119.521 $127.853 $136.766 $146.300 $156.499
Add: OPEB Obligation 67.291 70.656 74.189 77.898 81.793
Add: GASB 68 Pension Adjustment (10.409) (8.740) (8.423) (6.772) (4.672)
Add: Environmental Remediation 0.000 0.000 0.000 0.000 0.000
Total Expenses After Depreciation and GASB Adjs. $695.260 $766.488 $838.052 $870.406 $900.497
Less: Depreciation $119.521 $127.853 $136.766 $146.300 $156.499
Less: OPEB Obligation 67.291 70.656 74.189 77.898 81.793
Less: GASB 68 Pension Adjustment (10.409) (8.740) (8.423) (6.772) (4.672)
Total Expenses $518.857 $576.719 $635.520 $652.980 $666.877
Net Surplus/(Deficit) $1,396.127 $1,396.982 $1,349.825 $1,345.703 $1,339.401
February Financial Plan 2017-2020Accrual Statement of Operations by Category
($ in millions)
MTA BRIDGES & TUNNELS
VI-6
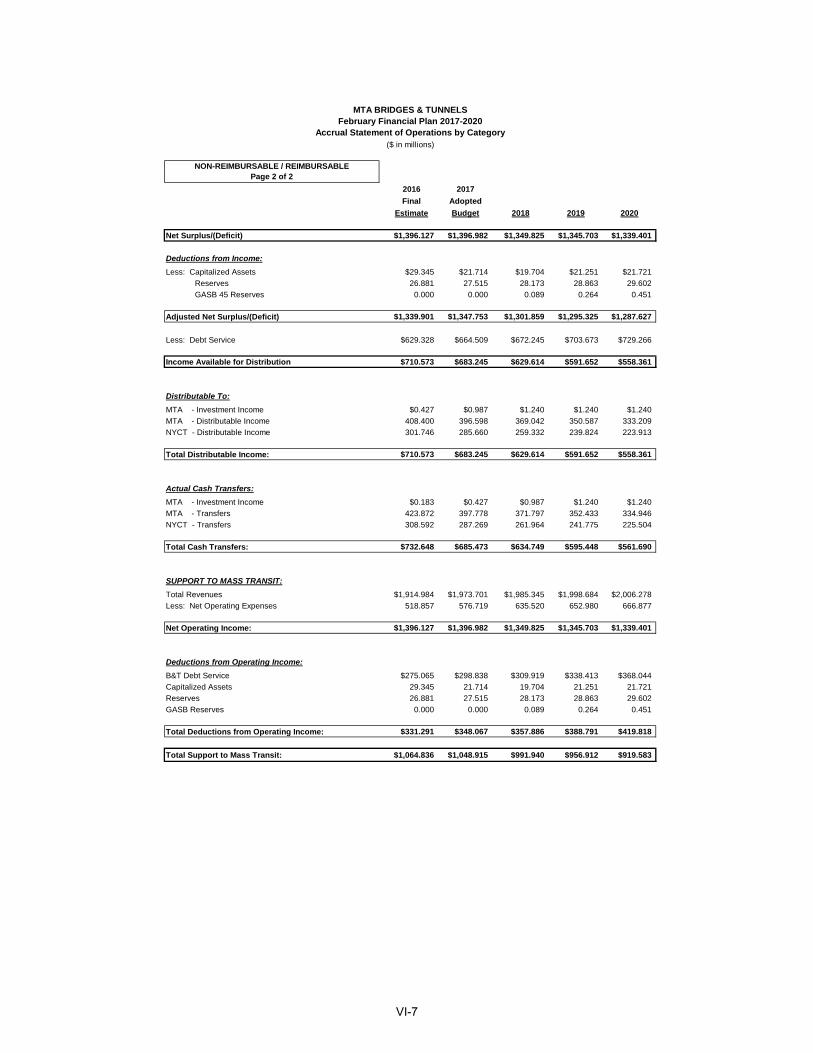
NON-REIMBURSABLE / REIMBURSABLEPage 2 of 2
2016 2017
Final Adopted
Estimate Budget 2018 2019 2020
Net Surplus/(Deficit) $1,396.127 $1,396.982 $1,349.825 $1,345.703 $1,339.401
Deductions from Income:
Less: Capitalized Assets $29.345 $21.714 $19.704 $21.251 $21.721
Reserves 26.881 27.515 28.173 28.863 29.602
GASB 45 Reserves 0.000 0.000 0.089 0.264 0.451
Adjusted Net Surplus/(Deficit) $1,339.901 $1,347.753 $1,301.859 $1,295.325 $1,287.627
Less: Debt Service $629.328 $664.509 $672.245 $703.673 $729.266
Income Available for Distribution $710.573 $683.245 $629.614 $591.652 $558.361
Distributable To:
MTA - Investment Income $0.427 $0.987 $1.240 $1.240 $1.240
MTA - Distributable Income 408.400 396.598 369.042 350.587 333.209
NYCT - Distributable Income 301.746 285.660 259.332 239.824 223.913
Total Distributable Income: $710.573 $683.245 $629.614 $591.652 $558.361
Actual Cash Transfers:
MTA - Investment Income $0.183 $0.427 $0.987 $1.240 $1.240
MTA - Transfers 423.872 397.778 371.797 352.433 334.946
NYCT - Transfers 308.592 287.269 261.964 241.775 225.504
Total Cash Transfers: $732.648 $685.473 $634.749 $595.448 $561.690
SUPPORT TO MASS TRANSIT:
Total Revenues $1,914.984 $1,973.701 $1,985.345 $1,998.684 $2,006.278
Less: Net Operating Expenses 518.857 576.719 635.520 652.980 666.877
Net Operating Income: $1,396.127 $1,396.982 $1,349.825 $1,345.703 $1,339.401
Deductions from Operating Income:
B&T Debt Service $275.065 $298.838 $309.919 $338.413 $368.044
Capitalized Assets 29.345 21.714 19.704 21.251 21.721
Reserves 26.881 27.515 28.173 28.863 29.602
GASB Reserves 0.000 0.000 0.089 0.264 0.451
Total Deductions from Operating Income: $331.291 $348.067 $357.886 $388.791 $419.818
Total Support to Mass Transit: $1,064.836 $1,048.915 $991.940 $956.912 $919.583
($ in millions)
MTA BRIDGES & TUNNELSFebruary Financial Plan 2017-2020
Accrual Statement of Operations by Category
VI-7
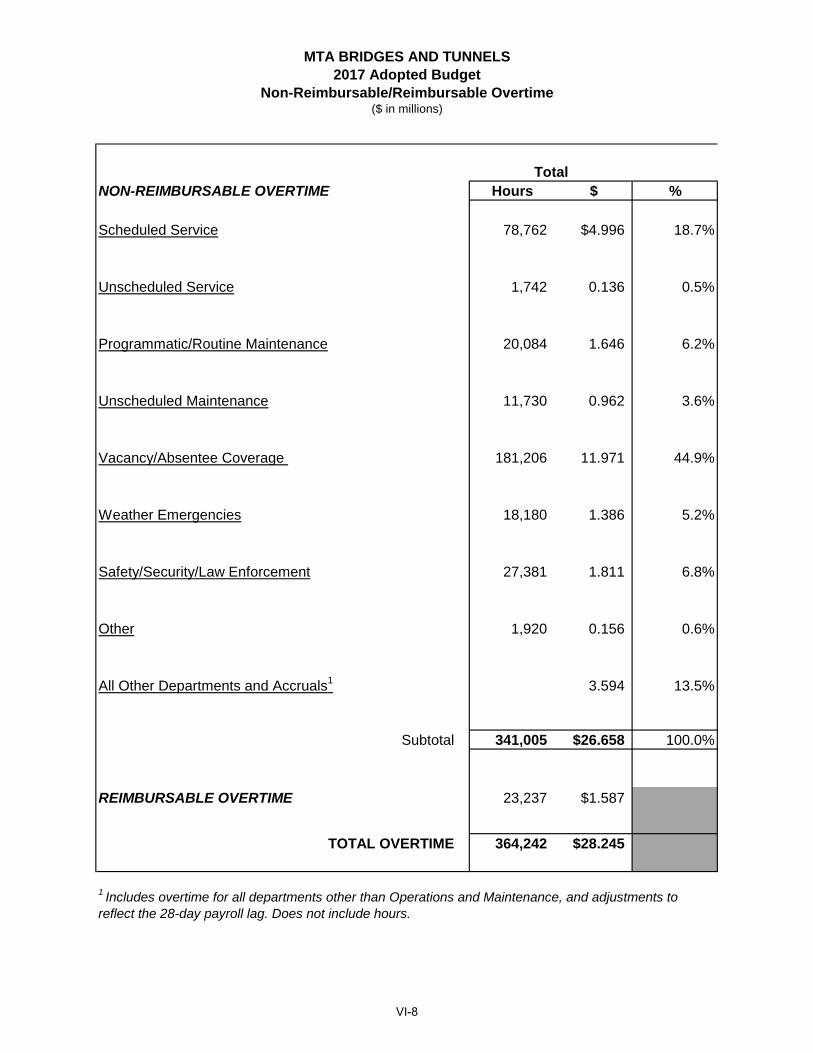
MTA BRIDGES AND TUNNELS2017 Adopted Budget
Non-Reimbursable/Reimbursable Overtime ($ in millions)
NON-REIMBURSABLE OVERTIME Hours $ %
Scheduled Service 78,762 $4.996 18.7%
Unscheduled Service 1,742 0.136 0.5%
Programmatic/Routine Maintenance 20,084 1.646 6.2%
Unscheduled Maintenance 11,730 0.962 3.6%
Vacancy/Absentee Coverage 181,206 11.971 44.9%
Weather Emergencies 18,180 1.386 5.2%
Safety/Security/Law Enforcement 27,381 1.811 6.8%
Other 1,920 0.156 0.6%
All Other Departments and Accruals1 3.594 13.5%
Subtotal 341,005 $26.658 100.0%
REIMBURSABLE OVERTIME 23,237 $1.587
TOTAL OVERTIME 364,242 $28.245
Total
1 Includes overtime for all departments other than Operations and Maintenance, and adjustments to reflect the 28-day payroll lag. Does not include hours.
VI-8

2016 2017Final Adopted
Estimate Budget 2018 2019 2020
TRAFFIC VOLUME
Total Traffic Volume 307.099 305.033 305.035 307.517 309.262
TOLL REVENUE
Total Toll Revenue $1,868.480 $1,927.222 $1,938.329 $1,951.421 $1,958.769
MTA BRIDGES AND TUNNELSFebruary Financial Plan 2017-2020
Traffic Volume/(Utilization)(in millions)
VI-9
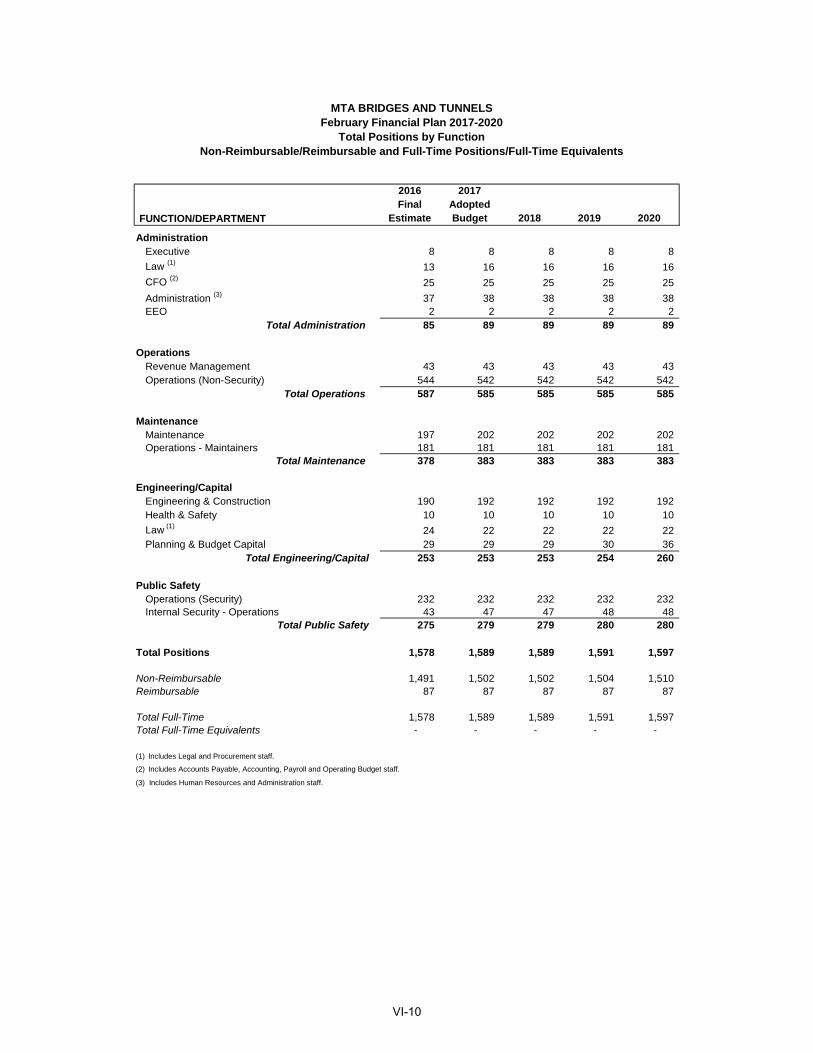
2016 2017Final Adopted
Estimate Budget 2018 2019 2020
AdministrationExecutive 8 8 8 8 8
Law (1)13 16 16 16 16
CFO (2)25 25 25 25 25
Administration (3) 37 38 38 38 38EEO 2 2 2 2 2
Total Administration 85 89 89 89 89
OperationsRevenue Management 43 43 43 43 43Operations (Non-Security) 544 542 542 542 542
Total Operations 587 585 585 585 585
MaintenanceMaintenance 197 202 202 202 202Operations - Maintainers 181 181 181 181 181
Total Maintenance 378 383 383 383 383
Engineering/CapitalEngineering & Construction 190 192 192 192 192Health & Safety 10 10 10 10 10
Law (1)24 22 22 22 22
Planning & Budget Capital 29 29 29 30 36Total Engineering/Capital 253 253 253 254 260
Public SafetyOperations (Security) 232 232 232 232 232Internal Security - Operations 43 47 47 48 48
Total Public Safety 275 279 279 280 280
Total Positions 1,578 1,589 1,589 1,591 1,597
Non-Reimbursable 1,491 1,502 1,502 1,504 1,510Reimbursable 87 87 87 87 87
Total Full-Time 1,578 1,589 1,589 1,591 1,597Total Full-Time Equivalents - - - - -
(1) Includes Legal and Procurement staff.
(2) Includes Accounts Payable, Accounting, Payroll and Operating Budget staff.
(3) Includes Human Resources and Administration staff.
FUNCTION/DEPARTMENT
MTA BRIDGES AND TUNNELSFebruary Financial Plan 2017-2020
Total Positions by FunctionNon-Reimbursable/Reimbursable and Full-Time Positions/Full-Time Equivalents
VI-10
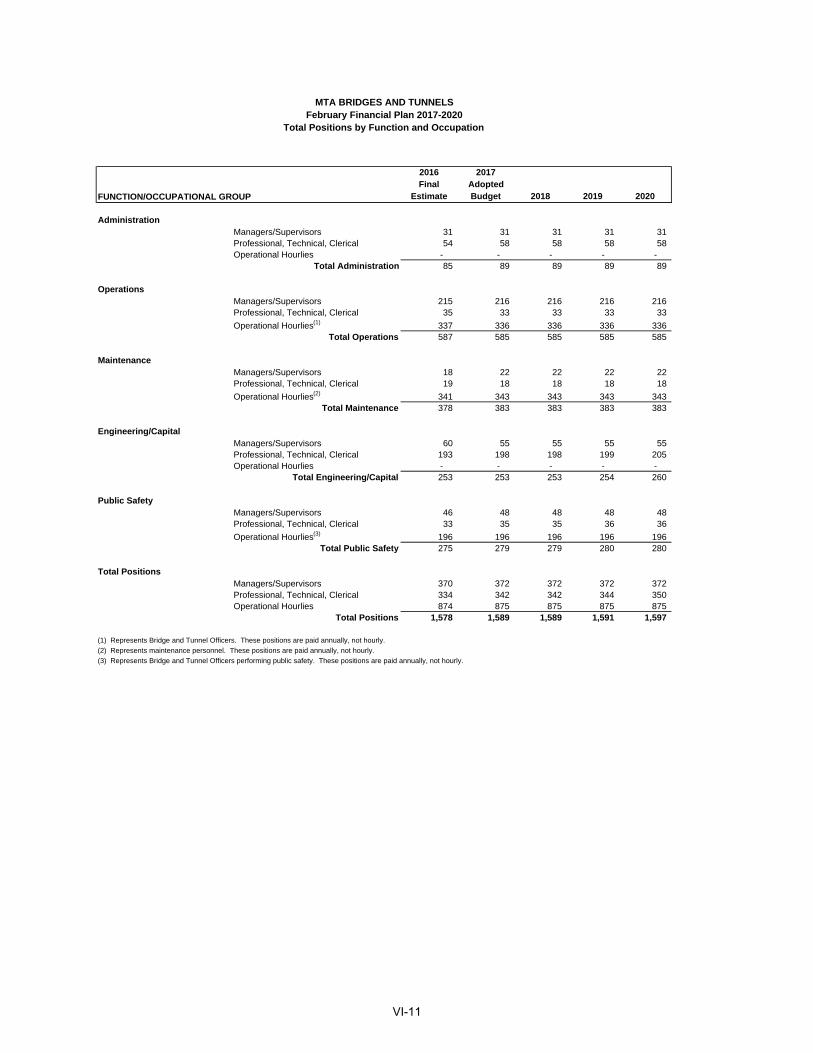
2016 2017Final Adopted
FUNCTION/OCCUPATIONAL GROUP Estimate Budget 2018 2019 2020
Administration Managers/Supervisors 31 31 31 31 31 Professional, Technical, Clerical 54 58 58 58 58 Operational Hourlies - - - - -
Total Administration 85 89 89 89 89
Operations Managers/Supervisors 215 216 216 216 216 Professional, Technical, Clerical 35 33 33 33 33
Operational Hourlies(1) 337 336 336 336 336 Total Operations 587 585 585 585 585
Maintenance Managers/Supervisors 18 22 22 22 22 Professional, Technical, Clerical 19 18 18 18 18
Operational Hourlies(2) 341 343 343 343 343 Total Maintenance 378 383 383 383 383
Engineering/Capital Managers/Supervisors 60 55 55 55 55 Professional, Technical, Clerical 193 198 198 199 205 Operational Hourlies - - - - -
Total Engineering/Capital 253 253 253 254 260
Public Safety Managers/Supervisors 46 48 48 48 48 Professional, Technical, Clerical 33 35 35 36 36
Operational Hourlies(3) 196 196 196 196 196 Total Public Safety 275 279 279 280 280
Total Positions Managers/Supervisors 370 372 372 372 372 Professional, Technical, Clerical 334 342 342 344 350 Operational Hourlies 874 875 875 875 875
Total Positions 1,578 1,589 1,589 1,591 1,597
(1) Represents Bridge and Tunnel Officers. These positions are paid annually, not hourly.
(2) Represents maintenance personnel. These positions are paid annually, not hourly.
(3) Represents Bridge and Tunnel Officers performing public safety. These positions are paid annually, not hourly.
MTA BRIDGES AND TUNNELSFebruary Financial Plan 2017-2020
Total Positions by Function and Occupation
VI-11
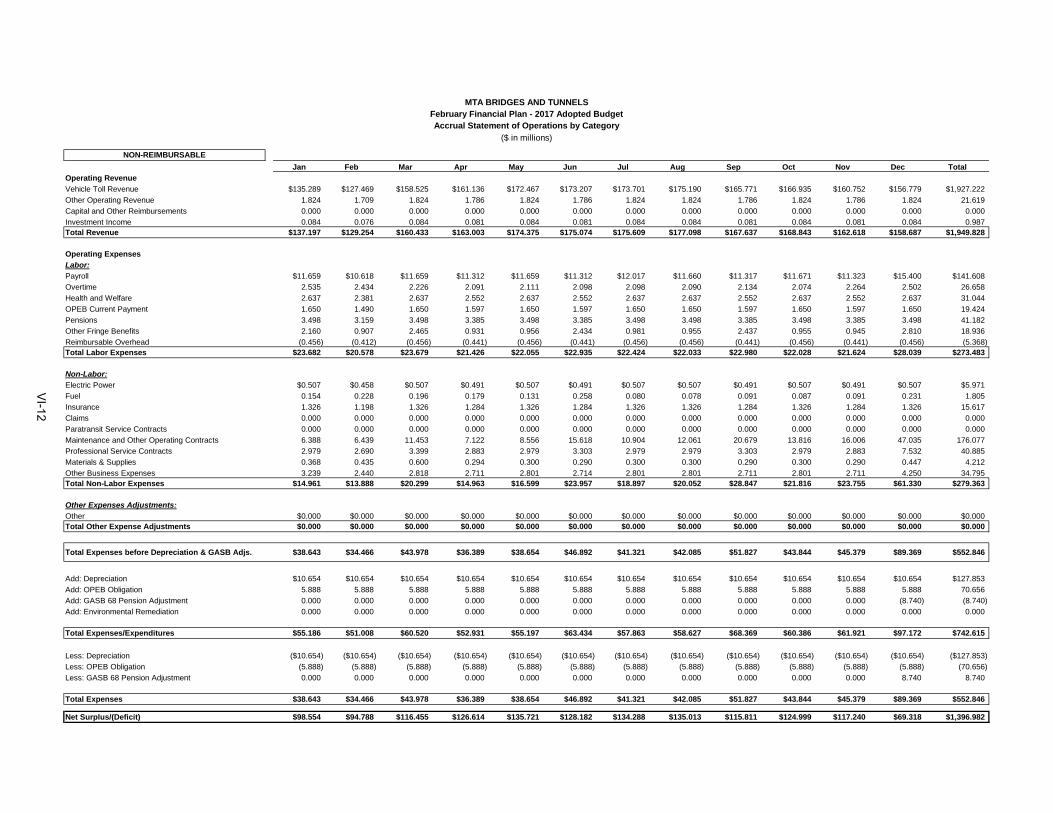
NON-REIMBURSABLE
Jan Feb Mar Apr May Jun Jul Aug Sep Oct Nov Dec Total
Operating Revenue
Vehicle Toll Revenue $135.289 $127.469 $158.525 $161.136 $172.467 $173.207 $173.701 $175.190 $165.771 $166.935 $160.752 $156.779 $1,927.222
Other Operating Revenue 1.824 1.709 1.824 1.786 1.824 1.786 1.824 1.824 1.786 1.824 1.786 1.824 21.619
Capital and Other Reimbursements 0.000 0.000 0.000 0.000 0.000 0.000 0.000 0.000 0.000 0.000 0.000 0.000 0.000
Investment Income 0.084 0.076 0.084 0.081 0.084 0.081 0.084 0.084 0.081 0.084 0.081 0.084 0.987Total Revenue $137.197 $129.254 $160.433 $163.003 $174.375 $175.074 $175.609 $177.098 $167.637 $168.843 $162.618 $158.687 $1,949.828
Operating Expenses
Labor:
Payroll $11.659 $10.618 $11.659 $11.312 $11.659 $11.312 $12.017 $11.660 $11.317 $11.671 $11.323 $15.400 $141.608
Overtime 2.535 2.434 2.226 2.091 2.111 2.098 2.098 2.090 2.134 2.074 2.264 2.502 26.658
Health and Welfare 2.637 2.381 2.637 2.552 2.637 2.552 2.637 2.637 2.552 2.637 2.552 2.637 31.044
OPEB Current Payment 1.650 1.490 1.650 1.597 1.650 1.597 1.650 1.650 1.597 1.650 1.597 1.650 19.424
Pensions 3.498 3.159 3.498 3.385 3.498 3.385 3.498 3.498 3.385 3.498 3.385 3.498 41.182
Other Fringe Benefits 2.160 0.907 2.465 0.931 0.956 2.434 0.981 0.955 2.437 0.955 0.945 2.810 18.936
Reimbursable Overhead (0.456) (0.412) (0.456) (0.441) (0.456) (0.441) (0.456) (0.456) (0.441) (0.456) (0.441) (0.456) (5.368)Total Labor Expenses $23.682 $20.578 $23.679 $21.426 $22.055 $22.935 $22.424 $22.033 $22.980 $22.028 $21.624 $28.039 $273.483
Non-Labor:
Electric Power $0.507 $0.458 $0.507 $0.491 $0.507 $0.491 $0.507 $0.507 $0.491 $0.507 $0.491 $0.507 $5.971
Fuel 0.154 0.228 0.196 0.179 0.131 0.258 0.080 0.078 0.091 0.087 0.091 0.231 1.805
Insurance 1.326 1.198 1.326 1.284 1.326 1.284 1.326 1.326 1.284 1.326 1.284 1.326 15.617
Claims 0.000 0.000 0.000 0.000 0.000 0.000 0.000 0.000 0.000 0.000 0.000 0.000 0.000
Paratransit Service Contracts 0.000 0.000 0.000 0.000 0.000 0.000 0.000 0.000 0.000 0.000 0.000 0.000 0.000
Maintenance and Other Operating Contracts 6.388 6.439 11.453 7.122 8.556 15.618 10.904 12.061 20.679 13.816 16.006 47.035 176.077
Professional Service Contracts 2.979 2.690 3.399 2.883 2.979 3.303 2.979 2.979 3.303 2.979 2.883 7.532 40.885
Materials & Supplies 0.368 0.435 0.600 0.294 0.300 0.290 0.300 0.300 0.290 0.300 0.290 0.447 4.212
Other Business Expenses 3.239 2.440 2.818 2.711 2.801 2.714 2.801 2.801 2.711 2.801 2.711 4.250 34.795Total Non-Labor Expenses $14.961 $13.888 $20.299 $14.963 $16.599 $23.957 $18.897 $20.052 $28.847 $21.816 $23.755 $61.330 $279.363
Other Expenses Adjustments:
Other $0.000 $0.000 $0.000 $0.000 $0.000 $0.000 $0.000 $0.000 $0.000 $0.000 $0.000 $0.000 $0.000Total Other Expense Adjustments $0.000 $0.000 $0.000 $0.000 $0.000 $0.000 $0.000 $0.000 $0.000 $0.000 $0.000 $0.000 $0.000
Total Expenses before Depreciation & GASB Adjs. $38.643 $34.466 $43.978 $36.389 $38.654 $46.892 $41.321 $42.085 $51.827 $43.844 $45.379 $89.369 $552.846
Add: Depreciation $10.654 $10.654 $10.654 $10.654 $10.654 $10.654 $10.654 $10.654 $10.654 $10.654 $10.654 $10.654 $127.853
Add: OPEB Obligation 5.888 5.888 5.888 5.888 5.888 5.888 5.888 5.888 5.888 5.888 5.888 5.888 70.656
Add: GASB 68 Pension Adjustment 0.000 0.000 0.000 0.000 0.000 0.000 0.000 0.000 0.000 0.000 0.000 (8.740) (8.740)
Add: Environmental Remediation 0.000 0.000 0.000 0.000 0.000 0.000 0.000 0.000 0.000 0.000 0.000 0.000 0.000
Total Expenses/Expenditures $55.186 $51.008 $60.520 $52.931 $55.197 $63.434 $57.863 $58.627 $68.369 $60.386 $61.921 $97.172 $742.615
Less: Depreciation ($10.654) ($10.654) ($10.654) ($10.654) ($10.654) ($10.654) ($10.654) ($10.654) ($10.654) ($10.654) ($10.654) ($10.654) ($127.853)
Less: OPEB Obligation (5.888) (5.888) (5.888) (5.888) (5.888) (5.888) (5.888) (5.888) (5.888) (5.888) (5.888) (5.888) (70.656)
Less: GASB 68 Pension Adjustment 0.000 0.000 0.000 0.000 0.000 0.000 0.000 0.000 0.000 0.000 0.000 8.740 8.740
Total Expenses $38.643 $34.466 $43.978 $36.389 $38.654 $46.892 $41.321 $42.085 $51.827 $43.844 $45.379 $89.369 $552.846
Net Surplus/(Deficit) $98.554 $94.788 $116.455 $126.614 $135.721 $128.182 $134.288 $135.013 $115.811 $124.999 $117.240 $69.318 $1,396.982
MTA BRIDGES AND TUNNELSFebruary Financial Plan - 2017 Adopted BudgetAccrual Statement of Operations by Category
($ in millions)
VI-12
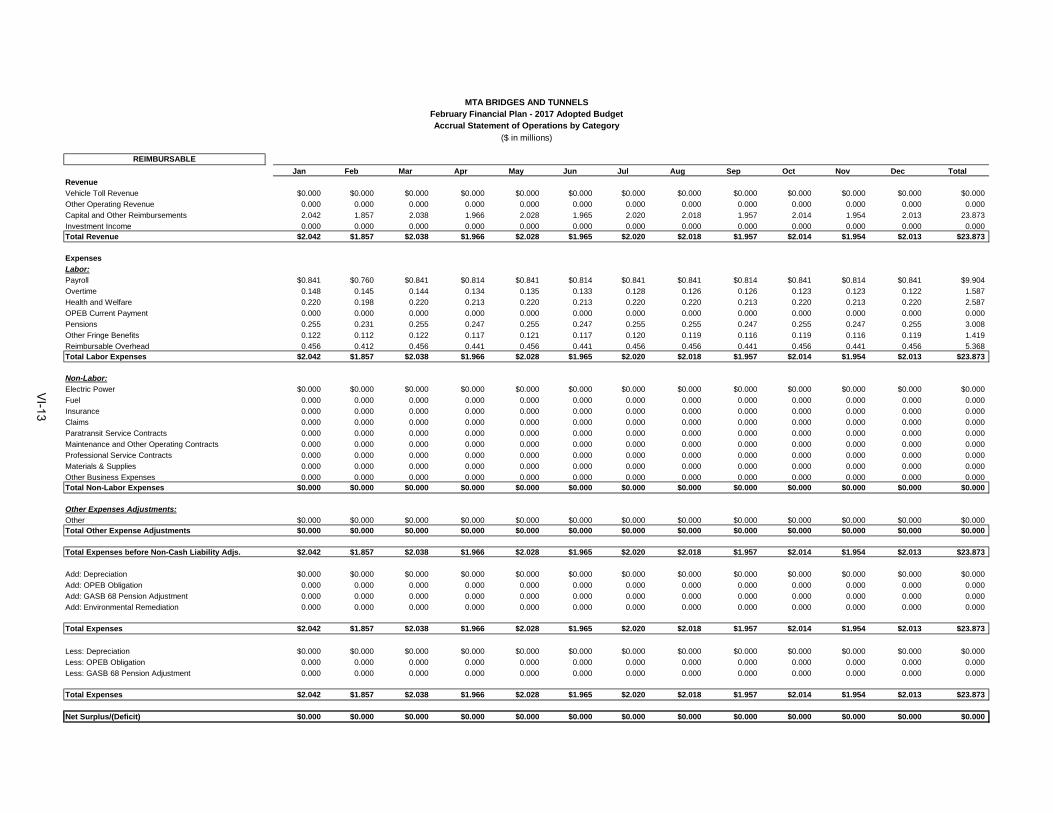
REIMBURSABLE
Jan Feb Mar Apr May Jun Jul Aug Sep Oct Nov Dec Total
Revenue
Vehicle Toll Revenue $0.000 $0.000 $0.000 $0.000 $0.000 $0.000 $0.000 $0.000 $0.000 $0.000 $0.000 $0.000 $0.000
Other Operating Revenue 0.000 0.000 0.000 0.000 0.000 0.000 0.000 0.000 0.000 0.000 0.000 0.000 0.000
Capital and Other Reimbursements 2.042 1.857 2.038 1.966 2.028 1.965 2.020 2.018 1.957 2.014 1.954 2.013 23.873
Investment Income 0.000 0.000 0.000 0.000 0.000 0.000 0.000 0.000 0.000 0.000 0.000 0.000 0.000Total Revenue $2.042 $1.857 $2.038 $1.966 $2.028 $1.965 $2.020 $2.018 $1.957 $2.014 $1.954 $2.013 $23.873
Expenses
Labor:
Payroll $0.841 $0.760 $0.841 $0.814 $0.841 $0.814 $0.841 $0.841 $0.814 $0.841 $0.814 $0.841 $9.904
Overtime 0.148 0.145 0.144 0.134 0.135 0.133 0.128 0.126 0.126 0.123 0.123 0.122 1.587
Health and Welfare 0.220 0.198 0.220 0.213 0.220 0.213 0.220 0.220 0.213 0.220 0.213 0.220 2.587
OPEB Current Payment 0.000 0.000 0.000 0.000 0.000 0.000 0.000 0.000 0.000 0.000 0.000 0.000 0.000
Pensions 0.255 0.231 0.255 0.247 0.255 0.247 0.255 0.255 0.247 0.255 0.247 0.255 3.008
Other Fringe Benefits 0.122 0.112 0.122 0.117 0.121 0.117 0.120 0.119 0.116 0.119 0.116 0.119 1.419
Reimbursable Overhead 0.456 0.412 0.456 0.441 0.456 0.441 0.456 0.456 0.441 0.456 0.441 0.456 5.368Total Labor Expenses $2.042 $1.857 $2.038 $1.966 $2.028 $1.965 $2.020 $2.018 $1.957 $2.014 $1.954 $2.013 $23.873
Non-Labor:
Electric Power $0.000 $0.000 $0.000 $0.000 $0.000 $0.000 $0.000 $0.000 $0.000 $0.000 $0.000 $0.000 $0.000
Fuel 0.000 0.000 0.000 0.000 0.000 0.000 0.000 0.000 0.000 0.000 0.000 0.000 0.000
Insurance 0.000 0.000 0.000 0.000 0.000 0.000 0.000 0.000 0.000 0.000 0.000 0.000 0.000
Claims 0.000 0.000 0.000 0.000 0.000 0.000 0.000 0.000 0.000 0.000 0.000 0.000 0.000
Paratransit Service Contracts 0.000 0.000 0.000 0.000 0.000 0.000 0.000 0.000 0.000 0.000 0.000 0.000 0.000
Maintenance and Other Operating Contracts 0.000 0.000 0.000 0.000 0.000 0.000 0.000 0.000 0.000 0.000 0.000 0.000 0.000
Professional Service Contracts 0.000 0.000 0.000 0.000 0.000 0.000 0.000 0.000 0.000 0.000 0.000 0.000 0.000
Materials & Supplies 0.000 0.000 0.000 0.000 0.000 0.000 0.000 0.000 0.000 0.000 0.000 0.000 0.000
Other Business Expenses 0.000 0.000 0.000 0.000 0.000 0.000 0.000 0.000 0.000 0.000 0.000 0.000 0.000Total Non-Labor Expenses $0.000 $0.000 $0.000 $0.000 $0.000 $0.000 $0.000 $0.000 $0.000 $0.000 $0.000 $0.000 $0.000
Other Expenses Adjustments:
Other $0.000 $0.000 $0.000 $0.000 $0.000 $0.000 $0.000 $0.000 $0.000 $0.000 $0.000 $0.000 $0.000Total Other Expense Adjustments $0.000 $0.000 $0.000 $0.000 $0.000 $0.000 $0.000 $0.000 $0.000 $0.000 $0.000 $0.000 $0.000
Total Expenses before Non-Cash Liability Adjs. $2.042 $1.857 $2.038 $1.966 $2.028 $1.965 $2.020 $2.018 $1.957 $2.014 $1.954 $2.013 $23.873
Add: Depreciation $0.000 $0.000 $0.000 $0.000 $0.000 $0.000 $0.000 $0.000 $0.000 $0.000 $0.000 $0.000 $0.000
Add: OPEB Obligation 0.000 0.000 0.000 0.000 0.000 0.000 0.000 0.000 0.000 0.000 0.000 0.000 0.000
Add: GASB 68 Pension Adjustment 0.000 0.000 0.000 0.000 0.000 0.000 0.000 0.000 0.000 0.000 0.000 0.000 0.000
Add: Environmental Remediation 0.000 0.000 0.000 0.000 0.000 0.000 0.000 0.000 0.000 0.000 0.000 0.000 0.000
Total Expenses $2.042 $1.857 $2.038 $1.966 $2.028 $1.965 $2.020 $2.018 $1.957 $2.014 $1.954 $2.013 $23.873
Less: Depreciation $0.000 $0.000 $0.000 $0.000 $0.000 $0.000 $0.000 $0.000 $0.000 $0.000 $0.000 $0.000 $0.000
Less: OPEB Obligation 0.000 0.000 0.000 0.000 0.000 0.000 0.000 0.000 0.000 0.000 0.000 0.000 0.000
Less: GASB 68 Pension Adjustment 0.000 0.000 0.000 0.000 0.000 0.000 0.000 0.000 0.000 0.000 0.000 0.000 0.000
Total Expenses $2.042 $1.857 $2.038 $1.966 $2.028 $1.965 $2.020 $2.018 $1.957 $2.014 $1.954 $2.013 $23.873
Net Surplus/(Deficit) $0.000 $0.000 $0.000 $0.000 $0.000 $0.000 $0.000 $0.000 $0.000 $0.000 $0.000 $0.000 $0.000
February Financial Plan - 2017 Adopted BudgetAccrual Statement of Operations by Category
($ in millions)
MTA BRIDGES AND TUNNELS
VI-13
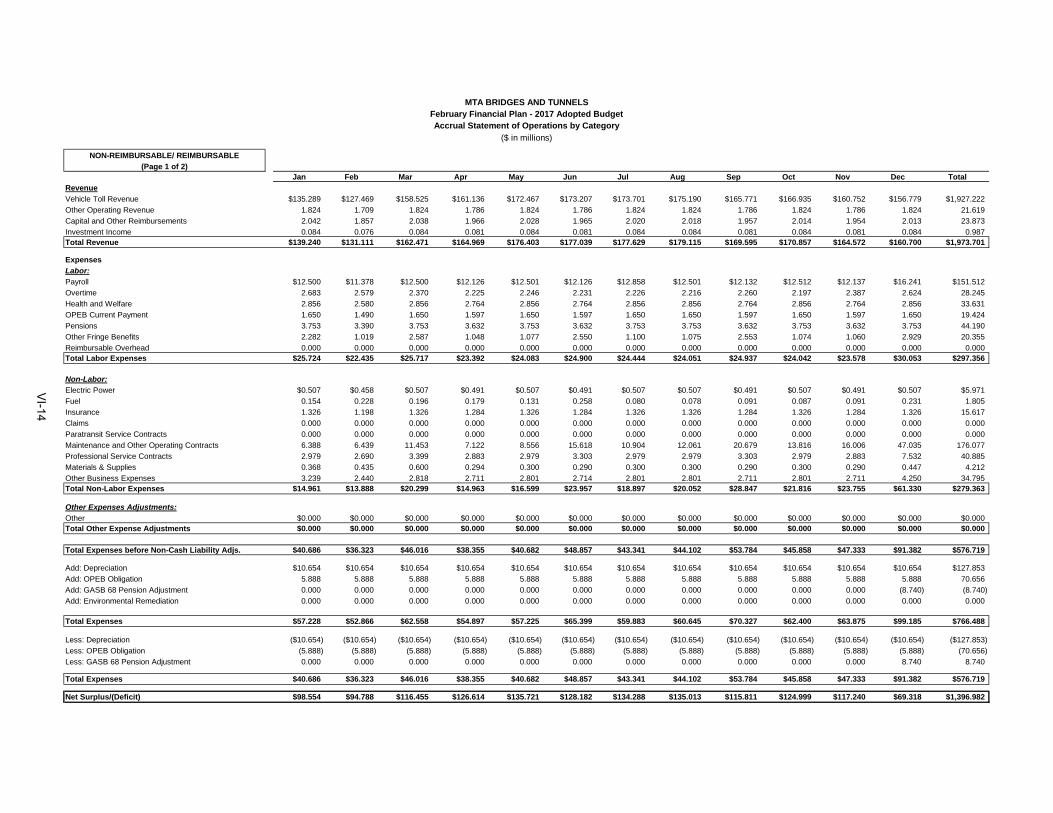
NON-REIMBURSABLE/ REIMBURSABLE
(Page 1 of 2)Jan Feb Mar Apr May Jun Jul Aug Sep Oct Nov Dec Total
Revenue
Vehicle Toll Revenue $135.289 $127.469 $158.525 $161.136 $172.467 $173.207 $173.701 $175.190 $165.771 $166.935 $160.752 $156.779 $1,927.222
Other Operating Revenue 1.824 1.709 1.824 1.786 1.824 1.786 1.824 1.824 1.786 1.824 1.786 1.824 21.619
Capital and Other Reimbursements 2.042 1.857 2.038 1.966 2.028 1.965 2.020 2.018 1.957 2.014 1.954 2.013 23.873
Investment Income 0.084 0.076 0.084 0.081 0.084 0.081 0.084 0.084 0.081 0.084 0.081 0.084 0.987Total Revenue $139.240 $131.111 $162.471 $164.969 $176.403 $177.039 $177.629 $179.115 $169.595 $170.857 $164.572 $160.700 $1,973.701
Expenses
Labor:
Payroll $12.500 $11.378 $12.500 $12.126 $12.501 $12.126 $12.858 $12.501 $12.132 $12.512 $12.137 $16.241 $151.512
Overtime 2.683 2.579 2.370 2.225 2.246 2.231 2.226 2.216 2.260 2.197 2.387 2.624 28.245
Health and Welfare 2.856 2.580 2.856 2.764 2.856 2.764 2.856 2.856 2.764 2.856 2.764 2.856 33.631
OPEB Current Payment 1.650 1.490 1.650 1.597 1.650 1.597 1.650 1.650 1.597 1.650 1.597 1.650 19.424
Pensions 3.753 3.390 3.753 3.632 3.753 3.632 3.753 3.753 3.632 3.753 3.632 3.753 44.190
Other Fringe Benefits 2.282 1.019 2.587 1.048 1.077 2.550 1.100 1.075 2.553 1.074 1.060 2.929 20.355
Reimbursable Overhead 0.000 0.000 0.000 0.000 0.000 0.000 0.000 0.000 0.000 0.000 0.000 0.000 0.000Total Labor Expenses $25.724 $22.435 $25.717 $23.392 $24.083 $24.900 $24.444 $24.051 $24.937 $24.042 $23.578 $30.053 $297.356
Non-Labor:
Electric Power $0.507 $0.458 $0.507 $0.491 $0.507 $0.491 $0.507 $0.507 $0.491 $0.507 $0.491 $0.507 $5.971
Fuel 0.154 0.228 0.196 0.179 0.131 0.258 0.080 0.078 0.091 0.087 0.091 0.231 1.805
Insurance 1.326 1.198 1.326 1.284 1.326 1.284 1.326 1.326 1.284 1.326 1.284 1.326 15.617
Claims 0.000 0.000 0.000 0.000 0.000 0.000 0.000 0.000 0.000 0.000 0.000 0.000 0.000
Paratransit Service Contracts 0.000 0.000 0.000 0.000 0.000 0.000 0.000 0.000 0.000 0.000 0.000 0.000 0.000
Maintenance and Other Operating Contracts 6.388 6.439 11.453 7.122 8.556 15.618 10.904 12.061 20.679 13.816 16.006 47.035 176.077
Professional Service Contracts 2.979 2.690 3.399 2.883 2.979 3.303 2.979 2.979 3.303 2.979 2.883 7.532 40.885
Materials & Supplies 0.368 0.435 0.600 0.294 0.300 0.290 0.300 0.300 0.290 0.300 0.290 0.447 4.212
Other Business Expenses 3.239 2.440 2.818 2.711 2.801 2.714 2.801 2.801 2.711 2.801 2.711 4.250 34.795Total Non-Labor Expenses $14.961 $13.888 $20.299 $14.963 $16.599 $23.957 $18.897 $20.052 $28.847 $21.816 $23.755 $61.330 $279.363
Other Expenses Adjustments:
Other $0.000 $0.000 $0.000 $0.000 $0.000 $0.000 $0.000 $0.000 $0.000 $0.000 $0.000 $0.000 $0.000Total Other Expense Adjustments $0.000 $0.000 $0.000 $0.000 $0.000 $0.000 $0.000 $0.000 $0.000 $0.000 $0.000 $0.000 $0.000
Total Expenses before Non-Cash Liability Adjs. $40.686 $36.323 $46.016 $38.355 $40.682 $48.857 $43.341 $44.102 $53.784 $45.858 $47.333 $91.382 $576.719
Add: Depreciation $10.654 $10.654 $10.654 $10.654 $10.654 $10.654 $10.654 $10.654 $10.654 $10.654 $10.654 $10.654 $127.853
Add: OPEB Obligation 5.888 5.888 5.888 5.888 5.888 5.888 5.888 5.888 5.888 5.888 5.888 5.888 70.656
Add: GASB 68 Pension Adjustment 0.000 0.000 0.000 0.000 0.000 0.000 0.000 0.000 0.000 0.000 0.000 (8.740) (8.740)
Add: Environmental Remediation 0.000 0.000 0.000 0.000 0.000 0.000 0.000 0.000 0.000 0.000 0.000 0.000 0.000
Total Expenses $57.228 $52.866 $62.558 $54.897 $57.225 $65.399 $59.883 $60.645 $70.327 $62.400 $63.875 $99.185 $766.488
Less: Depreciation ($10.654) ($10.654) ($10.654) ($10.654) ($10.654) ($10.654) ($10.654) ($10.654) ($10.654) ($10.654) ($10.654) ($10.654) ($127.853)
Less: OPEB Obligation (5.888) (5.888) (5.888) (5.888) (5.888) (5.888) (5.888) (5.888) (5.888) (5.888) (5.888) (5.888) (70.656)
Less: GASB 68 Pension Adjustment 0.000 0.000 0.000 0.000 0.000 0.000 0.000 0.000 0.000 0.000 0.000 8.740 8.740
Total Expenses $40.686 $36.323 $46.016 $38.355 $40.682 $48.857 $43.341 $44.102 $53.784 $45.858 $47.333 $91.382 $576.719
Net Surplus/(Deficit) $98.554 $94.788 $116.455 $126.614 $135.721 $128.182 $134.288 $135.013 $115.811 $124.999 $117.240 $69.318 $1,396.982
MTA BRIDGES AND TUNNELSFebruary Financial Plan - 2017 Adopted BudgetAccrual Statement of Operations by Category
($ in millions)
VI-14
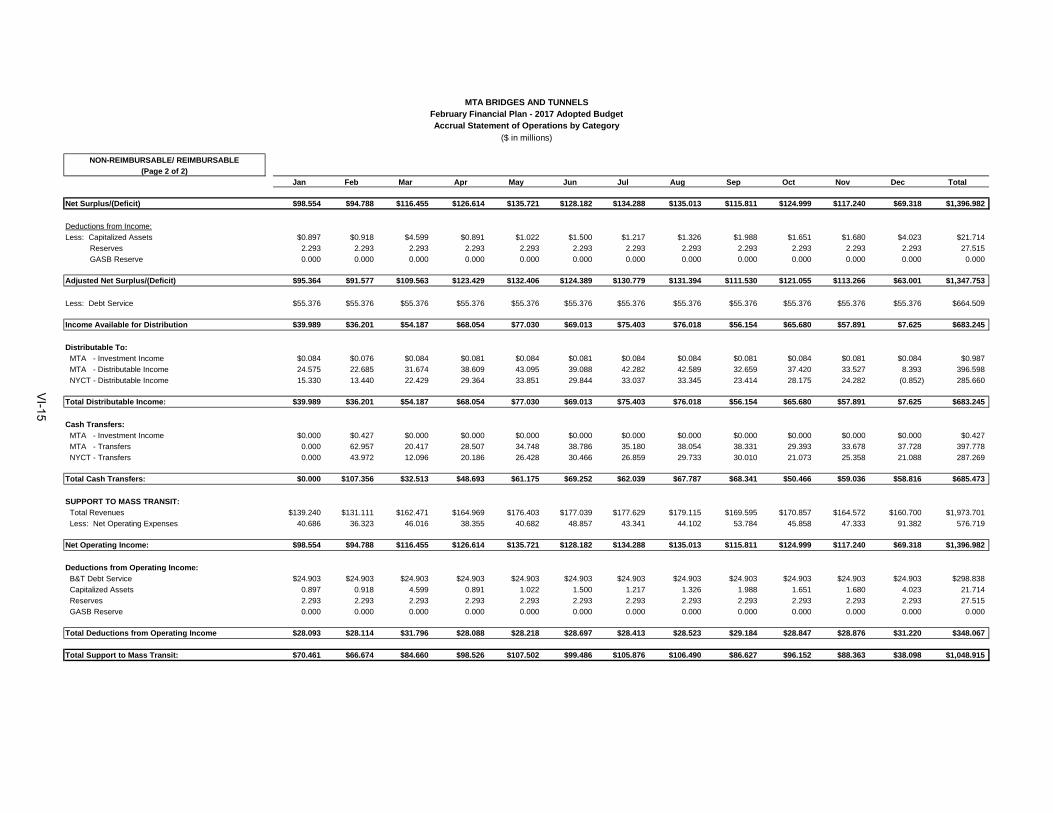
NON-REIMBURSABLE/ REIMBURSABLE
(Page 2 of 2)
Jan Feb Mar Apr May Jun Jul Aug Sep Oct Nov Dec Total
Net Surplus/(Deficit) $98.554 $94.788 $116.455 $126.614 $135.721 $128.182 $134.288 $135.013 $115.811 $124.999 $117.240 $69.318 $1,396.982
Deductions from Income:
Less: Capitalized Assets $0.897 $0.918 $4.599 $0.891 $1.022 $1.500 $1.217 $1.326 $1.988 $1.651 $1.680 $4.023 $21.714
Reserves 2.293 2.293 2.293 2.293 2.293 2.293 2.293 2.293 2.293 2.293 2.293 2.293 27.515
GASB Reserve 0.000 0.000 0.000 0.000 0.000 0.000 0.000 0.000 0.000 0.000 0.000 0.000 0.000
Adjusted Net Surplus/(Deficit) $95.364 $91.577 $109.563 $123.429 $132.406 $124.389 $130.779 $131.394 $111.530 $121.055 $113.266 $63.001 $1,347.753
Less: Debt Service $55.376 $55.376 $55.376 $55.376 $55.376 $55.376 $55.376 $55.376 $55.376 $55.376 $55.376 $55.376 $664.509
Income Available for Distribution $39.989 $36.201 $54.187 $68.054 $77.030 $69.013 $75.403 $76.018 $56.154 $65.680 $57.891 $7.625 $683.245
Distributable To:
MTA - Investment Income $0.084 $0.076 $0.084 $0.081 $0.084 $0.081 $0.084 $0.084 $0.081 $0.084 $0.081 $0.084 $0.987
MTA - Distributable Income 24.575 22.685 31.674 38.609 43.095 39.088 42.282 42.589 32.659 37.420 33.527 8.393 396.598
NYCT - Distributable Income 15.330 13.440 22.429 29.364 33.851 29.844 33.037 33.345 23.414 28.175 24.282 (0.852) 285.660
Total Distributable Income: $39.989 $36.201 $54.187 $68.054 $77.030 $69.013 $75.403 $76.018 $56.154 $65.680 $57.891 $7.625 $683.245
Cash Transfers:
MTA - Investment Income $0.000 $0.427 $0.000 $0.000 $0.000 $0.000 $0.000 $0.000 $0.000 $0.000 $0.000 $0.000 $0.427
MTA - Transfers 0.000 62.957 20.417 28.507 34.748 38.786 35.180 38.054 38.331 29.393 33.678 37.728 397.778
NYCT - Transfers 0.000 43.972 12.096 20.186 26.428 30.466 26.859 29.733 30.010 21.073 25.358 21.088 287.269
Total Cash Transfers: $0.000 $107.356 $32.513 $48.693 $61.175 $69.252 $62.039 $67.787 $68.341 $50.466 $59.036 $58.816 $685.473
SUPPORT TO MASS TRANSIT:
Total Revenues $139.240 $131.111 $162.471 $164.969 $176.403 $177.039 $177.629 $179.115 $169.595 $170.857 $164.572 $160.700 $1,973.701
Less: Net Operating Expenses 40.686 36.323 46.016 38.355 40.682 48.857 43.341 44.102 53.784 45.858 47.333 91.382 576.719
Net Operating Income: $98.554 $94.788 $116.455 $126.614 $135.721 $128.182 $134.288 $135.013 $115.811 $124.999 $117.240 $69.318 $1,396.982
Deductions from Operating Income:
B&T Debt Service $24.903 $24.903 $24.903 $24.903 $24.903 $24.903 $24.903 $24.903 $24.903 $24.903 $24.903 $24.903 $298.838
Capitalized Assets 0.897 0.918 4.599 0.891 1.022 1.500 1.217 1.326 1.988 1.651 1.680 4.023 21.714
Reserves 2.293 2.293 2.293 2.293 2.293 2.293 2.293 2.293 2.293 2.293 2.293 2.293 27.515
GASB Reserve 0.000 0.000 0.000 0.000 0.000 0.000 0.000 0.000 0.000 0.000 0.000 0.000 0.000
Total Deductions from Operating Income $28.093 $28.114 $31.796 $28.088 $28.218 $28.697 $28.413 $28.523 $29.184 $28.847 $28.876 $31.220 $348.067
Total Support to Mass Transit: $70.461 $66.674 $84.660 $98.526 $107.502 $99.486 $105.876 $106.490 $86.627 $96.152 $88.363 $38.098 $1,048.915
MTA BRIDGES AND TUNNELSFebruary Financial Plan - 2017 Adopted BudgetAccrual Statement of Operations by Category
($ in millions)
VI-15
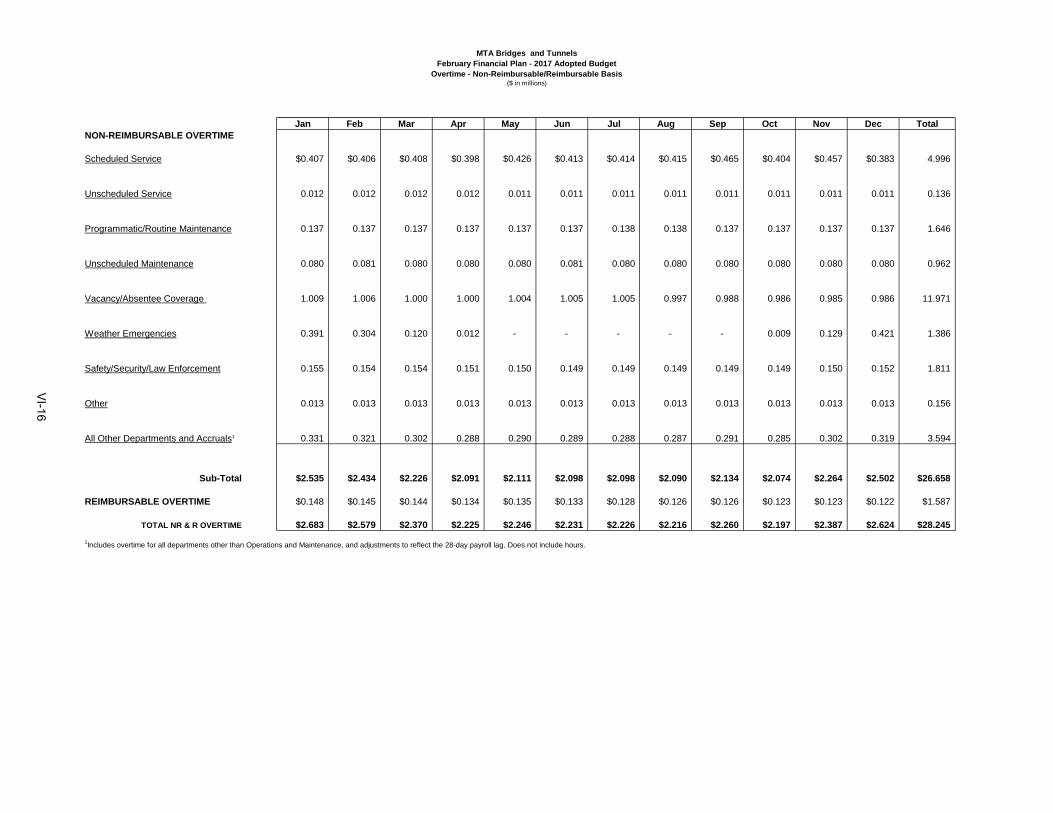
MTA Bridges and TunnelsFebruary Financial Plan - 2017 Adopted Budget
Overtime - Non-Reimbursable/Reimbursable Basis($ in millions)
Jan Feb Mar Apr May Jun Jul Aug Sep Oct Nov Dec TotalNON-REIMBURSABLE OVERTIME
Scheduled Service $0.407 $0.406 $0.408 $0.398 $0.426 $0.413 $0.414 $0.415 $0.465 $0.404 $0.457 $0.383 4.996
Unscheduled Service 0.012 0.012 0.012 0.012 0.011 0.011 0.011 0.011 0.011 0.011 0.011 0.011 0.136
Programmatic/Routine Maintenance 0.137 0.137 0.137 0.137 0.137 0.137 0.138 0.138 0.137 0.137 0.137 0.137 1.646
Unscheduled Maintenance 0.080 0.081 0.080 0.080 0.080 0.081 0.080 0.080 0.080 0.080 0.080 0.080 0.962
Vacancy/Absentee Coverage 1.009 1.006 1.000 1.000 1.004 1.005 1.005 0.997 0.988 0.986 0.985 0.986 11.971
Weather Emergencies 0.391 0.304 0.120 0.012 - - - - - 0.009 0.129 0.421 1.386
Safety/Security/Law Enforcement 0.155 0.154 0.154 0.151 0.150 0.149 0.149 0.149 0.149 0.149 0.150 0.152 1.811
Other 0.013 0.013 0.013 0.013 0.013 0.013 0.013 0.013 0.013 0.013 0.013 0.013 0.156
All Other Departments and Accruals1 0.331 0.321 0.302 0.288 0.290 0.289 0.288 0.287 0.291 0.285 0.302 0.319 3.594
Sub-Total $2.535 $2.434 $2.226 $2.091 $2.111 $2.098 $2.098 $2.090 $2.134 $2.074 $2.264 $2.502 $26.658
REIMBURSABLE OVERTIME $0.148 $0.145 $0.144 $0.134 $0.135 $0.133 $0.128 $0.126 $0.126 $0.123 $0.123 $0.122 $1.587
TOTAL NR & R OVERTIME $2.683 $2.579 $2.370 $2.225 $2.246 $2.231 $2.226 $2.216 $2.260 $2.197 $2.387 $2.624 $28.245
1Includes overtime for all departments other than Operations and Maintenance, and adjustments to reflect the 28-day payroll lag. Does not include hours.
VI-16
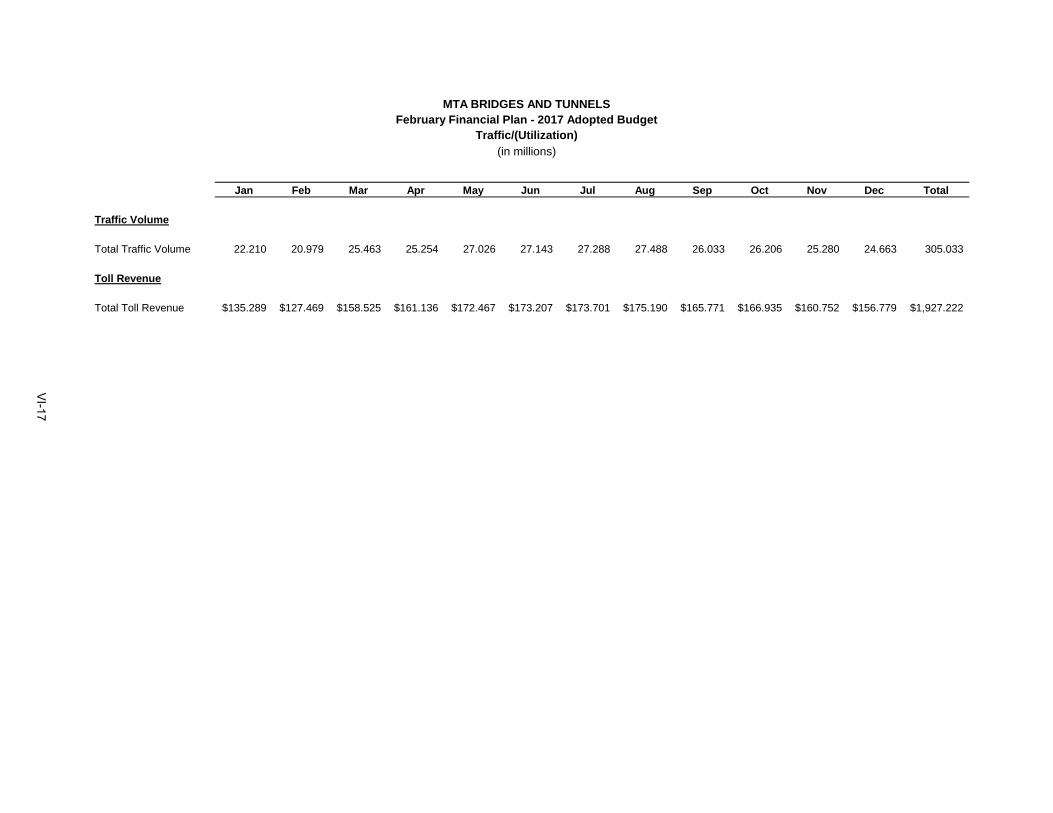
Jan Feb Mar Apr May Jun Jul Aug Sep Oct Nov Dec Total
Traffic Volume
Total Traffic Volume 22.210 20.979 25.463 25.254 27.026 27.143 27.288 27.488 26.033 26.206 25.280 24.663 305.033
Toll Revenue
Total Toll Revenue $135.289 $127.469 $158.525 $161.136 $172.467 $173.207 $173.701 $175.190 $165.771 $166.935 $160.752 $156.779 $1,927.222
MTA BRIDGES AND TUNNELSFebruary Financial Plan - 2017 Adopted Budget
Traffic/(Utilization)
(in millions)
VI-17
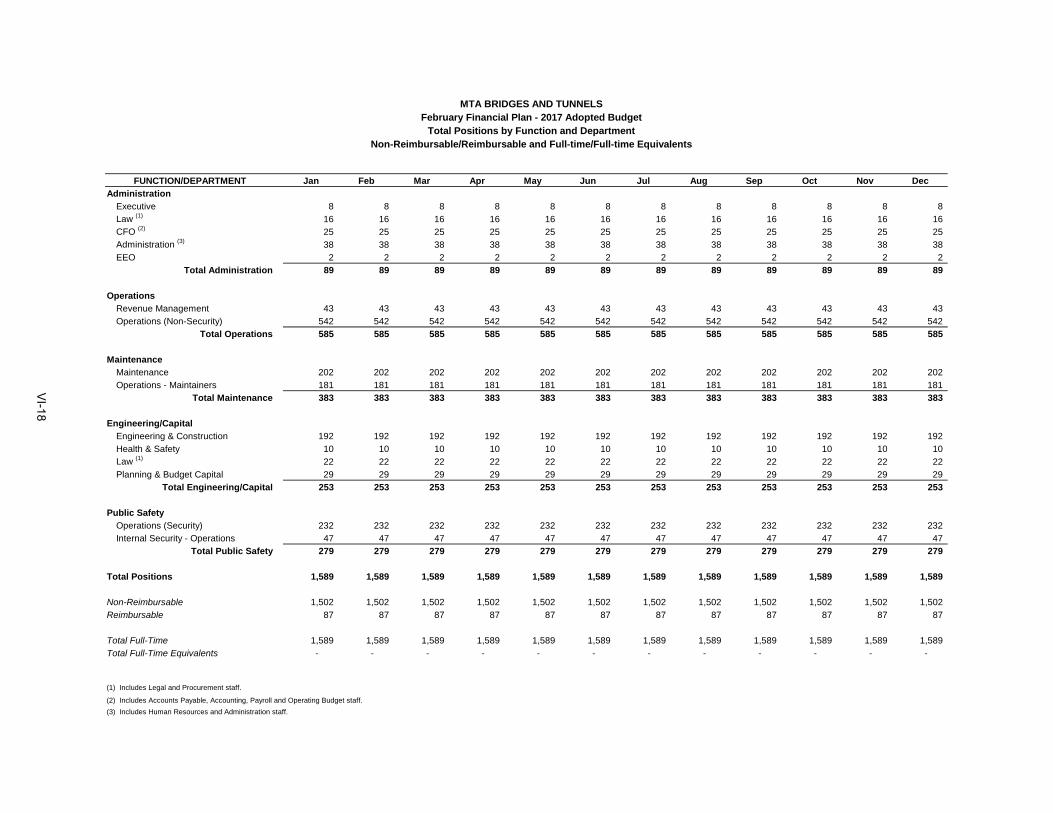
Jan Feb Mar Apr May Jun Jul Aug Sep Oct Nov Dec
Administration
Executive 8 8 8 8 8 8 8 8 8 8 8 8Law (1) 16 16 16 16 16 16 16 16 16 16 16 16CFO (2) 25 25 25 25 25 25 25 25 25 25 25 25Administration (3) 38 38 38 38 38 38 38 38 38 38 38 38
EEO 2 2 2 2 2 2 2 2 2 2 2 2
Total Administration 89 89 89 89 89 89 89 89 89 89 89 89
Operations
Revenue Management 43 43 43 43 43 43 43 43 43 43 43 43
Operations (Non-Security) 542 542 542 542 542 542 542 542 542 542 542 542
Total Operations 585 585 585 585 585 585 585 585 585 585 585 585
Maintenance
Maintenance 202 202 202 202 202 202 202 202 202 202 202 202
Operations - Maintainers 181 181 181 181 181 181 181 181 181 181 181 181
Total Maintenance 383 383 383 383 383 383 383 383 383 383 383 383
Engineering/Capital
Engineering & Construction 192 192 192 192 192 192 192 192 192 192 192 192
Health & Safety 10 10 10 10 10 10 10 10 10 10 10 10Law (1) 22 22 22 22 22 22 22 22 22 22 22 22
Planning & Budget Capital 29 29 29 29 29 29 29 29 29 29 29 29
Total Engineering/Capital 253 253 253 253 253 253 253 253 253 253 253 253
Public Safety
Operations (Security) 232 232 232 232 232 232 232 232 232 232 232 232
Internal Security - Operations 47 47 47 47 47 47 47 47 47 47 47 47
Total Public Safety 279 279 279 279 279 279 279 279 279 279 279 279
Total Positions 1,589 1,589 1,589 1,589 1,589 1,589 1,589 1,589 1,589 1,589 1,589 1,589
Non-Reimbursable 1,502 1,502 1,502 1,502 1,502 1,502 1,502 1,502 1,502 1,502 1,502 1,502
Reimbursable 87 87 87 87 87 87 87 87 87 87 87 87
Total Full-Time 1,589 1,589 1,589 1,589 1,589 1,589 1,589 1,589 1,589 1,589 1,589 1,589
Total Full-Time Equivalents - - - - - - - - - - - -
(1) Includes Legal and Procurement staff.
(2) Includes Accounts Payable, Accounting, Payroll and Operating Budget staff.
(3) Includes Human Resources and Administration staff.
MTA BRIDGES AND TUNNELSFebruary Financial Plan - 2017 Adopted Budget
Total Positions by Function and DepartmentNon-Reimbursable/Reimbursable and Full-time/Full-time Equivalents
FUNCTION/DEPARTMENT
VI-18

FUNCTION/OCCUPATION Jan Feb Mar Apr May Jun Jul Aug Sep Oct Nov Dec
Administration
Managers/Supervisors 31 31 31 31 31 31 31 31 31 31 31 31
Professional, Technical, Clerical 58 58 58 58 58 58 58 58 58 58 58 58
Operational Hourlies - - - - - - - - - - - -
Total Administration 89 89 89 89 89 89 89 89 89 89 89 89
Operations
Managers/Supervisors 216 216 216 216 216 216 216 216 216 216 216 216
Professional, Technical, Clerical 33 33 33 33 33 33 33 33 33 33 33 33
Operational Hourlies (1) 336 336 336 336 336 336 336 336 336 336 336 336
Total Operations 585 585 585 585 585 585 585 585 585 585 585 585
Maintenance
Managers/Supervisors 22 22 22 22 22 22 22 22 22 22 22 22
Professional, Technical, Clerical 18 18 18 18 18 18 18 18 18 18 18 18
Operational Hourlies (2) 343 343 343 343 343 343 343 343 343 343 343 343
Total Maintenance 383 383 383 383 383 383 383 383 383 383 383 383
Engineering/Capital
Managers/Supervisors 55 55 55 55 55 55 55 55 55 55 55 55
Professional, Technical, Clerical 198 198 198 198 198 198 198 198 198 198 198 198
Operational Hourlies - - - - - - - - - - - -
Total Engineering/Capital 253 253 253 253 253 253 253 253 253 253 253 253
Public Safety
Managers/Supervisors 48 48 48 48 48 48 48 48 48 48 48 48
Professional, Technical, Clerical 35 35 35 35 35 35 35 35 35 35 35 35
Operational Hourlies (3) 196 196 196 196 196 196 196 196 196 196 196 196
Total Public Safety 279 279 279 279 279 279 279 279 279 279 279 279
Total Positions
Managers/Supervisors 372 372 372 372 372 372 372 372 372 372 372 372
Professional, Technical, Clerical 342 342 342 342 342 342 342 342 342 342 342 342
Operational Hourlies 875 875 875 875 875 875 875 875 875 875 875 875
Total Positions 1,589 1,589 1,589 1,589 1,589 1,589 1,589 1,589 1,589 1,589 1,589 1,589
(1) Represents Bridge and Tunnel Officers. These positions are paid annually, not hourly.
(2) Represents maintenance personnel. These positions are paid annually, not hourly.
(3) Represents Bridge and Tunnel Officers performing public safety. These positions are paid annually, not hourly.
MTA BRIDGES AND TUNNELSFebruary Financial Plan - 2017 Adopted Budget
Total Positions by Function and Occupation
VI-19

[THIS PAGE INTENTIONALLY LEFT BLANK]
VI-20
Capital Construction Company
MTA CAPITAL CONSTRUCTION FEBRUARY FINANCIAL PLAN 2017-2020
2016 FINAL ESTIMATE AND 2017 ADOPTED BUDGET In accordance with MTA-approved budget procedures, the following information presents MTA Capital Construction’s 2016 Final Estimate, 2017 Adopted Budget and the Financial Plan for 2017-2020. There were no adjustments to the MTA CC Adopted Budget relating to MTA Adjustments that were presented in the December Plan and adopted by the Board in December 2016; however, there is one Agency adjustment included in this Plan cycle. Effective January 2017, non-core Agency procurement functions will be consolidated into a centralized organizational structure at MTA Headquarters (HQ). This consolidation is expected to yield contract savings and other efficiency savings. The February Plan reflects a shift of one authorized position in support of centralized operations from MTA Capital Construction to HQ. For the monthly reporting of expenses and the position, the Plan assumes an effective shift date of January 1, 2017. While the labor cost of the transferred position will be assumed by HQ, they are expected to be billed back and expensed within each Agencies’ Professional Services. The attached also includes schedules detailing the monthly allocation of financial and headcount data based on the 2017 Adopted Budget for the purpose of reporting actual results on a monthly basis to the Board.
VI-21
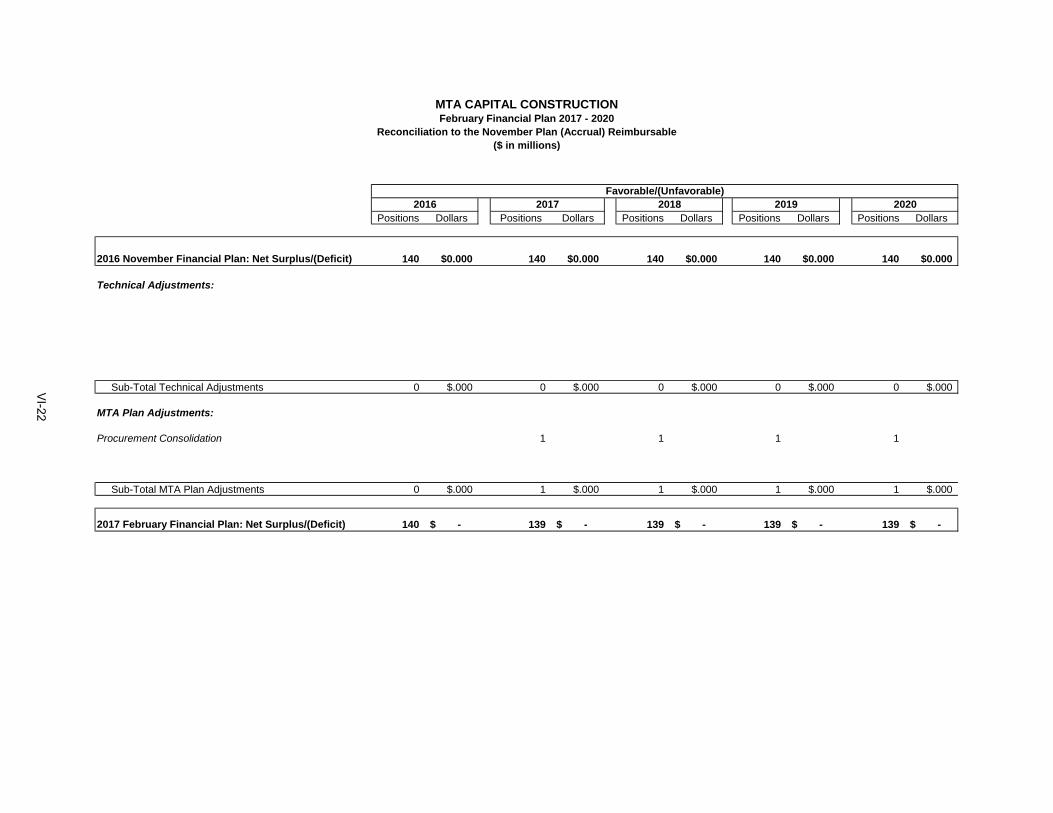
Positions Dollars Positions Dollars Positions Dollars Positions Dollars Positions Dollars
2016 November Financial Plan: Net Surplus/(Deficit) 140 $0.000 140 $0.000 140 $0.000 140 $0.000 140 $0.000
Technical Adjustments:
Sub-Total Technical Adjustments 0 $.000 0 $.000 0 $.000 0 $.000 0 $.000
MTA Plan Adjustments:
Procurement Consolidation 1 1 1 1
Sub-Total MTA Plan Adjustments 0 $.000 1 $.000 1 $.000 1 $.000 1 $.000
2017 February Financial Plan: Net Surplus/(Deficit) 140 -$ 139 -$ 139 -$ 139 -$ 139 -$
MTA CAPITAL CONSTRUCTIONFebruary Financial Plan 2017 - 2020
Reconciliation to the November Plan (Accrual) Reimbursable($ in millions)
Favorable/(Unfavorable)2016 2017 2018 2019 2020
VI-22

Positions Dollars Positions Dollars Positions Dollars Positions Dollars Positions Dollars
2016 November Financial Plan: Net Surplus/(Deficit) 140 $0.000 140 $0.000 140 $0.000 140 $0.000 140 $0.000
Technical Adjustments:
Sub-Total Technical Adjustments 0 $.000 0 $.000 0 $.000 0 $.000 0 $.000
MTA Plan Adjustments:
Procurement Consolidation 1 1 1 1
Sub-Total MTA Plan Adjustments 0 $.000 1 $.000 1 $.000 1 $.000 1 $.000
2017 February Financial Plan: Net Surplus/(Deficit) 140 -$ 139 -$ 139 -$ 139 -$ 139 -$
MTA CAPITAL CONSTRUCTIONFebruary Financial Plan 2017 - 2020
Reconciliation to the November Plan - (Cash)($ in millions)
Favorable/(Unfavorable)2016 2017 2018 2019 2020
VI-23

MTA CAPITAL CONSTRUCTIONFebruary Financial Plan 2017 - 2020
Accrual Statement of Operations By Category($ in millions)
Final Estimate
Adopted Budget
2016 2017 2018 2019 2020
Reimbursable
Operating RevenueFarebox Revenue $0.000 $0.000 $0.000 $0.000 $0.000 Other Operating Revenue 0.000 0.000 0.000 0.000 0.000 Capital and Other Reimbursements 35.688 37.392 37.577 38.496 37.076
Total Revenues $35.688 $37.392 $37.577 $38.496 $37.076
Operating ExpenseLabor:
Payroll $16.664 $18.644 $18.952 $19.267 $19.589 Overtime 0.021 0.000 0.000 0.000 0.000 Health and Welfare 2.260 2.694 2.750 2.865 2.985 OPEB Current Payments 0.000 0.000 0.000 0.000 0.000 Pension 2.341 2.885 2.973 3.128 3.256 Other Fringe Benefits 2.527 2.853 2.730 2.744 2.970 Reimbursable Overhead 0.000 0.000 0.000 0.000 0.000
Total Labor Expenses $23.812 $27.077 $27.405 $28.005 $28.801
Non-Labor:Electric Power $0.000 $0.000 $0.000 $0.000 $0.000 Fuel 0.002 0.002 0.002 0.002 0.002 Insurance 0.475 0.523 0.575 0.632 0.696 Claims 0.000 0.000 0.000 0.000 0.000 Paratransit Service Contracts 0.000 0.000 0.000 0.000 0.000 Maintenance and Other Operating Contracts 3.313 3.783 3.509 3.678 3.857 Professional Services Contracts 7.867 5.784 5.863 5.952 3.529 Materials and Supplies 0.000 0.000 0.000 0.000 0.000 Other Business Expenses 0.219 0.224 0.223 0.226 0.192
Total Non-Labor Expenses $11.876 $10.315 $10.172 $10.491 $8.275
Other Expense Adjustments:Other Expense Adjustments $0.000 $0.000 $0.000 $0.000 $0.000
Total Other Expense Adjustments $0.000 $0.000 $0.000 $0.000 $0.000
Total Expenses Before Depreciation $35.688 $37.392 $37.577 $38.496 $37.076
Net Surplus/(Deficit) $0.000 $0.000 $0.000 $0.000 $0.000
VI-24
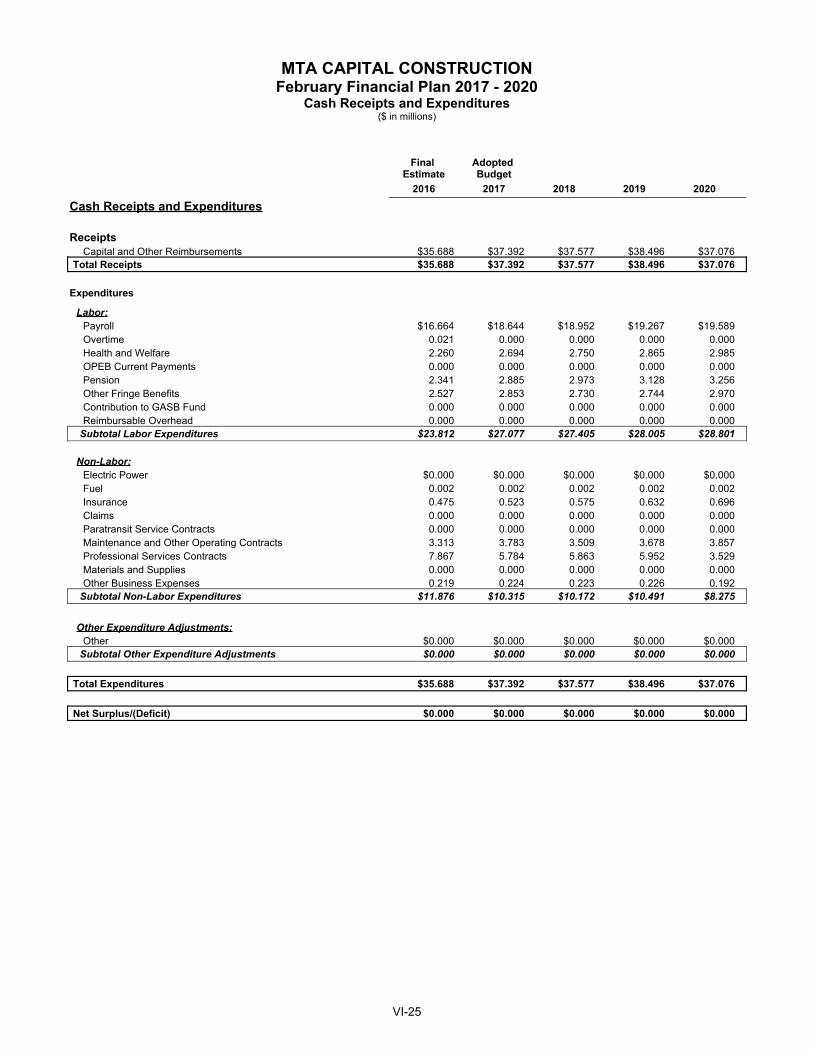
MTA CAPITAL CONSTRUCTIONFebruary Financial Plan 2017 - 2020
Cash Receipts and Expenditures($ in millions)
Final Estimate
Adopted Budget
2016 2017 2018 2019 2020
Cash Receipts and Expenditures
ReceiptsCapital and Other Reimbursements $35.688 $37.392 $37.577 $38.496 $37.076
Total Receipts $35.688 $37.392 $37.577 $38.496 $37.076
Expenditures
Labor:Payroll $16.664 $18.644 $18.952 $19.267 $19.589 Overtime 0.021 0.000 0.000 0.000 0.000 Health and Welfare 2.260 2.694 2.750 2.865 2.985 OPEB Current Payments 0.000 0.000 0.000 0.000 0.000 Pension 2.341 2.885 2.973 3.128 3.256 Other Fringe Benefits 2.527 2.853 2.730 2.744 2.970 Contribution to GASB Fund 0.000 0.000 0.000 0.000 0.000 Reimbursable Overhead 0.000 0.000 0.000 0.000 0.000
Subtotal Labor Expenditures $23.812 $27.077 $27.405 $28.005 $28.801
Non-Labor:Electric Power $0.000 $0.000 $0.000 $0.000 $0.000 Fuel 0.002 0.002 0.002 0.002 0.002 Insurance 0.475 0.523 0.575 0.632 0.696 Claims 0.000 0.000 0.000 0.000 0.000 Paratransit Service Contracts 0.000 0.000 0.000 0.000 0.000 Maintenance and Other Operating Contracts 3.313 3.783 3.509 3.678 3.857 Professional Services Contracts 7.867 5.784 5.863 5.952 3.529 Materials and Supplies 0.000 0.000 0.000 0.000 0.000 Other Business Expenses 0.219 0.224 0.223 0.226 0.192
Subtotal Non-Labor Expenditures $11.876 $10.315 $10.172 $10.491 $8.275
Other Expenditure Adjustments:Other $0.000 $0.000 $0.000 $0.000 $0.000
Subtotal Other Expenditure Adjustments $0.000 $0.000 $0.000 $0.000 $0.000
Total Expenditures $35.688 $37.392 $37.577 $38.496 $37.076
Net Surplus/(Deficit) $0.000 $0.000 $0.000 $0.000 $0.000
VI-25

MTA CAPITAL CONSTRUCTIONFebruary Financial Plan 2017 - 2020
Cash Conversion (Cash Flow Adjustments)Favorable/(Unfavorable)
($ in millions)
Final Estimate
Adopted Budget
2016 2017 2018 2019 2020Cash Flow Adjustments
ReceiptsCapital and Other Reimbursements $0.000 $0.000 $0.000 $0.000 $0.000
Total Receipts $0.000 $0.000 $0.000 $0.000 $0.000
ExpendituresLabor:
Payroll $0.000 $0.000 $0.000 $0.000 $0.000 Overtime 0.000 0.000 0.000 0.000 0.000 Health and Welfare 0.000 0.000 0.000 0.000 0.000 OPEB Current Payments 0.000 0.000 0.000 0.000 0.000 Pension 0.000 0.000 0.000 0.000 0.000 Other Fringe Benefits 0.000 0.000 0.000 0.000 0.000 Contribution to GASB Fund 0.000 0.000 0.000 0.000 0.000 Reimbursable Overhead 0.000 0.000 0.000 0.000 0.000
Subtotal Labor Expenditures $0.000 $0.000 $0.000 $0.000 $0.000
Non-Labor:Electric Power $0.000 0.000 $0.000 $0.000 $0.000 Fuel 0.000 0.000 0.000 0.000 0.000 Insurance 0.000 0.000 0.000 0.000 0.000 Claims 0.000 0.000 0.000 0.000 0.000 Paratransit Service Contracts 0.000 0.000 0.000 0.000 0.000 Maintenance and Other Operating Contracts 0.000 0.000 0.000 0.000 0.000 Professional Services Contracts 0.000 0.000 0.000 0.000 0.000 Materials and Supplies 0.000 0.000 0.000 0.000 0.000 Other Business Expenses 0.000 0.000 0.000 0.000 0.000
Subtotal Non-Labor Expenditures $0.000 $0.000 $0.000 $0.000 $0.000
Other Expenditure Adjustments:Other Expense Adjustments $0.000 $0.000 $0.000 $0.000 $0.000
Subtotal Other Expenditure Ajustments $0.000 $0.000 $0.000 $0.000 $0.000
Total Expenditures $0.000 $0.000 $0.000 $0.000 $0.000
Total Cash Conversion Adjustments before Depreciation $0.000 $0.000 $0.000 $0.000 $0.000
Depreciation $0.000 $0.000 $0.000 $0.000 $0.000 OPEB Liability Adjustment 0.000 0.000 0.000 0.000 0.000 GASB 68 Pension Expense Adjustment 0.000 0.000 0.000 0.000 0.000 Environmental Remediation 0.000 0.000 0.000 0.000 0.000
Total Cash Conversion Adjustments $0.000 $0.000 $0.000 $0.000 $0.000
VI-26

Final AdoptedEstimate Budget
2016 2017 2018 2019 2020
AdministrationMTACC 15 15 15 15 15
Engineering/CapitalMTACC 44 43 43 43 43 East Side Access 27 27 27 27 27 Security Program 8 8 8 8 8 Second Avenue Subway 20 20 26 26 26 Lower Manhattan Projects 14 14 12 12 12 7 Line Extension 10 10 - - - Penn Station Access 2 2 8 8 8
Total Engineering/Capital 125 124 124 124 124
Total Baseline Positions 140 139 139 139 139
Non-ReimbursableReimbursable 140 139 139 139 139
Total Full-Time 140 139 139 139 139 Total Full-Time Equivalents
140 139 139 139 139
MTA CAPITAL CONSTRUCTIONFebruary Financial Plan 2017 - 2020
Non-Reimbursable/Reimbursable and Full-Time Positions/Full-Time Equivalents
Function/Department
Total Positions by Function and Department
VI-27
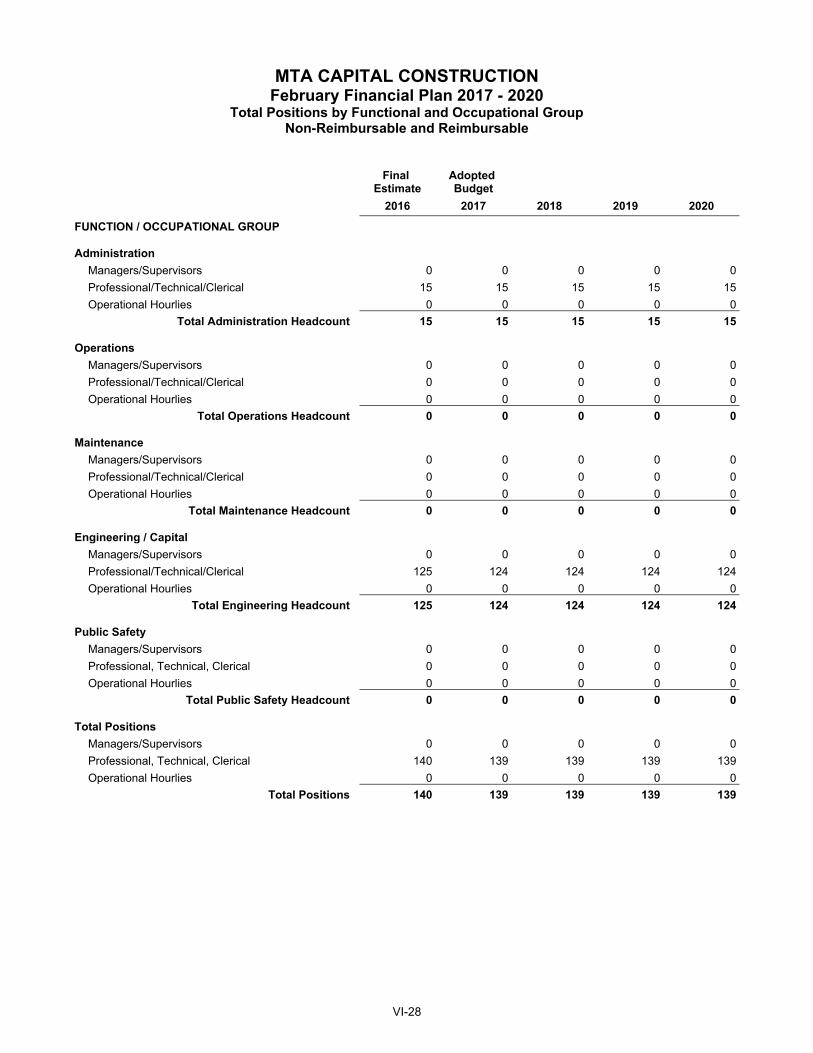
MTA CAPITAL CONSTRUCTIONFebruary Financial Plan 2017 - 2020
Total Positions by Functional and Occupational GroupNon-Reimbursable and Reimbursable
Final Estimate
Adopted Budget
2016 2017 2018 2019 2020
FUNCTION / OCCUPATIONAL GROUP
AdministrationManagers/Supervisors 0 0 0 0 0 Professional/Technical/Clerical 15 15 15 15 15 Operational Hourlies 0 0 0 0 0
Total Administration Headcount 15 15 15 15 15
OperationsManagers/Supervisors 0 0 0 0 0 Professional/Technical/Clerical 0 0 0 0 0 Operational Hourlies 0 0 0 0 0
Total Operations Headcount 0 0 0 0 0
MaintenanceManagers/Supervisors 0 0 0 0 0 Professional/Technical/Clerical 0 0 0 0 0 Operational Hourlies 0 0 0 0 0
Total Maintenance Headcount 0 0 0 0 0
Engineering / CapitalManagers/Supervisors 0 0 0 0 0 Professional/Technical/Clerical 125 124 124 124 124 Operational Hourlies 0 0 0 0 0
Total Engineering Headcount 125 124 124 124 124
Public SafetyManagers/Supervisors 0 0 0 0 0 Professional, Technical, Clerical 0 0 0 0 0 Operational Hourlies 0 0 0 0 0
Total Public Safety Headcount 0 0 0 0 0
Total PositionsManagers/Supervisors 0 0 0 0 0 Professional, Technical, Clerical 140 139 139 139 139 Operational Hourlies 0 0 0 0 0
Total Positions 140 139 139 139 139
VI-28
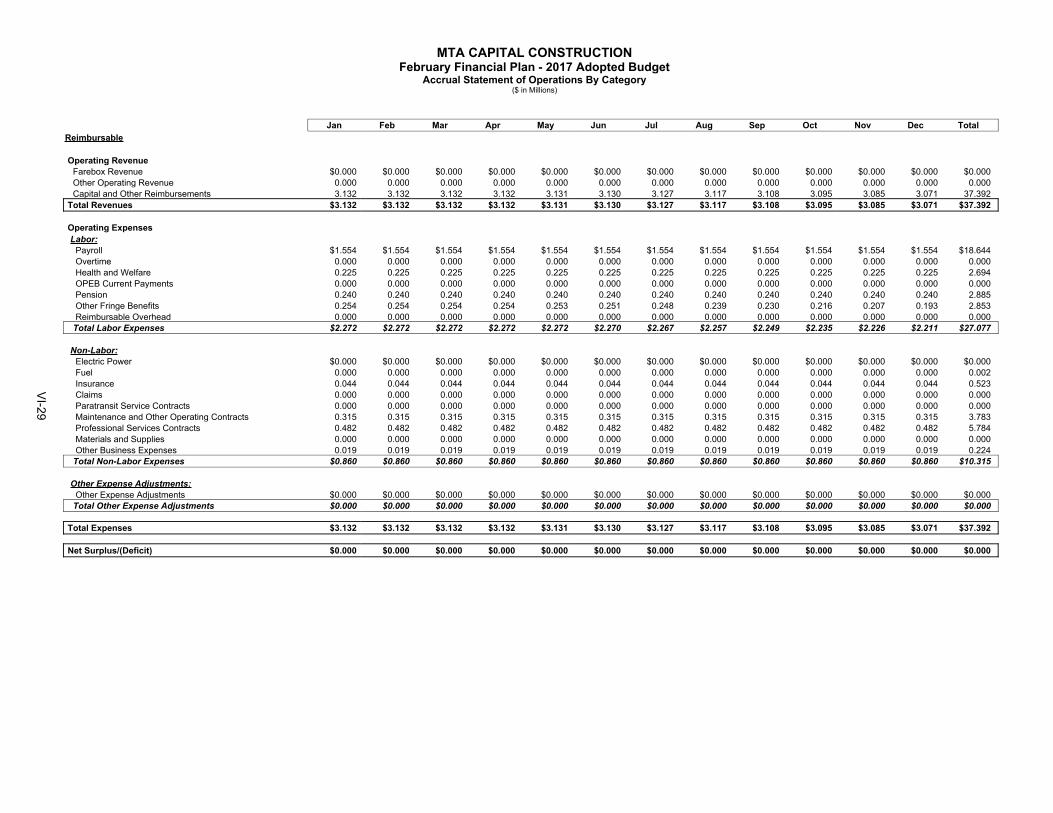
MTA CAPITAL CONSTRUCTIONFebruary Financial Plan - 2017 Adopted Budget
Accrual Statement of Operations By Category($ in Millions)
Jan Feb Mar Apr May Jun Jul Aug Sep Oct Nov Dec TotalReimbursable
Operating RevenueFarebox Revenue $0.000 $0.000 $0.000 $0.000 $0.000 $0.000 $0.000 $0.000 $0.000 $0.000 $0.000 $0.000 $0.000 Other Operating Revenue 0.000 0.000 0.000 0.000 0.000 0.000 0.000 0.000 0.000 0.000 0.000 0.000 0.000 Capital and Other Reimbursements 3.132 3.132 3.132 3.132 3.131 3.130 3.127 3.117 3.108 3.095 3.085 3.071 37.392
Total Revenues $3.132 $3.132 $3.132 $3.132 $3.131 $3.130 $3.127 $3.117 $3.108 $3.095 $3.085 $3.071 $37.392
Operating ExpensesLabor:
Payroll $1.554 $1.554 $1.554 $1.554 $1.554 $1.554 $1.554 $1.554 $1.554 $1.554 $1.554 $1.554 $18.644 Overtime 0.000 0.000 0.000 0.000 0.000 0.000 0.000 0.000 0.000 0.000 0.000 0.000 0.000 Health and Welfare 0.225 0.225 0.225 0.225 0.225 0.225 0.225 0.225 0.225 0.225 0.225 0.225 2.694 OPEB Current Payments 0.000 0.000 0.000 0.000 0.000 0.000 0.000 0.000 0.000 0.000 0.000 0.000 0.000 Pension 0.240 0.240 0.240 0.240 0.240 0.240 0.240 0.240 0.240 0.240 0.240 0.240 2.885 Other Fringe Benefits 0.254 0.254 0.254 0.254 0.253 0.251 0.248 0.239 0.230 0.216 0.207 0.193 2.853 Reimbursable Overhead 0.000 0.000 0.000 0.000 0.000 0.000 0.000 0.000 0.000 0.000 0.000 0.000 0.000
Total Labor Expenses $2.272 $2.272 $2.272 $2.272 $2.272 $2.270 $2.267 $2.257 $2.249 $2.235 $2.226 $2.211 $27.077
Non-Labor:Electric Power $0.000 $0.000 $0.000 $0.000 $0.000 $0.000 $0.000 $0.000 $0.000 $0.000 $0.000 $0.000 $0.000 Fuel 0.000 0.000 0.000 0.000 0.000 0.000 0.000 0.000 0.000 0.000 0.000 0.000 0.002 Insurance 0.044 0.044 0.044 0.044 0.044 0.044 0.044 0.044 0.044 0.044 0.044 0.044 0.523 Claims 0.000 0.000 0.000 0.000 0.000 0.000 0.000 0.000 0.000 0.000 0.000 0.000 0.000 Paratransit Service Contracts 0.000 0.000 0.000 0.000 0.000 0.000 0.000 0.000 0.000 0.000 0.000 0.000 0.000 Maintenance and Other Operating Contracts 0.315 0.315 0.315 0.315 0.315 0.315 0.315 0.315 0.315 0.315 0.315 0.315 3.783 Professional Services Contracts 0.482 0.482 0.482 0.482 0.482 0.482 0.482 0.482 0.482 0.482 0.482 0.482 5.784 Materials and Supplies 0.000 0.000 0.000 0.000 0.000 0.000 0.000 0.000 0.000 0.000 0.000 0.000 0.000 Other Business Expenses 0.019 0.019 0.019 0.019 0.019 0.019 0.019 0.019 0.019 0.019 0.019 0.019 0.224
Total Non-Labor Expenses $0.860 $0.860 $0.860 $0.860 $0.860 $0.860 $0.860 $0.860 $0.860 $0.860 $0.860 $0.860 $10.315
Other Expense Adjustments:Other Expense Adjustments $0.000 $0.000 $0.000 $0.000 $0.000 $0.000 $0.000 $0.000 $0.000 $0.000 $0.000 $0.000 $0.000
Total Other Expense Adjustments $0.000 $0.000 $0.000 $0.000 $0.000 $0.000 $0.000 $0.000 $0.000 $0.000 $0.000 $0.000 $0.000
Total Expenses $3.132 $3.132 $3.132 $3.132 $3.131 $3.130 $3.127 $3.117 $3.108 $3.095 $3.085 $3.071 $37.392
Net Surplus/(Deficit) $0.000 $0.000 $0.000 $0.000 $0.000 $0.000 $0.000 $0.000 $0.000 $0.000 $0.000 $0.000 $0.000
VI-29

MTA CAPITAL CONSTRUCTIONFebruary Financial Plan - 2017 Adopted Budget
Cash Receipts and Expenditures($ in millions)
Jan Feb Mar Apr May Jun Jul Aug Sep Oct Nov Dec TotalCash Receipts and Expenditures
ReceiptsFarebox Revenue $0.000 $0.000 $0.000 $0.000 $0.000 $0.000 $0.000 $0.000 $0.000 $0.000 $0.000 $0.000 $0.000 Other Operating Revenue 0.000 0.000 0.000 0.000 0.000 0.000 0.000 0.000 0.000 0.000 0.000 0.000 0.000 Capital and Other Reimbursements 3.132 3.132 3.132 3.132 3.131 3.130 3.127 3.117 3.108 3.095 3.085 3.071 37.392 Investment Income 0.000 0.000 0.000 0.000 0.000 0.000 0.000 0.000 0.000 0.000 0.000 0.000 0.000
Total Receipts $3.132 $3.132 $3.132 $3.132 $3.131 $3.130 $3.127 $3.117 $3.108 $3.095 $3.085 $3.071 $37.392
ExpendituresLabor:
Payroll $1.554 $1.554 $1.554 $1.554 $1.554 $1.554 $1.554 $1.554 $1.554 $1.554 $1.554 $1.554 $18.644 Overtime 0.000 0.000 0.000 0.000 0.000 0.000 0.000 0.000 0.000 0.000 0.000 0.000 0.000 Health and Welfare 0.225 0.225 0.225 0.225 0.225 0.225 0.225 0.225 0.225 0.225 0.225 0.225 2.694 OPEB Current Payments 0.000 0.000 0.000 0.000 0.000 0.000 0.000 0.000 0.000 0.000 0.000 0.000 0.000 Pension 0.240 0.240 0.240 0.240 0.240 0.240 0.240 0.240 0.240 0.240 0.240 0.240 2.885 Other Fringe Benefits 0.254 0.254 0.254 0.254 0.253 0.251 0.248 0.239 0.230 0.216 0.207 0.193 2.853 Contribution to GASB Fund 0.000 0.000 0.000 0.000 0.000 0.000 0.000 0.000 0.000 0.000 0.000 0.000 0.000 Reimbursable Overhead 0.000 0.000 0.000 0.000 0.000 0.000 0.000 0.000 0.000 0.000 0.000 0.000 0.000
Subtotal Labor Expenditures $2.272 $2.272 $2.272 $2.272 $2.272 $2.270 $2.267 $2.257 $2.249 $2.235 $2.226 $2.211 $27.077
Non-Labor:Electric Power $0.000 $0.000 $0.000 $0.000 $0.000 $0.000 $0.000 $0.000 $0.000 $0.000 $0.000 $0.000 $0.000 Fuel 0.000 0.000 0.000 0.000 0.000 0.000 0.000 0.000 0.000 0.000 0.000 0.000 0.002 Insurance 0.044 0.044 0.044 0.044 0.044 0.044 0.044 0.044 0.044 0.044 0.044 0.044 0.523 Claims 0.000 0.000 0.000 0.000 0.000 0.000 0.000 0.000 0.000 0.000 0.000 0.000 0.000 Paratransit Service Contracts 0.000 0.000 0.000 0.000 0.000 0.000 0.000 0.000 0.000 0.000 0.000 0.000 0.000 Maintenance and Other Operating Contracts 0.315 0.315 0.315 0.315 0.315 0.315 0.315 0.315 0.315 0.315 0.315 0.315 3.783 Professional Services Contracts 0.482 0.482 0.482 0.482 0.482 0.482 0.482 0.482 0.482 0.482 0.482 0.482 5.784 Materials and Supplies 0.000 0.000 0.000 0.000 0.000 0.000 0.000 0.000 0.000 0.000 0.000 0.000 0.000 Other Business Expenses 0.019 0.019 0.019 0.019 0.019 0.019 0.019 0.019 0.019 0.019 0.019 0.019 0.224
Subtotal Non-Labor Expenditures $0.860 $0.860 $0.860 $0.860 $0.860 $0.860 $0.860 $0.860 $0.860 $0.860 $0.860 $0.860 $10.315
Other Expenditure Adjustments:Other $0.000 $0.000 $0.000 $0.000 $0.000 $0.000 $0.000 $0.000 $0.000 $0.000 $0.000 $0.000 $0.000
Subtotal Other Expenditure Adjustments $0.000 $0.000 $0.000 $0.000 $0.000 $0.000 $0.000 $0.000 $0.000 $0.000 $0.000 $0.000 $0.000
Total Expenditures $3.132 $3.132 $3.132 $3.132 $3.131 $3.130 $3.127 $3.117 $3.108 $3.095 $3.085 $3.071 $37.392
Net Surplus/(Deficit) $0.000 $0.000 $0.000 $0.000 $0.000 $0.000 $0.000 $0.000 $0.000 $0.000 $0.000 $0.000 $0.000
VI-30

MTA CAPITAL CONSTRUCTIONFebruary Financial Plan - 2017 Adopted Budget
Cash Conversion (Cash Flow Adjustments)Favorable/(Unfavorable)
($ in millions)
Jan Feb Mar Apr May Jun Jul Aug Sep Oct Nov Dec TotalCash Flow Adjustments
ReceiptsFarebox Revenue $0.000 $0.000 $0.000 $0.000 $0.000 $0.000 $0.000 $0.000 $0.000 $0.000 $0.000 $0.000 $0.000 Other Operating Revenue 0.000 0.000 0.000 0.000 0.000 0.000 0.000 0.000 0.000 0.000 0.000 0.000 0.000 Capital and Other Reimbursements 0.000 0.000 0.000 0.000 0.000 0.000 0.000 0.000 0.000 0.000 0.000 0.000 0.000
Total Receipts $0.000 $0.000 $0.000 $0.000 $0.000 $0.000 $0.000 $0.000 $0.000 $0.000 $0.000 $0.000 $0.000
ExpendituresLabor:
Payroll $0.000 $0.000 $0.000 $0.000 $0.000 $0.000 $0.000 $0.000 $0.000 $0.000 $0.000 $0.000 $0.000 Overtime 0.000 0.000 0.000 0.000 0.000 0.000 0.000 0.000 0.000 0.000 0.000 0.000 0.000 Health and Welfare 0.000 0.000 0.000 0.000 0.000 0.000 0.000 0.000 0.000 0.000 0.000 0.000 0.000 OPEB Current Payments 0.000 0.000 0.000 0.000 0.000 0.000 0.000 0.000 0.000 0.000 0.000 0.000 0.000 Pension 0.000 0.000 0.000 0.000 0.000 0.000 0.000 0.000 0.000 0.000 0.000 0.000 0.000 Other Fringe Benefits 0.000 0.000 0.000 0.000 0.000 0.000 0.000 0.000 0.000 0.000 0.000 0.000 0.000 Contribution to GASB Fund 0.000 0.000 0.000 0.000 0.000 0.000 0.000 0.000 0.000 0.000 0.000 0.000 0.000 Reimbursable Overhead 0.000 0.000 0.000 0.000 0.000 0.000 0.000 0.000 0.000 0.000 0.000 0.000 0.000
Subtotal Labor Expenditures $0.000 $0.000 $0.000 $0.000 $0.000 $0.000 $0.000 $0.000 $0.000 $0.000 $0.000 $0.000 $0.000
Non-Labor:Electric Power $0.000 $0.000 $0.000 $0.000 $0.000 $0.000 $0.000 $0.000 $0.000 $0.000 $0.000 $0.000 $0.000 Fuel 0.000 0.000 0.000 0.000 0.000 0.000 0.000 0.000 0.000 0.000 0.000 0.000 0.000 Insurance 0.000 0.000 0.000 0.000 0.000 0.000 0.000 0.000 0.000 0.000 0.000 0.000 0.000 Claims 0.000 0.000 0.000 0.000 0.000 0.000 0.000 0.000 0.000 0.000 0.000 0.000 0.000 Paratransit Service Contracts 0.000 0.000 0.000 0.000 0.000 0.000 0.000 0.000 0.000 0.000 0.000 0.000 0.000 Maintenance and Other Operating Contracts 0.000 0.000 0.000 0.000 0.000 0.000 0.000 0.000 0.000 0.000 0.000 0.000 0.000 Professional Services Contracts 0.000 0.000 0.000 0.000 0.000 0.000 0.000 0.000 0.000 0.000 0.000 0.000 0.000 Materials and Supplies 0.000 0.000 0.000 0.000 0.000 0.000 0.000 0.000 0.000 0.000 0.000 0.000 0.000 Other Business Expenses 0.000 0.000 0.000 0.000 0.000 0.000 0.000 0.000 0.000 0.000 0.000 0.000 0.000
Subtotal Non-Labor Expenditures $0.000 $0.000 $0.000 $0.000 $0.000 $0.000 $0.000 $0.000 $0.000 $0.000 $0.000 $0.000 $0.000
Other Expenditure Adjustments:Other $0.000 $0.000 $0.000 $0.000 $0.000 $0.000 $0.000 $0.000 $0.000 $0.000 $0.000 $0.000 $0.000
Subtotal Other Expenditure Adjustments $0.000 $0.000 $0.000 $0.000 $0.000 $0.000 $0.000 $0.000 $0.000 $0.000 $0.000 $0.000 $0.000
Total Expenditures $0.000 $0.000 $0.000 $0.000 $0.000 $0.000 $0.000 $0.000 $0.000 $0.000 $0.000 $0.000 $0.000
Total Cash Conversion before Non-Cash Liability Adjs. $0.000 $0.000 $0.000 $0.000 $0.000 $0.000 $0.000 $0.000 $0.000 $0.000 $0.000 $0.000 $0.000
Depreciation $0.000 $0.000 $0.000 $0.000 $0.000 $0.000 $0.000 $0.000 $0.000 $0.000 $0.000 $0.000 $0.000 OPEB Liability Adjustment 0.000 0.000 0.000 0.000 0.000 0.000 0.000 0.000 0.000 0.000 0.000 0.000 0.000 GASB 68 Pension Expense Adjustment 0.000 0.000 0.000 0.000 0.000 0.000 0.000 0.000 0.000 0.000 0.000 0.000 0.000 Environmental Remediation 0.000 0.000 0.000 0.000 0.000 0.000 0.000 0.000 0.000 0.000 0.000 0.000 0.000
Total Cash Conversion Adjustments $0.000 $0.000 $0.000 $0.000 $0.000 $0.000 $0.000 $0.000 $0.000 $0.000 $0.000 $0.000 $0.000
VI-31
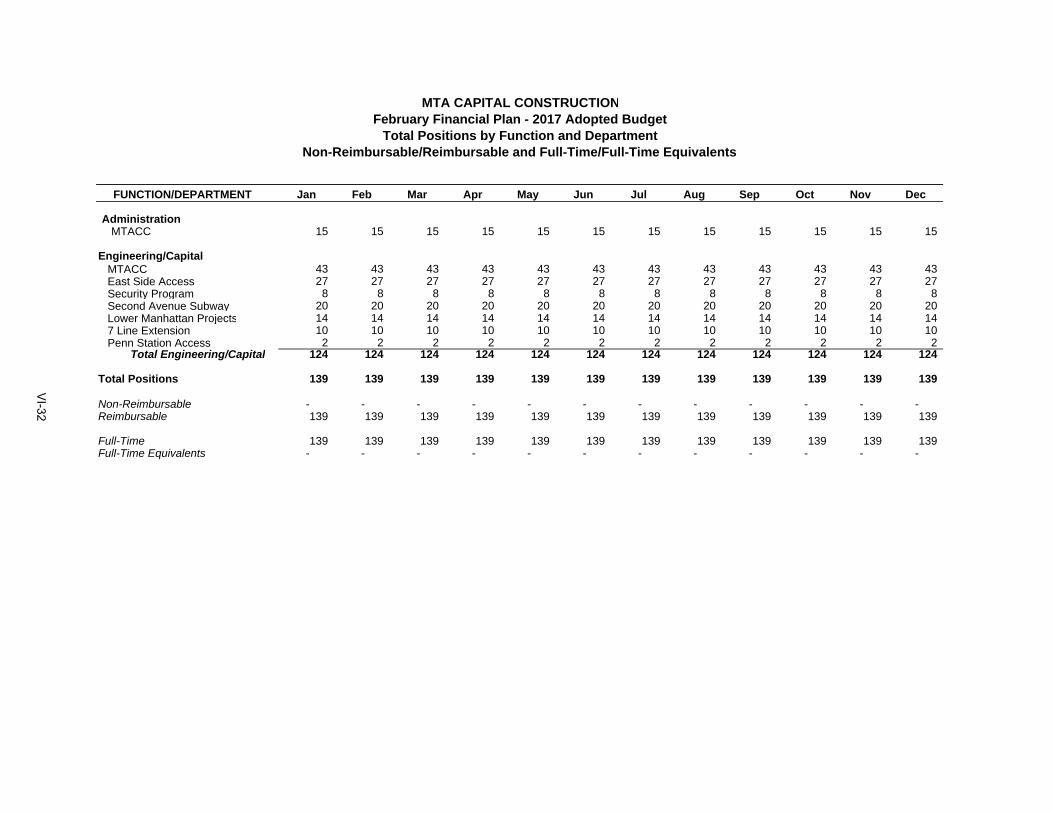
Jan Feb Mar Apr May Jun Jul Aug Sep Oct Nov Dec
AdministrationMTACC 15 15 15 15 15 15 15 15 15 15 15 15
Engineering/CapitalMTACC 43 43 43 43 43 43 43 43 43 43 43 43East Side Access 27 27 27 27 27 27 27 27 27 27 27 27Security Program 8 8 8 8 8 8 8 8 8 8 8 8Second Avenue Subway 20 20 20 20 20 20 20 20 20 20 20 20Lower Manhattan Projects 14 14 14 14 14 14 14 14 14 14 14 147 Line Extension 10 10 10 10 10 10 10 10 10 10 10 10Penn Station Access 2 2 2 2 2 2 2 2 2 2 2 2
Total Engineering/Capital 124 124 124 124 124 124 124 124 124 124 124 124
Total Positions 139 139 139 139 139 139 139 139 139 139 139 139
Non-Reimbursable - - - - - - - - - - - - Reimbursable 139 139 139 139 139 139 139 139 139 139 139 139
Full-Time 139 139 139 139 139 139 139 139 139 139 139 139Full-Time Equivalents - - - - - - - - - - - -
MTA CAPITAL CONSTRUCTIONFebruary Financial Plan - 2017 Adopted Budget
Total Positions by Function and DepartmentNon-Reimbursable/Reimbursable and Full-Time/Full-Time Equivalents
FUNCTION/DEPARTMENT
VI-32
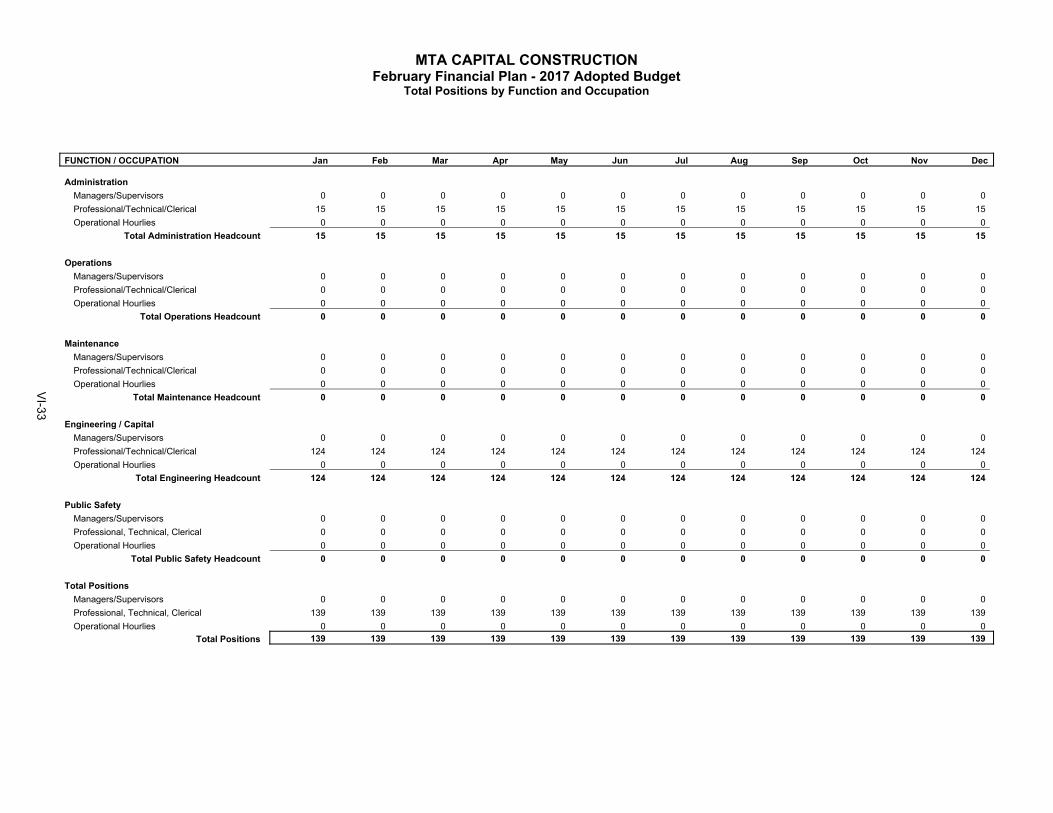
MTA CAPITAL CONSTRUCTIONFebruary Financial Plan - 2017 Adopted Budget
Total Positions by Function and Occupation
FUNCTION / OCCUPATION Jan Feb Mar Apr May Jun Jul Aug Sep Oct Nov Dec
AdministrationManagers/Supervisors 0 0 0 0 0 0 0 0 0 0 0 0 Professional/Technical/Clerical 15 15 15 15 15 15 15 15 15 15 15 15 Operational Hourlies 0 0 0 0 0 0 0 0 0 0 0 0
Total Administration Headcount 15 15 15 15 15 15 15 15 15 15 15 15
OperationsManagers/Supervisors 0 0 0 0 0 0 0 0 0 0 0 0 Professional/Technical/Clerical 0 0 0 0 0 0 0 0 0 0 0 0 Operational Hourlies 0 0 0 0 0 0 0 0 0 0 0 0
Total Operations Headcount 0 0 0 0 0 0 0 0 0 0 0 0
MaintenanceManagers/Supervisors 0 0 0 0 0 0 0 0 0 0 0 0 Professional/Technical/Clerical 0 0 0 0 0 0 0 0 0 0 0 0 Operational Hourlies 0 0 0 0 0 0 0 0 0 0 0 0
Total Maintenance Headcount 0 0 0 0 0 0 0 0 0 0 0 0
Engineering / CapitalManagers/Supervisors 0 0 0 0 0 0 0 0 0 0 0 0 Professional/Technical/Clerical 124 124 124 124 124 124 124 124 124 124 124 124 Operational Hourlies 0 0 0 0 0 0 0 0 0 0 0 0
Total Engineering Headcount 124 124 124 124 124 124 124 124 124 124 124 124
Public SafetyManagers/Supervisors 0 0 0 0 0 0 0 0 0 0 0 0 Professional, Technical, Clerical 0 0 0 0 0 0 0 0 0 0 0 0 Operational Hourlies 0 0 0 0 0 0 0 0 0 0 0 0
Total Public Safety Headcount 0 0 0 0 0 0 0 0 0 0 0 0
Total PositionsManagers/Supervisors 0 0 0 0 0 0 0 0 0 0 0 0 Professional, Technical, Clerical 139 139 139 139 139 139 139 139 139 139 139 139 Operational Hourlies 0 0 0 0 0 0 0 0 0 0 0 0
Total Positions 139 139 139 139 139 139 139 139 139 139 139 139
VI-33

[THIS PAGE INTENTIONALLY LEFT BLANK]
VI-34

Long Island Rail Road
MTA LONG ISLAND RAIL ROAD FEBRUARY FINANCIAL PLAN 2017-2020
2016 FINAL ESTIMATE AND 2017 ADOPTED BUDGET
In accordance with MTA-approved budget procedures, the following information presents MTA Long Island Rail Road’s 2016 Final Estimate, 2017 Adopted Budget and the Financial Plan for 2017-2020. The Adopted Budget reflects the inclusion of MTA Adjustments that were presented in the December Plan, which were adopted by the Board in December 2016, as well as other technical adjustments. These adjustments are presented on the included reconciliations from the November Financial Plan and are described below: Overhead rates have been revised based on updated expense information and adjusted for
the MTA IT consolidation.
Railroad Retirement Taxes maximum earning tier levels have been adjusted based on direction provided by the Railroad Retirement Board. This results in approximately $3.0 million in additional fringe benefit costs per year.
Railroad Unemployment Insurance rates have been adjusted based on direction provided by
the Railroad Retirement Board. This results in approximately $0.4 million in additional fringe benefit costs per year.
An average 4% fare increase was approved at the January 2017 MTA Board meeting and will go into effect on March 19, 2017 which results in additional farebox revenue of $20.8 million in 2017 and approximately $26.4 million per year 2017-2020.
Effective January 2017, non-core Agency procurement functions will be consolidated into a
centralized organizational structure at MTA Headquarters (HQ). This consolidation is expected to yield contract savings and other efficiency savings. The Plan has captured some preliminary contract savings. The February Plan reflects a shift of 19 authorized positions in support of centralized operations from MTA LIRR to HQ. For the monthly reporting of expenses and positions, the Plan assumes an effective shift date of January 1, 2017. While the labor cost of these employees will be assumed by HQ, they are expected to be billed back and expensed within each Agencies’ Professional Services.
The impact from a New York State Public Service Commission ruling on Con Edison rates for the delivery of New York Power Authority supplied power to NYPA governmental customers resulting in a savings of $0.8 million in 2017 increasing to $1.6 million in 2018 and $2.7 million each year thereafter.
A revision in fuel price forecasts subsequent to the provision of November Plan instructions resulting in a savings of $0.1 million in 2016 and an increase in expenses of $0.3 million in 2017 with increases ranging between $0.1 million and $0.2 million during the period 2018 – 2020.
The attached also includes schedules detailing the monthly allocation of financial, overtime, headcount and utilization data based on the 2017 Adopted Budget for the purpose of reporting actual results on a monthly basis to the Board.
VI-35
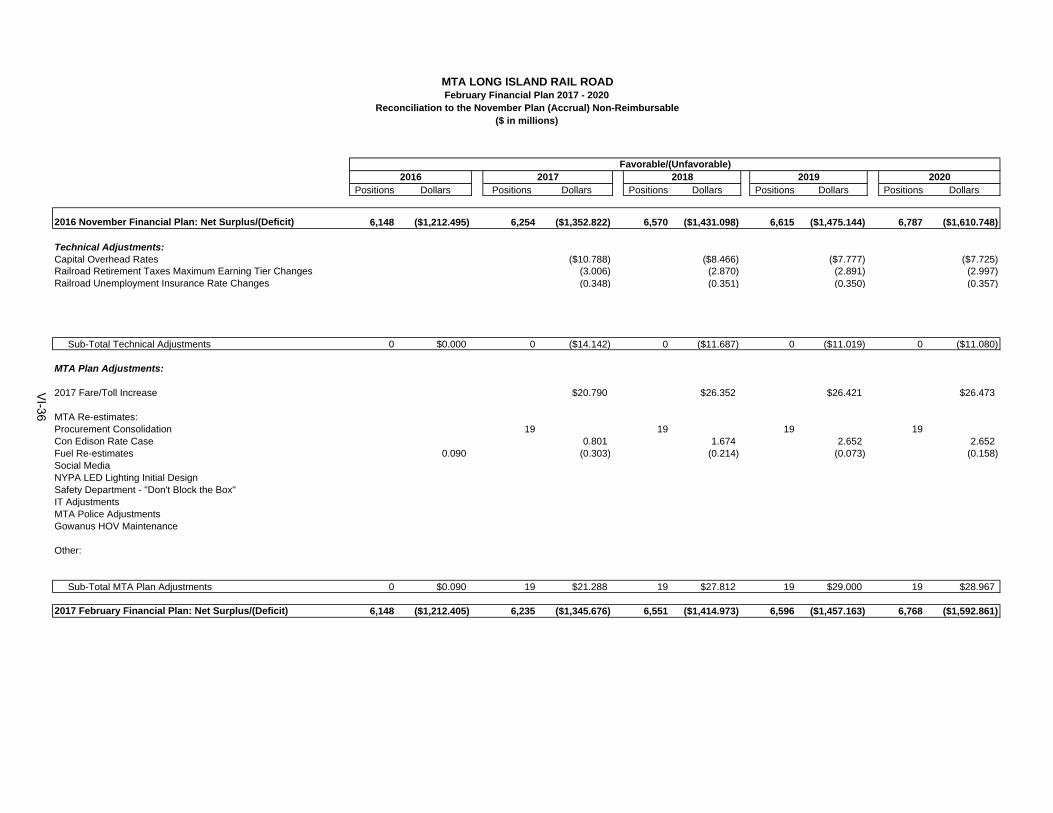
Positions Dollars Positions Dollars Positions Dollars Positions Dollars Positions Dollars
2016 November Financial Plan: Net Surplus/(Deficit) 6,148 ($1,212.495) 6,254 ($1,352.822) 6,570 ($1,431.098) 6,615 ($1,475.144) 6,787 ($1,610.748)
Technical Adjustments:Capital Overhead Rates ($10.788) ($8.466) ($7.777) ($7.725)Railroad Retirement Taxes Maximum Earning Tier Changes (3.006) (2.870) (2.891) (2.997) Railroad Unemployment Insurance Rate Changes (0.348) (0.351) (0.350) (0.357)
Sub-Total Technical Adjustments 0 $0.000 0 ($14.142) 0 ($11.687) 0 ($11.019) 0 ($11.080)
MTA Plan Adjustments:
2017 Fare/Toll Increase $20.790 $26.352 $26.421 $26.473
MTA Re-estimates:Procurement Consolidation 19 19 19 19 Con Edison Rate Case 0.801 1.674 2.652 2.652 Fuel Re-estimates 0.090 (0.303) (0.214) (0.073) (0.158) Social MediaNYPA LED Lighting Initial DesignSafety Department - "Don't Block the Box"IT AdjustmentsMTA Police AdjustmentsGowanus HOV Maintenance
Other:
Sub-Total MTA Plan Adjustments 0 $0.090 19 $21.288 19 $27.812 19 $29.000 19 $28.967
2017 February Financial Plan: Net Surplus/(Deficit) 6,148 ($1,212.405) 6,235 ($1,345.676) 6,551 ($1,414.973) 6,596 ($1,457.163) 6,768 ($1,592.861)
MTA LONG ISLAND RAIL ROAD
2020
February Financial Plan 2017 - 2020Reconciliation to the November Plan (Accrual) Non-Reimbursable
($ in millions)
Favorable/(Unfavorable)2016 2017 2018 2019
VI-36

Positions Dollars Positions Dollars Positions Dollars Positions Dollars Positions Dollars
2016 November Financial Plan: Net Surplus/(Deficit) 1,118 $0.000 1,215 $0.000 935 $0.000 889 $0.000 865 $0.000
Technical Adjustments:Capital Overhead Rates $10.788 $8.466 $7.777 $7.725
Sub-Total Technical Adjustments 0 $0.000 0 $10.788 0 $8.466 0 $7.777 0 $7.725
MTA Plan Adjustments:
2017 Fare/Toll Increase
MTA Re-estimates:Procurement ConsolidationCon Edison Rate CaseFuel Re-estimatesSocial MediaNYPA LED Lighting Initial DesignSafety Department - "Don't Block the Box"IT AdjustmentsMTA Police AdjustmentsGowanus HOV Maintenance
Other:
Sub-Total MTA Plan Adjustments 0 $0.000 0 $0.000 0 $0.000 0 $0.000 0 $0.000
Revenue Offset $0.000 ($10.788) ($8.466) ($7.777) ($7.725)
2017 February Financial Plan: Net Surplus/(Deficit) 1,118 $0.000 1,215 $10.788 935 $8.466 889 $7.777 865 $7.725
MTA LONG ISLAND RAIL ROADFebruary Financial Plan 2017 - 2020
Reconciliation to the November Plan (Accrual) Reimbursable($ in millions)
Favorable/(Unfavorable)2016 2017 2018 2019 2020
VI-37

Positions Dollars Positions Dollars Positions Dollars Positions Dollars Positions Dollars
2016 November Financial Plan: Net Surplus/(Deficit) 7,266 ($616.349) 7,469 ($759.780) 7,505 ($837.341) 7,504 ($874.260) 7,652 ($1,018.531)
Technical Adjustments:Capital Overhead Rates ($10.788) ($8.466) ($7.777) ($7.725)Railroad Retirement Taxes Maximum Earning Tier Changes (3.006) (2.870) (2.891) (2.997)Railroad Unemployment Insurance Rate Changes (0.348) (0.351) (0.350) (0.357)
Sub-Total Technical Adjustments 0 $0.000 0 ($14.142) 0 ($11.687) 0 ($11.019) 0 ($11.080)
MTA Plan Adjustments:
2017 Fare/Toll Increase $20.790 $26.352 $26.421 $26.473
MTA Re-estimates:Procurement Consolidation 19 19 19 19 Con Edison Rate Case 0.801 1.674 2.652 2.652 Fuel Re-estimates 0.090 (0.303) (0.214) (0.073) (0.158) Social MediaNYPA LED Lighting Initial DesignSafety Department - "Don't Block the Box"IT AdjustmentsMTA Police AdjustmentsGowanus HOV Maintenance
Other:
Sub-Total MTA Plan Adjustments 0 $0.090 19 $21.288 19 $27.812 19 $29.000 19 $28.967
2017 February Financial Plan: Net Surplus/(Deficit) 7,266 ($616.259) 7,450 ($752.634) 7,486 ($821.216) 7,485 ($856.279) 7,633 ($1,000.644)
MTA LONG ISLAND RAIL ROADFebruary Financial Plan 2017 - 2020
Reconciliation to the November Plan - (Cash)($ in millions)
Favorable/(Unfavorable)2016 2017 2018 2019 2020
VI-38
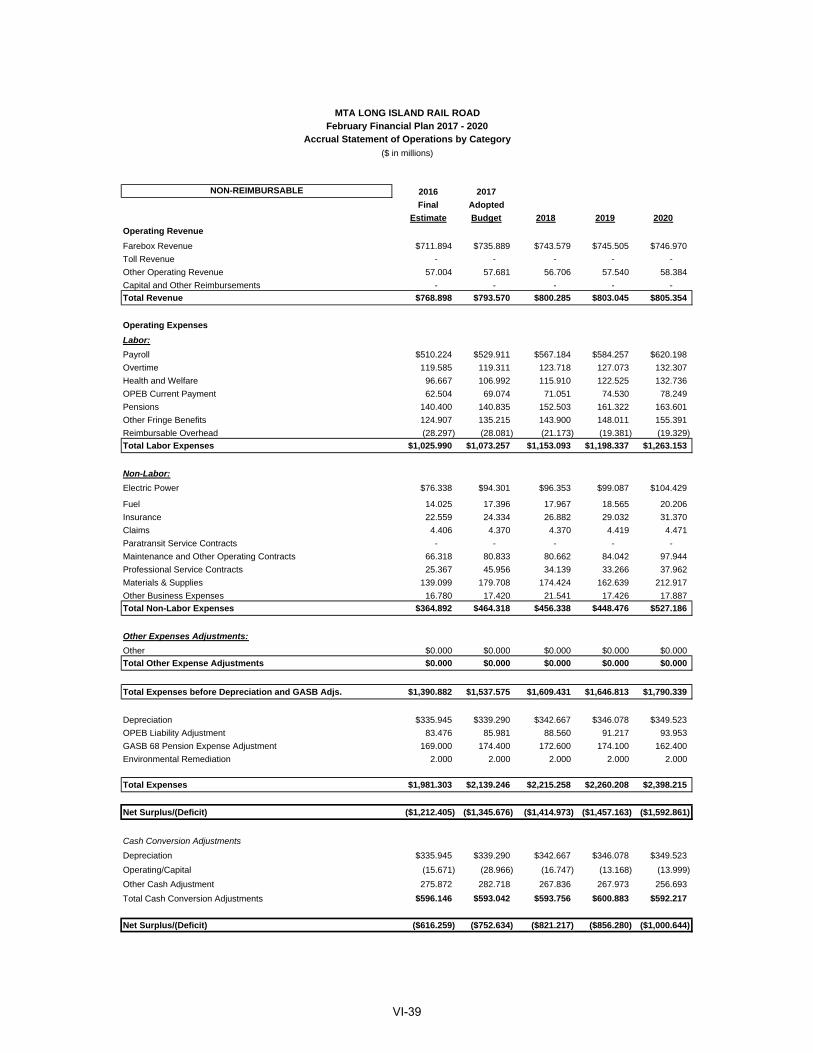
NON-REIMBURSABLE 2016 2017
Final Adopted
Estimate Budget 2018 2019 2020
Operating Revenue
Farebox Revenue $711.894 $735.889 $743.579 $745.505 $746.970
Toll Revenue - - - - -
Other Operating Revenue 57.004 57.681 56.706 57.540 58.384
Capital and Other Reimbursements - - - - -
Total Revenue $768.898 $793.570 $800.285 $803.045 $805.354
Operating Expenses
Labor:
Payroll $510.224 $529.911 $567.184 $584.257 $620.198
Overtime 119.585 119.311 123.718 127.073 132.307
Health and Welfare 96.667 106.992 115.910 122.525 132.736
OPEB Current Payment 62.504 69.074 71.051 74.530 78.249
Pensions 140.400 140.835 152.503 161.322 163.601
Other Fringe Benefits 124.907 135.215 143.900 148.011 155.391
Reimbursable Overhead (28.297) (28.081) (21.173) (19.381) (19.329)
Total Labor Expenses $1,025.990 $1,073.257 $1,153.093 $1,198.337 $1,263.153
Non-Labor:
Electric Power $76.338 $94.301 $96.353 $99.087 $104.429
Fuel 14.025 17.396 17.967 18.565 20.206
Insurance 22.559 24.334 26.882 29.032 31.370
Claims 4.406 4.370 4.370 4.419 4.471
Paratransit Service Contracts - - - - -
Maintenance and Other Operating Contracts 66.318 80.833 80.662 84.042 97.944
Professional Service Contracts 25.367 45.956 34.139 33.266 37.962
Materials & Supplies 139.099 179.708 174.424 162.639 212.917
Other Business Expenses 16.780 17.420 21.541 17.426 17.887
Total Non-Labor Expenses $364.892 $464.318 $456.338 $448.476 $527.186
Other Expenses Adjustments:
Other $0.000 $0.000 $0.000 $0.000 $0.000
Total Other Expense Adjustments $0.000 $0.000 $0.000 $0.000 $0.000
Total Expenses before Depreciation and GASB Adjs. $1,390.882 $1,537.575 $1,609.431 $1,646.813 $1,790.339
Depreciation $335.945 $339.290 $342.667 $346.078 $349.523
OPEB Liability Adjustment 83.476 85.981 88.560 91.217 93.953
GASB 68 Pension Expense Adjustment 169.000 174.400 172.600 174.100 162.400
Environmental Remediation 2.000 2.000 2.000 2.000 2.000
Total Expenses $1,981.303 $2,139.246 $2,215.258 $2,260.208 $2,398.215
Net Surplus/(Deficit) ($1,212.405) ($1,345.676) ($1,414.973) ($1,457.163) ($1,592.861)
Cash Conversion Adjustments
Depreciation $335.945 $339.290 $342.667 $346.078 $349.523
Operating/Capital (15.671) (28.966) (16.747) (13.168) (13.999)
Other Cash Adjustment 275.872 282.718 267.836 267.973 256.693
Total Cash Conversion Adjustments $596.146 $593.042 $593.756 $600.883 $592.217
Net Surplus/(Deficit) ($616.259) ($752.634) ($821.217) ($856.280) ($1,000.644)
MTA LONG ISLAND RAIL ROADFebruary Financial Plan 2017 - 2020
Accrual Statement of Operations by Category
($ in millions)
VI-39

MTA LONG ISLAND RAIL ROADFebruary Financial Plan 2017 - 2020
Accrual Statement of Operations By Category($ in millions)
Final Estimate
Adopted Budget
2016 2017 2018 2019 2020
Reimbursable
Operating RevenueFarebox Revenue $0.000 $0.000 $0.000 $0.000 $0.000 Other Operating Revenue 0.000 0.000 0.000 0.000 0.000 Capital and Other Reimbursements 333.374 368.593 311.065 295.863 297.033
Total Revenues $333.374 $368.593 $311.065 $295.863 $297.033
Operating ExpenseLabor:
Payroll $104.637 $128.992 $114.880 $110.156 $109.633 Overtime 34.178 30.372 20.811 19.728 20.122 Health and Welfare 23.318 26.892 23.250 22.069 21.996 OPEB Current Payments 0.000 0.000 0.000 0.000 0.000 Pension 40.500 43.692 37.776 35.856 35.739 Other Fringe Benefits 24.138 27.499 23.776 22.567 22.493 Reimbursable Overhead 28.297 28.081 21.173 19.381 19.329
Total Labor Expenses $255.069 $285.528 $241.666 $229.757 $229.313
Non-Labor:Electric Power $0.965 $0.125 $0.000 $0.000 $0.000 Fuel 0.000 0.000 0.000 0.000 0.000 Insurance 7.401 8.998 7.702 7.454 7.582 Claims 0.000 0.000 0.000 0.000 0.000 Paratransit Service Contracts 0.000 0.000 0.000 0.000 0.000 Maintenance and Other Operating Contracts 24.392 15.144 12.375 12.336 12.351 Professional Services Contracts 1.397 0.711 0.652 0.656 0.669 Materials and Supplies 43.339 57.714 48.348 45.354 46.812 Other Business Expenses 0.812 0.373 0.322 0.306 0.305
Total Non-Labor Expenses $78.305 $83.065 $69.400 $66.106 $67.720
Other Expense Adjustments:Other Expense Adjustments $0.000 $0.000 $0.000 $0.000 $0.000
Total Other Expense Adjustments $0.000 $0.000 $0.000 $0.000 $0.000
Total Expenses Before Depreciation $333.374 $368.593 $311.065 $295.863 $297.033
Baseline Surplus/(Deficit) $0.000 $0.000 $0.000 $0.000 $0.000
VI-40

NON-REIMBURSABLE / REIMBURSABLE2016 2017Final Adopted
Estimate Budget 2018 2019 2020
Revenue
Farebox Revenue $711.894 $735.889 $743.579 $745.505 $746.970
Toll Revenue - - - - -
Other Operating Revenue 57.004 57.681 56.706 57.540 58.384
Capital and Other Reimbursements 333.374 368.593 311.065 295.863 297.031
Total Revenue $1,102.272 $1,162.163 $1,111.350 $1,098.908 $1,102.385
Expenses
Labor:
Payroll $614.861 $658.903 $682.064 $694.413 $729.831
Overtime 153.763 149.683 144.529 146.801 152.429
Health and Welfare 119.985 133.884 139.160 144.594 154.732
OPEB Current Payment 62.504 69.074 71.051 74.530 78.249
Pensions 180.900 184.527 190.279 197.178 199.340
Other Fringe Benefits 149.045 162.714 167.676 170.578 177.884
Reimbursable Overhead - - - - -
Total Labor Expenses $1,281.058 $1,358.785 $1,394.759 $1,428.094 $1,492.465
Non-Labor:
Electric Power $77.303 $94.426 $96.353 $99.087 $104.429
Fuel 14.025 17.396 17.967 18.565 20.206
Insurance 29.960 33.332 34.584 36.486 38.952
Claims 4.406 4.370 4.370 4.419 4.471
Paratransit Service Contracts - - - - -
Maintenance and Other Operating Contracts 90.710 95.977 93.037 96.378 110.295
Professional Service Contracts 26.764 46.667 34.791 33.922 38.631
Materials & Supplies 182.438 237.422 222.772 207.993 259.729
Other Business Expenses 17.592 17.793 21.863 17.732 18.192
Total Non-Labor Expenses $443.198 $547.383 $525.737 $514.582 $594.905
Other Expenses Adjustments:
Other $0.000 $0.000 $0.000 $0.000 $0.000
Total Other Expense Adjustments $0.000 $0.000 $0.000 $0.000 $0.000
Total Expenses before Depreciation and GASB Adjs. $1,724.256 $1,906.168 $1,920.496 $1,942.676 $2,087.370
Depreciation $335.945 $339.290 $342.667 $346.078 $349.523
OPEB Liability Adjustment 83.476 85.981 88.560 91.217 93.953
GASB 68 Pension Expense Adjustment 169.000 174.400 172.600 174.100 162.400
Environmental Remediation 2.000 2.000 2.000 2.000 2.000
Total Expenses $2,314.677 $2,507.839 $2,526.323 $2,556.071 $2,695.246
Net Surplus/(Deficit) ($1,212.405) ($1,345.676) ($1,414.973) ($1,457.163) ($1,592.861)
Cash Conversion Adjustments
Depreciation $335.945 $339.290 $342.667 $346.078 $349.523
Operating/Capital (15.671) (28.966) (16.747) (13.168) (13.999)
Other Cash Adjustment 275.872 282.718 267.836 267.973 256.693
Total Cash Conversion Adjustments $596.146 $593.042 $593.756 $600.883 $592.217
Net Surplus/(Deficit) ($616.259) ($752.634) ($821.217) ($856.280) ($1,000.644)
MTA LONG ISLAND RAIL ROADFebruary Financial Plan 2017 - 2020
Accrual Statement of Operations by Category($ in millions)
VI-41
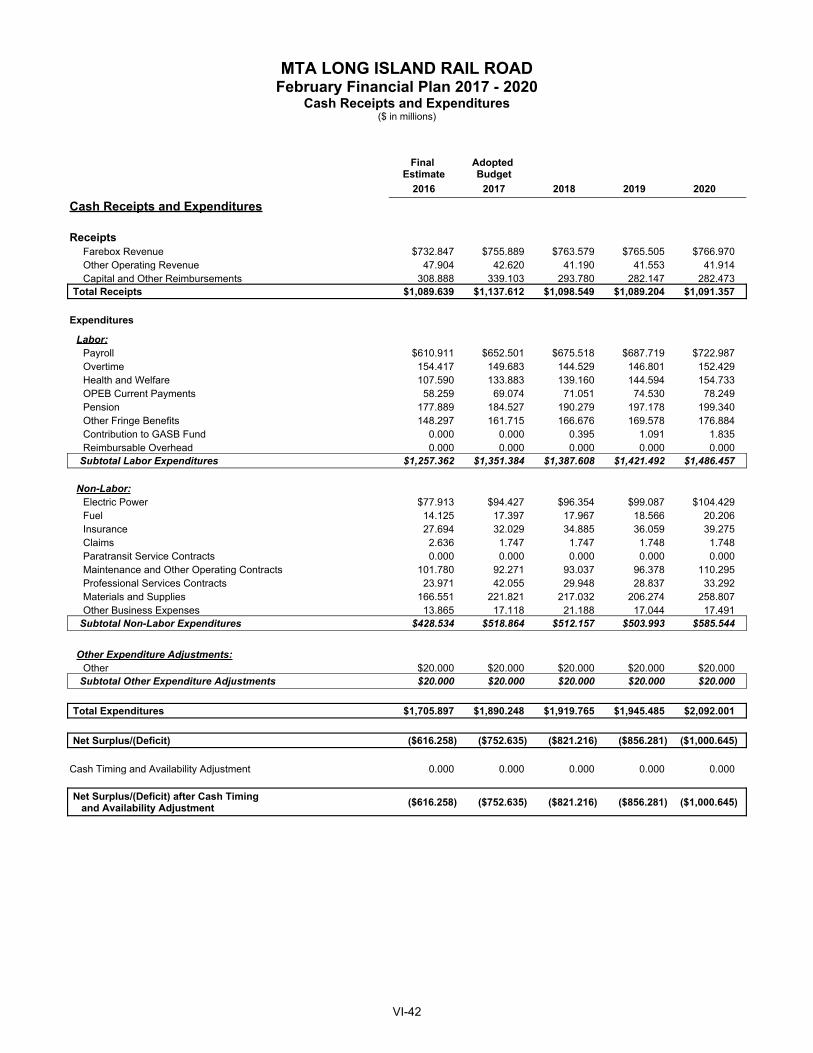
MTA LONG ISLAND RAIL ROADFebruary Financial Plan 2017 - 2020
Cash Receipts and Expenditures($ in millions)
Final Estimate
Adopted Budget
2016 2017 2018 2019 2020
Cash Receipts and Expenditures
ReceiptsFarebox Revenue $732.847 $755.889 $763.579 $765.505 $766.970 Other Operating Revenue 47.904 42.620 41.190 41.553 41.914 Capital and Other Reimbursements 308.888 339.103 293.780 282.147 282.473
Total Receipts $1,089.639 $1,137.612 $1,098.549 $1,089.204 $1,091.357
Expenditures
Labor:Payroll $610.911 $652.501 $675.518 $687.719 $722.987 Overtime 154.417 149.683 144.529 146.801 152.429 Health and Welfare 107.590 133.883 139.160 144.594 154.733 OPEB Current Payments 58.259 69.074 71.051 74.530 78.249 Pension 177.889 184.527 190.279 197.178 199.340 Other Fringe Benefits 148.297 161.715 166.676 169.578 176.884 Contribution to GASB Fund 0.000 0.000 0.395 1.091 1.835 Reimbursable Overhead 0.000 0.000 0.000 0.000 0.000
Subtotal Labor Expenditures $1,257.362 $1,351.384 $1,387.608 $1,421.492 $1,486.457
Non-Labor:Electric Power $77.913 $94.427 $96.354 $99.087 $104.429 Fuel 14.125 17.397 17.967 18.566 20.206 Insurance 27.694 32.029 34.885 36.059 39.275 Claims 2.636 1.747 1.747 1.748 1.748 Paratransit Service Contracts 0.000 0.000 0.000 0.000 0.000 Maintenance and Other Operating Contracts 101.780 92.271 93.037 96.378 110.295 Professional Services Contracts 23.971 42.055 29.948 28.837 33.292 Materials and Supplies 166.551 221.821 217.032 206.274 258.807 Other Business Expenses 13.865 17.118 21.188 17.044 17.491
Subtotal Non-Labor Expenditures $428.534 $518.864 $512.157 $503.993 $585.544
Other Expenditure Adjustments:Other $20.000 $20.000 $20.000 $20.000 $20.000
Subtotal Other Expenditure Adjustments $20.000 $20.000 $20.000 $20.000 $20.000
Total Expenditures $1,705.897 $1,890.248 $1,919.765 $1,945.485 $2,092.001
Net Surplus/(Deficit) ($616.258) ($752.635) ($821.216) ($856.281) ($1,000.645)
Cash Timing and Availability Adjustment 0.000 0.000 0.000 0.000 0.000
Net Surplus/(Deficit) after Cash Timing and Availability Adjustment ($616.258) ($752.635) ($821.216) ($856.281) ($1,000.645)
VI-42

MTA LONG ISLAND RAIL ROADFebruary Financial Plan 2017 - 2020
Cash Conversion (Cash Flow Adjustments)Favorable/(Unfavorable)
($ in millions)
Final Estimate
Adopted Budget
2016 2017 2018 2019 2020Cash Flow Adjustments
ReceiptsFarebox Revenue $20.953 $20.000 $20.000 $20.000 $20.000 Other Operating Revenue (9.100) (15.061) (15.516) (15.987) (16.470)Capital and Other Reimbursements (24.486) (29.490) (17.285) (13.716) (14.560)
Total Receipts ($12.633) ($24.551) ($12.801) ($9.703) ($11.030)
ExpendituresLabor:
Payroll $3.950 $6.401 $6.546 $6.693 $6.844 Overtime (0.654) 0.000 0.000 0.000 0.000 Health and Welfare 12.395 0.000 0.000 0.000 0.000 OPEB Current Payments 4.245 0.000 0.000 0.000 0.000 Pension 3.011 0.000 0.000 0.000 0.000 Other Fringe Benefits 0.748 1.000 1.000 1.000 1.000 Contribution to GASB Fund 0.000 0.000 (0.395) (1.091) (1.835)Reimbursable Overhead 0.000 0.000 0.000 0.000 0.000
Subtotal Labor Expenditures $23.695 $7.401 $7.151 $6.602 $6.009
Non-Labor:Electric Power ($0.610) 0.000 $0.000 $0.000 $0.000 Fuel (0.100) 0.000 0.000 0.000 0.000 Insurance 2.266 1.303 (0.301) 0.426 (0.323)Claims 1.770 2.623 2.623 2.671 2.723 Paratransit Service Contracts 0.000 0.000 0.000 0.000 0.000 Maintenance and Other Operating Contracts (11.071) 3.706 0.000 0.000 0.000 Professional Services Contracts 2.793 4.612 4.843 5.085 5.339 Materials and Supplies 15.888 15.602 5.739 1.719 0.922 Other Business Expenses 3.727 0.675 0.675 0.688 0.701
Subtotal Non-Labor Expenditures $14.663 $28.521 $13.579 $10.589 $9.362
Other Expenditure Adjustments:Other Expense Adjustments ($20.000) ($20.000) ($20.000) ($20.000) ($20.000)
Subtotal Other Expenditure Ajustments ($20.000) ($20.000) ($20.000) ($20.000) ($20.000)
Total Expenditures $18.358 $15.922 $0.730 ($2.809) ($4.629)
Total Cash Conversion Adjustments before Depreciation $5.725 ($8.629) ($12.071) ($12.512) ($15.659)
Depreciation $335.945 $339.290 $342.667 $346.078 $349.523 OPEB Liability Adjustment 83.476 85.981 88.560 91.217 93.953 GASB 68 Pension Expense Adjustment 169.000 174.400 172.600 174.100 162.400 Environmental Remediation 2.000 2.000 2.000 2.000 2.000 Cash Timing and Availability Adjustment 0.000 0.000 0.000 0.000 0.000
Total Cash Conversion Adjustments $596.146 $593.042 $593.756 $600.883 $592.217
VI-43
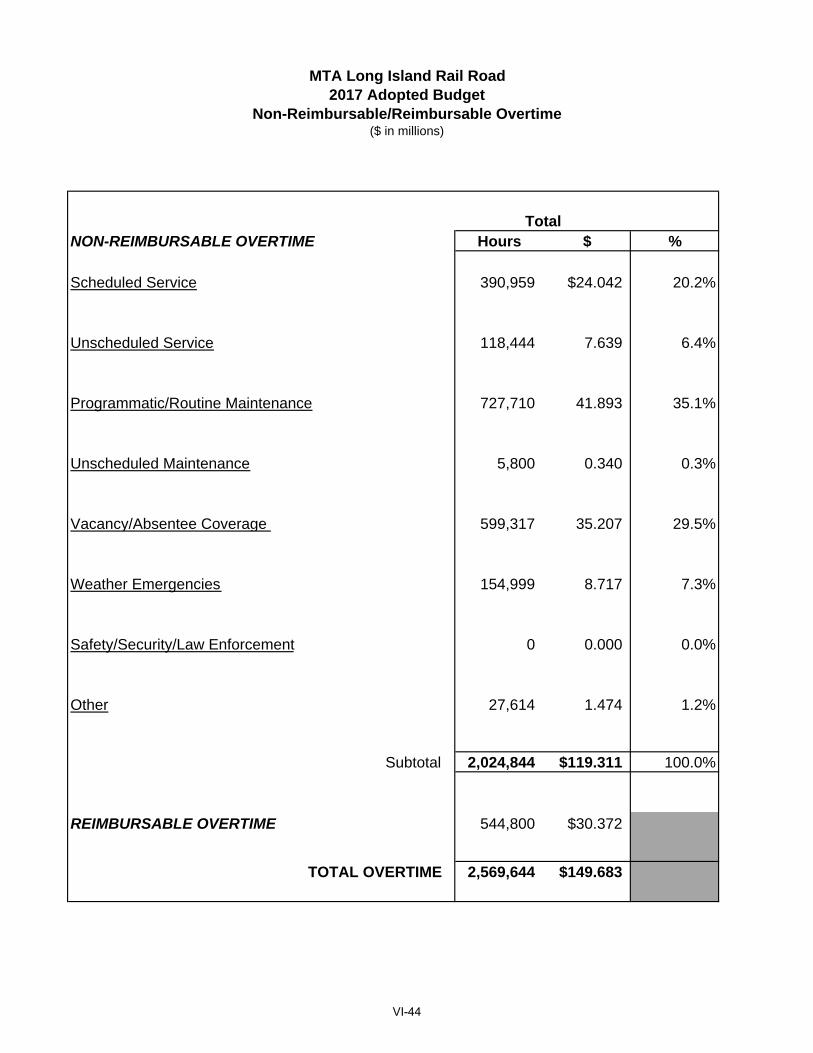
MTA Long Island Rail Road2017 Adopted Budget
Non-Reimbursable/Reimbursable Overtime ($ in millions)
NON-REIMBURSABLE OVERTIME Hours $ %
Scheduled Service 390,959 $24.042 20.2%
Unscheduled Service 118,444 7.639 6.4%
Programmatic/Routine Maintenance 727,710 41.893 35.1%
Unscheduled Maintenance 5,800 0.340 0.3%
Vacancy/Absentee Coverage 599,317 35.207 29.5%
Weather Emergencies 154,999 8.717 7.3%
Safety/Security/Law Enforcement 0 0.000 0.0%
Other 27,614 1.474 1.2%
Subtotal 2,024,844 $119.311 100.0%
REIMBURSABLE OVERTIME 544,800 $30.372
TOTAL OVERTIME 2,569,644 $149.683
Total
VI-44
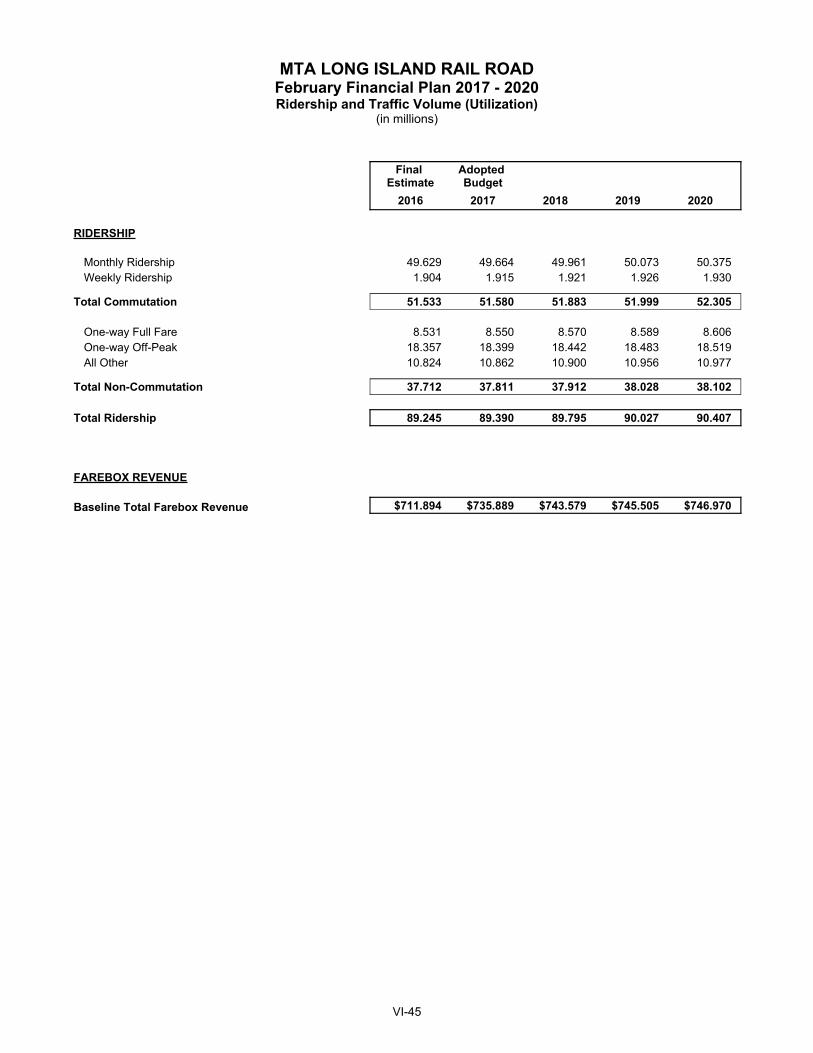
MTA LONG ISLAND RAIL ROADFebruary Financial Plan 2017 - 2020Ridership and Traffic Volume (Utilization)
(in millions)
Final Estimate
Adopted Budget
2016 2017 2018 2019 2020
RIDERSHIP
Monthly Ridership 49.629 49.664 49.961 50.073 50.375 Weekly Ridership 1.904 1.915 1.921 1.926 1.930
Total Commutation 51.533 51.580 51.883 51.999 52.305
One-way Full Fare 8.531 8.550 8.570 8.589 8.606 One-way Off-Peak 18.357 18.399 18.442 18.483 18.519 All Other 10.824 10.862 10.900 10.956 10.977
Total Non-Commutation 37.712 37.811 37.912 38.028 38.102
Total Ridership 89.245 89.390 89.795 90.027 90.407
FAREBOX REVENUE
Baseline Total Farebox Revenue $711.894 $735.889 $743.579 $745.505 $746.970
VI-45

2016FInal
Estimate
2017 Adopted Budget 2018 2019 2020
AdministrationExecutive VP 2 2 2 2 2Enterprise Asset Management 0 7 7 7 7Sr Vice President - Engineering 13 2 2 2 2Labor Relations 19 19 19 19 19Procurement & Logistics (excl. Stores) 86 70 70 67 66Human Resources 33 33 39 49 52Sr VP Administration 2 2 2 2 2Strategic Investments 25 17 17 17 17President 4 4 4 4 4VP & CFO 4 4 4 4 4Information Technology 0 0 0 0 0Controller 43 43 43 44 44Management and Budget 21 21 21 21 21BPM, Controls, & Compliance 7 7 7 7 7Market Dev. & Public Affairs 71 71 71 71 71Gen. Counsel & Secretary 33 33 33 33 33Diversity Management 3 3 3 3 3Security 14 14 14 14 14System Safety 36 36 36 36 36Training 65 67 67 66 73Service Planning 23 25 27 27 27Rolling Stock Programs 11 17 17 17 17Sr Vice President - Operations 2 2 2 2 2
Total Administration 517 499 507 514 523
OperationsTrain Operations 2,173 2,214 2,306 2,332 2,484Customer Service 299 303 303 303 303
Total Operations 2,472 2,517 2,609 2,635 2,787
MaintenanceEngineering 1,902 1,993 1,948 1,963 1,960Equipment 2,079 2,132 2,113 2,070 2,065Procurement (Stores) 94 96 96 94 94
Total Maintenance 4,075 4,221 4,157 4,127 4,119
Engineering/CapitalDepartment of Project Management 156 156 156 155 154Special Projects/East Side Access 46 46 46 45 45Positive Train Control 0 11 11 9 5
Total Engineering/Capital 202 213 213 209 204
Total Positions 7,266 7,450 7,486 7,485 7,633
Non-Reimbursable 6,148 6,235 6,551 6,596 6,768 Reimbursable 1,118 1,215 935 889 865
Total Full-Time 7,266 7,450 7,486 7,485 7,633 Total Full-Time Equivalents - - - - -
FUNCTION/DEPARTMENT
MTA LONG ISLAND RAIL ROADFebruary Financial Plan 2017 - 2020
Total Positions by Function and DepartmentNon-Reimbursable/Reimbursable and Full-Time/Full Time Equivalents
VI-46

MTA LONG ISLAND RAIL ROADFebruary Financial Plan 2017 - 2020
Total Positions by Functional and Occupational GroupNon-Reimbursable and Reimbursable
Final Estimate
Adopted Budget
2016 2017 2018 2019 2020
FUNCTION / OCCUPATIONAL GROUP
AdministrationManagers/Supervisors 262 254 255 253 253 Professional/Technical/Clerical 151 139 146 157 166 Operational Hourlies 104 106 106 104 104
Total Administration Headcount 517 499 507 514 523
OperationsManagers/Supervisors 293 296 290 285 302 Professional/Technical/Clerical 96 96 96 96 96 Operational Hourlies 2,083 2,125 2,223 2,254 2,389
Total Operations Headcount 2,472 2,517 2,609 2,635 2,787
MaintenanceManagers/Supervisors 750 782 753 752 749 Professional/Technical/Clerical 255 267 283 276 274 Operational Hourlies 3,070 3,172 3,121 3,099 3,096
Total Maintenance Headcount 4,075 4,221 4,157 4,127 4,119
Engineering / CapitalManagers/Supervisors 136 145 145 142 137 Professional/Technical/Clerical 66 68 68 67 67 Operational Hourlies 0 0 0 0 0
Total Engineering Headcount 202 213 213 209 204
Public SafetyManagers/Supervisors 0 0 0 0 0 Professional, Technical, Clerical 0 0 0 0 0 Operational Hourlies 0 0 0 0 0
Total Public Safety Headcount 0 0 0 0 0
Total PositionsManagers/Supervisors 1,441 1,477 1,443 1,432 1,441 Professional, Technical, Clerical 568 570 593 596 603 Operational Hourlies 5,257 5,403 5,450 5,457 5,589
Total Positions 7,266 7,450 7,486 7,485 7,633
VI-47
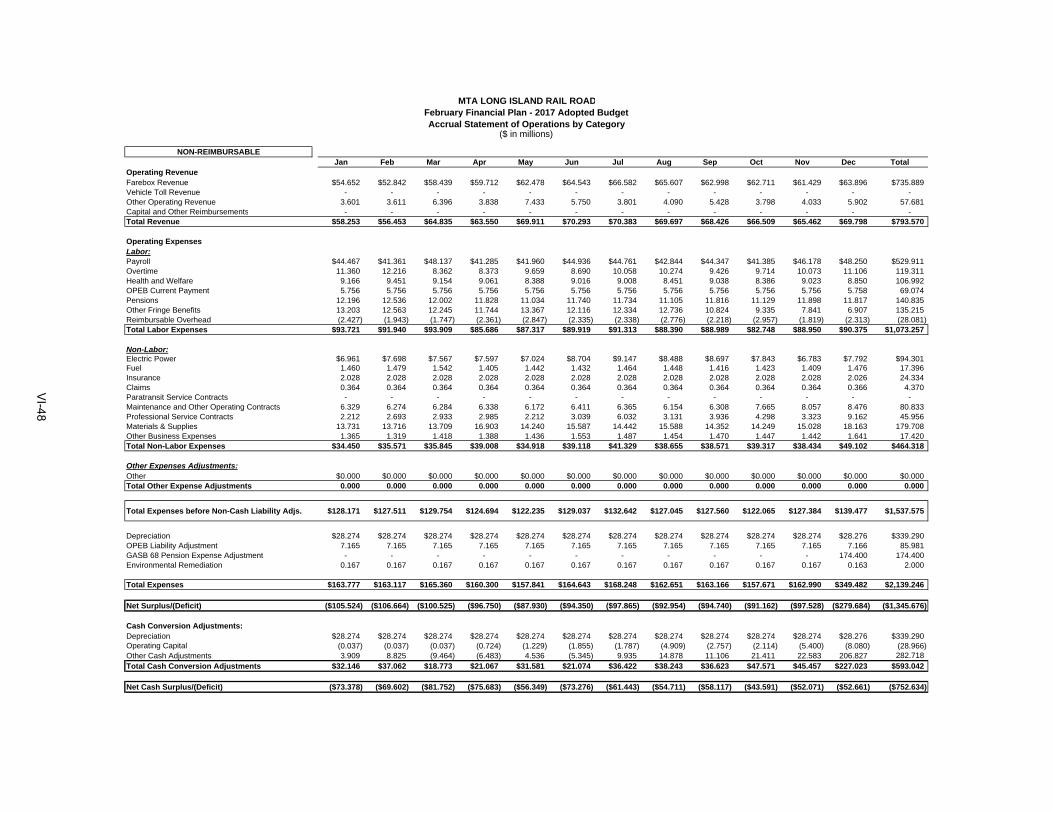
NON-REIMBURSABLEJan Feb Mar Apr May Jun Jul Aug Sep Oct Nov Dec Total
Operating RevenueFarebox Revenue $54.652 $52.842 $58.439 $59.712 $62.478 $64.543 $66.582 $65.607 $62.998 $62.711 $61.429 $63.896 $735.889Vehicle Toll Revenue - - - - - - - - - - - - - Other Operating Revenue 3.601 3.611 6.396 3.838 7.433 5.750 3.801 4.090 5.428 3.798 4.033 5.902 57.681Capital and Other Reimbursements - - - - - - - - - - - - - Total Revenue $58.253 $56.453 $64.835 $63.550 $69.911 $70.293 $70.383 $69.697 $68.426 $66.509 $65.462 $69.798 $793.570
Operating ExpensesLabor:Payroll $44.467 $41.361 $48.137 $41.285 $41.960 $44.936 $44.761 $42.844 $44.347 $41.385 $46.178 $48.250 $529.911Overtime 11.360 12.216 8.362 8.373 9.659 8.690 10.058 10.274 9.426 9.714 10.073 11.106 119.311Health and Welfare 9.166 9.451 9.154 9.061 8.388 9.016 9.008 8.451 9.038 8.386 9.023 8.850 106.992OPEB Current Payment 5.756 5.756 5.756 5.756 5.756 5.756 5.756 5.756 5.756 5.756 5.756 5.758 69.074Pensions 12.196 12.536 12.002 11.828 11.034 11.740 11.734 11.105 11.816 11.129 11.898 11.817 140.835Other Fringe Benefits 13.203 12.563 12.245 11.744 13.367 12.116 12.334 12.736 10.824 9.335 7.841 6.907 135.215Reimbursable Overhead (2.427) (1.943) (1.747) (2.361) (2.847) (2.335) (2.338) (2.776) (2.218) (2.957) (1.819) (2.313) (28.081)Total Labor Expenses $93.721 $91.940 $93.909 $85.686 $87.317 $89.919 $91.313 $88.390 $88.989 $82.748 $88.950 $90.375 $1,073.257
Non-Labor:Electric Power $6.961 $7.698 $7.567 $7.597 $7.024 $8.704 $9.147 $8.488 $8.697 $7.843 $6.783 $7.792 $94.301Fuel 1.460 1.479 1.542 1.405 1.442 1.432 1.464 1.448 1.416 1.423 1.409 1.476 17.396Insurance 2.028 2.028 2.028 2.028 2.028 2.028 2.028 2.028 2.028 2.028 2.028 2.026 24.334Claims 0.364 0.364 0.364 0.364 0.364 0.364 0.364 0.364 0.364 0.364 0.364 0.366 4.370Paratransit Service Contracts - - - - - - - - - - - - - Maintenance and Other Operating Contracts 6.329 6.274 6.284 6.338 6.172 6.411 6.365 6.154 6.308 7.665 8.057 8.476 80.833Professional Service Contracts 2.212 2.693 2.933 2.985 2.212 3.039 6.032 3.131 3.936 4.298 3.323 9.162 45.956Materials & Supplies 13.731 13.716 13.709 16.903 14.240 15.587 14.442 15.588 14.352 14.249 15.028 18.163 179.708Other Business Expenses 1.365 1.319 1.418 1.388 1.436 1.553 1.487 1.454 1.470 1.447 1.442 1.641 17.420Total Non-Labor Expenses $34.450 $35.571 $35.845 $39.008 $34.918 $39.118 $41.329 $38.655 $38.571 $39.317 $38.434 $49.102 $464.318
Other Expenses Adjustments:Other $0.000 $0.000 $0.000 $0.000 $0.000 $0.000 $0.000 $0.000 $0.000 $0.000 $0.000 $0.000 $0.000Total Other Expense Adjustments 0.000 0.000 0.000 0.000 0.000 0.000 0.000 0.000 0.000 0.000 0.000 0.000 0.000
Total Expenses before Non-Cash Liability Adjs. $128.171 $127.511 $129.754 $124.694 $122.235 $129.037 $132.642 $127.045 $127.560 $122.065 $127.384 $139.477 $1,537.575
Depreciation $28.274 $28.274 $28.274 $28.274 $28.274 $28.274 $28.274 $28.274 $28.274 $28.274 $28.274 $28.276 $339.290OPEB Liability Adjustment 7.165 7.165 7.165 7.165 7.165 7.165 7.165 7.165 7.165 7.165 7.165 7.166 85.981 GASB 68 Pension Expense Adjustment - - - - - - - - - - - 174.400 174.400 Environmental Remediation 0.167 0.167 0.167 0.167 0.167 0.167 0.167 0.167 0.167 0.167 0.167 0.163 2.000
Total Expenses $163.777 $163.117 $165.360 $160.300 $157.841 $164.643 $168.248 $162.651 $163.166 $157.671 $162.990 $349.482 $2,139.246
Net Surplus/(Deficit) ($105.524) ($106.664) ($100.525) ($96.750) ($87.930) ($94.350) ($97.865) ($92.954) ($94.740) ($91.162) ($97.528) ($279.684) ($1,345.676)
Cash Conversion Adjustments:Depreciation $28.274 $28.274 $28.274 $28.274 $28.274 $28.274 $28.274 $28.274 $28.274 $28.274 $28.274 $28.276 $339.290Operating Capital (0.037) (0.037) (0.037) (0.724) (1.229) (1.855) (1.787) (4.909) (2.757) (2.114) (5.400) (8.080) (28.966) Other Cash Adjustments 3.909 8.825 (9.464) (6.483) 4.536 (5.345) 9.935 14.878 11.106 21.411 22.583 206.827 282.718 Total Cash Conversion Adjustments $32.146 $37.062 $18.773 $21.067 $31.581 $21.074 $36.422 $38.243 $36.623 $47.571 $45.457 $227.023 $593.042
Net Cash Surplus/(Deficit) ($73.378) ($69.602) ($81.752) ($75.683) ($56.349) ($73.276) ($61.443) ($54.711) ($58.117) ($43.591) ($52.071) ($52.661) ($752.634)
February Financial Plan - 2017 Adopted Budget
($ in millions)
MTA LONG ISLAND RAIL ROAD
Accrual Statement of Operations by Category
VI-48
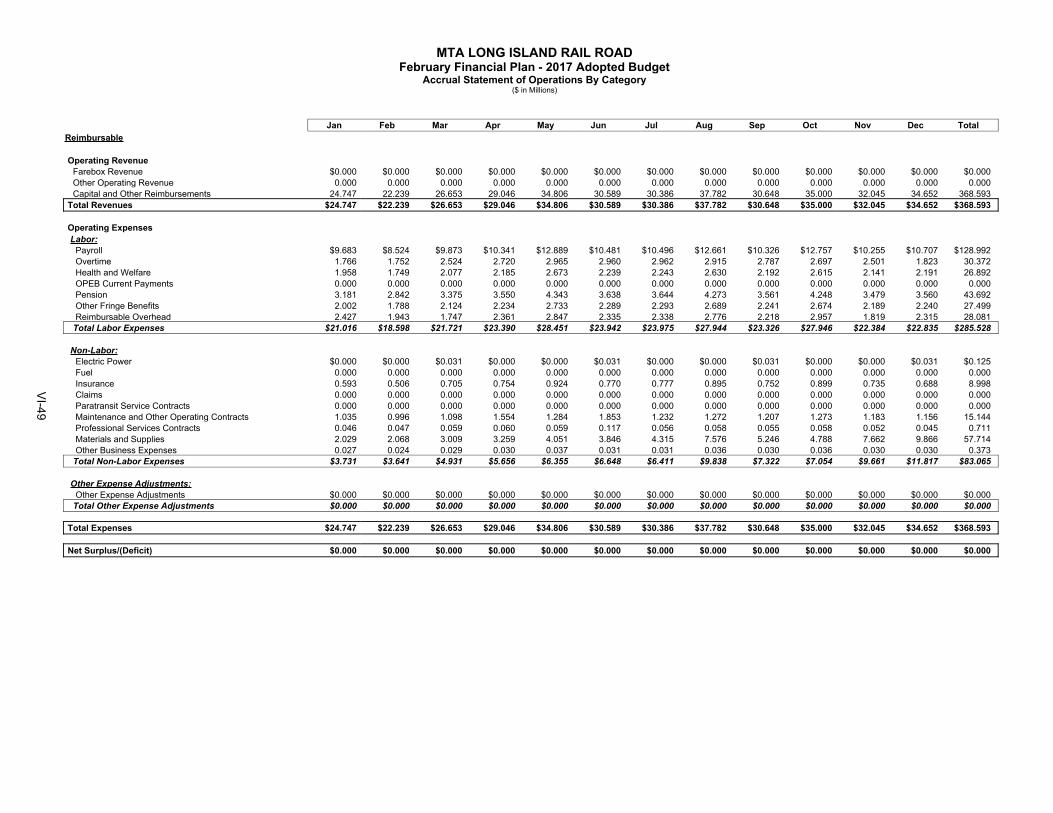
MTA LONG ISLAND RAIL ROADFebruary Financial Plan - 2017 Adopted Budget
Accrual Statement of Operations By Category($ in Millions)
Jan Feb Mar Apr May Jun Jul Aug Sep Oct Nov Dec TotalReimbursable
Operating RevenueFarebox Revenue $0.000 $0.000 $0.000 $0.000 $0.000 $0.000 $0.000 $0.000 $0.000 $0.000 $0.000 $0.000 $0.000 Other Operating Revenue 0.000 0.000 0.000 0.000 0.000 0.000 0.000 0.000 0.000 0.000 0.000 0.000 0.000 Capital and Other Reimbursements 24.747 22.239 26.653 29.046 34.806 30.589 30.386 37.782 30.648 35.000 32.045 34.652 368.593
Total Revenues $24.747 $22.239 $26.653 $29.046 $34.806 $30.589 $30.386 $37.782 $30.648 $35.000 $32.045 $34.652 $368.593
Operating ExpensesLabor:
Payroll $9.683 $8.524 $9.873 $10.341 $12.889 $10.481 $10.496 $12.661 $10.326 $12.757 $10.255 $10.707 $128.992 Overtime 1.766 1.752 2.524 2.720 2.965 2.960 2.962 2.915 2.787 2.697 2.501 1.823 30.372 Health and Welfare 1.958 1.749 2.077 2.185 2.673 2.239 2.243 2.630 2.192 2.615 2.141 2.191 26.892 OPEB Current Payments 0.000 0.000 0.000 0.000 0.000 0.000 0.000 0.000 0.000 0.000 0.000 0.000 0.000 Pension 3.181 2.842 3.375 3.550 4.343 3.638 3.644 4.273 3.561 4.248 3.479 3.560 43.692 Other Fringe Benefits 2.002 1.788 2.124 2.234 2.733 2.289 2.293 2.689 2.241 2.674 2.189 2.240 27.499 Reimbursable Overhead 2.427 1.943 1.747 2.361 2.847 2.335 2.338 2.776 2.218 2.957 1.819 2.315 28.081
Total Labor Expenses $21.016 $18.598 $21.721 $23.390 $28.451 $23.942 $23.975 $27.944 $23.326 $27.946 $22.384 $22.835 $285.528
Non-Labor:Electric Power $0.000 $0.000 $0.031 $0.000 $0.000 $0.031 $0.000 $0.000 $0.031 $0.000 $0.000 $0.031 $0.125 Fuel 0.000 0.000 0.000 0.000 0.000 0.000 0.000 0.000 0.000 0.000 0.000 0.000 0.000 Insurance 0.593 0.506 0.705 0.754 0.924 0.770 0.777 0.895 0.752 0.899 0.735 0.688 8.998 Claims 0.000 0.000 0.000 0.000 0.000 0.000 0.000 0.000 0.000 0.000 0.000 0.000 0.000 Paratransit Service Contracts 0.000 0.000 0.000 0.000 0.000 0.000 0.000 0.000 0.000 0.000 0.000 0.000 0.000 Maintenance and Other Operating Contracts 1.035 0.996 1.098 1.554 1.284 1.853 1.232 1.272 1.207 1.273 1.183 1.156 15.144 Professional Services Contracts 0.046 0.047 0.059 0.060 0.059 0.117 0.056 0.058 0.055 0.058 0.052 0.045 0.711 Materials and Supplies 2.029 2.068 3.009 3.259 4.051 3.846 4.315 7.576 5.246 4.788 7.662 9.866 57.714 Other Business Expenses 0.027 0.024 0.029 0.030 0.037 0.031 0.031 0.036 0.030 0.036 0.030 0.030 0.373
Total Non-Labor Expenses $3.731 $3.641 $4.931 $5.656 $6.355 $6.648 $6.411 $9.838 $7.322 $7.054 $9.661 $11.817 $83.065
Other Expense Adjustments:Other Expense Adjustments $0.000 $0.000 $0.000 $0.000 $0.000 $0.000 $0.000 $0.000 $0.000 $0.000 $0.000 $0.000 $0.000
Total Other Expense Adjustments $0.000 $0.000 $0.000 $0.000 $0.000 $0.000 $0.000 $0.000 $0.000 $0.000 $0.000 $0.000 $0.000
Total Expenses $24.747 $22.239 $26.653 $29.046 $34.806 $30.589 $30.386 $37.782 $30.648 $35.000 $32.045 $34.652 $368.593
Net Surplus/(Deficit) $0.000 $0.000 $0.000 $0.000 $0.000 $0.000 $0.000 $0.000 $0.000 $0.000 $0.000 $0.000 $0.000
VI-49

NON-REIMBURSABLE / REIMBURSABLEJan Feb Mar Apr May Jun Jul Aug Sep Oct Nov Dec Total
RevenueFarebox Revenue $54.652 $52.842 $58.439 $59.712 $62.478 $64.543 $66.582 $65.607 $62.998 $62.711 $61.429 $63.896 $735.889Vehicle Toll Revenue - - - - - - - - - - - - - Other Operating Revenue 3.601 3.611 6.396 3.838 7.433 5.750 3.801 4.090 5.428 3.798 4.033 5.902 57.681Capital and Other Reimbursements 24.747 22.239 26.651 29.048 34.805 30.590 30.387 37.781 30.646 35.002 32.046 34.651 368.593Total Revenue $83.000 $78.692 $91.486 $92.598 $104.716 $100.883 $100.770 $107.478 $99.072 $101.511 $97.508 $104.449 $1,162.163
ExpensesLabor:Payroll $54.150 $49.885 $58.010 $51.626 $54.849 $55.417 $55.257 $55.505 $54.673 $54.142 $56.433 $58.956 $658.903Overtime 13.126 13.968 10.886 11.093 12.624 11.650 13.020 13.189 12.213 12.411 12.574 12.929 149.683Health and Welfare 11.124 11.200 11.231 11.246 11.061 11.255 11.251 11.081 11.230 11.001 11.164 11.040 133.884OPEB Current Payment 5.756 5.756 5.756 5.756 5.756 5.756 5.756 5.756 5.756 5.756 5.756 5.758 69.074Pensions 15.377 15.378 15.377 15.378 15.377 15.378 15.378 15.378 15.377 15.377 15.377 15.375 184.527Other Fringe Benefits 15.205 14.351 14.369 13.978 16.100 14.405 14.627 15.425 13.065 12.009 10.030 9.150 162.714Reimbursable Overhead 0.000 0.000 0.000 0.000 0.000 0.000 0.000 0.000 0.000 0.000 0.000 0.000 0.000Total Labor Expenses $114.738 $110.538 $115.629 $109.077 $115.767 $113.861 $115.289 $116.334 $112.314 $110.696 $111.334 $113.208 $1,358.785
Non-Labor:Electric Power $6.961 $7.698 $7.598 $7.597 $7.024 $8.735 $9.147 $8.488 $8.728 $7.843 $6.783 $7.824 $94.426Fuel 1.460 1.479 1.542 1.405 1.442 1.432 1.464 1.448 1.416 1.423 1.409 1.476 17.396Insurance 2.621 2.534 2.733 2.782 2.952 2.798 2.805 2.923 2.780 2.927 2.763 2.714 33.332Claims 0.364 0.364 0.364 0.364 0.364 0.364 0.364 0.364 0.364 0.364 0.364 0.366 4.370Paratransit Service Contracts - - - - - - - - - - - - - Maintenance and Other Operating Contracts 7.364 7.270 7.382 7.892 7.456 8.264 7.597 7.426 7.515 8.938 9.240 9.633 95.977Professional Service Contracts 2.258 2.740 2.992 3.045 2.271 3.156 6.088 3.189 3.991 4.356 3.375 9.206 46.667Materials & Supplies 15.760 15.784 16.718 20.162 18.291 19.433 18.757 23.164 19.598 19.037 22.690 28.028 237.422Other Business Expenses 1.392 1.343 1.447 1.418 1.473 1.584 1.518 1.490 1.500 1.483 1.472 1.673 17.793Total Non-Labor Expenses $38.180 $39.212 $40.776 $44.665 $41.273 $45.766 $47.740 $48.492 $45.892 $46.371 $48.096 $60.920 $547.383
Other Expenses Adjustments:Other $0.000 $0.000 $0.000 $0.000 $0.000 $0.000 $0.000 $0.000 $0.000 $0.000 $0.000 $0.000 $0.000Total Other Expense Adjustments $0.000 $0.000 $0.000 $0.000 $0.000 $0.000 $0.000 $0.000 $0.000 $0.000 $0.000 $0.000 $0.000
Total Expenses before Non-Cash Liability Adjs. $152.918 $149.750 $156.405 $153.742 $157.040 $159.627 $163.029 $164.826 $158.206 $157.067 $159.430 $174.128 $1,906.168
Depreciation $28.274 $28.274 $28.274 $28.274 $28.274 $28.274 $28.274 $28.274 $28.274 $28.274 $28.274 $28.276 $339.290OPEB Liability Adjustment 7.165 7.165 7.165 7.165 7.165 7.165 7.165 7.165 7.165 7.165 7.165 7.166 85.981 GASB 68 Pension Expense Adjustment - - - - - - - - - - - 174.400 174.400 Environmental Remediation 0.167 0.167 0.167 0.167 0.167 0.167 0.167 0.167 0.167 0.167 0.167 0.163 2.000
Total Expenses $188.524 $185.356 $192.011 $189.348 $192.646 $195.233 $198.635 $200.432 $193.812 $192.673 $195.036 $384.133 $2,507.839
Net Surplus/(Deficit) ($105.524) ($106.664) ($100.525) ($96.750) ($87.930) ($94.350) ($97.865) ($92.954) ($94.740) ($91.162) ($97.528) ($279.684) ($1,345.676)
Cash Conversion Adjustments:Depreciation $28.274 $28.274 $28.274 $28.274 $28.274 $28.274 $28.274 $28.274 $28.274 $28.274 $28.274 $28.276 $339.290Operating Capital (0.037) (0.037) (0.037) (0.724) (1.229) (1.855) (1.787) (4.909) (2.757) (2.114) (5.400) (8.080) (28.966) Other Cash Adjustments 3.909 8.825 (9.464) (6.483) 4.536 (5.345) 9.935 14.878 11.106 21.411 22.583 206.827 282.718 Total Cash Conversion Adjustments $32.146 $37.062 $18.773 $21.067 $31.581 $21.074 $36.422 $38.243 $36.623 $47.571 $45.457 $227.023 $593.042
Net Cash Surplus/(Deficit) ($73.378) ($69.602) ($81.752) ($75.683) ($56.349) ($73.276) ($61.443) ($54.711) ($58.117) ($43.591) ($52.071) ($52.661) ($752.634)
Accrual Statement of Operations by Category($ in millions)
MTA LONG ISLAND RAIL ROADFebruary Financial Plan - 2017 Adopted Budget
VI-50
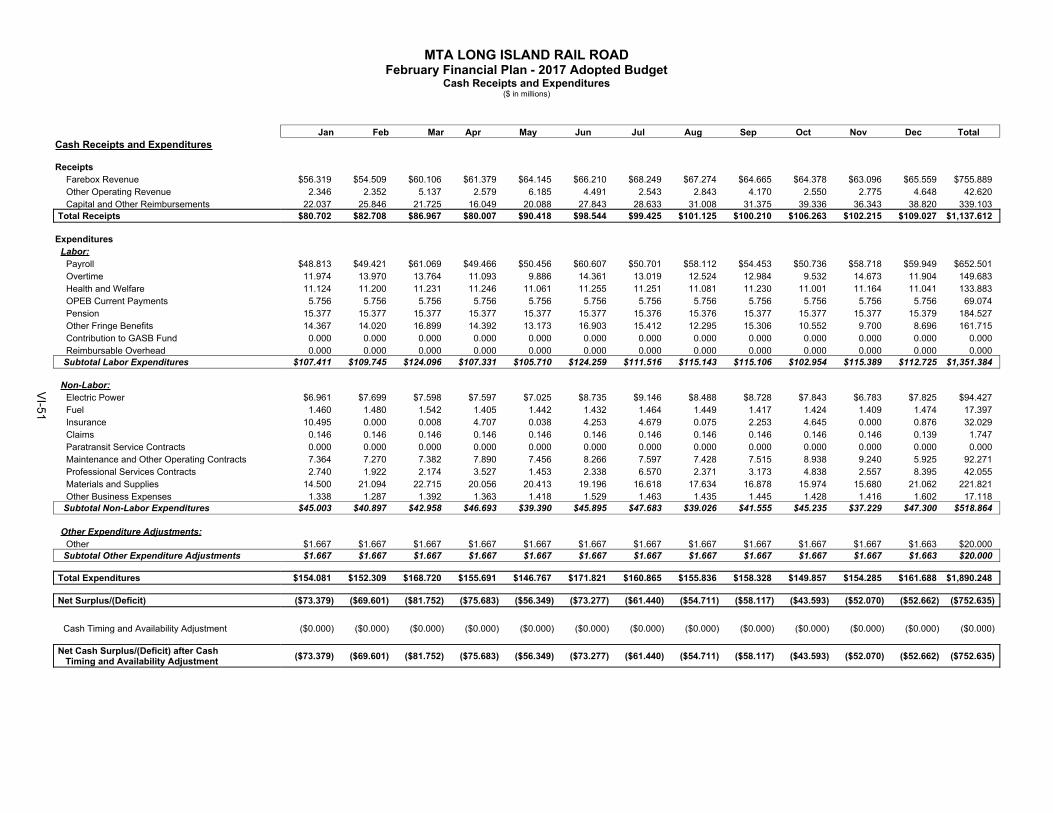
MTA LONG ISLAND RAIL ROADFebruary Financial Plan - 2017 Adopted Budget
Cash Receipts and Expenditures($ in millions)
Jan Feb Mar Apr May Jun Jul Aug Sep Oct Nov Dec TotalCash Receipts and Expenditures
ReceiptsFarebox Revenue $56.319 $54.509 $60.106 $61.379 $64.145 $66.210 $68.249 $67.274 $64.665 $64.378 $63.096 $65.559 $755.889 Other Operating Revenue 2.346 2.352 5.137 2.579 6.185 4.491 2.543 2.843 4.170 2.550 2.775 4.648 42.620 Capital and Other Reimbursements 22.037 25.846 21.725 16.049 20.088 27.843 28.633 31.008 31.375 39.336 36.343 38.820 339.103
Total Receipts $80.702 $82.708 $86.967 $80.007 $90.418 $98.544 $99.425 $101.125 $100.210 $106.263 $102.215 $109.027 $1,137.612
ExpendituresLabor:
Payroll $48.813 $49.421 $61.069 $49.466 $50.456 $60.607 $50.701 $58.112 $54.453 $50.736 $58.718 $59.949 $652.501 Overtime 11.974 13.970 13.764 11.093 9.886 14.361 13.019 12.524 12.984 9.532 14.673 11.904 149.683 Health and Welfare 11.124 11.200 11.231 11.246 11.061 11.255 11.251 11.081 11.230 11.001 11.164 11.041 133.883 OPEB Current Payments 5.756 5.756 5.756 5.756 5.756 5.756 5.756 5.756 5.756 5.756 5.756 5.756 69.074 Pension 15.377 15.377 15.377 15.377 15.377 15.377 15.376 15.376 15.377 15.377 15.377 15.379 184.527 Other Fringe Benefits 14.367 14.020 16.899 14.392 13.173 16.903 15.412 12.295 15.306 10.552 9.700 8.696 161.715 Contribution to GASB Fund 0.000 0.000 0.000 0.000 0.000 0.000 0.000 0.000 0.000 0.000 0.000 0.000 0.000 Reimbursable Overhead 0.000 0.000 0.000 0.000 0.000 0.000 0.000 0.000 0.000 0.000 0.000 0.000 0.000
Subtotal Labor Expenditures $107.411 $109.745 $124.096 $107.331 $105.710 $124.259 $111.516 $115.143 $115.106 $102.954 $115.389 $112.725 $1,351.384
Non-Labor:Electric Power $6.961 $7.699 $7.598 $7.597 $7.025 $8.735 $9.146 $8.488 $8.728 $7.843 $6.783 $7.825 $94.427 Fuel 1.460 1.480 1.542 1.405 1.442 1.432 1.464 1.449 1.417 1.424 1.409 1.474 17.397 Insurance 10.495 0.000 0.008 4.707 0.038 4.253 4.679 0.075 2.253 4.645 0.000 0.876 32.029 Claims 0.146 0.146 0.146 0.146 0.146 0.146 0.146 0.146 0.146 0.146 0.146 0.139 1.747 Paratransit Service Contracts 0.000 0.000 0.000 0.000 0.000 0.000 0.000 0.000 0.000 0.000 0.000 0.000 0.000 Maintenance and Other Operating Contracts 7.364 7.270 7.382 7.890 7.456 8.266 7.597 7.428 7.515 8.938 9.240 5.925 92.271 Professional Services Contracts 2.740 1.922 2.174 3.527 1.453 2.338 6.570 2.371 3.173 4.838 2.557 8.395 42.055 Materials and Supplies 14.500 21.094 22.715 20.056 20.413 19.196 16.618 17.634 16.878 15.974 15.680 21.062 221.821 Other Business Expenses 1.338 1.287 1.392 1.363 1.418 1.529 1.463 1.435 1.445 1.428 1.416 1.602 17.118
Subtotal Non-Labor Expenditures $45.003 $40.897 $42.958 $46.693 $39.390 $45.895 $47.683 $39.026 $41.555 $45.235 $37.229 $47.300 $518.864
Other Expenditure Adjustments:Other $1.667 $1.667 $1.667 $1.667 $1.667 $1.667 $1.667 $1.667 $1.667 $1.667 $1.667 $1.663 $20.000
Subtotal Other Expenditure Adjustments $1.667 $1.667 $1.667 $1.667 $1.667 $1.667 $1.667 $1.667 $1.667 $1.667 $1.667 $1.663 $20.000
Total Expenditures $154.081 $152.309 $168.720 $155.691 $146.767 $171.821 $160.865 $155.836 $158.328 $149.857 $154.285 $161.688 $1,890.248
Net Surplus/(Deficit) ($73.379) ($69.601) ($81.752) ($75.683) ($56.349) ($73.277) ($61.440) ($54.711) ($58.117) ($43.593) ($52.070) ($52.662) ($752.635)
Cash Timing and Availability Adjustment ($0.000) ($0.000) ($0.000) ($0.000) ($0.000) ($0.000) ($0.000) ($0.000) ($0.000) ($0.000) ($0.000) ($0.000) ($0.000)
Net Cash Surplus/(Deficit) after Cash Timing and Availability Adjustment ($73.379) ($69.601) ($81.752) ($75.683) ($56.349) ($73.277) ($61.440) ($54.711) ($58.117) ($43.593) ($52.070) ($52.662) ($752.635)
VI-51
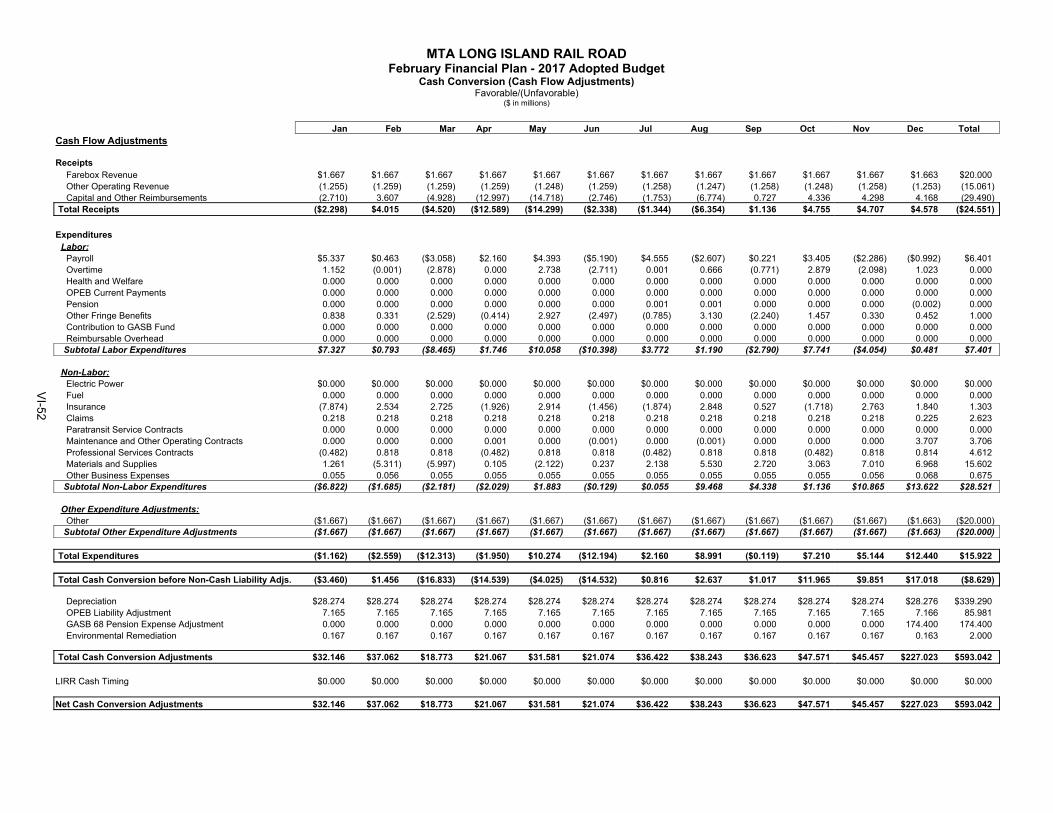
MTA LONG ISLAND RAIL ROADFebruary Financial Plan - 2017 Adopted Budget
Cash Conversion (Cash Flow Adjustments)Favorable/(Unfavorable)
($ in millions)
Jan Feb Mar Apr May Jun Jul Aug Sep Oct Nov Dec TotalCash Flow Adjustments
ReceiptsFarebox Revenue $1.667 $1.667 $1.667 $1.667 $1.667 $1.667 $1.667 $1.667 $1.667 $1.667 $1.667 $1.663 $20.000 Other Operating Revenue (1.255) (1.259) (1.259) (1.259) (1.248) (1.259) (1.258) (1.247) (1.258) (1.248) (1.258) (1.253) (15.061)Capital and Other Reimbursements (2.710) 3.607 (4.928) (12.997) (14.718) (2.746) (1.753) (6.774) 0.727 4.336 4.298 4.168 (29.490)
Total Receipts ($2.298) $4.015 ($4.520) ($12.589) ($14.299) ($2.338) ($1.344) ($6.354) $1.136 $4.755 $4.707 $4.578 ($24.551)
ExpendituresLabor:
Payroll $5.337 $0.463 ($3.058) $2.160 $4.393 ($5.190) $4.555 ($2.607) $0.221 $3.405 ($2.286) ($0.992) $6.401 Overtime 1.152 (0.001) (2.878) 0.000 2.738 (2.711) 0.001 0.666 (0.771) 2.879 (2.098) 1.023 0.000 Health and Welfare 0.000 0.000 0.000 0.000 0.000 0.000 0.000 0.000 0.000 0.000 0.000 0.000 0.000 OPEB Current Payments 0.000 0.000 0.000 0.000 0.000 0.000 0.000 0.000 0.000 0.000 0.000 0.000 0.000 Pension 0.000 0.000 0.000 0.000 0.000 0.000 0.001 0.001 0.000 0.000 0.000 (0.002) 0.000 Other Fringe Benefits 0.838 0.331 (2.529) (0.414) 2.927 (2.497) (0.785) 3.130 (2.240) 1.457 0.330 0.452 1.000 Contribution to GASB Fund 0.000 0.000 0.000 0.000 0.000 0.000 0.000 0.000 0.000 0.000 0.000 0.000 0.000 Reimbursable Overhead 0.000 0.000 0.000 0.000 0.000 0.000 0.000 0.000 0.000 0.000 0.000 0.000 0.000
Subtotal Labor Expenditures $7.327 $0.793 ($8.465) $1.746 $10.058 ($10.398) $3.772 $1.190 ($2.790) $7.741 ($4.054) $0.481 $7.401
Non-Labor:Electric Power $0.000 $0.000 $0.000 $0.000 $0.000 $0.000 $0.000 $0.000 $0.000 $0.000 $0.000 $0.000 $0.000 Fuel 0.000 0.000 0.000 0.000 0.000 0.000 0.000 0.000 0.000 0.000 0.000 0.000 0.000 Insurance (7.874) 2.534 2.725 (1.926) 2.914 (1.456) (1.874) 2.848 0.527 (1.718) 2.763 1.840 1.303 Claims 0.218 0.218 0.218 0.218 0.218 0.218 0.218 0.218 0.218 0.218 0.218 0.225 2.623 Paratransit Service Contracts 0.000 0.000 0.000 0.000 0.000 0.000 0.000 0.000 0.000 0.000 0.000 0.000 0.000 Maintenance and Other Operating Contracts 0.000 0.000 0.000 0.001 0.000 (0.001) 0.000 (0.001) 0.000 0.000 0.000 3.707 3.706 Professional Services Contracts (0.482) 0.818 0.818 (0.482) 0.818 0.818 (0.482) 0.818 0.818 (0.482) 0.818 0.814 4.612 Materials and Supplies 1.261 (5.311) (5.997) 0.105 (2.122) 0.237 2.138 5.530 2.720 3.063 7.010 6.968 15.602 Other Business Expenses 0.055 0.056 0.055 0.055 0.055 0.055 0.055 0.055 0.055 0.055 0.056 0.068 0.675
Subtotal Non-Labor Expenditures ($6.822) ($1.685) ($2.181) ($2.029) $1.883 ($0.129) $0.055 $9.468 $4.338 $1.136 $10.865 $13.622 $28.521
Other Expenditure Adjustments:Other ($1.667) ($1.667) ($1.667) ($1.667) ($1.667) ($1.667) ($1.667) ($1.667) ($1.667) ($1.667) ($1.667) ($1.663) ($20.000)
Subtotal Other Expenditure Adjustments ($1.667) ($1.667) ($1.667) ($1.667) ($1.667) ($1.667) ($1.667) ($1.667) ($1.667) ($1.667) ($1.667) ($1.663) ($20.000)
Total Expenditures ($1.162) ($2.559) ($12.313) ($1.950) $10.274 ($12.194) $2.160 $8.991 ($0.119) $7.210 $5.144 $12.440 $15.922
Total Cash Conversion before Non-Cash Liability Adjs. ($3.460) $1.456 ($16.833) ($14.539) ($4.025) ($14.532) $0.816 $2.637 $1.017 $11.965 $9.851 $17.018 ($8.629)
Depreciation $28.274 $28.274 $28.274 $28.274 $28.274 $28.274 $28.274 $28.274 $28.274 $28.274 $28.274 $28.276 $339.290 OPEB Liability Adjustment 7.165 7.165 7.165 7.165 7.165 7.165 7.165 7.165 7.165 7.165 7.165 7.166 85.981 GASB 68 Pension Expense Adjustment 0.000 0.000 0.000 0.000 0.000 0.000 0.000 0.000 0.000 0.000 0.000 174.400 174.400 Environmental Remediation 0.167 0.167 0.167 0.167 0.167 0.167 0.167 0.167 0.167 0.167 0.167 0.163 2.000
Total Cash Conversion Adjustments $32.146 $37.062 $18.773 $21.067 $31.581 $21.074 $36.422 $38.243 $36.623 $47.571 $45.457 $227.023 $593.042
LIRR Cash Timing $0.000 $0.000 $0.000 $0.000 $0.000 $0.000 $0.000 $0.000 $0.000 $0.000 $0.000 $0.000 $0.000
Net Cash Conversion Adjustments $32.146 $37.062 $18.773 $21.067 $31.581 $21.074 $36.422 $38.243 $36.623 $47.571 $45.457 $227.023 $593.042
VI-52

MTA LONG ISLAND RAIL ROADFebruary Financial Plan - 2017 Adopted Budget
Overtime - Non-Reimbursable/Reimbursable Basis($ in millions)
Jan Feb Mar Apr May Jun Jul Aug Sep Oct Nov Dec TotalNON-REIMBURSABLE OVERTIME
Scheduled Service $2.843 $2.431 $0.999 $1.976 $2.121 $0.998 $2.008 $1.242 $1.880 $2.255 $3.083 $2.207 $24.042
Unscheduled Service 0.615 0.572 0.611 0.601 0.732 0.602 0.580 0.729 0.590 0.735 0.571 0.700 7.639
Programmatic/Routine Maintenance 2.827 2.811 3.524 3.203 3.833 3.580 3.366 3.875 3.550 4.137 3.405 3.782 41.893
Unscheduled Maintenance 0.018 0.011 0.082 0.012 0.035 0.018 0.041 0.018 0.076 0.012 0.006 0.012 0.340
Vacancy/Absentee Coverage 2.292 2.427 2.078 2.377 2.757 3.311 3.881 4.207 3.126 2.336 2.742 3.673 35.207
Weather Emergencies 2.642 3.842 0.945 0.081 0.059 0.059 0.059 0.082 0.081 0.117 0.144 0.605 8.717
Safety/Security/Law Enforcement 0.000 0.000 0.000 0.000 0.000 0.000 0.000 0.000 0.000 0.000 0.000 0.000 0.000
Other 0.123 0.122 0.122 0.123 0.122 0.122 0.123 0.123 0.123 0.123 0.122 0.125 1.474
Sub-Total $11.361 $12.216 $8.362 $8.374 $9.659 $8.690 $10.058 $10.274 $9.426 $9.714 $10.073 $11.104 $119.311
REIMBURSABLE OVERTIME $1.766 $1.753 $2.524 $2.720 $2.965 $2.960 $2.962 $2.916 $2.787 $2.697 $2.501 $1.822 $30.372
TOTAL NR & R OVERTIME $13.127 $13.969 $10.885 $11.093 $12.624 $11.649 $13.020 $13.190 $12.213 $12.411 $12.574 $12.926 $149.683
VI-53

MTA LONG ISLAND RAIL ROADFebruary Financial Plan - 2017 Adopted Budget
Ridership and Traffic Volume (Utilization)(in millions)
Jan Feb Mar Apr May Jun Jul Aug Sep Oct Nov Dec Total
RIDERSHIP
Monthly Ridership 3.936 3.746 4.559 4.010 4.342 4.380 3.879 4.133 4.041 4.544 4.126 3.968 49.664 Weekly Ridership 0.136 0.137 0.157 0.150 0.140 0.176 0.193 0.232 0.159 0.157 0.125 0.156 1.915
Total Commutation 4.072 3.882 4.716 4.161 4.482 4.557 4.072 4.364 4.200 4.700 4.251 4.123 51.580
One-way Full Fare 0.615 0.580 0.672 0.684 0.749 0.760 0.818 0.817 0.730 0.757 0.662 0.707 8.550 One-way Off-Peak 1.335 1.172 1.436 1.419 1.565 1.618 1.746 1.795 1.556 1.460 1.533 1.764 18.399 All Other 0.750 0.735 0.876 0.870 0.912 0.966 1.015 1.041 0.926 0.904 0.884 0.982 10.862
Total Non-Commutation 2.700 2.487 2.984 2.973 3.226 3.344 3.578 3.653 3.213 3.121 3.079 3.454 37.811
Total Ridership 6.772 6.370 7.700 7.133 7.708 7.900 7.650 8.017 7.412 7.821 7.329 7.577 89.390
FAREBOX REVENUE
Baseline Total Farebox Revenue $54.652 $52.842 $58.439 $59.712 $62.478 $64.543 $66.582 $65.607 $62.998 $62.711 $61.429 $63.896 $735.889
VI-54
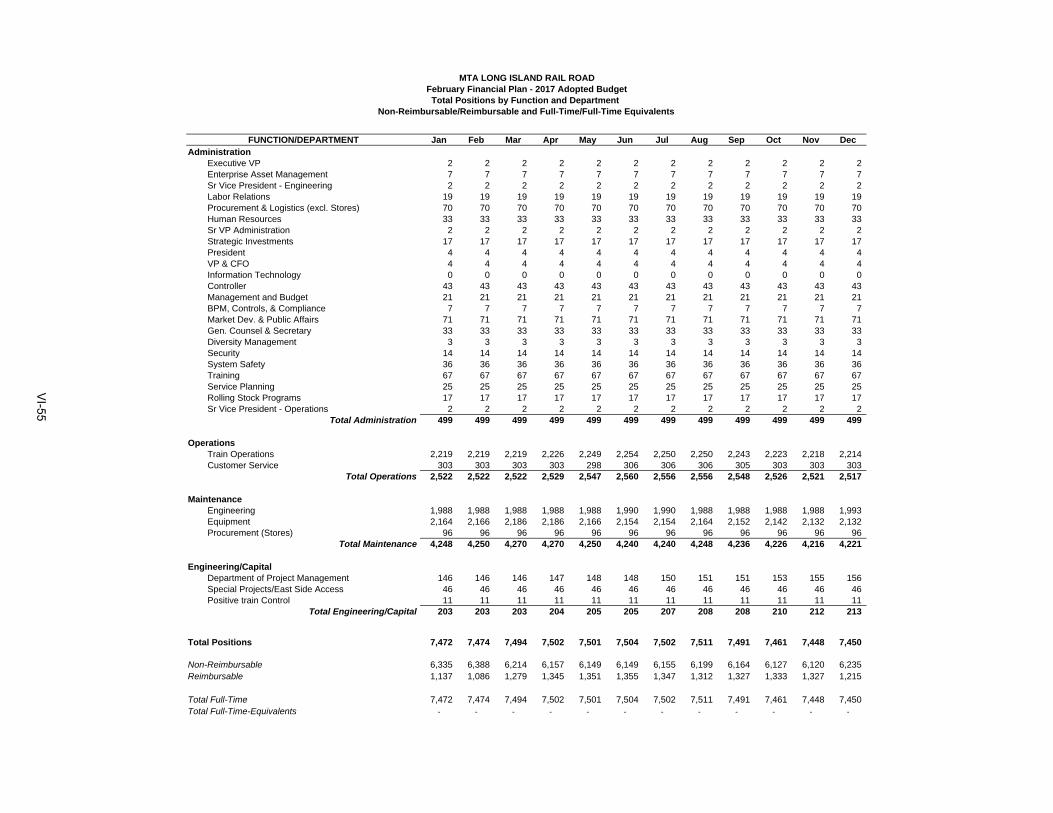
Jan Feb Mar Apr May Jun Jul Aug Sep Oct Nov DecAdministration
Executive VP 2 2 2 2 2 2 2 2 2 2 2 2Enterprise Asset Management 7 7 7 7 7 7 7 7 7 7 7 7Sr Vice President - Engineering 2 2 2 2 2 2 2 2 2 2 2 2Labor Relations 19 19 19 19 19 19 19 19 19 19 19 19Procurement & Logistics (excl. Stores) 70 70 70 70 70 70 70 70 70 70 70 70Human Resources 33 33 33 33 33 33 33 33 33 33 33 33Sr VP Administration 2 2 2 2 2 2 2 2 2 2 2 2Strategic Investments 17 17 17 17 17 17 17 17 17 17 17 17President 4 4 4 4 4 4 4 4 4 4 4 4VP & CFO 4 4 4 4 4 4 4 4 4 4 4 4Information Technology 0 0 0 0 0 0 0 0 0 0 0 0Controller 43 43 43 43 43 43 43 43 43 43 43 43Management and Budget 21 21 21 21 21 21 21 21 21 21 21 21BPM, Controls, & Compliance 7 7 7 7 7 7 7 7 7 7 7 7Market Dev. & Public Affairs 71 71 71 71 71 71 71 71 71 71 71 71Gen. Counsel & Secretary 33 33 33 33 33 33 33 33 33 33 33 33Diversity Management 3 3 3 3 3 3 3 3 3 3 3 3Security 14 14 14 14 14 14 14 14 14 14 14 14System Safety 36 36 36 36 36 36 36 36 36 36 36 36Training 67 67 67 67 67 67 67 67 67 67 67 67Service Planning 25 25 25 25 25 25 25 25 25 25 25 25Rolling Stock Programs 17 17 17 17 17 17 17 17 17 17 17 17Sr Vice President - Operations 2 2 2 2 2 2 2 2 2 2 2 2
Total Administration 499 499 499 499 499 499 499 499 499 499 499 499
OperationsTrain Operations 2,219 2,219 2,219 2,226 2,249 2,254 2,250 2,250 2,243 2,223 2,218 2,214Customer Service 303 303 303 303 298 306 306 306 305 303 303 303
Total Operations 2,522 2,522 2,522 2,529 2,547 2,560 2,556 2,556 2,548 2,526 2,521 2,517
MaintenanceEngineering 1,988 1,988 1,988 1,988 1,988 1,990 1,990 1,988 1,988 1,988 1,988 1,993Equipment 2,164 2,166 2,186 2,186 2,166 2,154 2,154 2,164 2,152 2,142 2,132 2,132Procurement (Stores) 96 96 96 96 96 96 96 96 96 96 96 96
Total Maintenance 4,248 4,250 4,270 4,270 4,250 4,240 4,240 4,248 4,236 4,226 4,216 4,221
Engineering/CapitalDepartment of Project Management 146 146 146 147 148 148 150 151 151 153 155 156Special Projects/East Side Access 46 46 46 46 46 46 46 46 46 46 46 46Positive train Control 11 11 11 11 11 11 11 11 11 11 11 11
Total Engineering/Capital 203 203 203 204 205 205 207 208 208 210 212 213
Total Positions 7,472 7,474 7,494 7,502 7,501 7,504 7,502 7,511 7,491 7,461 7,448 7,450
Non-Reimbursable 6,335 6,388 6,214 6,157 6,149 6,149 6,155 6,199 6,164 6,127 6,120 6,235Reimbursable 1,137 1,086 1,279 1,345 1,351 1,355 1,347 1,312 1,327 1,333 1,327 1,215
Total Full-Time 7,472 7,474 7,494 7,502 7,501 7,504 7,502 7,511 7,491 7,461 7,448 7,450Total Full-Time-Equivalents - - - - - - - - - - - -
FUNCTION/DEPARTMENT
MTA LONG ISLAND RAIL ROADFebruary Financial Plan - 2017 Adopted BudgetTotal Positions by Function and Department
Non-Reimbursable/Reimbursable and Full-Time/Full-Time Equivalents
VI-55
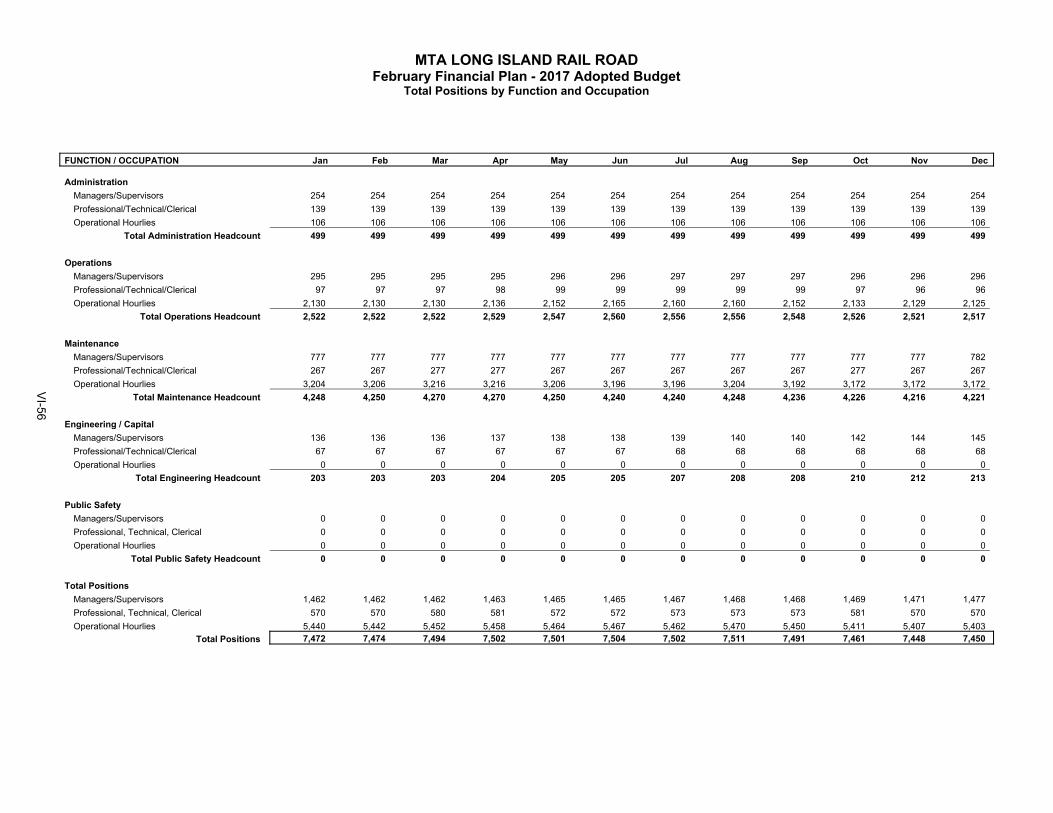
MTA LONG ISLAND RAIL ROADFebruary Financial Plan - 2017 Adopted Budget
Total Positions by Function and Occupation
FUNCTION / OCCUPATION Jan Feb Mar Apr May Jun Jul Aug Sep Oct Nov Dec
AdministrationManagers/Supervisors 254 254 254 254 254 254 254 254 254 254 254 254 Professional/Technical/Clerical 139 139 139 139 139 139 139 139 139 139 139 139 Operational Hourlies 106 106 106 106 106 106 106 106 106 106 106 106
Total Administration Headcount 499 499 499 499 499 499 499 499 499 499 499 499
OperationsManagers/Supervisors 295 295 295 295 296 296 297 297 297 296 296 296 Professional/Technical/Clerical 97 97 97 98 99 99 99 99 99 97 96 96 Operational Hourlies 2,130 2,130 2,130 2,136 2,152 2,165 2,160 2,160 2,152 2,133 2,129 2,125
Total Operations Headcount 2,522 2,522 2,522 2,529 2,547 2,560 2,556 2,556 2,548 2,526 2,521 2,517
MaintenanceManagers/Supervisors 777 777 777 777 777 777 777 777 777 777 777 782 Professional/Technical/Clerical 267 267 277 277 267 267 267 267 267 277 267 267 Operational Hourlies 3,204 3,206 3,216 3,216 3,206 3,196 3,196 3,204 3,192 3,172 3,172 3,172
Total Maintenance Headcount 4,248 4,250 4,270 4,270 4,250 4,240 4,240 4,248 4,236 4,226 4,216 4,221
Engineering / CapitalManagers/Supervisors 136 136 136 137 138 138 139 140 140 142 144 145 Professional/Technical/Clerical 67 67 67 67 67 67 68 68 68 68 68 68 Operational Hourlies 0 0 0 0 0 0 0 0 0 0 0 0
Total Engineering Headcount 203 203 203 204 205 205 207 208 208 210 212 213
Public SafetyManagers/Supervisors 0 0 0 0 0 0 0 0 0 0 0 0 Professional, Technical, Clerical 0 0 0 0 0 0 0 0 0 0 0 0 Operational Hourlies 0 0 0 0 0 0 0 0 0 0 0 0
Total Public Safety Headcount 0 0 0 0 0 0 0 0 0 0 0 0
Total PositionsManagers/Supervisors 1,462 1,462 1,462 1,463 1,465 1,465 1,467 1,468 1,468 1,469 1,471 1,477 Professional, Technical, Clerical 570 570 580 581 572 572 573 573 573 581 570 570 Operational Hourlies 5,440 5,442 5,452 5,458 5,464 5,467 5,462 5,470 5,450 5,411 5,407 5,403
Total Positions 7,472 7,474 7,494 7,502 7,501 7,504 7,502 7,511 7,491 7,461 7,448 7,450
VI-56

Metro-North Railroad

MTA METRO-NORTH RAILROAD FEBRUARY FINANCIAL PLAN FOR 2017-2020
2016 FINAL ESTIMATE AND 2017 ADOPTED BUDGET
In accordance with MTA-approved budget procedures, the following information presents MTA Metro-North Railroad’s (MNR) 2016 Final Estimate, 2017 Adopted Budget, and the Financial Plan for 2017-2020. The Adopted Budget reflects the inclusion of MTA Adjustments that were presented in the December Financial Plan, and adopted by the Board in December 2016, as well as other technical adjustments. These adjustments, which are described below, are also presented in the reconciliation schedules from the November Financial Plan included with this submission. An average 4% fare increase was approved at the January 2017 MTA Board meeting and
will go into effect on March 19,2017 results in increased Farebox revenues of $13.3 million in 2017, $16.8 million in 2018, $17.0 million in 2019, and $17.2 million in 2020. The increased Farebox revenues also result in increased credit card transaction costs. These are forecasted to be $0.2 million in 2017 and in the following years.
Starting in 2017, West of Hudson ticket sales collected by New Jersey Transit, averaging $15.5 million annually, will be reclassified Farebox Revenues from Other Business Expenses. This shift neither changes the botton line or impacts subsidies.
Effective January 2017, MTA Information Technology will oversee the management of
mobile devices, including service support on behalf of Metro-North Railroad. Accordingly, this adjustment reflects a shift of $1.0 million in annual expenses and one position to MTA Headquarters. The cost reduction to MNR is offset by a chargeback from MTA IT to facilitate proper invoicing to the Connecticut Department of Transportion (CDOT).
Effective January 2017, non-core Agency procurement functions will be consolidated into a
centralized organizational structure at MTA Headquarters (HQ). This consolidation is expected to yield contract savings and other efficiency savings. The Plan has captured some preliminary contract savings. The February Plan reflects a shift of four authorized positions in support of centralized operations from MNR to HQ. It is expected that all related positions will be transferred during the first six months of 2017. For the monthly reporting of expenses and positions, the Plan assumes an effective shift date of April 1, 2017. This is the projected median transfer date, with half of the transfers presumed to take place by then; thereby approximating average expense and headcount levels over the first six months of 2017. While the labor cost of these employees will be assumed by HQ, they are expected to be billed back and expensed within each Agencies’ Professional Services.
The impact from a New York State Public Service Commission ruling on Con Edison rates
for the delivery of New York Power Authority supplied power to NYPA governmental customers results in reductions to Electric Power costs of $0.8 million in 2017, $1.7 million in 2018, $2.7 million in 2019 and 2020.
VI-57
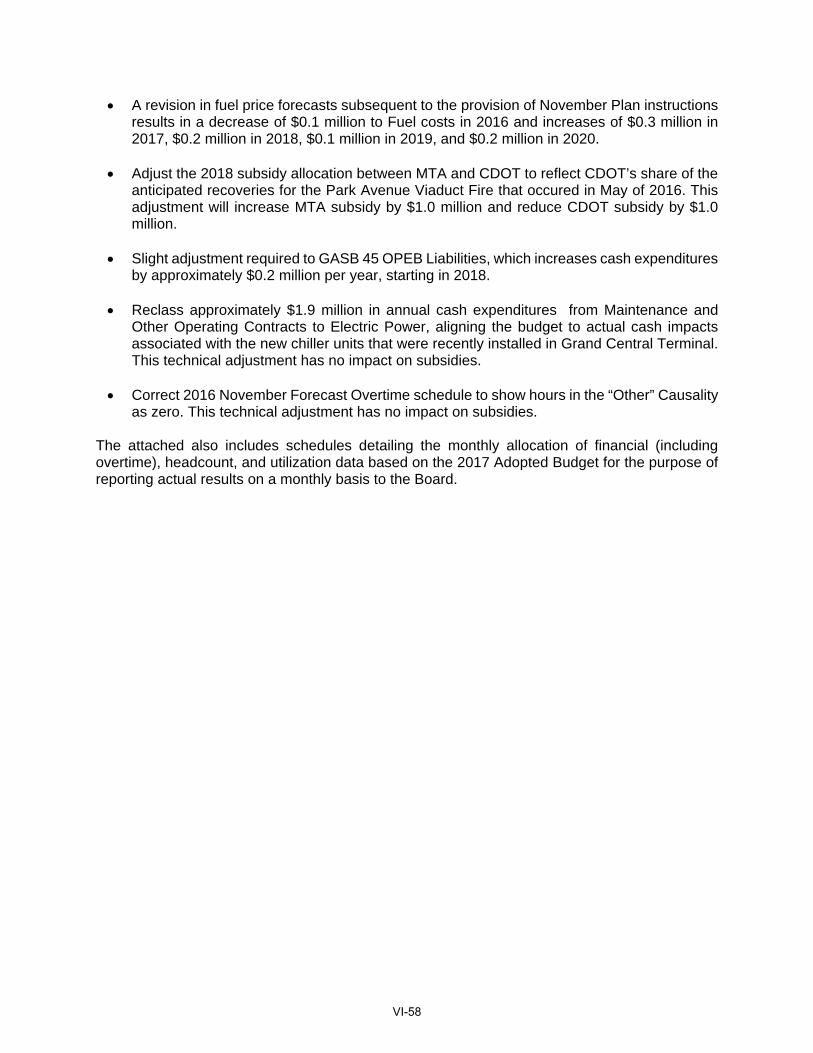
A revision in fuel price forecasts subsequent to the provision of November Plan instructions results in a decrease of $0.1 million to Fuel costs in 2016 and increases of $0.3 million in 2017, $0.2 million in 2018, $0.1 million in 2019, and $0.2 million in 2020.
Adjust the 2018 subsidy allocation between MTA and CDOT to reflect CDOT’s share of the
anticipated recoveries for the Park Avenue Viaduct Fire that occured in May of 2016. This adjustment will increase MTA subsidy by $1.0 million and reduce CDOT subsidy by $1.0 million.
Slight adjustment required to GASB 45 OPEB Liabilities, which increases cash expenditures
by approximately $0.2 million per year, starting in 2018.
Reclass approximately $1.9 million in annual cash expenditures from Maintenance and Other Operating Contracts to Electric Power, aligning the budget to actual cash impacts associated with the new chiller units that were recently installed in Grand Central Terminal. This technical adjustment has no impact on subsidies.
Correct 2016 November Forecast Overtime schedule to show hours in the “Other” Causality
as zero. This technical adjustment has no impact on subsidies.
The attached also includes schedules detailing the monthly allocation of financial (including overtime), headcount, and utilization data based on the 2017 Adopted Budget for the purpose of reporting actual results on a monthly basis to the Board.
VI-58

Positions Dollars Positions Dollars Positions Dollars Positions Dollars Positions Dollars
2016 November Financial Plan: Net Surplus/(Deficit) 6,300 ($762.279) 6,250 ($818.486) 6,234 ($846.983) 6,252 ($874.519) 6,252 ($891.432)
Technical Adjustments:Record West of Hudson Farebox Revenue - Offset Expense Payment to New Jersey Transit - $0.000 $15.149 $15.529 $15.834 $16.038Increase Expense Payment to New Jersey Transit - Offset Farebox Revenue - - (15.149) (15.529) (15.834) (16.038) Transfer Mobile Device Support to MTA IT - - 1 1.596 1 1.633 1 1.673 1 1.716 MTA IT Mobile Device Support Allocation for CDOT Invoicing - - (0.610) (0.624) (0.639) (0.655) Farebox Revenue Credit Card Fees - - (0.192) (0.242) (0.245) (0.248)
Sub-Total Technical Adjustments 0 $0.000 1 $0.795 1 $0.767 1 $0.789 1 $0.812
MTA Plan Adjustments:
2017 Fare/Toll Increase $13.268 $16.761 $16.969 $17.178
MTA Re-estimates:Procurement Consolidation 4 4 4 4Con Edison Rate Case 0.801 1.674 2.652 2.652 Fuel Re-estimates 0.095 (0.304) (0.217) (0.076) (0.162)
Other:
Sub-Total MTA Plan Adjustments 0 $0.095 4 $13.765 4 $18.218 4 $19.545 4 $19.668
2017 February Financial Plan: Net Surplus/(Deficit) 6,300 ($762.184) 6,245 ($803.927) 6,229 ($827.999) 6,247 ($854.186) 6,247 ($870.952)
MTA METRO-NORTH RAILROADFebruary Financial Plan 2017 - 2020
Reconciliation to the November Plan (Accrual) Non-Reimbursable($ in millions)
Favorable/(Unfavorable)2016 2017 2018 2019 2020
VI-59

Positions Dollars Positions Dollars Positions Dollars Positions Dollars Positions Dollars
2016 November Financial Plan: Net Surplus/(Deficit) 536 $0.000 721 $0.000 762 $0.000 748 $0.000 750 $0.000
Technical Adjustments:
Sub-Total Technical Adjustments 0 $0.000 0 $0.000 0 $0.000 0 $0.000 0 $0.000
MTA Plan Adjustments:
2017 Fare/Toll Increase
MTA Re-estimates:Procurement ConsolidationCon Edison Rate CaseFuel Re-estimates
Other:
Sub-Total MTA Plan Adjustments 0 $0.000 0 $0.000 0 $0.000 0 $0.000 0 $0.000
2017 February Financial Plan: Net Surplus/(Deficit) 536 $0.000 721 $0.000 762 $0.000 748 $0.000 750 $0.000
MTA METRO NORTH RAILROADFebruary Financial Plan 2017 - 2020
Reconciliation to the November Plan (Accrual) Reimbursable($ in millions)
Favorable/(Unfavorable)2016 2017 2018 2019 2020
VI-60

Positions Dollars Positions Dollars Positions Dollars Positions Dollars Positions Dollars
2016 November Financial Plan: Net Cash Surplus/(Deficit) 6,836 ($543.065) 6,971 ($565.444) 6,996 ($584.559) 7,000 ($579.025) 7,002 ($632.278)
Technical Adjustments:
Remove West of Hudson Farebox Revenue Increase - Non-Reimbursable Change Only ($15.149) ($15.529) ($15.834) ($16.038)
Remove New Jersey Transit Expense Increase - Non-Reimbursable Change Only 15.149 15.529 15.834 16.038Transfer Mobile Device Support to MTA IT 1 1.596 1 1.633 1 1.673 1 1.716MTA IT Mobile Device Support Allocation for CDOT Invoicing (0.610) (0.624) (0.639) (0.655)Farebox Revenue Credit Card Fees (0.192) (0.242) (0.245) (0.248)GASB 45 Incremental Cash Contribution (0.160) (0.200) (0.200)NYPA Loan Repayment - Increase Electric Power (1.901) (1.901) (1.901) (1.901)NYPA Loan Repayment - Decrease Maintenance and Other Contracts 1.901 1.901 1.901 1.901 MTA Subsidy Allocation - Anticipated Recoveries Park Avenue Viaduct Fire (1.000)CDOT Subsidy Allocation - Anticipated Recoveries Park Avenue Viaduct Fire 1.000System Adjustments 0.001 0.001 0.003 (0.001) 0.000
Sub-Total Technical Adjustments 0 $0.001 1 $0.795 1 $0.609 1 $0.587 1 $0.612
MTA Plan Adjustments:
2017 Fare/Toll Increase $13.268 $16.761 $16.969 $17.178
MTA Re-estimates:Procurement Consolidation 4 4 4 4Con Edison Rate Case - 0.801 1.674 2.652 2.652 Fuel Re-estimates 0.095 (0.304) (0.217) (0.076) (0.162)
Sub-Total MTA Plan Adjustments 0 $0.095 4 $13.765 4 $18.218 4 $19.545 4 $19.668
2017 February Financial Plan: Net Cash Surplus/(Deficit) 6,836 ($542.970) 6,966 ($550.884) 6,991 ($565.731) 6,995 ($558.893) 6,997 ($611.997)
MTA METRO-NORTH RAILROADFebruary Financial Plan 2017 - 2020
Reconciliation to the November Plan - (Cash)($ in millions)
Favorable/(Unfavorable)2016 2017 2018 2019 2020
VI-61

NON-REIMBURSABLE
2016 2017
Final Adopted
Estimate Budget 2018 2019 2020
Operating Revenue
Farebox Revenue $687.186 $740.355 $754.924 $761.620 $768.544
Other Operating Revenue 63.475 68.250 68.698 68.775 68.881
MNR - MTA 0.000 0.000 0.000 0.000 0.000
MNR - CDOT 0.000 0.000 0.000 0.000 0.000
MNR - Other 0.000 0.000 0.000 0.000 0.000
Capital and Other Reimbursements 0.000 0.000 0.000 0.000 0.000
Total Revenue $750.661 $808.605 $823.622 $830.394 $837.424
Operating Expenses
Labor:
Payroll $484.593 $495.685 $517.230 $532.165 $542.249
Overtime 93.870 97.352 98.921 100.899 102.915
Health and Welfare 104.403 107.144 112.279 118.340 117.410
OPEB Current Payment 30.500 31.200 32.000 33.000 34.000
Pensions 94.070 98.766 100.929 102.178 103.785
Other Fringe Benefits 116.116 118.284 122.537 125.706 127.861
Reimbursable Overhead (45.071) (59.303) (60.706) (61.787) (62.654)
Total Labor Expenses $878.480 $889.128 $923.191 $950.501 $965.565
Non-Labor:
Electric Power $64.402 $78.711 $80.448 $81.016 $87.823
Fuel 14.811 17.460 18.171 19.431 20.756
Insurance 18.998 20.661 22.338 24.316 26.446
Claims 3.472 1.000 1.000 1.000 1.000
Paratransit Service Contracts 0.000 0.000 0.000 0.000 0.000
Maintenance and Other Operating Contracts 116.274 123.473 123.420 125.525 129.222
Professional Service Contracts 37.313 44.668 46.043 42.877 43.325
Materials & Supplies 83.580 94.845 101.284 99.576 98.883
Other Business Expenses 13.874 32.078 23.817 34.629 36.147
Total Non-Labor $352.723 $412.896 $416.521 $428.370 $443.603
Other Expenses Adjustments:
Other $0.000 $0.000 $0.000 $0.000 $0.000
Total Other Expense Adjustments $0.000 $0.000 $0.000 $0.000 $0.000
Total Expenses before Depreciation and GASB Adjs. $1,231.204 $1,302.024 $1,339.711 $1,378.871 $1,409.167
Depreciation $231.305 $240.693 $240.693 $240.693 $240.693
OPEB Obligation 68.316 68.316 68.316 68.316 68.316
GASB 68 Pension Adjustment (21.688) (2.500) (1.100) (7.300) (13.800)
Environmental Remediation 3.708 4.000 4.000 4.000 4.000
Total Expenses $1,512.844 $1,612.533 $1,651.621 $1,684.580 $1,708.376
Net Surplus/(Deficit) ($762.184) ($803.927) ($827.999) ($854.186) ($870.952)
Cash Conversion Adjustments:
Depreciation $231.305 $240.693 $240.693 $240.693 $240.693Operating Capital (41.583) (61.019) (42.274) (14.346) (12.927)Other Cash Adjustments 29.492 73.369 63.848 68.946 31.189Total Cash Conversion Adjustments $219.214 $253.043 $262.267 $295.293 $258.955
Net Cash Surplus/(Deficit) ($542.970) ($550.884) ($565.731) ($558.893) ($611.997)
MTA METRO-NORTH RAILROADFebruary Financial Plan 2017 - 2020
Accrual Statement of Operations by Category
($ in millions)
VI-62
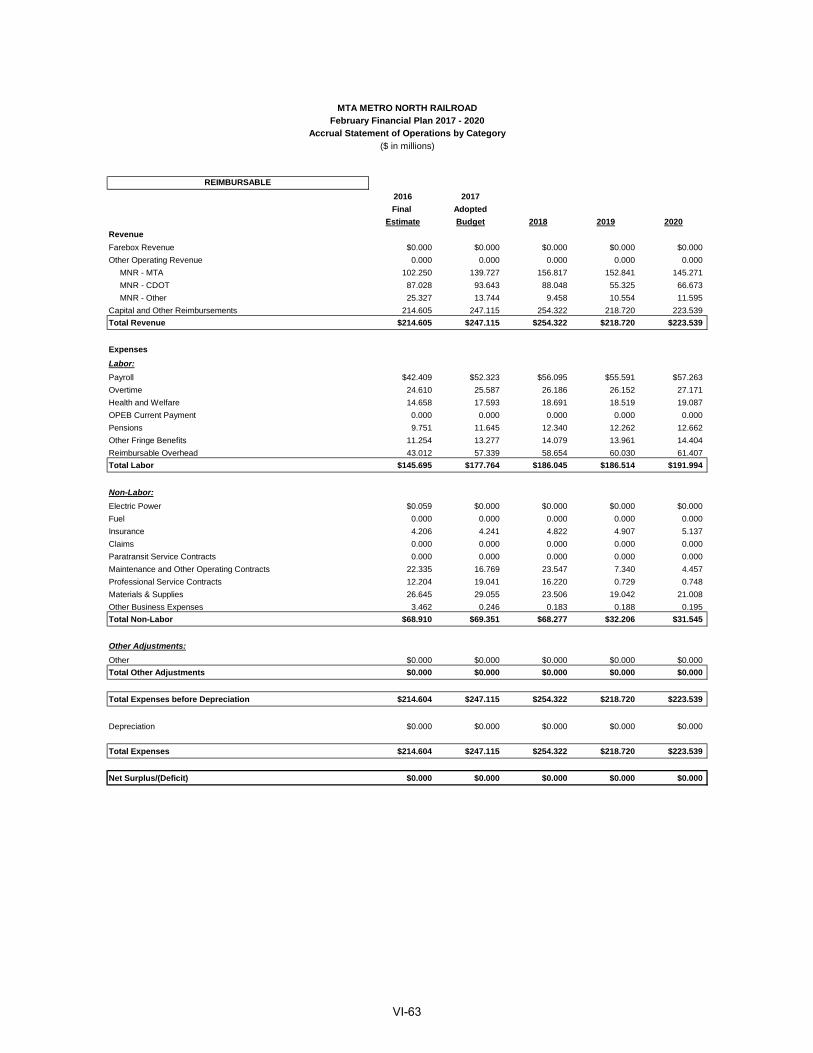
REIMBURSABLE
2016 2017
Final Adopted
Estimate Budget 2018 2019 2020
Revenue
Farebox Revenue $0.000 $0.000 $0.000 $0.000 $0.000
Other Operating Revenue 0.000 0.000 0.000 0.000 0.000
MNR - MTA 102.250 139.727 156.817 152.841 145.271
MNR - CDOT 87.028 93.643 88.048 55.325 66.673
MNR - Other 25.327 13.744 9.458 10.554 11.595
Capital and Other Reimbursements 214.605 247.115 254.322 218.720 223.539
Total Revenue $214.605 $247.115 $254.322 $218.720 $223.539
Expenses
Labor:
Payroll $42.409 $52.323 $56.095 $55.591 $57.263
Overtime 24.610 25.587 26.186 26.152 27.171
Health and Welfare 14.658 17.593 18.691 18.519 19.087
OPEB Current Payment 0.000 0.000 0.000 0.000 0.000
Pensions 9.751 11.645 12.340 12.262 12.662
Other Fringe Benefits 11.254 13.277 14.079 13.961 14.404
Reimbursable Overhead 43.012 57.339 58.654 60.030 61.407
Total Labor $145.695 $177.764 $186.045 $186.514 $191.994
Non-Labor:
Electric Power $0.059 $0.000 $0.000 $0.000 $0.000
Fuel 0.000 0.000 0.000 0.000 0.000
Insurance 4.206 4.241 4.822 4.907 5.137
Claims 0.000 0.000 0.000 0.000 0.000
Paratransit Service Contracts 0.000 0.000 0.000 0.000 0.000
Maintenance and Other Operating Contracts 22.335 16.769 23.547 7.340 4.457
Professional Service Contracts 12.204 19.041 16.220 0.729 0.748
Materials & Supplies 26.645 29.055 23.506 19.042 21.008
Other Business Expenses 3.462 0.246 0.183 0.188 0.195
Total Non-Labor $68.910 $69.351 $68.277 $32.206 $31.545
Other Adjustments:
Other $0.000 $0.000 $0.000 $0.000 $0.000
Total Other Adjustments $0.000 $0.000 $0.000 $0.000 $0.000
Total Expenses before Depreciation $214.604 $247.115 $254.322 $218.720 $223.539
Depreciation $0.000 $0.000 $0.000 $0.000 $0.000
Total Expenses $214.604 $247.115 $254.322 $218.720 $223.539
Net Surplus/(Deficit) $0.000 $0.000 $0.000 $0.000 $0.000
February Financial Plan 2017 - 2020Accrual Statement of Operations by Category
($ in millions)
MTA METRO NORTH RAILROAD
VI-63
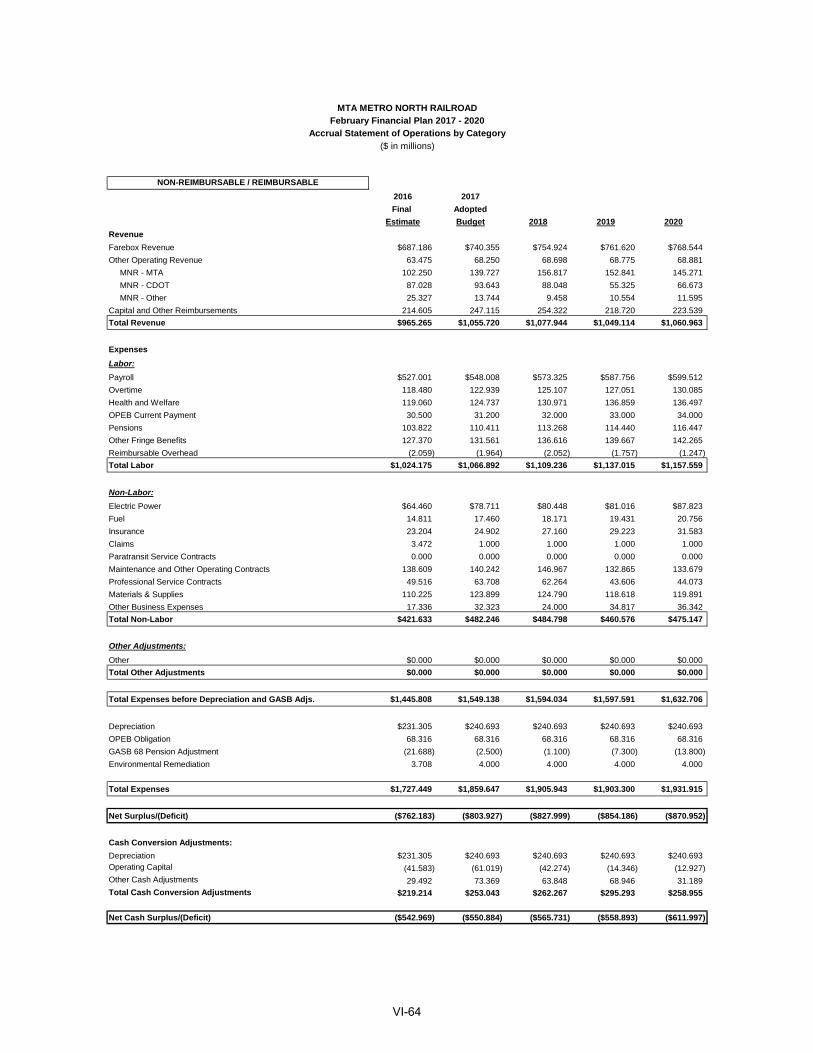
NON-REIMBURSABLE / REIMBURSABLE
2016 2017
Final Adopted
Estimate Budget 2018 2019 2020
Revenue
Farebox Revenue $687.186 $740.355 $754.924 $761.620 $768.544
Other Operating Revenue 63.475 68.250 68.698 68.775 68.881
MNR - MTA 102.250 139.727 156.817 152.841 145.271
MNR - CDOT 87.028 93.643 88.048 55.325 66.673
MNR - Other 25.327 13.744 9.458 10.554 11.595
Capital and Other Reimbursements 214.605 247.115 254.322 218.720 223.539
Total Revenue $965.265 $1,055.720 $1,077.944 $1,049.114 $1,060.963
Expenses
Labor:
Payroll $527.001 $548.008 $573.325 $587.756 $599.512
Overtime 118.480 122.939 125.107 127.051 130.085
Health and Welfare 119.060 124.737 130.971 136.859 136.497
OPEB Current Payment 30.500 31.200 32.000 33.000 34.000
Pensions 103.822 110.411 113.268 114.440 116.447
Other Fringe Benefits 127.370 131.561 136.616 139.667 142.265
Reimbursable Overhead (2.059) (1.964) (2.052) (1.757) (1.247)
Total Labor $1,024.175 $1,066.892 $1,109.236 $1,137.015 $1,157.559
Non-Labor:
Electric Power $64.460 $78.711 $80.448 $81.016 $87.823
Fuel 14.811 17.460 18.171 19.431 20.756
Insurance 23.204 24.902 27.160 29.223 31.583
Claims 3.472 1.000 1.000 1.000 1.000
Paratransit Service Contracts 0.000 0.000 0.000 0.000 0.000
Maintenance and Other Operating Contracts 138.609 140.242 146.967 132.865 133.679
Professional Service Contracts 49.516 63.708 62.264 43.606 44.073
Materials & Supplies 110.225 123.899 124.790 118.618 119.891
Other Business Expenses 17.336 32.323 24.000 34.817 36.342
Total Non-Labor $421.633 $482.246 $484.798 $460.576 $475.147
Other Adjustments:
Other $0.000 $0.000 $0.000 $0.000 $0.000
Total Other Adjustments $0.000 $0.000 $0.000 $0.000 $0.000
Total Expenses before Depreciation and GASB Adjs. $1,445.808 $1,549.138 $1,594.034 $1,597.591 $1,632.706
Depreciation $231.305 $240.693 $240.693 $240.693 $240.693
OPEB Obligation 68.316 68.316 68.316 68.316 68.316
GASB 68 Pension Adjustment (21.688) (2.500) (1.100) (7.300) (13.800)
Environmental Remediation 3.708 4.000 4.000 4.000 4.000
Total Expenses $1,727.449 $1,859.647 $1,905.943 $1,903.300 $1,931.915
Net Surplus/(Deficit) ($762.183) ($803.927) ($827.999) ($854.186) ($870.952)
Cash Conversion Adjustments:
Depreciation $231.305 $240.693 $240.693 $240.693 $240.693Operating Capital (41.583) (61.019) (42.274) (14.346) (12.927)Other Cash Adjustments 29.492 73.369 63.848 68.946 31.189Total Cash Conversion Adjustments $219.214 $253.043 $262.267 $295.293 $258.955
Net Cash Surplus/(Deficit) ($542.969) ($550.884) ($565.731) ($558.893) ($611.997)
MTA METRO NORTH RAILROADFebruary Financial Plan 2017 - 2020
Accrual Statement of Operations by Category
($ in millions)
VI-64
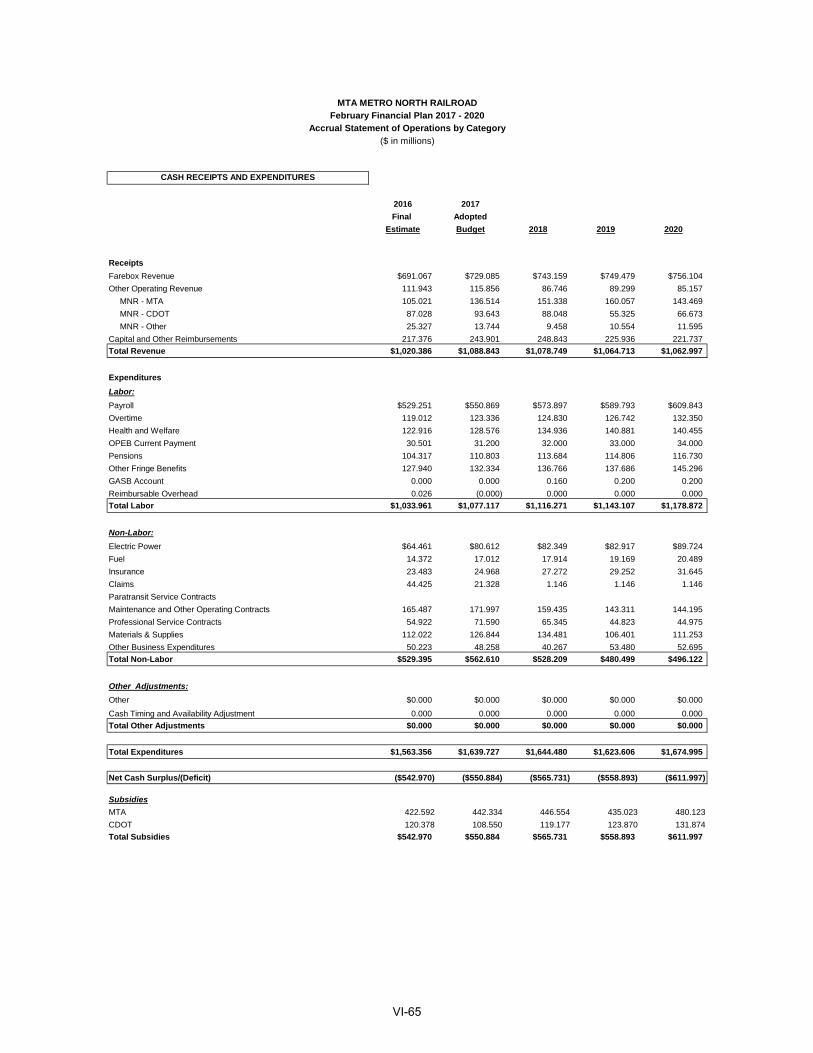
CASH RECEIPTS AND EXPENDITURES
2016 2017
Final Adopted
Estimate Budget 2018 2019 2020
Receipts
Farebox Revenue $691.067 $729.085 $743.159 $749.479 $756.104
Other Operating Revenue 111.943 115.856 86.746 89.299 85.157
MNR - MTA 105.021 136.514 151.338 160.057 143.469
MNR - CDOT 87.028 93.643 88.048 55.325 66.673
MNR - Other 25.327 13.744 9.458 10.554 11.595
Capital and Other Reimbursements 217.376 243.901 248.843 225.936 221.737
Total Revenue $1,020.386 $1,088.843 $1,078.749 $1,064.713 $1,062.997
Expenditures
Labor:
Payroll $529.251 $550.869 $573.897 $589.793 $609.843
Overtime 119.012 123.336 124.830 126.742 132.350
Health and Welfare 122.916 128.576 134.936 140.881 140.455
OPEB Current Payment 30.501 31.200 32.000 33.000 34.000
Pensions 104.317 110.803 113.684 114.806 116.730
Other Fringe Benefits 127.940 132.334 136.766 137.686 145.296
GASB Account 0.000 0.000 0.160 0.200 0.200
Reimbursable Overhead 0.026 (0.000) 0.000 0.000 0.000
Total Labor $1,033.961 $1,077.117 $1,116.271 $1,143.107 $1,178.872
Non-Labor:
Electric Power $64.461 $80.612 $82.349 $82.917 $89.724
Fuel 14.372 17.012 17.914 19.169 20.489
Insurance 23.483 24.968 27.272 29.252 31.645
Claims 44.425 21.328 1.146 1.146 1.146
Paratransit Service Contracts
Maintenance and Other Operating Contracts 165.487 171.997 159.435 143.311 144.195
Professional Service Contracts 54.922 71.590 65.345 44.823 44.975
Materials & Supplies 112.022 126.844 134.481 106.401 111.253
Other Business Expenditures 50.223 48.258 40.267 53.480 52.695
Total Non-Labor $529.395 $562.610 $528.209 $480.499 $496.122
Other Adjustments:
Other $0.000 $0.000 $0.000 $0.000 $0.000
Cash Timing and Availability Adjustment 0.000 0.000 0.000 0.000 0.000
Total Other Adjustments $0.000 $0.000 $0.000 $0.000 $0.000
Total Expenditures $1,563.356 $1,639.727 $1,644.480 $1,623.606 $1,674.995
Net Cash Surplus/(Deficit) ($542.970) ($550.884) ($565.731) ($558.893) ($611.997)
Subsidies
MTA 422.592 442.334 446.554 435.023 480.123
CDOT 120.378 108.550 119.177 123.870 131.874
Total Subsidies $542.970 $550.884 $565.731 $558.893 $611.997
MTA METRO NORTH RAILROADFebruary Financial Plan 2017 - 2020
Accrual Statement of Operations by Category
($ in millions)
VI-65
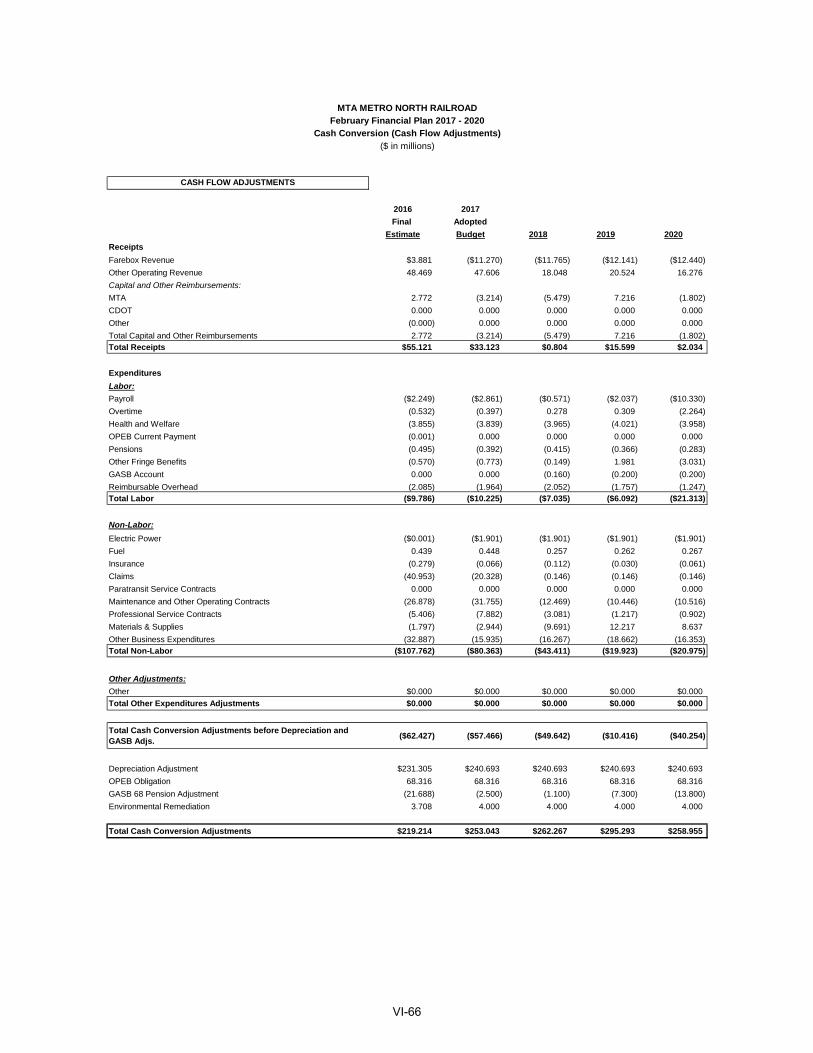
CASH FLOW ADJUSTMENTS
2016 2017
Final Adopted
Estimate Budget 2018 2019 2020
Receipts
Farebox Revenue $3.881 ($11.270) ($11.765) ($12.141) ($12.440)
Other Operating Revenue 48.469 47.606 18.048 20.524 16.276
Capital and Other Reimbursements:
MTA 2.772 (3.214) (5.479) 7.216 (1.802)
CDOT 0.000 0.000 0.000 0.000 0.000
Other (0.000) 0.000 0.000 0.000 0.000
Total Capital and Other Reimbursements 2.772 (3.214) (5.479) 7.216 (1.802)Total Receipts $55.121 $33.123 $0.804 $15.599 $2.034
Expenditures
Labor:
Payroll ($2.249) ($2.861) ($0.571) ($2.037) ($10.330)
Overtime (0.532) (0.397) 0.278 0.309 (2.264)
Health and Welfare (3.855) (3.839) (3.965) (4.021) (3.958)
OPEB Current Payment (0.001) 0.000 0.000 0.000 0.000
Pensions (0.495) (0.392) (0.415) (0.366) (0.283)
Other Fringe Benefits (0.570) (0.773) (0.149) 1.981 (3.031)
GASB Account 0.000 0.000 (0.160) (0.200) (0.200)
Reimbursable Overhead (2.085) (1.964) (2.052) (1.757) (1.247)Total Labor ($9.786) ($10.225) ($7.035) ($6.092) ($21.313)
Non-Labor:
Electric Power ($0.001) ($1.901) ($1.901) ($1.901) ($1.901)
Fuel 0.439 0.448 0.257 0.262 0.267
Insurance (0.279) (0.066) (0.112) (0.030) (0.061)
Claims (40.953) (20.328) (0.146) (0.146) (0.146)
Paratransit Service Contracts 0.000 0.000 0.000 0.000 0.000
Maintenance and Other Operating Contracts (26.878) (31.755) (12.469) (10.446) (10.516)
Professional Service Contracts (5.406) (7.882) (3.081) (1.217) (0.902)
Materials & Supplies (1.797) (2.944) (9.691) 12.217 8.637
Other Business Expenditures (32.887) (15.935) (16.267) (18.662) (16.353)Total Non-Labor ($107.762) ($80.363) ($43.411) ($19.923) ($20.975)
Other Adjustments:
Other $0.000 $0.000 $0.000 $0.000 $0.000
Total Other Expenditures Adjustments $0.000 $0.000 $0.000 $0.000 $0.000
Total Cash Conversion Adjustments before Depreciation and GASB Adjs.
($62.427) ($57.466) ($49.642) ($10.416) ($40.254)
Depreciation Adjustment $231.305 $240.693 $240.693 $240.693 $240.693
OPEB Obligation 68.316 68.316 68.316 68.316 68.316
GASB 68 Pension Adjustment (21.688) (2.500) (1.100) (7.300) (13.800)
Environmental Remediation 3.708 4.000 4.000 4.000 4.000
Total Cash Conversion Adjustments $219.214 $253.043 $262.267 $295.293 $258.955
MTA METRO NORTH RAILROADFebruary Financial Plan 2017 - 2020
Cash Conversion (Cash Flow Adjustments)
($ in millions)
VI-66

MTA METRO-NORTH RAILROAD2017 Adopted Budget
Non-Reimbursable/Reimbursable Overtime ($ in millions)
NON-REIMBURSABLE OVERTIME Hours $ %
Scheduled Service 583,792 $36.070 37.1%
Unscheduled Service 0 $0.000 0.0%
Programmatic/Routine Maintenance 618,069 $35.067 36.0%
Unscheduled Maintenance 11,381 $0.612 0.6%
Vacancy/Absentee Coverage 342,326 $18.156 18.6%
Weather Emergencies 130,362 $7.446 7.6%
Safety/Security/Law Enforcement 0 $0.000 0.0%
Other 0 $0.000 0.0%
Subtotal 1,685,929 $97.352 100.0%
REIMBURSABLE OVERTIME 427,281 $25.587
TOTAL OVERTIME 2,113,210 $122.939
Total
VI-67
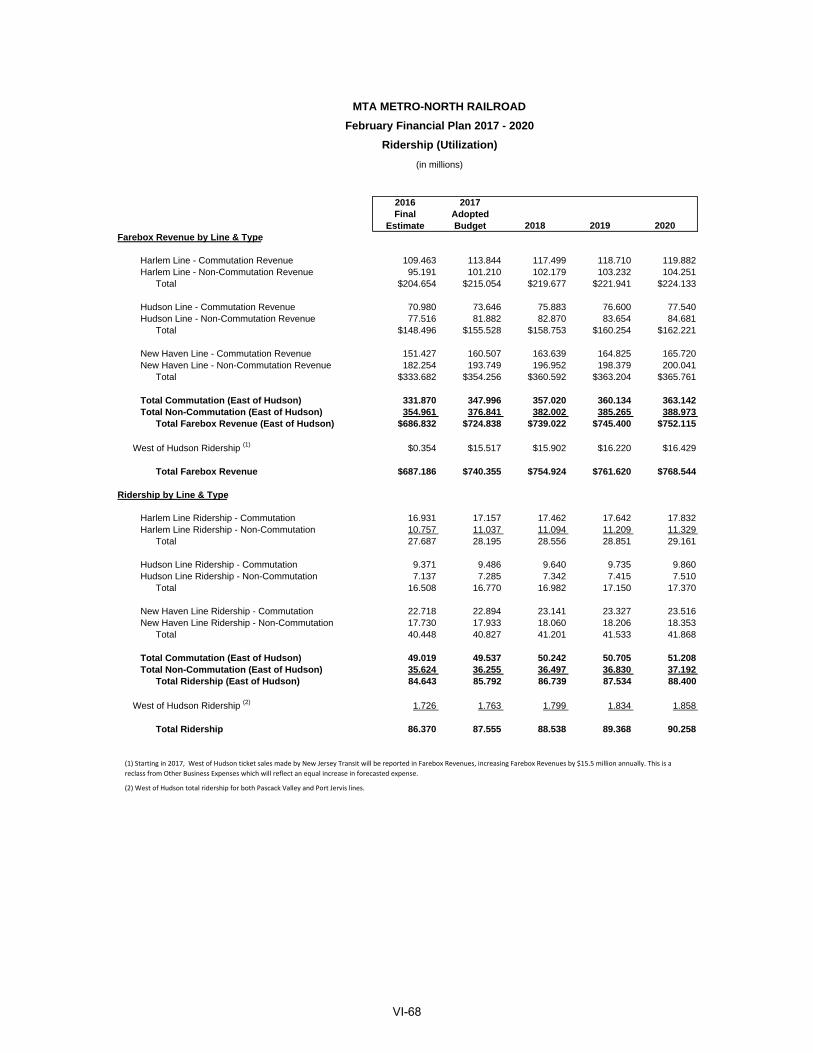
2016 2017Final Adopted
Estimate Budget 2018 2019 2020Farebox Revenue by Line & Type
Harlem Line - Commutation Revenue 109.463 113.844 117.499 118.710 119.882 Harlem Line - Non-Commutation Revenue 95.191 101.210 102.179 103.232 104.251
Total $204.654 $215.054 $219.677 $221.941 $224.133
Hudson Line - Commutation Revenue 70.980 73.646 75.883 76.600 77.540 Hudson Line - Non-Commutation Revenue 77.516 81.882 82.870 83.654 84.681
Total $148.496 $155.528 $158.753 $160.254 $162.221
New Haven Line - Commutation Revenue 151.427 160.507 163.639 164.825 165.720 New Haven Line - Non-Commutation Revenue 182.254 193.749 196.952 198.379 200.041
Total $333.682 $354.256 $360.592 $363.204 $365.761
Total Commutation (East of Hudson) 331.870 347.996 357.020 360.134 363.142 Total Non-Commutation (East of Hudson) 354.961 376.841 382.002 385.265 388.973
Total Farebox Revenue (East of Hudson) $686.832 $724.838 $739.022 $745.400 $752.115
West of Hudson Ridership (1) $0.354 $15.517 $15.902 $16.220 $16.429
Total Farebox Revenue $687.186 $740.355 $754.924 $761.620 $768.544
Ridership by Line & Type
Harlem Line Ridership - Commutation 16.931 17.157 17.462 17.642 17.832 Harlem Line Ridership - Non-Commutation 10.757 11.037 11.094 11.209 11.329
Total 27.687 28.195 28.556 28.851 29.161
Hudson Line Ridership - Commutation 9.371 9.486 9.640 9.735 9.860 Hudson Line Ridership - Non-Commutation 7.137 7.285 7.342 7.415 7.510
Total 16.508 16.770 16.982 17.150 17.370
New Haven Line Ridership - Commutation 22.718 22.894 23.141 23.327 23.516 New Haven Line Ridership - Non-Commutation 17.730 17.933 18.060 18.206 18.353
Total 40.448 40.827 41.201 41.533 41.868
Total Commutation (East of Hudson) 49.019 49.537 50.242 50.705 51.208 Total Non-Commutation (East of Hudson) 35.624 36.255 36.497 36.830 37.192
Total Ridership (East of Hudson) 84.643 85.792 86.739 87.534 88.400
West of Hudson Ridership (2) 1.726 1.763 1.799 1.834 1.858
Total Ridership 86.370 87.555 88.538 89.368 90.258
(2) West of Hudson total ridership for both Pascack Valley and Port Jervis lines.
MTA METRO-NORTH RAILROAD
February Financial Plan 2017 - 2020
Ridership (Utilization)
(in millions)
(1) Starting in 2017, West of Hudson ticket sales made by New Jersey Transit will be reported in Farebox Revenues, increasing Farebox Revenues by $15.5 million annually. This is a
reclass from Other Business Expenses which will reflect an equal increase in forecasted expense.
VI-68
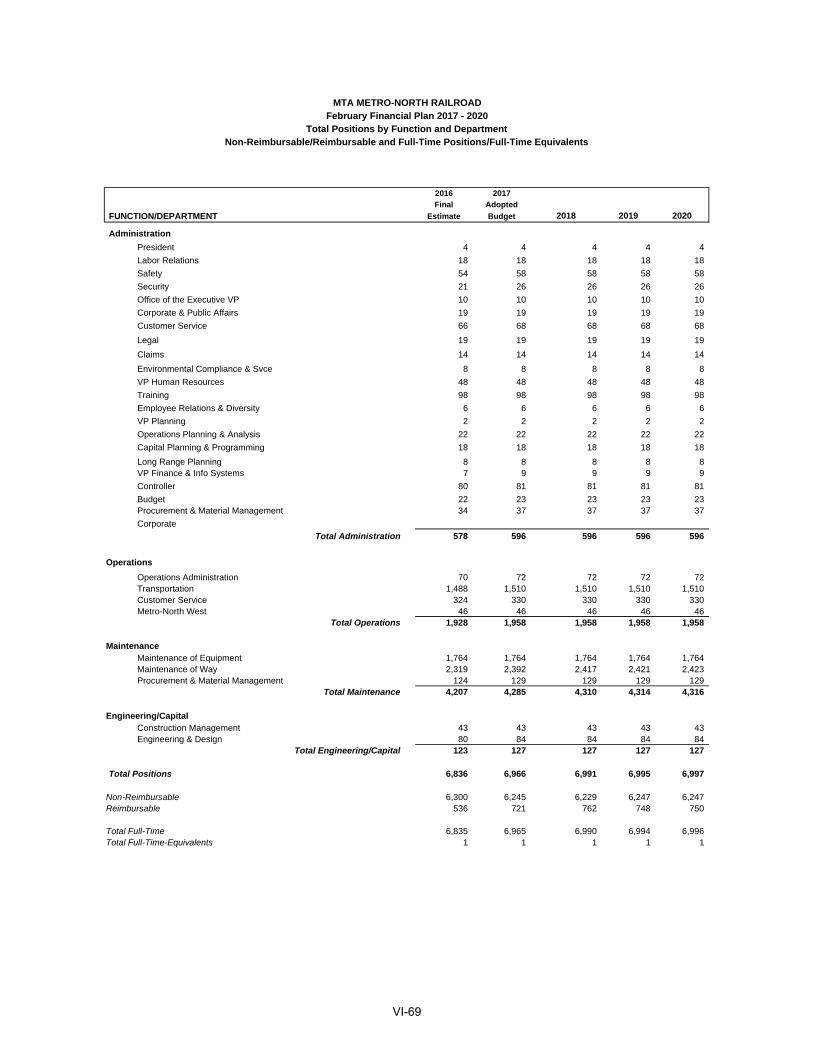
2016 2017
Final Adopted
FUNCTION/DEPARTMENT Estimate Budget 2018 2019 2020
Administration
President 4 4 4 4 4
Labor Relations 18 18 18 18 18
Safety 54 58 58 58 58
Security 21 26 26 26 26
Office of the Executive VP 10 10 10 10 10
Corporate & Public Affairs 19 19 19 19 19
Customer Service 66 68 68 68 68
Legal 19 19 19 19 19
Claims 14 14 14 14 14
Environmental Compliance & Svce 8 8 8 8 8
VP Human Resources 48 48 48 48 48
Training 98 98 98 98 98
Employee Relations & Diversity 6 6 6 6 6
VP Planning 2 2 2 2 2
Operations Planning & Analysis 22 22 22 22 22
Capital Planning & Programming 18 18 18 18 18
Long Range Planning 8 8 8 8 8VP Finance & Info Systems 7 9 9 9 9
Controller 80 81 81 81 81
Budget 22 23 23 23 23Procurement & Material Management 34 37 37 37 37
Corporate
Total Administration 578 596 596 596 596
Operations
Operations Administration 70 72 72 72 72Transportation 1,488 1,510 1,510 1,510 1,510Customer Service 324 330 330 330 330Metro-North West 46 46 46 46 46
Total Operations 1,928 1,958 1,958 1,958 1,958
MaintenanceMaintenance of Equipment 1,764 1,764 1,764 1,764 1,764Maintenance of Way 2,319 2,392 2,417 2,421 2,423Procurement & Material Management 124 129 129 129 129
Total Maintenance 4,207 4,285 4,310 4,314 4,316
Engineering/Capital Construction Management 43 43 43 43 43Engineering & Design 80 84 84 84 84
Total Engineering/Capital 123 127 127 127 127
Total Positions 6,836 6,966 6,991 6,995 6,997
Non-Reimbursable 6,300 6,245 6,229 6,247 6,247Reimbursable 536 721 762 748 750
Total Full-Time 6,835 6,965 6,990 6,994 6,996Total Full-Time-Equivalents 1 1 1 1 1
MTA METRO-NORTH RAILROADFebruary Financial Plan 2017 - 2020
Total Positions by Function and DepartmentNon-Reimbursable/Reimbursable and Full-Time Positions/Full-Time Equivalents
VI-69

2016 2017
Final Adopted
FUNCTION/OCCUPATIONAL GROUP Estimate Budget 2018 2019 2020
Administration Managers/Supervisors 169 176 176 176 176 Professional, Technical, Clerical 409 420 420 420 420 Operational Hourlies
Total Administration 578 596 596 596 596
Operations Managers/Supervisors 230 233 233 233 233 Professional, Technical, Clerical 198 200 200 200 200 Operational Hourlies 1,500 1,525 1,525 1,525 1,525
Total Operations 1,928 1,958 1,958 1,958 1,958
Maintenance Managers/Supervisors 704 717 724 724 724 Professional, Technical, Clerical 539 554 556 557 557 Operational Hourlies 2,964 3,014 3,030 3,033 3,035
Total Maintenance 4,207 4,285 4,310 4,314 4,316
Engineering/Capital Managers/Supervisors 43 44 44 44 44 Professional, Technical, Clerical 80 83 83 83 83 Operational Hourlies
Total Engineering/Capital 123 127 127 127 127
Public Safety Managers/Supervisors Professional, Technical, Clerical Operational Hourlies
Total Public Safety - - - - - Total Positions
Managers/Supervisors 1,146 1,170 1,177 1,177 1,177 Professional, Technical, Clerical 1,226 1,257 1,259 1,260 1,260 Operational Hourlies 4,464 4,539 4,555 4,558 4,560
Total Positions 6,836 6,966 6,991 6,995 6,997
MTA METRO-NORTH RAILROADFebruary Financial Plan 2017 - 2020
Total Positions by Function and Occupational Group
VI-70
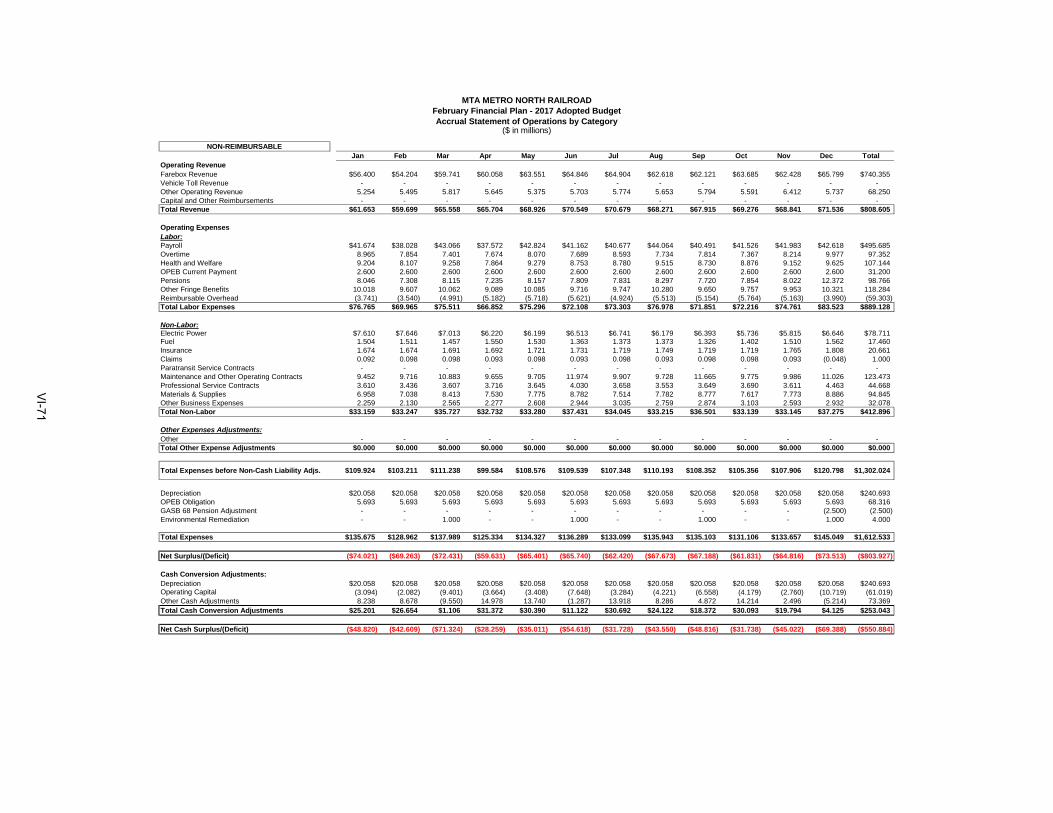
NON-REIMBURSABLEJan Feb Mar Apr May Jun Jul Aug Sep Oct Nov Dec Total
Operating RevenueFarebox Revenue $56.400 $54.204 $59.741 $60.058 $63.551 $64.846 $64.904 $62.618 $62.121 $63.685 $62.428 $65.799 $740.355Vehicle Toll Revenue - - - - - - - - - - - - - Other Operating Revenue 5.254 5.495 5.817 5.645 5.375 5.703 5.774 5.653 5.794 5.591 6.412 5.737 68.250Capital and Other Reimbursements - - - - - - - - - - - - - Total Revenue $61.653 $59.699 $65.558 $65.704 $68.926 $70.549 $70.679 $68.271 $67.915 $69.276 $68.841 $71.536 $808.605
Operating ExpensesLabor:Payroll $41.674 $38.028 $43.066 $37.572 $42.824 $41.162 $40.677 $44.064 $40.491 $41.526 $41.983 $42.618 $495.685Overtime 8.965 7.854 7.401 7.674 8.070 7.689 8.593 7.734 7.814 7.367 8.214 9.977 97.352Health and Welfare 9.204 8.107 9.258 7.864 9.279 8.753 8.780 9.515 8.730 8.876 9.152 9.625 107.144OPEB Current Payment 2.600 2.600 2.600 2.600 2.600 2.600 2.600 2.600 2.600 2.600 2.600 2.600 31.200Pensions 8.046 7.308 8.115 7.235 8.157 7.809 7.831 8.297 7.720 7.854 8.022 12.372 98.766Other Fringe Benefits 10.018 9.607 10.062 9.089 10.085 9.716 9.747 10.280 9.650 9.757 9.953 10.321 118.284Reimbursable Overhead (3.741) (3.540) (4.991) (5.182) (5.718) (5.621) (4.924) (5.513) (5.154) (5.764) (5.163) (3.990) (59.303)Total Labor Expenses $76.765 $69.965 $75.511 $66.852 $75.296 $72.108 $73.303 $76.978 $71.851 $72.216 $74.761 $83.523 $889.128
Non-Labor:Electric Power $7.610 $7.646 $7.013 $6.220 $6.199 $6.513 $6.741 $6.179 $6.393 $5.736 $5.815 $6.646 $78.711Fuel 1.504 1.511 1.457 1.550 1.530 1.363 1.373 1.373 1.326 1.402 1.510 1.562 17.460Insurance 1.674 1.674 1.691 1.692 1.721 1.731 1.719 1.749 1.719 1.719 1.765 1.808 20.661Claims 0.092 0.098 0.098 0.093 0.098 0.093 0.098 0.093 0.098 0.098 0.093 (0.048) 1.000Paratransit Service Contracts - - - - - - - - - - - - - Maintenance and Other Operating Contracts 9.452 9.716 10.883 9.655 9.705 11.974 9.907 9.728 11.665 9.775 9.986 11.026 123.473Professional Service Contracts 3.610 3.436 3.607 3.716 3.645 4.030 3.658 3.553 3.649 3.690 3.611 4.463 44.668Materials & Supplies 6.958 7.038 8.413 7.530 7.775 8.782 7.514 7.782 8.777 7.617 7.773 8.886 94.845Other Business Expenses 2.259 2.130 2.565 2.277 2.608 2.944 3.035 2.759 2.874 3.103 2.593 2.932 32.078Total Non-Labor $33.159 $33.247 $35.727 $32.732 $33.280 $37.431 $34.045 $33.215 $36.501 $33.139 $33.145 $37.275 $412.896
Other Expenses Adjustments:Other - - - - - - - - - - - - - Total Other Expense Adjustments $0.000 $0.000 $0.000 $0.000 $0.000 $0.000 $0.000 $0.000 $0.000 $0.000 $0.000 $0.000 $0.000
Total Expenses before Non-Cash Liability Adjs. $109.924 $103.211 $111.238 $99.584 $108.576 $109.539 $107.348 $110.193 $108.352 $105.356 $107.906 $120.798 $1,302.024
Depreciation $20.058 $20.058 $20.058 $20.058 $20.058 $20.058 $20.058 $20.058 $20.058 $20.058 $20.058 $20.058 $240.693OPEB Obligation 5.693 5.693 5.693 5.693 5.693 5.693 5.693 5.693 5.693 5.693 5.693 5.693 68.316 GASB 68 Pension Adjustment - - - - - - - - - - - (2.500) (2.500) Environmental Remediation - - 1.000 - - 1.000 - - 1.000 - - 1.000 4.000
Total Expenses $135.675 $128.962 $137.989 $125.334 $134.327 $136.289 $133.099 $135.943 $135.103 $131.106 $133.657 $145.049 $1,612.533
Net Surplus/(Deficit) ($74.021) ($69.263) ($72.431) ($59.631) ($65.401) ($65.740) ($62.420) ($67.673) ($67.188) ($61.831) ($64.816) ($73.513) ($803.927)
Cash Conversion Adjustments:Depreciation $20.058 $20.058 $20.058 $20.058 $20.058 $20.058 $20.058 $20.058 $20.058 $20.058 $20.058 $20.058 $240.693Operating Capital (3.094) (2.082) (9.401) (3.664) (3.408) (7.648) (3.284) (4.221) (6.558) (4.179) (2.760) (10.719) (61.019) Other Cash Adjustments 8.238 8.678 (9.550) 14.978 13.740 (1.287) 13.918 8.286 4.872 14.214 2.496 (5.214) 73.369 Total Cash Conversion Adjustments $25.201 $26.654 $1.106 $31.372 $30.390 $11.122 $30.692 $24.122 $18.372 $30.093 $19.794 $4.125 $253.043
Net Cash Surplus/(Deficit) ($48.820) ($42.609) ($71.324) ($28.259) ($35.011) ($54.618) ($31.728) ($43.550) ($48.816) ($31.738) ($45.022) ($69.388) ($550.884)
February Financial Plan - 2017 Adopted BudgetMTA METRO NORTH RAILROAD
Accrual Statement of Operations by Category($ in millions)
VI-71
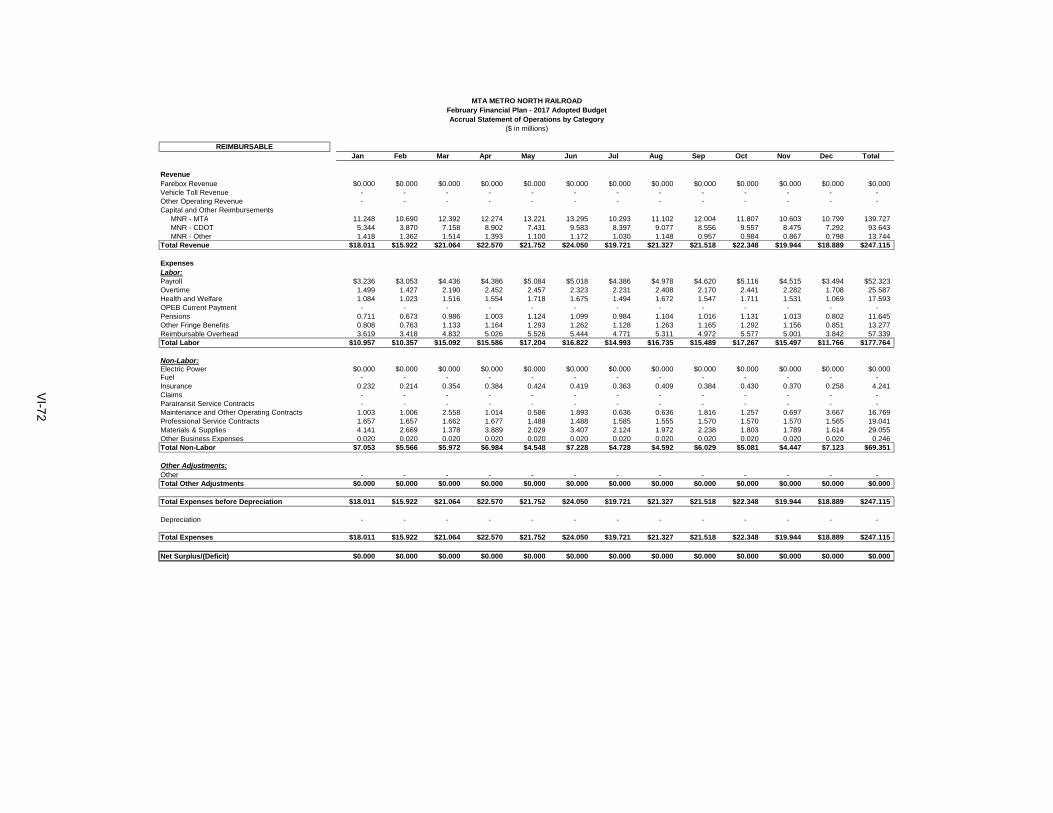
REIMBURSABLEJan Feb Mar Apr May Jun Jul Aug Sep Oct Nov Dec Total
RevenueFarebox Revenue $0.000 $0.000 $0.000 $0.000 $0.000 $0.000 $0.000 $0.000 $0.000 $0.000 $0.000 $0.000 $0.000Vehicle Toll Revenue - - - - - - - - - - - - - Other Operating Revenue - - - - - - - - - - - - - Capital and Other Reimbursements MNR - MTA 11.248 10.690 12.392 12.274 13.221 13.295 10.293 11.102 12.004 11.807 10.603 10.799 139.727 MNR - CDOT 5.344 3.870 7.158 8.902 7.431 9.583 8.397 9.077 8.556 9.557 8.475 7.292 93.643 MNR - Other 1.418 1.362 1.514 1.393 1.100 1.172 1.030 1.148 0.957 0.984 0.867 0.798 13.744Total Revenue $18.011 $15.922 $21.064 $22.570 $21.752 $24.050 $19.721 $21.327 $21.518 $22.348 $19.944 $18.889 $247.115
ExpensesLabor:Payroll $3.236 $3.053 $4.436 $4.386 $5.084 $5.018 $4.386 $4.978 $4.620 $5.116 $4.515 $3.494 $52.323Overtime 1.499 1.427 2.190 2.452 2.457 2.323 2.231 2.408 2.170 2.441 2.282 1.708 25.587Health and Welfare 1.084 1.023 1.516 1.554 1.718 1.675 1.494 1.672 1.547 1.711 1.531 1.069 17.593OPEB Current Payment - - - - - - - - - - - - - Pensions 0.711 0.673 0.986 1.003 1.124 1.099 0.984 1.104 1.016 1.131 1.013 0.802 11.645Other Fringe Benefits 0.808 0.763 1.133 1.164 1.293 1.262 1.128 1.263 1.165 1.292 1.156 0.851 13.277Reimbursable Overhead 3.619 3.418 4.832 5.026 5.526 5.444 4.771 5.311 4.972 5.577 5.001 3.842 57.339Total Labor $10.957 $10.357 $15.092 $15.586 $17.204 $16.822 $14.993 $16.735 $15.489 $17.267 $15.497 $11.766 $177.764
Non-Labor:Electric Power $0.000 $0.000 $0.000 $0.000 $0.000 $0.000 $0.000 $0.000 $0.000 $0.000 $0.000 $0.000 $0.000Fuel - - - - - - - - - - - - - Insurance 0.232 0.214 0.354 0.384 0.424 0.419 0.363 0.409 0.384 0.430 0.370 0.258 4.241Claims - - - - - - - - - - - - - Paratransit Service Contracts - - - - - - - - - - - - - Maintenance and Other Operating Contracts 1.003 1.006 2.558 1.014 0.586 1.893 0.636 0.636 1.816 1.257 0.697 3.667 16.769Professional Service Contracts 1.657 1.657 1.662 1.677 1.488 1.488 1.585 1.555 1.570 1.570 1.570 1.565 19.041Materials & Supplies 4.141 2.669 1.378 3.889 2.029 3.407 2.124 1.972 2.238 1.803 1.789 1.614 29.055Other Business Expenses 0.020 0.020 0.020 0.020 0.020 0.020 0.020 0.020 0.020 0.020 0.020 0.020 0.246Total Non-Labor $7.053 $5.566 $5.972 $6.984 $4.548 $7.228 $4.728 $4.592 $6.029 $5.081 $4.447 $7.123 $69.351
Other Adjustments:Other - - - - - - - - - - - - - Total Other Adjustments $0.000 $0.000 $0.000 $0.000 $0.000 $0.000 $0.000 $0.000 $0.000 $0.000 $0.000 $0.000 $0.000
Total Expenses before Depreciation $18.011 $15.922 $21.064 $22.570 $21.752 $24.050 $19.721 $21.327 $21.518 $22.348 $19.944 $18.889 $247.115
Depreciation - - - - - - - - - - - - -
Total Expenses $18.011 $15.922 $21.064 $22.570 $21.752 $24.050 $19.721 $21.327 $21.518 $22.348 $19.944 $18.889 $247.115
Net Surplus/(Deficit) $0.000 $0.000 $0.000 $0.000 $0.000 $0.000 $0.000 $0.000 $0.000 $0.000 $0.000 $0.000 $0.000
MTA METRO NORTH RAILROADFebruary Financial Plan - 2017 Adopted BudgetAccrual Statement of Operations by Category
($ in millions)
VI-72

NON-REIMBURSABLE / REIMBURSABLE
Jan Feb Mar Apr May Jun Jul Aug Sep Oct Nov Dec Total
RevenueFarebox Revenue $56.400 $54.204 $59.741 $60.058 $63.551 $64.846 $64.904 $62.618 $62.121 $63.685 $62.428 $65.799 $740.355Vehicle Toll Revenue - - - - - - - - - - - - - Other Operating Revenue 5.254 5.495 5.817 5.645 5.375 5.703 5.774 5.653 5.794 5.591 6.412 5.737 68.250 Capital and Other Reimbursements MNR - MTA 11.248 10.690 12.392 12.274 13.221 13.295 10.293 11.102 12.004 11.807 10.603 10.799 139.727 MNR - CDOT 5.344 3.870 7.158 8.902 7.431 9.583 8.397 9.077 8.556 9.557 8.475 7.292 93.643 MNR - Other 1.418 1.362 1.514 1.393 1.100 1.172 1.030 1.148 0.957 0.984 0.867 0.798 13.744Total Revenue $79.664 $75.622 $86.621 $88.273 $90.677 $94.600 $90.399 $89.598 $89.432 $91.624 $88.784 $90.425 $1,055.720
ExpensesLabor:Payroll $44.910 $41.081 $47.502 $41.958 $47.908 $46.180 $45.063 $49.042 $45.111 $46.642 $46.498 $46.113 $548.008Overtime 10.463 9.281 9.591 10.126 10.527 10.013 10.824 10.142 9.984 9.808 10.496 11.685 122.939Health and Welfare 10.288 9.130 10.773 9.418 10.997 10.429 10.274 11.187 10.277 10.587 10.683 10.694 124.737OPEB Current Payment 2.600 2.600 2.600 2.600 2.600 2.600 2.600 2.600 2.600 2.600 2.600 2.600 31.200 Pensions 8.757 7.981 9.101 8.238 9.281 8.908 8.815 9.401 8.736 8.985 9.035 13.174 110.411Other Fringe Benefits 10.826 10.370 11.194 10.253 11.378 10.978 10.874 11.543 10.815 11.049 11.109 11.172 131.561Reimbursable Overhead (0.122) (0.122) (0.159) (0.156) (0.192) (0.177) (0.153) (0.202) (0.183) (0.188) (0.162) (0.149) (1.964)Total Labor $87.723 $80.321 $90.603 $82.437 $92.499 $88.930 $88.296 $93.713 $87.340 $89.483 $90.258 $95.288 $1,066.892
Non-Labor:Electric Power $7.610 $7.646 $7.013 $6.220 $6.199 $6.513 $6.741 $6.179 $6.393 $5.736 $5.815 $6.646 $78.711Fuel 1.504 1.511 1.457 1.550 1.530 1.363 1.373 1.373 1.326 1.402 1.510 1.562 17.460 Insurance 1.906 1.887 2.045 2.076 2.146 2.150 2.082 2.158 2.103 2.149 2.135 2.066 24.902Claims 0.092 0.098 0.098 0.093 0.098 0.093 0.098 0.093 0.098 0.098 0.093 (0.048) 1.000 Paratransit Service Contracts - - - - - - - - - - - - - Maintenance and Other Operating Contracts 10.455 10.721 13.441 10.669 10.292 13.868 10.543 10.364 13.482 11.033 10.683 14.693 140.242Professional Service Contracts 5.266 5.092 5.269 5.392 5.133 5.518 5.243 5.108 5.219 5.260 5.181 6.028 63.708Materials & Supplies 11.099 9.707 9.791 11.419 9.804 12.190 9.638 9.753 11.016 9.420 9.562 10.500 123.899Other Business Expenses 2.280 2.150 2.585 2.297 2.628 2.964 3.056 2.779 2.894 3.124 2.614 2.952 32.323Total Non-Labor $40.212 $38.812 $41.699 $39.716 $37.828 $44.659 $38.772 $37.807 $42.530 $38.220 $37.592 $44.399 $482.246
Other Adjustments:Other - - - - - - - - - - - - - Total Other Adjustments $0.000 $0.000 $0.000 $0.000 $0.000 $0.000 $0.000 $0.000 $0.000 $0.000 $0.000 $0.000 $0.000
Total Expenses before Non-Cash Liability Adjs. $127.935 $119.134 $132.301 $122.153 $130.327 $133.589 $127.069 $131.520 $129.870 $127.704 $127.850 $139.687 $1,549.138
Depreciation $20.058 $20.058 $20.058 $20.058 $20.058 $20.058 $20.058 $20.058 $20.058 $20.058 $20.058 $20.058 $240.693OPEB Obligation 5.693 5.693 5.693 5.693 5.693 5.693 5.693 5.693 5.693 5.693 5.693 5.693 68.316 GASB 68 Pension Adjustment - - - - - - - - - - - (2.500) (2.500) Environmental Remediation - - 1.000 - - 1.000 - - 1.000 - - 1.000 4.000
Total Expenses $153.685 $144.885 $159.052 $147.904 $156.078 $160.340 $152.819 $157.271 $156.621 $153.454 $153.601 $163.938 $1,859.647
Net Surplus/(Deficit) ($74.021) ($69.263) ($72.431) ($59.631) ($65.401) ($65.740) ($62.420) ($67.673) ($67.188) ($61.831) ($64.816) ($73.513) ($803.927)
Cash Conversion Adjustments:Depreciation $20.058 $20.058 $20.058 $20.058 $20.058 $20.058 $20.058 $20.058 $20.058 $20.058 $20.058 $20.058 $240.693Operating Capital (3.094) (2.082) (9.401) (3.664) (3.408) (7.648) (3.284) (4.221) (6.558) (4.179) (2.760) (10.719) (61.019) Other Cash Adjustments 8.238 8.678 (9.550) 14.978 13.740 (1.287) 13.918 8.286 4.872 14.214 2.496 (5.214) 73.369 Total Cash Conversion Adjustments 25.201 26.654 1.106 31.372 30.390 11.122 30.692 24.122 18.372 30.093 19.794 4.125 253.043
Net Cash Surplus/(Deficit) ($48.820) ($42.609) ($71.324) ($28.259) ($35.011) ($54.618) ($31.728) ($43.550) ($48.816) ($31.738) ($45.022) ($69.388) ($550.884)
Accrual Statement of Operations by Category($ in millions)
February Financial Plan - 2017 Adopted BudgetMTA METRO NORTH RAILROAD
VI-73

CASH RECEIPTS AND EXPENDITURESJan Feb Mar Apr May Jun Jul Aug Sep Oct Nov Dec Total
ReceiptsFarebox Revenue $55.457 $53.437 $58.922 $59.141 $62.569 $63.805 $63.870 $61.734 $61.177 $62.804 $61.486 $64.683 $729.085Vehicle Toll Revenue - - - - - - - - - - - - - Other Operating Revenue 7.546 6.802 8.487 16.702 6.424 26.231 6.875 6.636 8.019 6.777 7.331 8.026 115.856 Capital and Other Reimbursements MNR - MTA 11.170 11.280 7.396 11.351 10.943 12.482 12.180 13.130 13.280 10.461 11.046 11.795 136.514 MNR - CDOT 5.344 3.870 7.158 8.902 7.431 9.583 8.397 9.077 8.556 9.557 8.475 7.292 93.643 MNR - Other 1.418 1.362 1.514 1.393 1.100 1.172 1.030 1.148 0.957 0.984 0.867 0.798 13.744Total Receipts $80.936 $76.752 $83.477 $97.489 $88.467 $113.274 $92.352 $91.726 $91.990 $90.584 $89.203 $92.594 $1,088.843
ExpendituresLabor:Payroll $40.427 $41.968 $52.298 $42.258 $41.366 $53.721 $43.279 $53.767 $42.854 $42.123 $53.409 $43.399 $550.869Overtime 9.672 9.306 10.435 10.154 9.351 11.279 10.447 10.996 9.612 9.028 11.749 11.306 123.336 Health and Welfare 10.584 9.427 11.146 9.730 11.320 10.806 10.573 11.560 10.586 10.896 11.040 10.907 128.576 OPEB Current Payment 2.600 2.600 2.600 2.600 2.600 2.600 2.600 2.600 2.600 2.600 2.600 2.600 31.200 Pensions 8.787 8.012 9.142 8.278 9.327 8.952 8.847 9.442 8.774 9.024 9.067 13.149 110.803 Other Fringe Benefits 10.894 10.189 11.282 10.305 11.554 11.319 11.147 11.594 10.796 11.076 11.117 11.062 132.334 GASB Account - - - - - - - - - - - - - Reimbursable Overhead - - - - - - - - - - - - - Total Labor $82.964 $81.502 $96.903 $83.326 $85.519 $98.677 $86.894 $99.960 $85.221 $84.747 $98.983 $92.422 $1,077.117
Non-Labor:Electric Power $7.768 $7.804 $7.171 $6.379 $6.357 $6.672 $6.900 $6.337 $6.552 $5.894 $5.973 $6.804 $80.612Fuel 1.504 1.511 1.345 1.550 1.530 1.251 1.373 1.373 1.214 1.402 1.510 1.450 17.012 Insurance 6.761 0.228 0.373 2.513 0.450 1.232 2.264 0.475 3.571 2.334 2.027 2.737 24.968 Claims 3.181 3.186 3.186 3.732 3.737 3.732 0.098 0.093 0.098 0.098 0.093 0.098 21.328 Paratransit Service Contracts - - - - - - - - - - - - - Maintenance and Other Operating Contracts 7.751 7.156 22.116 8.020 7.503 30.454 7.220 8.539 20.157 7.748 7.651 37.681 171.997 Professional Service Contracts 4.438 4.219 8.604 4.583 4.323 8.846 4.976 4.292 8.411 4.439 4.349 10.110 71.590 Materials & Supplies 11.345 10.032 10.878 12.118 10.277 12.997 9.742 10.126 11.558 11.281 9.831 6.660 126.844 Other Business Expenditures 4.044 3.723 4.223 3.529 3.782 4.030 4.616 4.080 4.025 4.378 3.809 4.019 48.258 Total Non-Labor $46.792 $37.860 $57.898 $42.422 $37.959 $69.214 $37.187 $35.316 $55.585 $37.575 $35.243 $69.560 $562.610
Other Adjustments:Other - - - - - - - - - - - - -
Total Other Adjustments $0.000 $0.000 $0.000 $0.000 $0.000 $0.000 $0.000 $0.000 $0.000 $0.000 $0.000 $0.000 $0.000
Total Expenditures $129.756 $119.361 $154.801 $125.748 $123.478 $167.891 $124.081 $135.276 $140.806 $122.321 $134.226 $161.982 $1,639.727
Net Cash Deficit ($48.820) ($42.609) ($71.324) ($28.259) ($35.011) ($54.618) ($31.728) ($43.550) ($48.816) ($31.738) ($45.022) ($69.388) ($550.884)
MTA Subsidy $37.192 $32.135 $59.920 $21.005 $26.354 $49.923 $24.056 $34.381 $39.005 $24.310 $36.948 $57.105 $442.334CDOT Subsidy $11.628 $10.474 $11.404 $7.254 $8.657 $4.695 $7.672 $9.169 $9.811 $7.428 $8.075 $12.283 $108.550
MTA METRO NORTH RAILROADFebruary Financial Plan - 2017 Adopted Budget
Cash Receipts & Expenditures($ in millions)
VI-74
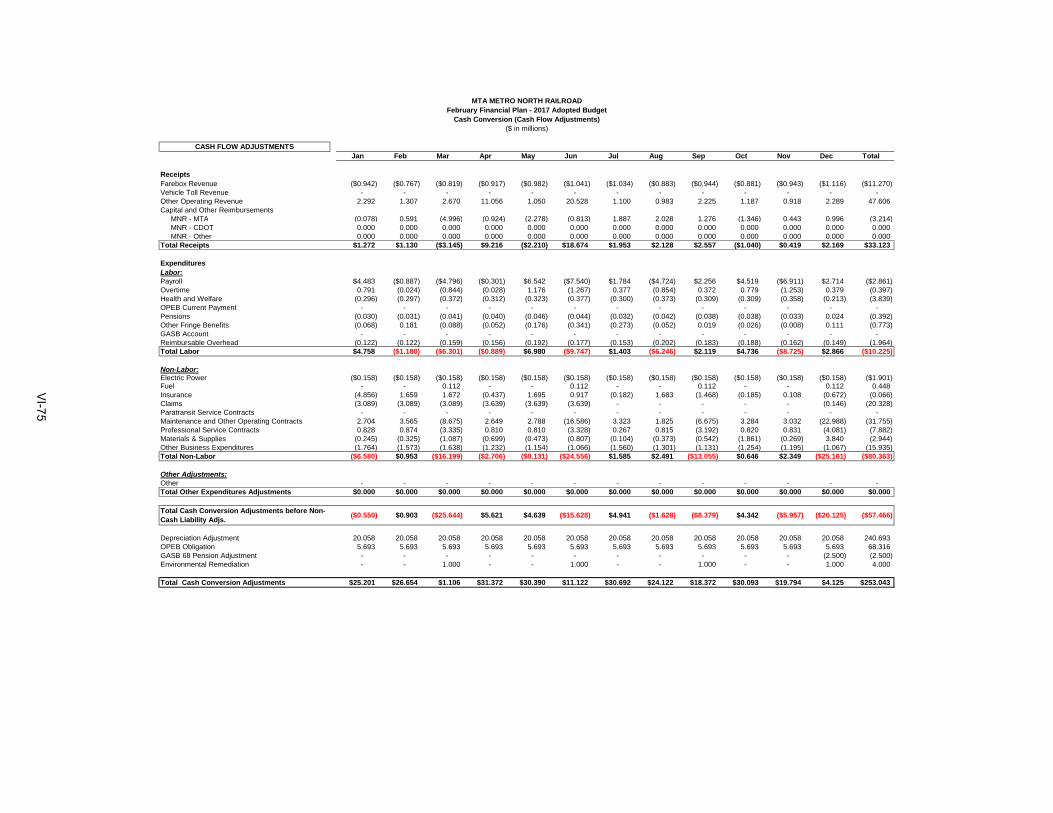
CASH FLOW ADJUSTMENTSJan Feb Mar Apr May Jun Jul Aug Sep Oct Nov Dec Total
ReceiptsFarebox Revenue ($0.942) ($0.767) ($0.819) ($0.917) ($0.982) ($1.041) ($1.034) ($0.883) ($0.944) ($0.881) ($0.943) ($1.116) ($11.270)Vehicle Toll Revenue - - - - - - - - - - - - - Other Operating Revenue 2.292 1.307 2.670 11.056 1.050 20.528 1.100 0.983 2.225 1.187 0.918 2.289 47.606 Capital and Other Reimbursements MNR - MTA (0.078) 0.591 (4.996) (0.924) (2.278) (0.813) 1.887 2.028 1.276 (1.346) 0.443 0.996 (3.214) MNR - CDOT 0.000 0.000 0.000 0.000 0.000 0.000 0.000 0.000 0.000 0.000 0.000 0.000 0.000 MNR - Other 0.000 0.000 0.000 0.000 0.000 0.000 0.000 0.000 0.000 0.000 0.000 0.000 0.000Total Receipts $1.272 $1.130 ($3.145) $9.216 ($2.210) $18.674 $1.953 $2.128 $2.557 ($1.040) $0.419 $2.169 $33.123
ExpendituresLabor:Payroll $4.483 ($0.887) ($4.796) ($0.301) $6.542 ($7.540) $1.784 ($4.724) $2.256 $4.519 ($6.911) $2.714 ($2.861)Overtime 0.791 (0.024) (0.844) (0.028) 1.176 (1.267) 0.377 (0.854) 0.372 0.779 (1.253) 0.379 (0.397) Health and Welfare (0.296) (0.297) (0.372) (0.312) (0.323) (0.377) (0.300) (0.373) (0.309) (0.309) (0.358) (0.213) (3.839) OPEB Current Payment - - - - - - - - - - - - - Pensions (0.030) (0.031) (0.041) (0.040) (0.046) (0.044) (0.032) (0.042) (0.038) (0.038) (0.033) 0.024 (0.392) Other Fringe Benefits (0.068) 0.181 (0.088) (0.052) (0.176) (0.341) (0.273) (0.052) 0.019 (0.026) (0.008) 0.111 (0.773) GASB Account - - - - - - - - - - - - - Reimbursable Overhead (0.122) (0.122) (0.159) (0.156) (0.192) (0.177) (0.153) (0.202) (0.183) (0.188) (0.162) (0.149) (1.964) Total Labor $4.758 ($1.180) ($6.301) ($0.889) $6.980 ($9.747) $1.403 ($6.246) $2.119 $4.736 ($8.725) $2.866 ($10.225)
Non-Labor:Electric Power ($0.158) ($0.158) ($0.158) ($0.158) ($0.158) ($0.158) ($0.158) ($0.158) ($0.158) ($0.158) ($0.158) ($0.158) ($1.901)Fuel - - 0.112 - - 0.112 - - 0.112 - - 0.112 0.448 Insurance (4.856) 1.659 1.672 (0.437) 1.695 0.917 (0.182) 1.683 (1.468) (0.185) 0.108 (0.672) (0.066) Claims (3.089) (3.089) (3.089) (3.639) (3.639) (3.639) - - - - - (0.146) (20.328) Paratransit Service Contracts - - - - - - - - - - - - - Maintenance and Other Operating Contracts 2.704 3.565 (8.675) 2.649 2.788 (16.586) 3.323 1.825 (6.675) 3.284 3.032 (22.988) (31.755) Professional Service Contracts 0.828 0.874 (3.335) 0.810 0.810 (3.328) 0.267 0.815 (3.192) 0.820 0.831 (4.081) (7.882) Materials & Supplies (0.245) (0.325) (1.087) (0.699) (0.473) (0.807) (0.104) (0.373) (0.542) (1.861) (0.269) 3.840 (2.944) Other Business Expenditures (1.764) (1.573) (1.638) (1.232) (1.154) (1.066) (1.560) (1.301) (1.131) (1.254) (1.195) (1.067) (15.935) Total Non-Labor ($6.580) $0.953 ($16.199) ($2.706) ($0.131) ($24.556) $1.585 $2.491 ($13.055) $0.646 $2.349 ($25.161) ($80.363)
Other Adjustments:Other - - - - - - - - - - - - - Total Other Expenditures Adjustments $0.000 $0.000 $0.000 $0.000 $0.000 $0.000 $0.000 $0.000 $0.000 $0.000 $0.000 $0.000 $0.000
Total Cash Conversion Adjustments before Non-Cash Liability Adjs.
($0.550) $0.903 ($25.644) $5.621 $4.639 ($15.628) $4.941 ($1.628) ($8.379) $4.342 ($5.957) ($20.125) ($57.466)
Depreciation Adjustment 20.058 20.058 20.058 20.058 20.058 20.058 20.058 20.058 20.058 20.058 20.058 20.058 240.693 OPEB Obligation 5.693 5.693 5.693 5.693 5.693 5.693 5.693 5.693 5.693 5.693 5.693 5.693 68.316 GASB 68 Pension Adjustment - - - - - - - - - - - (2.500) (2.500) Environmental Remediation - - 1.000 - - 1.000 - - 1.000 - - 1.000 4.000
Total Cash Conversion Adjustments $25.201 $26.654 $1.106 $31.372 $30.390 $11.122 $30.692 $24.122 $18.372 $30.093 $19.794 $4.125 $253.043
($ in millions)Cash Conversion (Cash Flow Adjustments)
February Financial Plan - 2017 Adopted BudgetMTA METRO NORTH RAILROAD
VI-75
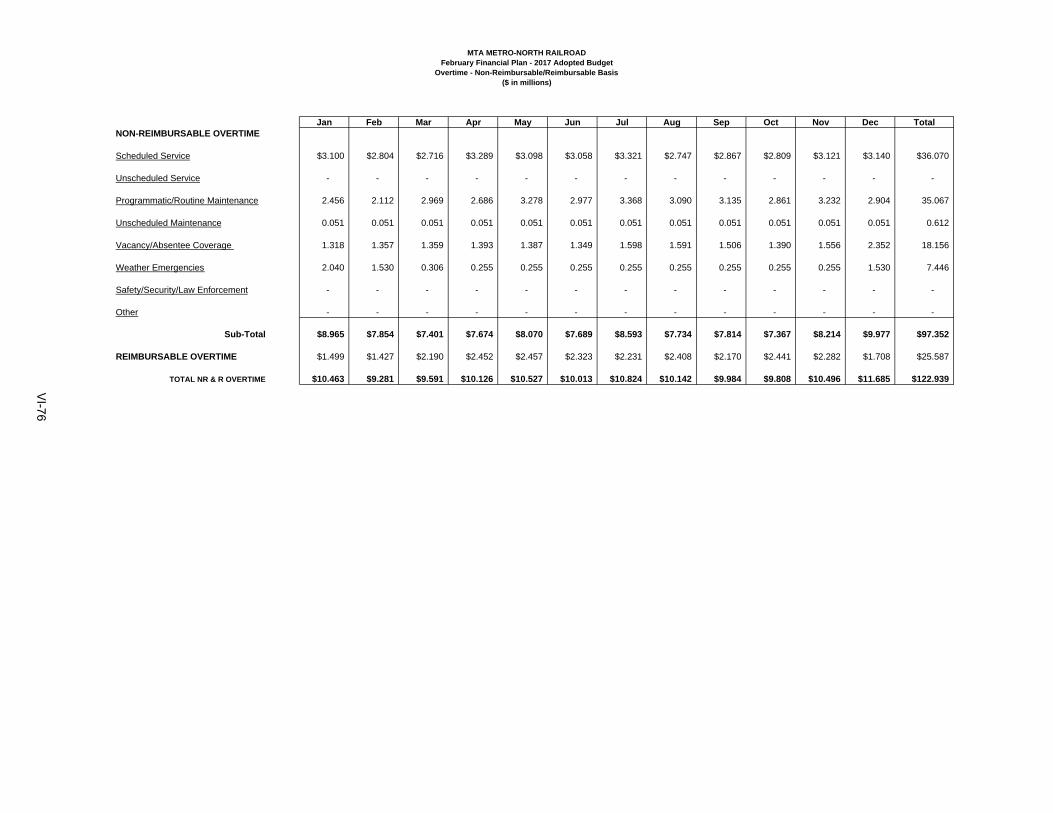
MTA METRO-NORTH RAILROADFebruary Financial Plan - 2017 Adopted Budget
Overtime - Non-Reimbursable/Reimbursable Basis($ in millions)
Jan Feb Mar Apr May Jun Jul Aug Sep Oct Nov Dec TotalNON-REIMBURSABLE OVERTIME
Scheduled Service $3.100 $2.804 $2.716 $3.289 $3.098 $3.058 $3.321 $2.747 $2.867 $2.809 $3.121 $3.140 $36.070
Unscheduled Service - - - - - - - - - - - - -
Programmatic/Routine Maintenance 2.456 2.112 2.969 2.686 3.278 2.977 3.368 3.090 3.135 2.861 3.232 2.904 35.067
Unscheduled Maintenance 0.051 0.051 0.051 0.051 0.051 0.051 0.051 0.051 0.051 0.051 0.051 0.051 0.612
Vacancy/Absentee Coverage 1.318 1.357 1.359 1.393 1.387 1.349 1.598 1.591 1.506 1.390 1.556 2.352 18.156
Weather Emergencies 2.040 1.530 0.306 0.255 0.255 0.255 0.255 0.255 0.255 0.255 0.255 1.530 7.446
Safety/Security/Law Enforcement - - - - - - - - - - - - -
Other - - - - - - - - - - - - -
Sub-Total $8.965 $7.854 $7.401 $7.674 $8.070 $7.689 $8.593 $7.734 $7.814 $7.367 $8.214 $9.977 $97.352
REIMBURSABLE OVERTIME $1.499 $1.427 $2.190 $2.452 $2.457 $2.323 $2.231 $2.408 $2.170 $2.441 $2.282 $1.708 $25.587
TOTAL NR & R OVERTIME $10.463 $9.281 $9.591 $10.126 $10.527 $10.013 $10.824 $10.142 $9.984 $9.808 $10.496 $11.685 $122.939
VI-76
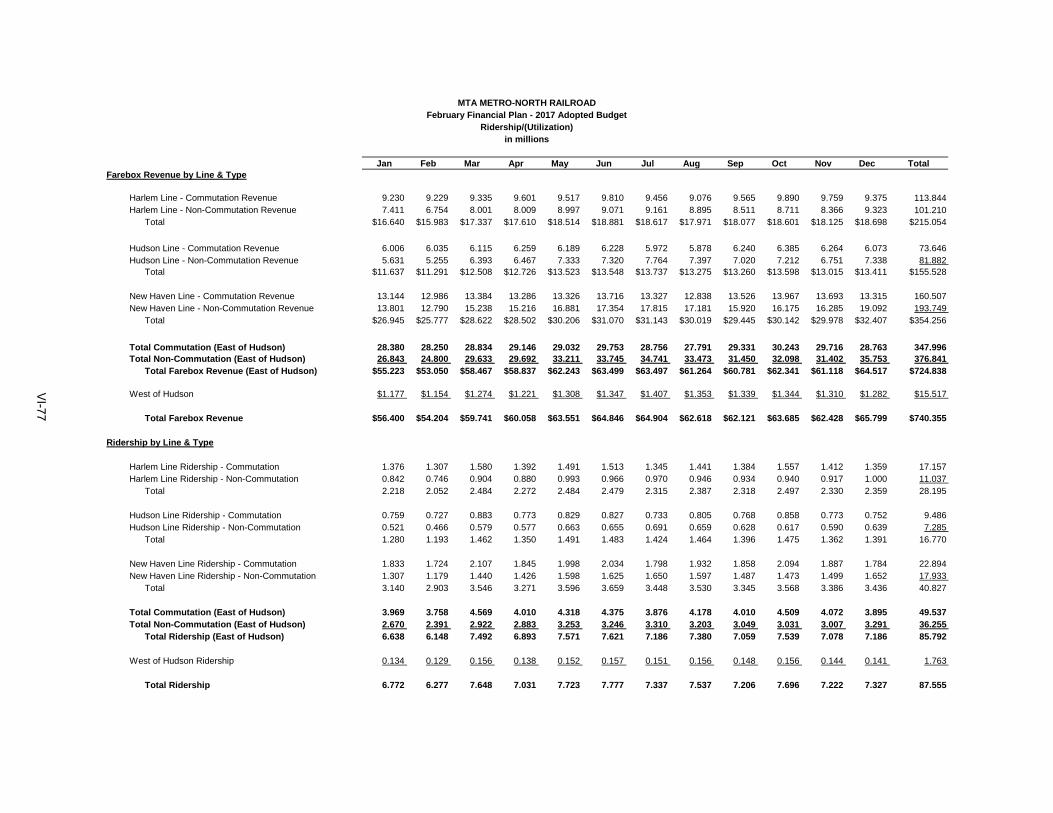
MTA METRO-NORTH RAILROADFebruary Financial Plan - 2017 Adopted Budget
Ridership/(Utilization)in millions
Jan Feb Mar Apr May Jun Jul Aug Sep Oct Nov Dec TotalFarebox Revenue by Line & Type
Harlem Line - Commutation Revenue 9.230 9.229 9.335 9.601 9.517 9.810 9.456 9.076 9.565 9.890 9.759 9.375 113.844Harlem Line - Non-Commutation Revenue 7.411 6.754 8.001 8.009 8.997 9.071 9.161 8.895 8.511 8.711 8.366 9.323 101.210
Total $16.640 $15.983 $17.337 $17.610 $18.514 $18.881 $18.617 $17.971 $18.077 $18.601 $18.125 $18.698 $215.054
Hudson Line - Commutation Revenue 6.006 6.035 6.115 6.259 6.189 6.228 5.972 5.878 6.240 6.385 6.264 6.073 73.646 Hudson Line - Non-Commutation Revenue 5.631 5.255 6.393 6.467 7.333 7.320 7.764 7.397 7.020 7.212 6.751 7.338 81.882
Total $11.637 $11.291 $12.508 $12.726 $13.523 $13.548 $13.737 $13.275 $13.260 $13.598 $13.015 $13.411 $155.528
New Haven Line - Commutation Revenue 13.144 12.986 13.384 13.286 13.326 13.716 13.327 12.838 13.526 13.967 13.693 13.315 160.507 New Haven Line - Non-Commutation Revenue 13.801 12.790 15.238 15.216 16.881 17.354 17.815 17.181 15.920 16.175 16.285 19.092 193.749
Total $26.945 $25.777 $28.622 $28.502 $30.206 $31.070 $31.143 $30.019 $29.445 $30.142 $29.978 $32.407 $354.256
Total Commutation (East of Hudson) 28.380 28.250 28.834 29.146 29.032 29.753 28.756 27.791 29.331 30.243 29.716 28.763 347.996 Total Non-Commutation (East of Hudson) 26.843 24.800 29.633 29.692 33.211 33.745 34.741 33.473 31.450 32.098 31.402 35.753 376.841
Total Farebox Revenue (East of Hudson) $55.223 $53.050 $58.467 $58.837 $62.243 $63.499 $63.497 $61.264 $60.781 $62.341 $61.118 $64.517 $724.838
West of Hudson $1.177 $1.154 $1.274 $1.221 $1.308 $1.347 $1.407 $1.353 $1.339 $1.344 $1.310 $1.282 $15.517
Total Farebox Revenue $56.400 $54.204 $59.741 $60.058 $63.551 $64.846 $64.904 $62.618 $62.121 $63.685 $62.428 $65.799 $740.355
Ridership by Line & Type
Harlem Line Ridership - Commutation 1.376 1.307 1.580 1.392 1.491 1.513 1.345 1.441 1.384 1.557 1.412 1.359 17.157 Harlem Line Ridership - Non-Commutation 0.842 0.746 0.904 0.880 0.993 0.966 0.970 0.946 0.934 0.940 0.917 1.000 11.037
Total 2.218 2.052 2.484 2.272 2.484 2.479 2.315 2.387 2.318 2.497 2.330 2.359 28.195
Hudson Line Ridership - Commutation 0.759 0.727 0.883 0.773 0.829 0.827 0.733 0.805 0.768 0.858 0.773 0.752 9.486 Hudson Line Ridership - Non-Commutation 0.521 0.466 0.579 0.577 0.663 0.655 0.691 0.659 0.628 0.617 0.590 0.639 7.285
Total 1.280 1.193 1.462 1.350 1.491 1.483 1.424 1.464 1.396 1.475 1.362 1.391 16.770
New Haven Line Ridership - Commutation 1.833 1.724 2.107 1.845 1.998 2.034 1.798 1.932 1.858 2.094 1.887 1.784 22.894 New Haven Line Ridership - Non-Commutation 1.307 1.179 1.440 1.426 1.598 1.625 1.650 1.597 1.487 1.473 1.499 1.652 17.933
Total 3.140 2.903 3.546 3.271 3.596 3.659 3.448 3.530 3.345 3.568 3.386 3.436 40.827
Total Commutation (East of Hudson) 3.969 3.758 4.569 4.010 4.318 4.375 3.876 4.178 4.010 4.509 4.072 3.895 49.537 Total Non-Commutation (East of Hudson) 2.670 2.391 2.922 2.883 3.253 3.246 3.310 3.203 3.049 3.031 3.007 3.291 36.255
Total Ridership (East of Hudson) 6.638 6.148 7.492 6.893 7.571 7.621 7.186 7.380 7.059 7.539 7.078 7.186 85.792
West of Hudson Ridership 0.134 0.129 0.156 0.138 0.152 0.157 0.151 0.156 0.148 0.156 0.144 0.141 1.763
Total Ridership 6.772 6.277 7.648 7.031 7.723 7.777 7.337 7.537 7.206 7.696 7.222 7.327 87.555
VI-77
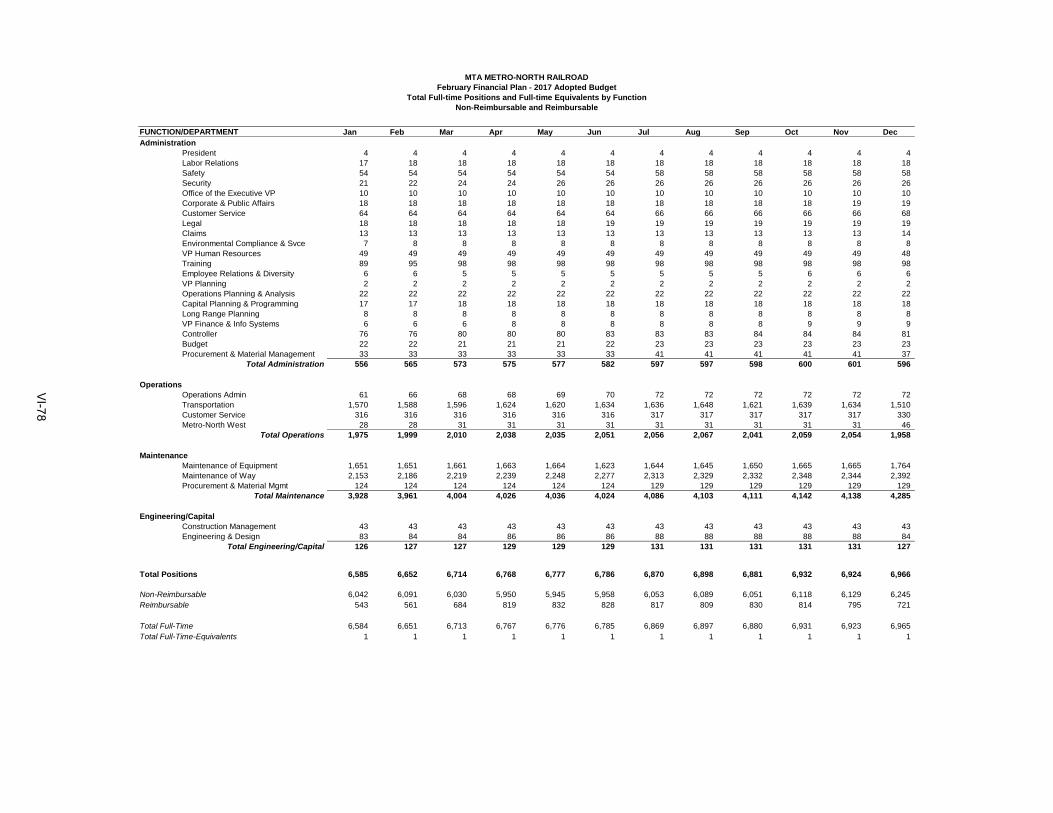
Jan Feb Mar Apr May Jun Jul Aug Sep Oct Nov DecAdministration
President 4 4 4 4 4 4 4 4 4 4 4 4Labor Relations 17 18 18 18 18 18 18 18 18 18 18 18Safety 54 54 54 54 54 54 58 58 58 58 58 58Security 21 22 24 24 26 26 26 26 26 26 26 26Office of the Executive VP 10 10 10 10 10 10 10 10 10 10 10 10Corporate & Public Affairs 18 18 18 18 18 18 18 18 18 18 19 19Customer Service 64 64 64 64 64 64 66 66 66 66 66 68Legal 18 18 18 18 18 19 19 19 19 19 19 19Claims 13 13 13 13 13 13 13 13 13 13 13 14Environmental Compliance & Svce 7 8 8 8 8 8 8 8 8 8 8 8VP Human Resources 49 49 49 49 49 49 49 49 49 49 49 48Training 89 95 98 98 98 98 98 98 98 98 98 98Employee Relations & Diversity 6 6 5 5 5 5 5 5 5 6 6 6VP Planning 2 2 2 2 2 2 2 2 2 2 2 2Operations Planning & Analysis 22 22 22 22 22 22 22 22 22 22 22 22Capital Planning & Programming 17 17 18 18 18 18 18 18 18 18 18 18Long Range Planning 8 8 8 8 8 8 8 8 8 8 8 8VP Finance & Info Systems 6 6 6 8 8 8 8 8 8 9 9 9Controller 76 76 80 80 80 83 83 83 84 84 84 81Budget 22 22 21 21 21 22 23 23 23 23 23 23Procurement & Material Management 33 33 33 33 33 33 41 41 41 41 41 37
Total Administration 556 565 573 575 577 582 597 597 598 600 601 596
OperationsOperations Admin 61 66 68 68 69 70 72 72 72 72 72 72Transportation 1,570 1,588 1,596 1,624 1,620 1,634 1,636 1,648 1,621 1,639 1,634 1,510Customer Service 316 316 316 316 316 316 317 317 317 317 317 330Metro-North West 28 28 31 31 31 31 31 31 31 31 31 46
Total Operations 1,975 1,999 2,010 2,038 2,035 2,051 2,056 2,067 2,041 2,059 2,054 1,958
MaintenanceMaintenance of Equipment 1,651 1,651 1,661 1,663 1,664 1,623 1,644 1,645 1,650 1,665 1,665 1,764Maintenance of Way 2,153 2,186 2,219 2,239 2,248 2,277 2,313 2,329 2,332 2,348 2,344 2,392Procurement & Material Mgmt 124 124 124 124 124 124 129 129 129 129 129 129
Total Maintenance 3,928 3,961 4,004 4,026 4,036 4,024 4,086 4,103 4,111 4,142 4,138 4,285
Engineering/CapitalConstruction Management 43 43 43 43 43 43 43 43 43 43 43 43Engineering & Design 83 84 84 86 86 86 88 88 88 88 88 84
Total Engineering/Capital 126 127 127 129 129 129 131 131 131 131 131 127
Total Positions 6,585 6,652 6,714 6,768 6,777 6,786 6,870 6,898 6,881 6,932 6,924 6,966
Non-Reimbursable 6,042 6,091 6,030 5,950 5,945 5,958 6,053 6,089 6,051 6,118 6,129 6,245Reimbursable 543 561 684 819 832 828 817 809 830 814 795 721
Total Full-Time 6,584 6,651 6,713 6,767 6,776 6,785 6,869 6,897 6,880 6,931 6,923 6,965Total Full-Time-Equivalents 1 1 1 1 1 1 1 1 1 1 1 1
MTA METRO-NORTH RAILROADFebruary Financial Plan - 2017 Adopted Budget
Total Full-time Positions and Full-time Equivalents by FunctionNon-Reimbursable and Reimbursable
FUNCTION/DEPARTMENT
VI-78
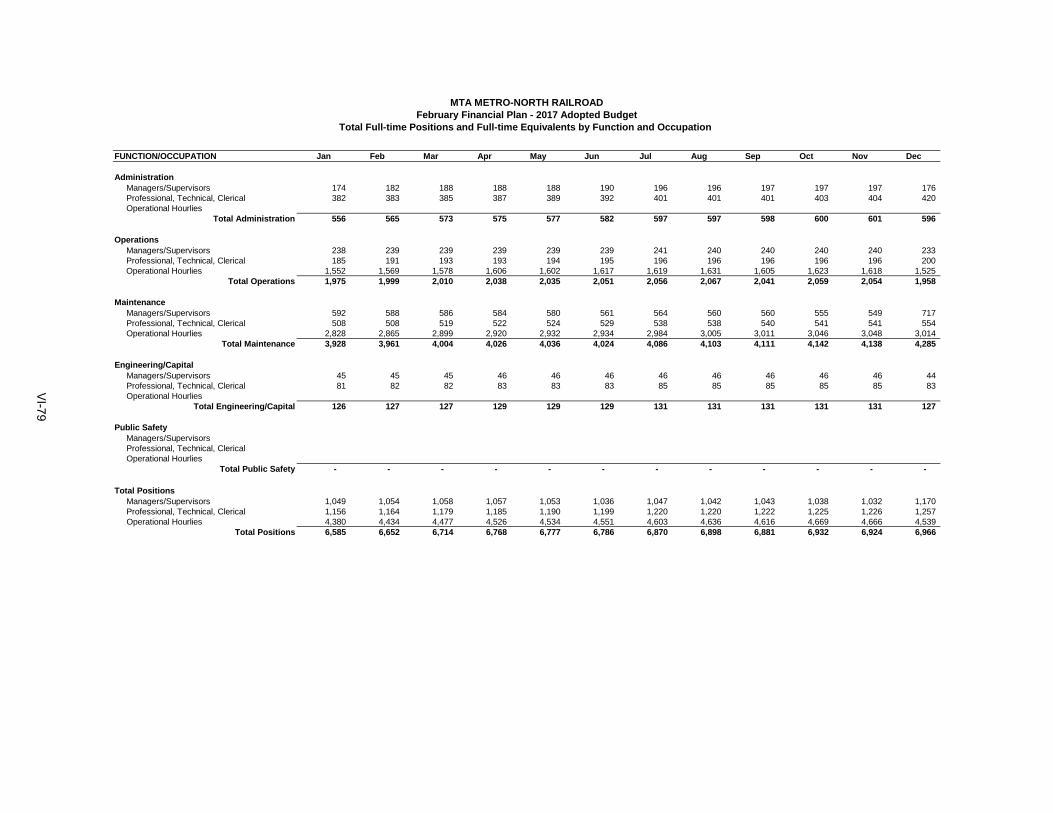
FUNCTION/OCCUPATION Jan Feb Mar Apr May Jun Jul Aug Sep Oct Nov Dec
Administration Managers/Supervisors 174 182 188 188 188 190 196 196 197 197 197 176 Professional, Technical, Clerical 382 383 385 387 389 392 401 401 401 403 404 420 Operational Hourlies
Total Administration 556 565 573 575 577 582 597 597 598 600 601 596
Operations Managers/Supervisors 238 239 239 239 239 239 241 240 240 240 240 233 Professional, Technical, Clerical 185 191 193 193 194 195 196 196 196 196 196 200 Operational Hourlies 1,552 1,569 1,578 1,606 1,602 1,617 1,619 1,631 1,605 1,623 1,618 1,525
Total Operations 1,975 1,999 2,010 2,038 2,035 2,051 2,056 2,067 2,041 2,059 2,054 1,958
Maintenance Managers/Supervisors 592 588 586 584 580 561 564 560 560 555 549 717 Professional, Technical, Clerical 508 508 519 522 524 529 538 538 540 541 541 554 Operational Hourlies 2,828 2,865 2,899 2,920 2,932 2,934 2,984 3,005 3,011 3,046 3,048 3,014
Total Maintenance 3,928 3,961 4,004 4,026 4,036 4,024 4,086 4,103 4,111 4,142 4,138 4,285
Engineering/Capital Managers/Supervisors 45 45 45 46 46 46 46 46 46 46 46 44 Professional, Technical, Clerical 81 82 82 83 83 83 85 85 85 85 85 83 Operational Hourlies
Total Engineering/Capital 126 127 127 129 129 129 131 131 131 131 131 127
Public Safety Managers/Supervisors Professional, Technical, Clerical Operational Hourlies
Total Public Safety - - - - - - - - - - - -
Total Positions Managers/Supervisors 1,049 1,054 1,058 1,057 1,053 1,036 1,047 1,042 1,043 1,038 1,032 1,170 Professional, Technical, Clerical 1,156 1,164 1,179 1,185 1,190 1,199 1,220 1,220 1,222 1,225 1,226 1,257 Operational Hourlies 4,380 4,434 4,477 4,526 4,534 4,551 4,603 4,636 4,616 4,669 4,666 4,539
Total Positions 6,585 6,652 6,714 6,768 6,777 6,786 6,870 6,898 6,881 6,932 6,924 6,966
MTA METRO-NORTH RAILROADFebruary Financial Plan - 2017 Adopted Budget
Total Full-time Positions and Full-time Equivalents by Function and Occupation
VI-79

[THIS PAGE INTENTIONALLY LEFT BLANK]
VI-80
MTA Headquarters and
Inspector General
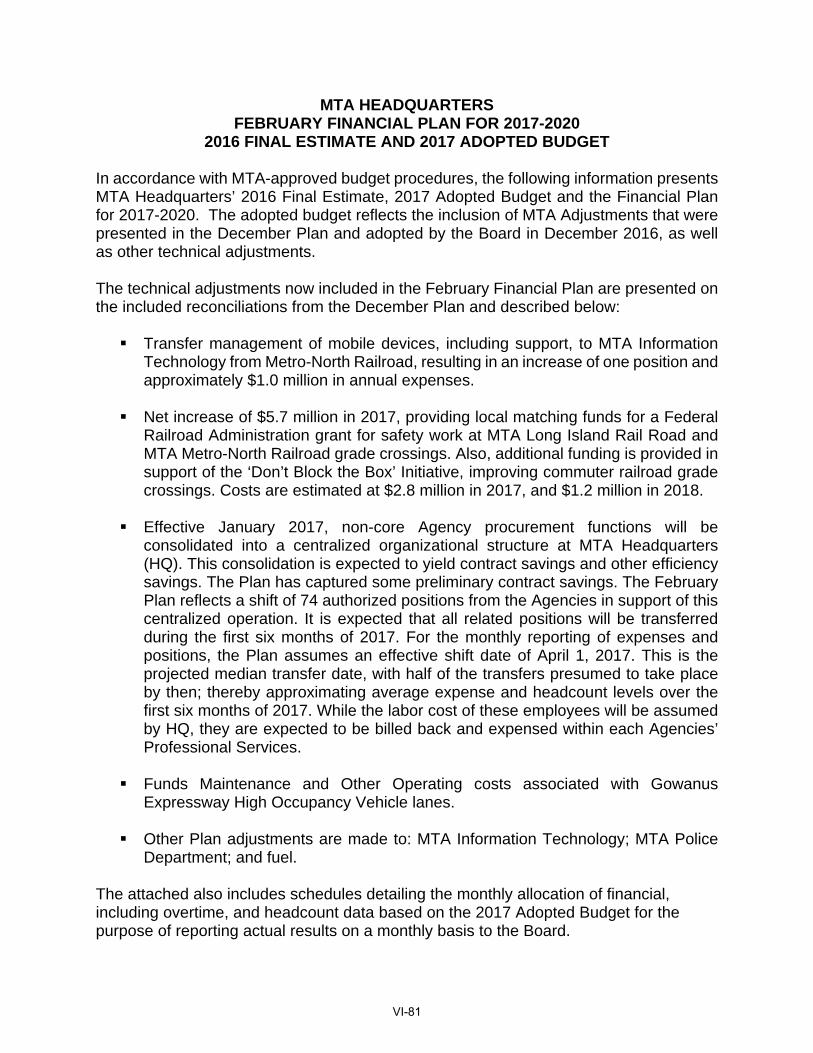
MTA HEADQUARTERS FEBRUARY FINANCIAL PLAN FOR 2017-2020
2016 FINAL ESTIMATE AND 2017 ADOPTED BUDGET In accordance with MTA-approved budget procedures, the following information presents MTA Headquarters’ 2016 Final Estimate, 2017 Adopted Budget and the Financial Plan for 2017-2020. The adopted budget reflects the inclusion of MTA Adjustments that were presented in the December Plan and adopted by the Board in December 2016, as well as other technical adjustments. The technical adjustments now included in the February Financial Plan are presented on the included reconciliations from the December Plan and described below:
Transfer management of mobile devices, including support, to MTA Information
Technology from Metro-North Railroad, resulting in an increase of one position and approximately $1.0 million in annual expenses.
Net increase of $5.7 million in 2017, providing local matching funds for a Federal Railroad Administration grant for safety work at MTA Long Island Rail Road and MTA Metro-North Railroad grade crossings. Also, additional funding is provided in support of the ‘Don’t Block the Box’ Initiative, improving commuter railroad grade crossings. Costs are estimated at $2.8 million in 2017, and $1.2 million in 2018.
Effective January 2017, non-core Agency procurement functions will be consolidated into a centralized organizational structure at MTA Headquarters (HQ). This consolidation is expected to yield contract savings and other efficiency savings. The Plan has captured some preliminary contract savings. The February Plan reflects a shift of 74 authorized positions from the Agencies in support of this centralized operation. It is expected that all related positions will be transferred during the first six months of 2017. For the monthly reporting of expenses and positions, the Plan assumes an effective shift date of April 1, 2017. This is the projected median transfer date, with half of the transfers presumed to take place by then; thereby approximating average expense and headcount levels over the first six months of 2017. While the labor cost of these employees will be assumed by HQ, they are expected to be billed back and expensed within each Agencies’ Professional Services.
Funds Maintenance and Other Operating costs associated with Gowanus
Expressway High Occupancy Vehicle lanes.
Other Plan adjustments are made to: MTA Information Technology; MTA Police Department; and fuel.
The attached also includes schedules detailing the monthly allocation of financial, including overtime, and headcount data based on the 2017 Adopted Budget for the purpose of reporting actual results on a monthly basis to the Board.
VI-81
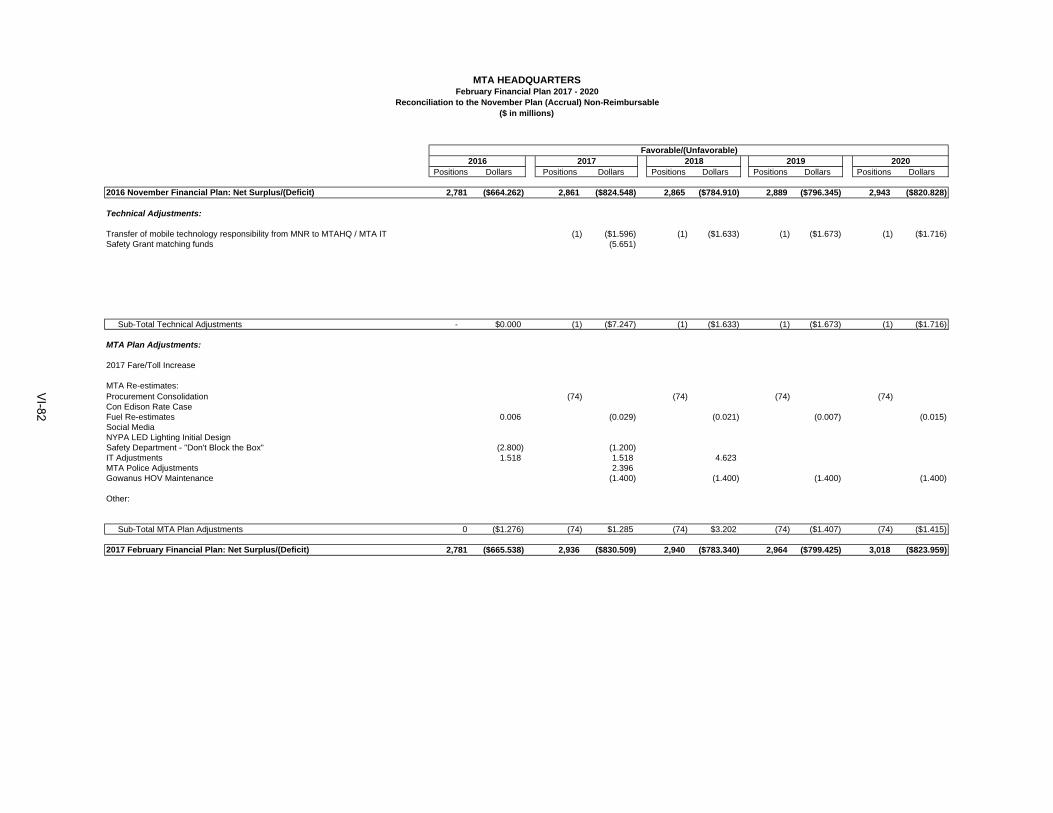
Positions Dollars Positions Dollars Positions Dollars Positions Dollars Positions Dollars
2016 November Financial Plan: Net Surplus/(Deficit) 2,781 ($664.262) 2,861 ($824.548) 2,865 ($784.910) 2,889 ($796.345) 2,943 ($820.828)
Technical Adjustments:
Transfer of mobile technology responsibility from MNR to MTAHQ / MTA IT (1) ($1.596) (1) ($1.633) (1) ($1.673) (1) ($1.716)Safety Grant matching funds (5.651)
Sub-Total Technical Adjustments - $0.000 (1) ($7.247) (1) ($1.633) (1) ($1.673) (1) ($1.716)
MTA Plan Adjustments:
2017 Fare/Toll Increase
MTA Re-estimates:Procurement Consolidation (74) (74) (74) (74) Con Edison Rate CaseFuel Re-estimates 0.006 (0.029) (0.021) (0.007) (0.015) Social MediaNYPA LED Lighting Initial DesignSafety Department - "Don't Block the Box" (2.800) (1.200) IT Adjustments 1.518 1.518 4.623 MTA Police Adjustments 2.396 Gowanus HOV Maintenance (1.400) (1.400) (1.400) (1.400)
Other:
Sub-Total MTA Plan Adjustments 0 ($1.276) (74) $1.285 (74) $3.202 (74) ($1.407) (74) ($1.415)
2017 February Financial Plan: Net Surplus/(Deficit) 2,781 ($665.538) 2,936 ($830.509) 2,940 ($783.340) 2,964 ($799.425) 3,018 ($823.959)
MTA HEADQUARTERSFebruary Financial Plan 2017 - 2020
Reconciliation to the November Plan (Accrual) Non-Reimbursable($ in millions)
Favorable/(Unfavorable)2016 2017 2018 2019 2020
VI-82
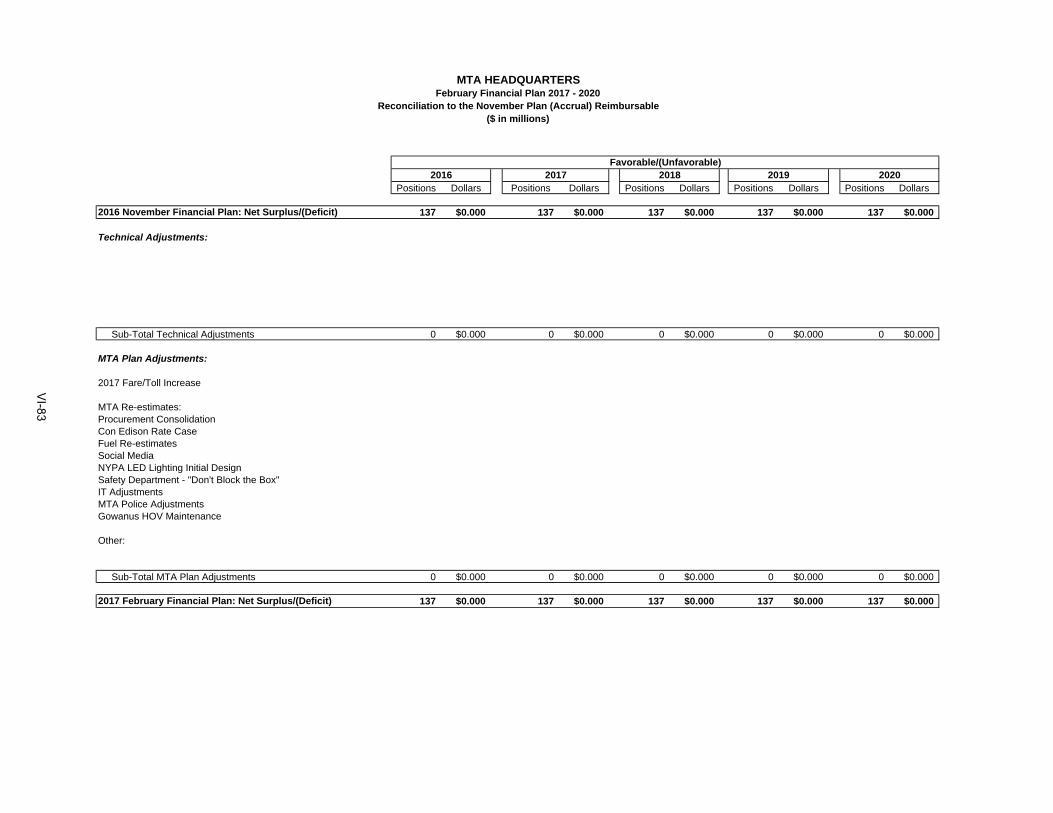
Positions Dollars Positions Dollars Positions Dollars Positions Dollars Positions Dollars
2016 November Financial Plan: Net Surplus/(Deficit) 137 $0.000 137 $0.000 137 $0.000 137 $0.000 137 $0.000
Technical Adjustments:
Sub-Total Technical Adjustments 0 $0.000 0 $0.000 0 $0.000 0 $0.000 0 $0.000
MTA Plan Adjustments:
2017 Fare/Toll Increase
MTA Re-estimates:Procurement ConsolidationCon Edison Rate CaseFuel Re-estimatesSocial MediaNYPA LED Lighting Initial DesignSafety Department - "Don't Block the Box"IT AdjustmentsMTA Police AdjustmentsGowanus HOV Maintenance
Other:
Sub-Total MTA Plan Adjustments 0 $0.000 0 $0.000 0 $0.000 0 $0.000 0 $0.000
2017 February Financial Plan: Net Surplus/(Deficit) 137 $0.000 137 $0.000 137 $0.000 137 $0.000 137 $0.000
MTA HEADQUARTERSFebruary Financial Plan 2017 - 2020
Reconciliation to the November Plan (Accrual) Reimbursable($ in millions)
Favorable/(Unfavorable)2016 2017 2018 2019 2020
VI-83
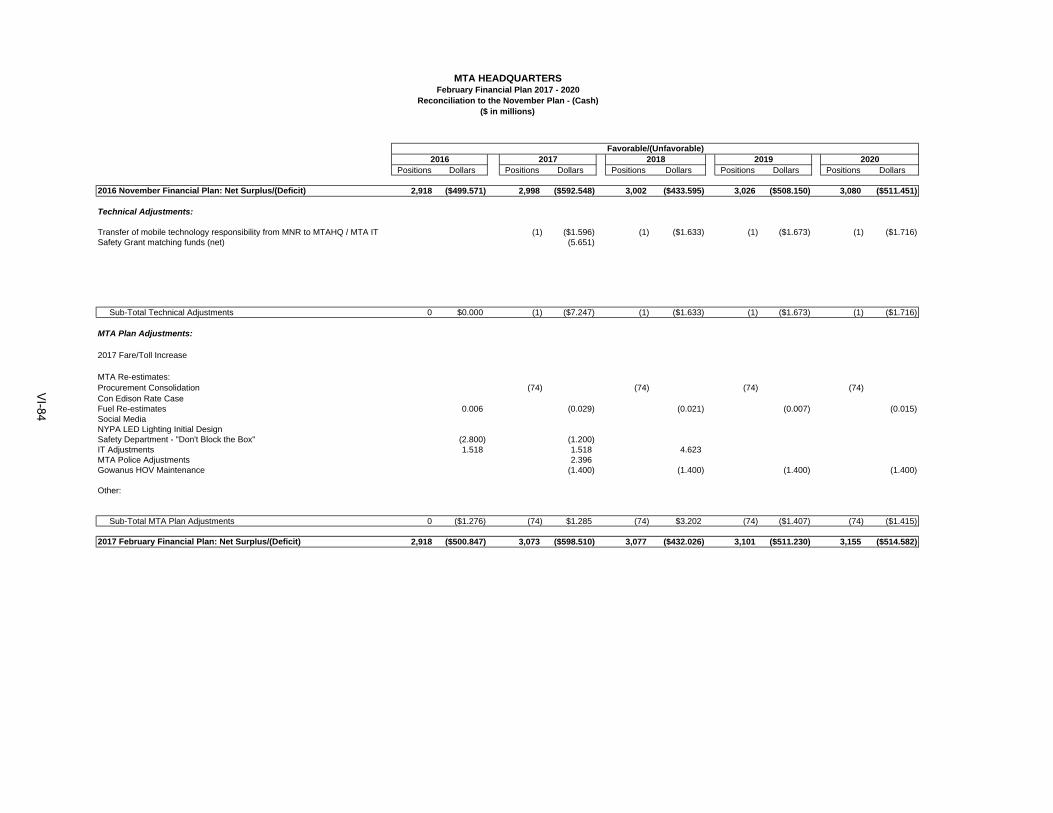
Positions Dollars Positions Dollars Positions Dollars Positions Dollars Positions Dollars
2016 November Financial Plan: Net Surplus/(Deficit) 2,918 ($499.571) 2,998 ($592.548) 3,002 ($433.595) 3,026 ($508.150) 3,080 ($511.451)
Technical Adjustments:
Transfer of mobile technology responsibility from MNR to MTAHQ / MTA IT (1) ($1.596) (1) ($1.633) (1) ($1.673) (1) ($1.716)Safety Grant matching funds (net) (5.651)
Sub-Total Technical Adjustments 0 $0.000 (1) ($7.247) (1) ($1.633) (1) ($1.673) (1) ($1.716)
MTA Plan Adjustments:
2017 Fare/Toll Increase
MTA Re-estimates:Procurement Consolidation (74) (74) (74) (74) Con Edison Rate CaseFuel Re-estimates 0.006 (0.029) (0.021) (0.007) (0.015) Social MediaNYPA LED Lighting Initial DesignSafety Department - "Don't Block the Box" (2.800) (1.200) IT Adjustments 1.518 1.518 4.623 MTA Police Adjustments 2.396 Gowanus HOV Maintenance (1.400) (1.400) (1.400) (1.400)
Other:
Sub-Total MTA Plan Adjustments 0 ($1.276) (74) $1.285 (74) $3.202 (74) ($1.407) (74) ($1.415)
2017 February Financial Plan: Net Surplus/(Deficit) 2,918 ($500.847) 3,073 ($598.510) 3,077 ($432.026) 3,101 ($511.230) 3,155 ($514.582)
MTA HEADQUARTERSFebruary Financial Plan 2017 - 2020
Reconciliation to the November Plan - (Cash)($ in millions)
Favorable/(Unfavorable)2016 2017 2018 2019 2020
VI-84
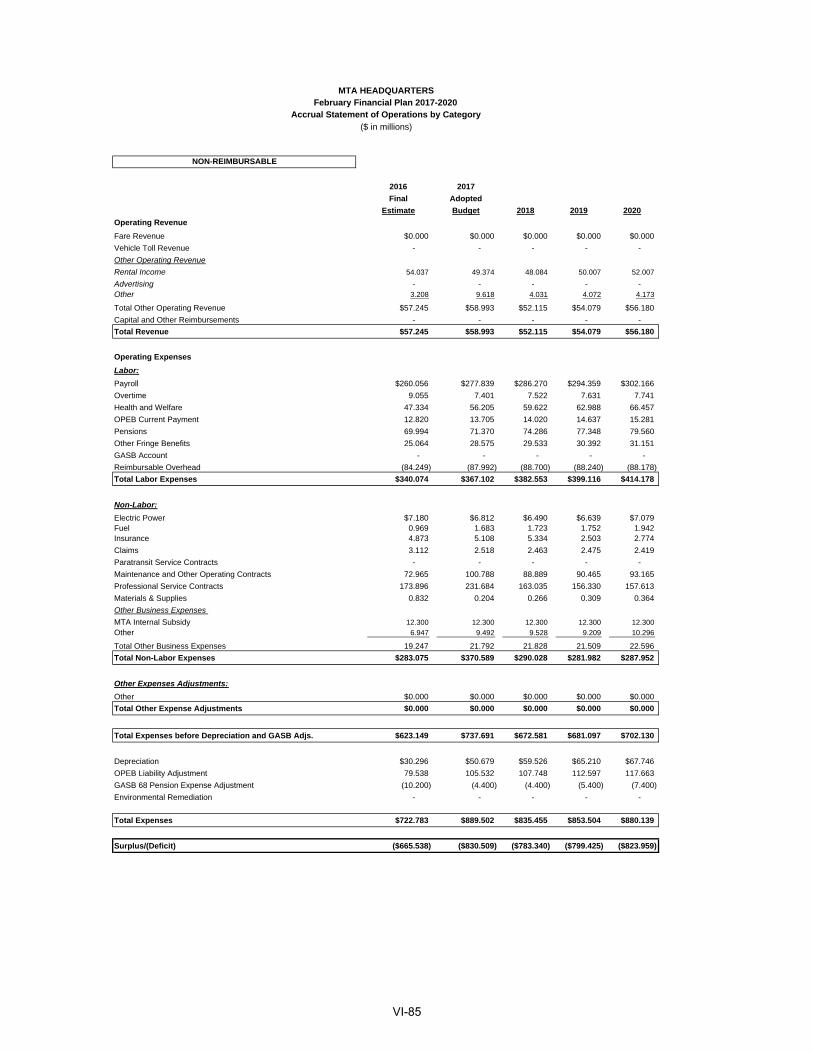
NON-REIMBURSABLE
2016 2017
Final Adopted
Estimate Budget 2018 2019 2020
Operating Revenue
Fare Revenue $0.000 $0.000 $0.000 $0.000 $0.000
Vehicle Toll Revenue - - - - -
Other Operating Revenue
Rental Income 54.037 49.374 48.084 50.007 52.007
Advertising - - - - - Other 3.208 9.618 4.031 4.072 4.173
Total Other Operating Revenue $57.245 $58.993 $52.115 $54.079 $56.180
Capital and Other Reimbursements - - - - -
Total Revenue $57.245 $58.993 $52.115 $54.079 $56.180
Operating Expenses
Labor:
Payroll $260.056 $277.839 $286.270 $294.359 $302.166
Overtime 9.055 7.401 7.522 7.631 7.741
Health and Welfare 47.334 56.205 59.622 62.988 66.457
OPEB Current Payment 12.820 13.705 14.020 14.637 15.281
Pensions 69.994 71.370 74.286 77.348 79.560
Other Fringe Benefits 25.064 28.575 29.533 30.392 31.151
GASB Account - - - - -
Reimbursable Overhead (84.249) (87.992) (88.700) (88.240) (88.178)
Total Labor Expenses $340.074 $367.102 $382.553 $399.116 $414.178
Non-Labor:
Electric Power $7.180 $6.812 $6.490 $6.639 $7.079Fuel 0.969 1.683 1.723 1.752 1.942 Insurance 4.873 5.108 5.334 2.503 2.774
Claims 3.112 2.518 2.463 2.475 2.419
Paratransit Service Contracts - - - - -
Maintenance and Other Operating Contracts 72.965 100.788 88.889 90.465 93.165
Professional Service Contracts 173.896 231.684 163.035 156.330 157.613
Materials & Supplies 0.832 0.204 0.266 0.309 0.364
Other Business Expenses
MTA Internal Subsidy 12.300 12.300 12.300 12.300 12.300
Other 6.947 9.492 9.528 9.209 10.296
Total Other Business Expenses 19.247 21.792 21.828 21.509 22.596
Total Non-Labor Expenses $283.075 $370.589 $290.028 $281.982 $287.952
Other Expenses Adjustments:
Other $0.000 $0.000 $0.000 $0.000 $0.000
Total Other Expense Adjustments $0.000 $0.000 $0.000 $0.000 $0.000
Total Expenses before Depreciation and GASB Adjs. $623.149 $737.691 $672.581 $681.097 $702.130
Depreciation $30.296 $50.679 $59.526 $65.210 $67.746
OPEB Liability Adjustment 79.538 105.532 107.748 112.597 117.663
GASB 68 Pension Expense Adjustment (10.200) (4.400) (4.400) (5.400) (7.400)
Environmental Remediation - - - - -
Total Expenses $722.783 $889.502 $835.455 $853.504 $880.139
Surplus/(Deficit) ($665.538) ($830.509) ($783.340) ($799.425) ($823.959)
MTA HEADQUARTERSFebruary Financial Plan 2017-2020
Accrual Statement of Operations by Category
($ in millions)
VI-85
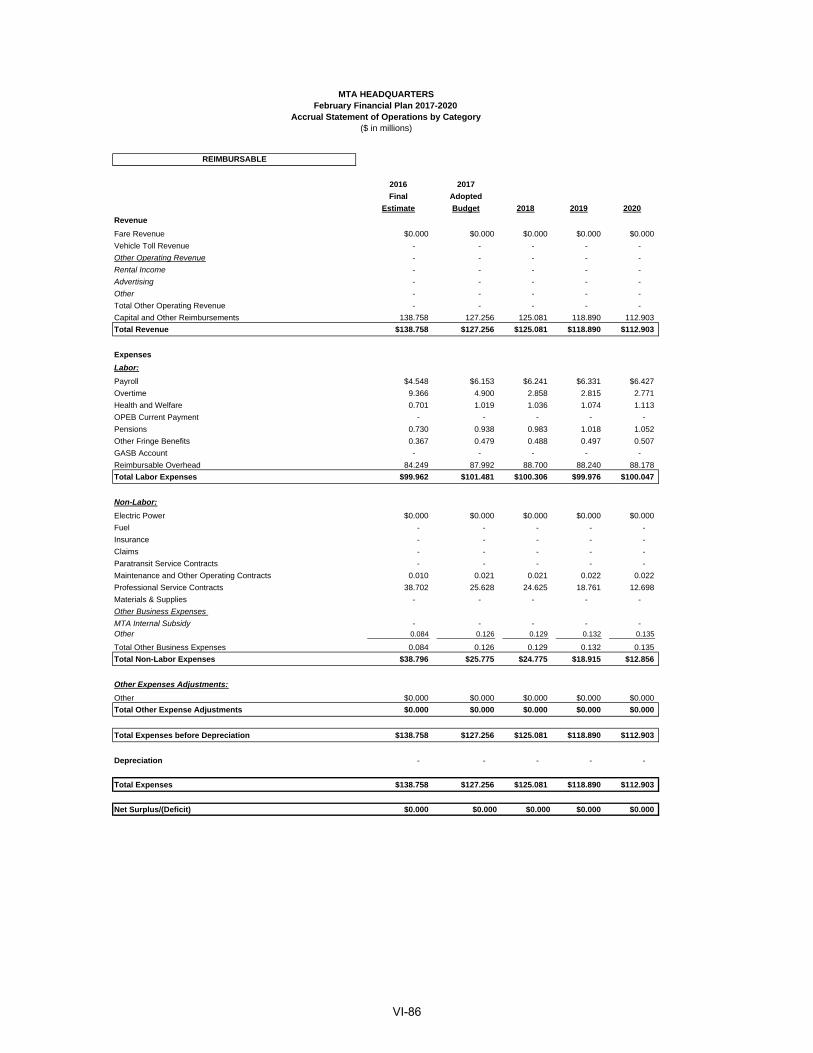
REIMBURSABLE
2016 2017
Final Adopted
Estimate Budget 2018 2019 2020
Revenue
Fare Revenue $0.000 $0.000 $0.000 $0.000 $0.000
Vehicle Toll Revenue - - - - -
Other Operating Revenue - - - - -
Rental Income - - - - -
Advertising - - - - -
Other - - - - -
Total Other Operating Revenue - - - - -
Capital and Other Reimbursements 138.758 127.256 125.081 118.890 112.903
Total Revenue $138.758 $127.256 $125.081 $118.890 $112.903
Expenses
Labor:
Payroll $4.548 $6.153 $6.241 $6.331 $6.427
Overtime 9.366 4.900 2.858 2.815 2.771
Health and Welfare 0.701 1.019 1.036 1.074 1.113
OPEB Current Payment - - - - -
Pensions 0.730 0.938 0.983 1.018 1.052
Other Fringe Benefits 0.367 0.479 0.488 0.497 0.507
GASB Account - - - - -
Reimbursable Overhead 84.249 87.992 88.700 88.240 88.178
Total Labor Expenses $99.962 $101.481 $100.306 $99.976 $100.047
Non-Labor:
Electric Power $0.000 $0.000 $0.000 $0.000 $0.000
Fuel - - - - -
Insurance - - - - -
Claims - - - - -
Paratransit Service Contracts - - - - -
Maintenance and Other Operating Contracts 0.010 0.021 0.021 0.022 0.022
Professional Service Contracts 38.702 25.628 24.625 18.761 12.698
Materials & Supplies - - - - -
Other Business Expenses
MTA Internal Subsidy - - - - - Other 0.084 0.126 0.129 0.132 0.135
Total Other Business Expenses 0.084 0.126 0.129 0.132 0.135
Total Non-Labor Expenses $38.796 $25.775 $24.775 $18.915 $12.856
Other Expenses Adjustments:
Other $0.000 $0.000 $0.000 $0.000 $0.000
Total Other Expense Adjustments $0.000 $0.000 $0.000 $0.000 $0.000
Total Expenses before Depreciation $138.758 $127.256 $125.081 $118.890 $112.903
Depreciation - - - - -
Total Expenses $138.758 $127.256 $125.081 $118.890 $112.903
Net Surplus/(Deficit) $0.000 $0.000 $0.000 $0.000 $0.000
February Financial Plan 2017-2020Accrual Statement of Operations by Category
($ in millions)
MTA HEADQUARTERS
VI-86
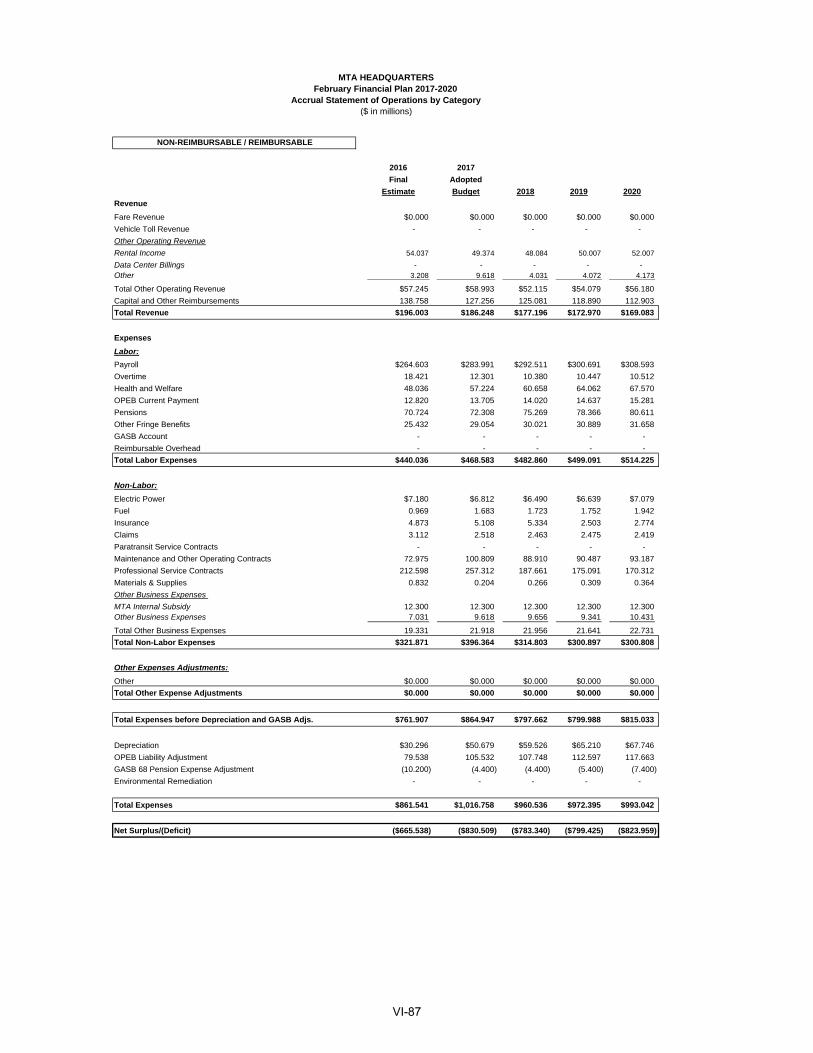
NON-REIMBURSABLE / REIMBURSABLE
2016 2017
Final Adopted
Estimate Budget 2018 2019 2020
Revenue
Fare Revenue $0.000 $0.000 $0.000 $0.000 $0.000
Vehicle Toll Revenue - - - - -
Other Operating Revenue
Rental Income 54.037 49.374 48.084 50.007 52.007
Data Center Billings - - - - -
Other 3.208 9.618 4.031 4.072 4.173
Total Other Operating Revenue $57.245 $58.993 $52.115 $54.079 $56.180
Capital and Other Reimbursements 138.758 127.256 125.081 118.890 112.903
Total Revenue $196.003 $186.248 $177.196 $172.970 $169.083
Expenses
Labor:
Payroll $264.603 $283.991 $292.511 $300.691 $308.593
Overtime 18.421 12.301 10.380 10.447 10.512
Health and Welfare 48.036 57.224 60.658 64.062 67.570
OPEB Current Payment 12.820 13.705 14.020 14.637 15.281
Pensions 70.724 72.308 75.269 78.366 80.611
Other Fringe Benefits 25.432 29.054 30.021 30.889 31.658
GASB Account - - - - -
Reimbursable Overhead - - - - -
Total Labor Expenses $440.036 $468.583 $482.860 $499.091 $514.225
Non-Labor:
Electric Power $7.180 $6.812 $6.490 $6.639 $7.079
Fuel 0.969 1.683 1.723 1.752 1.942
Insurance 4.873 5.108 5.334 2.503 2.774
Claims 3.112 2.518 2.463 2.475 2.419
Paratransit Service Contracts - - - - -
Maintenance and Other Operating Contracts 72.975 100.809 88.910 90.487 93.187
Professional Service Contracts 212.598 257.312 187.661 175.091 170.312
Materials & Supplies 0.832 0.204 0.266 0.309 0.364
Other Business Expenses
MTA Internal Subsidy 12.300 12.300 12.300 12.300 12.300 Other Business Expenses 7.031 9.618 9.656 9.341 10.431
Total Other Business Expenses 19.331 21.918 21.956 21.641 22.731
Total Non-Labor Expenses $321.871 $396.364 $314.803 $300.897 $300.808
Other Expenses Adjustments:
Other $0.000 $0.000 $0.000 $0.000 $0.000
Total Other Expense Adjustments $0.000 $0.000 $0.000 $0.000 $0.000
Total Expenses before Depreciation and GASB Adjs. $761.907 $864.947 $797.662 $799.988 $815.033
Depreciation $30.296 $50.679 $59.526 $65.210 $67.746
OPEB Liability Adjustment 79.538 105.532 107.748 112.597 117.663
GASB 68 Pension Expense Adjustment (10.200) (4.400) (4.400) (5.400) (7.400)
Environmental Remediation - - - - -
Total Expenses $861.541 $1,016.758 $960.536 $972.395 $993.042
Net Surplus/(Deficit) ($665.538) ($830.509) ($783.340) ($799.425) ($823.959)
($ in millions)
MTA HEADQUARTERSFebruary Financial Plan 2017-2020
Accrual Statement of Operations by Category
VI-87
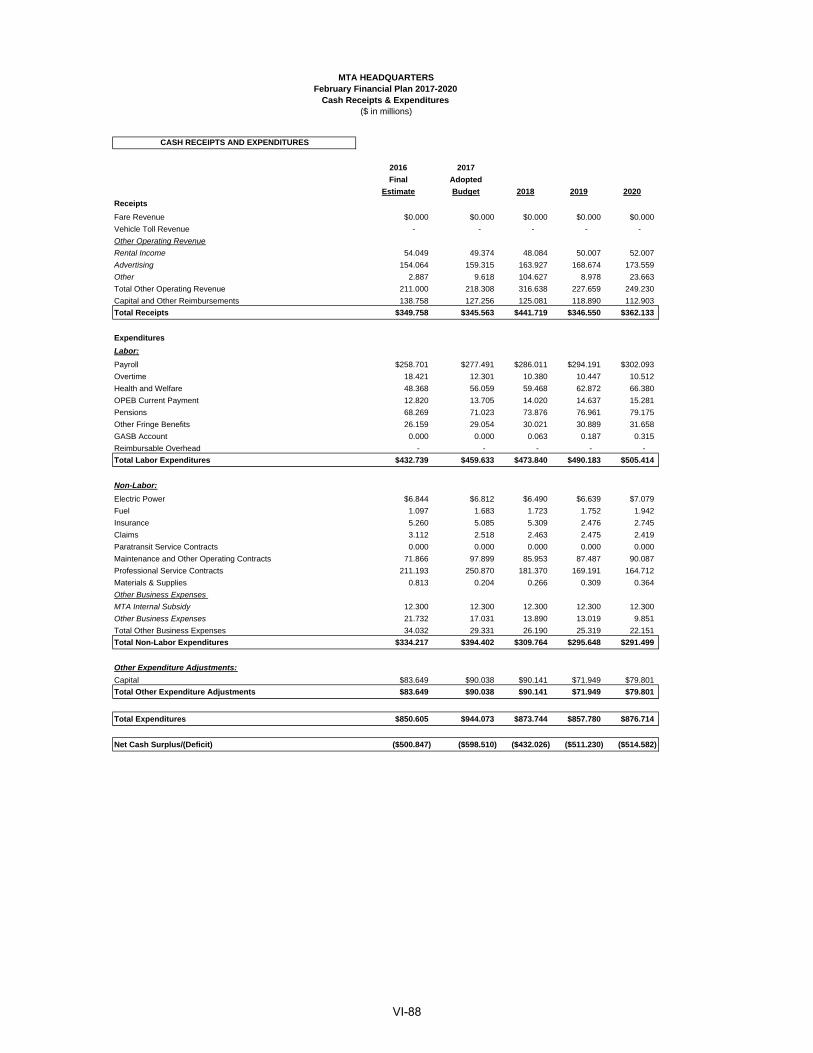
CASH RECEIPTS AND EXPENDITURES
2016 2017
Final Adopted
Estimate Budget 2018 2019 2020
Receipts
Fare Revenue $0.000 $0.000 $0.000 $0.000 $0.000
Vehicle Toll Revenue - - - - -
Other Operating Revenue
Rental Income 54.049 49.374 48.084 50.007 52.007
Advertising 154.064 159.315 163.927 168.674 173.559
Other 2.887 9.618 104.627 8.978 23.663
Total Other Operating Revenue 211.000 218.308 316.638 227.659 249.230
Capital and Other Reimbursements 138.758 127.256 125.081 118.890 112.903
Total Receipts $349.758 $345.563 $441.719 $346.550 $362.133
Expenditures
Labor:
Payroll $258.701 $277.491 $286.011 $294.191 $302.093
Overtime 18.421 12.301 10.380 10.447 10.512
Health and Welfare 48.368 56.059 59.468 62.872 66.380
OPEB Current Payment 12.820 13.705 14.020 14.637 15.281
Pensions 68.269 71.023 73.876 76.961 79.175
Other Fringe Benefits 26.159 29.054 30.021 30.889 31.658
GASB Account 0.000 0.000 0.063 0.187 0.315
Reimbursable Overhead - - - - -
Total Labor Expenditures $432.739 $459.633 $473.840 $490.183 $505.414
Non-Labor:
Electric Power $6.844 $6.812 $6.490 $6.639 $7.079
Fuel 1.097 1.683 1.723 1.752 1.942
Insurance 5.260 5.085 5.309 2.476 2.745
Claims 3.112 2.518 2.463 2.475 2.419
Paratransit Service Contracts 0.000 0.000 0.000 0.000 0.000
Maintenance and Other Operating Contracts 71.866 97.899 85.953 87.487 90.087
Professional Service Contracts 211.193 250.870 181.370 169.191 164.712
Materials & Supplies 0.813 0.204 0.266 0.309 0.364
Other Business Expenses
MTA Internal Subsidy 12.300 12.300 12.300 12.300 12.300
Other Business Expenses 21.732 17.031 13.890 13.019 9.851
Total Other Business Expenses 34.032 29.331 26.190 25.319 22.151
Total Non-Labor Expenditures $334.217 $394.402 $309.764 $295.648 $291.499
Other Expenditure Adjustments:
Capital $83.649 $90.038 $90.141 $71.949 $79.801
Total Other Expenditure Adjustments $83.649 $90.038 $90.141 $71.949 $79.801
Total Expenditures $850.605 $944.073 $873.744 $857.780 $876.714
Net Cash Surplus/(Deficit) ($500.847) ($598.510) ($432.026) ($511.230) ($514.582)
MTA HEADQUARTERSFebruary Financial Plan 2017-2020
Cash Receipts & Expenditures($ in millions)
VI-88
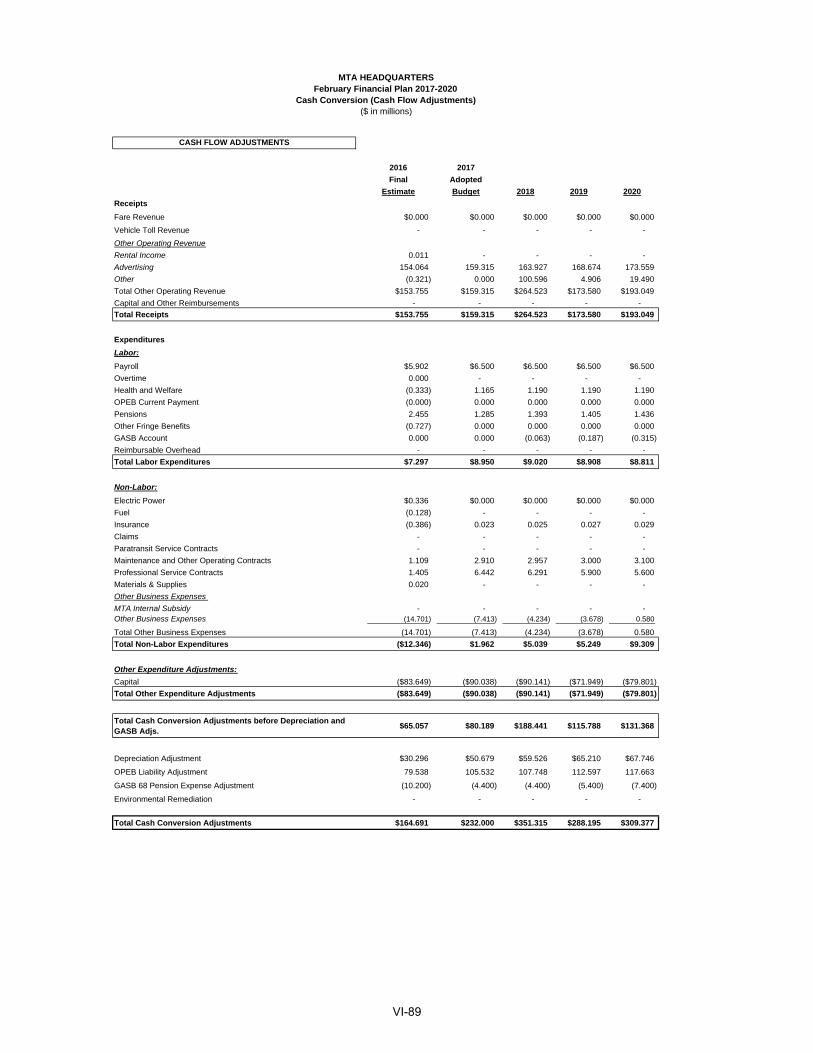
CASH FLOW ADJUSTMENTS
2016 2017
Final Adopted
Estimate Budget 2018 2019 2020
Receipts
Fare Revenue $0.000 $0.000 $0.000 $0.000 $0.000
Vehicle Toll Revenue - - - - -
Other Operating Revenue
Rental Income 0.011 - - - -
Advertising 154.064 159.315 163.927 168.674 173.559
Other (0.321) 0.000 100.596 4.906 19.490
Total Other Operating Revenue $153.755 $159.315 $264.523 $173.580 $193.049
Capital and Other Reimbursements - - - - -
Total Receipts $153.755 $159.315 $264.523 $173.580 $193.049
Expenditures
Labor:
Payroll $5.902 $6.500 $6.500 $6.500 $6.500
Overtime 0.000 - - - -
Health and Welfare (0.333) 1.165 1.190 1.190 1.190
OPEB Current Payment (0.000) 0.000 0.000 0.000 0.000
Pensions 2.455 1.285 1.393 1.405 1.436
Other Fringe Benefits (0.727) 0.000 0.000 0.000 0.000
GASB Account 0.000 0.000 (0.063) (0.187) (0.315)
Reimbursable Overhead - - - - -
Total Labor Expenditures $7.297 $8.950 $9.020 $8.908 $8.811
Non-Labor:
Electric Power $0.336 $0.000 $0.000 $0.000 $0.000
Fuel (0.128) - - - -
Insurance (0.386) 0.023 0.025 0.027 0.029
Claims - - - - -
Paratransit Service Contracts - - - - -
Maintenance and Other Operating Contracts 1.109 2.910 2.957 3.000 3.100
Professional Service Contracts 1.405 6.442 6.291 5.900 5.600
Materials & Supplies 0.020 - - - -
Other Business Expenses
MTA Internal Subsidy - - - - - Other Business Expenses (14.701) (7.413) (4.234) (3.678) 0.580
Total Other Business Expenses (14.701) (7.413) (4.234) (3.678) 0.580
Total Non-Labor Expenditures ($12.346) $1.962 $5.039 $5.249 $9.309
Other Expenditure Adjustments:
Capital ($83.649) ($90.038) ($90.141) ($71.949) ($79.801)
Total Other Expenditure Adjustments ($83.649) ($90.038) ($90.141) ($71.949) ($79.801)
Total Cash Conversion Adjustments before Depreciation and GASB Adjs.
$65.057 $80.189 $188.441 $115.788 $131.368
Depreciation Adjustment $30.296 $50.679 $59.526 $65.210 $67.746
OPEB Liability Adjustment 79.538 105.532 107.748 112.597 117.663
GASB 68 Pension Expense Adjustment (10.200) (4.400) (4.400) (5.400) (7.400)
Environmental Remediation - - - - -
Total Cash Conversion Adjustments $164.691 $232.000 $351.315 $288.195 $309.377
February Financial Plan 2017-2020Cash Conversion (Cash Flow Adjustments)
($ in millions)
MTA HEADQUARTERS
VI-89
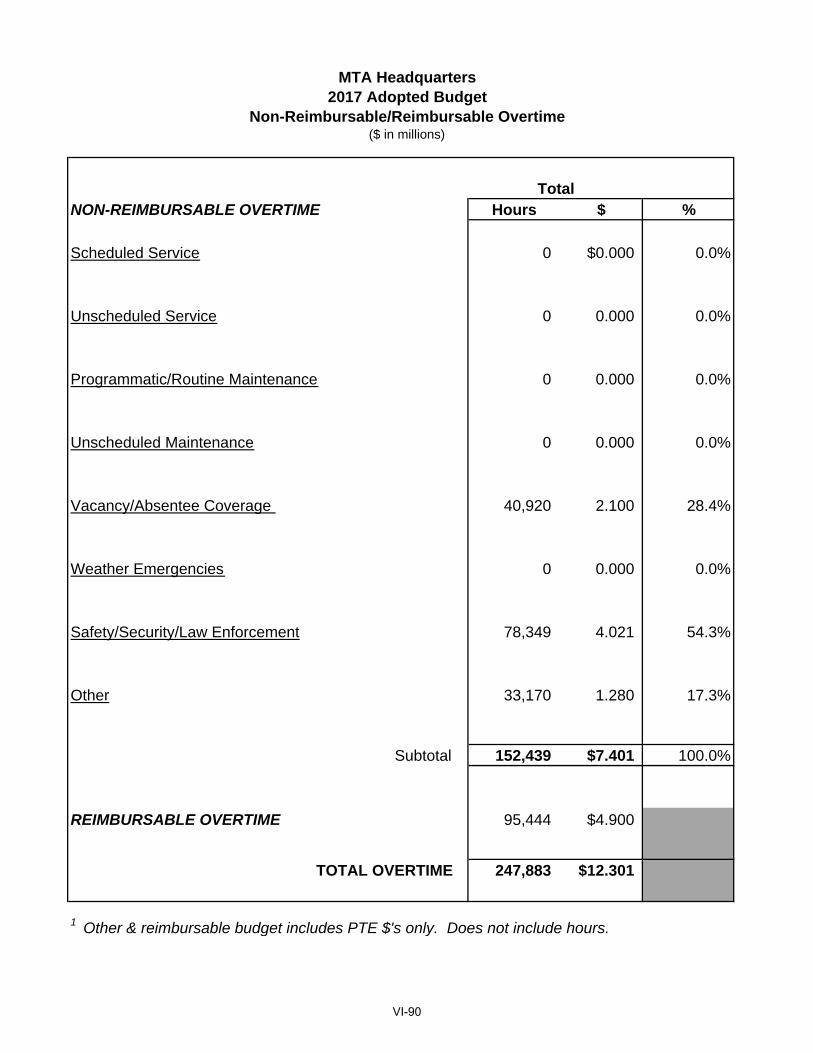
MTA Headquarters2017 Adopted Budget
Non-Reimbursable/Reimbursable Overtime ($ in millions)
NON-REIMBURSABLE OVERTIME Hours $ %
Scheduled Service 0 $0.000 0.0%
Unscheduled Service 0 0.000 0.0%
Programmatic/Routine Maintenance 0 0.000 0.0%
Unscheduled Maintenance 0 0.000 0.0%
Vacancy/Absentee Coverage 40,920 2.100 28.4%
Weather Emergencies 0 0.000 0.0%
Safety/Security/Law Enforcement 78,349 4.021 54.3%
Other 33,170 1.280 17.3%
Subtotal 152,439 $7.401 100.0%
REIMBURSABLE OVERTIME 95,444 $4.900
TOTAL OVERTIME 247,883 $12.301
1 Other & reimbursable budget includes PTE $'s only. Does not include hours.
Total
VI-90
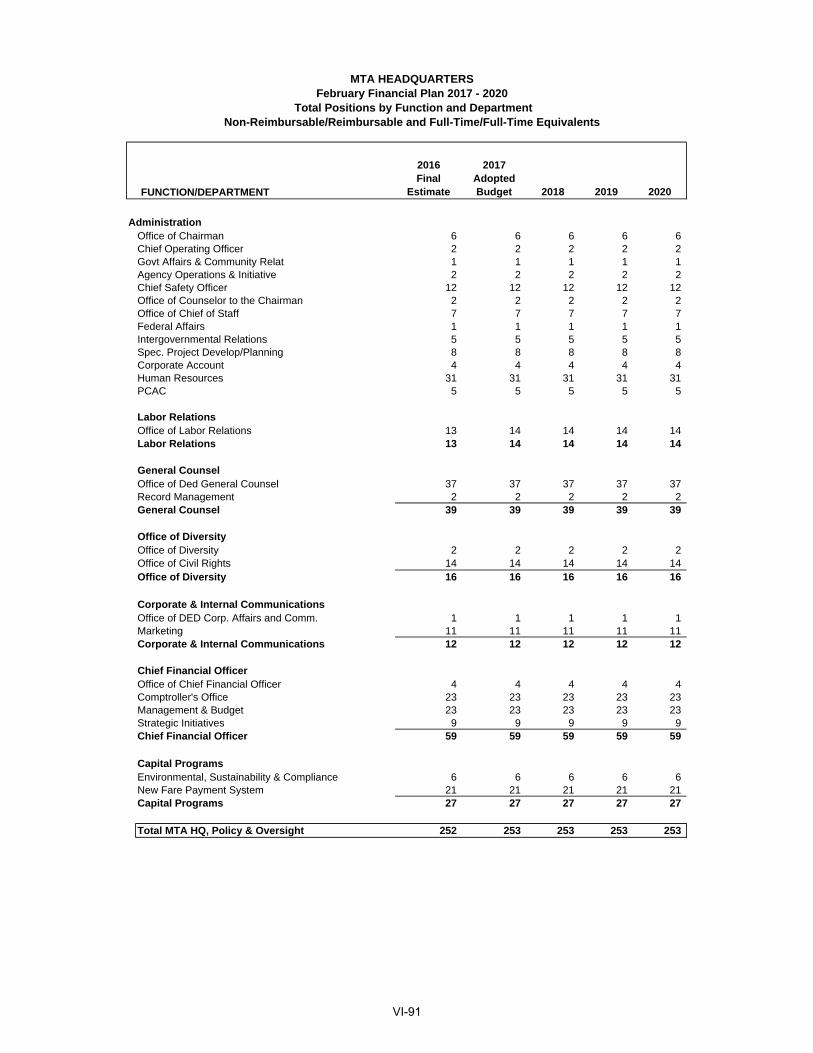
FUNCTION/DEPARTMENT
2016 Final
Estimate
2017 Adopted Budget 2018 2019 2020
AdministrationOffice of Chairman 6 6 6 6 6Chief Operating Officer 2 2 2 2 2Govt Affairs & Community Relat 1 1 1 1 1Agency Operations & Initiative 2 2 2 2 2Chief Safety Officer 12 12 12 12 12Office of Counselor to the Chairman 2 2 2 2 2Office of Chief of Staff 7 7 7 7 7Federal Affairs 1 1 1 1 1Intergovernmental Relations 5 5 5 5 5Spec. Project Develop/Planning 8 8 8 8 8Corporate Account 4 4 4 4 4Human Resources 31 31 31 31 31PCAC 5 5 5 5 5
Labor RelationsOffice of Labor Relations 13 14 14 14 14Labor Relations 13 14 14 14 14
General CounselOffice of Ded General Counsel 37 37 37 37 37Record Management 2 2 2 2 2General Counsel 39 39 39 39 39
Office of DiversityOffice of Diversity 2 2 2 2 2Office of Civil Rights 14 14 14 14 14Office of Diversity 16 16 16 16 16
Corporate & Internal Communications Office of DED Corp. Affairs and Comm. 1 1 1 1 1Marketing 11 11 11 11 11Corporate & Internal Communications 12 12 12 12 12
Chief Financial OfficerOffice of Chief Financial Officer 4 4 4 4 4Comptroller's Office 23 23 23 23 23Management & Budget 23 23 23 23 23Strategic Initiatives 9 9 9 9 9Chief Financial Officer 59 59 59 59 59
Capital Programs Environmental, Sustainability & Compliance 6 6 6 6 6New Fare Payment System 21 21 21 21 21Capital Programs 27 27 27 27 27
Total MTA HQ, Policy & Oversight 252 253 253 253 253
MTA HEADQUARTERSFebruary Financial Plan 2017 - 2020
Total Positions by Function and DepartmentNon-Reimbursable/Reimbursable and Full-Time/Full-Time Equivalents
VI-91

FUNCTION/DEPARTMENT
2016 Final
Estimate
2017 Adopted Budget 2018 2019 2020
MTA HEADQUARTERSFebruary Financial Plan 2017 - 2020
Total Positions by Function and DepartmentNon-Reimbursable/Reimbursable and Full-Time/Full-Time Equivalents
MTA Consolidated Functions
External Communication 15 15 15 15 15Audit 85 85 85 85 85Office of Diversity - MWDBE/ DBE Contract Integrity 16 16 16 16 16Pensions 63 63 63 63 63Occupational Health & Safety 17 17 17 17 17
General Counsel/ComplianceCompliance 10 10 10 10 10
Chief Financial Officer Director of Finance 6 6 6 6 6Treasury 18 18 18 18 18Risk and Insurance Management 23 23 23 23 23Real Estate 71 72 72 72 72Procurement 0 109 109 109 109Information Technology 1,100 1,127 1,131 1,135 1,135Chief Financial Officer 1,218 1,355 1,359 1,363 1,363
Capital Programs Office of Capital Programs 1 1 1 1 1Construction Oversight 5 5 5 5 5Federal Policy 1 1 1 1 1Enterprise Asset Management 9 9 9 9 9Capital Program Management 15 15 15 15 15Capital Program Funding 11 11 11 11 11Total Capital Programs 42 42 42 42 42
Corporate and Internal CommunicationsInternal Communications 3 3 3 3 3Arts for Transit 8 8 8 8 8Transit Museum Operations 13 13 13 13 13Retail Operations 5 5 5 5 5Corporate and Internal Communications 29 29 29 29 29
Total MTA Consolidated Functions 1,495 1,632 1,636 1,640 1,640
Business Service Center 359 317 317 317 317
Public Safety 812 871 871 891 945
Baseline Total Positions 2,918 3,073 3,077 3,101 3,155
Non-Reimbursable 2,781 2,936 2,940 2,964 3,018Reimbursable 137 137 137 137 137
Full-Time 2,918 3,073 3,077 3,101 3,155Full-Time Equivalents - - - - -
VI-92
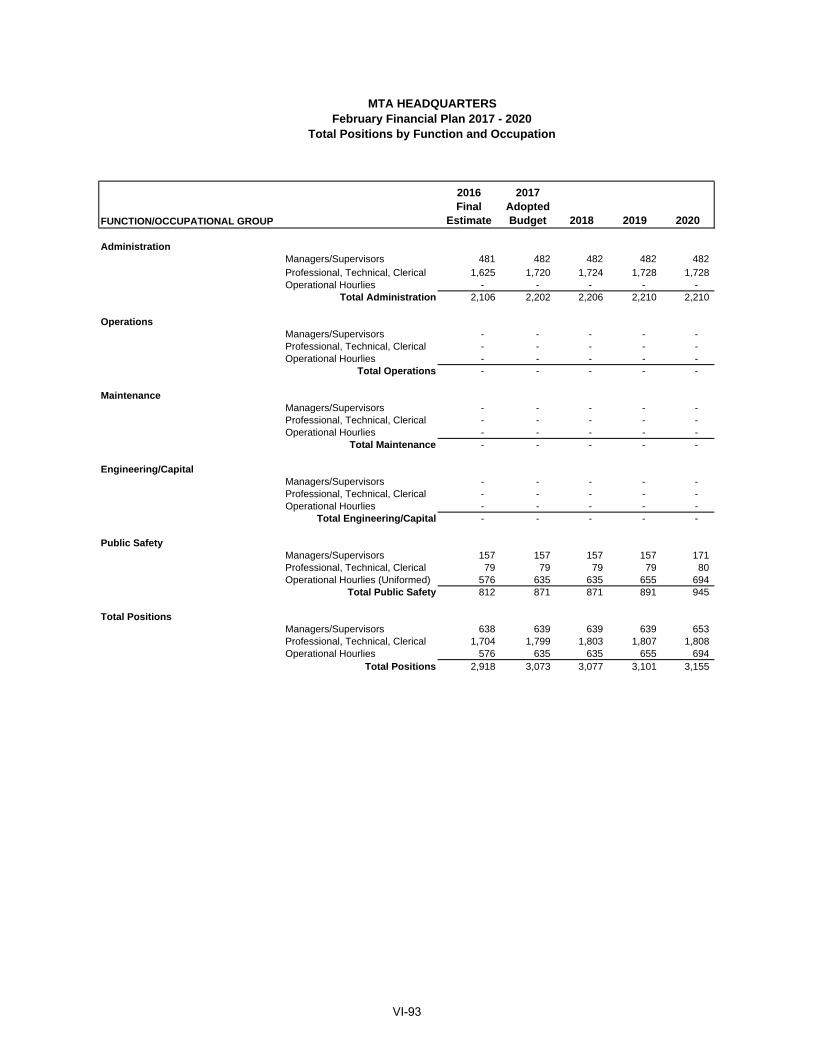
FUNCTION/OCCUPATIONAL GROUP
2016 Final
Estimate
2017 Adopted Budget 2018 2019 2020
Administration Managers/Supervisors 481 482 482 482 482 Professional, Technical, Clerical 1,625 1,720 1,724 1,728 1,728 Operational Hourlies - - - - -
Total Administration 2,106 2,202 2,206 2,210 2,210
Operations Managers/Supervisors - - - - - Professional, Technical, Clerical - - - - - Operational Hourlies - - - - -
Total Operations - - - - -
Maintenance Managers/Supervisors - - - - - Professional, Technical, Clerical - - - - - Operational Hourlies - - - - -
Total Maintenance - - - - -
Engineering/Capital Managers/Supervisors - - - - - Professional, Technical, Clerical - - - - - Operational Hourlies - - - - -
Total Engineering/Capital - - - - -
Public Safety Managers/Supervisors 157 157 157 157 171 Professional, Technical, Clerical 79 79 79 79 80 Operational Hourlies (Uniformed) 576 635 635 655 694
Total Public Safety 812 871 871 891 945
Total Positions Managers/Supervisors 638 639 639 639 653 Professional, Technical, Clerical 1,704 1,799 1,803 1,807 1,808 Operational Hourlies 576 635 635 655 694
Total Positions 2,918 3,073 3,077 3,101 3,155
MTA HEADQUARTERSFebruary Financial Plan 2017 - 2020
Total Positions by Function and Occupation
VI-93
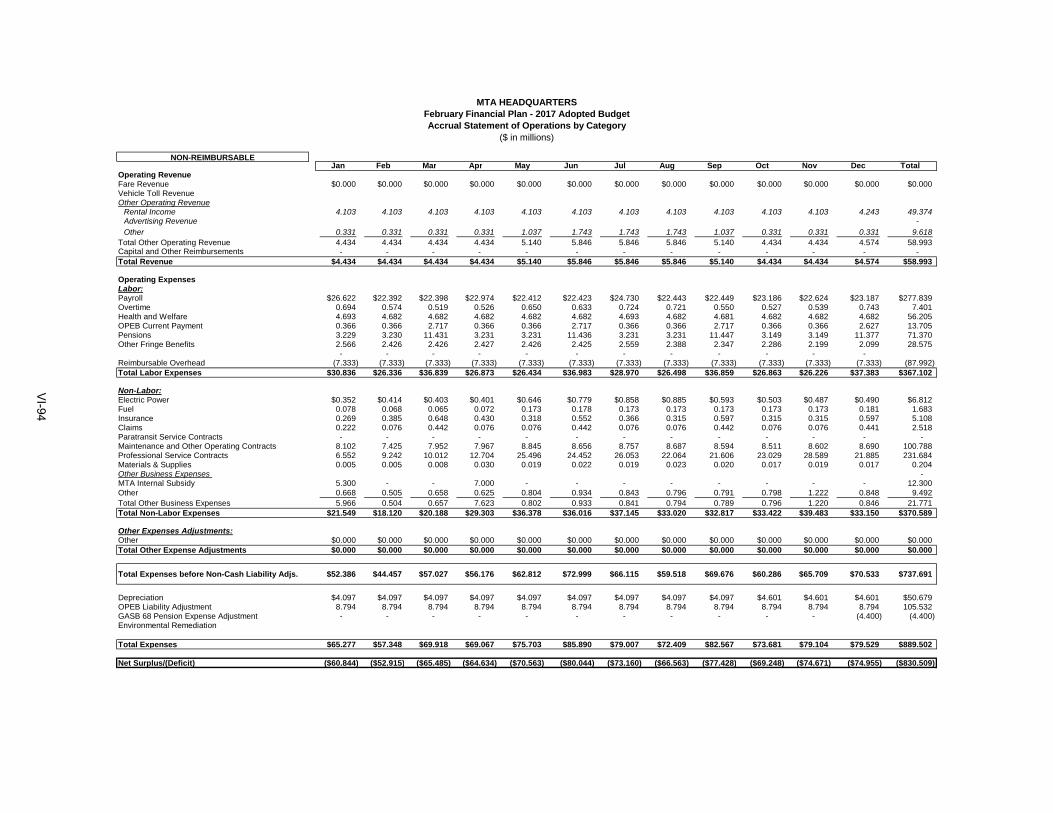
NON-REIMBURSABLEJan Feb Mar Apr May Jun Jul Aug Sep Oct Nov Dec Total
Operating RevenueFare Revenue $0.000 $0.000 $0.000 $0.000 $0.000 $0.000 $0.000 $0.000 $0.000 $0.000 $0.000 $0.000 $0.000Vehicle Toll RevenueOther Operating Revenue
Rental Income 4.103 4.103 4.103 4.103 4.103 4.103 4.103 4.103 4.103 4.103 4.103 4.243 49.374 Advertising Revenue - Other 0.331 0.331 0.331 0.331 1.037 1.743 1.743 1.743 1.037 0.331 0.331 0.331 9.618
Total Other Operating Revenue 4.434 4.434 4.434 4.434 5.140 5.846 5.846 5.846 5.140 4.434 4.434 4.574 58.993Capital and Other Reimbursements - - - - - - - - - - - - - Total Revenue $4.434 $4.434 $4.434 $4.434 $5.140 $5.846 $5.846 $5.846 $5.140 $4.434 $4.434 $4.574 $58.993
Operating ExpensesLabor:Payroll $26.622 $22.392 $22.398 $22.974 $22.412 $22.423 $24.730 $22.443 $22.449 $23.186 $22.624 $23.187 $277.839Overtime 0.694 0.574 0.519 0.526 0.650 0.633 0.724 0.721 0.550 0.527 0.539 0.743 7.401 Health and Welfare 4.693 4.682 4.682 4.682 4.682 4.682 4.693 4.682 4.681 4.682 4.682 4.682 56.205 OPEB Current Payment 0.366 0.366 2.717 0.366 0.366 2.717 0.366 0.366 2.717 0.366 0.366 2.627 13.705 Pensions 3.229 3.230 11.431 3.231 3.231 11.436 3.231 3.231 11.447 3.149 3.149 11.377 71.370 Other Fringe Benefits 2.566 2.426 2.426 2.427 2.426 2.425 2.559 2.388 2.347 2.286 2.199 2.099 28.575
- - - - - - - - - - - - Reimbursable Overhead (7.333) (7.333) (7.333) (7.333) (7.333) (7.333) (7.333) (7.333) (7.333) (7.333) (7.333) (7.333) (87.992) Total Labor Expenses $30.836 $26.336 $36.839 $26.873 $26.434 $36.983 $28.970 $26.498 $36.859 $26.863 $26.226 $37.383 $367.102
Non-Labor:Electric Power $0.352 $0.414 $0.403 $0.401 $0.646 $0.779 $0.858 $0.885 $0.593 $0.503 $0.487 $0.490 $6.812Fuel 0.078 0.068 0.065 0.072 0.173 0.178 0.173 0.173 0.173 0.173 0.173 0.181 1.683 Insurance 0.269 0.385 0.648 0.430 0.318 0.552 0.366 0.315 0.597 0.315 0.315 0.597 5.108 Claims 0.222 0.076 0.442 0.076 0.076 0.442 0.076 0.076 0.442 0.076 0.076 0.441 2.518 Paratransit Service Contracts - - - - - - - - - - - - - Maintenance and Other Operating Contracts 8.102 7.425 7.952 7.967 8.845 8.656 8.757 8.687 8.594 8.511 8.602 8.690 100.788 Professional Service Contracts 6.552 9.242 10.012 12.704 25.496 24.452 26.053 22.064 21.606 23.029 28.589 21.885 231.684 Materials & Supplies 0.005 0.005 0.008 0.030 0.019 0.022 0.019 0.023 0.020 0.017 0.019 0.017 0.204 Other Business Expenses - MTA Internal Subsidy 5.300 - - 7.000 - - - - - - - - 12.300 Other 0.668 0.505 0.658 0.625 0.804 0.934 0.843 0.796 0.791 0.798 1.222 0.848 9.492 Total Other Business Expenses 5.966 0.504 0.657 7.623 0.802 0.933 0.841 0.794 0.789 0.796 1.220 0.846 21.771Total Non-Labor Expenses $21.549 $18.120 $20.188 $29.303 $36.378 $36.016 $37.145 $33.020 $32.817 $33.422 $39.483 $33.150 $370.589
Other Expenses Adjustments:Other $0.000 $0.000 $0.000 $0.000 $0.000 $0.000 $0.000 $0.000 $0.000 $0.000 $0.000 $0.000 $0.000Total Other Expense Adjustments $0.000 $0.000 $0.000 $0.000 $0.000 $0.000 $0.000 $0.000 $0.000 $0.000 $0.000 $0.000 $0.000
Total Expenses before Non-Cash Liability Adjs. $52.386 $44.457 $57.027 $56.176 $62.812 $72.999 $66.115 $59.518 $69.676 $60.286 $65.709 $70.533 $737.691
Depreciation $4.097 $4.097 $4.097 $4.097 $4.097 $4.097 $4.097 $4.097 $4.097 $4.601 $4.601 $4.601 $50.679OPEB Liability Adjustment 8.794 8.794 8.794 8.794 8.794 8.794 8.794 8.794 8.794 8.794 8.794 8.794 105.532 GASB 68 Pension Expense Adjustment - - - - - - - - - - - (4.400) (4.400) Environmental Remediation
Total Expenses $65.277 $57.348 $69.918 $69.067 $75.703 $85.890 $79.007 $72.409 $82.567 $73.681 $79.104 $79.529 $889.502
Net Surplus/(Deficit) ($60.844) ($52.915) ($65.485) ($64.634) ($70.563) ($80.044) ($73.160) ($66.563) ($77.428) ($69.248) ($74.671) ($74.955) ($830.509)
MTA HEADQUARTERSFebruary Financial Plan - 2017 Adopted BudgetAccrual Statement of Operations by Category
($ in millions)
VI-94

REIMBURSABLEJan Feb Mar Apr May Jun Jul Aug Sep Oct Nov Dec Total
RevenueFare Revenue $0.000 $0.000 $0.000 $0.000 $0.000 $0.000 $0.000 $0.000 $0.000 $0.000 $0.000 $0.000 $0.000Vehicle Toll Revenue - - - - - - - - - - - - - Other Operating Revenue - - - - - - - - - - - - -
Rental Income - - - - - - - - - - - - - Advertising Revenue - - - - - - - - - - - - - Other - - - - - - - - - - - - -
Total Other Operating Revenue - - - - - - - - - - - - - Capital and Other Reimbursements 10.207 10.866 10.578 10.813 10.737 10.722 10.719 10.737 10.471 10.466 10.480 10.462 127.256 Total Revenue $10.207 $10.866 $10.578 $10.813 $10.737 $10.722 $10.719 $10.737 $10.471 $10.466 $10.480 $10.462 $127.256
ExpensesLabor:Payroll $0.513 $0.513 $0.513 $0.513 $0.513 $0.513 $0.513 $0.513 $0.513 $0.513 $0.513 $0.513 $6.153Overtime 0.492 0.492 0.492 0.492 0.492 0.492 0.492 0.492 0.242 0.242 0.242 0.242 4.900 Health and Welfare 0.085 0.085 0.085 0.085 0.085 0.085 0.085 0.085 0.085 0.085 0.085 0.085 1.019 OPEB Current Payment - - - - - - - - - - - - - Pensions 0.078 0.078 0.078 0.078 0.078 0.078 0.078 0.078 0.078 0.078 0.078 0.078 0.938 Other Fringe Benefits 0.042 0.042 0.042 0.042 0.042 0.042 0.042 0.042 0.040 0.038 0.034 0.033 0.479
Reimbursable Overhead 7.333 7.333 7.333 7.333 7.333 7.333 7.333 7.333 7.333 7.333 7.333 7.333 87.992 Total Labor Expenses $8.542 $8.542 $8.542 $8.542 $8.542 $8.542 $8.542 $8.542 $8.290 $8.289 $8.285 $8.283 $101.481
Non-Labor:Electric Power $0.000 $0.000 $0.000 $0.000 $0.000 $0.000 $0.000 $0.000 $0.000 $0.000 $0.000 $0.000 $0.000Fuel - - - - - - - - - - - - - Insurance - - - - - - - - - - - - - Claims - - - - - - - - - - - - - Paratransit Service Contracts - - - - - - - - - - - - - Maintenance and Other Operating Contracts 0.000 0.000 0.000 0.000 0.003 0.003 0.003 0.003 0.003 0.003 0.003 0.003 0.021 Professional Service Contracts 1.663 2.322 2.031 2.247 2.182 2.164 2.164 2.182 2.164 2.164 2.182 2.165 25.628 Materials & Supplies - Other Business Expenses
MTA Internal Subsidy - - - - - - - - - - - - - Other 0.002 0.002 0.006 0.024 0.011 0.014 0.011 0.011 0.014 0.011 0.011 0.011 0.126
Total Other Business Expenses 0.002 0.002 0.006 0.024 0.011 0.014 0.011 0.011 0.014 0.011 0.011 0.011 0.126Total Non-Labor Expenses $1.665 $2.324 $2.036 $2.271 $2.195 $2.180 $2.177 $2.195 $2.180 $2.177 $2.195 $2.178 $25.775
Other Expenses Adjustments:Other $0.000 $0.000 $0.000 $0.000 $0.000 $0.000 $0.000 $0.000 $0.000 $0.000 $0.000 $0.000 $0.000Total Other Expense Adjustments $0.000 $0.000 $0.000 $0.000 $0.000 $0.000 $0.000 $0.000 $0.000 $0.000 $0.000 $0.000 $0.000
Total Expenses before Depreciation $10.207 $10.866 $10.578 $10.813 $10.737 $10.722 $10.719 $10.737 $10.471 $10.466 $10.480 $10.462 $127.256
Depreciation $0.000 $0.000 $0.000 $0.000 $0.000 $0.000 $0.000 $0.000 $0.000 $0.000 $0.000 $0.000 $0.000
Total Expenses $10.207 $10.866 $10.578 $10.813 $10.737 $10.722 $10.719 $10.737 $10.471 $10.466 $10.480 $10.462 $127.256
Net Surplus/(Deficit) $0.000 $0.000 $0.000 $0.000 $0.000 $0.000 $0.000 $0.000 $0.000 $0.000 $0.000 $0.000 $0.000
February Financial Plan - 2017 Adopted BudgetAccrual Statement of Operations by Category
($ in millions)
MTA HEADQUARTERS
VI-95
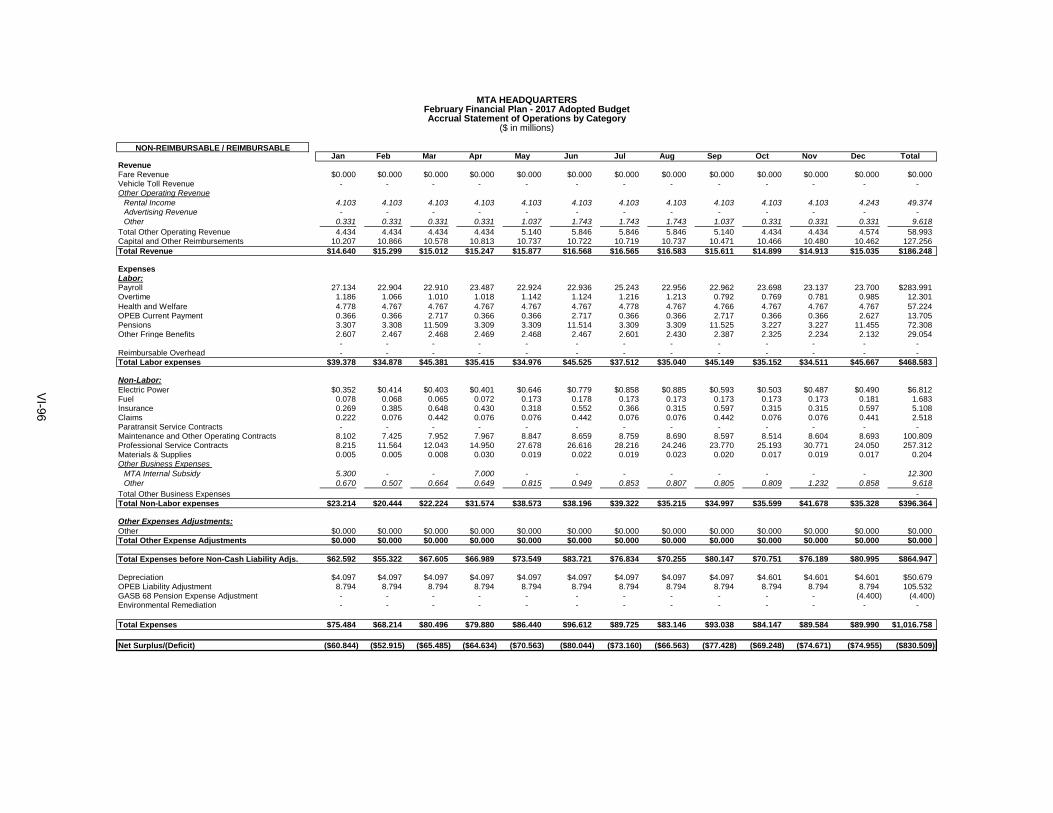
NON-REIMBURSABLE / REIMBURSABLEJan Feb Mar Apr May Jun Jul Aug Sep Oct Nov Dec Total
RevenueFare Revenue $0.000 $0.000 $0.000 $0.000 $0.000 $0.000 $0.000 $0.000 $0.000 $0.000 $0.000 $0.000 $0.000Vehicle Toll Revenue - - - - - - - - - - - - - Other Operating Revenue
Rental Income 4.103 4.103 4.103 4.103 4.103 4.103 4.103 4.103 4.103 4.103 4.103 4.243 49.374 Advertising Revenue - - - - - - - - - - - - - Other 0.331 0.331 0.331 0.331 1.037 1.743 1.743 1.743 1.037 0.331 0.331 0.331 9.618
Total Other Operating Revenue 4.434 4.434 4.434 4.434 5.140 5.846 5.846 5.846 5.140 4.434 4.434 4.574 58.993 Capital and Other Reimbursements 10.207 10.866 10.578 10.813 10.737 10.722 10.719 10.737 10.471 10.466 10.480 10.462 127.256 Total Revenue $14.640 $15.299 $15.012 $15.247 $15.877 $16.568 $16.565 $16.583 $15.611 $14.899 $14.913 $15.035 $186.248
ExpensesLabor:Payroll 27.134 22.904 22.910 23.487 22.924 22.936 25.243 22.956 22.962 23.698 23.137 23.700 $283.991Overtime 1.186 1.066 1.010 1.018 1.142 1.124 1.216 1.213 0.792 0.769 0.781 0.985 12.301 Health and Welfare 4.778 4.767 4.767 4.767 4.767 4.767 4.778 4.767 4.766 4.767 4.767 4.767 57.224 OPEB Current Payment 0.366 0.366 2.717 0.366 0.366 2.717 0.366 0.366 2.717 0.366 0.366 2.627 13.705 Pensions 3.307 3.308 11.509 3.309 3.309 11.514 3.309 3.309 11.525 3.227 3.227 11.455 72.308 Other Fringe Benefits 2.607 2.467 2.468 2.469 2.468 2.467 2.601 2.430 2.387 2.325 2.234 2.132 29.054
- - - - - - - - - - - - - Reimbursable Overhead - - - - - - - - - - - - - Total Labor expenses $39.378 $34.878 $45.381 $35.415 $34.976 $45.525 $37.512 $35.040 $45.149 $35.152 $34.511 $45.667 $468.583
Non-Labor:Electric Power $0.352 $0.414 $0.403 $0.401 $0.646 $0.779 $0.858 $0.885 $0.593 $0.503 $0.487 $0.490 $6.812Fuel 0.078 0.068 0.065 0.072 0.173 0.178 0.173 0.173 0.173 0.173 0.173 0.181 1.683 Insurance 0.269 0.385 0.648 0.430 0.318 0.552 0.366 0.315 0.597 0.315 0.315 0.597 5.108 Claims 0.222 0.076 0.442 0.076 0.076 0.442 0.076 0.076 0.442 0.076 0.076 0.441 2.518 Paratransit Service Contracts - - - - - - - - - - - - - Maintenance and Other Operating Contracts 8.102 7.425 7.952 7.967 8.847 8.659 8.759 8.690 8.597 8.514 8.604 8.693 100.809 Professional Service Contracts 8.215 11.564 12.043 14.950 27.678 26.616 28.216 24.246 23.770 25.193 30.771 24.050 257.312 Materials & Supplies 0.005 0.005 0.008 0.030 0.019 0.022 0.019 0.023 0.020 0.017 0.019 0.017 0.204 Other Business Expenses
MTA Internal Subsidy 5.300 - - 7.000 - - - - - - - - 12.300 Other 0.670 0.507 0.664 0.649 0.815 0.949 0.853 0.807 0.805 0.809 1.232 0.858 9.618
Total Other Business Expenses - Total Non-Labor expenses $23.214 $20.444 $22.224 $31.574 $38.573 $38.196 $39.322 $35.215 $34.997 $35.599 $41.678 $35.328 $396.364
Other Expenses Adjustments:Other $0.000 $0.000 $0.000 $0.000 $0.000 $0.000 $0.000 $0.000 $0.000 $0.000 $0.000 $0.000 $0.000Total Other Expense Adjustments $0.000 $0.000 $0.000 $0.000 $0.000 $0.000 $0.000 $0.000 $0.000 $0.000 $0.000 $0.000 $0.000
Total Expenses before Non-Cash Liability Adjs. $62.592 $55.322 $67.605 $66.989 $73.549 $83.721 $76.834 $70.255 $80.147 $70.751 $76.189 $80.995 $864.947
Depreciation $4.097 $4.097 $4.097 $4.097 $4.097 $4.097 $4.097 $4.097 $4.097 $4.601 $4.601 $4.601 $50.679OPEB Liability Adjustment 8.794 8.794 8.794 8.794 8.794 8.794 8.794 8.794 8.794 8.794 8.794 8.794 105.532 GASB 68 Pension Expense Adjustment - - - - - - - - - - - (4.400) (4.400) Environmental Remediation - - - - - - - - - - - - -
Total Expenses $75.484 $68.214 $80.496 $79.880 $86.440 $96.612 $89.725 $83.146 $93.038 $84.147 $89.584 $89.990 $1,016.758
Net Surplus/(Deficit) ($60.844) ($52.915) ($65.485) ($64.634) ($70.563) ($80.044) ($73.160) ($66.563) ($77.428) ($69.248) ($74.671) ($74.955) ($830.509)
($ in millions)
MTA HEADQUARTERSFebruary Financial Plan - 2017 Adopted BudgetAccrual Statement of Operations by Category
VI-96

CASH RECEIPTS AND EXPENDITURESJan Feb Mar Apr May Jun Jul Aug Sep Oct Nov Dec Total
ReceiptsFare Revenue $0.000 $0.000 $0.000 $0.000 $0.000 $0.000 $0.000 $0.000 $0.000 $0.000 $0.000 $0.000 $0.000Vehicle Toll Revenue - - - - - - - - - - - - - Other Operating Revenue
Rental Income 4.103 4.103 4.103 4.103 4.103 4.103 4.103 4.103 4.103 4.103 4.103 4.243 49.374 Advertising Revenue 79.658 7.242 7.242 7.242 7.242 7.242 7.242 7.242 7.242 7.242 7.242 7.242 159.315 Other 0.331 0.331 0.331 0.331 1.037 1.743 1.743 1.743 1.037 0.331 0.331 0.331 9.618
Total Other Operating Revenue 84.091 11.675 11.675 11.675 12.381 13.088 13.088 13.088 12.381 11.675 11.675 11.815 218.308 Capital and Other Reimbursements 10.207 10.866 10.578 10.813 10.737 10.722 10.719 10.737 10.471 10.466 10.480 10.462 127.256 Total Receipts $94.298 $22.541 $22.253 $22.488 $23.118 $23.810 $23.806 $23.825 $22.852 $22.141 $22.155 $22.277 $345.563
ExpendituresLabor:Payroll $26.134 $23.404 $19.660 $22.487 $23.924 $21.936 $24.243 $23.706 $21.962 $23.198 $24.137 $22.700 $277.491Overtime 1.186 1.066 1.010 1.018 1.142 1.124 1.216 1.213 0.792 0.769 0.781 0.985 12.301 Health and Welfare 4.681 4.670 4.670 4.670 4.670 4.670 4.681 4.670 4.669 4.670 4.670 4.670 56.059 OPEB Current Payment 0.366 0.366 2.717 0.366 0.366 2.717 0.366 0.366 2.717 0.366 0.366 2.627 13.705 Pensions 4.671 4.672 4.743 4.673 4.673 4.747 4.673 4.673 4.759 4.591 4.591 19.555 71.023 Other Fringe Benefits 2.607 2.467 2.468 2.469 2.468 2.467 2.601 2.430 2.387 2.325 2.234 2.132 29.054 GASB Account - - - - - - - - - - - - - Reimbursable Overhead 0.000 0.000 0.000 0.000 0.000 0.000 0.000 0.000 0.000 0.000 0.000 0.000 0.000 Total Labor Expenditures $39.645 $36.645 $35.268 $35.682 $37.243 $37.661 $37.779 $37.057 $37.286 $35.919 $36.778 $52.670 $459.633
Non-Labor:Electric Power $0.352 $0.414 $0.403 $0.401 $0.646 $0.779 $0.858 $0.885 $0.593 $0.503 $0.487 $0.490 $6.812Fuel 0.078 0.068 0.065 0.072 0.173 0.178 0.173 0.173 0.173 0.173 0.173 0.181 1.683 Insurance 0.264 0.385 0.648 0.424 0.318 0.552 0.360 0.315 0.597 0.309 0.315 0.597 5.085 Claims 0.222 0.076 0.442 0.076 0.076 0.442 0.076 0.076 0.442 0.076 0.076 0.441 2.518 Paratransit Service Contracts - - - - - - - - - - - - - Maintenance and Other Operating Contracts 7.602 7.675 8.202 7.634 8.514 8.325 8.456 8.387 8.293 8.181 8.271 8.359 97.899 Professional Service Contracts 7.227 11.070 12.290 15.221 27.948 26.533 28.084 24.114 23.638 23.546 29.124 22.074 250.870 Materials & Supplies 0.005 0.005 0.008 0.030 0.019 0.022 0.019 0.023 0.020 0.017 0.019 0.017 0.204 Other Business Expenses
MTA Internal Subsidy 5.300 - - 7.000 - - - - - - - - 12.300 Other 1.287 1.125 1.282 1.267 1.432 1.566 1.471 1.424 1.423 1.426 1.850 1.476 17.031
Total Other Business Expenses 6.586 1.123 1.280 8.265 1.431 1.565 1.470 1.423 1.421 1.425 1.848 1.474 29.310 Total Non-Labor Expenditures $22.338 $20.818 $23.339 $32.123 $39.128 $38.398 $39.499 $35.397 $35.180 $34.231 $40.315 $33.636 $394.402
Other Expenditure Adjustments:Capital $7.503 $7.503 $7.503 $7.503 $7.503 $7.503 $7.503 $7.503 $7.503 $7.503 $7.503 $7.503 $90.038Total Other Expenditure Adjustments $7.503 $7.503 $7.503 $7.503 $7.503 $7.503 $7.503 $7.503 $7.503 $7.503 $7.503 $7.503 $90.038
Total Expenditures $69.486 $64.966 $66.109 $75.308 $83.874 $83.562 $84.781 $79.958 $79.969 $77.653 $84.597 $93.809 $944.073
Net Cash Surplus/(Deficit) $24.811 ($42.426) ($43.856) ($52.820) ($60.756) ($59.752) ($60.975) ($56.133) ($57.117) ($55.513) ($62.442) ($71.532) ($598.510)
MTA HEADQUARTERSFebruary Financial Plan - 2017 Adopted Budget
Cash Receipts & Expenditures($ in millions)
VI-97
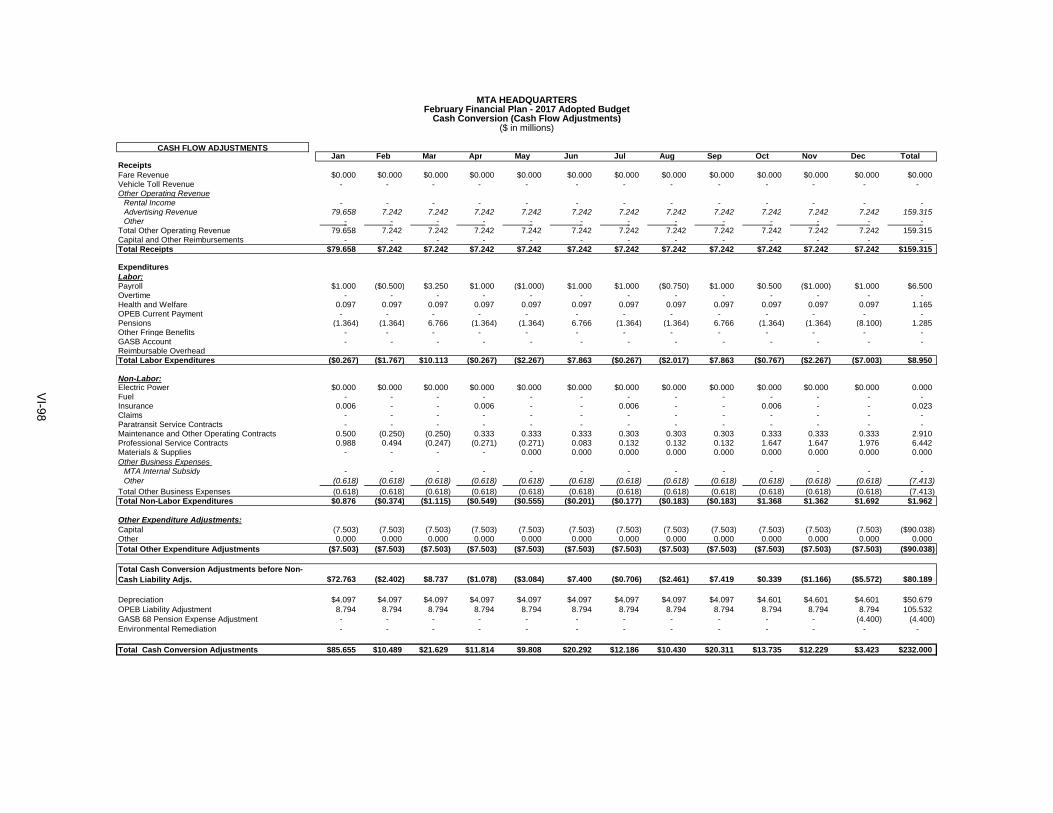
CASH FLOW ADJUSTMENTSJan Feb Mar Apr May Jun Jul Aug Sep Oct Nov Dec Total
ReceiptsFare Revenue $0.000 $0.000 $0.000 $0.000 $0.000 $0.000 $0.000 $0.000 $0.000 $0.000 $0.000 $0.000 $0.000Vehicle Toll Revenue - - - - - - - - - - - - - Other Operating Revenue
Rental Income - - - - - - - - - - - - - Advertising Revenue 79.658 7.242 7.242 7.242 7.242 7.242 7.242 7.242 7.242 7.242 7.242 7.242 159.315 Other - - - - - - - - - - - - -
Total Other Operating Revenue 79.658 7.242 7.242 7.242 7.242 7.242 7.242 7.242 7.242 7.242 7.242 7.242 159.315 Capital and Other Reimbursements - - - - - - - - - - - - - Total Receipts $79.658 $7.242 $7.242 $7.242 $7.242 $7.242 $7.242 $7.242 $7.242 $7.242 $7.242 $7.242 $159.315
ExpendituresLabor:Payroll $1.000 ($0.500) $3.250 $1.000 ($1.000) $1.000 $1.000 ($0.750) $1.000 $0.500 ($1.000) $1.000 $6.500Overtime - - - - - - - - - - - - - Health and Welfare 0.097 0.097 0.097 0.097 0.097 0.097 0.097 0.097 0.097 0.097 0.097 0.097 1.165 OPEB Current Payment - - - - - - - - - - - - - Pensions (1.364) (1.364) 6.766 (1.364) (1.364) 6.766 (1.364) (1.364) 6.766 (1.364) (1.364) (8.100) 1.285 Other Fringe Benefits - - - - - - - - - - - - - GASB Account - - - - - - - - - - - - - Reimbursable Overhead Total Labor Expenditures ($0.267) ($1.767) $10.113 ($0.267) ($2.267) $7.863 ($0.267) ($2.017) $7.863 ($0.767) ($2.267) ($7.003) $8.950
Non-Labor:Electric Power $0.000 $0.000 $0.000 $0.000 $0.000 $0.000 $0.000 $0.000 $0.000 $0.000 $0.000 $0.000 0.000Fuel - - - - - - - - - - - - - Insurance 0.006 - - 0.006 - - 0.006 - - 0.006 - - 0.023 Claims - - - - - - - - - - - - - Paratransit Service Contracts - - - - - - - - - - - - - Maintenance and Other Operating Contracts 0.500 (0.250) (0.250) 0.333 0.333 0.333 0.303 0.303 0.303 0.333 0.333 0.333 2.910 Professional Service Contracts 0.988 0.494 (0.247) (0.271) (0.271) 0.083 0.132 0.132 0.132 1.647 1.647 1.976 6.442 Materials & Supplies - - - - 0.000 0.000 0.000 0.000 0.000 0.000 0.000 0.000 0.000 Other Business Expenses
MTA Internal Subsidy - - - - - - - - - - - - - Other (0.618) (0.618) (0.618) (0.618) (0.618) (0.618) (0.618) (0.618) (0.618) (0.618) (0.618) (0.618) (7.413)
Total Other Business Expenses (0.618) (0.618) (0.618) (0.618) (0.618) (0.618) (0.618) (0.618) (0.618) (0.618) (0.618) (0.618) (7.413) Total Non-Labor Expenditures $0.876 ($0.374) ($1.115) ($0.549) ($0.555) ($0.201) ($0.177) ($0.183) ($0.183) $1.368 $1.362 $1.692 $1.962
Other Expenditure Adjustments:Capital (7.503) (7.503) (7.503) (7.503) (7.503) (7.503) (7.503) (7.503) (7.503) (7.503) (7.503) (7.503) ($90.038)Other 0.000 0.000 0.000 0.000 0.000 0.000 0.000 0.000 0.000 0.000 0.000 0.000 0.000Total Other Expenditure Adjustments ($7.503) ($7.503) ($7.503) ($7.503) ($7.503) ($7.503) ($7.503) ($7.503) ($7.503) ($7.503) ($7.503) ($7.503) ($90.038)
Total Cash Conversion Adjustments before Non-Cash Liability Adjs. $72.763 ($2.402) $8.737 ($1.078) ($3.084) $7.400 ($0.706) ($2.461) $7.419 $0.339 ($1.166) ($5.572) $80.189
Depreciation $4.097 $4.097 $4.097 $4.097 $4.097 $4.097 $4.097 $4.097 $4.097 $4.601 $4.601 $4.601 $50.679OPEB Liability Adjustment 8.794 8.794 8.794 8.794 8.794 8.794 8.794 8.794 8.794 8.794 8.794 8.794 105.532 GASB 68 Pension Expense Adjustment - - - - - - - - - - - (4.400) (4.400) Environmental Remediation - - - - - - - - - - - - -
Total Cash Conversion Adjustments $85.655 $10.489 $21.629 $11.814 $9.808 $20.292 $12.186 $10.430 $20.311 $13.735 $12.229 $3.423 $232.000
MTA HEADQUARTERSFebruary Financial Plan - 2017 Adopted Budget
Cash Conversion (Cash Flow Adjustments)($ in millions)
VI-98

MTA HEADQUARTERSFebruary Financial Plan - 2017
Adopted BudgetOvertime - Non-Reimbursable/Reimbursable Basis
($ in millions)
Jan Feb Mar Apr May Jun Jul Aug Sep Oct Nov Dec Total$ $ $ $ $ $ $ $ $ $ $ $ $
NON-REIMBURSABLE OVERTIME
Scheduled Service - - - - - - - - - - - - -
Unscheduled Service - - - - - - - - - - - - -
Programmatic/Routine Maintenance - - - - - - - - - - - - -
Unscheduled Maintenance - - - - - - - - - - - - -
Vacancy/Absentee Coverage 0.202$ 0.160$ 0.141$ 0.144$ 0.187$ 0.180$ 0.212$ 0.211$ 0.152$ 0.144$ 0.148$ 0.218$ $2.100
Weather Emergencies - - - - - - - - - - - - $0.000
Safety/Security/Law Enforcement 0.386 0.307 0.271 0.275 0.357 0.346 0.406 0.404 0.291 0.276 0.284 0.418 $4.021
Other 0.107 0.107 0.107 0.107 0.107 0.107 0.107 0.107 0.107 0.107 0.107 0.107 $1.280
Sub-Total $0.694 $0.574 $0.519 $0.526 $0.650 $0.633 $0.724 $0.721 $0.550 $0.527 $0.539 $0.743 $7.401
REIMBURSABLE OVERTIME $0.492 $0.492 $0.492 $0.492 $0.492 $0.492 $0.492 $0.492 $0.242 $0.242 $0.242 $0.242 $4.900
TOTAL NR & R OVERTIME $1.186 $1.066 $1.010 $1.018 $1.142 $1.124 $1.216 $1.213 $0.792 $0.769 $0.781 $0.985 $12.301
VI-99
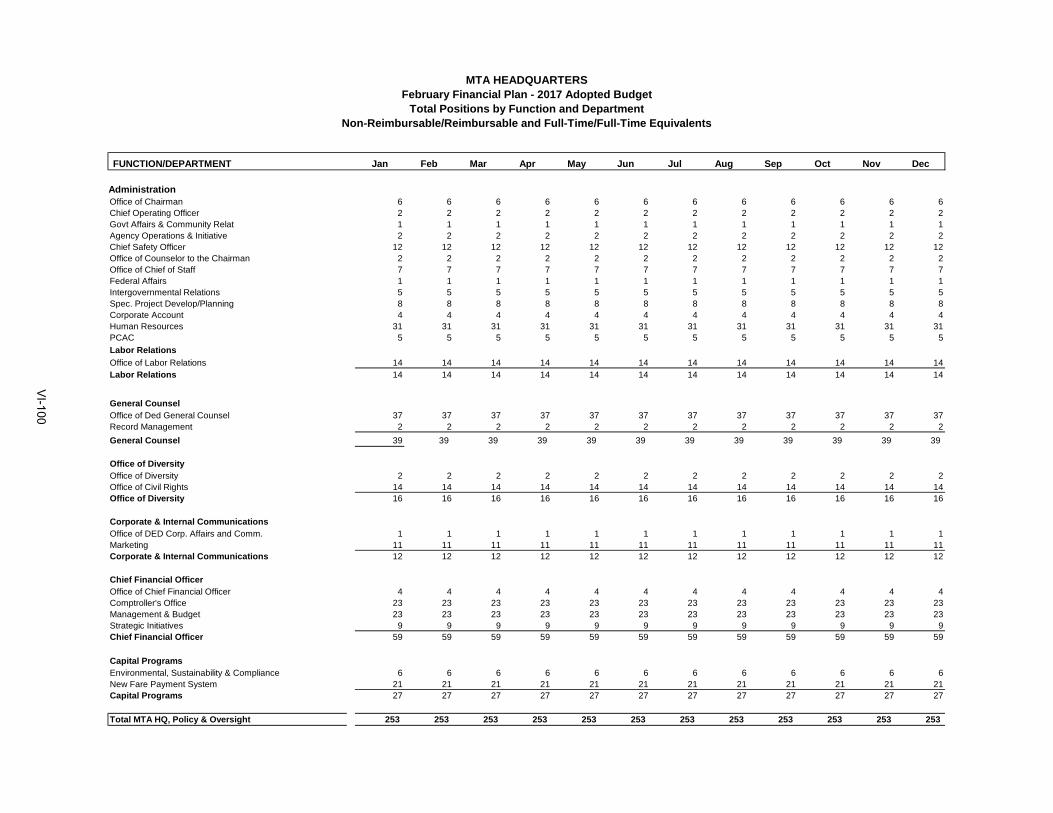
Jan Feb Mar Apr May Jun Jul Aug Sep Oct Nov Dec
AdministrationOffice of Chairman 6 6 6 6 6 6 6 6 6 6 6 6Chief Operating Officer 2 2 2 2 2 2 2 2 2 2 2 2Govt Affairs & Community Relat 1 1 1 1 1 1 1 1 1 1 1 1Agency Operations & Initiative 2 2 2 2 2 2 2 2 2 2 2 2Chief Safety Officer 12 12 12 12 12 12 12 12 12 12 12 12Office of Counselor to the Chairman 2 2 2 2 2 2 2 2 2 2 2 2Office of Chief of Staff 7 7 7 7 7 7 7 7 7 7 7 7Federal Affairs 1 1 1 1 1 1 1 1 1 1 1 1Intergovernmental Relations 5 5 5 5 5 5 5 5 5 5 5 5Spec. Project Develop/Planning 8 8 8 8 8 8 8 8 8 8 8 8Corporate Account 4 4 4 4 4 4 4 4 4 4 4 4Human Resources 31 31 31 31 31 31 31 31 31 31 31 31PCAC 5 5 5 5 5 5 5 5 5 5 5 5
Labor Relations
Office of Labor Relations 14 14 14 14 14 14 14 14 14 14 14 14Labor Relations 14 14 14 14 14 14 14 14 14 14 14 14
General CounselOffice of Ded General Counsel 37 37 37 37 37 37 37 37 37 37 37 37Record Management 2 2 2 2 2 2 2 2 2 2 2 2
General Counsel 39 39 39 39 39 39 39 39 39 39 39 39
Office of DiversityOffice of Diversity 2 2 2 2 2 2 2 2 2 2 2 2Office of Civil Rights 14 14 14 14 14 14 14 14 14 14 14 14Office of Diversity 16 16 16 16 16 16 16 16 16 16 16 16
Corporate & Internal Communications Office of DED Corp. Affairs and Comm. 1 1 1 1 1 1 1 1 1 1 1 1Marketing 11 11 11 11 11 11 11 11 11 11 11 11Corporate & Internal Communications 12 12 12 12 12 12 12 12 12 12 12 12
Chief Financial OfficerOffice of Chief Financial Officer 4 4 4 4 4 4 4 4 4 4 4 4Comptroller's Office 23 23 23 23 23 23 23 23 23 23 23 23Management & Budget 23 23 23 23 23 23 23 23 23 23 23 23Strategic Initiatives 9 9 9 9 9 9 9 9 9 9 9 9Chief Financial Officer 59 59 59 59 59 59 59 59 59 59 59 59
Capital Programs Environmental, Sustainability & Compliance 6 6 6 6 6 6 6 6 6 6 6 6New Fare Payment System 21 21 21 21 21 21 21 21 21 21 21 21Capital Programs 27 27 27 27 27 27 27 27 27 27 27 27
Total MTA HQ, Policy & Oversight 253 253 253 253 253 253 253 253 253 253 253 253
February Financial Plan - 2017 Adopted BudgetTotal Positions by Function and Department
Non-Reimbursable/Reimbursable and Full-Time/Full-Time Equivalents
MTA HEADQUARTERS
FUNCTION/DEPARTMENT
VI-100

Jan Feb Mar Apr May Jun Jul Aug Sep Oct Nov Dec
February Financial Plan - 2017 Adopted BudgetTotal Positions by Function and Department
Non-Reimbursable/Reimbursable and Full-Time/Full-Time Equivalents
FUNCTION/DEPARTMENT
MTA Consolidated Functions
External Communication 15 15 15 15 15 15 15 15 15 15 15 15Audit 85 85 85 85 85 85 85 85 85 85 85 85Office of Diversity - MWDBE/ DBE Contract Integrity 16 16 16 16 16 16 16 16 16 16 16 16Pensions 63 63 63 63 63 63 63 63 63 63 63 63Occupational Health & Safety 17 17 17 17 17 17 17 17 17 17 17 17
General Counsel/ComplianceCompliance 10 10 10 10 10 10 10 10 10 10 10 10
Chief Financial Officer Director of Finance 6 6 6 6 6 6 6 6 6 6 6 6 Treasury 18 18 18 18 18 18 18 18 18 18 18 18 Risk and Insurance Management 23 23 23 23 23 23 23 23 23 23 23 23 Real Estate 73 73 73 73 73 73 73 73 73 72 72 72 Procurement 42 42 42 109 109 109 109 109 109 109 109 109 Information Technology 1,120 1,120 1,120 1,127 1,127 1,127 1,127 1,127 1,127 1,127 1,127 1,127 Chief Financial Officer 1,282 1,282 1,282 1,356 1,356 1,356 1,356 1,356 1,356 1,355 1,355 1,355
Capital Programs Office of Capital Programs 1 1 1 1 1 1 1 1 1 1 1 1Construction Oversight 5 5 5 5 5 5 5 5 5 5 5 5Federal Policy 1 1 1 1 1 1 1 1 1 1 1 1Enterprise Asset Management 9 9 9 9 9 9 9 9 9 9 9 9Capital Program Management 15 15 15 15 15 15 15 15 15 15 15 15Capital Program Funding 11 11 11 11 11 11 11 11 11 11 11 11Total Capital Programs 42 42 42 42 42 42 42 42 42 42 42 42
Corporate and Internal CommunicationsInternal Communications 3 3 3 3 3 3 3 3 3 3 3 3Arts for Transit 8 8 8 8 8 8 8 8 8 8 8 8Transit Museum Operations 13 13 13 13 13 13 13 13 13 13 13 13Retail Operations 5 5 5 5 5 5 5 5 5 5 5 5Corporate and Internal Communications 29 29 29 29 29 29 29 29 29 29 29 29
Total MTA Consolidated Functions 1,559 1,559 1,559 1,633 1,633 1,633 1,633 1,633 1,633 1,632 1,632 1,632
Business Service Center 317 317 317 317 317 317 317 317 317 317 317 317
Public Safety 869 869 869 869 869 869 869 869 869 871 871 871
Baseline Total Positions 2,998 2,998 2,998 3,072 3,072 3,072 3,072 3,072 3,072 3,073 3,073 3,073
Non-Reimbursable 2,861 2,861 2,861 2,935 2,935 2,935 2,935 2,935 2,935 2,936 2,936 2,936Reimbursable 137 137 137 137 137 137 137 137 137 137 137 137
Full-Time 2,998 2,998 2,998 3,072 3,072 3,072 3,072 3,072 3,072 3,073 3,073 3,073
VI-101
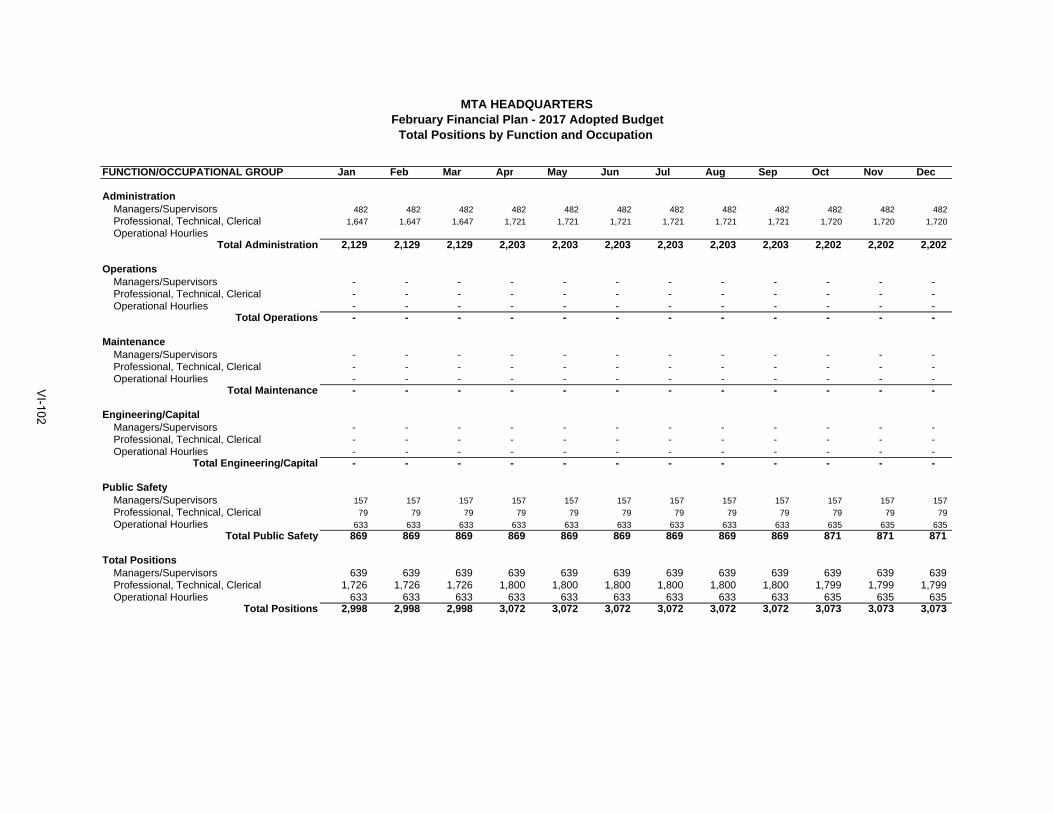
FUNCTION/OCCUPATIONAL GROUP Jan Feb Mar Apr May Jun Jul Aug Sep Oct Nov Dec
Administration Managers/Supervisors 482 482 482 482 482 482 482 482 482 482 482 482
Professional, Technical, Clerical 1,647 1,647 1,647 1,721 1,721 1,721 1,721 1,721 1,721 1,720 1,720 1,720
Operational HourliesTotal Administration 2,129 2,129 2,129 2,203 2,203 2,203 2,203 2,203 2,203 2,202 2,202 2,202
Operations Managers/Supervisors - - - - - - - - - - - - Professional, Technical, Clerical - - - - - - - - - - - - Operational Hourlies - - - - - - - - - - - -
Total Operations - - - - - - - - - - - -
Maintenance Managers/Supervisors - - - - - - - - - - - - Professional, Technical, Clerical - - - - - - - - - - - - Operational Hourlies - - - - - - - - - - - -
Total Maintenance - - - - - - - - - - - -
Engineering/Capital Managers/Supervisors - - - - - - - - - - - - Professional, Technical, Clerical - - - - - - - - - - - - Operational Hourlies - - - - - - - - - - - -
Total Engineering/Capital - - - - - - - - - - - -
Public Safety Managers/Supervisors 157 157 157 157 157 157 157 157 157 157 157 157
Professional, Technical, Clerical 79 79 79 79 79 79 79 79 79 79 79 79
Operational Hourlies 633 633 633 633 633 633 633 633 633 635 635 635 Total Public Safety 869 869 869 869 869 869 869 869 869 871 871 871
Total Positions Managers/Supervisors 639 639 639 639 639 639 639 639 639 639 639 639 Professional, Technical, Clerical 1,726 1,726 1,726 1,800 1,800 1,800 1,800 1,800 1,800 1,799 1,799 1,799 Operational Hourlies 633 633 633 633 633 633 633 633 633 635 635 635
Total Positions 2,998 2,998 2,998 3,072 3,072 3,072 3,072 3,072 3,072 3,073 3,073 3,073
MTA HEADQUARTERS
Total Positions by Function and Occupation February Financial Plan - 2017 Adopted Budget
VI-102
MTA Headquarters
MTA Headquarters includes four distinct components: Policy & Oversight, MTA Consolidated Functions including Information Technology and Non-Information Technology, the Business Service Center, and MTA Security.
MTA HQ, Policy & Oversight includes MTA executive leadership and policy/oversight functions including the Chairman’s Office, Chief of Staff, Office of the Chief Financial Officer, Human Resources, Labor Relations, and Corporate and Community Affairs.
MTA Consolidated Functions includes areas where savings have been achieved through function consolidations or areas where the work can be more efficiently performed at Headquarters. Previous Plans included the consolidation of the Pension function. This Plan includes the consolidation of the Information Technology and Treasury functions. The Procurement function will be consolidated in a future Plan. As MTA consolidates functions across the Agencies, it is likely that the net budget change associated with those functions will increase Headquarters’ costs, while staffing and expense levels decrease at a higher level at the Agencies.
The Business Service Center provides shared back-office financial, payroll,
procurement, and human resource services to all agencies.
Public Safety includes the MTA Police which patrols the MTA’s commuter railroads, and provides MTA-wide oversight of security and safety services. Public Safety also leads emergency preparedness, and interfaces with multiple city, state and federal law enforcement agencies.
The following table breaks out the MTA HQ expenses and personnel Budgets by these categories.
VI-103
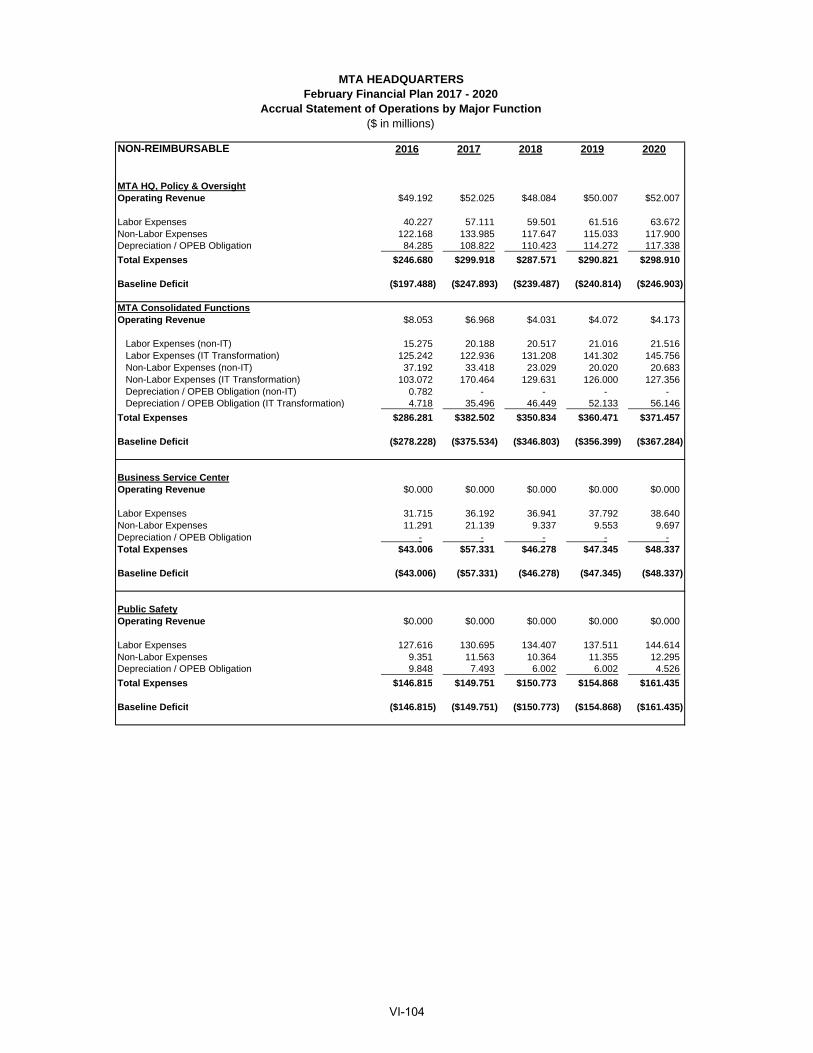
MTA HEADQUARTERSFebruary Financial Plan 2017 - 2020
Accrual Statement of Operations by Major Function($ in millions)
NON-REIMBURSABLE 2016 2017 2018 2019 2020
MTA HQ, Policy & OversightOperating Revenue $49.192 $52.025 $48.084 $50.007 $52.007
Labor Expenses 40.227 57.111 59.501 61.516 63.672 Non-Labor Expenses 122.168 133.985 117.647 115.033 117.900 Depreciation / OPEB Obligation 84.285 108.822 110.423 114.272 117.338
Total Expenses $246.680 $299.918 $287.571 $290.821 $298.910
Baseline Deficit ($197.488) ($247.893) ($239.487) ($240.814) ($246.903)
MTA Consolidated FunctionsOperating Revenue $8.053 $6.968 $4.031 $4.072 $4.173
Labor Expenses (non-IT) 15.275 20.188 20.517 21.016 21.516 Labor Expenses (IT Transformation) 125.242 122.936 131.208 141.302 145.756 Non-Labor Expenses (non-IT) 37.192 33.418 23.029 20.020 20.683 Non-Labor Expenses (IT Transformation) 103.072 170.464 129.631 126.000 127.356 Depreciation / OPEB Obligation (non-IT) 0.782 - - - - Depreciation / OPEB Obligation (IT Transformation) 4.718 35.496 46.449 52.133 56.146
Total Expenses $286.281 $382.502 $350.834 $360.471 $371.457
Baseline Deficit ($278.228) ($375.534) ($346.803) ($356.399) ($367.284)
Business Service CenterOperating Revenue $0.000 $0.000 $0.000 $0.000 $0.000
Labor Expenses 31.715 36.192 36.941 37.792 38.640 Non-Labor Expenses 11.291 21.139 9.337 9.553 9.697 Depreciation / OPEB Obligation - - - - - Total Expenses $43.006 $57.331 $46.278 $47.345 $48.337
Baseline Deficit ($43.006) ($57.331) ($46.278) ($47.345) ($48.337)
Public SafetyOperating Revenue $0.000 $0.000 $0.000 $0.000 $0.000
Labor Expenses 127.616 130.695 134.407 137.511 144.614 Non-Labor Expenses 9.351 11.563 10.364 11.355 12.295 Depreciation / OPEB Obligation 9.848 7.493 6.002 6.002 4.526
Total Expenses $146.815 $149.751 $150.773 $154.868 $161.435
Baseline Deficit ($146.815) ($149.751) ($150.773) ($154.868) ($161.435)
VI-104
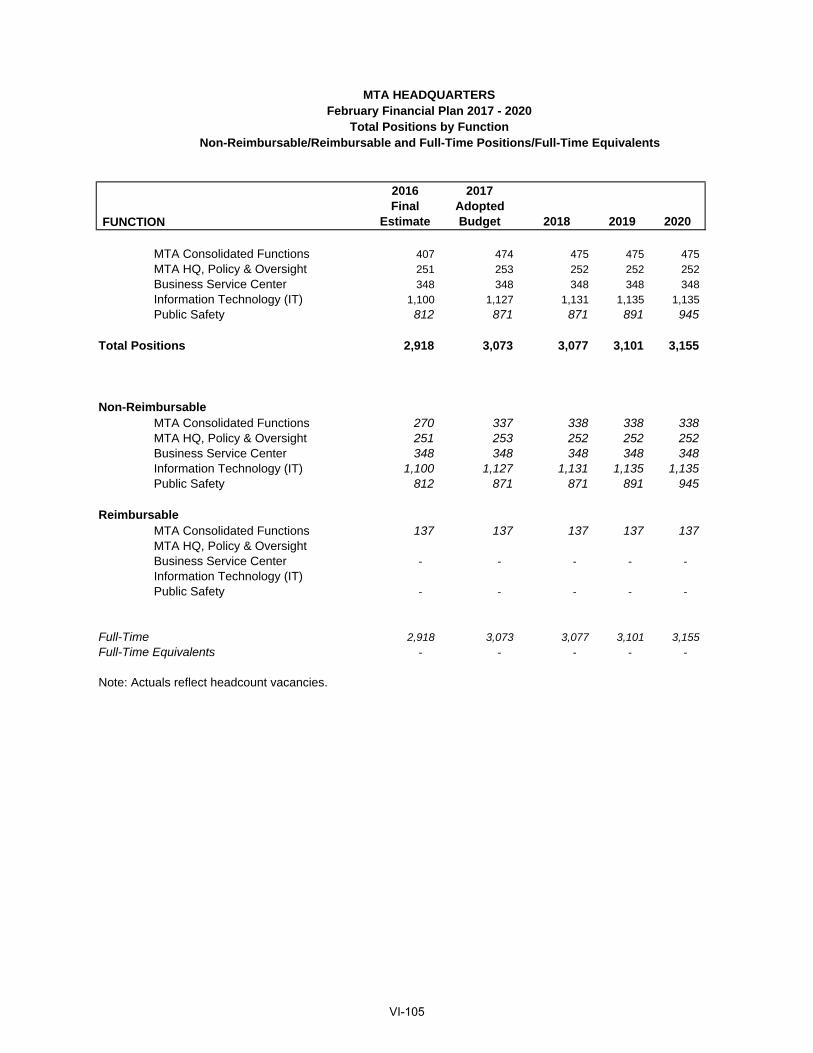
FUNCTION
2016 Final
Estimate
2017 Adopted Budget 2018 2019 2020
MTA Consolidated Functions 407 474 475 475 475 MTA HQ, Policy & Oversight 251 253 252 252 252 Business Service Center 348 348 348 348 348 Information Technology (IT) 1,100 1,127 1,131 1,135 1,135 Public Safety 812 871 871 891 945
Total Positions 2,918 3,073 3,077 3,101 3,155
Non-ReimbursableMTA Consolidated Functions 270 337 338 338 338 MTA HQ, Policy & Oversight 251 253 252 252 252 Business Service Center 348 348 348 348 348 Information Technology (IT) 1,100 1,127 1,131 1,135 1,135 Public Safety 812 871 871 891 945
ReimbursableMTA Consolidated Functions 137 137 137 137 137 MTA HQ, Policy & OversightBusiness Service Center - - - - - Information Technology (IT)Public Safety - - - - -
Full-Time 2,918 3,073 3,077 3,101 3,155 Full-Time Equivalents - - - - -
Note: Actuals reflect headcount vacancies.
MTA HEADQUARTERSFebruary Financial Plan 2017 - 2020
Total Positions by FunctionNon-Reimbursable/Reimbursable and Full-Time Positions/Full-Time Equivalents
VI-105

[THIS PAGE INTENTIONALLY LEFT BLANK]
VI-106

MTA INSPECTOR GENERAL FEBRUARY FINANCIAL PLAN FOR 2017-2020
2016 FINAL ESTIMATE AND 2017 ADOPTED BUDGET In accordance with MTA-approved budget procedures, the following information presents MTA Inspector General’s 2016 Final Estimate, 2017 Adopted Budget and the Financial Plan for 2017-2020, which are 100% reimbursable. There were no adjustments to the MTA Inspector General’s Adopted Budget relating to MTA adjustments that were presented in the December Plan and adopted by the Board in December 2016, and there were minor adjustments included in this plan cycle.
VI-107
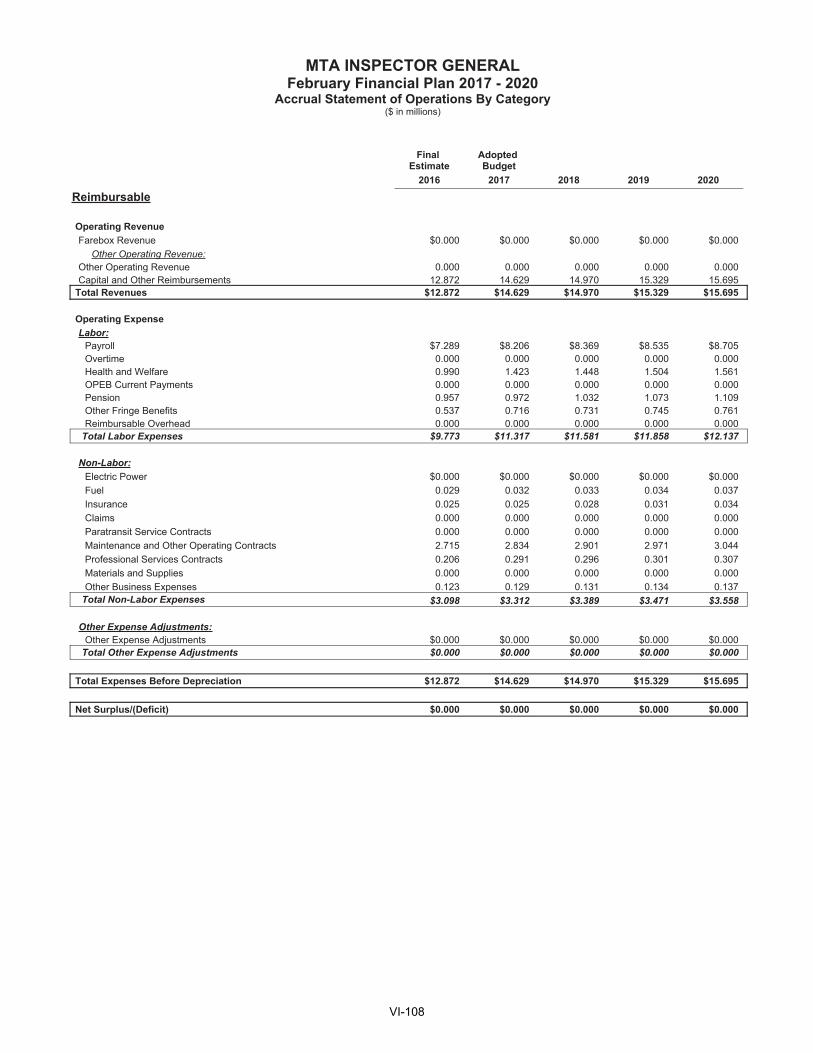
VI-108

VI-109
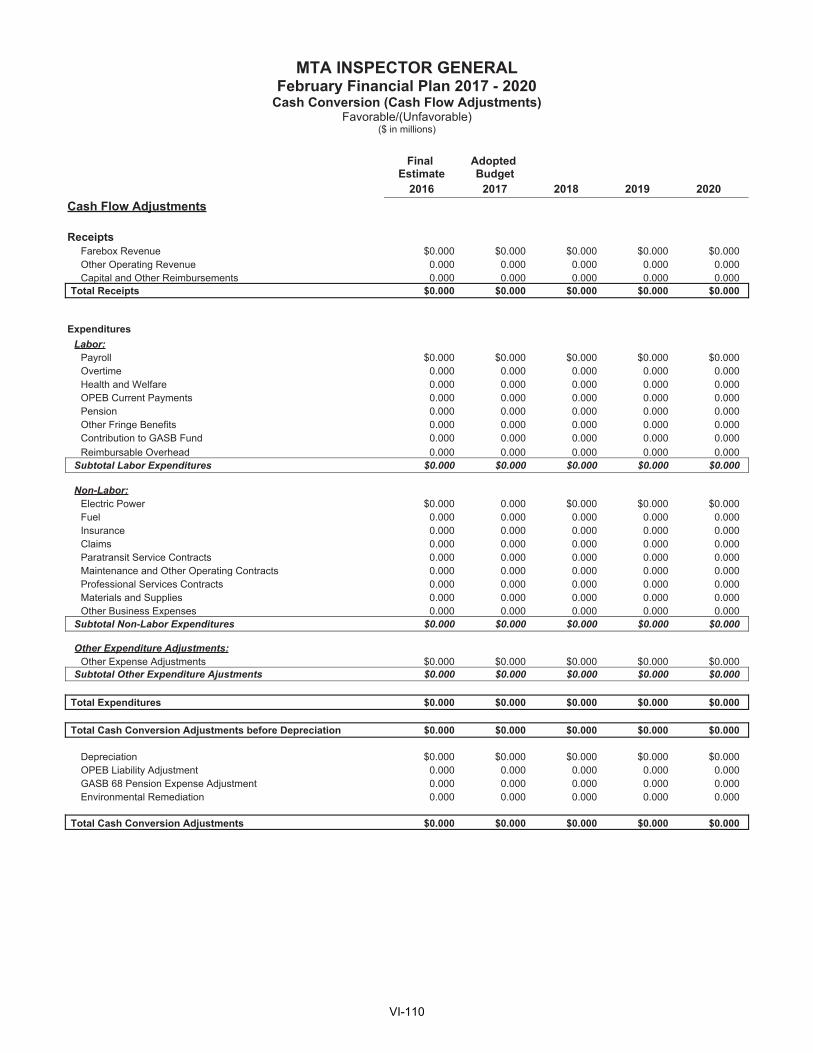
VI-110
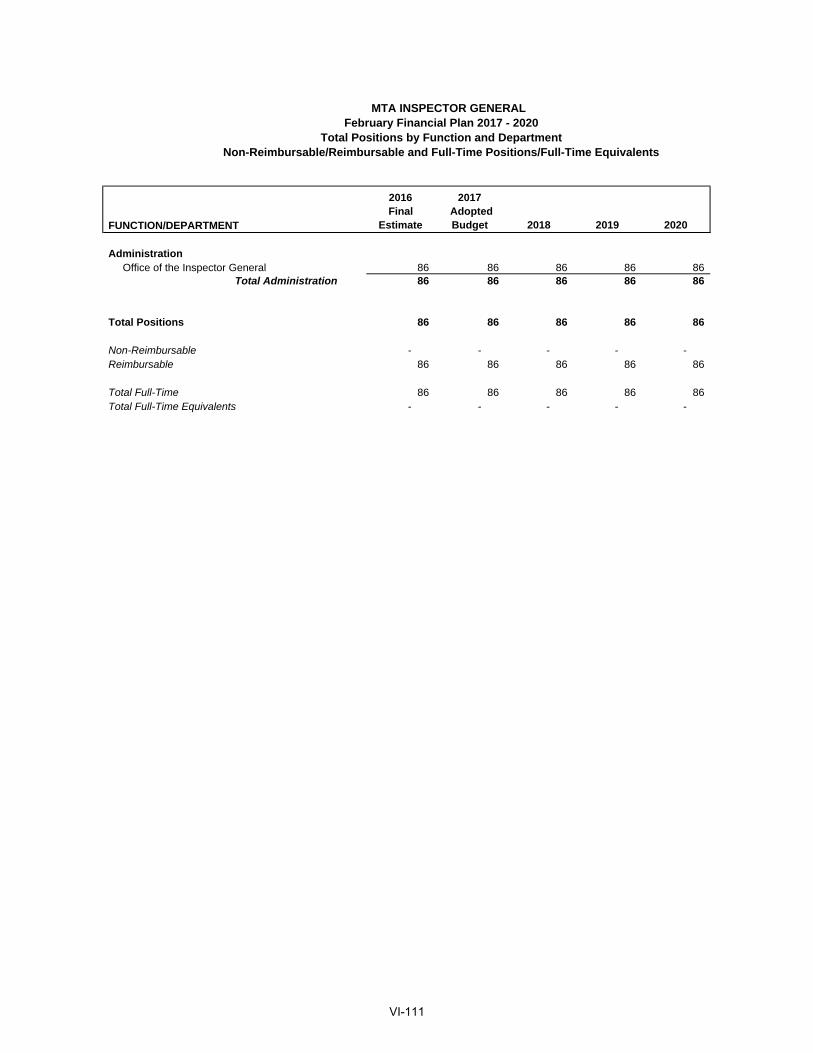
2016Final
Estimate
2017 Adopted Budget 2018 2019 2020
AdministrationOffice of the Inspector General 86 86 86 86 86
Total Administration 86 86 86 86 86
Total Positions 86 86 86 86 86
Non-Reimbursable - - - - - Reimbursable 86 86 86 86 86
Total Full-Time 86 86 86 86 86 Total Full-Time Equivalents - - - - -
FUNCTION/DEPARTMENT
MTA INSPECTOR GENERALFebruary Financial Plan 2017 - 2020
Total Positions by Function and DepartmentNon-Reimbursable/Reimbursable and Full-Time Positions/Full-Time Equivalents
VI-111
[THIS PAGE INTENTIONALLY LEFT BLANK]
VI-112

First Mutual Transportation Assurance Co. (FMTAC)
MTA FIRST MUTUAL TRANSPORTATION ASSURANCE COMPANY FEBRUARY FINANCIAL PLAN FOR 2017-2020
2016 FINAL ESTIMATE AND 2017 ADOPTED BUDGET
In accordance with MTA-approved budget procedures, the following information presents MTA First Mutual Transportation Assurance Company’s 2016 Final Estimate, 2017 Adopted Budget and the Financial Plan for 2017-2020.
The attached also includes schedules detailing the monthly allocation of financial data based on the 2017 Adopted Budget for the purpose of reporting actual results on a monthly basis to the Board.
VI-113
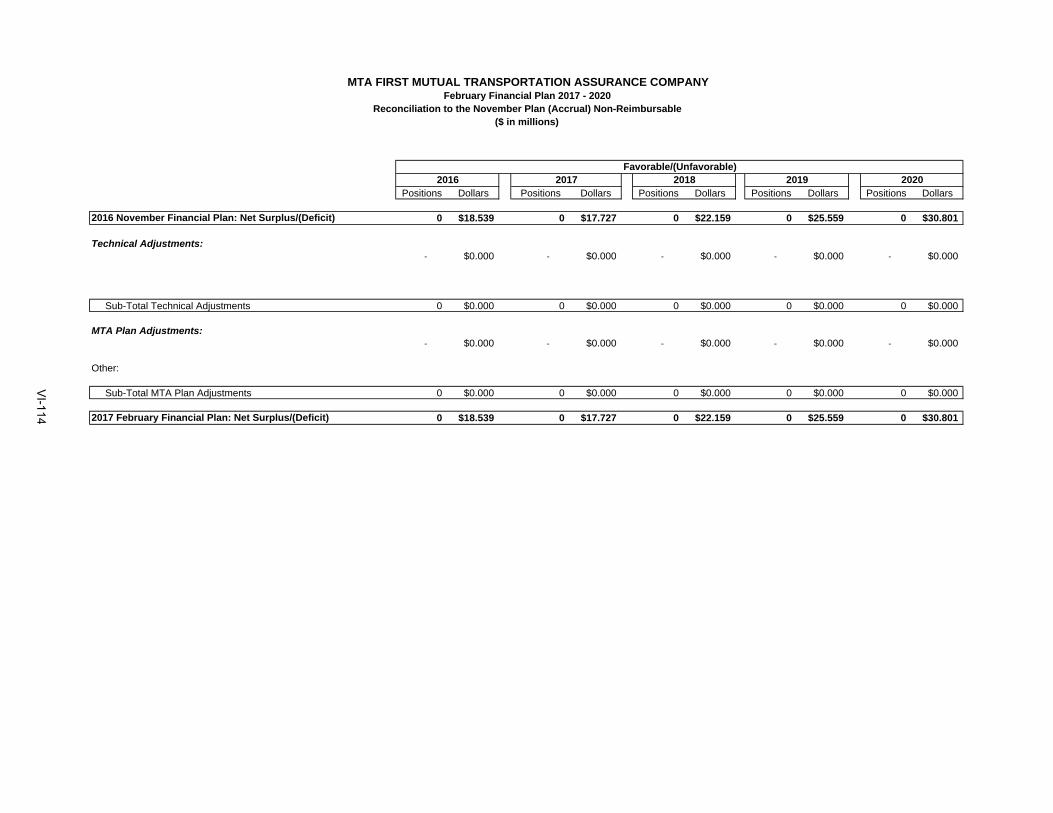
Positions Dollars Positions Dollars Positions Dollars Positions Dollars Positions Dollars
2016 November Financial Plan: Net Surplus/(Deficit) 0 $18.539 0 $17.727 0 $22.159 0 $25.559 0 $30.801
Technical Adjustments: - $0.000 - $0.000 - $0.000 - $0.000 - $0.000
Sub-Total Technical Adjustments 0 $0.000 0 $0.000 0 $0.000 0 $0.000 0 $0.000
MTA Plan Adjustments:- $0.000 - $0.000 - $0.000 - $0.000 - $0.000
Other:
Sub-Total MTA Plan Adjustments 0 $0.000 0 $0.000 0 $0.000 0 $0.000 0 $0.000
2017 February Financial Plan: Net Surplus/(Deficit) 0 $18.539 0 $17.727 0 $22.159 0 $25.559 0 $30.801
MTA FIRST MUTUAL TRANSPORTATION ASSURANCE COMPANY
2020
Reconciliation to the November Plan (Accrual) Non-Reimbursable($ in millions)
Favorable/(Unfavorable)2016 2017 2018 2019
February Financial Plan 2017 - 2020
VI-114
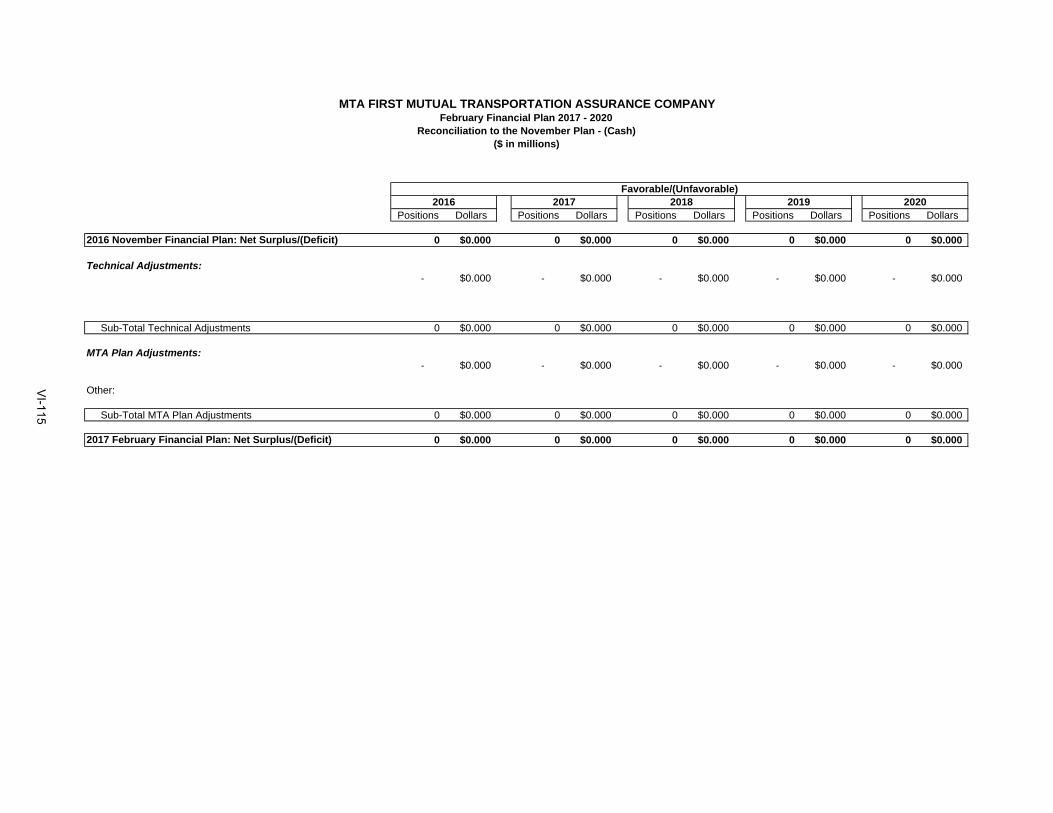
Positions Dollars Positions Dollars Positions Dollars Positions Dollars Positions Dollars
2016 November Financial Plan: Net Surplus/(Deficit) 0 $0.000 0 $0.000 0 $0.000 0 $0.000 0 $0.000
Technical Adjustments: - $0.000 - $0.000 - $0.000 - $0.000 - $0.000
Sub-Total Technical Adjustments 0 $0.000 0 $0.000 0 $0.000 0 $0.000 0 $0.000
MTA Plan Adjustments:- $0.000 - $0.000 - $0.000 - $0.000 - $0.000
Other:
Sub-Total MTA Plan Adjustments 0 $0.000 0 $0.000 0 $0.000 0 $0.000 0 $0.000
2017 February Financial Plan: Net Surplus/(Deficit) 0 $0.000 0 $0.000 0 $0.000 0 $0.000 0 $0.000
MTA FIRST MUTUAL TRANSPORTATION ASSURANCE COMPANY
Reconciliation to the November Plan - (Cash)($ in millions)
Favorable/(Unfavorable)2016 2017 2018 2019 2020
February Financial Plan 2017 - 2020
VI-115

MTA FIRST MUTUAL TRANSPORTATION ASSURANCE COMPANYFebruary Financial Plan 2017 - 2020
Accrual Statement of Operations By Category($ in millions)
Final Estimate
Adopted Budget
2016 2017 2018 2019 2020
Non-Reimbursable
Operating RevenueFarebox Revenue $0.000 $0.000 $0.000 $0.000 $0.000 Other Operating Revenue 10.350 10.621 10.870 11.140 11.431 Capital and Other Reimbursements 0.000 0.000 0.000 0.000 0.000 Investment Income 12.000 12.314 12.603 12.916 13.253
Total Revenues $22.350 $22.935 $23.473 $24.056 $24.684
Operating ExpenseLabor:
Payroll $0.000 $0.000 $0.000 $0.000 $0.000 Overtime 0.000 0.000 0.000 0.000 0.000 Health and Welfare 0.000 0.000 0.000 0.000 0.000 OPEB Current Payments 0.000 0.000 0.000 0.000 0.000 Pension 0.000 0.000 0.000 0.000 0.000 Other Fringe Benefits 0.000 0.000 0.000 0.000 0.000 Reimbursable Overhead 0.000 0.000 0.000 0.000 0.000
Total Labor Expenses $0.000 $0.000 $0.000 $0.000 $0.000
Non-Labor:Electric Power $0.000 $0.000 $0.000 $0.000 $0.000 Fuel 0.000 0.000 0.000 0.000 0.000 Insurance (97.909) (103.722) (110.828) (119.227) (128.945)Claims 90.220 97.201 100.177 105.521 110.381 Paratransit Service Contracts 0.000 0.000 0.000 0.000 0.000 Maintenance and Other Operating Contracts 0.000 0.000 0.000 0.000 0.000 Professional Services Contracts 0.000 0.000 0.000 0.000 0.000 Materials and Supplies 0.000 0.000 0.000 0.000 0.000 Other Business Expenses 11.500 11.730 11.965 12.204 12.448
Total Non-Labor Expenses $3.811 $5.209 $1.314 ($1.502) ($6.116)
Other Expense Adjustments:Other Expense Adjustments $0.000 $0.000 $0.000 $0.000 $0.000
Total Other Expense Adjustments $0.000 $0.000 $0.000 $0.000 $0.000
Total Expenses Before Depreciation and GASB Adjs. $3.811 $5.209 $1.314 ($1.502) ($6.116)
Depreciation $0.000 $0.000 $0.000 $0.000 $0.000 OPEB Liability Adjustment 0.000 0.000 0.000 0.000 0.000 GASB 68 Pension Expense Adjustment 0.000 0.000 0.000 0.000 0.000 Environmental Remediation 0.000 0.000 0.000 0.000 0.000
Total Expenses $3.811 $5.209 $1.314 ($1.502) ($6.116)
Net Surplus/(Deficit) $18.539 $17.726 $22.159 $25.558 $30.800
VI-116
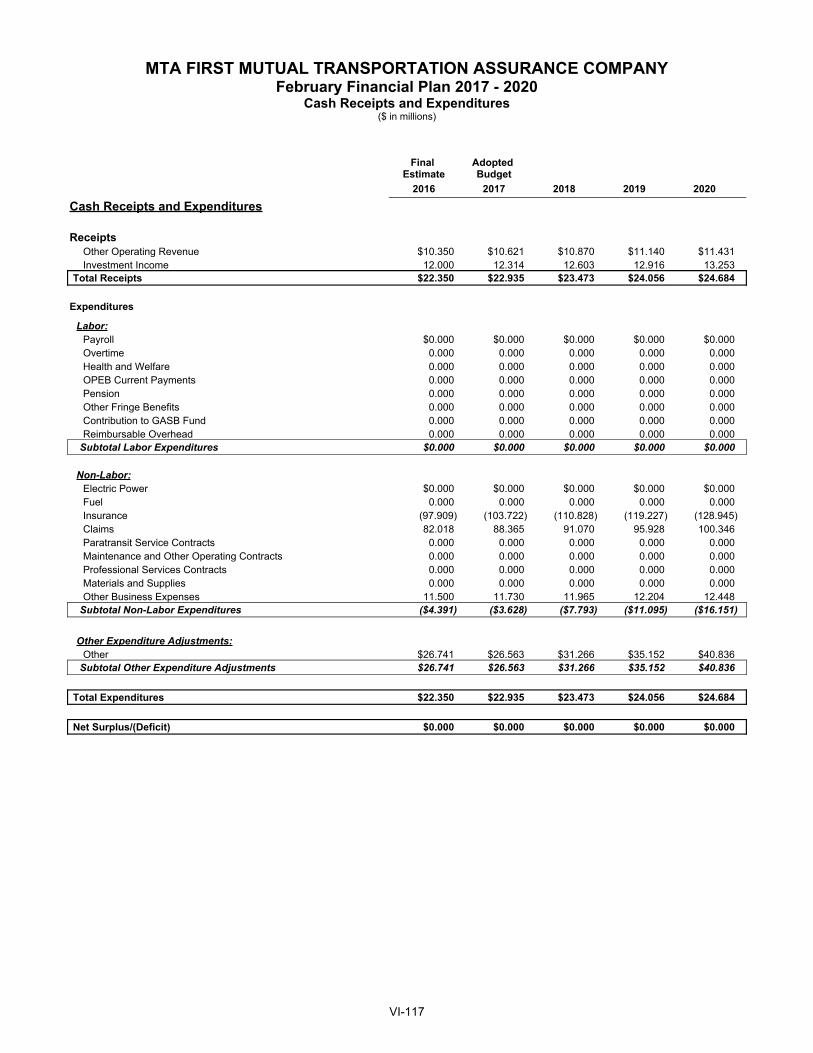
MTA FIRST MUTUAL TRANSPORTATION ASSURANCE COMPANYFebruary Financial Plan 2017 - 2020
Cash Receipts and Expenditures($ in millions)
Final Estimate
Adopted Budget
2016 2017 2018 2019 2020
Cash Receipts and Expenditures
ReceiptsOther Operating Revenue $10.350 $10.621 $10.870 $11.140 $11.431 Investment Income 12.000 12.314 12.603 12.916 13.253
Total Receipts $22.350 $22.935 $23.473 $24.056 $24.684
Expenditures
Labor:Payroll $0.000 $0.000 $0.000 $0.000 $0.000 Overtime 0.000 0.000 0.000 0.000 0.000 Health and Welfare 0.000 0.000 0.000 0.000 0.000 OPEB Current Payments 0.000 0.000 0.000 0.000 0.000 Pension 0.000 0.000 0.000 0.000 0.000 Other Fringe Benefits 0.000 0.000 0.000 0.000 0.000 Contribution to GASB Fund 0.000 0.000 0.000 0.000 0.000 Reimbursable Overhead 0.000 0.000 0.000 0.000 0.000
Subtotal Labor Expenditures $0.000 $0.000 $0.000 $0.000 $0.000
Non-Labor:Electric Power $0.000 $0.000 $0.000 $0.000 $0.000 Fuel 0.000 0.000 0.000 0.000 0.000 Insurance (97.909) (103.722) (110.828) (119.227) (128.945)Claims 82.018 88.365 91.070 95.928 100.346 Paratransit Service Contracts 0.000 0.000 0.000 0.000 0.000 Maintenance and Other Operating Contracts 0.000 0.000 0.000 0.000 0.000 Professional Services Contracts 0.000 0.000 0.000 0.000 0.000 Materials and Supplies 0.000 0.000 0.000 0.000 0.000 Other Business Expenses 11.500 11.730 11.965 12.204 12.448
Subtotal Non-Labor Expenditures ($4.391) ($3.628) ($7.793) ($11.095) ($16.151)
Other Expenditure Adjustments:Other $26.741 $26.563 $31.266 $35.152 $40.836
Subtotal Other Expenditure Adjustments $26.741 $26.563 $31.266 $35.152 $40.836
Total Expenditures $22.350 $22.935 $23.473 $24.056 $24.684
Net Surplus/(Deficit) $0.000 $0.000 $0.000 $0.000 $0.000
VI-117
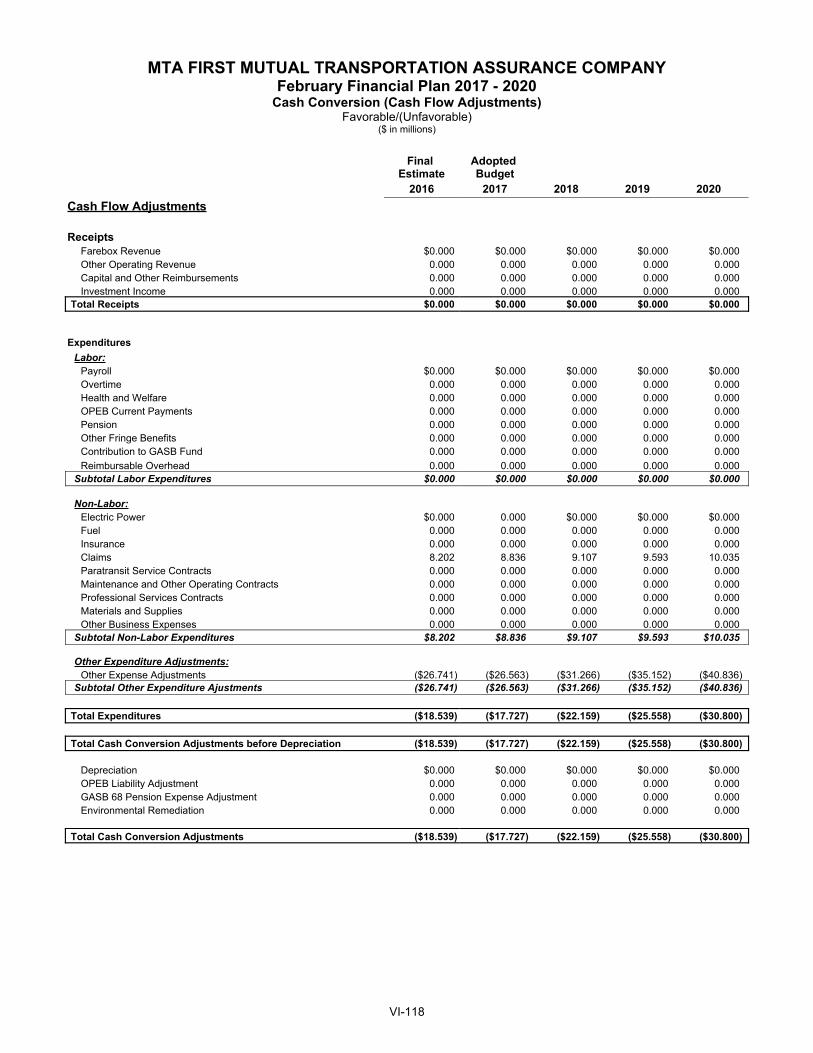
MTA FIRST MUTUAL TRANSPORTATION ASSURANCE COMPANYFebruary Financial Plan 2017 - 2020
Cash Conversion (Cash Flow Adjustments)Favorable/(Unfavorable)
($ in millions)
Final Estimate
Adopted Budget
2016 2017 2018 2019 2020Cash Flow Adjustments
ReceiptsFarebox Revenue $0.000 $0.000 $0.000 $0.000 $0.000 Other Operating Revenue 0.000 0.000 0.000 0.000 0.000 Capital and Other Reimbursements 0.000 0.000 0.000 0.000 0.000 Investment Income 0.000 0.000 0.000 0.000 0.000
Total Receipts $0.000 $0.000 $0.000 $0.000 $0.000
ExpendituresLabor:
Payroll $0.000 $0.000 $0.000 $0.000 $0.000 Overtime 0.000 0.000 0.000 0.000 0.000 Health and Welfare 0.000 0.000 0.000 0.000 0.000 OPEB Current Payments 0.000 0.000 0.000 0.000 0.000 Pension 0.000 0.000 0.000 0.000 0.000 Other Fringe Benefits 0.000 0.000 0.000 0.000 0.000 Contribution to GASB Fund 0.000 0.000 0.000 0.000 0.000 Reimbursable Overhead 0.000 0.000 0.000 0.000 0.000
Subtotal Labor Expenditures $0.000 $0.000 $0.000 $0.000 $0.000
Non-Labor:Electric Power $0.000 0.000 $0.000 $0.000 $0.000 Fuel 0.000 0.000 0.000 0.000 0.000 Insurance 0.000 0.000 0.000 0.000 0.000 Claims 8.202 8.836 9.107 9.593 10.035 Paratransit Service Contracts 0.000 0.000 0.000 0.000 0.000 Maintenance and Other Operating Contracts 0.000 0.000 0.000 0.000 0.000 Professional Services Contracts 0.000 0.000 0.000 0.000 0.000 Materials and Supplies 0.000 0.000 0.000 0.000 0.000 Other Business Expenses 0.000 0.000 0.000 0.000 0.000
Subtotal Non-Labor Expenditures $8.202 $8.836 $9.107 $9.593 $10.035
Other Expenditure Adjustments:Other Expense Adjustments ($26.741) ($26.563) ($31.266) ($35.152) ($40.836)
Subtotal Other Expenditure Ajustments ($26.741) ($26.563) ($31.266) ($35.152) ($40.836)
Total Expenditures ($18.539) ($17.727) ($22.159) ($25.558) ($30.800)
Total Cash Conversion Adjustments before Depreciation ($18.539) ($17.727) ($22.159) ($25.558) ($30.800)
Depreciation $0.000 $0.000 $0.000 $0.000 $0.000 OPEB Liability Adjustment 0.000 0.000 0.000 0.000 0.000 GASB 68 Pension Expense Adjustment 0.000 0.000 0.000 0.000 0.000 Environmental Remediation 0.000 0.000 0.000 0.000 0.000
Total Cash Conversion Adjustments ($18.539) ($17.727) ($22.159) ($25.558) ($30.800)
VI-118

MTA FIRST MUTUAL TRANSPORTATION ASSURANCE COMPANYFebruary Financial Plan - 2017 Adopted Budget
Accrual Statement of Operations By Category($ in Millions)
Jan Feb Mar Apr May Jun Jul Aug Sep Oct Nov Dec TotalNon-Reimbursable
Operating RevenueFarebox Revenue $0.000 $0.000 $0.000 $0.000 $0.000 $0.000 $0.000 $0.000 $0.000 $0.000 $0.000 $0.000 $0.000 Other Operating Revenue 0.885 0.885 0.885 0.885 0.885 0.885 0.885 0.885 0.885 0.885 0.885 0.885 10.621 Investment Income 1.026 1.026 1.026 1.026 1.026 1.026 1.026 1.026 1.026 1.026 1.026 1.026 12.314
Total Revenues $1.911 $1.911 $1.911 $1.911 $1.911 $1.911 $1.911 $1.911 $1.911 $1.911 $1.911 $1.911 $22.935
Operating ExpensesLabor:
Payroll $0.000 $0.000 $0.000 $0.000 $0.000 $0.000 $0.000 $0.000 $0.000 $0.000 $0.000 $0.000 $0.000 Overtime 0.000 0.000 0.000 0.000 0.000 0.000 0.000 0.000 0.000 0.000 0.000 0.000 0.000 Health and Welfare 0.000 0.000 0.000 0.000 0.000 0.000 0.000 0.000 0.000 0.000 0.000 0.000 0.000 OPEB Current Payments 0.000 0.000 0.000 0.000 0.000 0.000 0.000 0.000 0.000 0.000 0.000 0.000 0.000 Pension 0.000 0.000 0.000 0.000 0.000 0.000 0.000 0.000 0.000 0.000 0.000 0.000 0.000 Other Fringe Benefits 0.000 0.000 0.000 0.000 0.000 0.000 0.000 0.000 0.000 0.000 0.000 0.000 0.000 Reimbursable Overhead 0.000 0.000 0.000 0.000 0.000 0.000 0.000 0.000 0.000 0.000 0.000 0.000 0.000
Total Labor Expenses $0.000 $0.000 $0.000 $0.000 $0.000 $0.000 $0.000 $0.000 $0.000 $0.000 $0.000 $0.000 $0.000
Non-Labor:Electric Power $0.000 $0.000 $0.000 $0.000 $0.000 $0.000 $0.000 $0.000 $0.000 $0.000 $0.000 $0.000 $0.000 Fuel 0.000 0.000 0.000 0.000 0.000 0.000 0.000 0.000 0.000 0.000 0.000 0.000 0.000 Insurance (8.644) (8.644) (8.644) (8.644) (8.644) (8.644) (8.644) (8.644) (8.644) (8.644) (8.644) (8.644) (103.722)Claims 8.100 8.100 8.100 8.100 8.100 8.100 8.100 8.100 8.100 8.100 8.100 8.100 97.201 Paratransit Service Contracts 0.000 0.000 0.000 0.000 0.000 0.000 0.000 0.000 0.000 0.000 0.000 0.000 0.000 Maintenance and Other Operating Contracts 0.000 0.000 0.000 0.000 0.000 0.000 0.000 0.000 0.000 0.000 0.000 0.000 0.000 Professional Services Contracts 0.000 0.000 0.000 0.000 0.000 0.000 0.000 0.000 0.000 0.000 0.000 0.000 0.000 Materials and Supplies 0.000 0.000 0.000 0.000 0.000 0.000 0.000 0.000 0.000 0.000 0.000 0.000 0.000 Other Business Expenses 0.978 0.978 0.978 0.978 0.978 0.978 0.978 0.978 0.978 0.978 0.978 0.978 11.730
Total Non-Labor Expenses $0.434 $0.434 $0.434 $0.434 $0.434 $0.434 $0.434 $0.434 $0.434 $0.434 $0.434 $0.434 $5.209
Other Expense Adjustments:Other Expense Adjustments $0.000 $0.000 $0.000 $0.000 $0.000 $0.000 $0.000 $0.000 $0.000 $0.000 $0.000 $0.000 $0.000
Total Other Expense Adjustments $0.000 $0.000 $0.000 $0.000 $0.000 $0.000 $0.000 $0.000 $0.000 $0.000 $0.000 $0.000 $0.000
Total Expenses $0.434 $0.434 $0.434 $0.434 $0.434 $0.434 $0.434 $0.434 $0.434 $0.434 $0.434 $0.434 $5.209
Depreciation $0.000 $0.000 $0.000 $0.000 $0.000 $0.000 $0.000 $0.000 $0.000 $0.000 $0.000 $0.000 $0.000 OPEB Liability Adjustment 0.000 0.000 0.000 0.000 0.000 0.000 0.000 0.000 0.000 0.000 0.000 0.000 0.000 GASB 68 Pension Expense Adjustment 0.000 0.000 0.000 0.000 0.000 0.000 0.000 0.000 0.000 0.000 0.000 0.000 0.000 Environmental Remediation 0.000 0.000 0.000 0.000 0.000 0.000 0.000 0.000 0.000 0.000 0.000 0.000 0.000
Total Expenses After Non-Cash Liability Adjs. $0.434 $0.434 $0.434 $0.434 $0.434 $0.434 $0.434 $0.434 $0.434 $0.434 $0.434 $0.434 $5.209
Net Surplus/(Deficit) $1.477 $1.477 $1.477 $1.477 $1.477 $1.477 $1.477 $1.477 $1.477 $1.477 $1.477 $1.477 $17.726
VI-119
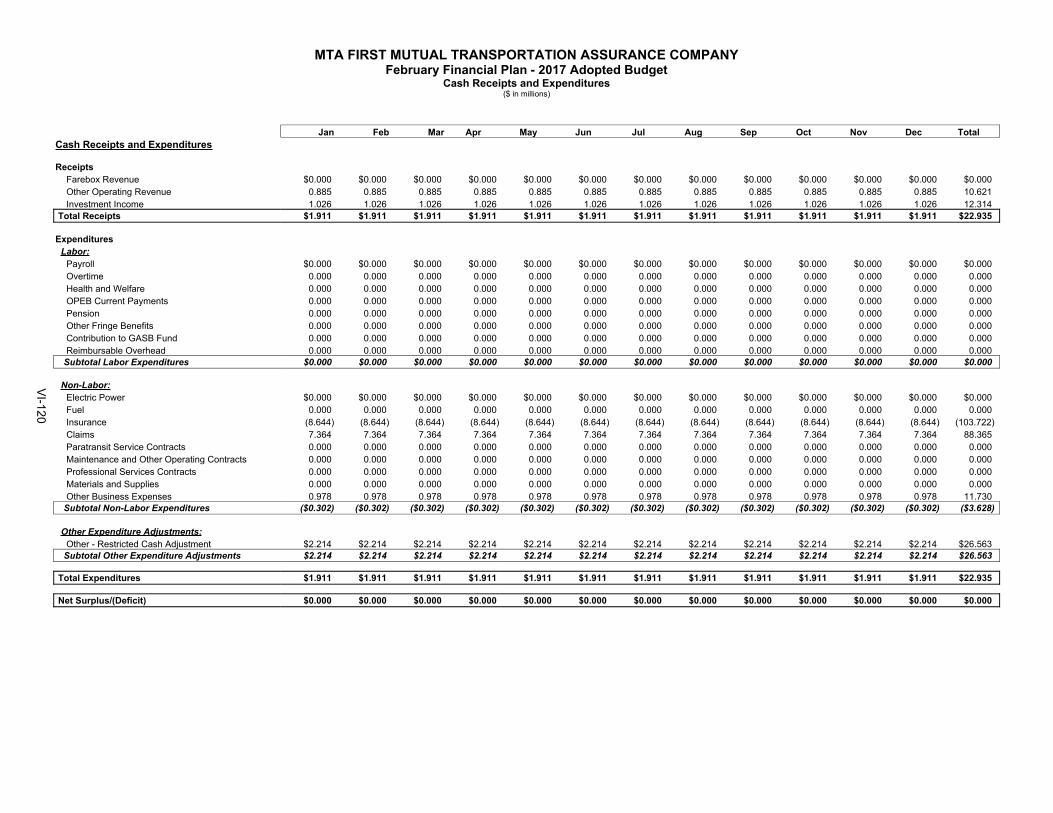
MTA FIRST MUTUAL TRANSPORTATION ASSURANCE COMPANYFebruary Financial Plan - 2017 Adopted Budget
Cash Receipts and Expenditures($ in millions)
Jan Feb Mar Apr May Jun Jul Aug Sep Oct Nov Dec TotalCash Receipts and Expenditures
ReceiptsFarebox Revenue $0.000 $0.000 $0.000 $0.000 $0.000 $0.000 $0.000 $0.000 $0.000 $0.000 $0.000 $0.000 $0.000 Other Operating Revenue 0.885 0.885 0.885 0.885 0.885 0.885 0.885 0.885 0.885 0.885 0.885 0.885 10.621 Investment Income 1.026 1.026 1.026 1.026 1.026 1.026 1.026 1.026 1.026 1.026 1.026 1.026 12.314
Total Receipts $1.911 $1.911 $1.911 $1.911 $1.911 $1.911 $1.911 $1.911 $1.911 $1.911 $1.911 $1.911 $22.935
ExpendituresLabor:
Payroll $0.000 $0.000 $0.000 $0.000 $0.000 $0.000 $0.000 $0.000 $0.000 $0.000 $0.000 $0.000 $0.000 Overtime 0.000 0.000 0.000 0.000 0.000 0.000 0.000 0.000 0.000 0.000 0.000 0.000 0.000 Health and Welfare 0.000 0.000 0.000 0.000 0.000 0.000 0.000 0.000 0.000 0.000 0.000 0.000 0.000 OPEB Current Payments 0.000 0.000 0.000 0.000 0.000 0.000 0.000 0.000 0.000 0.000 0.000 0.000 0.000 Pension 0.000 0.000 0.000 0.000 0.000 0.000 0.000 0.000 0.000 0.000 0.000 0.000 0.000 Other Fringe Benefits 0.000 0.000 0.000 0.000 0.000 0.000 0.000 0.000 0.000 0.000 0.000 0.000 0.000 Contribution to GASB Fund 0.000 0.000 0.000 0.000 0.000 0.000 0.000 0.000 0.000 0.000 0.000 0.000 0.000 Reimbursable Overhead 0.000 0.000 0.000 0.000 0.000 0.000 0.000 0.000 0.000 0.000 0.000 0.000 0.000
Subtotal Labor Expenditures $0.000 $0.000 $0.000 $0.000 $0.000 $0.000 $0.000 $0.000 $0.000 $0.000 $0.000 $0.000 $0.000
Non-Labor:Electric Power $0.000 $0.000 $0.000 $0.000 $0.000 $0.000 $0.000 $0.000 $0.000 $0.000 $0.000 $0.000 $0.000 Fuel 0.000 0.000 0.000 0.000 0.000 0.000 0.000 0.000 0.000 0.000 0.000 0.000 0.000 Insurance (8.644) (8.644) (8.644) (8.644) (8.644) (8.644) (8.644) (8.644) (8.644) (8.644) (8.644) (8.644) (103.722)Claims 7.364 7.364 7.364 7.364 7.364 7.364 7.364 7.364 7.364 7.364 7.364 7.364 88.365 Paratransit Service Contracts 0.000 0.000 0.000 0.000 0.000 0.000 0.000 0.000 0.000 0.000 0.000 0.000 0.000 Maintenance and Other Operating Contracts 0.000 0.000 0.000 0.000 0.000 0.000 0.000 0.000 0.000 0.000 0.000 0.000 0.000 Professional Services Contracts 0.000 0.000 0.000 0.000 0.000 0.000 0.000 0.000 0.000 0.000 0.000 0.000 0.000 Materials and Supplies 0.000 0.000 0.000 0.000 0.000 0.000 0.000 0.000 0.000 0.000 0.000 0.000 0.000 Other Business Expenses 0.978 0.978 0.978 0.978 0.978 0.978 0.978 0.978 0.978 0.978 0.978 0.978 11.730
Subtotal Non-Labor Expenditures ($0.302) ($0.302) ($0.302) ($0.302) ($0.302) ($0.302) ($0.302) ($0.302) ($0.302) ($0.302) ($0.302) ($0.302) ($3.628)
Other Expenditure Adjustments:Other - Restricted Cash Adjustment $2.214 $2.214 $2.214 $2.214 $2.214 $2.214 $2.214 $2.214 $2.214 $2.214 $2.214 $2.214 $26.563
Subtotal Other Expenditure Adjustments $2.214 $2.214 $2.214 $2.214 $2.214 $2.214 $2.214 $2.214 $2.214 $2.214 $2.214 $2.214 $26.563
Total Expenditures $1.911 $1.911 $1.911 $1.911 $1.911 $1.911 $1.911 $1.911 $1.911 $1.911 $1.911 $1.911 $22.935
Net Surplus/(Deficit) $0.000 $0.000 $0.000 $0.000 $0.000 $0.000 $0.000 $0.000 $0.000 $0.000 $0.000 $0.000 $0.000
VI-120
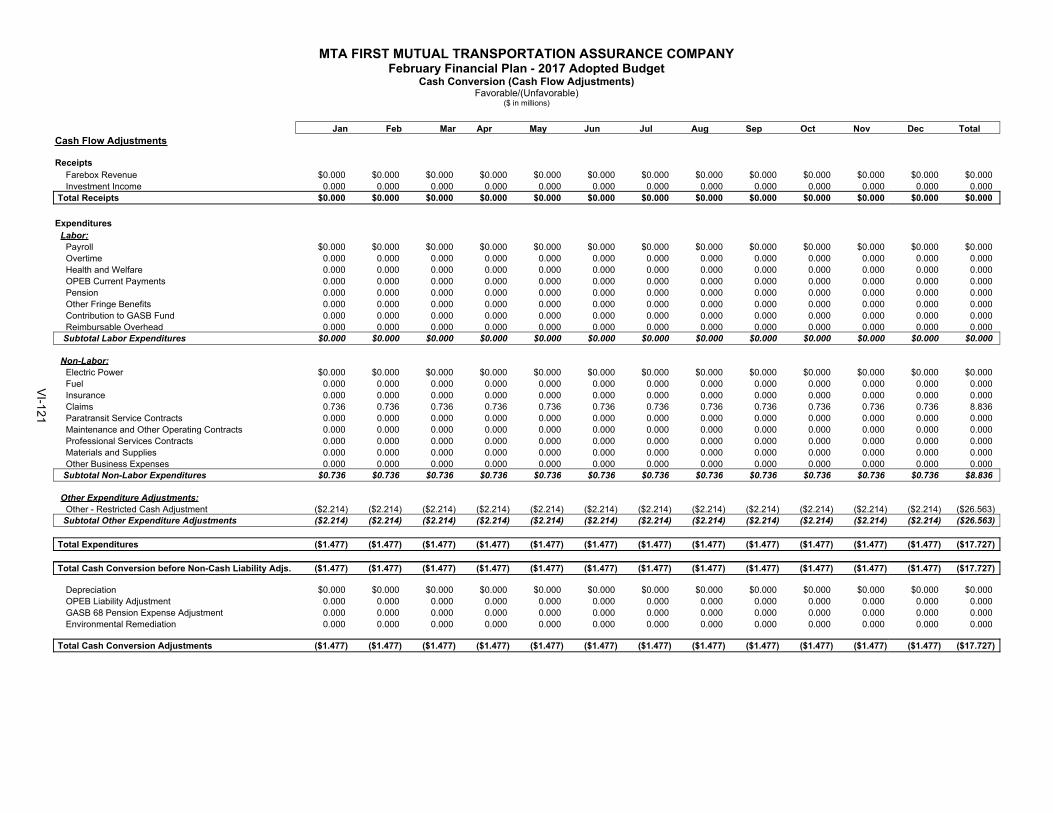
MTA FIRST MUTUAL TRANSPORTATION ASSURANCE COMPANYFebruary Financial Plan - 2017 Adopted Budget
Cash Conversion (Cash Flow Adjustments)Favorable/(Unfavorable)
($ in millions)
Jan Feb Mar Apr May Jun Jul Aug Sep Oct Nov Dec TotalCash Flow Adjustments
ReceiptsFarebox Revenue $0.000 $0.000 $0.000 $0.000 $0.000 $0.000 $0.000 $0.000 $0.000 $0.000 $0.000 $0.000 $0.000 Investment Income 0.000 0.000 0.000 0.000 0.000 0.000 0.000 0.000 0.000 0.000 0.000 0.000 0.000
Total Receipts $0.000 $0.000 $0.000 $0.000 $0.000 $0.000 $0.000 $0.000 $0.000 $0.000 $0.000 $0.000 $0.000
ExpendituresLabor:
Payroll $0.000 $0.000 $0.000 $0.000 $0.000 $0.000 $0.000 $0.000 $0.000 $0.000 $0.000 $0.000 $0.000 Overtime 0.000 0.000 0.000 0.000 0.000 0.000 0.000 0.000 0.000 0.000 0.000 0.000 0.000 Health and Welfare 0.000 0.000 0.000 0.000 0.000 0.000 0.000 0.000 0.000 0.000 0.000 0.000 0.000 OPEB Current Payments 0.000 0.000 0.000 0.000 0.000 0.000 0.000 0.000 0.000 0.000 0.000 0.000 0.000 Pension 0.000 0.000 0.000 0.000 0.000 0.000 0.000 0.000 0.000 0.000 0.000 0.000 0.000 Other Fringe Benefits 0.000 0.000 0.000 0.000 0.000 0.000 0.000 0.000 0.000 0.000 0.000 0.000 0.000 Contribution to GASB Fund 0.000 0.000 0.000 0.000 0.000 0.000 0.000 0.000 0.000 0.000 0.000 0.000 0.000 Reimbursable Overhead 0.000 0.000 0.000 0.000 0.000 0.000 0.000 0.000 0.000 0.000 0.000 0.000 0.000
Subtotal Labor Expenditures $0.000 $0.000 $0.000 $0.000 $0.000 $0.000 $0.000 $0.000 $0.000 $0.000 $0.000 $0.000 $0.000
Non-Labor:Electric Power $0.000 $0.000 $0.000 $0.000 $0.000 $0.000 $0.000 $0.000 $0.000 $0.000 $0.000 $0.000 $0.000 Fuel 0.000 0.000 0.000 0.000 0.000 0.000 0.000 0.000 0.000 0.000 0.000 0.000 0.000 Insurance 0.000 0.000 0.000 0.000 0.000 0.000 0.000 0.000 0.000 0.000 0.000 0.000 0.000 Claims 0.736 0.736 0.736 0.736 0.736 0.736 0.736 0.736 0.736 0.736 0.736 0.736 8.836 Paratransit Service Contracts 0.000 0.000 0.000 0.000 0.000 0.000 0.000 0.000 0.000 0.000 0.000 0.000 0.000 Maintenance and Other Operating Contracts 0.000 0.000 0.000 0.000 0.000 0.000 0.000 0.000 0.000 0.000 0.000 0.000 0.000 Professional Services Contracts 0.000 0.000 0.000 0.000 0.000 0.000 0.000 0.000 0.000 0.000 0.000 0.000 0.000 Materials and Supplies 0.000 0.000 0.000 0.000 0.000 0.000 0.000 0.000 0.000 0.000 0.000 0.000 0.000 Other Business Expenses 0.000 0.000 0.000 0.000 0.000 0.000 0.000 0.000 0.000 0.000 0.000 0.000 0.000
Subtotal Non-Labor Expenditures $0.736 $0.736 $0.736 $0.736 $0.736 $0.736 $0.736 $0.736 $0.736 $0.736 $0.736 $0.736 $8.836
Other Expenditure Adjustments:Other - Restricted Cash Adjustment ($2.214) ($2.214) ($2.214) ($2.214) ($2.214) ($2.214) ($2.214) ($2.214) ($2.214) ($2.214) ($2.214) ($2.214) ($26.563)
Subtotal Other Expenditure Adjustments ($2.214) ($2.214) ($2.214) ($2.214) ($2.214) ($2.214) ($2.214) ($2.214) ($2.214) ($2.214) ($2.214) ($2.214) ($26.563)
Total Expenditures ($1.477) ($1.477) ($1.477) ($1.477) ($1.477) ($1.477) ($1.477) ($1.477) ($1.477) ($1.477) ($1.477) ($1.477) ($17.727)
Total Cash Conversion before Non-Cash Liability Adjs. ($1.477) ($1.477) ($1.477) ($1.477) ($1.477) ($1.477) ($1.477) ($1.477) ($1.477) ($1.477) ($1.477) ($1.477) ($17.727)
Depreciation $0.000 $0.000 $0.000 $0.000 $0.000 $0.000 $0.000 $0.000 $0.000 $0.000 $0.000 $0.000 $0.000 OPEB Liability Adjustment 0.000 0.000 0.000 0.000 0.000 0.000 0.000 0.000 0.000 0.000 0.000 0.000 0.000 GASB 68 Pension Expense Adjustment 0.000 0.000 0.000 0.000 0.000 0.000 0.000 0.000 0.000 0.000 0.000 0.000 0.000 Environmental Remediation 0.000 0.000 0.000 0.000 0.000 0.000 0.000 0.000 0.000 0.000 0.000 0.000 0.000
Total Cash Conversion Adjustments ($1.477) ($1.477) ($1.477) ($1.477) ($1.477) ($1.477) ($1.477) ($1.477) ($1.477) ($1.477) ($1.477) ($1.477) ($17.727)
VI-121

[THIS PAGE INTENTIONALLY LEFT BLANK]
VI-122
New York City Transit
MTA NEW YORK CITY TRANSIT
FEBRUARY FINANCIAL PLAN 2017-2020 2016 FINAL ESTIMATE AND 2017 ADOPTED BUDGET
In accordance with MTA-approved budget procedures, the following information presents MTA New York City Transit’s 2016 Final Estimate, 2017 Adopted Budget and the Financial Plan for 2017 - 2020. The Adopted Budget reflects the inclusion of MTA Adjustments that were presented in the December Plan and adopted by the Board in December 2016, as well as other technical adjustments. The MTA adjustments that are included in this MTA New York City Transit Financial Plan are as follows:
An average 4% fare increase was approved at the January 2017 MTA Board meeting and will go into effect on March 19, 2017. This fare increase projects increases in farebox revenue of $130.7 million in 2017, $164.5 million in 2018, $165.0 million in 2019 and $166.0 million in 2020.
The impacts from a New York State Public Service Commission ruling on Con
Edison rates for the delivery of New York Power Authority supplied power to NYPA governmental customers are estimated as savings of: $4.3 million in 2017; $9.1 million in 2018 and $14.3 million in both 2019 and 2020.
A revision in fuel price forecasts subsequent to the provision of November Plan instructions, resulting in higher expenses of $1.7 million in 2017, $1.2 million in 2018, $0.4 million in 2019 and $0.9 million in 2020.
Nine positions and an annual cost per year of $0.9 million are being transferred from MTA in support of a significantly enhanced presence on social media, improving ability to inform and interact with customers and potential business partners in a timelier and comprehensive fashion. Ensure 24/7 coverage, posting content on Facebook, Twitter and Instagram that will inform customers about weekend service diversions, FASTRACK, capital projects, public hearings, customer self-service and courtesy efforts, counterterrorism (See something, Say something), and weather alerts.
Effective January 2017, non-core Agency procurement functions will be consolidated into a centralized organizational structure at MTA Headquarters (HQ). This consolidation is expected to yield contract savings and other efficiency savings. The Plan has captured some preliminary contract savings. The February Plan reflects a shift of 48 non-reimbursable and two reimbursable authorized positions in support of centralized operations from MTA New York City Transit to HQ. It is expected that all related positions will be transferred during the first six months of 2017. For the monthly reporting of expenses and positions, the Plan assumes an effective shift date of April 1, 2017. This is the projected median transfer date, with half of the transfers presumed to take place by then; thereby approximating average expense and headcount levels over the first six months of 2017. While the labor cost of these employees will be assumed by HQ, they are
VI-123

expected to be billed back and expensed within each Agencies’ Professional Services.
The primary technical adjustment now reflected in this financial plan represents the impact of the recent labor contract agreement, effective January 16, 2017, between the MTA and the TWU (Transit Workers Union). The terms of this contract are also assumed for the other NYCT unions that traditionally follow the TWU pattern. The combined cash impact of the contract are increases of $13.1 million in 2017, $15.1 million in 2018, $19.5 million in 2019, and $4.4 million in 2020. These impacts include an offset representing half of the savings from a re-bid of the medical contract for its represented employees; the savings were derived from the joint efforts of both labor and management. Because the November Plan captured the full value of these savings without any recognition of the labor contribution, additional cash increases of $10.1 million in 2017, $17.0 million in 2018, $18.0 million in 2019, and $19.2 million in 2020 are now reflected in the February Plan. The attached also includes schedules detailing the monthly allocation of financial, including overtime, and headcount and utilization data based on the 2017 Adopted Budget for the purpose of reporting actual results on a monthly basis to the Board.
VI-124
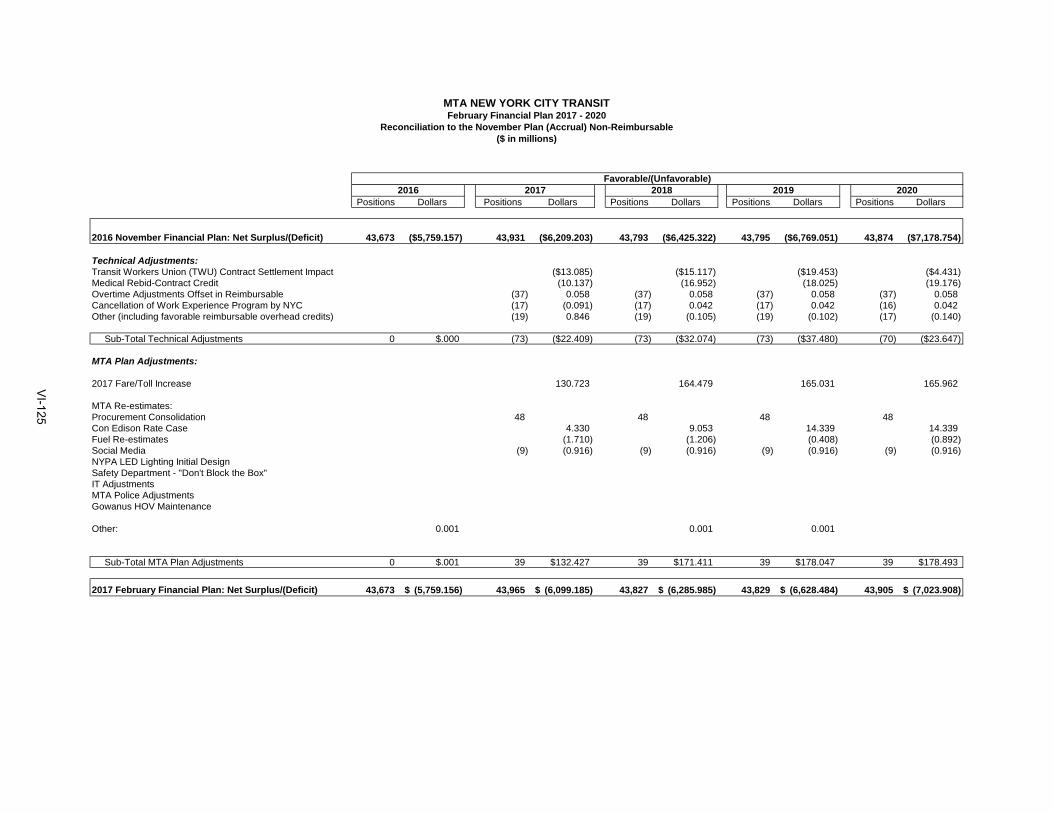
Positions Dollars Positions Dollars Positions Dollars Positions Dollars Positions Dollars
2016 November Financial Plan: Net Surplus/(Deficit) 43,673 ($5,759.157) 43,931 ($6,209.203) 43,793 ($6,425.322) 43,795 ($6,769.051) 43,874 ($7,178.754)
Technical Adjustments:Transit Workers Union (TWU) Contract Settlement Impact ($13.085) ($15.117) ($19.453) ($4.431)Medical Rebid-Contract Credit (10.137) (16.952) (18.025) (19.176)Overtime Adjustments Offset in Reimbursable (37) 0.058 (37) 0.058 (37) 0.058 (37) 0.058Cancellation of Work Experience Program by NYC (17) (0.091) (17) 0.042 (17) 0.042 (16) 0.042Other (including favorable reimbursable overhead credits) (19) 0.846 (19) (0.105) (19) (0.102) (17) (0.140)
Sub-Total Technical Adjustments 0 $.000 (73) ($22.409) (73) ($32.074) (73) ($37.480) (70) ($23.647)
MTA Plan Adjustments:
2017 Fare/Toll Increase 130.723 164.479 165.031 165.962
MTA Re-estimates:Procurement Consolidation 48 48 48 48Con Edison Rate Case 4.330 9.053 14.339 14.339 Fuel Re-estimates (1.710) (1.206) (0.408) (0.892) Social Media (9) (0.916) (9) (0.916) (9) (0.916) (9) (0.916) NYPA LED Lighting Initial DesignSafety Department - "Don't Block the Box"IT AdjustmentsMTA Police AdjustmentsGowanus HOV Maintenance
Other: 0.001 0.001 0.001
Sub-Total MTA Plan Adjustments 0 $.001 39 $132.427 39 $171.411 39 $178.047 39 $178.493
2017 February Financial Plan: Net Surplus/(Deficit) 43,673 (5,759.156)$ 43,965 (6,099.185)$ 43,827 (6,285.985)$ 43,829 (6,628.484)$ 43,905 (7,023.908)$
2016 2017 2018 2019 2020
MTA NEW YORK CITY TRANSITFebruary Financial Plan 2017 - 2020
Reconciliation to the November Plan (Accrual) Non-Reimbursable($ in millions)
Favorable/(Unfavorable)
VI-125
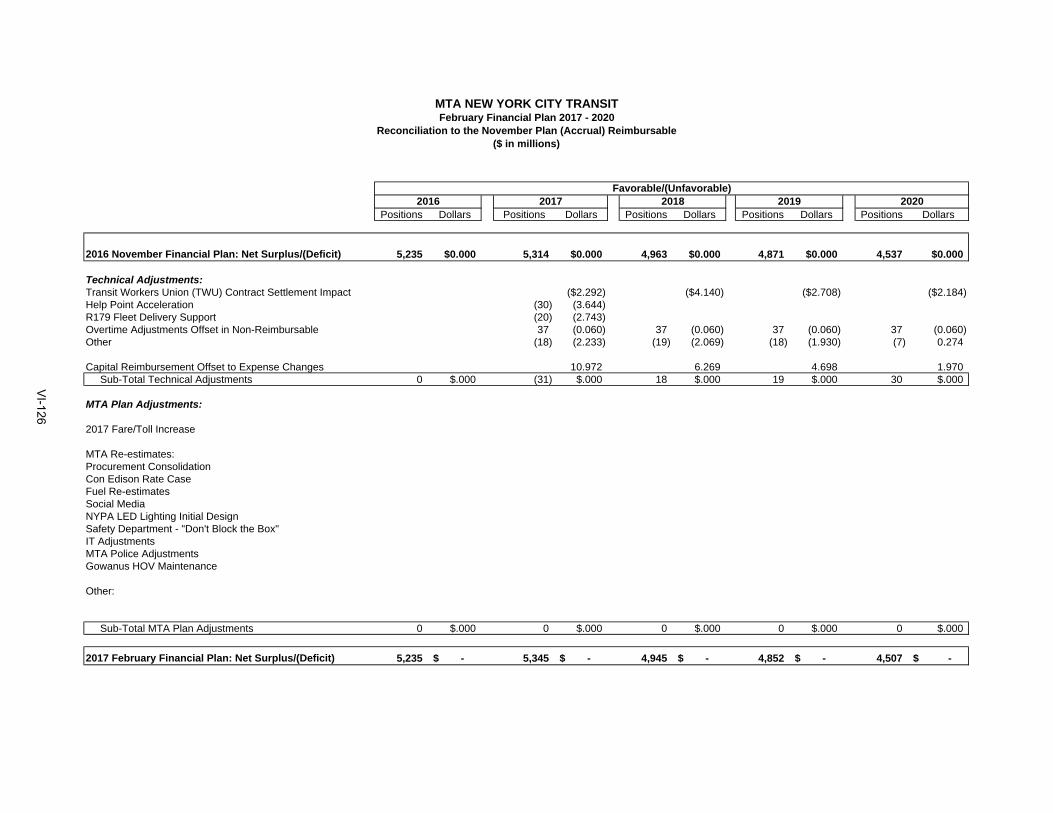
Positions Dollars Positions Dollars Positions Dollars Positions Dollars Positions Dollars
2016 November Financial Plan: Net Surplus/(Deficit) 5,235 $0.000 5,314 $0.000 4,963 $0.000 4,871 $0.000 4,537 $0.000
Technical Adjustments: Transit Workers Union (TWU) Contract Settlement Impact ($2.292) ($4.140) ($2.708) ($2.184)Help Point Acceleration (30) (3.644) R179 Fleet Delivery Support (20) (2.743)Overtime Adjustments Offset in Non-Reimbursable 37 (0.060) 37 (0.060) 37 (0.060) 37 (0.060)Other (18) (2.233) (19) (2.069) (18) (1.930) (7) 0.274
Capital Reimbursement Offset to Expense Changes 10.972 6.269 4.698 1.970 Sub-Total Technical Adjustments 0 $.000 (31) $.000 18 $.000 19 $.000 30 $.000
MTA Plan Adjustments:
2017 Fare/Toll Increase
MTA Re-estimates:Procurement ConsolidationCon Edison Rate CaseFuel Re-estimatesSocial MediaNYPA LED Lighting Initial DesignSafety Department - "Don't Block the Box"IT AdjustmentsMTA Police AdjustmentsGowanus HOV Maintenance
Other:
Sub-Total MTA Plan Adjustments 0 $.000 0 $.000 0 $.000 0 $.000 0 $.000
2017 February Financial Plan: Net Surplus/(Deficit) 5,235 -$ 5,345 -$ 4,945 -$ 4,852 -$ 4,507 -$
2016 2017 2018 2019 2020
MTA NEW YORK CITY TRANSITFebruary Financial Plan 2017 - 2020
Reconciliation to the November Plan (Accrual) Reimbursable($ in millions)
Favorable/(Unfavorable)
VI-126
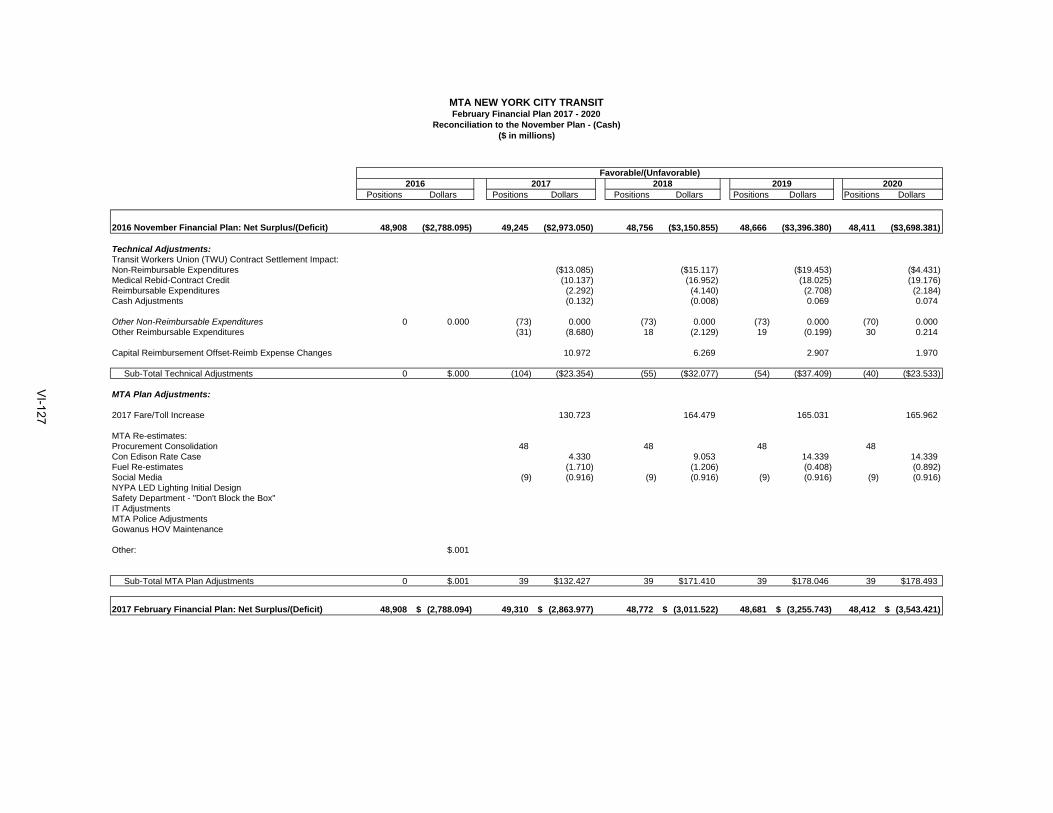
Positions Dollars Positions Dollars Positions Dollars Positions Dollars Positions Dollars
2016 November Financial Plan: Net Surplus/(Deficit) 48,908 ($2,788.095) 49,245 ($2,973.050) 48,756 ($3,150.855) 48,666 ($3,396.380) 48,411 ($3,698.381)
Technical Adjustments:Transit Workers Union (TWU) Contract Settlement Impact:Non-Reimbursable Expenditures ($13.085) ($15.117) ($19.453) ($4.431)Medical Rebid-Contract Credit (10.137) (16.952) (18.025) (19.176)Reimbursable Expenditures (2.292) (4.140) (2.708) (2.184)Cash Adjustments (0.132) (0.008) 0.069 0.074
Other Non-Reimbursable Expenditures 0 0.000 (73) 0.000 (73) 0.000 (73) 0.000 (70) 0.000Other Reimbursable Expenditures (31) (8.680) 18 (2.129) 19 (0.199) 30 0.214
Capital Reimbursement Offset-Reimb Expense Changes 10.972 6.269 2.907 1.970 Sub-Total Technical Adjustments 0 $.000 (104) ($23.354) (55) ($32.077) (54) ($37.409) (40) ($23.533)
MTA Plan Adjustments:
2017 Fare/Toll Increase 130.723 164.479 165.031 165.962
MTA Re-estimates:Procurement Consolidation 48 48 48 48Con Edison Rate Case 4.330 9.053 14.339 14.339 Fuel Re-estimates (1.710) (1.206) (0.408) (0.892) Social Media (9) (0.916) (9) (0.916) (9) (0.916) (9) (0.916) NYPA LED Lighting Initial DesignSafety Department - "Don't Block the Box"IT AdjustmentsMTA Police AdjustmentsGowanus HOV Maintenance
Other: $.001
Sub-Total MTA Plan Adjustments 0 $.001 39 $132.427 39 $171.410 39 $178.046 39 $178.493
2017 February Financial Plan: Net Surplus/(Deficit) 48,908 (2,788.094)$ 49,310 (2,863.977)$ 48,772 (3,011.522)$ 48,681 (3,255.743)$ 48,412 (3,543.421)$
2016 2017 2018 2019 2020
MTA NEW YORK CITY TRANSITFebruary Financial Plan 2017 - 2020
Reconciliation to the November Plan - (Cash)($ in millions)
Favorable/(Unfavorable)
VI-127
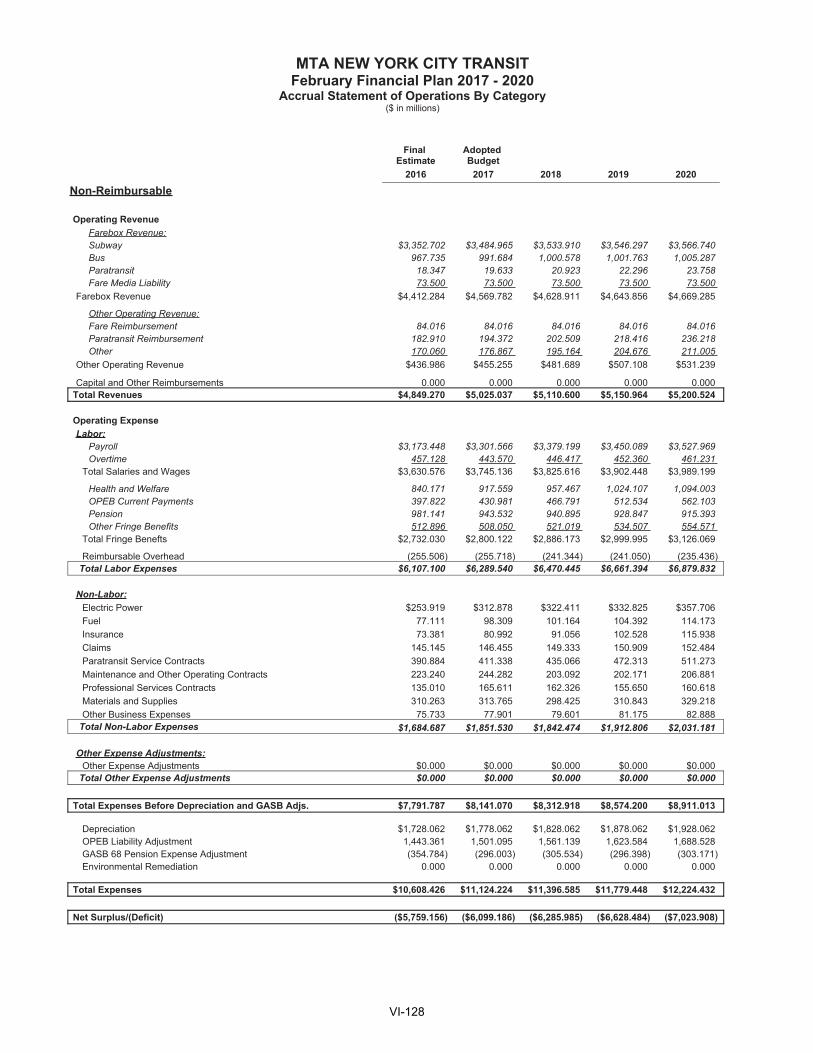
VI-128
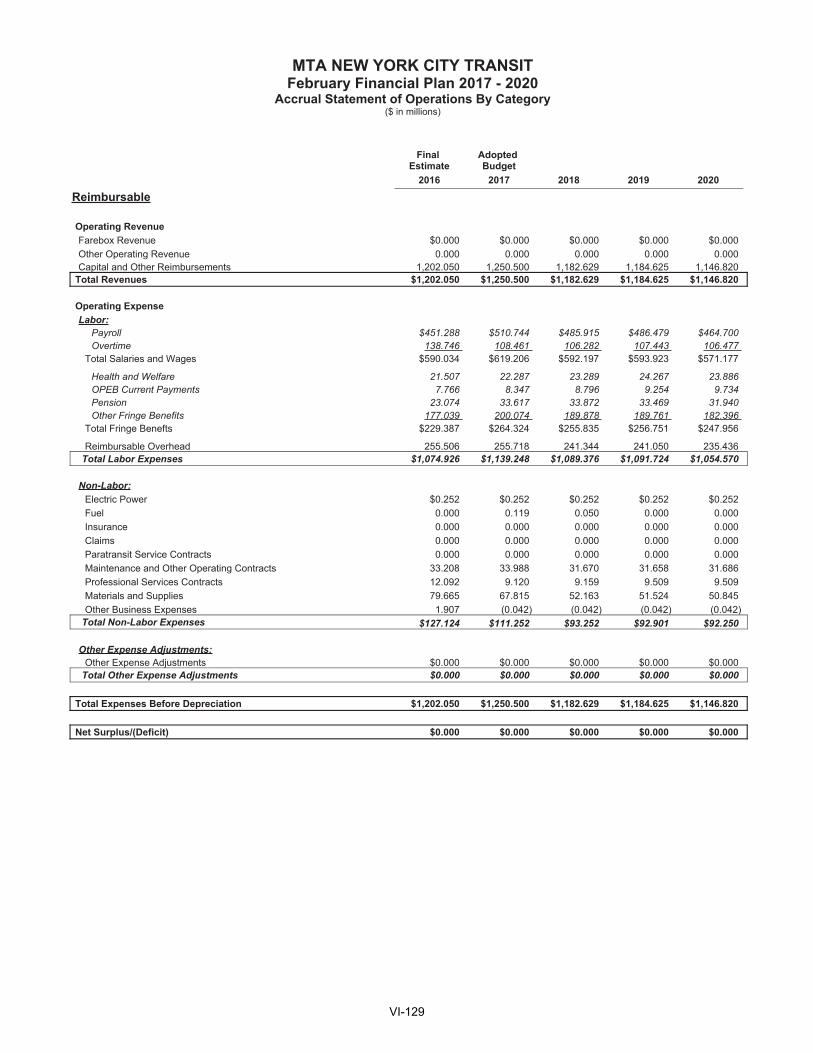
VI-129
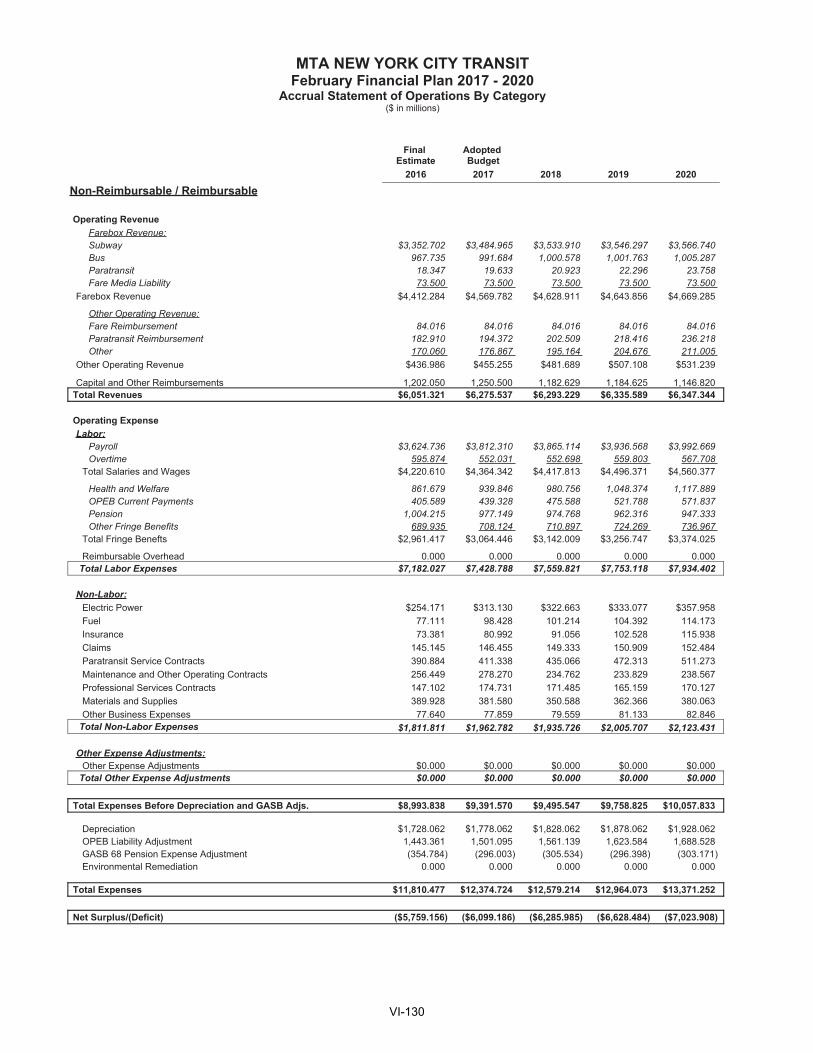
VI-130

VI-131
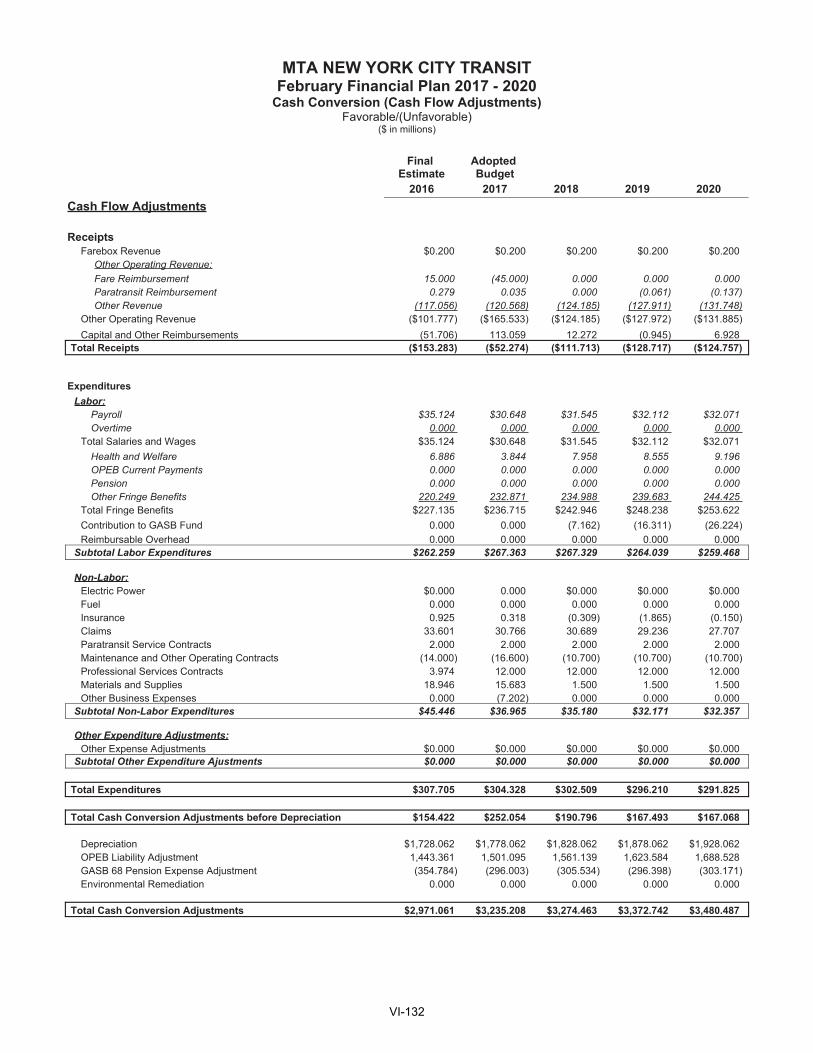
VI-132

MTA NEW YORK CITY TRANSIT2017 Adopted Budget
Non-Reimbursable/Reimbursable Overtime($ in millions)
2017 2017
TotalNON-REIMBURSABLE OVERTIME Hours $ %
Scheduled Service 4,269,458 $137.700 31.0%
Unscheduled Service 3,694,536 123.262 27.8%
Programmatic/Routine Maintenance 4,052,777 140.330 31.6%
Unscheduled Maintenance 0 0.000 0.0%
Vacancy/Absentee Coverage 496,920 15.830 3.6%
Weather Emergencies 538,813 17.473 3.9%
Safety/Security/Law Enforcement 129,566 3.780 0.9%
Other 165,770 5.195 1.2%
Subtotal 13,347,840 $443.570 100.0%
REIMBURSABLE OVERTIME 3,156,230 $108.461
TOTAL OVERTIME 16,504,071 $552.031
No hours for PTEs are included.
VI-133
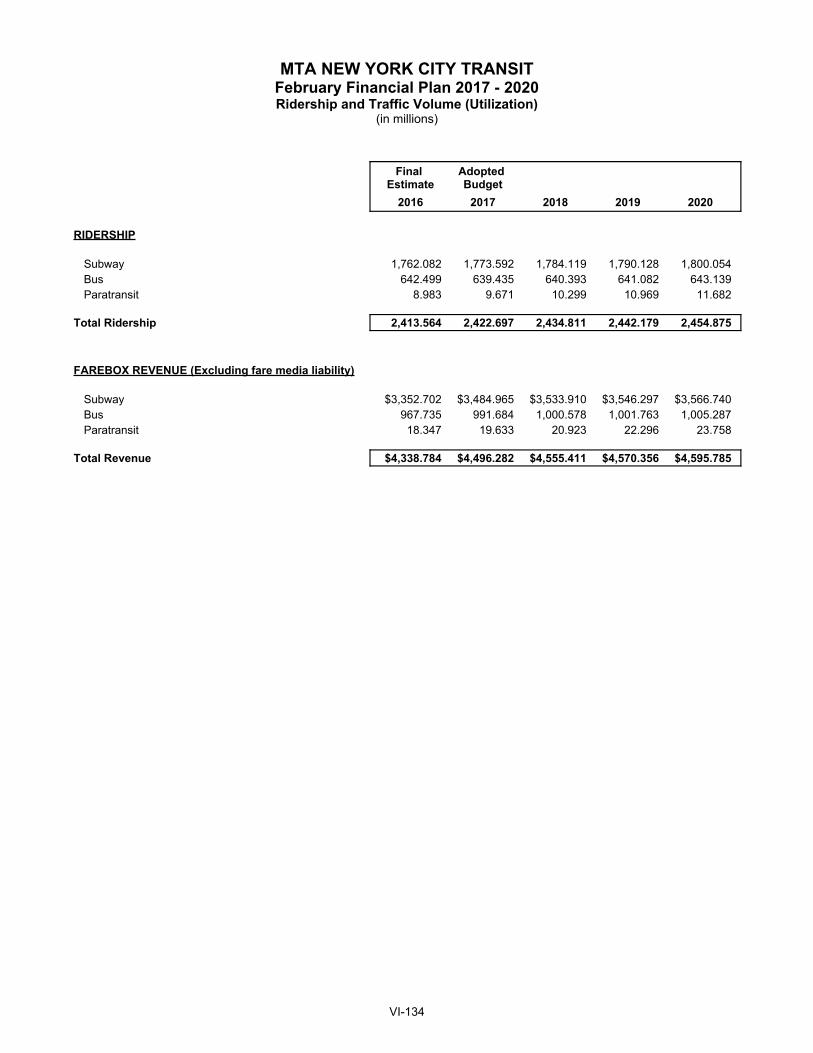
MTA NEW YORK CITY TRANSITFebruary Financial Plan 2017 - 2020Ridership and Traffic Volume (Utilization)
(in millions)
Final Estimate
Adopted Budget
2016 2017 2018 2019 2020
RIDERSHIP
Subway 1,762.082 1,773.592 1,784.119 1,790.128 1,800.054 Bus 642.499 639.435 640.393 641.082 643.139 Paratransit 8.983 9.671 10.299 10.969 11.682
Total Ridership 2,413.564 2,422.697 2,434.811 2,442.179 2,454.875
FAREBOX REVENUE (Excluding fare media liability)
Subway $3,352.702 $3,484.965 $3,533.910 $3,546.297 $3,566.740 Bus 967.735 991.684 1,000.578 1,001.763 1,005.287 Paratransit 18.347 19.633 20.923 22.296 23.758
Total Revenue $4,338.784 $4,496.282 $4,555.411 $4,570.356 $4,595.785
VI-134

Final AdoptedEstimate Budget
2016 2017 2018 2019 2020
Administration Office of the President 50 55 55 56 56 Law 320 320 320 320 320 Office of the EVP 55 54 54 54 52 Human Resources 232 233 231 230 230 Office of Management and Budget 42 44 44 44 43 Capital Planning & Budget 35 35 35 35 35 Corporate Communications 265 279 279 279 277 Non-Departmental (34) (31) (31) (31) (31) Labor Relations 98 97 97 97 97 Materiel 290 238 237 235 206 Controller 128 127 127 127 124
Total Administration 1,481 1,451 1,448 1,446 1,409
Operations Subways Service Delivery 8,315 8,536 8,395 8,369 8,245 Subways Operation Support /Admin 392 402 402 402 402 Subways Stations 2,669 2,608 2,592 2,592 2,592
Subtotal - Subways 11,376 11,546 11,389 11,363 11,239 Buses 11,042 11,156 11,116 11,116 11,116 Paratransit 213 213 213 213 213 Operations Planning 400 406 406 405 398 Revenue Control 583 583 583 583 583 Non-Departmental - 36 36 36 36
Total Operations 23,614 23,940 23,743 23,716 23,585 -
Maintenance Subways Operation Support /Admin 175 144 132 130 123 Subways Engineering 379 388 365 338 315 Subways Car Equipment 4,429 4,410 4,332 4,290 4,290 Subways Infrastructure 1,642 1,684 1,558 1,554 1,545 Subways Elevator & Escalators 488 505 500 487 489 Subways Stations 3,808 3,859 3,865 3,852 3,852 Subways Track 2,841 2,850 2,832 2,820 2,822 Subways Power 625 629 616 604 598 Subways Signals 1,517 1,527 1,493 1,469 1,451 Subways Electronics Maintenance 1,630 1,649 1,577 1,564 1,557
Subtotal - Subways 17,534 17,645 17,270 17,108 17,042 Buses 3,683 3,667 3,677 3,756 3,799 Supply Logistics 559 567 564 564 564 System Safety 99 99 99 99 96 Non-Departmental (82) (90) (60) (39) (39)
Total Maintenance 21,793 21,888 21,550 21,488 21,462
Engineering/Capital Capital Program Management 1,358 1,358 1,358 1,358 1,283
Total Engineering/Capital 1,358 1,358 1,358 1,358 1,283
Public Safety Security 662 673 673 673 673
Total Public Safety 662 673 673 673 673
Total Positions 48,908 49,310 48,772 48,681 48,412
Non-Reimbursable 43,673 43,965 43,827 43,828 43,904 Reimbursable 5,235 5,345 4,945 4,853 4,508
Total Full-Time 48,695 49,097 48,559 48,468 48,199 Total Full-Time Equivalents 213 213 213 213 213
MTA NEW YORK CITY TRANSITFebruary Financial Plan 2017 - 2020
Total Positions by FunctionNon-Reimbursable/Reimbursable and Full-Time Positions/Full-Time Equivalents
Function/Department
VI-135

MTA NEW YORK CITY TRANSITFebruary Financial Plan 2017 - 2020
Total Positions by Functional and Occupational GroupNon-Reimbursable and Reimbursable
Final Estimate
Adopted Budget
2016 2017 2018 2019 2020
FUNCTION / OCCUPATIONAL GROUP
AdministrationManagers/Supervisors 536 516 515 513 494 Professional/Technical/Clerical 916 906 904 904 886 Operational Hourlies 29 29 29 29 29
Total Administration Headcount 1,481 1,451 1,448 1,446 1,409
OperationsManagers/Supervisors 2,786 2,799 2,791 2,788 2,779 Professional/Technical/Clerical 507 515 517 516 514 Operational Hourlies 20,321 20,626 20,435 20,412 20,292
Total Operations Headcount 23,614 23,940 23,743 23,716 23,585
MaintenanceManagers/Supervisors 3,925 3,932 3,844 3,827 3,818 Professional/Technical/Clerical 1,124 1,153 1,109 1,099 1,068 Operational Hourlies 16,744 16,803 16,597 16,562 16,576
Total Maintenance Headcount 21,793 21,888 21,550 21,488 21,462
Engineering / CapitalManagers/Supervisors 339 339 339 339 283 Professional/Technical/Clerical 1,017 1,017 1,017 1,017 998 Operational Hourlies 2 2 2 2 2
Total Engineering Headcount 1,358 1,358 1,358 1,358 1,283
Public SafetyManagers/Supervisors 288 295 295 295 295 Professional, Technical, Clerical 38 42 42 42 42 Operational Hourlies 336 336 336 336 336
Total Public Safety Headcount 662 673 673 673 673
Total PositionsManagers/Supervisors 7,874 7,881 7,784 7,762 7,669 Professional, Technical, Clerical 3,602 3,633 3,589 3,578 3,508 Operational Hourlies 37,432 37,796 37,399 37,341 37,235
Total Positions 48,908 49,310 48,772 48,681 48,412
VI-136
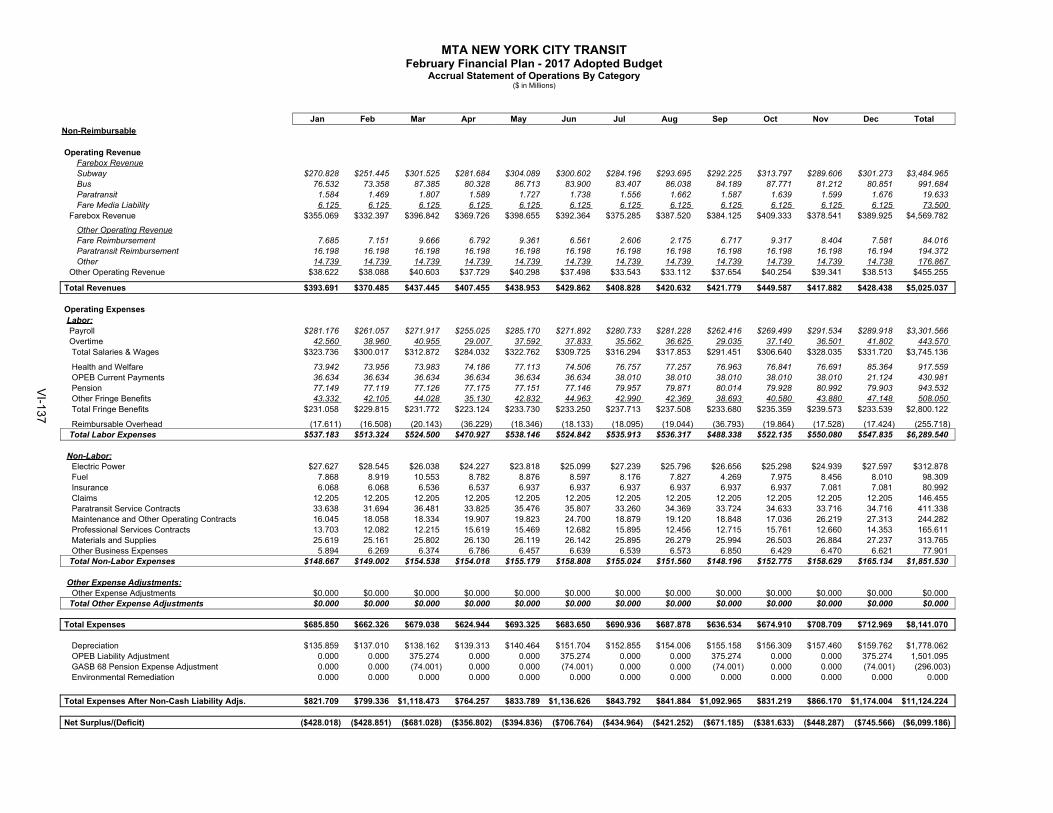
MTA NEW YORK CITY TRANSITFebruary Financial Plan - 2017 Adopted Budget
Accrual Statement of Operations By Category($ in Millions)
Jan Feb Mar Apr May Jun Jul Aug Sep Oct Nov Dec TotalNon-Reimbursable
Operating RevenueFarebox RevenueSubway $270.828 $251.445 $301.525 $281.684 $304.089 $300.602 $284.196 $293.695 $292.225 $313.797 $289.606 $301.273 $3,484.965 Bus 76.532 73.358 87.385 80.328 86.713 83.900 83.407 86.038 84.189 87.771 81.212 80.851 991.684 Paratransit 1.584 1.469 1.807 1.589 1.727 1.738 1.556 1.662 1.587 1.639 1.599 1.676 19.633 Fare Media Liability 6.125 6.125 6.125 6.125 6.125 6.125 6.125 6.125 6.125 6.125 6.125 6.125 73.500
Farebox Revenue $355.069 $332.397 $396.842 $369.726 $398.655 $392.364 $375.285 $387.520 $384.125 $409.333 $378.541 $389.925 $4,569.782
Other Operating RevenueFare Reimbursement 7.685 7.151 9.666 6.792 9.361 6.561 2.606 2.175 6.717 9.317 8.404 7.581 84.016 Paratransit Reimbursement 16.198 16.198 16.198 16.198 16.198 16.198 16.198 16.198 16.198 16.198 16.198 16.194 194.372 Other 14.739 14.739 14.739 14.739 14.739 14.739 14.739 14.739 14.739 14.739 14.739 14.738 176.867
Other Operating Revenue $38.622 $38.088 $40.603 $37.729 $40.298 $37.498 $33.543 $33.112 $37.654 $40.254 $39.341 $38.513 $455.255
Total Revenues $393.691 $370.485 $437.445 $407.455 $438.953 $429.862 $408.828 $420.632 $421.779 $449.587 $417.882 $428.438 $5,025.037
Operating ExpensesLabor:Payroll $281.176 $261.057 $271.917 $255.025 $285.170 $271.892 $280.733 $281.228 $262.416 $269.499 $291.534 $289.918 $3,301.566 Overtime 42.560 38.960 40.955 29.007 37.592 37.833 35.562 36.625 29.035 37.140 36.501 41.802 443.570 Total Salaries & Wages $323.736 $300.017 $312.872 $284.032 $322.762 $309.725 $316.294 $317.853 $291.451 $306.640 $328.035 $331.720 $3,745.136
Health and Welfare 73.942 73.956 73.983 74.186 77.113 74.506 76.757 77.257 76.963 76.841 76.691 85.364 917.559 OPEB Current Payments 36.634 36.634 36.634 36.634 36.634 36.634 38.010 38.010 38.010 38.010 38.010 21.124 430.981 Pension 77.149 77.119 77.126 77.175 77.151 77.146 79.957 79.871 80.014 79.928 80.992 79.903 943.532 Other Fringe Benefits 43.332 42.105 44.028 35.130 42.832 44.963 42.990 42.369 38.693 40.580 43.880 47.148 508.050 Total Fringe Benefits $231.058 $229.815 $231.772 $223.124 $233.730 $233.250 $237.713 $237.508 $233.680 $235.359 $239.573 $233.539 $2,800.122
Reimbursable Overhead (17.611) (16.508) (20.143) (36.229) (18.346) (18.133) (18.095) (19.044) (36.793) (19.864) (17.528) (17.424) (255.718)Total Labor Expenses $537.183 $513.324 $524.500 $470.927 $538.146 $524.842 $535.913 $536.317 $488.338 $522.135 $550.080 $547.835 $6,289.540
Non-Labor:Electric Power $27.627 $28.545 $26.038 $24.227 $23.818 $25.099 $27.239 $25.796 $26.656 $25.298 $24.939 $27.597 $312.878 Fuel 7.868 8.919 10.553 8.782 8.876 8.597 8.176 7.827 4.269 7.975 8.456 8.010 98.309 Insurance 6.068 6.068 6.536 6.537 6.937 6.937 6.937 6.937 6.937 6.937 7.081 7.081 80.992 Claims 12.205 12.205 12.205 12.205 12.205 12.205 12.205 12.205 12.205 12.205 12.205 12.205 146.455 Paratransit Service Contracts 33.638 31.694 36.481 33.825 35.476 35.807 33.260 34.369 33.724 34.633 33.716 34.716 411.338 Maintenance and Other Operating Contracts 16.045 18.058 18.334 19.907 19.823 24.700 18.879 19.120 18.848 17.036 26.219 27.313 244.282 Professional Services Contracts 13.703 12.082 12.215 15.619 15.469 12.682 15.895 12.456 12.715 15.761 12.660 14.353 165.611 Materials and Supplies 25.619 25.161 25.802 26.130 26.119 26.142 25.895 26.279 25.994 26.503 26.884 27.237 313.765 Other Business Expenses 5.894 6.269 6.374 6.786 6.457 6.639 6.539 6.573 6.850 6.429 6.470 6.621 77.901
Total Non-Labor Expenses $148.667 $149.002 $154.538 $154.018 $155.179 $158.808 $155.024 $151.560 $148.196 $152.775 $158.629 $165.134 $1,851.530
Other Expense Adjustments:Other Expense Adjustments $0.000 $0.000 $0.000 $0.000 $0.000 $0.000 $0.000 $0.000 $0.000 $0.000 $0.000 $0.000 $0.000
Total Other Expense Adjustments $0.000 $0.000 $0.000 $0.000 $0.000 $0.000 $0.000 $0.000 $0.000 $0.000 $0.000 $0.000 $0.000
Total Expenses $685.850 $662.326 $679.038 $624.944 $693.325 $683.650 $690.936 $687.878 $636.534 $674.910 $708.709 $712.969 $8,141.070
Depreciation $135.859 $137.010 $138.162 $139.313 $140.464 $151.704 $152.855 $154.006 $155.158 $156.309 $157.460 $159.762 $1,778.062 OPEB Liability Adjustment 0.000 0.000 375.274 0.000 0.000 375.274 0.000 0.000 375.274 0.000 0.000 375.274 1,501.095 GASB 68 Pension Expense Adjustment 0.000 0.000 (74.001) 0.000 0.000 (74.001) 0.000 0.000 (74.001) 0.000 0.000 (74.001) (296.003)Environmental Remediation 0.000 0.000 0.000 0.000 0.000 0.000 0.000 0.000 0.000 0.000 0.000 0.000 0.000
Total Expenses After Non-Cash Liability Adjs. $821.709 $799.336 $1,118.473 $764.257 $833.789 $1,136.626 $843.792 $841.884 $1,092.965 $831.219 $866.170 $1,174.004 $11,124.224
Net Surplus/(Deficit) ($428.018) ($428.851) ($681.028) ($356.802) ($394.836) ($706.764) ($434.964) ($421.252) ($671.185) ($381.633) ($448.287) ($745.566) ($6,099.186)
VI-137
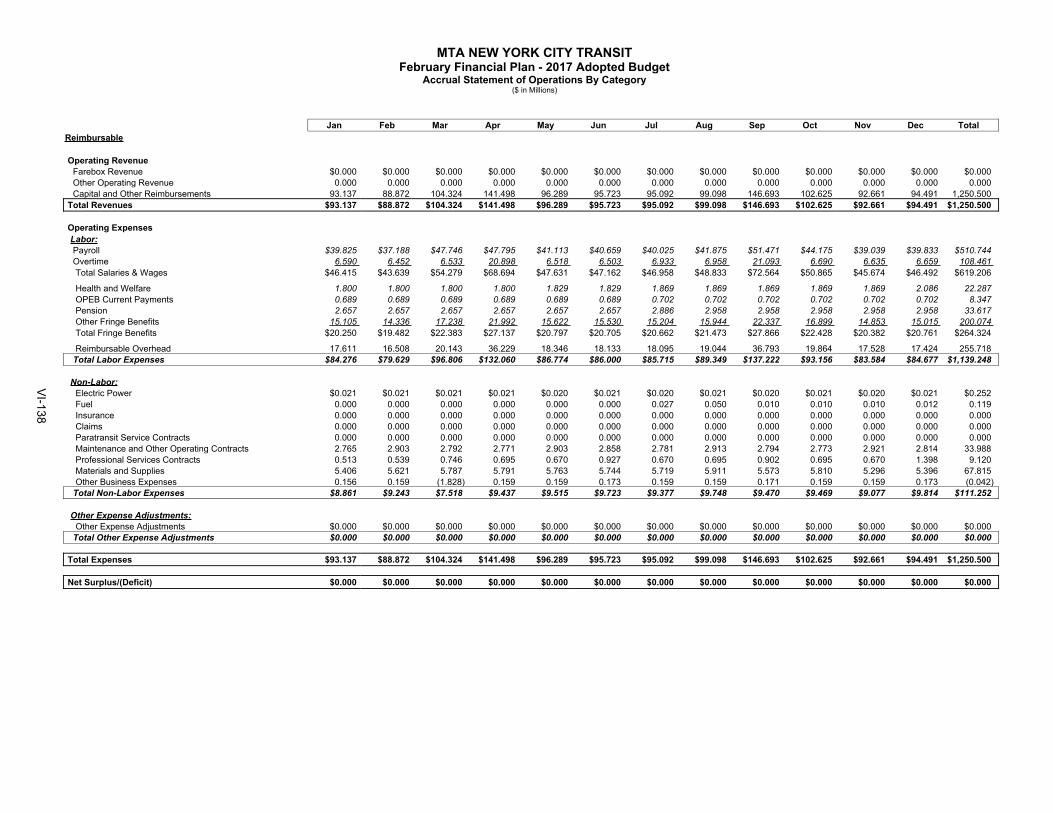
MTA NEW YORK CITY TRANSITFebruary Financial Plan - 2017 Adopted Budget
Accrual Statement of Operations By Category($ in Millions)
Jan Feb Mar Apr May Jun Jul Aug Sep Oct Nov Dec TotalReimbursable
Operating RevenueFarebox Revenue $0.000 $0.000 $0.000 $0.000 $0.000 $0.000 $0.000 $0.000 $0.000 $0.000 $0.000 $0.000 $0.000 Other Operating Revenue 0.000 0.000 0.000 0.000 0.000 0.000 0.000 0.000 0.000 0.000 0.000 0.000 0.000 Capital and Other Reimbursements 93.137 88.872 104.324 141.498 96.289 95.723 95.092 99.098 146.693 102.625 92.661 94.491 1,250.500
Total Revenues $93.137 $88.872 $104.324 $141.498 $96.289 $95.723 $95.092 $99.098 $146.693 $102.625 $92.661 $94.491 $1,250.500
Operating ExpensesLabor:Payroll $39.825 $37.188 $47.746 $47.795 $41.113 $40.659 $40.025 $41.875 $51.471 $44.175 $39.039 $39.833 $510.744 Overtime 6.590 6.452 6.533 20.898 6.518 6.503 6.933 6.958 21.093 6.690 6.635 6.659 108.461 Total Salaries & Wages $46.415 $43.639 $54.279 $68.694 $47.631 $47.162 $46.958 $48.833 $72.564 $50.865 $45.674 $46.492 $619.206
Health and Welfare 1.800 1.800 1.800 1.800 1.829 1.829 1.869 1.869 1.869 1.869 1.869 2.086 22.287 OPEB Current Payments 0.689 0.689 0.689 0.689 0.689 0.689 0.702 0.702 0.702 0.702 0.702 0.702 8.347 Pension 2.657 2.657 2.657 2.657 2.657 2.657 2.886 2.958 2.958 2.958 2.958 2.958 33.617 Other Fringe Benefits 15.105 14.336 17.238 21.992 15.622 15.530 15.204 15.944 22.337 16.899 14.853 15.015 200.074 Total Fringe Benefits $20.250 $19.482 $22.383 $27.137 $20.797 $20.705 $20.662 $21.473 $27.866 $22.428 $20.382 $20.761 $264.324
Reimbursable Overhead 17.611 16.508 20.143 36.229 18.346 18.133 18.095 19.044 36.793 19.864 17.528 17.424 255.718 Total Labor Expenses $84.276 $79.629 $96.806 $132.060 $86.774 $86.000 $85.715 $89.349 $137.222 $93.156 $83.584 $84.677 $1,139.248
Non-Labor:Electric Power $0.021 $0.021 $0.021 $0.021 $0.020 $0.021 $0.020 $0.021 $0.020 $0.021 $0.020 $0.021 $0.252 Fuel 0.000 0.000 0.000 0.000 0.000 0.000 0.027 0.050 0.010 0.010 0.010 0.012 0.119 Insurance 0.000 0.000 0.000 0.000 0.000 0.000 0.000 0.000 0.000 0.000 0.000 0.000 0.000 Claims 0.000 0.000 0.000 0.000 0.000 0.000 0.000 0.000 0.000 0.000 0.000 0.000 0.000 Paratransit Service Contracts 0.000 0.000 0.000 0.000 0.000 0.000 0.000 0.000 0.000 0.000 0.000 0.000 0.000 Maintenance and Other Operating Contracts 2.765 2.903 2.792 2.771 2.903 2.858 2.781 2.913 2.794 2.773 2.921 2.814 33.988 Professional Services Contracts 0.513 0.539 0.746 0.695 0.670 0.927 0.670 0.695 0.902 0.695 0.670 1.398 9.120 Materials and Supplies 5.406 5.621 5.787 5.791 5.763 5.744 5.719 5.911 5.573 5.810 5.296 5.396 67.815 Other Business Expenses 0.156 0.159 (1.828) 0.159 0.159 0.173 0.159 0.159 0.171 0.159 0.159 0.173 (0.042)
Total Non-Labor Expenses $8.861 $9.243 $7.518 $9.437 $9.515 $9.723 $9.377 $9.748 $9.470 $9.469 $9.077 $9.814 $111.252
Other Expense Adjustments:Other Expense Adjustments $0.000 $0.000 $0.000 $0.000 $0.000 $0.000 $0.000 $0.000 $0.000 $0.000 $0.000 $0.000 $0.000
Total Other Expense Adjustments $0.000 $0.000 $0.000 $0.000 $0.000 $0.000 $0.000 $0.000 $0.000 $0.000 $0.000 $0.000 $0.000
Total Expenses $93.137 $88.872 $104.324 $141.498 $96.289 $95.723 $95.092 $99.098 $146.693 $102.625 $92.661 $94.491 $1,250.500
Net Surplus/(Deficit) $0.000 $0.000 $0.000 $0.000 $0.000 $0.000 $0.000 $0.000 $0.000 $0.000 $0.000 $0.000 $0.000
VI-138
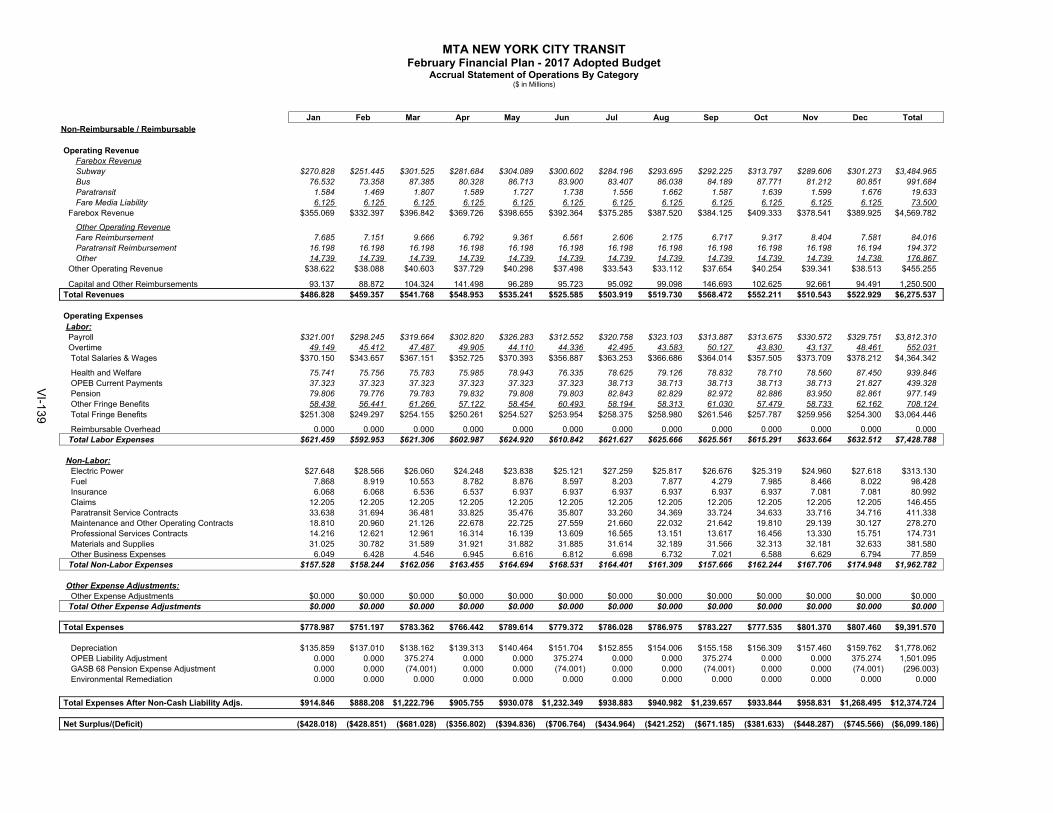
MTA NEW YORK CITY TRANSITFebruary Financial Plan - 2017 Adopted Budget
Accrual Statement of Operations By Category($ in Millions)
Jan Feb Mar Apr May Jun Jul Aug Sep Oct Nov Dec TotalNon-Reimbursable / Reimbursable
Operating RevenueFarebox RevenueSubway $270.828 $251.445 $301.525 $281.684 $304.089 $300.602 $284.196 $293.695 $292.225 $313.797 $289.606 $301.273 $3,484.965 Bus 76.532 73.358 87.385 80.328 86.713 83.900 83.407 86.038 84.189 87.771 81.212 80.851 991.684 Paratransit 1.584 1.469 1.807 1.589 1.727 1.738 1.556 1.662 1.587 1.639 1.599 1.676 19.633 Fare Media Liability 6.125 6.125 6.125 6.125 6.125 6.125 6.125 6.125 6.125 6.125 6.125 6.125 73.500
Farebox Revenue $355.069 $332.397 $396.842 $369.726 $398.655 $392.364 $375.285 $387.520 $384.125 $409.333 $378.541 $389.925 $4,569.782
Other Operating RevenueFare Reimbursement 7.685 7.151 9.666 6.792 9.361 6.561 2.606 2.175 6.717 9.317 8.404 7.581 84.016 Paratransit Reimbursement 16.198 16.198 16.198 16.198 16.198 16.198 16.198 16.198 16.198 16.198 16.198 16.194 194.372 Other 14.739 14.739 14.739 14.739 14.739 14.739 14.739 14.739 14.739 14.739 14.739 14.738 176.867
Other Operating Revenue $38.622 $38.088 $40.603 $37.729 $40.298 $37.498 $33.543 $33.112 $37.654 $40.254 $39.341 $38.513 $455.255
Capital and Other Reimbursements 93.137 88.872 104.324 141.498 96.289 95.723 95.092 99.098 146.693 102.625 92.661 94.491 1,250.500 Total Revenues $486.828 $459.357 $541.768 $548.953 $535.241 $525.585 $503.919 $519.730 $568.472 $552.211 $510.543 $522.929 $6,275.537
Operating ExpensesLabor:Payroll $321.001 $298.245 $319.664 $302.820 $326.283 $312.552 $320.758 $323.103 $313.887 $313.675 $330.572 $329.751 $3,812.310 Overtime 49.149 45.412 47.487 49.905 44.110 44.336 42.495 43.583 50.127 43.830 43.137 48.461 552.031 Total Salaries & Wages $370.150 $343.657 $367.151 $352.725 $370.393 $356.887 $363.253 $366.686 $364.014 $357.505 $373.709 $378.212 $4,364.342
Health and Welfare 75.741 75.756 75.783 75.985 78.943 76.335 78.625 79.126 78.832 78.710 78.560 87.450 939.846 OPEB Current Payments 37.323 37.323 37.323 37.323 37.323 37.323 38.713 38.713 38.713 38.713 38.713 21.827 439.328 Pension 79.806 79.776 79.783 79.832 79.808 79.803 82.843 82.829 82.972 82.886 83.950 82.861 977.149 Other Fringe Benefits 58.438 56.441 61.266 57.122 58.454 60.493 58.194 58.313 61.030 57.479 58.733 62.162 708.124 Total Fringe Benefits $251.308 $249.297 $254.155 $250.261 $254.527 $253.954 $258.375 $258.980 $261.546 $257.787 $259.956 $254.300 $3,064.446
Reimbursable Overhead 0.000 0.000 0.000 0.000 0.000 0.000 0.000 0.000 0.000 0.000 0.000 0.000 0.000 Total Labor Expenses $621.459 $592.953 $621.306 $602.987 $624.920 $610.842 $621.627 $625.666 $625.561 $615.291 $633.664 $632.512 $7,428.788
Non-Labor:Electric Power $27.648 $28.566 $26.060 $24.248 $23.838 $25.121 $27.259 $25.817 $26.676 $25.319 $24.960 $27.618 $313.130 Fuel 7.868 8.919 10.553 8.782 8.876 8.597 8.203 7.877 4.279 7.985 8.466 8.022 98.428 Insurance 6.068 6.068 6.536 6.537 6.937 6.937 6.937 6.937 6.937 6.937 7.081 7.081 80.992 Claims 12.205 12.205 12.205 12.205 12.205 12.205 12.205 12.205 12.205 12.205 12.205 12.205 146.455 Paratransit Service Contracts 33.638 31.694 36.481 33.825 35.476 35.807 33.260 34.369 33.724 34.633 33.716 34.716 411.338 Maintenance and Other Operating Contracts 18.810 20.960 21.126 22.678 22.725 27.559 21.660 22.032 21.642 19.810 29.139 30.127 278.270 Professional Services Contracts 14.216 12.621 12.961 16.314 16.139 13.609 16.565 13.151 13.617 16.456 13.330 15.751 174.731 Materials and Supplies 31.025 30.782 31.589 31.921 31.882 31.885 31.614 32.189 31.566 32.313 32.181 32.633 381.580 Other Business Expenses 6.049 6.428 4.546 6.945 6.616 6.812 6.698 6.732 7.021 6.588 6.629 6.794 77.859
Total Non-Labor Expenses $157.528 $158.244 $162.056 $163.455 $164.694 $168.531 $164.401 $161.309 $157.666 $162.244 $167.706 $174.948 $1,962.782
Other Expense Adjustments:Other Expense Adjustments $0.000 $0.000 $0.000 $0.000 $0.000 $0.000 $0.000 $0.000 $0.000 $0.000 $0.000 $0.000 $0.000
Total Other Expense Adjustments $0.000 $0.000 $0.000 $0.000 $0.000 $0.000 $0.000 $0.000 $0.000 $0.000 $0.000 $0.000 $0.000
Total Expenses $778.987 $751.197 $783.362 $766.442 $789.614 $779.372 $786.028 $786.975 $783.227 $777.535 $801.370 $807.460 $9,391.570
Depreciation $135.859 $137.010 $138.162 $139.313 $140.464 $151.704 $152.855 $154.006 $155.158 $156.309 $157.460 $159.762 $1,778.062 OPEB Liability Adjustment 0.000 0.000 375.274 0.000 0.000 375.274 0.000 0.000 375.274 0.000 0.000 375.274 1,501.095 GASB 68 Pension Expense Adjustment 0.000 0.000 (74.001) 0.000 0.000 (74.001) 0.000 0.000 (74.001) 0.000 0.000 (74.001) (296.003)Environmental Remediation 0.000 0.000 0.000 0.000 0.000 0.000 0.000 0.000 0.000 0.000 0.000 0.000 0.000
Total Expenses After Non-Cash Liability Adjs. $914.846 $888.208 $1,222.796 $905.755 $930.078 $1,232.349 $938.883 $940.982 $1,239.657 $933.844 $958.831 $1,268.495 $12,374.724
Net Surplus/(Deficit) ($428.018) ($428.851) ($681.028) ($356.802) ($394.836) ($706.764) ($434.964) ($421.252) ($671.185) ($381.633) ($448.287) ($745.566) ($6,099.186)
VI-139
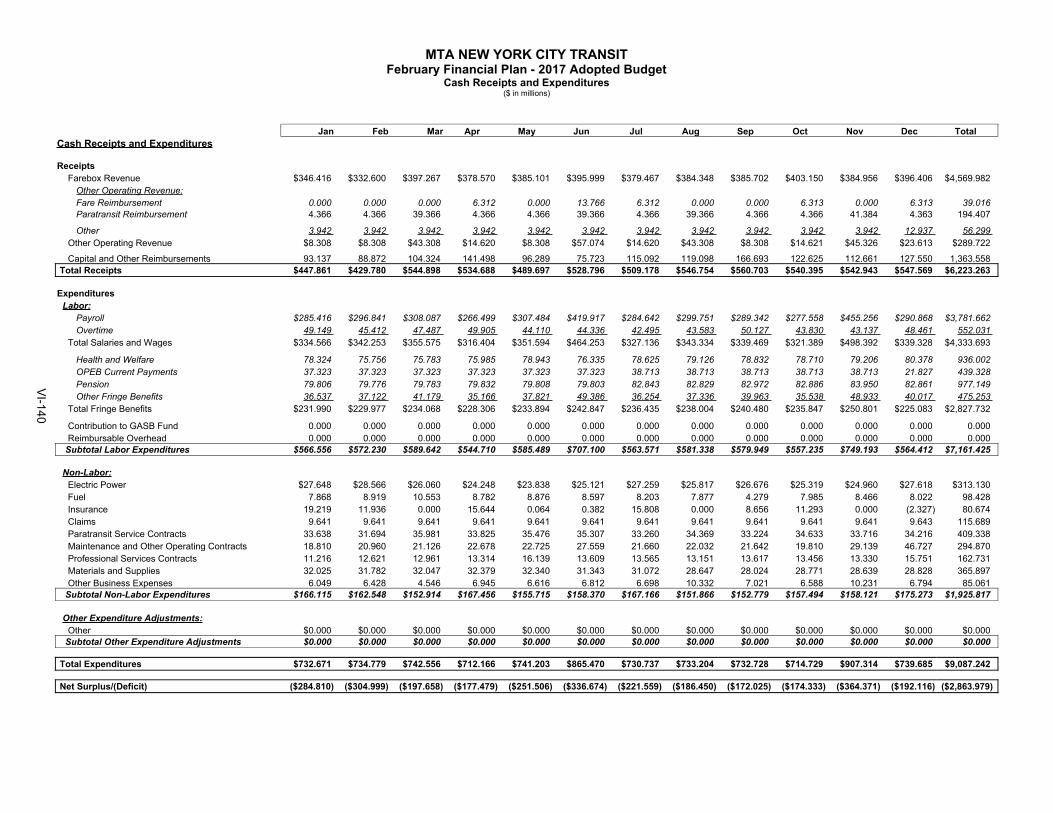
MTA NEW YORK CITY TRANSITFebruary Financial Plan - 2017 Adopted Budget
Cash Receipts and Expenditures($ in millions)
Jan Feb Mar Apr May Jun Jul Aug Sep Oct Nov Dec TotalCash Receipts and Expenditures
ReceiptsFarebox Revenue $346.416 $332.600 $397.267 $378.570 $385.101 $395.999 $379.467 $384.348 $385.702 $403.150 $384.956 $396.406 $4,569.982
Other Operating Revenue:Fare Reimbursement 0.000 0.000 0.000 6.312 0.000 13.766 6.312 0.000 0.000 6.313 0.000 6.313 39.016 Paratransit Reimbursement 4.366 4.366 39.366 4.366 4.366 39.366 4.366 39.366 4.366 4.366 41.384 4.363 194.407
Other 3.942 3.942 3.942 3.942 3.942 3.942 3.942 3.942 3.942 3.942 3.942 12.937 56.299 Other Operating Revenue $8.308 $8.308 $43.308 $14.620 $8.308 $57.074 $14.620 $43.308 $8.308 $14.621 $45.326 $23.613 $289.722
Capital and Other Reimbursements 93.137 88.872 104.324 141.498 96.289 75.723 115.092 119.098 166.693 122.625 112.661 127.550 1,363.558 Total Receipts $447.861 $429.780 $544.898 $534.688 $489.697 $528.796 $509.178 $546.754 $560.703 $540.395 $542.943 $547.569 $6,223.263
ExpendituresLabor:
Payroll $285.416 $296.841 $308.087 $266.499 $307.484 $419.917 $284.642 $299.751 $289.342 $277.558 $455.256 $290.868 $3,781.662 Overtime 49.149 45.412 47.487 49.905 44.110 44.336 42.495 43.583 50.127 43.830 43.137 48.461 552.031
Total Salaries and Wages $334.566 $342.253 $355.575 $316.404 $351.594 $464.253 $327.136 $343.334 $339.469 $321.389 $498.392 $339.328 $4,333.693
Health and Welfare 78.324 75.756 75.783 75.985 78.943 76.335 78.625 79.126 78.832 78.710 79.206 80.378 936.002 OPEB Current Payments 37.323 37.323 37.323 37.323 37.323 37.323 38.713 38.713 38.713 38.713 38.713 21.827 439.328 Pension 79.806 79.776 79.783 79.832 79.808 79.803 82.843 82.829 82.972 82.886 83.950 82.861 977.149 Other Fringe Benefits 36.537 37.122 41.179 35.166 37.821 49.386 36.254 37.336 39.963 35.538 48.933 40.017 475.253
Total Fringe Benefits $231.990 $229.977 $234.068 $228.306 $233.894 $242.847 $236.435 $238.004 $240.480 $235.847 $250.801 $225.083 $2,827.732
Contribution to GASB Fund 0.000 0.000 0.000 0.000 0.000 0.000 0.000 0.000 0.000 0.000 0.000 0.000 0.000 Reimbursable Overhead 0.000 0.000 0.000 0.000 0.000 0.000 0.000 0.000 0.000 0.000 0.000 0.000 0.000
Subtotal Labor Expenditures $566.556 $572.230 $589.642 $544.710 $585.489 $707.100 $563.571 $581.338 $579.949 $557.235 $749.193 $564.412 $7,161.425
Non-Labor:Electric Power $27.648 $28.566 $26.060 $24.248 $23.838 $25.121 $27.259 $25.817 $26.676 $25.319 $24.960 $27.618 $313.130 Fuel 7.868 8.919 10.553 8.782 8.876 8.597 8.203 7.877 4.279 7.985 8.466 8.022 98.428 Insurance 19.219 11.936 0.000 15.644 0.064 0.382 15.808 0.000 8.656 11.293 0.000 (2.327) 80.674 Claims 9.641 9.641 9.641 9.641 9.641 9.641 9.641 9.641 9.641 9.641 9.641 9.643 115.689 Paratransit Service Contracts 33.638 31.694 35.981 33.825 35.476 35.307 33.260 34.369 33.224 34.633 33.716 34.216 409.338 Maintenance and Other Operating Contracts 18.810 20.960 21.126 22.678 22.725 27.559 21.660 22.032 21.642 19.810 29.139 46.727 294.870 Professional Services Contracts 11.216 12.621 12.961 13.314 16.139 13.609 13.565 13.151 13.617 13.456 13.330 15.751 162.731 Materials and Supplies 32.025 31.782 32.047 32.379 32.340 31.343 31.072 28.647 28.024 28.771 28.639 28.828 365.897 Other Business Expenses 6.049 6.428 4.546 6.945 6.616 6.812 6.698 10.332 7.021 6.588 10.231 6.794 85.061
Subtotal Non-Labor Expenditures $166.115 $162.548 $152.914 $167.456 $155.715 $158.370 $167.166 $151.866 $152.779 $157.494 $158.121 $175.273 $1,925.817
Other Expenditure Adjustments:Other $0.000 $0.000 $0.000 $0.000 $0.000 $0.000 $0.000 $0.000 $0.000 $0.000 $0.000 $0.000 $0.000
Subtotal Other Expenditure Adjustments $0.000 $0.000 $0.000 $0.000 $0.000 $0.000 $0.000 $0.000 $0.000 $0.000 $0.000 $0.000 $0.000
Total Expenditures $732.671 $734.779 $742.556 $712.166 $741.203 $865.470 $730.737 $733.204 $732.728 $714.729 $907.314 $739.685 $9,087.242
Net Surplus/(Deficit) ($284.810) ($304.999) ($197.658) ($177.479) ($251.506) ($336.674) ($221.559) ($186.450) ($172.025) ($174.333) ($364.371) ($192.116) ($2,863.979)
VI-140
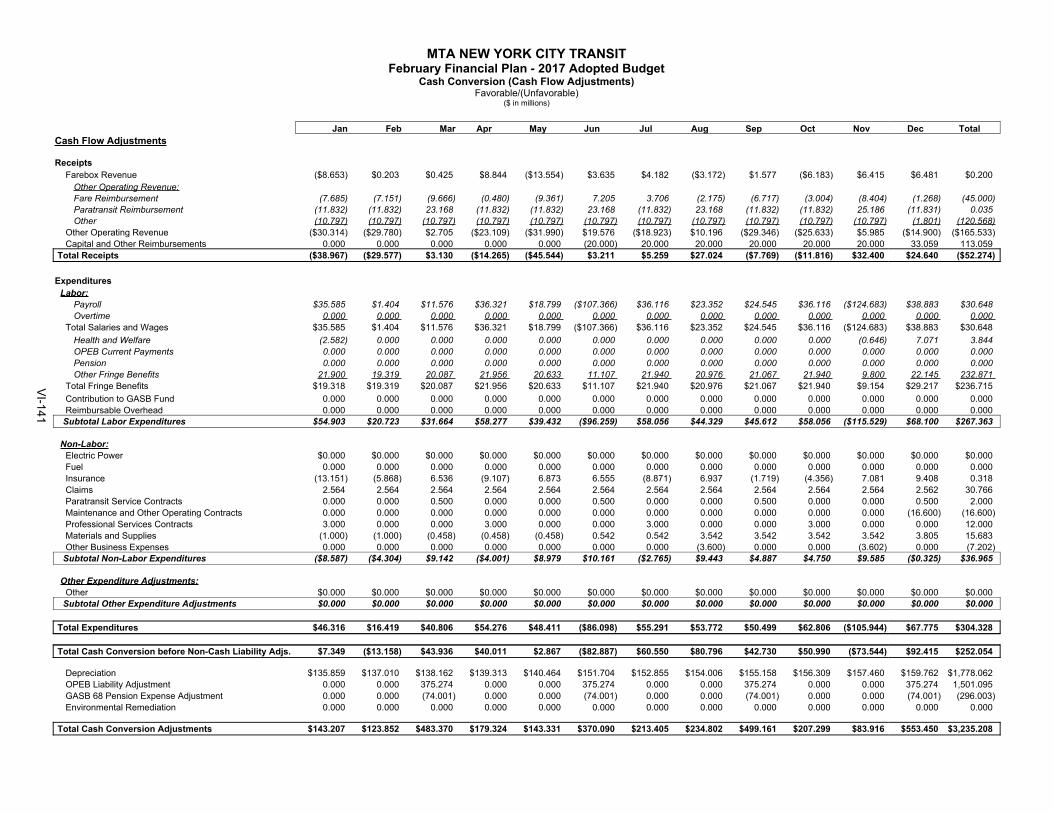
MTA NEW YORK CITY TRANSITFebruary Financial Plan - 2017 Adopted Budget
Cash Conversion (Cash Flow Adjustments)Favorable/(Unfavorable)
($ in millions)
Jan Feb Mar Apr May Jun Jul Aug Sep Oct Nov Dec TotalCash Flow Adjustments
ReceiptsFarebox Revenue ($8.653) $0.203 $0.425 $8.844 ($13.554) $3.635 $4.182 ($3.172) $1.577 ($6.183) $6.415 $6.481 $0.200
Other Operating Revenue:Fare Reimbursement (7.685) (7.151) (9.666) (0.480) (9.361) 7.205 3.706 (2.175) (6.717) (3.004) (8.404) (1.268) (45.000)Paratransit Reimbursement (11.832) (11.832) 23.168 (11.832) (11.832) 23.168 (11.832) 23.168 (11.832) (11.832) 25.186 (11.831) 0.035 Other (10.797) (10.797) (10.797) (10.797) (10.797) (10.797) (10.797) (10.797) (10.797) (10.797) (10.797) (1.801) (120.568)
Other Operating Revenue ($30.314) ($29.780) $2.705 ($23.109) ($31.990) $19.576 ($18.923) $10.196 ($29.346) ($25.633) $5.985 ($14.900) ($165.533)Capital and Other Reimbursements 0.000 0.000 0.000 0.000 0.000 (20.000) 20.000 20.000 20.000 20.000 20.000 33.059 113.059
Total Receipts ($38.967) ($29.577) $3.130 ($14.265) ($45.544) $3.211 $5.259 $27.024 ($7.769) ($11.816) $32.400 $24.640 ($52.274)
ExpendituresLabor:
Payroll $35.585 $1.404 $11.576 $36.321 $18.799 ($107.366) $36.116 $23.352 $24.545 $36.116 ($124.683) $38.883 $30.648 Overtime 0.000 0.000 0.000 0.000 0.000 0.000 0.000 0.000 0.000 0.000 0.000 0.000 0.000
Total Salaries and Wages $35.585 $1.404 $11.576 $36.321 $18.799 ($107.366) $36.116 $23.352 $24.545 $36.116 ($124.683) $38.883 $30.648 Health and Welfare (2.582) 0.000 0.000 0.000 0.000 0.000 0.000 0.000 0.000 0.000 (0.646) 7.071 3.844 OPEB Current Payments 0.000 0.000 0.000 0.000 0.000 0.000 0.000 0.000 0.000 0.000 0.000 0.000 0.000 Pension 0.000 0.000 0.000 0.000 0.000 0.000 0.000 0.000 0.000 0.000 0.000 0.000 0.000 Other Fringe Benefits 21.900 19.319 20.087 21.956 20.633 11.107 21.940 20.976 21.067 21.940 9.800 22.145 232.871
Total Fringe Benefits $19.318 $19.319 $20.087 $21.956 $20.633 $11.107 $21.940 $20.976 $21.067 $21.940 $9.154 $29.217 $236.715 Contribution to GASB Fund 0.000 0.000 0.000 0.000 0.000 0.000 0.000 0.000 0.000 0.000 0.000 0.000 0.000 Reimbursable Overhead 0.000 0.000 0.000 0.000 0.000 0.000 0.000 0.000 0.000 0.000 0.000 0.000 0.000
Subtotal Labor Expenditures $54.903 $20.723 $31.664 $58.277 $39.432 ($96.259) $58.056 $44.329 $45.612 $58.056 ($115.529) $68.100 $267.363
Non-Labor:Electric Power $0.000 $0.000 $0.000 $0.000 $0.000 $0.000 $0.000 $0.000 $0.000 $0.000 $0.000 $0.000 $0.000 Fuel 0.000 0.000 0.000 0.000 0.000 0.000 0.000 0.000 0.000 0.000 0.000 0.000 0.000 Insurance (13.151) (5.868) 6.536 (9.107) 6.873 6.555 (8.871) 6.937 (1.719) (4.356) 7.081 9.408 0.318 Claims 2.564 2.564 2.564 2.564 2.564 2.564 2.564 2.564 2.564 2.564 2.564 2.562 30.766 Paratransit Service Contracts 0.000 0.000 0.500 0.000 0.000 0.500 0.000 0.000 0.500 0.000 0.000 0.500 2.000 Maintenance and Other Operating Contracts 0.000 0.000 0.000 0.000 0.000 0.000 0.000 0.000 0.000 0.000 0.000 (16.600) (16.600)Professional Services Contracts 3.000 0.000 0.000 3.000 0.000 0.000 3.000 0.000 0.000 3.000 0.000 0.000 12.000 Materials and Supplies (1.000) (1.000) (0.458) (0.458) (0.458) 0.542 0.542 3.542 3.542 3.542 3.542 3.805 15.683 Other Business Expenses 0.000 0.000 0.000 0.000 0.000 0.000 0.000 (3.600) 0.000 0.000 (3.602) 0.000 (7.202)
Subtotal Non-Labor Expenditures ($8.587) ($4.304) $9.142 ($4.001) $8.979 $10.161 ($2.765) $9.443 $4.887 $4.750 $9.585 ($0.325) $36.965
Other Expenditure Adjustments:Other $0.000 $0.000 $0.000 $0.000 $0.000 $0.000 $0.000 $0.000 $0.000 $0.000 $0.000 $0.000 $0.000
Subtotal Other Expenditure Adjustments $0.000 $0.000 $0.000 $0.000 $0.000 $0.000 $0.000 $0.000 $0.000 $0.000 $0.000 $0.000 $0.000
Total Expenditures $46.316 $16.419 $40.806 $54.276 $48.411 ($86.098) $55.291 $53.772 $50.499 $62.806 ($105.944) $67.775 $304.328
Total Cash Conversion before Non-Cash Liability Adjs. $7.349 ($13.158) $43.936 $40.011 $2.867 ($82.887) $60.550 $80.796 $42.730 $50.990 ($73.544) $92.415 $252.054
Depreciation $135.859 $137.010 $138.162 $139.313 $140.464 $151.704 $152.855 $154.006 $155.158 $156.309 $157.460 $159.762 $1,778.062 OPEB Liability Adjustment 0.000 0.000 375.274 0.000 0.000 375.274 0.000 0.000 375.274 0.000 0.000 375.274 1,501.095 GASB 68 Pension Expense Adjustment 0.000 0.000 (74.001) 0.000 0.000 (74.001) 0.000 0.000 (74.001) 0.000 0.000 (74.001) (296.003)Environmental Remediation 0.000 0.000 0.000 0.000 0.000 0.000 0.000 0.000 0.000 0.000 0.000 0.000 0.000
Total Cash Conversion Adjustments $143.207 $123.852 $483.370 $179.324 $143.331 $370.090 $213.405 $234.802 $499.161 $207.299 $83.916 $553.450 $3,235.208
VI-141

MTA NEW YORK CITY TRANSITFebruary Financial Plan - 2017 Adopted Budget
Non-Reimbursable/Reimbursable Overtime($ in millions)
Jan Feb Mar Apr May Jun Jul Aug Sep Oct Nov Dec Total
NON-REIMBURSABLE OVERTIME
Scheduled Service $11.534 $10.743 $12.229 $11.148 $11.967 $11.737 $10.813 $11.450 $11.215 $11.953 $11.548 $11.363 $137.700
Unscheduled Service 9.447 9.280 9.993 10.079 10.400 10.486 10.062 10.439 10.009 10.222 9.844 13.001 123.262
Programmatic/Routine Maintenance 14.469 11.893 13.395 5.615 13.064 13.434 12.478 12.585 5.684 12.819 12.842 12.050 140.330
Unscheduled Maintenance 0.000 0.000 0.000 0.000 0.000 0.000 0.000 0.000 0.000 0.000 0.000 0.000 0.000
Vacancy/Absentee Coverage 1.305 1.320 1.320 1.320 1.320 1.320 1.320 1.320 1.320 1.320 1.320 1.320 15.830
Weather Emergencies 5.045 5.000 3.265 0.100 0.093 0.115 0.145 0.078 0.063 0.078 0.189 3.303 17.473
Safety/Security/Law Enforcement 0.312 0.315 0.315 0.315 0.315 0.315 0.315 0.315 0.315 0.315 0.315 0.316 3.780
Other 0.447 0.408 0.437 0.430 0.432 0.425 0.428 0.437 0.428 0.432 0.441 0.449 5.195
Subtotal $42.560 $38.960 $40.955 $29.007 $37.592 $37.833 $35.562 $36.625 $29.035 $37.140 $36.501 $41.802 $443.570
REIMBURSABLE OVERTIME $6.590 $6.452 $6.533 $20.898 $6.518 $6.503 $6.933 $6.958 $21.093 $6.690 $6.635 $6.659 $108.461
TOTAL OVERTIME $49.149 $45.412 $47.487 $49.905 $44.110 $44.336 $42.495 $43.583 $50.127 $43.830 $43.137 $48.461 $552.031
VI-142
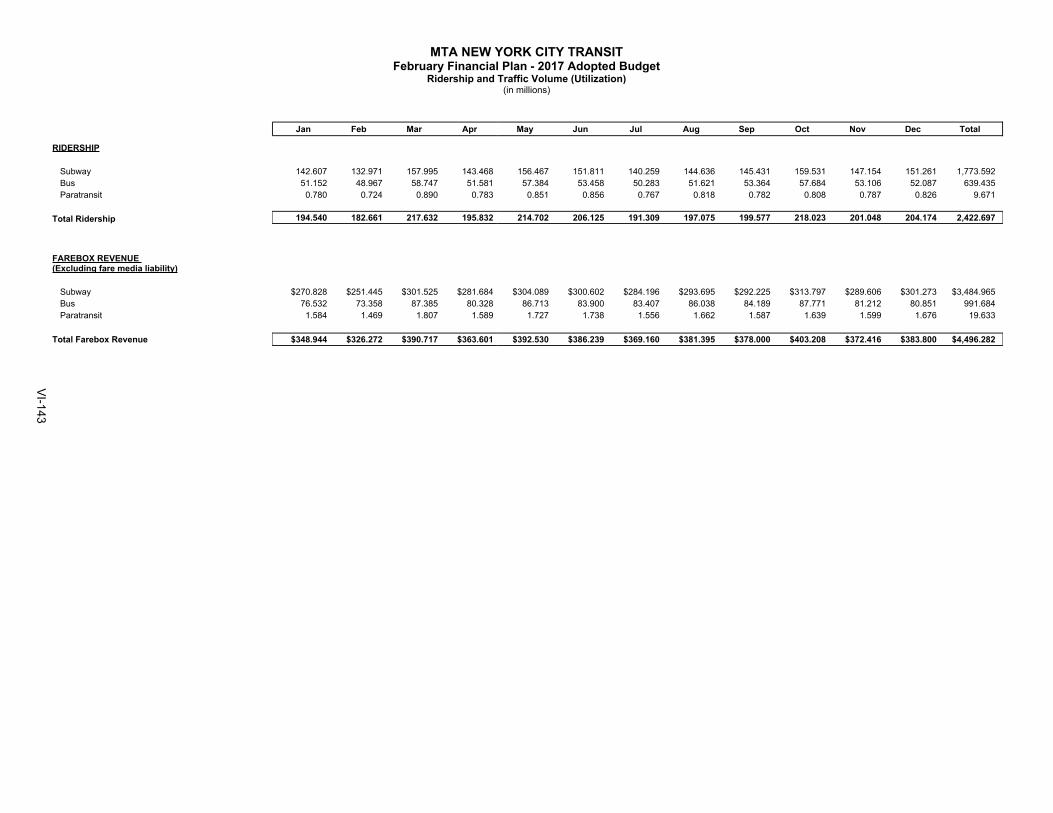
MTA NEW YORK CITY TRANSITFebruary Financial Plan - 2017 Adopted Budget
Ridership and Traffic Volume (Utilization)(in millions)
Jan Feb Mar Apr May Jun Jul Aug Sep Oct Nov Dec Total
RIDERSHIP
Subway 142.607 132.971 157.995 143.468 156.467 151.811 140.259 144.636 145.431 159.531 147.154 151.261 1,773.592 Bus 51.152 48.967 58.747 51.581 57.384 53.458 50.283 51.621 53.364 57.684 53.106 52.087 639.435 Paratransit 0.780 0.724 0.890 0.783 0.851 0.856 0.767 0.818 0.782 0.808 0.787 0.826 9.671
Total Ridership 194.540 182.661 217.632 195.832 214.702 206.125 191.309 197.075 199.577 218.023 201.048 204.174 2,422.697
FAREBOX REVENUE (Excluding fare media liability)
Subway $270.828 $251.445 $301.525 $281.684 $304.089 $300.602 $284.196 $293.695 $292.225 $313.797 $289.606 $301.273 $3,484.965 Bus 76.532 73.358 87.385 80.328 86.713 83.900 83.407 86.038 84.189 87.771 81.212 80.851 991.684 Paratransit 1.584 1.469 1.807 1.589 1.727 1.738 1.556 1.662 1.587 1.639 1.599 1.676 19.633
Total Farebox Revenue $348.944 $326.272 $390.717 $363.601 $392.530 $386.239 $369.160 $381.395 $378.000 $403.208 $372.416 $383.800 $4,496.282
VI-143

Function/Department Jan Feb Mar Apr May Jun Jul Aug Sep Oct Nov Dec EOYAdministration:
Office of the President 55 55 55 55 55 55 55 55 55 55 55 55 55 Law 320 320 320 320 320 320 320 320 320 320 320 320 320 Office of the EVP 54 54 54 54 54 54 54 54 54 54 54 54 54 Human Resources 237 237 237 237 237 237 233 233 233 233 233 233 233 Office of Management and Budget 44 44 44 44 44 44 44 44 44 44 44 44 44 Capital Planning and Budget 35 35 35 35 35 35 35 35 35 35 35 35 35 Corporate Communications 279 279 279 279 279 279 279 279 279 279 279 279 279 Non-Departmental (31) (31) (31) (31) (31) (31) (31) (31) (31) (31) (31) (31) (31)Labor Relations 97 97 97 97 97 97 97 97 97 97 97 97 97 Materiel 269 259 249 238 238 238 238 238 238 238 238 238 238 Controller 127 127 127 127 127 127 127 127 127 127 127 127 127
Total Administration 1,485 1,475 1,465 1,454 1,454 1,454 1,451 1,451 1,451 1,451 1,451 1,451 1,451 Operations:Subways Service Delivery 8,434 8,434 8,448 8,448 8,443 8,492 8,481 8,481 8,515 8,515 8,513 8,507 8,536 Subways Operations Support/Admin 412 412 412 412 412 412 412 412 412 412 412 412 402 Subways Stations 2,654 2,654 2,654 2,654 2,630 2,630 2,630 2,630 2,630 2,612 2,612 2,612 2,608
SubTotal Subways 11,500 11,500 11,514 11,514 11,485 11,534 11,523 11,523 11,557 11,539 11,537 11,531 11,546 Buses 11,091 11,091 11,091 11,096 11,144 11,144 11,114 11,114 11,204 11,156 11,156 11,156 11,156 Paratransit 213 213 213 213 213 213 213 213 213 213 213 213 213 Operations Planning 406 406 406 406 406 406 406 406 406 406 406 406 406 Revenue Control 583 583 583 583 583 583 583 583 583 583 583 583 583 Non-Departmental 36 36 36 36 36 36 36 36 36 36 36 36 36
Total Operations 23,829 23,829 23,843 23,848 23,867 23,916 23,875 23,875 23,999 23,933 23,931 23,925 23,940 Maintenance:Subways Operations Support/Admin 137 137 139 139 139 139 144 144 144 144 144 144 144 Subways Engineering 390 390 390 390 390 390 389 388 388 388 388 388 388 Subways Car Equipment 4,359 4,378 4,378 4,512 4,504 4,504 4,504 4,504 4,504 4,506 4,413 4,413 4,410 Subways Infrastructure 1,666 1,667 1,677 1,677 1,683 1,683 1,684 1,684 1,684 1,684 1,684 1,684 1,684 Subways Elevators & Escalators 504 504 505 505 505 505 505 505 505 505 505 505 505 Subways Stations 3,857 3,857 3,857 3,857 3,868 3,868 3,870 3,870 3,871 3,859 3,859 3,859 3,859 Subways Track 2,848 2,848 2,848 2,850 2,850 2,850 2,850 2,850 2,850 2,850 2,850 2,850 2,850 Subways Power 629 629 629 629 629 629 629 629 629 629 629 629 629 Subways Signals 1,526 1,526 1,526 1,526 1,526 1,527 1,527 1,527 1,527 1,527 1,527 1,527 1,527 Subways Electronic Maintenance 1,664 1,664 1,664 1,665 1,665 1,665 1,649 1,649 1,649 1,649 1,649 1,649 1,649
Subtotal Subways 17,580 17,600 17,613 17,750 17,759 17,760 17,751 17,750 17,751 17,741 17,648 17,648 17,645 Buses 3,653 3,653 3,654 3,654 3,654 3,657 3,656 3,656 3,659 3,659 3,659 3,660 3,667 Supply Logistics 567 567 567 567 567 567 567 567 567 567 567 567 567 System Safety 99 99 99 99 99 99 99 99 99 99 99 99 99 Non-Departmental (100) (100) (100) (100) (100) (100) (100) (100) (100) (100) (100) (100) (90)
Total Maintenance 21,799 21,819 21,833 21,970 21,979 21,983 21,973 21,972 21,976 21,966 21,873 21,874 21,888 Engineering:Capital Program Management 1,358 1,358 1,358 1,358 1,358 1,358 1,358 1,358 1,358 1,358 1,358 1,358 1,358
Total Engineering/Capital 1,358 1,358 1,358 1,358 1,358 1,358 1,358 1,358 1,358 1,358 1,358 1,358 1,358 Public Safety:Security 673 673 673 673 673 673 673 673 673 673 673 673 673
Total Public Safety 673 673 673 673 673 673 673 673 673 673 673 673 673
Total Positions 49,144 49,154 49,172 49,303 49,331 49,384 49,330 49,329 49,457 49,381 49,286 49,281 49,310
Non-Reimbursable 43,773 43,764 43,764 43,879 43,914 43,967 43,835 43,835 43,995 43,919 43,960 43,960 43,965Reimbursable 5,371 5,390 5,408 5,424 5,417 5,417 5,495 5,494 5,462 5,462 5,326 5,326 5,345
Total Full-Time 48,932 48,942 48,960 49,091 49,119 49,172 49,117 49,116 49,244 49,168 49,073 49,073 49,097Total Full-Time Equivalents 212 212 212 212 212 212 213 213 213 213 213 213 213
MTA NEW YORK CITY TRANSITFebruary Financial Plan - 2017 Adopted Budget
Total Positions by Function and DepartmentNon-Reimbursable/Reimbursable and Full-Time/Full-Time Equivalents
VI-144
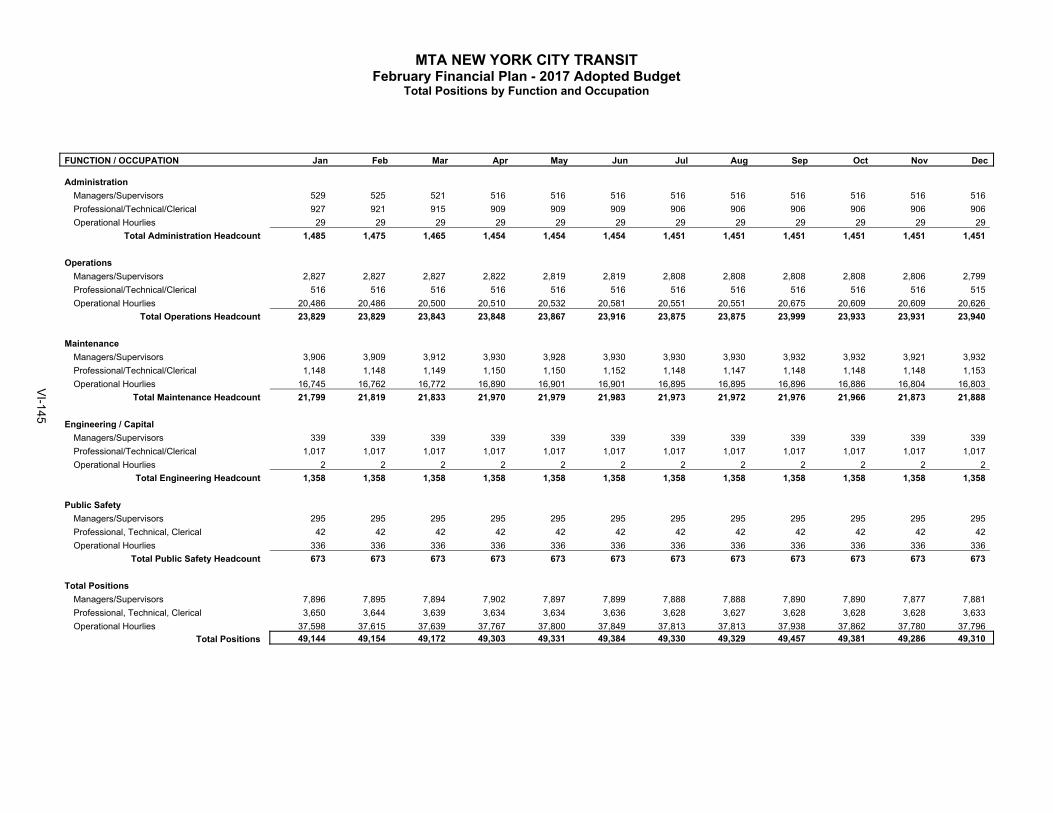
MTA NEW YORK CITY TRANSITFebruary Financial Plan - 2017 Adopted Budget
Total Positions by Function and Occupation
FUNCTION / OCCUPATION Jan Feb Mar Apr May Jun Jul Aug Sep Oct Nov Dec
AdministrationManagers/Supervisors 529 525 521 516 516 516 516 516 516 516 516 516 Professional/Technical/Clerical 927 921 915 909 909 909 906 906 906 906 906 906 Operational Hourlies 29 29 29 29 29 29 29 29 29 29 29 29
Total Administration Headcount 1,485 1,475 1,465 1,454 1,454 1,454 1,451 1,451 1,451 1,451 1,451 1,451
OperationsManagers/Supervisors 2,827 2,827 2,827 2,822 2,819 2,819 2,808 2,808 2,808 2,808 2,806 2,799 Professional/Technical/Clerical 516 516 516 516 516 516 516 516 516 516 516 515 Operational Hourlies 20,486 20,486 20,500 20,510 20,532 20,581 20,551 20,551 20,675 20,609 20,609 20,626
Total Operations Headcount 23,829 23,829 23,843 23,848 23,867 23,916 23,875 23,875 23,999 23,933 23,931 23,940
MaintenanceManagers/Supervisors 3,906 3,909 3,912 3,930 3,928 3,930 3,930 3,930 3,932 3,932 3,921 3,932 Professional/Technical/Clerical 1,148 1,148 1,149 1,150 1,150 1,152 1,148 1,147 1,148 1,148 1,148 1,153 Operational Hourlies 16,745 16,762 16,772 16,890 16,901 16,901 16,895 16,895 16,896 16,886 16,804 16,803
Total Maintenance Headcount 21,799 21,819 21,833 21,970 21,979 21,983 21,973 21,972 21,976 21,966 21,873 21,888
Engineering / CapitalManagers/Supervisors 339 339 339 339 339 339 339 339 339 339 339 339 Professional/Technical/Clerical 1,017 1,017 1,017 1,017 1,017 1,017 1,017 1,017 1,017 1,017 1,017 1,017 Operational Hourlies 2 2 2 2 2 2 2 2 2 2 2 2
Total Engineering Headcount 1,358 1,358 1,358 1,358 1,358 1,358 1,358 1,358 1,358 1,358 1,358 1,358
Public SafetyManagers/Supervisors 295 295 295 295 295 295 295 295 295 295 295 295 Professional, Technical, Clerical 42 42 42 42 42 42 42 42 42 42 42 42 Operational Hourlies 336 336 336 336 336 336 336 336 336 336 336 336
Total Public Safety Headcount 673 673 673 673 673 673 673 673 673 673 673 673
Total PositionsManagers/Supervisors 7,896 7,895 7,894 7,902 7,897 7,899 7,888 7,888 7,890 7,890 7,877 7,881 Professional, Technical, Clerical 3,650 3,644 3,639 3,634 3,634 3,636 3,628 3,627 3,628 3,628 3,628 3,633 Operational Hourlies 37,598 37,615 37,639 37,767 37,800 37,849 37,813 37,813 37,938 37,862 37,780 37,796
Total Positions 49,144 49,154 49,172 49,303 49,331 49,384 49,330 49,329 49,457 49,381 49,286 49,310
VI-145

[THIS PAGE INTENTIONALLY LEFT BLANK]
VI-146

MTA Bus Company
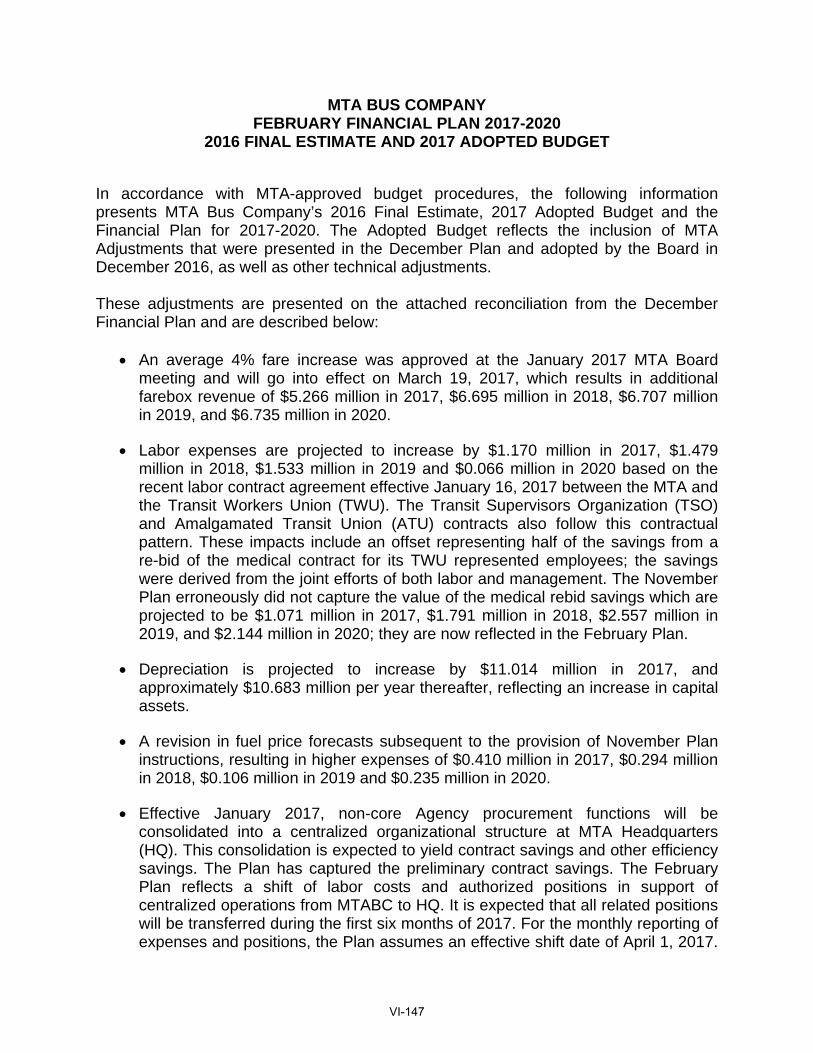
MTA BUS COMPANY FEBRUARY FINANCIAL PLAN 2017-2020
2016 FINAL ESTIMATE AND 2017 ADOPTED BUDGET
In accordance with MTA-approved budget procedures, the following information presents MTA Bus Company’s 2016 Final Estimate, 2017 Adopted Budget and the Financial Plan for 2017-2020. The Adopted Budget reflects the inclusion of MTA Adjustments that were presented in the December Plan and adopted by the Board in December 2016, as well as other technical adjustments. These adjustments are presented on the attached reconciliation from the December Financial Plan and are described below:
An average 4% fare increase was approved at the January 2017 MTA Board meeting and will go into effect on March 19, 2017, which results in additional farebox revenue of $5.266 million in 2017, $6.695 million in 2018, $6.707 million in 2019, and $6.735 million in 2020.
Labor expenses are projected to increase by $1.170 million in 2017, $1.479 million in 2018, $1.533 million in 2019 and $0.066 million in 2020 based on the recent labor contract agreement effective January 16, 2017 between the MTA and the Transit Workers Union (TWU). The Transit Supervisors Organization (TSO) and Amalgamated Transit Union (ATU) contracts also follow this contractual pattern. These impacts include an offset representing half of the savings from a re-bid of the medical contract for its TWU represented employees; the savings were derived from the joint efforts of both labor and management. The November Plan erroneously did not capture the value of the medical rebid savings which are projected to be $1.071 million in 2017, $1.791 million in 2018, $2.557 million in 2019, and $2.144 million in 2020; they are now reflected in the February Plan.
Depreciation is projected to increase by $11.014 million in 2017, and approximately $10.683 million per year thereafter, reflecting an increase in capital assets.
A revision in fuel price forecasts subsequent to the provision of November Plan instructions, resulting in higher expenses of $0.410 million in 2017, $0.294 million in 2018, $0.106 million in 2019 and $0.235 million in 2020.
Effective January 2017, non-core Agency procurement functions will be consolidated into a centralized organizational structure at MTA Headquarters (HQ). This consolidation is expected to yield contract savings and other efficiency savings. The Plan has captured the preliminary contract savings. The February Plan reflects a shift of labor costs and authorized positions in support of centralized operations from MTABC to HQ. It is expected that all related positions will be transferred during the first six months of 2017. For the monthly reporting of expenses and positions, the Plan assumes an effective shift date of April 1, 2017.
VI-147
This is the projected median transfer date, with half of the transfers presumed to take place by then; thereby approximating average expense and headcount levels over the first six months of 2017. While the labor cost of these employees will be assumed by HQ, they are expected to be billed back and expensed within each Agencies’ Professional Services.
The attached also includes schedules detailing the monthly allocation of financials, including overtime, headcount and utilization data based on the 2017 Adopted Budget for the purpose of reporting actual results on a monthly basis to the Board.
VI-148
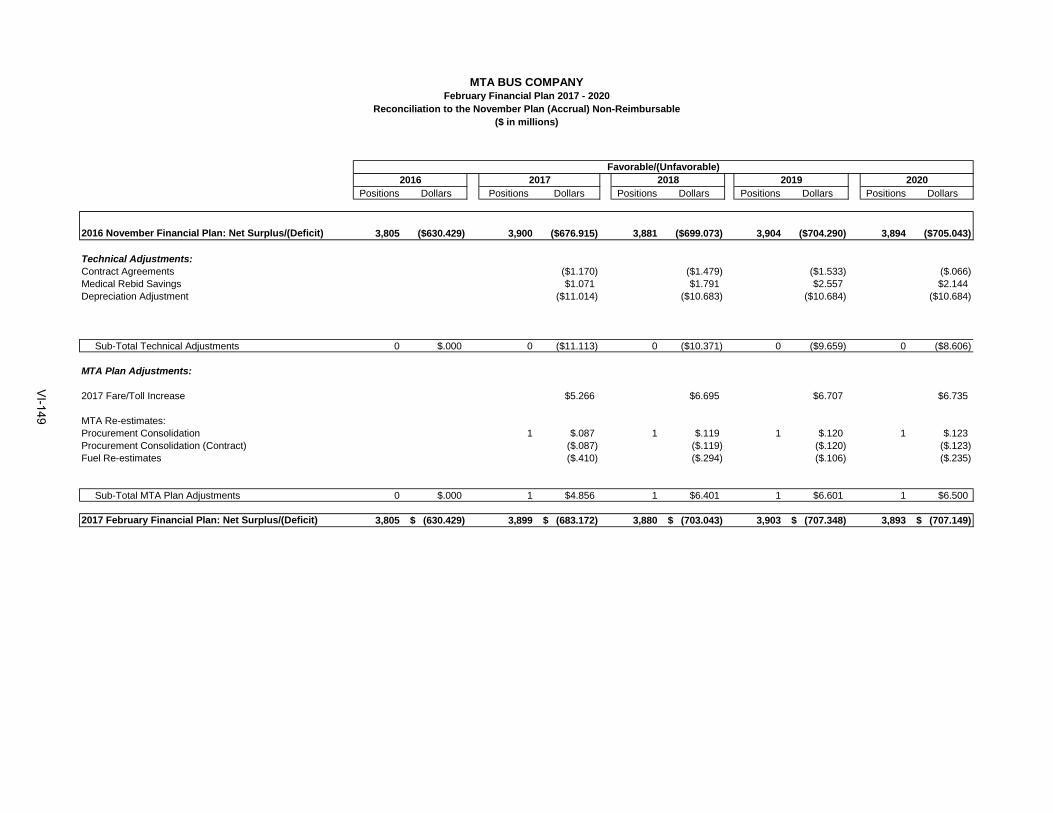
Positions Dollars Positions Dollars Positions Dollars Positions Dollars Positions Dollars
2016 November Financial Plan: Net Surplus/(Deficit) 3,805 ($630.429) 3,900 ($676.915) 3,881 ($699.073) 3,904 ($704.290) 3,894 ($705.043)
Technical Adjustments:Contract Agreements ($1.170) ($1.479) ($1.533) ($.066)Medical Rebid Savings $1.071 $1.791 $2.557 $2.144Depreciation Adjustment ($11.014) ($10.683) ($10.684) ($10.684)
Sub-Total Technical Adjustments 0 $.000 0 ($11.113) 0 ($10.371) 0 ($9.659) 0 ($8.606)
MTA Plan Adjustments:
2017 Fare/Toll Increase $5.266 $6.695 $6.707 $6.735
MTA Re-estimates:Procurement Consolidation 1 $.087 1 $.119 1 $.120 1 $.123Procurement Consolidation (Contract) ($.087) ($.119) ($.120) ($.123)Fuel Re-estimates ($.410) ($.294) ($.106) ($.235)
Sub-Total MTA Plan Adjustments 0 $.000 1 $4.856 1 $6.401 1 $6.601 1 $6.500
2017 February Financial Plan: Net Surplus/(Deficit) 3,805 (630.429)$ 3,899 (683.172)$ 3,880 (703.043)$ 3,903 (707.348)$ 3,893 (707.149)$
MTA BUS COMPANY
2020
February Financial Plan 2017 - 2020Reconciliation to the November Plan (Accrual) Non-Reimbursable
($ in millions)
Favorable/(Unfavorable)2016 2017 2018 2019
VI-149

Positions Dollars Positions Dollars Positions Dollars Positions Dollars Positions Dollars
2016 November Financial Plan: Net Surplus/(Deficit) 40 $0.000 40 $0.000 40 $0.000 40 $0.000 40 $0.000
Technical Adjustments:
Sub-Total Technical Adjustments 0 $.000 0 $.000 0 $.000 0 $.000 0 $.000
MTA Plan Adjustments:
MTA Re-estimates:Procurement Consolidation
2017 Fare/Toll IncreaseCon Edison Rate CaseFuel Re-estimatesOther:
Sub-Total MTA Plan Adjustments 0 $.000 0 $.000 0 $.000 0 $.000 0 $.000
2017 February Financial Plan: Net Surplus/(Deficit) 40 -$ 40 -$ 40 -$ 40 -$ 40 -$
MTA BUS COMPANYFebruary Financial Plan 2017 - 2020
Reconciliation to the November Plan (Accrual) Reimbursable($ in millions)
Favorable/(Unfavorable)2016 2017 2018 2019 2020
VI-150
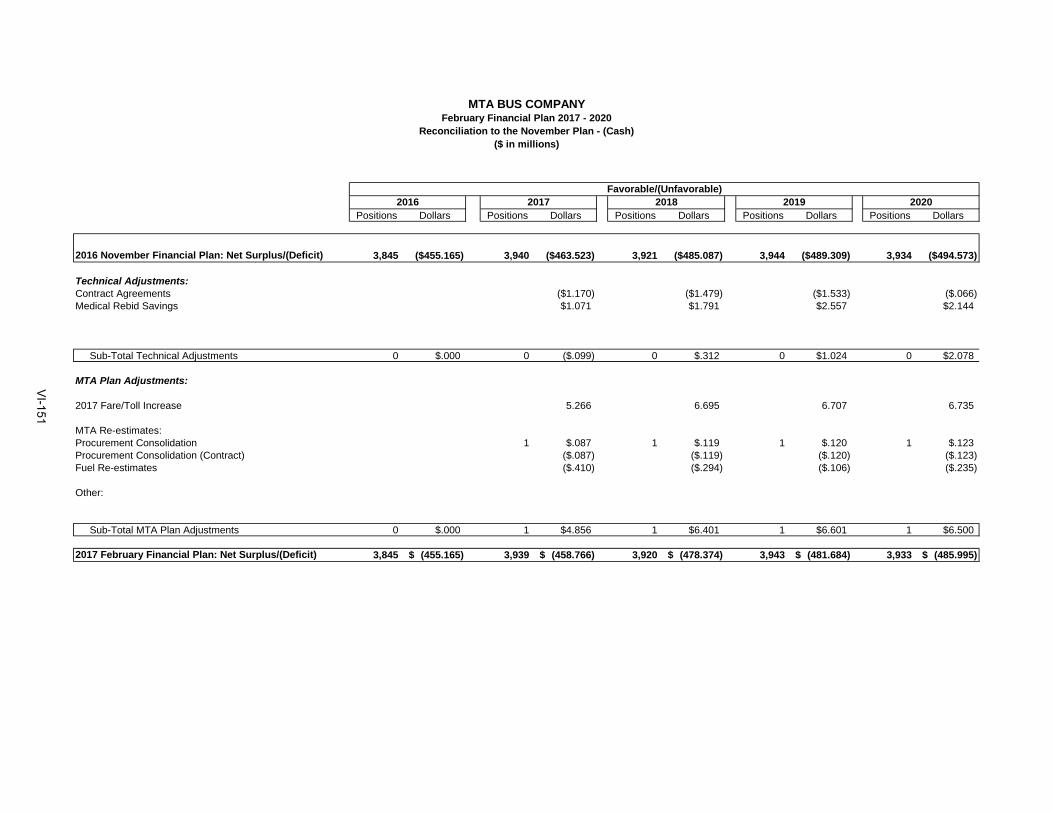
Positions Dollars Positions Dollars Positions Dollars Positions Dollars Positions Dollars
2016 November Financial Plan: Net Surplus/(Deficit) 3,845 ($455.165) 3,940 ($463.523) 3,921 ($485.087) 3,944 ($489.309) 3,934 ($494.573)
Technical Adjustments:Contract Agreements ($1.170) ($1.479) ($1.533) ($.066)Medical Rebid Savings $1.071 $1.791 $2.557 $2.144
Sub-Total Technical Adjustments 0 $.000 0 ($.099) 0 $.312 0 $1.024 0 $2.078
MTA Plan Adjustments:
2017 Fare/Toll Increase 5.266 6.695 6.707 6.735
MTA Re-estimates:Procurement Consolidation 1 $.087 1 $.119 1 $.120 1 $.123Procurement Consolidation (Contract) ($.087) ($.119) ($.120) ($.123)Fuel Re-estimates ($.410) ($.294) ($.106) ($.235)
Other:
Sub-Total MTA Plan Adjustments 0 $.000 1 $4.856 1 $6.401 1 $6.601 1 $6.500
2017 February Financial Plan: Net Surplus/(Deficit) 3,845 (455.165)$ 3,939 (458.766)$ 3,920 (478.374)$ 3,943 (481.684)$ 3,933 (485.995)$
MTA BUS COMPANYFebruary Financial Plan 2017 - 2020
Reconciliation to the November Plan - (Cash)($ in millions)
Favorable/(Unfavorable)2016 2017 2018 2019 2020
VI-151
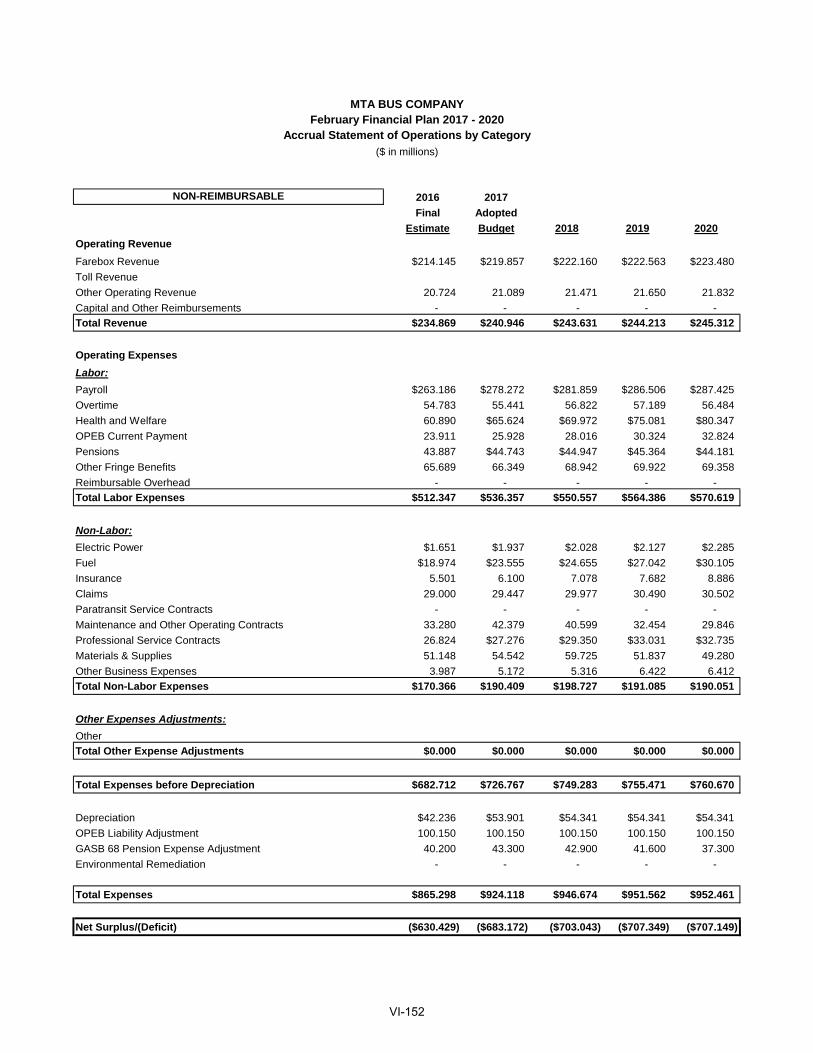
NON-REIMBURSABLE 2016 2017
Final Adopted
Estimate Budget 2018 2019 2020
Operating Revenue
Farebox Revenue $214.145 $219.857 $222.160 $222.563 $223.480
Toll Revenue
Other Operating Revenue 20.724 21.089 21.471 21.650 21.832
Capital and Other Reimbursements - - - - -
Total Revenue $234.869 $240.946 $243.631 $244.213 $245.312
Operating Expenses
Labor:
Payroll $263.186 $278.272 $281.859 $286.506 $287.425
Overtime 54.783 55.441 56.822 57.189 56.484
Health and Welfare 60.890 $65.624 $69.972 $75.081 $80.347
OPEB Current Payment 23.911 25.928 28.016 30.324 32.824
Pensions 43.887 $44.743 $44.947 $45.364 $44.181
Other Fringe Benefits 65.689 66.349 68.942 69.922 69.358
Reimbursable Overhead - - - - -
Total Labor Expenses $512.347 $536.357 $550.557 $564.386 $570.619
Non-Labor:
Electric Power $1.651 $1.937 $2.028 $2.127 $2.285
Fuel $18.974 $23.555 $24.655 $27.042 $30.105
Insurance 5.501 6.100 7.078 7.682 8.886
Claims 29.000 29.447 29.977 30.490 30.502
Paratransit Service Contracts - - - - -
Maintenance and Other Operating Contracts 33.280 42.379 40.599 32.454 29.846
Professional Service Contracts 26.824 $27.276 $29.350 $33.031 $32.735
Materials & Supplies 51.148 54.542 59.725 51.837 49.280
Other Business Expenses 3.987 5.172 5.316 6.422 6.412
Total Non-Labor Expenses $170.366 $190.409 $198.727 $191.085 $190.051
Other Expenses Adjustments:
Other
Total Other Expense Adjustments $0.000 $0.000 $0.000 $0.000 $0.000
Total Expenses before Depreciation $682.712 $726.767 $749.283 $755.471 $760.670
Depreciation $42.236 $53.901 $54.341 $54.341 $54.341
OPEB Liability Adjustment 100.150 100.150 100.150 100.150 100.150
GASB 68 Pension Expense Adjustment 40.200 43.300 42.900 41.600 37.300
Environmental Remediation - - - - -
Total Expenses $865.298 $924.118 $946.674 $951.562 $952.461
Net Surplus/(Deficit) ($630.429) ($683.172) ($703.043) ($707.349) ($707.149)
MTA BUS COMPANYFebruary Financial Plan 2017 - 2020
Accrual Statement of Operations by Category
($ in millions)
VI-152
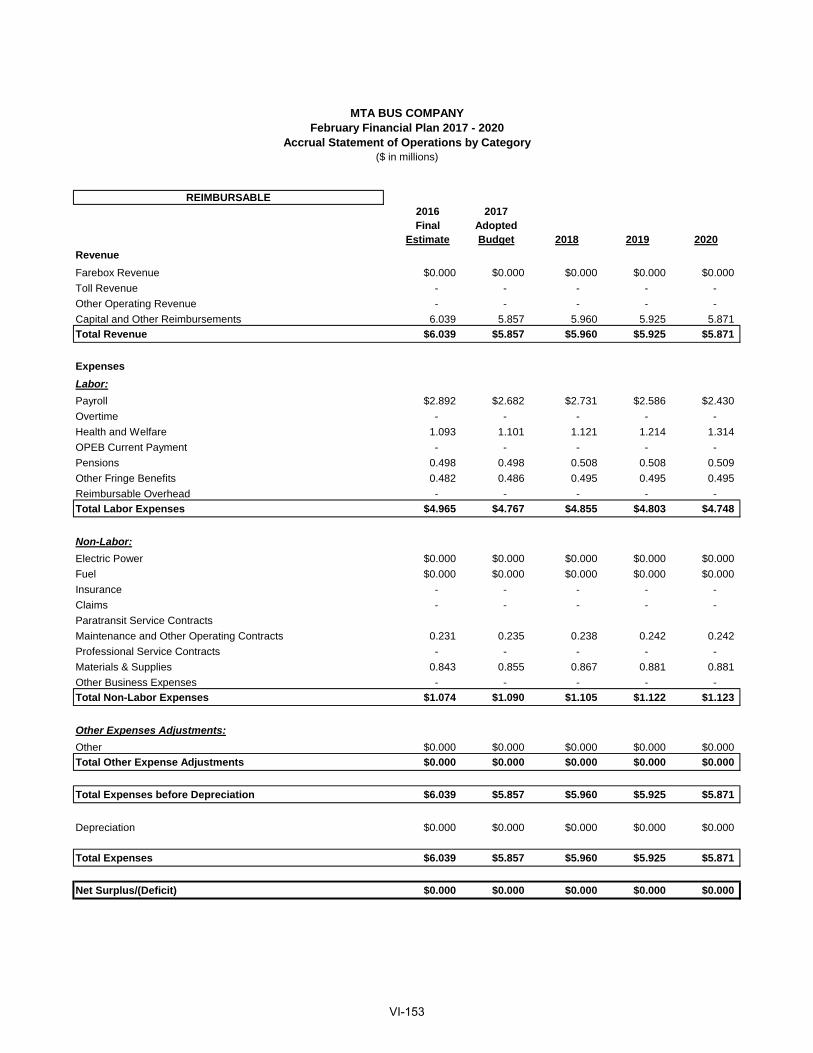
REIMBURSABLE2016 2017Final Adopted
Estimate Budget 2018 2019 2020
Revenue
Farebox Revenue $0.000 $0.000 $0.000 $0.000 $0.000
Toll Revenue - - - - -
Other Operating Revenue - - - - -
Capital and Other Reimbursements 6.039 5.857 5.960 5.925 5.871
Total Revenue $6.039 $5.857 $5.960 $5.925 $5.871
Expenses
Labor:
Payroll $2.892 $2.682 $2.731 $2.586 $2.430
Overtime - - - - -
Health and Welfare 1.093 1.101 1.121 1.214 1.314
OPEB Current Payment - - - - -
Pensions 0.498 0.498 0.508 0.508 0.509
Other Fringe Benefits 0.482 0.486 0.495 0.495 0.495
Reimbursable Overhead - - - - -
Total Labor Expenses $4.965 $4.767 $4.855 $4.803 $4.748
Non-Labor:
Electric Power $0.000 $0.000 $0.000 $0.000 $0.000
Fuel $0.000 $0.000 $0.000 $0.000 $0.000
Insurance - - - - -
Claims - - - - -
Paratransit Service Contracts
Maintenance and Other Operating Contracts 0.231 0.235 0.238 0.242 0.242
Professional Service Contracts - - - - -
Materials & Supplies 0.843 0.855 0.867 0.881 0.881
Other Business Expenses - - - - -
Total Non-Labor Expenses $1.074 $1.090 $1.105 $1.122 $1.123
Other Expenses Adjustments:
Other $0.000 $0.000 $0.000 $0.000 $0.000
Total Other Expense Adjustments $0.000 $0.000 $0.000 $0.000 $0.000
Total Expenses before Depreciation $6.039 $5.857 $5.960 $5.925 $5.871
Depreciation $0.000 $0.000 $0.000 $0.000 $0.000
Total Expenses $6.039 $5.857 $5.960 $5.925 $5.871
Net Surplus/(Deficit) $0.000 $0.000 $0.000 $0.000 $0.000
MTA BUS COMPANYFebruary Financial Plan 2017 - 2020
Accrual Statement of Operations by Category($ in millions)
VI-153
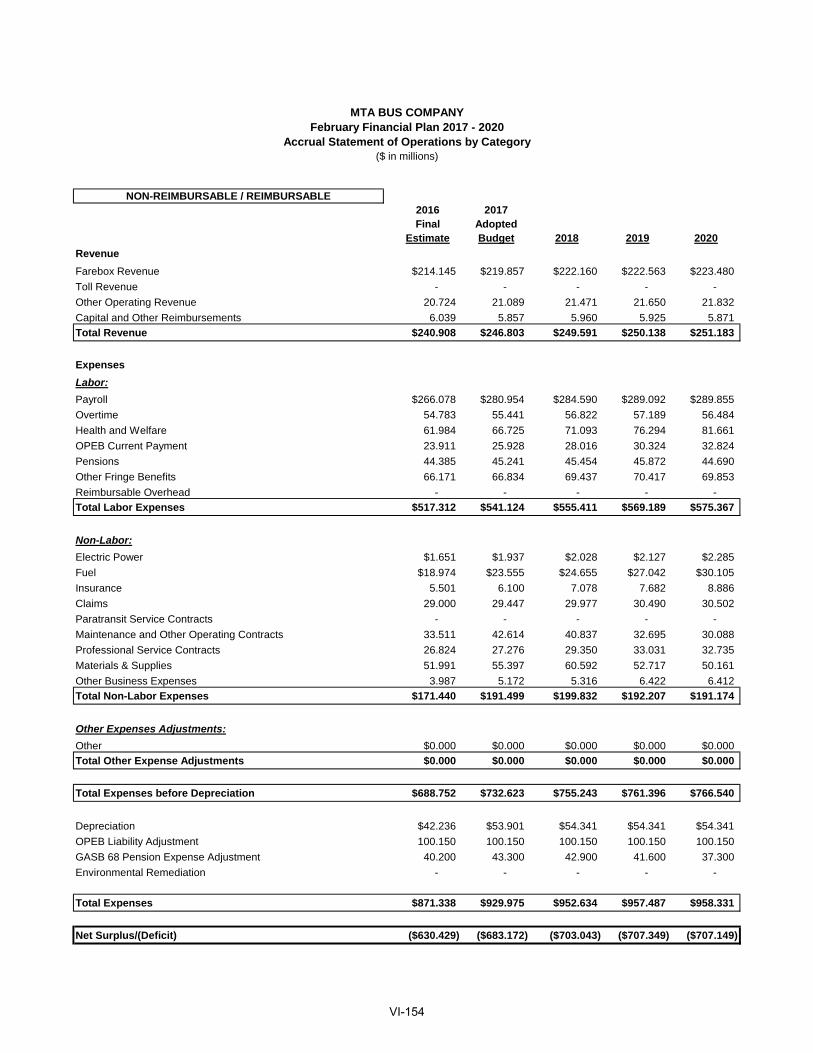
NON-REIMBURSABLE / REIMBURSABLE2016 2017Final Adopted
Estimate Budget 2018 2019 2020
Revenue
Farebox Revenue $214.145 $219.857 $222.160 $222.563 $223.480
Toll Revenue - - - - -
Other Operating Revenue 20.724 21.089 21.471 21.650 21.832
Capital and Other Reimbursements 6.039 5.857 5.960 5.925 5.871
Total Revenue $240.908 $246.803 $249.591 $250.138 $251.183
Expenses
Labor:
Payroll $266.078 $280.954 $284.590 $289.092 $289.855
Overtime 54.783 55.441 56.822 57.189 56.484
Health and Welfare 61.984 66.725 71.093 76.294 81.661
OPEB Current Payment 23.911 25.928 28.016 30.324 32.824
Pensions 44.385 45.241 45.454 45.872 44.690
Other Fringe Benefits 66.171 66.834 69.437 70.417 69.853
Reimbursable Overhead - - - - -
Total Labor Expenses $517.312 $541.124 $555.411 $569.189 $575.367
Non-Labor:
Electric Power $1.651 $1.937 $2.028 $2.127 $2.285
Fuel $18.974 $23.555 $24.655 $27.042 $30.105
Insurance 5.501 6.100 7.078 7.682 8.886
Claims 29.000 29.447 29.977 30.490 30.502
Paratransit Service Contracts - - - - -
Maintenance and Other Operating Contracts 33.511 42.614 40.837 32.695 30.088
Professional Service Contracts 26.824 27.276 29.350 33.031 32.735
Materials & Supplies 51.991 55.397 60.592 52.717 50.161
Other Business Expenses 3.987 5.172 5.316 6.422 6.412
Total Non-Labor Expenses $171.440 $191.499 $199.832 $192.207 $191.174
Other Expenses Adjustments:
Other $0.000 $0.000 $0.000 $0.000 $0.000
Total Other Expense Adjustments $0.000 $0.000 $0.000 $0.000 $0.000
Total Expenses before Depreciation $688.752 $732.623 $755.243 $761.396 $766.540
Depreciation $42.236 $53.901 $54.341 $54.341 $54.341
OPEB Liability Adjustment 100.150 100.150 100.150 100.150 100.150
GASB 68 Pension Expense Adjustment 40.200 43.300 42.900 41.600 37.300
Environmental Remediation - - - - -
Total Expenses $871.338 $929.975 $952.634 $957.487 $958.331
Net Surplus/(Deficit) ($630.429) ($683.172) ($703.043) ($707.349) ($707.149)
MTA BUS COMPANYFebruary Financial Plan 2017 - 2020
Accrual Statement of Operations by Category($ in millions)
VI-154
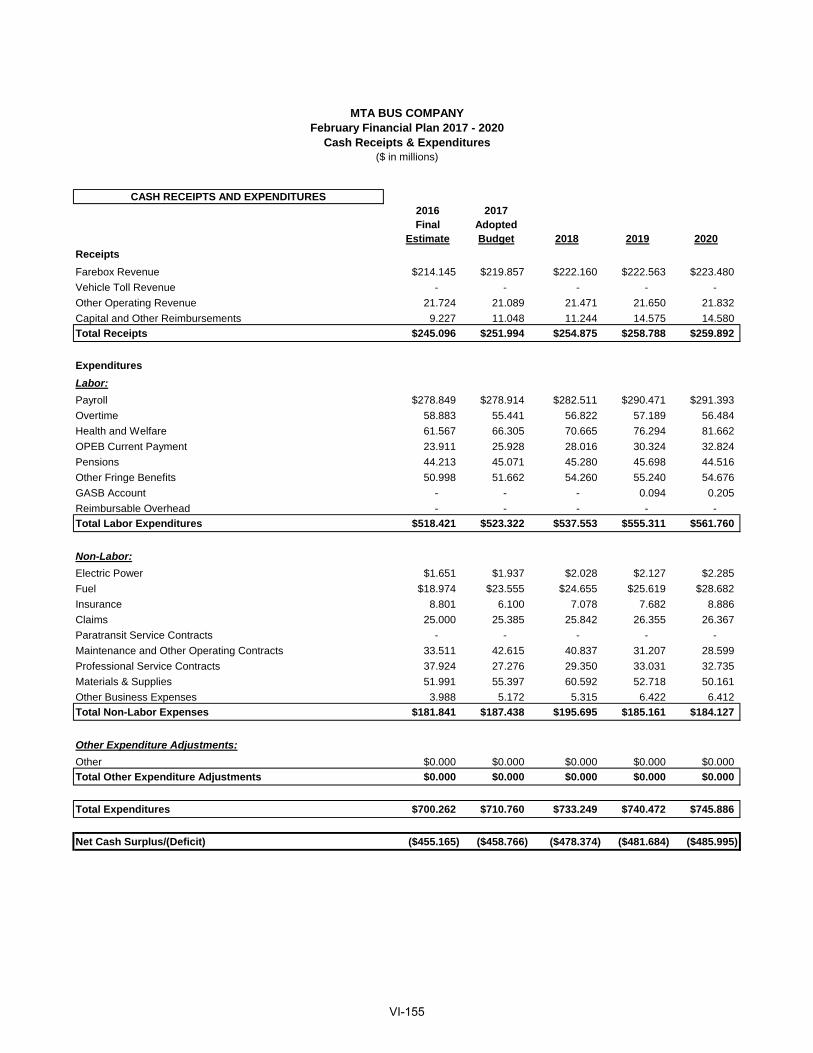
CASH RECEIPTS AND EXPENDITURES2016 2017Final Adopted
Estimate Budget 2018 2019 2020
Receipts
Farebox Revenue $214.145 $219.857 $222.160 $222.563 $223.480
Vehicle Toll Revenue - - - - -
Other Operating Revenue 21.724 21.089 21.471 21.650 21.832
Capital and Other Reimbursements 9.227 11.048 11.244 14.575 14.580
Total Receipts $245.096 $251.994 $254.875 $258.788 $259.892
Expenditures
Labor:
Payroll $278.849 $278.914 $282.511 $290.471 $291.393
Overtime 58.883 55.441 56.822 57.189 56.484
Health and Welfare 61.567 66.305 70.665 76.294 81.662
OPEB Current Payment 23.911 25.928 28.016 30.324 32.824
Pensions 44.213 45.071 45.280 45.698 44.516
Other Fringe Benefits 50.998 51.662 54.260 55.240 54.676
GASB Account - - - 0.094 0.205
Reimbursable Overhead - - - - -
Total Labor Expenditures $518.421 $523.322 $537.553 $555.311 $561.760
Non-Labor:
Electric Power $1.651 $1.937 $2.028 $2.127 $2.285
Fuel $18.974 $23.555 $24.655 $25.619 $28.682
Insurance 8.801 6.100 7.078 7.682 8.886
Claims 25.000 25.385 25.842 26.355 26.367
Paratransit Service Contracts - - - - -
Maintenance and Other Operating Contracts 33.511 42.615 40.837 31.207 28.599
Professional Service Contracts 37.924 27.276 29.350 33.031 32.735
Materials & Supplies 51.991 55.397 60.592 52.718 50.161
Other Business Expenses 3.988 5.172 5.315 6.422 6.412
Total Non-Labor Expenses $181.841 $187.438 $195.695 $185.161 $184.127
Other Expenditure Adjustments:
Other $0.000 $0.000 $0.000 $0.000 $0.000
Total Other Expenditure Adjustments $0.000 $0.000 $0.000 $0.000 $0.000
Total Expenditures $700.262 $710.760 $733.249 $740.472 $745.886
Net Cash Surplus/(Deficit) ($455.165) ($458.766) ($478.374) ($481.684) ($485.995)
MTA BUS COMPANYFebruary Financial Plan 2017 - 2020
Cash Receipts & Expenditures($ in millions)
VI-155
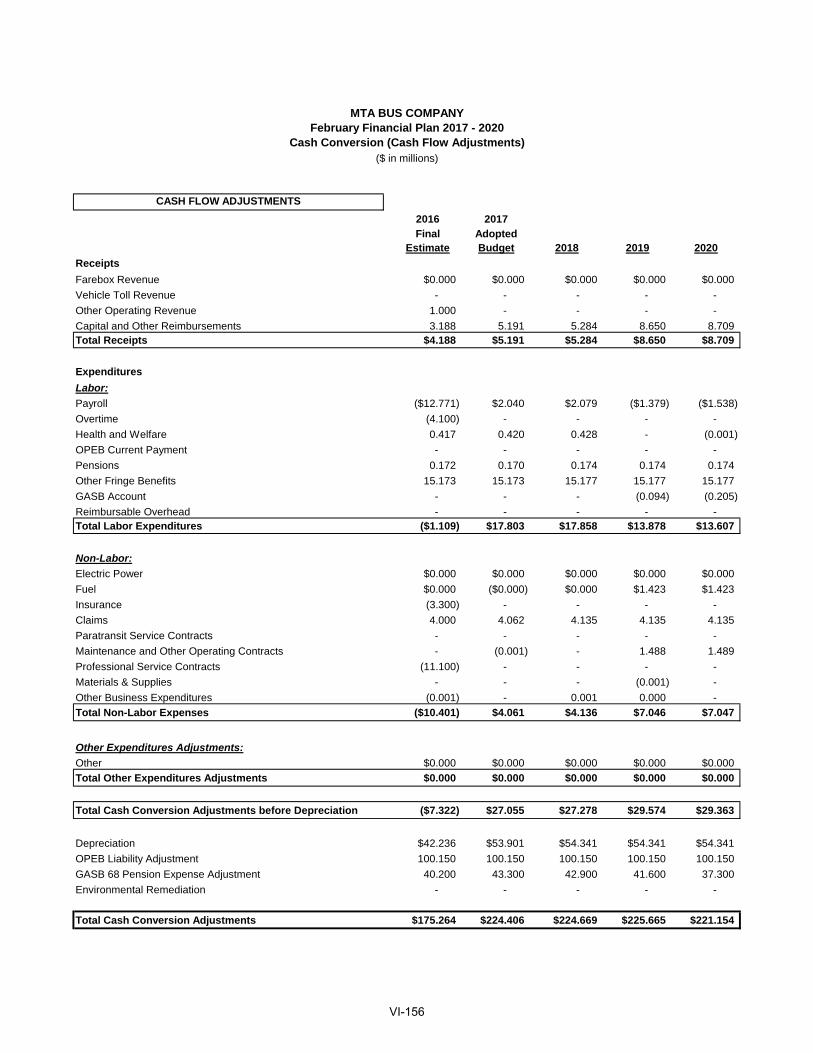
CASH FLOW ADJUSTMENTS
2016 2017Final Adopted
Estimate Budget 2018 2019 2020
Receipts
Farebox Revenue $0.000 $0.000 $0.000 $0.000 $0.000
Vehicle Toll Revenue - - - - -
Other Operating Revenue 1.000 - - - -
Capital and Other Reimbursements 3.188 5.191 5.284 8.650 8.709 Total Receipts $4.188 $5.191 $5.284 $8.650 $8.709
Expenditures
Labor:
Payroll ($12.771) $2.040 $2.079 ($1.379) ($1.538)
Overtime (4.100) - - - -
Health and Welfare 0.417 0.420 0.428 - (0.001)
OPEB Current Payment - - - - -
Pensions 0.172 0.170 0.174 0.174 0.174
Other Fringe Benefits 15.173 15.173 15.177 15.177 15.177
GASB Account - - - (0.094) (0.205)
Reimbursable Overhead - - - - - Total Labor Expenditures ($1.109) $17.803 $17.858 $13.878 $13.607
Non-Labor:
Electric Power $0.000 $0.000 $0.000 $0.000 $0.000
Fuel $0.000 ($0.000) $0.000 $1.423 $1.423
Insurance (3.300) - - - -
Claims 4.000 4.062 4.135 4.135 4.135
Paratransit Service Contracts - - - - -
Maintenance and Other Operating Contracts - (0.001) - 1.488 1.489
Professional Service Contracts (11.100) - - - -
Materials & Supplies - - - (0.001) -
Other Business Expenditures (0.001) - 0.001 0.000 -
Total Non-Labor Expenses ($10.401) $4.061 $4.136 $7.046 $7.047
Other Expenditures Adjustments:
Other $0.000 $0.000 $0.000 $0.000 $0.000
Total Other Expenditures Adjustments $0.000 $0.000 $0.000 $0.000 $0.000
Total Cash Conversion Adjustments before Depreciation ($7.322) $27.055 $27.278 $29.574 $29.363
Depreciation $42.236 $53.901 $54.341 $54.341 $54.341
OPEB Liability Adjustment 100.150 100.150 100.150 100.150 100.150
GASB 68 Pension Expense Adjustment 40.200 43.300 42.900 41.600 37.300
Environmental Remediation - - - - -
Total Cash Conversion Adjustments $175.264 $224.406 $224.669 $225.665 $221.154
MTA BUS COMPANYFebruary Financial Plan 2017 - 2020
Cash Conversion (Cash Flow Adjustments)($ in millions)
VI-156
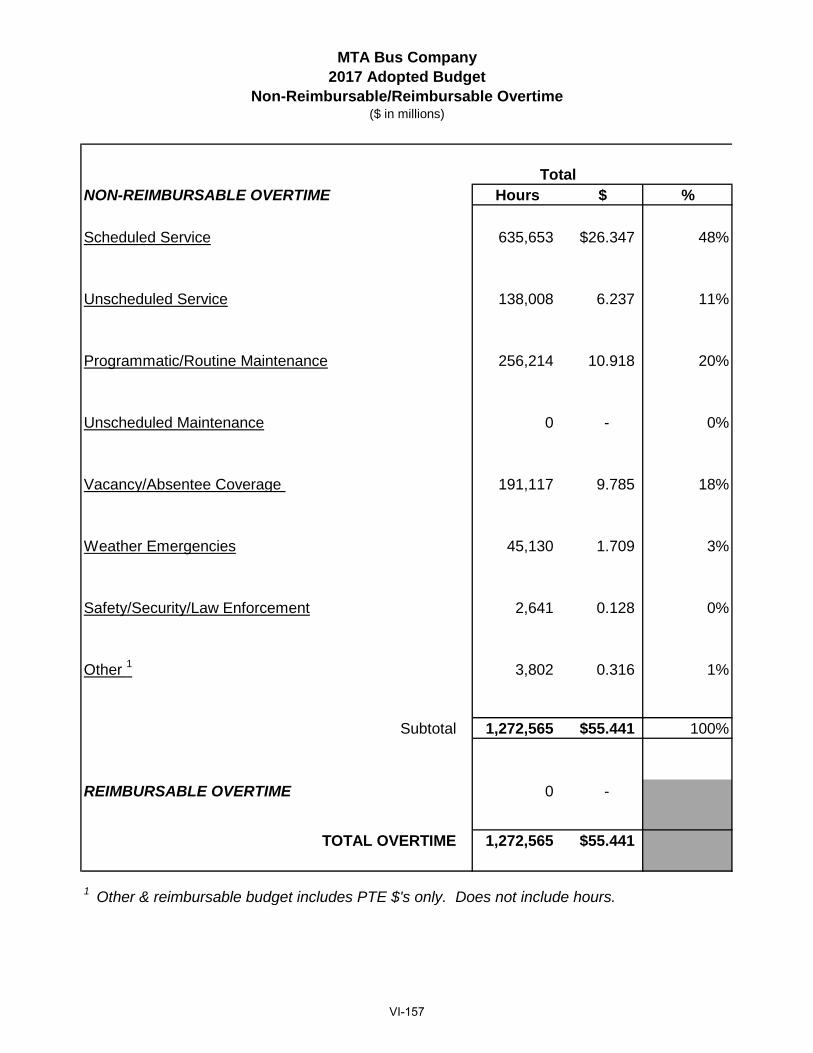
MTA Bus Company2017 Adopted Budget
Non-Reimbursable/Reimbursable Overtime ($ in millions)
NON-REIMBURSABLE OVERTIME Hours $ %
Scheduled Service 635,653 $26.347 48%
Unscheduled Service 138,008 6.237 11%
Programmatic/Routine Maintenance 256,214 10.918 20%
Unscheduled Maintenance 0 - 0%
Vacancy/Absentee Coverage 191,117 9.785 18%
Weather Emergencies 45,130 1.709 3%
Safety/Security/Law Enforcement 2,641 0.128 0%
Other 1 3,802 0.316 1%
Subtotal 1,272,565 $55.441 100%
REIMBURSABLE OVERTIME 0 -
TOTAL OVERTIME 1,272,565 $55.441
1 Other & reimbursable budget includes PTE $'s only. Does not include hours.
Total
VI-157

2016 2017Final Adopted
Estimate Budget 2018 2019 2020
RIDERSHIP
Fixed Route 126.111 125.606 125.875 126.086 126.558
Baseline Total Ridership 126.111 125.606 125.875 126.086 126.558
FAREBOX REVENUE
Fixed Route $214.145 $219.857 $222.160 $222.563 $223.480
Baseline Total Revenue $214.145 $219.857 $222.160 $222.563 $223.480
February Financial Plan 2017 - 2020MTA BUS COMPANY
Ridership/ (Utilization)(in millions)
VI-158
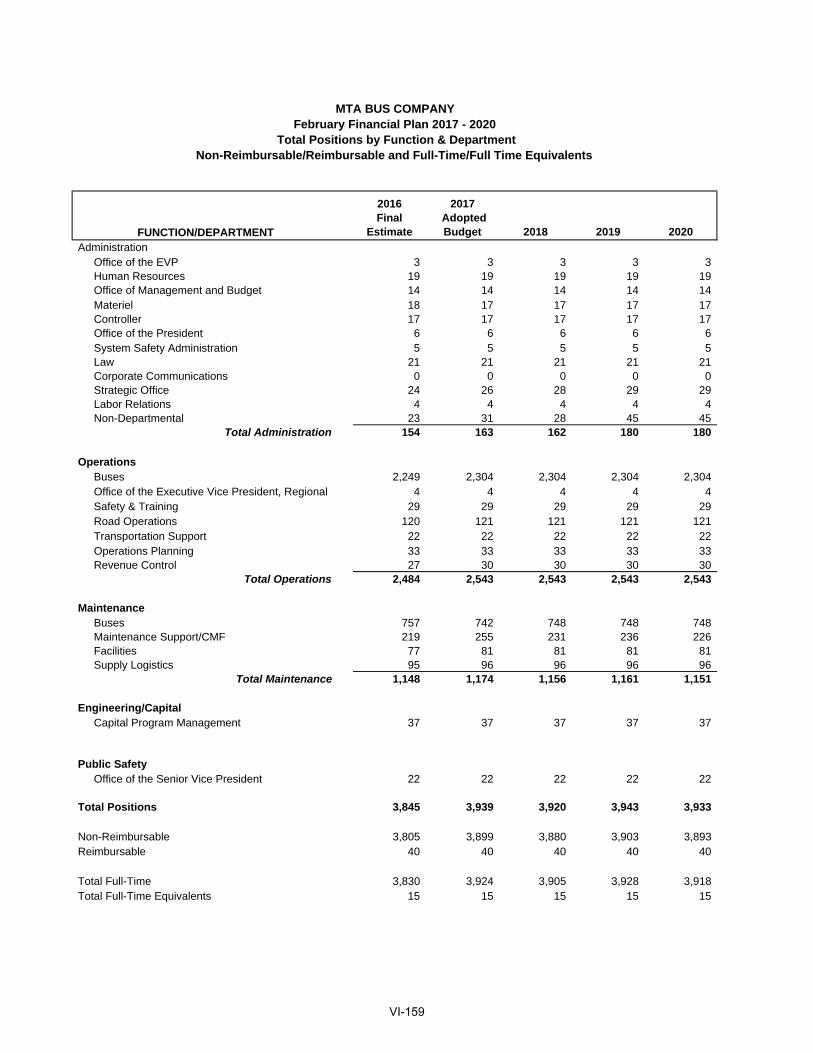
2016Final
Estimate
2017 Adopted Budget 2018 2019 2020
AdministrationOffice of the EVP 3 3 3 3 3Human Resources 19 19 19 19 19Office of Management and Budget 14 14 14 14 14Materiel 18 17 17 17 17Controller 17 17 17 17 17Office of the President 6 6 6 6 6System Safety Administration 5 5 5 5 5Law 21 21 21 21 21Corporate Communications 0 0 0 0 0Strategic Office 24 26 28 29 29Labor Relations 4 4 4 4 4Non-Departmental 23 31 28 45 45
Total Administration 154 163 162 180 180
OperationsBuses 2,249 2,304 2,304 2,304 2,304Office of the Executive Vice President, Regional 4 4 4 4 4Safety & Training 29 29 29 29 29Road Operations 120 121 121 121 121Transportation Support 22 22 22 22 22Operations Planning 33 33 33 33 33Revenue Control 27 30 30 30 30
Total Operations 2,484 2,543 2,543 2,543 2,543
MaintenanceBuses 757 742 748 748 748Maintenance Support/CMF 219 255 231 236 226Facilities 77 81 81 81 81Supply Logistics 95 96 96 96 96
Total Maintenance 1,148 1,174 1,156 1,161 1,151
Engineering/CapitalCapital Program Management 37 37 37 37 37
Public SafetyOffice of the Senior Vice President 22 22 22 22 22
Total Positions 3,845 3,939 3,920 3,943 3,933
Non-Reimbursable 3,805 3,899 3,880 3,903 3,893 Reimbursable 40 40 40 40 40
Total Full-Time 3,830 3,924 3,905 3,928 3,918 Total Full-Time Equivalents 15 15 15 15 15
FUNCTION/DEPARTMENT
MTA BUS COMPANYFebruary Financial Plan 2017 - 2020
Total Positions by Function & DepartmentNon-Reimbursable/Reimbursable and Full-Time/Full Time Equivalents
VI-159
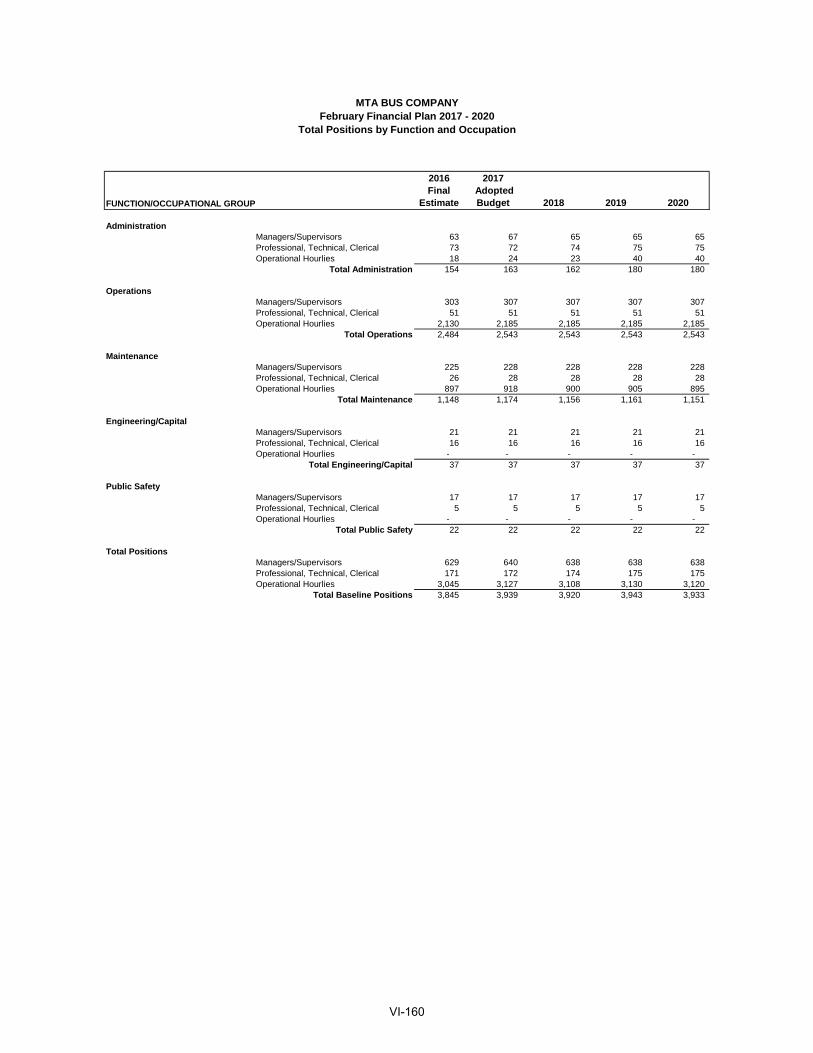
FUNCTION/OCCUPATIONAL GROUP
2016Final
Estimate
2017 Adopted Budget 2018 2019 2020
Administration Managers/Supervisors 63 67 65 65 65 Professional, Technical, Clerical 73 72 74 75 75 Operational Hourlies 18 24 23 40 40
Total Administration 154 163 162 180 180
Operations Managers/Supervisors 303 307 307 307 307 Professional, Technical, Clerical 51 51 51 51 51 Operational Hourlies 2,130 2,185 2,185 2,185 2,185
Total Operations 2,484 2,543 2,543 2,543 2,543
Maintenance Managers/Supervisors 225 228 228 228 228 Professional, Technical, Clerical 26 28 28 28 28 Operational Hourlies 897 918 900 905 895
Total Maintenance 1,148 1,174 1,156 1,161 1,151
Engineering/Capital Managers/Supervisors 21 21 21 21 21 Professional, Technical, Clerical 16 16 16 16 16 Operational Hourlies - - - - -
Total Engineering/Capital 37 37 37 37 37
Public Safety Managers/Supervisors 17 17 17 17 17 Professional, Technical, Clerical 5 5 5 5 5 Operational Hourlies - - - - -
Total Public Safety 22 22 22 22 22
Total Positions Managers/Supervisors 629 640 638 638 638 Professional, Technical, Clerical 171 172 174 175 175 Operational Hourlies 3,045 3,127 3,108 3,130 3,120
Total Baseline Positions 3,845 3,939 3,920 3,943 3,933
MTA BUS COMPANYFebruary Financial Plan 2017 - 2020
Total Positions by Function and Occupation
VI-160
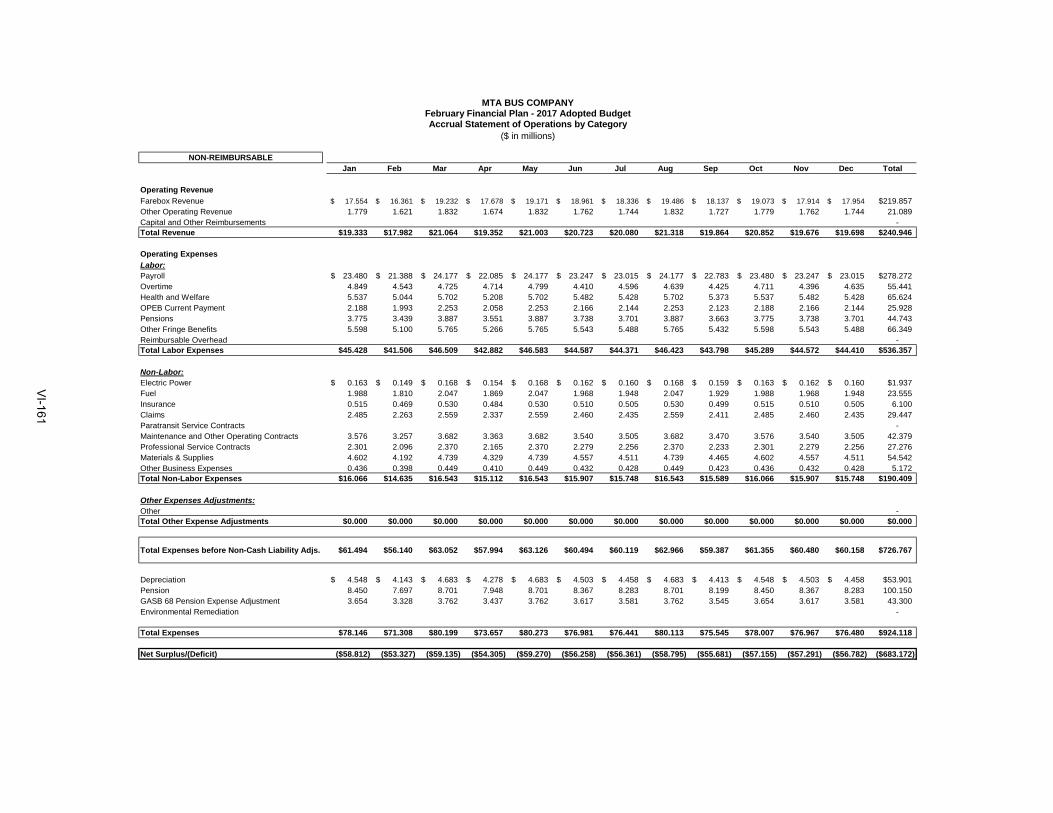
NON-REIMBURSABLEJan Feb Mar Apr May Jun Jul Aug Sep Oct Nov Dec Total
Operating Revenue
Farebox Revenue 17.554$ 16.361$ 19.232$ 17.678$ 19.171$ 18.961$ 18.336$ 19.486$ 18.137$ 19.073$ 17.914$ 17.954$ $219.857Other Operating Revenue 1.779 1.621 1.832 1.674 1.832 1.762 1.744 1.832 1.727 1.779 1.762 1.744 21.089 Capital and Other Reimbursements - Total Revenue $19.333 $17.982 $21.064 $19.352 $21.003 $20.723 $20.080 $21.318 $19.864 $20.852 $19.676 $19.698 $240.946
Operating Expenses
Labor:Payroll 23.480$ 21.388$ 24.177$ 22.085$ 24.177$ 23.247$ 23.015$ 24.177$ 22.783$ 23.480$ 23.247$ 23.015$ $278.272Overtime 4.849 4.543 4.725 4.714 4.799 4.410 4.596 4.639 4.425 4.711 4.396 4.635 55.441 Health and Welfare 5.537 5.044 5.702 5.208 5.702 5.482 5.428 5.702 5.373 5.537 5.482 5.428 65.624 OPEB Current Payment 2.188 1.993 2.253 2.058 2.253 2.166 2.144 2.253 2.123 2.188 2.166 2.144 25.928 Pensions 3.775 3.439 3.887 3.551 3.887 3.738 3.701 3.887 3.663 3.775 3.738 3.701 44.743 Other Fringe Benefits 5.598 5.100 5.765 5.266 5.765 5.543 5.488 5.765 5.432 5.598 5.543 5.488 66.349 Reimbursable Overhead - Total Labor Expenses $45.428 $41.506 $46.509 $42.882 $46.583 $44.587 $44.371 $46.423 $43.798 $45.289 $44.572 $44.410 $536.357
Non-Labor:Electric Power 0.163$ 0.149$ 0.168$ 0.154$ 0.168$ 0.162$ 0.160$ 0.168$ 0.159$ 0.163$ 0.162$ 0.160$ $1.937Fuel 1.988 1.810 2.047 1.869 2.047 1.968 1.948 2.047 1.929 1.988 1.968 1.948 23.555 Insurance 0.515 0.469 0.530 0.484 0.530 0.510 0.505 0.530 0.499 0.515 0.510 0.505 6.100 Claims 2.485 2.263 2.559 2.337 2.559 2.460 2.435 2.559 2.411 2.485 2.460 2.435 29.447 Paratransit Service Contracts - Maintenance and Other Operating Contracts 3.576 3.257 3.682 3.363 3.682 3.540 3.505 3.682 3.470 3.576 3.540 3.505 42.379 Professional Service Contracts 2.301 2.096 2.370 2.165 2.370 2.279 2.256 2.370 2.233 2.301 2.279 2.256 27.276 Materials & Supplies 4.602 4.192 4.739 4.329 4.739 4.557 4.511 4.739 4.465 4.602 4.557 4.511 54.542 Other Business Expenses 0.436 0.398 0.449 0.410 0.449 0.432 0.428 0.449 0.423 0.436 0.432 0.428 5.172 Total Non-Labor Expenses $16.066 $14.635 $16.543 $15.112 $16.543 $15.907 $15.748 $16.543 $15.589 $16.066 $15.907 $15.748 $190.409
Other Expenses Adjustments:Other - Total Other Expense Adjustments $0.000 $0.000 $0.000 $0.000 $0.000 $0.000 $0.000 $0.000 $0.000 $0.000 $0.000 $0.000 $0.000
Total Expenses before Non-Cash Liability Adjs. $61.494 $56.140 $63.052 $57.994 $63.126 $60.494 $60.119 $62.966 $59.387 $61.355 $60.480 $60.158 $726.767
Depreciation 4.548$ 4.143$ 4.683$ 4.278$ 4.683$ 4.503$ 4.458$ 4.683$ 4.413$ 4.548$ 4.503$ 4.458$ $53.901Pension 8.450 7.697 8.701 7.948 8.701 8.367 8.283 8.701 8.199 8.450 8.367 8.283 100.150 GASB 68 Pension Expense Adjustment 3.654 3.328 3.762 3.437 3.762 3.617 3.581 3.762 3.545 3.654 3.617 3.581 43.300 Environmental Remediation -
Total Expenses $78.146 $71.308 $80.199 $73.657 $80.273 $76.981 $76.441 $80.113 $75.545 $78.007 $76.967 $76.480 $924.118
Net Surplus/(Deficit) ($58.812) ($53.327) ($59.135) ($54.305) ($59.270) ($56.258) ($56.361) ($58.795) ($55.681) ($57.155) ($57.291) ($56.782) ($683.172)
MTA BUS COMPANYFebruary Financial Plan - 2017 Adopted BudgetAccrual Statement of Operations by Category
($ in millions)
VI-161
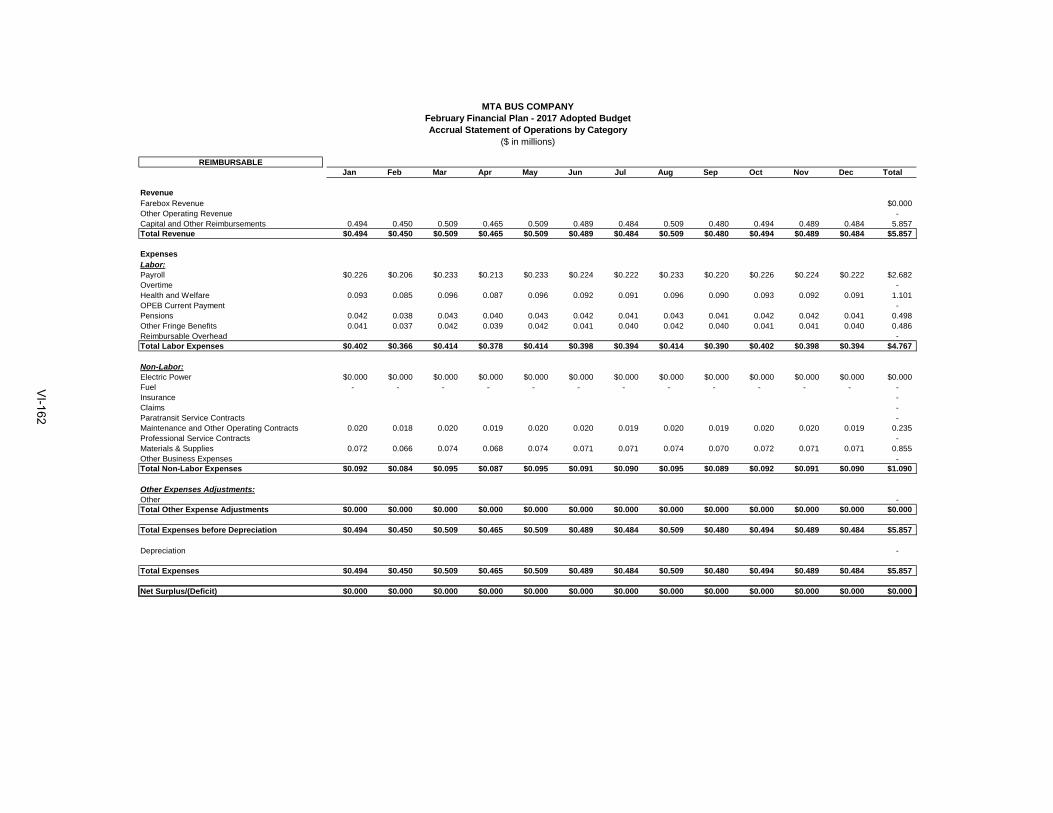
REIMBURSABLEJan Feb Mar Apr May Jun Jul Aug Sep Oct Nov Dec Total
RevenueFarebox Revenue $0.000Other Operating Revenue - Capital and Other Reimbursements 0.494 0.450 0.509 0.465 0.509 0.489 0.484 0.509 0.480 0.494 0.489 0.484 5.857 Total Revenue $0.494 $0.450 $0.509 $0.465 $0.509 $0.489 $0.484 $0.509 $0.480 $0.494 $0.489 $0.484 $5.857
ExpensesLabor:Payroll $0.226 $0.206 $0.233 $0.213 $0.233 $0.224 $0.222 $0.233 $0.220 $0.226 $0.224 $0.222 $2.682Overtime - Health and Welfare 0.093 0.085 0.096 0.087 0.096 0.092 0.091 0.096 0.090 0.093 0.092 0.091 1.101 OPEB Current Payment - Pensions 0.042 0.038 0.043 0.040 0.043 0.042 0.041 0.043 0.041 0.042 0.042 0.041 0.498 Other Fringe Benefits 0.041 0.037 0.042 0.039 0.042 0.041 0.040 0.042 0.040 0.041 0.041 0.040 0.486 Reimbursable Overhead - Total Labor Expenses $0.402 $0.366 $0.414 $0.378 $0.414 $0.398 $0.394 $0.414 $0.390 $0.402 $0.398 $0.394 $4.767
Non-Labor:Electric Power $0.000 $0.000 $0.000 $0.000 $0.000 $0.000 $0.000 $0.000 $0.000 $0.000 $0.000 $0.000 $0.000Fuel - - - - - - - - - - - - - Insurance - Claims - Paratransit Service Contracts - Maintenance and Other Operating Contracts 0.020 0.018 0.020 0.019 0.020 0.020 0.019 0.020 0.019 0.020 0.020 0.019 0.235 Professional Service Contracts - Materials & Supplies 0.072 0.066 0.074 0.068 0.074 0.071 0.071 0.074 0.070 0.072 0.071 0.071 0.855 Other Business Expenses - Total Non-Labor Expenses $0.092 $0.084 $0.095 $0.087 $0.095 $0.091 $0.090 $0.095 $0.089 $0.092 $0.091 $0.090 $1.090
Other Expenses Adjustments:Other - Total Other Expense Adjustments $0.000 $0.000 $0.000 $0.000 $0.000 $0.000 $0.000 $0.000 $0.000 $0.000 $0.000 $0.000 $0.000
Total Expenses before Depreciation $0.494 $0.450 $0.509 $0.465 $0.509 $0.489 $0.484 $0.509 $0.480 $0.494 $0.489 $0.484 $5.857
Depreciation -
Total Expenses $0.494 $0.450 $0.509 $0.465 $0.509 $0.489 $0.484 $0.509 $0.480 $0.494 $0.489 $0.484 $5.857
Net Surplus/(Deficit) $0.000 $0.000 $0.000 $0.000 $0.000 $0.000 $0.000 $0.000 $0.000 $0.000 $0.000 $0.000 $0.000
MTA BUS COMPANYFebruary Financial Plan - 2017 Adopted BudgetAccrual Statement of Operations by Category
($ in millions)
VI-162

NON-REIMBURSABLE / REIMBURSABLEJan Feb Mar Apr May Jun Jul Aug Sep Oct Nov Dec Total
RevenueFarebox Revenue $17.554 $16.361 $19.232 $17.678 $19.171 $18.961 $18.336 $19.486 $18.137 $19.073 $17.914 $17.954 $219.857Other Operating Revenue 1.779 1.621 1.832 1.674 1.832 1.762 1.744 1.832 1.727 1.779 1.762 1.744 21.089 Capital and Other Reimbursements 0.494 0.450 0.509 0.465 0.509 0.489 0.484 0.509 0.480 0.494 0.489 0.484 5.857 Total Revenue $19.828 $18.432 $21.573 $19.817 $21.512 $21.212 $20.565 $21.827 $20.343 $21.347 $20.165 $20.183 $246.803
ExpensesLabor:Payroll $23.706 $21.594 $24.410 $22.298 $24.410 $23.472 $23.237 $24.410 $23.002 $23.706 $23.472 $23.237 $280.954Overtime 4.849 4.543 4.725 4.714 4.799 4.410 4.596 4.639 4.425 4.711 4.396 4.635 55.441 Health and Welfare 5.630 5.128 5.797 5.296 5.797 5.574 5.519 5.797 5.463 5.630 5.574 5.519 66.725 OPEB Current Payment 2.188 1.993 2.253 2.058 2.253 2.166 2.144 2.253 2.123 2.188 2.166 2.144 25.928 Pensions 3.817 3.477 3.931 3.591 3.931 3.780 3.742 3.931 3.704 3.817 3.780 3.742 45.241 Other Fringe Benefits 5.639 5.137 5.807 5.304 5.807 5.584 5.528 5.807 5.472 5.639 5.584 5.528 66.835 Reimbursable Overhead - - - - - - - - - - - - - Total Labor Expenses $45.830 $41.872 $46.923 $43.260 $46.997 $44.985 $44.765 $46.837 $44.189 $45.691 $44.971 $44.804 $541.124
Non-Labor:Electric Power $0.163 $0.149 $0.168 $0.154 $0.168 $0.162 $0.160 $0.168 $0.159 $0.163 $0.162 $0.160 $1.937Fuel $1.988 $1.810 2.047 1.869 2.047 1.968 1.948 2.047 1.929 1.988 1.968 1.948 23.555 Insurance 0.515 0.469 0.530 0.484 0.530 0.510 0.505 0.530 0.499 0.515 0.510 0.505 6.100 Claims 2.485 2.263 2.559 2.337 2.559 2.460 2.435 2.559 2.411 2.485 2.460 2.435 29.447 Paratransit Service Contracts - - - - - - - - - - - - - Maintenance and Other Operating Contracts 3.596 3.275 3.703 3.382 3.703 3.560 3.525 3.703 3.489 3.596 3.560 3.525 42.614 Professional Service Contracts 2.301 2.096 2.370 2.165 2.370 2.279 2.256 2.370 2.233 2.301 2.279 2.256 27.276 Materials & Supplies 4.674 4.258 4.813 4.397 4.813 4.628 4.582 4.813 4.535 4.674 4.628 4.582 55.397 Other Business Expenses 0.436 0.398 0.449 0.410 0.449 0.432 0.428 0.449 0.423 0.436 0.432 0.428 5.172 Total Non-Labor Expenses $16.158 $14.718 $16.638 $15.198 $16.638 $15.998 $15.838 $16.638 $15.678 $16.158 $15.998 $15.838 $191.499
Other Expenses Adjustments:Other - - - - - - - - - - - - - Total Other Expense Adjustments $0.000 $0.000 $0.000 $0.000 $0.000 $0.000 $0.000 $0.000 $0.000 $0.000 $0.000 $0.000 $0.000
Total Expenses before Non-Cash Liability Adjs. $61.988 $56.590 $63.561 $58.459 $63.635 $60.983 $60.604 $63.475 $59.867 $61.850 $60.969 $60.643 $732.624
Depreciation $4.548 $4.143 $4.683 $4.278 $4.683 $4.503 $4.458 $4.683 $4.413 $4.548 $4.503 $4.458 $53.901OPEB Obligation 8.450 7.697 8.701 7.948 8.701 8.367 8.283 8.701 8.199 8.450 8.367 8.283 100.150 GASB 68 Pension Expense Adjustment 3.654 3.328 3.762 3.437 3.762 3.617 3.581 3.762 3.545 3.654 3.617 3.581 43.300 Environmental Remediation - - - - - - - - - - - - -
Total Expenses $78.640 $71.759 $80.708 $74.121 $80.782 $77.470 $76.926 $80.622 $76.024 $78.502 $77.456 $76.965 $929.975
Net Surplus/(Deficit) ($58.812) ($53.327) ($59.135) ($54.305) ($59.270) ($56.258) ($56.361) ($58.795) ($55.681) ($57.155) ($57.291) ($56.782) ($683.172)
MTA BUS COMPANYFebruary Financial Plan - 2017 Adopted BudgetAccrual Statement of Operations by Category
($ in millions)
VI-163
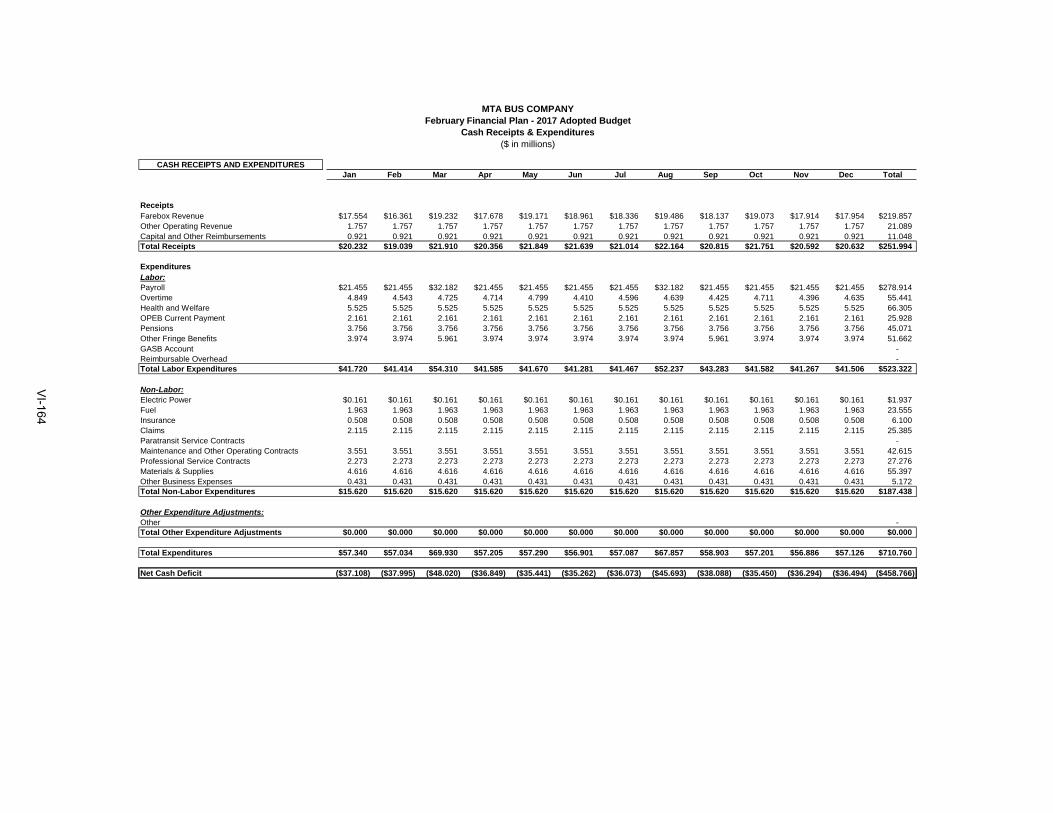
CASH RECEIPTS AND EXPENDITURESJan Feb Mar Apr May Jun Jul Aug Sep Oct Nov Dec Total
ReceiptsFarebox Revenue $17.554 $16.361 $19.232 $17.678 $19.171 $18.961 $18.336 $19.486 $18.137 $19.073 $17.914 $17.954 $219.857Other Operating Revenue 1.757 1.757 1.757 1.757 1.757 1.757 1.757 1.757 1.757 1.757 1.757 1.757 21.089 Capital and Other Reimbursements 0.921 0.921 0.921 0.921 0.921 0.921 0.921 0.921 0.921 0.921 0.921 0.921 11.048 Total Receipts $20.232 $19.039 $21.910 $20.356 $21.849 $21.639 $21.014 $22.164 $20.815 $21.751 $20.592 $20.632 $251.994
ExpendituresLabor:Payroll $21.455 $21.455 $32.182 $21.455 $21.455 $21.455 $21.455 $32.182 $21.455 $21.455 $21.455 $21.455 $278.914Overtime 4.849 4.543 4.725 4.714 4.799 4.410 4.596 4.639 4.425 4.711 4.396 4.635 55.441 Health and Welfare 5.525 5.525 5.525 5.525 5.525 5.525 5.525 5.525 5.525 5.525 5.525 5.525 66.305 OPEB Current Payment 2.161 2.161 2.161 2.161 2.161 2.161 2.161 2.161 2.161 2.161 2.161 2.161 25.928 Pensions 3.756 3.756 3.756 3.756 3.756 3.756 3.756 3.756 3.756 3.756 3.756 3.756 45.071 Other Fringe Benefits 3.974 3.974 5.961 3.974 3.974 3.974 3.974 3.974 5.961 3.974 3.974 3.974 51.662 GASB Account - Reimbursable Overhead - Total Labor Expenditures $41.720 $41.414 $54.310 $41.585 $41.670 $41.281 $41.467 $52.237 $43.283 $41.582 $41.267 $41.506 $523.322
Non-Labor:Electric Power $0.161 $0.161 $0.161 $0.161 $0.161 $0.161 $0.161 $0.161 $0.161 $0.161 $0.161 $0.161 $1.937Fuel 1.963 1.963 1.963 1.963 1.963 1.963 1.963 1.963 1.963 1.963 1.963 1.963 23.555 Insurance 0.508 0.508 0.508 0.508 0.508 0.508 0.508 0.508 0.508 0.508 0.508 0.508 6.100 Claims 2.115 2.115 2.115 2.115 2.115 2.115 2.115 2.115 2.115 2.115 2.115 2.115 25.385 Paratransit Service Contracts - Maintenance and Other Operating Contracts 3.551 3.551 3.551 3.551 3.551 3.551 3.551 3.551 3.551 3.551 3.551 3.551 42.615 Professional Service Contracts 2.273 2.273 2.273 2.273 2.273 2.273 2.273 2.273 2.273 2.273 2.273 2.273 27.276 Materials & Supplies 4.616 4.616 4.616 4.616 4.616 4.616 4.616 4.616 4.616 4.616 4.616 4.616 55.397 Other Business Expenses 0.431 0.431 0.431 0.431 0.431 0.431 0.431 0.431 0.431 0.431 0.431 0.431 5.172 Total Non-Labor Expenditures $15.620 $15.620 $15.620 $15.620 $15.620 $15.620 $15.620 $15.620 $15.620 $15.620 $15.620 $15.620 $187.438
Other Expenditure Adjustments:Other - Total Other Expenditure Adjustments $0.000 $0.000 $0.000 $0.000 $0.000 $0.000 $0.000 $0.000 $0.000 $0.000 $0.000 $0.000 $0.000
Total Expenditures $57.340 $57.034 $69.930 $57.205 $57.290 $56.901 $57.087 $67.857 $58.903 $57.201 $56.886 $57.126 $710.760
Net Cash Deficit ($37.108) ($37.995) ($48.020) ($36.849) ($35.441) ($35.262) ($36.073) ($45.693) ($38.088) ($35.450) ($36.294) ($36.494) ($458.766)
MTA BUS COMPANYFebruary Financial Plan - 2017 Adopted Budget
Cash Receipts & Expenditures($ in millions)
VI-164
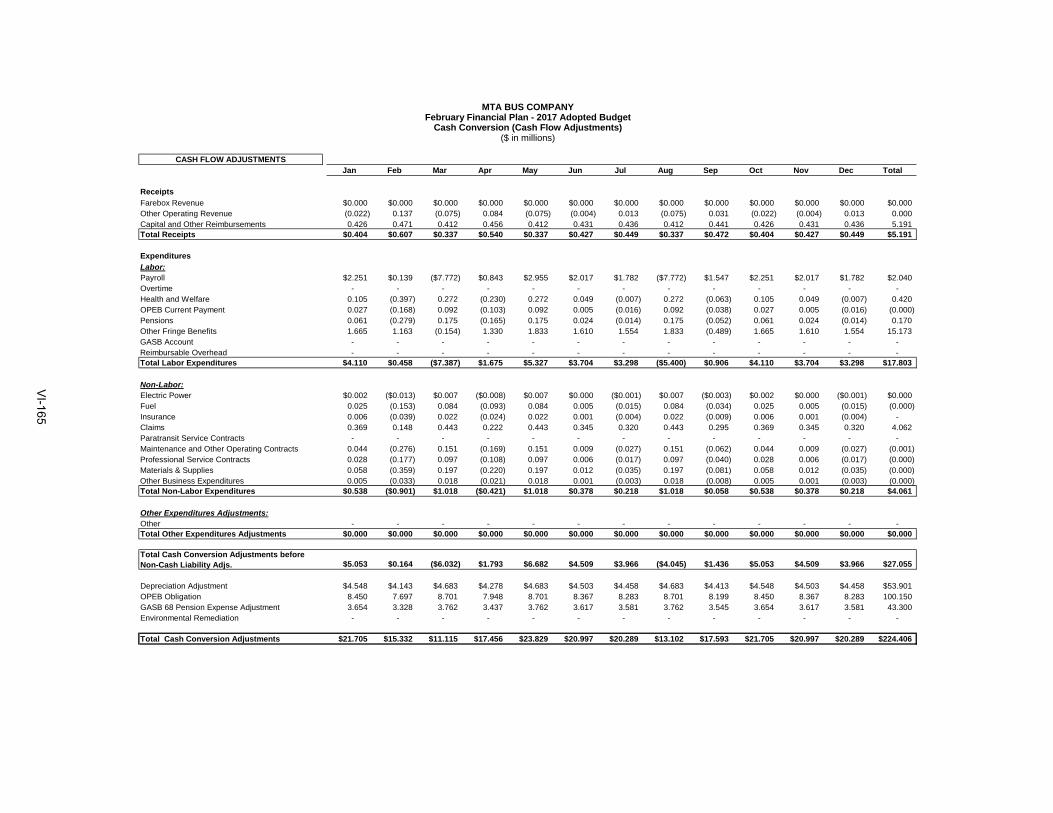
CASH FLOW ADJUSTMENTSJan Feb Mar Apr May Jun Jul Aug Sep Oct Nov Dec Total
Receipts
Farebox Revenue $0.000 $0.000 $0.000 $0.000 $0.000 $0.000 $0.000 $0.000 $0.000 $0.000 $0.000 $0.000 $0.000Other Operating Revenue (0.022) 0.137 (0.075) 0.084 (0.075) (0.004) 0.013 (0.075) 0.031 (0.022) (0.004) 0.013 0.000 Capital and Other Reimbursements 0.426 0.471 0.412 0.456 0.412 0.431 0.436 0.412 0.441 0.426 0.431 0.436 5.191 Total Receipts $0.404 $0.607 $0.337 $0.540 $0.337 $0.427 $0.449 $0.337 $0.472 $0.404 $0.427 $0.449 $5.191
Expenditures
Labor:Payroll $2.251 $0.139 ($7.772) $0.843 $2.955 $2.017 $1.782 ($7.772) $1.547 $2.251 $2.017 $1.782 $2.040Overtime - - - - - - - - - - - - - Health and Welfare 0.105 (0.397) 0.272 (0.230) 0.272 0.049 (0.007) 0.272 (0.063) 0.105 0.049 (0.007) 0.420 OPEB Current Payment 0.027 (0.168) 0.092 (0.103) 0.092 0.005 (0.016) 0.092 (0.038) 0.027 0.005 (0.016) (0.000) Pensions 0.061 (0.279) 0.175 (0.165) 0.175 0.024 (0.014) 0.175 (0.052) 0.061 0.024 (0.014) 0.170 Other Fringe Benefits 1.665 1.163 (0.154) 1.330 1.833 1.610 1.554 1.833 (0.489) 1.665 1.610 1.554 15.173 GASB Account - - - - - - - - - - - - - Reimbursable Overhead - - - - - - - - - - - - - Total Labor Expenditures $4.110 $0.458 ($7.387) $1.675 $5.327 $3.704 $3.298 ($5.400) $0.906 $4.110 $3.704 $3.298 $17.803
Non-Labor:Electric Power $0.002 ($0.013) $0.007 ($0.008) $0.007 $0.000 ($0.001) $0.007 ($0.003) $0.002 $0.000 ($0.001) $0.000Fuel 0.025 (0.153) 0.084 (0.093) 0.084 0.005 (0.015) 0.084 (0.034) 0.025 0.005 (0.015) (0.000) Insurance 0.006 (0.039) 0.022 (0.024) 0.022 0.001 (0.004) 0.022 (0.009) 0.006 0.001 (0.004) - Claims 0.369 0.148 0.443 0.222 0.443 0.345 0.320 0.443 0.295 0.369 0.345 0.320 4.062 Paratransit Service Contracts - - - - - - - - - - - - - Maintenance and Other Operating Contracts 0.044 (0.276) 0.151 (0.169) 0.151 0.009 (0.027) 0.151 (0.062) 0.044 0.009 (0.027) (0.001) Professional Service Contracts 0.028 (0.177) 0.097 (0.108) 0.097 0.006 (0.017) 0.097 (0.040) 0.028 0.006 (0.017) (0.000) Materials & Supplies 0.058 (0.359) 0.197 (0.220) 0.197 0.012 (0.035) 0.197 (0.081) 0.058 0.012 (0.035) (0.000) Other Business Expenditures 0.005 (0.033) 0.018 (0.021) 0.018 0.001 (0.003) 0.018 (0.008) 0.005 0.001 (0.003) (0.000) Total Non-Labor Expenditures $0.538 ($0.901) $1.018 ($0.421) $1.018 $0.378 $0.218 $1.018 $0.058 $0.538 $0.378 $0.218 $4.061
Other Expenditures Adjustments:Other - - - - - - - - - - - - - Total Other Expenditures Adjustments $0.000 $0.000 $0.000 $0.000 $0.000 $0.000 $0.000 $0.000 $0.000 $0.000 $0.000 $0.000 $0.000
Total Cash Conversion Adjustments before Non-Cash Liability Adjs. $5.053 $0.164 ($6.032) $1.793 $6.682 $4.509 $3.966 ($4.045) $1.436 $5.053 $4.509 $3.966 $27.055
Depreciation Adjustment $4.548 $4.143 $4.683 $4.278 $4.683 $4.503 $4.458 $4.683 $4.413 $4.548 $4.503 $4.458 $53.901OPEB Obligation 8.450 7.697 8.701 7.948 8.701 8.367 8.283 8.701 8.199 8.450 8.367 8.283 100.150 GASB 68 Pension Expense Adjustment 3.654 3.328 3.762 3.437 3.762 3.617 3.581 3.762 3.545 3.654 3.617 3.581 43.300 Environmental Remediation - - - - - - - - - - - - -
Total Cash Conversion Adjustments $21.705 $15.332 $11.115 $17.456 $23.829 $20.997 $20.289 $13.102 $17.593 $21.705 $20.997 $20.289 $224.406
Cash Conversion (Cash Flow Adjustments)($ in millions)
MTA BUS COMPANYFebruary Financial Plan - 2017 Adopted Budget
VI-165

MTA Bus CompanyFebruary Financial Plan - 2017 Adopted Budget
Non-Reimbursable/Reimbursable Overtime ($ in millions)
Jan Jun July Aug Sep Oct Nov Dec$ $ $ $ $ $ $ $ $ $ $ $ $
NON-REIMBURSABLE OVERTIME
Scheduled Service 2.227$ 2.006$ 2.220$ 2.203$ 2.236$ 2.136$ 2.256$ 2.256$ 2.140$ 2.296$ 2.145$ 2.227$ 26.347$
Unscheduled Service 0.565$ 0.478$ 0.516$ 0.513$ 0.522$ 0.495$ 0.516$ 0.521$ 0.497$ 0.529$ 0.547$ 0.539$ 6.237$
Programmatic/Routine Maintenance 1.080$ 1.043$ 0.901$ 1.055$ 1.067$ 0.788$ 0.784$ 0.799$ 0.836$ 0.910$ 0.837$ 0.819$ 10.918$
Unscheduled Maintenance -$ -$ -$ -$ -$ -$ -$ -$ -$ -$ -$ -$ -$
Vacancy/Absentee Coverage 0.726$ 0.774$ 0.833$ 0.801$ 0.829$ 0.853$ 0.894$ 0.917$ 0.812$ 0.826$ 0.727$ 0.793$ 9.785$
Weather Emergencies 0.219$ 0.207$ 0.217$ 0.106$ 0.107$ 0.102$ 0.108$ 0.108$ 0.103$ 0.110$ 0.104$ 0.218$ 1.709$
Safety/Security/Law Enforcement 0.006$ 0.011$ 0.011$ 0.011$ 0.011$ 0.011$ 0.011$ 0.011$ 0.011$ 0.012$ 0.011$ 0.011$ 0.128$
Other 0.027$ 0.024$ 0.027$ 0.026$ 0.027$ 0.026$ 0.027$ 0.027$ 0.026$ 0.028$ 0.026$ 0.027$ 0.316$
Sub-Total $4.849 $4.543 $4.725 $4.714 $4.799 $4.410 $4.596 $4.639 $4.425 $4.711 $4.396 $4.635 $55.441
REIMBURSABLE OVERTIME -$ -$ -$ -$ -$ -$ -$ -$ -$ -$ -$ -$ -$
TOTAL NR & R OVERTIME $4.849 $4.543 $4.725 $4.714 $4.799 $4.410 $4.596 $4.639 $4.425 $4.711 $4.396 $4.635 $55.441
Feb Mar Apr May Total
VI-166
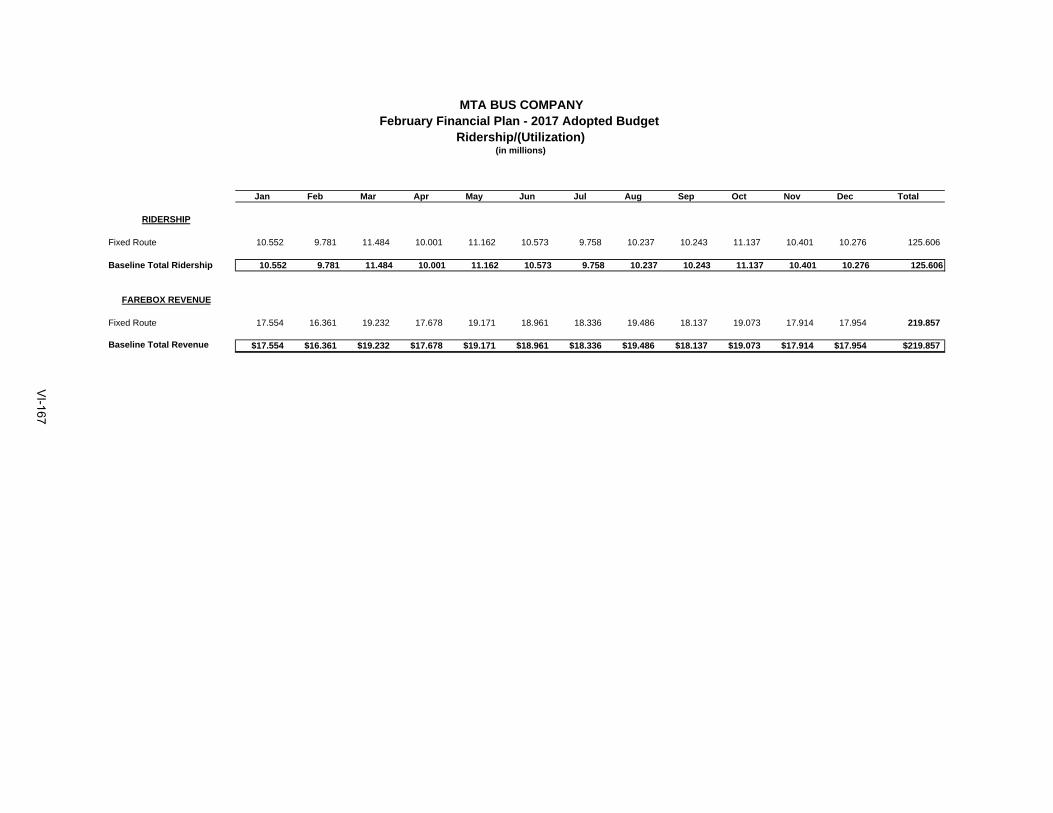
MTA BUS COMPANY
Ridership/(Utilization)
Jan Feb Mar Apr May Jun Jul Aug Sep Oct Nov Dec Total
Fixed Route 10.552 9.781 11.484 10.001 11.162 10.573 9.758 10.237 10.243 11.137 10.401 10.276 125.606
Baseline Total Ridership 10.552 9.781 11.484 10.001 11.162 10.573 9.758 10.237 10.243 11.137 10.401 10.276 125.606
Fixed Route 17.554 16.361 19.232 17.678 19.171 18.961 18.336 19.486 18.137 19.073 17.914 17.954 219.857
Baseline Total Revenue $17.554 $16.361 $19.232 $17.678 $19.171 $18.961 $18.336 $19.486 $18.137 $19.073 $17.914 $17.954 $219.857
February Financial Plan - 2017 Adopted Budget
(in millions)
RIDERSHIP
FAREBOX REVENUE
VI-167
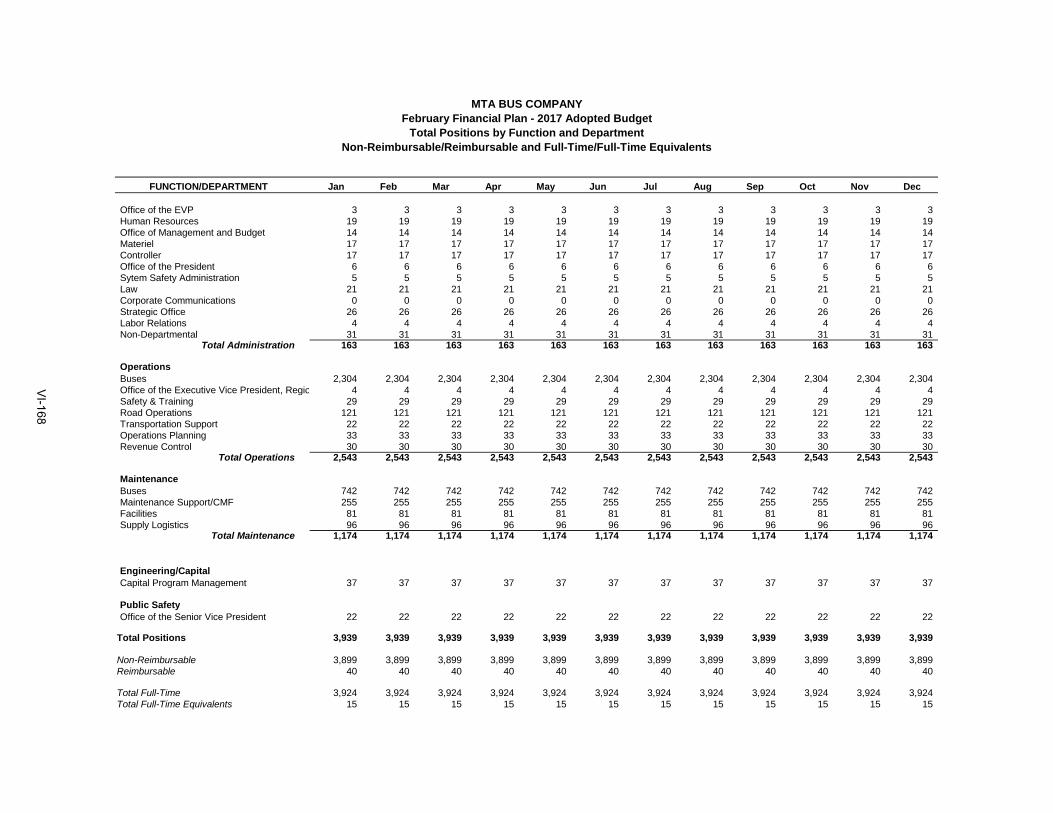
Jan Feb Mar Apr May Jun Jul Aug Sep Oct Nov Dec
Office of the EVP 3 3 3 3 3 3 3 3 3 3 3 3Human Resources 19 19 19 19 19 19 19 19 19 19 19 19Office of Management and Budget 14 14 14 14 14 14 14 14 14 14 14 14Materiel 17 17 17 17 17 17 17 17 17 17 17 17Controller 17 17 17 17 17 17 17 17 17 17 17 17Office of the President 6 6 6 6 6 6 6 6 6 6 6 6Sytem Safety Administration 5 5 5 5 5 5 5 5 5 5 5 5Law 21 21 21 21 21 21 21 21 21 21 21 21Corporate Communications 0 0 0 0 0 0 0 0 0 0 0 0Strategic Office 26 26 26 26 26 26 26 26 26 26 26 26Labor Relations 4 4 4 4 4 4 4 4 4 4 4 4Non-Departmental 31 31 31 31 31 31 31 31 31 31 31 31
Total Administration 163 163 163 163 163 163 163 163 163 163 163 163
OperationsBuses 2,304 2,304 2,304 2,304 2,304 2,304 2,304 2,304 2,304 2,304 2,304 2,304Office of the Executive Vice President, Regio 4 4 4 4 4 4 4 4 4 4 4 4Safety & Training 29 29 29 29 29 29 29 29 29 29 29 29Road Operations 121 121 121 121 121 121 121 121 121 121 121 121Transportation Support 22 22 22 22 22 22 22 22 22 22 22 22Operations Planning 33 33 33 33 33 33 33 33 33 33 33 33Revenue Control 30 30 30 30 30 30 30 30 30 30 30 30
Total Operations 2,543 2,543 2,543 2,543 2,543 2,543 2,543 2,543 2,543 2,543 2,543 2,543
MaintenanceBuses 742 742 742 742 742 742 742 742 742 742 742 742Maintenance Support/CMF 255 255 255 255 255 255 255 255 255 255 255 255Facilities 81 81 81 81 81 81 81 81 81 81 81 81Supply Logistics 96 96 96 96 96 96 96 96 96 96 96 96
Total Maintenance 1,174 1,174 1,174 1,174 1,174 1,174 1,174 1,174 1,174 1,174 1,174 1,174
Engineering/CapitalCapital Program Management 37 37 37 37 37 37 37 37 37 37 37 37
Public SafetyOffice of the Senior Vice President 22 22 22 22 22 22 22 22 22 22 22 22
Total Positions 3,939 3,939 3,939 3,939 3,939 3,939 3,939 3,939 3,939 3,939 3,939 3,939
Non-Reimbursable 3,899 3,899 3,899 3,899 3,899 3,899 3,899 3,899 3,899 3,899 3,899 3,899Reimbursable 40 40 40 40 40 40 40 40 40 40 40 40
Total Full-Time 3,924 3,924 3,924 3,924 3,924 3,924 3,924 3,924 3,924 3,924 3,924 3,924Total Full-Time Equivalents 15 15 15 15 15 15 15 15 15 15 15 15
MTA BUS COMPANYFebruary Financial Plan - 2017 Adopted Budget
Total Positions by Function and DepartmentNon-Reimbursable/Reimbursable and Full-Time/Full-Time Equivalents
FUNCTION/DEPARTMENT
VI-168
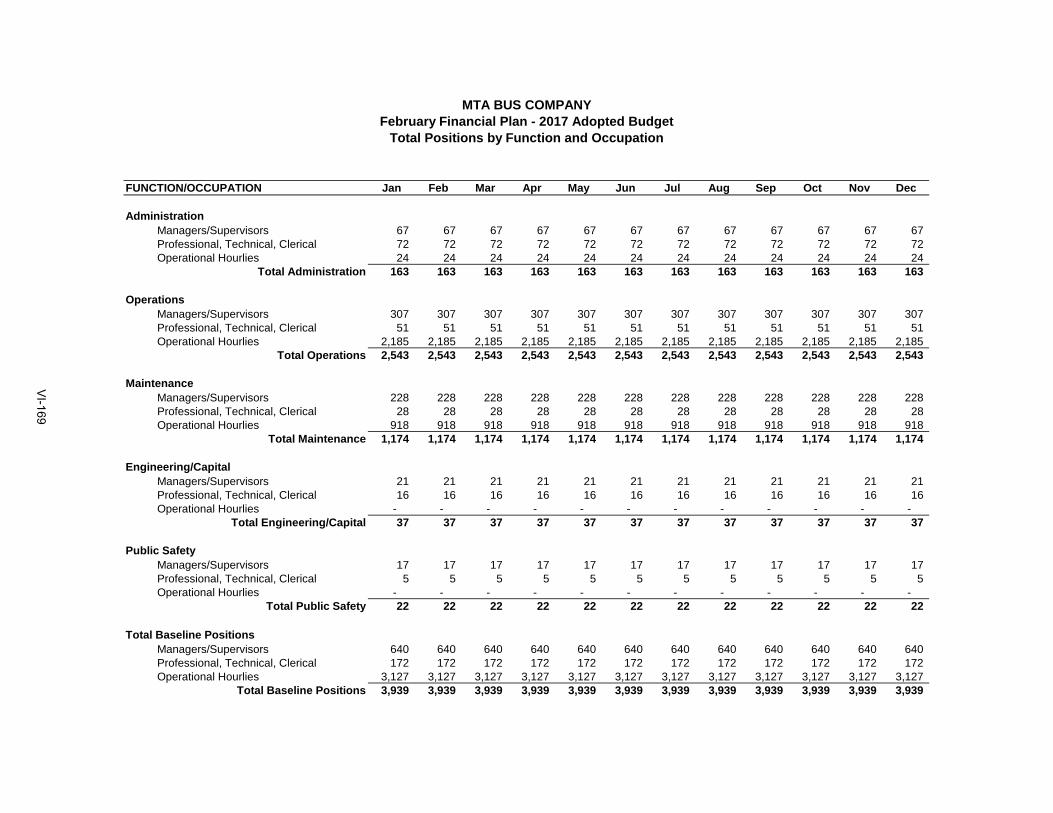
FUNCTION/OCCUPATION Jan Feb Mar Apr May Jun Jul Aug Sep Oct Nov Dec
Administration Managers/Supervisors 67 67 67 67 67 67 67 67 67 67 67 67 Professional, Technical, Clerical 72 72 72 72 72 72 72 72 72 72 72 72 Operational Hourlies 24 24 24 24 24 24 24 24 24 24 24 24
Total Administration 163 163 163 163 163 163 163 163 163 163 163 163
Operations Managers/Supervisors 307 307 307 307 307 307 307 307 307 307 307 307 Professional, Technical, Clerical 51 51 51 51 51 51 51 51 51 51 51 51 Operational Hourlies 2,185 2,185 2,185 2,185 2,185 2,185 2,185 2,185 2,185 2,185 2,185 2,185
Total Operations 2,543 2,543 2,543 2,543 2,543 2,543 2,543 2,543 2,543 2,543 2,543 2,543
Maintenance Managers/Supervisors 228 228 228 228 228 228 228 228 228 228 228 228 Professional, Technical, Clerical 28 28 28 28 28 28 28 28 28 28 28 28 Operational Hourlies 918 918 918 918 918 918 918 918 918 918 918 918
Total Maintenance 1,174 1,174 1,174 1,174 1,174 1,174 1,174 1,174 1,174 1,174 1,174 1,174
Engineering/Capital Managers/Supervisors 21 21 21 21 21 21 21 21 21 21 21 21 Professional, Technical, Clerical 16 16 16 16 16 16 16 16 16 16 16 16 Operational Hourlies - - - - - - - - - - - -
Total Engineering/Capital 37 37 37 37 37 37 37 37 37 37 37 37
Public Safety Managers/Supervisors 17 17 17 17 17 17 17 17 17 17 17 17 Professional, Technical, Clerical 5 5 5 5 5 5 5 5 5 5 5 5 Operational Hourlies - - - - - - - - - - - -
Total Public Safety 22 22 22 22 22 22 22 22 22 22 22 22
Total Baseline Positions Managers/Supervisors 640 640 640 640 640 640 640 640 640 640 640 640 Professional, Technical, Clerical 172 172 172 172 172 172 172 172 172 172 172 172 Operational Hourlies 3,127 3,127 3,127 3,127 3,127 3,127 3,127 3,127 3,127 3,127 3,127 3,127
Total Baseline Positions 3,939 3,939 3,939 3,939 3,939 3,939 3,939 3,939 3,939 3,939 3,939 3,939
MTA BUS COMPANYFebruary Financial Plan - 2017 Adopted Budget
Total Positions by Function and Occupation
VI-169
[THIS PAGE INTENTIONALLY LEFT BLANK]
VI-170
Staten Island Railway

MTA STATEN ISLAND RAILWAY
FEBRUARY FINANCIAL PLAN 2017-2020 2016 FINAL ESTIMATE AND 2017 ADOPTED BUDGET
In accordance with MTA-approved budget procedures, the following information presents MTA Staten Island Railway’s 2016 Final Estimate, 2017 Adopted Budget and the Financial Plan for 2017 - 2020. The Adopted Budget reflects the inclusion of MTA Adjustments that were presented in the December Plan and adopted by the Board in December 2016, as well as other technical adjustments. The MTA adjustments that are included in this MTA Staten Island Railway Financial Plan are as follows:
An average 4% fare increase was approved at the January 2017 MTA Board meeting and will go into effect on March 19, 2017. This fare increase projects increases in farebox revenue of $0.231 million in 2017, $0.290 million in 2018, $0.291 million in 2019 and $0.293 million in 2020. Additionally, ridership is projected to decrease by 0.005 million in 2017, and 0.007 million for each year 2018 through 2020.
A revision in fuel price forecasts subsequent to the provision of November Plan
instructions, resulting in expense increases of $0.005 million in 2017, $0.003 million in 2018, $0.001 million in 2019 and $0.002 million in 2020.
The attached also includes schedules detailing the monthly allocation of financial, including overtime, and headcount and utilization data based on the 2017 Adopted Budget for the purpose of reporting actual results on a monthly basis to the Board.
VI-171
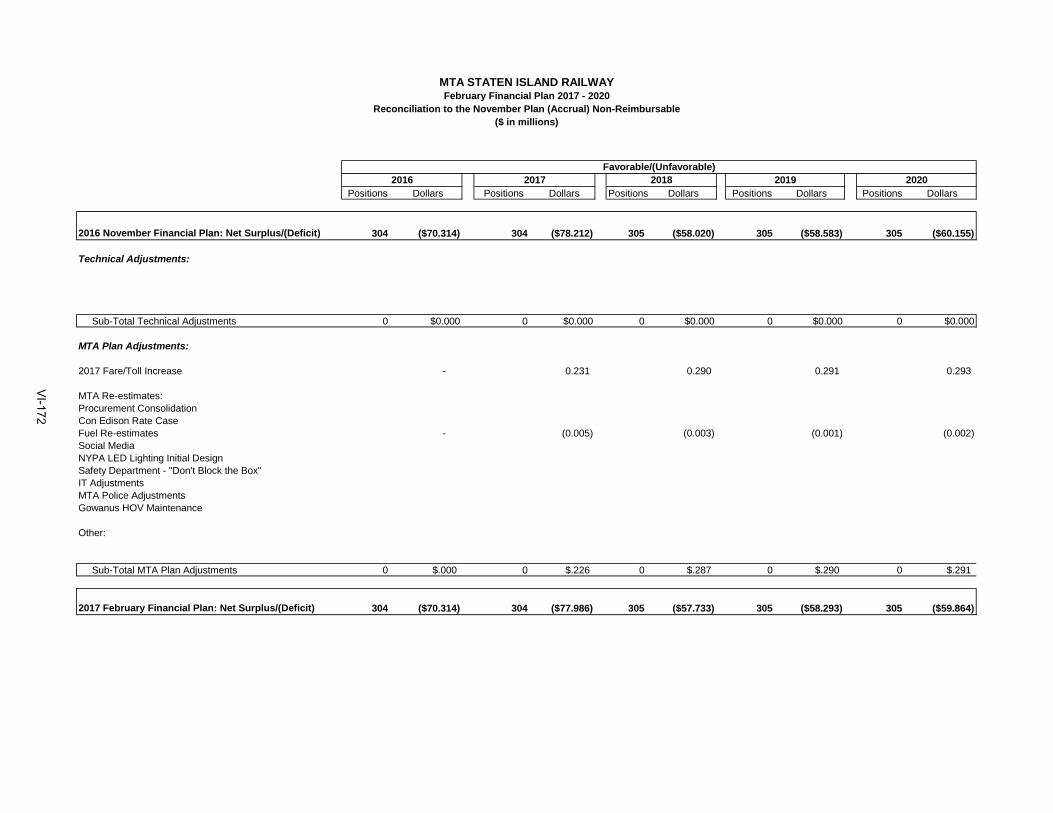
Positions Dollars Positions Dollars Positions Dollars Positions Dollars Positions Dollars
2016 November Financial Plan: Net Surplus/(Deficit) 304 ($70.314) 304 ($78.212) 305 ($58.020) 305 ($58.583) 305 ($60.155)
Technical Adjustments:
Sub-Total Technical Adjustments 0 $0.000 0 $0.000 0 $0.000 0 $0.000 0 $0.000
MTA Plan Adjustments:
2017 Fare/Toll Increase - 0.231 0.290 0.291 0.293
MTA Re-estimates:Procurement ConsolidationCon Edison Rate CaseFuel Re-estimates - (0.005) (0.003) (0.001) (0.002) Social MediaNYPA LED Lighting Initial DesignSafety Department - "Don't Block the Box"IT AdjustmentsMTA Police AdjustmentsGowanus HOV Maintenance
Other:
Sub-Total MTA Plan Adjustments 0 $.000 0 $.226 0 $.287 0 $.290 0 $.291
2017 February Financial Plan: Net Surplus/(Deficit) 304 ($70.314) 304 ($77.986) 305 ($57.733) 305 ($58.293) 305 ($59.864)
MTA STATEN ISLAND RAILWAYFebruary Financial Plan 2017 - 2020
Reconciliation to the November Plan (Accrual) Non-Reimbursable($ in millions)
Favorable/(Unfavorable)2016 2017 2018 2019 2020
VI-172
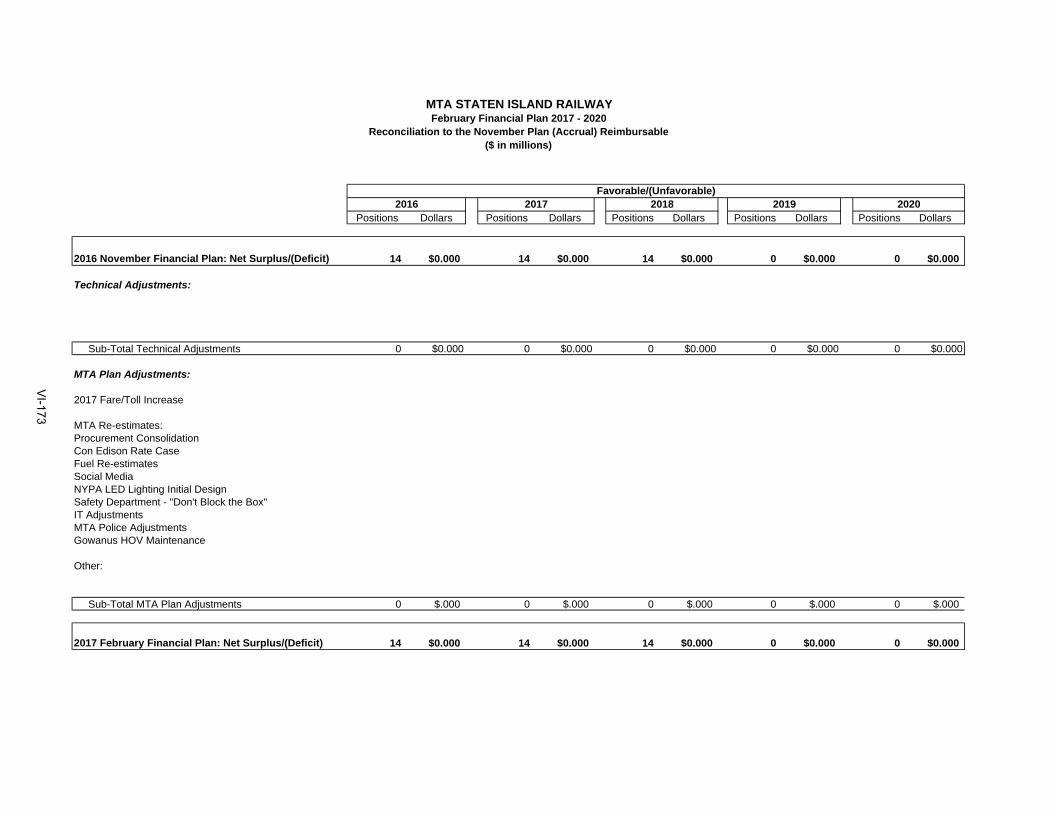
Positions Dollars Positions Dollars Positions Dollars Positions Dollars Positions Dollars
2016 November Financial Plan: Net Surplus/(Deficit) 14 $0.000 14 $0.000 14 $0.000 0 $0.000 0 $0.000
Technical Adjustments:
Sub-Total Technical Adjustments 0 $0.000 0 $0.000 0 $0.000 0 $0.000 0 $0.000
MTA Plan Adjustments:
2017 Fare/Toll Increase
MTA Re-estimates:Procurement ConsolidationCon Edison Rate CaseFuel Re-estimatesSocial MediaNYPA LED Lighting Initial DesignSafety Department - "Don't Block the Box"IT AdjustmentsMTA Police AdjustmentsGowanus HOV Maintenance
Other:
Sub-Total MTA Plan Adjustments 0 $.000 0 $.000 0 $.000 0 $.000 0 $.000
2017 February Financial Plan: Net Surplus/(Deficit) 14 $0.000 14 $0.000 14 $0.000 0 $0.000 0 $0.000
MTA STATEN ISLAND RAILWAYFebruary Financial Plan 2017 - 2020
Reconciliation to the November Plan (Accrual) Reimbursable($ in millions)
Favorable/(Unfavorable)2016 2017 2018 2019 2020
VI-173
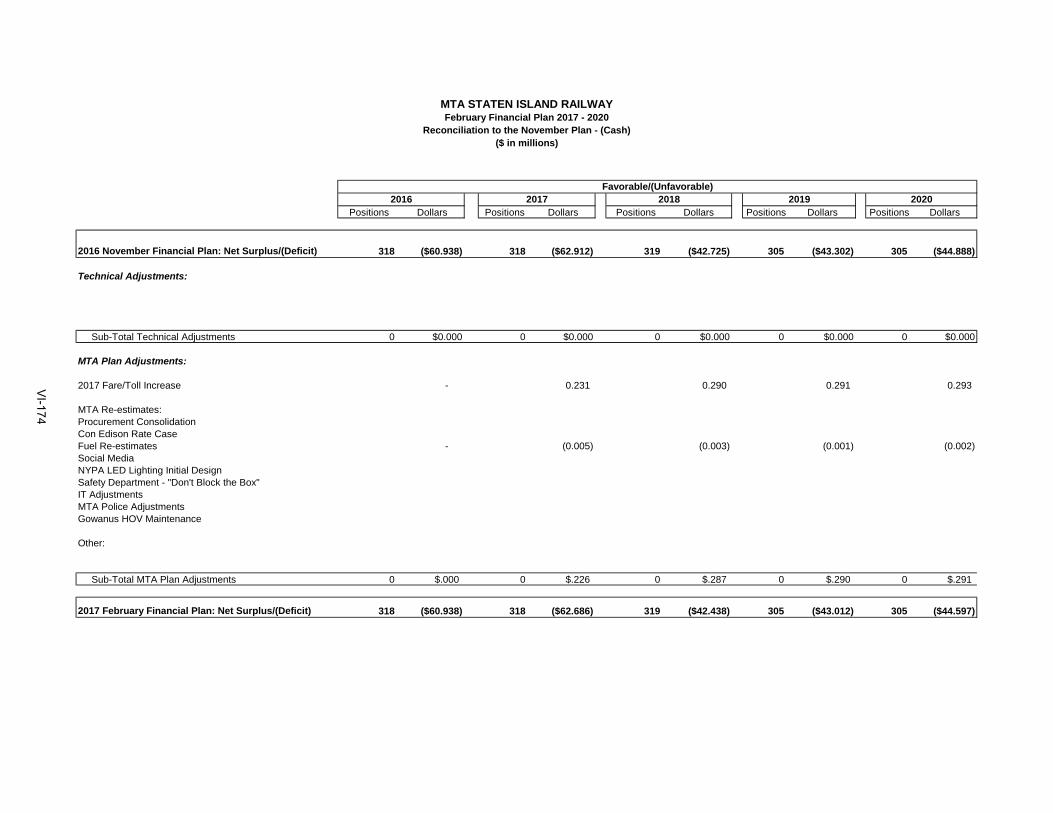
Positions Dollars Positions Dollars Positions Dollars Positions Dollars Positions Dollars
2016 November Financial Plan: Net Surplus/(Deficit) 318 ($60.938) 318 ($62.912) 319 ($42.725) 305 ($43.302) 305 ($44.888)
Technical Adjustments:
Sub-Total Technical Adjustments 0 $0.000 0 $0.000 0 $0.000 0 $0.000 0 $0.000
MTA Plan Adjustments:
2017 Fare/Toll Increase - 0.231 0.290 0.291 0.293
MTA Re-estimates:Procurement ConsolidationCon Edison Rate CaseFuel Re-estimates - (0.005) (0.003) (0.001) (0.002) Social MediaNYPA LED Lighting Initial DesignSafety Department - "Don't Block the Box"IT AdjustmentsMTA Police AdjustmentsGowanus HOV Maintenance
Other:
Sub-Total MTA Plan Adjustments 0 $.000 0 $.226 0 $.287 0 $.290 0 $.291
2017 February Financial Plan: Net Surplus/(Deficit) 318 ($60.938) 318 ($62.686) 319 ($42.438) 305 ($43.012) 305 ($44.597)
MTA STATEN ISLAND RAILWAYFebruary Financial Plan 2017 - 2020
Reconciliation to the November Plan - (Cash)($ in millions)
Favorable/(Unfavorable)2016 2017 2018 2019 2020
VI-174

MTA STATEN ISLAND RAILWAYFebruary Financial Plan 2017 - 2020
Accrual Statement of Operations By Category($ in millions)
Final Estimate
Adopted Budget
2016 2017 2018 2019 2020
Non-Reimbursable
Operating RevenueFarebox Revenue $6.574 $6.849 $6.955 $6.978 $7.025 Other Operating Revenue 2.428 2.450 2.473 2.496 2.520 Capital and Other Reimbursements 0.000 0.000 0.000 0.000 0.000
Total Revenues $9.002 $9.299 $9.428 $9.474 $9.545
Operating ExpenseLabor:
Payroll $23.406 $22.726 $23.091 $23.465 $23.924 Overtime 2.895 3.062 1.641 1.655 1.669 Health and Welfare 4.293 4.649 4.730 4.913 5.103 OPEB Current Payments 1.404 1.497 1.524 1.585 1.650 Pension 6.074 6.128 6.128 6.229 6.130 Other Fringe Benefits 4.036 4.093 4.082 4.165 4.261 Reimbursable Overhead (1.208) (0.489) (0.489) (0.489) 0.000
Total Labor Expenses $40.900 $41.666 $40.707 $41.523 $42.737
Non-Labor:Electric Power $3.324 $4.025 $4.191 $4.364 $4.678 Fuel 0.235 0.280 0.291 0.294 0.318 Insurance 1.117 1.462 1.660 1.680 1.870 Claims 0.084 0.088 0.088 0.091 0.093 Paratransit Service Contracts 0.000 0.000 0.000 0.000 0.000 Maintenance and Other Operating Contracts 14.933 21.507 2.517 2.081 1.950 Professional Services Contracts 0.762 1.112 1.046 1.064 1.083 Materials and Supplies 2.631 1.815 1.331 1.340 1.350 Other Business Expenses 0.030 0.030 0.030 0.030 0.030
Total Non-Labor Expenses $23.116 $30.319 $11.154 $10.944 $11.372
Other Expense Adjustments:Other Expense Adjustments $0.000 $0.000 $0.000 $0.000 $0.000
Total Other Expense Adjustments $0.000 $0.000 $0.000 $0.000 $0.000
Total Expenses Before Depreciation and GASB Adjs. $64.016 $71.985 $51.861 $52.467 $54.109
Depreciation $8.300 $8.300 $8.300 $8.300 $8.300 OPEB Liability Adjustment 7.500 7.500 7.500 7.500 7.500 GASB 68 Pension Expense Adjustment (0.500) (0.500) (0.500) (0.500) (0.500)Environmental Remediation 0.000 0.000 0.000 0.000 0.000
Total Expenses $79.316 $87.285 $67.161 $67.767 $69.409
Net Surplus/(Deficit) ($70.314) ($77.986) ($57.733) ($58.293) ($59.864)
VI-175
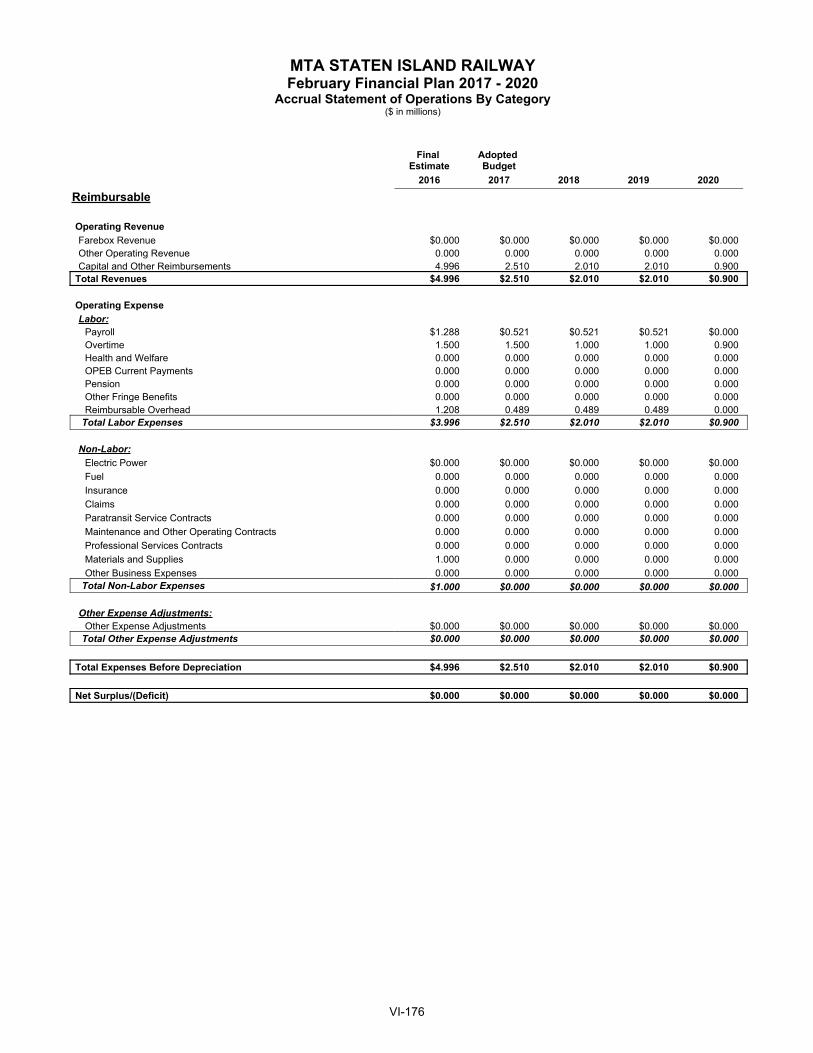
MTA STATEN ISLAND RAILWAYFebruary Financial Plan 2017 - 2020
Accrual Statement of Operations By Category($ in millions)
Final Estimate
Adopted Budget
2016 2017 2018 2019 2020
Reimbursable
Operating RevenueFarebox Revenue $0.000 $0.000 $0.000 $0.000 $0.000 Other Operating Revenue 0.000 0.000 0.000 0.000 0.000 Capital and Other Reimbursements 4.996 2.510 2.010 2.010 0.900
Total Revenues $4.996 $2.510 $2.010 $2.010 $0.900
Operating ExpenseLabor:
Payroll $1.288 $0.521 $0.521 $0.521 $0.000 Overtime 1.500 1.500 1.000 1.000 0.900 Health and Welfare 0.000 0.000 0.000 0.000 0.000 OPEB Current Payments 0.000 0.000 0.000 0.000 0.000 Pension 0.000 0.000 0.000 0.000 0.000 Other Fringe Benefits 0.000 0.000 0.000 0.000 0.000 Reimbursable Overhead 1.208 0.489 0.489 0.489 0.000
Total Labor Expenses $3.996 $2.510 $2.010 $2.010 $0.900
Non-Labor:Electric Power $0.000 $0.000 $0.000 $0.000 $0.000 Fuel 0.000 0.000 0.000 0.000 0.000 Insurance 0.000 0.000 0.000 0.000 0.000 Claims 0.000 0.000 0.000 0.000 0.000 Paratransit Service Contracts 0.000 0.000 0.000 0.000 0.000 Maintenance and Other Operating Contracts 0.000 0.000 0.000 0.000 0.000 Professional Services Contracts 0.000 0.000 0.000 0.000 0.000 Materials and Supplies 1.000 0.000 0.000 0.000 0.000 Other Business Expenses 0.000 0.000 0.000 0.000 0.000
Total Non-Labor Expenses $1.000 $0.000 $0.000 $0.000 $0.000
Other Expense Adjustments:Other Expense Adjustments $0.000 $0.000 $0.000 $0.000 $0.000
Total Other Expense Adjustments $0.000 $0.000 $0.000 $0.000 $0.000
Total Expenses Before Depreciation $4.996 $2.510 $2.010 $2.010 $0.900
Net Surplus/(Deficit) $0.000 $0.000 $0.000 $0.000 $0.000
VI-176
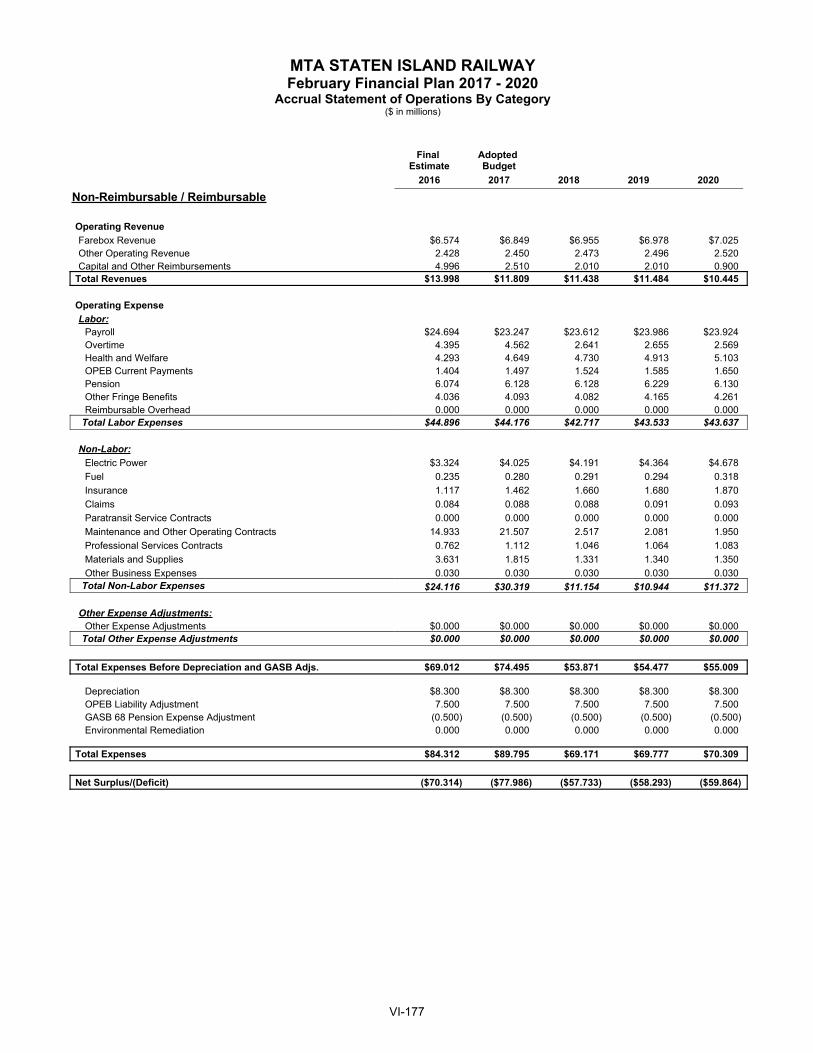
MTA STATEN ISLAND RAILWAYFebruary Financial Plan 2017 - 2020
Accrual Statement of Operations By Category($ in millions)
Final Estimate
Adopted Budget
2016 2017 2018 2019 2020
Non-Reimbursable / Reimbursable
Operating RevenueFarebox Revenue $6.574 $6.849 $6.955 $6.978 $7.025 Other Operating Revenue 2.428 2.450 2.473 2.496 2.520 Capital and Other Reimbursements 4.996 2.510 2.010 2.010 0.900
Total Revenues $13.998 $11.809 $11.438 $11.484 $10.445
Operating ExpenseLabor:
Payroll $24.694 $23.247 $23.612 $23.986 $23.924 Overtime 4.395 4.562 2.641 2.655 2.569 Health and Welfare 4.293 4.649 4.730 4.913 5.103 OPEB Current Payments 1.404 1.497 1.524 1.585 1.650 Pension 6.074 6.128 6.128 6.229 6.130 Other Fringe Benefits 4.036 4.093 4.082 4.165 4.261 Reimbursable Overhead 0.000 0.000 0.000 0.000 0.000
Total Labor Expenses $44.896 $44.176 $42.717 $43.533 $43.637
Non-Labor:Electric Power $3.324 $4.025 $4.191 $4.364 $4.678 Fuel 0.235 0.280 0.291 0.294 0.318 Insurance 1.117 1.462 1.660 1.680 1.870 Claims 0.084 0.088 0.088 0.091 0.093 Paratransit Service Contracts 0.000 0.000 0.000 0.000 0.000 Maintenance and Other Operating Contracts 14.933 21.507 2.517 2.081 1.950 Professional Services Contracts 0.762 1.112 1.046 1.064 1.083 Materials and Supplies 3.631 1.815 1.331 1.340 1.350 Other Business Expenses 0.030 0.030 0.030 0.030 0.030
Total Non-Labor Expenses $24.116 $30.319 $11.154 $10.944 $11.372
Other Expense Adjustments:Other Expense Adjustments $0.000 $0.000 $0.000 $0.000 $0.000
Total Other Expense Adjustments $0.000 $0.000 $0.000 $0.000 $0.000
Total Expenses Before Depreciation and GASB Adjs. $69.012 $74.495 $53.871 $54.477 $55.009
Depreciation $8.300 $8.300 $8.300 $8.300 $8.300 OPEB Liability Adjustment 7.500 7.500 7.500 7.500 7.500 GASB 68 Pension Expense Adjustment (0.500) (0.500) (0.500) (0.500) (0.500)Environmental Remediation 0.000 0.000 0.000 0.000 0.000
Total Expenses $84.312 $89.795 $69.171 $69.777 $70.309
Net Surplus/(Deficit) ($70.314) ($77.986) ($57.733) ($58.293) ($59.864)
VI-177
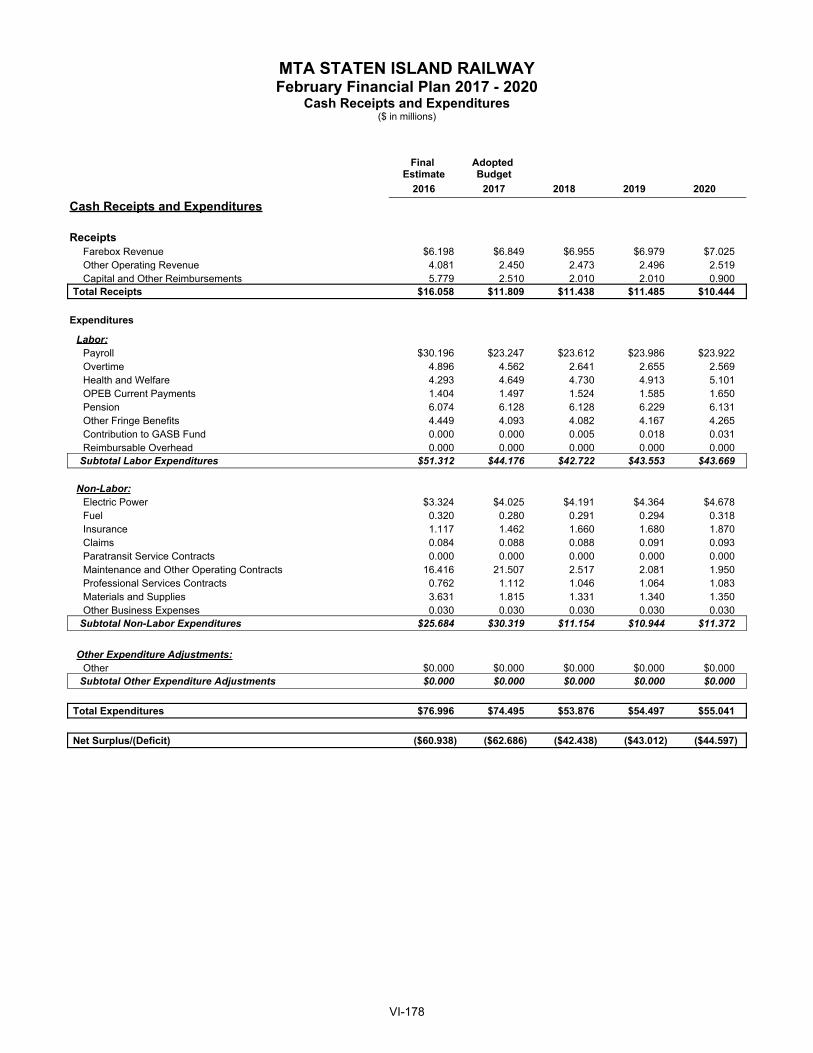
MTA STATEN ISLAND RAILWAYFebruary Financial Plan 2017 - 2020
Cash Receipts and Expenditures($ in millions)
Final Estimate
Adopted Budget
2016 2017 2018 2019 2020
Cash Receipts and Expenditures
ReceiptsFarebox Revenue $6.198 $6.849 $6.955 $6.979 $7.025 Other Operating Revenue 4.081 2.450 2.473 2.496 2.519 Capital and Other Reimbursements 5.779 2.510 2.010 2.010 0.900
Total Receipts $16.058 $11.809 $11.438 $11.485 $10.444
Expenditures
Labor:Payroll $30.196 $23.247 $23.612 $23.986 $23.922 Overtime 4.896 4.562 2.641 2.655 2.569 Health and Welfare 4.293 4.649 4.730 4.913 5.101 OPEB Current Payments 1.404 1.497 1.524 1.585 1.650 Pension 6.074 6.128 6.128 6.229 6.131 Other Fringe Benefits 4.449 4.093 4.082 4.167 4.265 Contribution to GASB Fund 0.000 0.000 0.005 0.018 0.031 Reimbursable Overhead 0.000 0.000 0.000 0.000 0.000
Subtotal Labor Expenditures $51.312 $44.176 $42.722 $43.553 $43.669
Non-Labor:Electric Power $3.324 $4.025 $4.191 $4.364 $4.678 Fuel 0.320 0.280 0.291 0.294 0.318 Insurance 1.117 1.462 1.660 1.680 1.870 Claims 0.084 0.088 0.088 0.091 0.093 Paratransit Service Contracts 0.000 0.000 0.000 0.000 0.000 Maintenance and Other Operating Contracts 16.416 21.507 2.517 2.081 1.950 Professional Services Contracts 0.762 1.112 1.046 1.064 1.083 Materials and Supplies 3.631 1.815 1.331 1.340 1.350 Other Business Expenses 0.030 0.030 0.030 0.030 0.030
Subtotal Non-Labor Expenditures $25.684 $30.319 $11.154 $10.944 $11.372
Other Expenditure Adjustments:Other $0.000 $0.000 $0.000 $0.000 $0.000
Subtotal Other Expenditure Adjustments $0.000 $0.000 $0.000 $0.000 $0.000
Total Expenditures $76.996 $74.495 $53.876 $54.497 $55.041
Net Surplus/(Deficit) ($60.938) ($62.686) ($42.438) ($43.012) ($44.597)
VI-178

MTA STATEN ISLAND RAILWAYFebruary Financial Plan 2017 - 2020
Cash Conversion (Cash Flow Adjustments)Favorable/(Unfavorable)
($ in millions)
Final Estimate
Adopted Budget
2016 2017 2018 2019 2020Cash Flow Adjustments
ReceiptsFarebox Revenue ($0.376) $0.000 $0.000 $0.001 $0.000 Other Operating Revenue 1.653 0.000 0.000 0.000 (0.001)Capital and Other Reimbursements 0.783 0.000 0.000 0.000 0.000
Total Receipts $2.060 $0.000 $0.000 $0.001 ($0.001)
ExpendituresLabor:
Payroll ($5.502) $0.000 $0.000 $0.000 $0.002 Overtime (0.501) 0.000 0.000 0.000 0.000 Health and Welfare 0.000 0.000 0.000 0.000 0.002 OPEB Current Payments 0.000 0.000 0.000 0.000 0.000 Pension 0.000 0.000 0.000 0.000 (0.001)Other Fringe Benefits (0.413) 0.000 0.000 (0.002) (0.004)Contribution to GASB Fund 0.000 0.000 (0.005) (0.018) (0.031)Reimbursable Overhead 0.000 0.000 0.000 0.000 0.000
Subtotal Labor Expenditures ($6.416) $0.000 ($0.005) ($0.020) ($0.032)
Non-Labor:Electric Power $0.000 0.000 $0.000 $0.000 $0.000 Fuel (0.085) 0.000 0.000 0.000 0.000 Insurance 0.000 0.000 0.000 0.000 0.000 Claims 0.000 0.000 0.000 0.000 0.000 Paratransit Service Contracts 0.000 0.000 0.000 0.000 0.000 Maintenance and Other Operating Contracts (1.483) 0.000 0.000 0.000 0.000 Professional Services Contracts 0.000 0.000 0.000 0.000 0.000 Materials and Supplies 0.000 0.000 0.000 0.000 0.000 Other Business Expenses 0.000 0.000 0.000 0.000 0.000
Subtotal Non-Labor Expenditures ($1.568) $0.000 $0.000 $0.000 $0.000
Other Expenditure Adjustments:Other Expense Adjustments $0.000 $0.000 $0.000 $0.000 $0.000
Subtotal Other Expenditure Ajustments $0.000 $0.000 $0.000 $0.000 $0.000
Total Expenditures ($7.984) $0.000 ($0.005) ($0.020) ($0.032)
Total Cash Conversion Adjustments before Depreciation ($5.924) $0.000 ($0.005) ($0.019) ($0.033)
Depreciation $8.300 $8.300 $8.300 $8.300 $8.300 OPEB Liability Adjustment 7.500 7.500 7.500 7.500 7.500 GASB 68 Pension Expense Adjustment (0.500) (0.500) (0.500) (0.500) (0.500)Environmental Remediation 0.000 0.000 0.000 0.000 0.000
Total Cash Conversion Adjustments $9.376 $15.300 $15.295 $15.281 $15.267
VI-179

MTA STATEN ISLAND RAILWAYFebruary Financial Plan 2017 - 2020Ridership and Traffic Volume (Utilization)
(in millions)
Final Estimate
Adopted Budget
2016 2017 2018 2019 2020
RIDERSHIP
Fixed Route 4.570 4.590 4.615 4.629 4.655
Total Ridership 4.570 4.590 4.615 4.629 4.655
FAREBOX REVENUE
Fixed Route Farebox Revenue $6.574 $6.849 $6.955 $6.978 $7.025
Farebox Revenue $6.574 $6.849 $6.955 $6.978 $7.025
VI-180
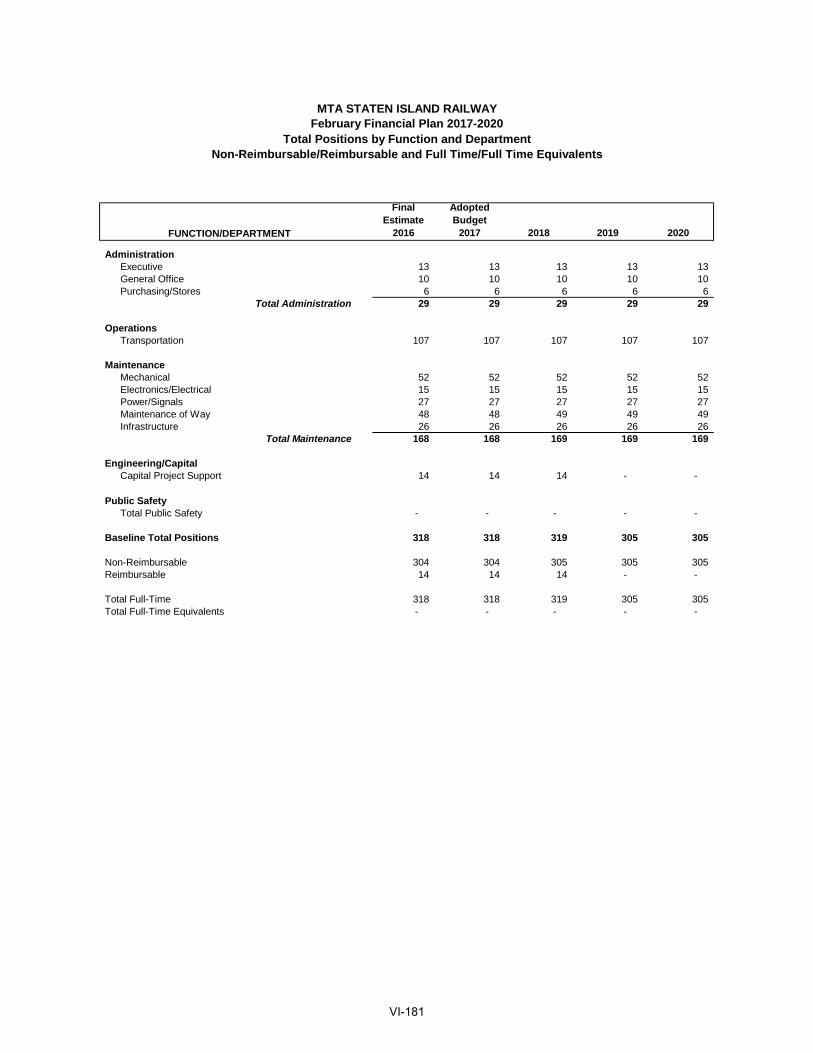
Final Estimate
2016
Adopted Budget
2017 2018 2019 2020
AdministrationExecutive 13 13 13 13 13 General Office 10 10 10 10 10 Purchasing/Stores 6 6 6 6 6
Total Administration 29 29 29 29 29
OperationsTransportation 107 107 107 107 107
MaintenanceMechanical 52 52 52 52 52 Electronics/Electrical 15 15 15 15 15 Power/Signals 27 27 27 27 27 Maintenance of Way 48 48 49 49 49 Infrastructure 26 26 26 26 26
Total Maintenance 168 168 169 169 169
Engineering/CapitalCapital Project Support 14 14 14 - -
Public SafetyTotal Public Safety - - - - -
Baseline Total Positions 318 318 319 305 305
Non-Reimbursable 304 304 305 305 305 Reimbursable 14 14 14 - -
Total Full-Time 318 318 319 305 305 Total Full-Time Equivalents - - - - -
MTA STATEN ISLAND RAILWAYFebruary Financial Plan 2017-2020
Total Positions by Function and DepartmentNon-Reimbursable/Reimbursable and Full Time/Full Time Equivalents
FUNCTION/DEPARTMENT
VI-181
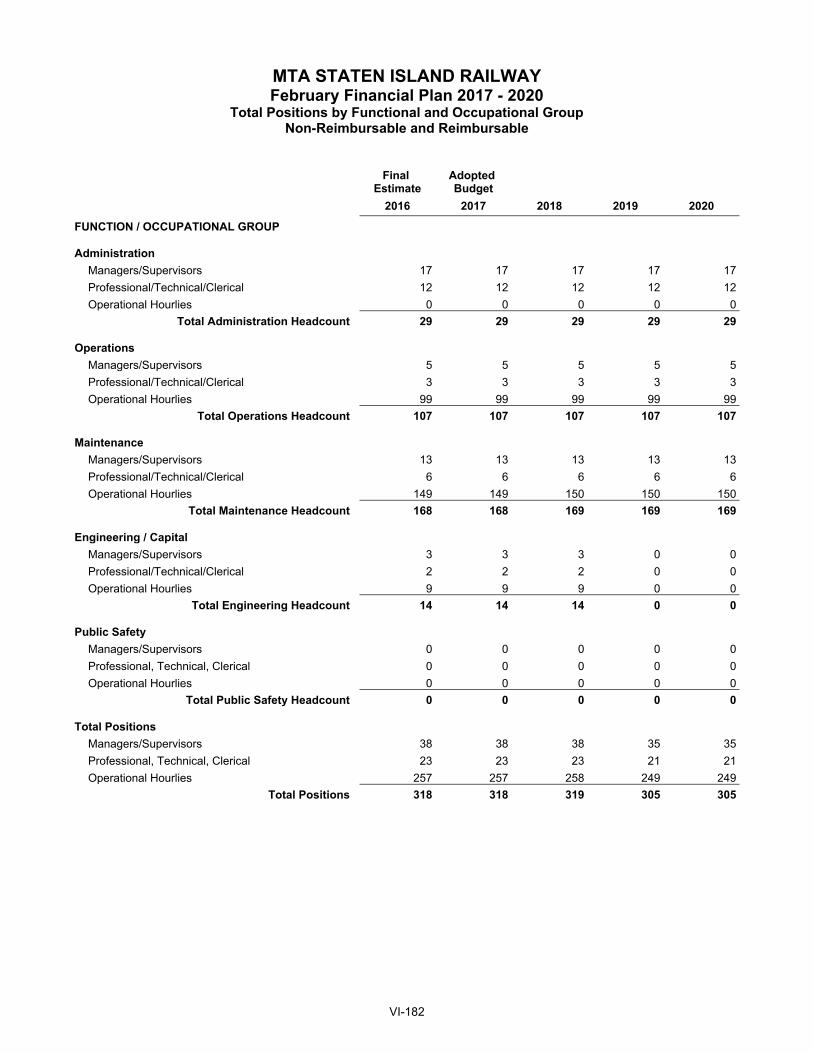
MTA STATEN ISLAND RAILWAYFebruary Financial Plan 2017 - 2020
Total Positions by Functional and Occupational GroupNon-Reimbursable and Reimbursable
Final Estimate
Adopted Budget
2016 2017 2018 2019 2020
FUNCTION / OCCUPATIONAL GROUP
AdministrationManagers/Supervisors 17 17 17 17 17 Professional/Technical/Clerical 12 12 12 12 12 Operational Hourlies 0 0 0 0 0
Total Administration Headcount 29 29 29 29 29
OperationsManagers/Supervisors 5 5 5 5 5 Professional/Technical/Clerical 3 3 3 3 3 Operational Hourlies 99 99 99 99 99
Total Operations Headcount 107 107 107 107 107
MaintenanceManagers/Supervisors 13 13 13 13 13 Professional/Technical/Clerical 6 6 6 6 6 Operational Hourlies 149 149 150 150 150
Total Maintenance Headcount 168 168 169 169 169
Engineering / CapitalManagers/Supervisors 3 3 3 0 0 Professional/Technical/Clerical 2 2 2 0 0 Operational Hourlies 9 9 9 0 0
Total Engineering Headcount 14 14 14 0 0
Public SafetyManagers/Supervisors 0 0 0 0 0 Professional, Technical, Clerical 0 0 0 0 0 Operational Hourlies 0 0 0 0 0
Total Public Safety Headcount 0 0 0 0 0
Total PositionsManagers/Supervisors 38 38 38 35 35 Professional, Technical, Clerical 23 23 23 21 21 Operational Hourlies 257 257 258 249 249
Total Positions 318 318 319 305 305
VI-182

MTA STATEN ISLAND RAILWAYFebruary Financial Plan - 2017 Adopted Budget
Accrual Statement of Operations By Category($ in Millions)
Jan Feb Mar Apr May Jun Jul Aug Sep Oct Nov Dec TotalNon-Reimbursable
Operating RevenueFarebox Revenue $0.521 $0.474 $0.591 $0.537 $0.596 $0.609 $0.561 $0.607 $0.589 $0.625 $0.578 $0.562 $6.849 Other Operating Revenue 0.258 0.187 0.256 0.175 0.249 0.203 0.082 0.069 0.219 0.279 0.248 0.225 2.450
Total Revenues $0.779 $0.662 $0.847 $0.712 $0.845 $0.812 $0.643 $0.675 $0.808 $0.904 $0.826 $0.786 $9.299
Operating ExpensesLabor:
Payroll $1.942 $1.793 $1.885 $1.775 $1.942 $1.852 $1.921 $1.936 $1.869 $1.908 $1.997 $1.908 $22.726 Overtime 0.433 0.260 0.247 0.218 0.218 0.221 0.254 0.267 0.249 0.249 0.223 0.223 3.062 Health and Welfare 0.387 0.387 0.387 0.387 0.387 0.387 0.387 0.387 0.387 0.387 0.387 0.387 4.649 OPEB Current Payments 0.125 0.125 0.125 0.125 0.125 0.125 0.125 0.125 0.125 0.125 0.125 0.125 1.497 Pension 0.511 0.511 0.511 0.511 0.511 0.511 0.511 0.511 0.511 0.511 0.511 0.511 6.128 Other Fringe Benefits 0.341 0.341 0.341 0.341 0.341 0.341 0.341 0.341 0.341 0.341 0.341 0.341 4.093 Reimbursable Overhead (0.041) (0.041) (0.041) (0.041) (0.041) (0.041) (0.041) (0.041) (0.041) (0.041) (0.041) (0.041) (0.489)
Total Labor Expenses $3.698 $3.376 $3.454 $3.316 $3.484 $3.396 $3.497 $3.525 $3.441 $3.481 $3.543 $3.454 $41.666
Non-Labor:Electric Power $0.335 $0.335 $0.335 $0.335 $0.335 $0.335 $0.335 $0.335 $0.335 $0.335 $0.335 $0.335 $4.025 Fuel 0.023 0.023 0.023 0.023 0.023 0.023 0.023 0.023 0.023 0.023 0.023 0.023 0.280 Insurance 0.122 0.122 0.122 0.122 0.122 0.122 0.122 0.122 0.122 0.122 0.122 0.122 1.462 Claims 0.007 0.007 0.007 0.007 0.007 0.007 0.007 0.007 0.007 0.007 0.007 0.007 0.088 Paratransit Service Contracts 0.000 0.000 0.000 0.000 0.000 0.000 0.000 0.000 0.000 0.000 0.000 0.000 0.000 Maintenance and Other Operating Contracts 1.792 1.792 1.792 1.792 1.792 1.792 1.792 1.792 1.792 1.792 1.792 1.792 21.507 Professional Services Contracts 0.093 0.093 0.093 0.093 0.093 0.093 0.093 0.093 0.093 0.093 0.093 0.093 1.112 Materials and Supplies 0.151 0.151 0.151 0.151 0.151 0.151 0.151 0.151 0.151 0.151 0.151 0.151 1.815 Other Business Expenses 0.003 0.003 0.003 0.003 0.003 0.003 0.003 0.003 0.003 0.003 0.003 0.003 0.030
Total Non-Labor Expenses $2.527 $2.527 $2.527 $2.527 $2.527 $2.527 $2.527 $2.527 $2.527 $2.527 $2.527 $2.527 $30.319
Other Expense Adjustments:Other Expense Adjustments $0.000 $0.000 $0.000 $0.000 $0.000 $0.000 $0.000 $0.000 $0.000 $0.000 $0.000 $0.000 $0.000
Total Other Expense Adjustments $0.000 $0.000 $0.000 $0.000 $0.000 $0.000 $0.000 $0.000 $0.000 $0.000 $0.000 $0.000 $0.000
Total Expenses $6.225 $5.903 $5.981 $5.843 $6.010 $5.922 $6.024 $6.052 $5.968 $6.007 $6.069 $5.981 $71.985
Depreciation $0.692 $0.692 $0.692 $0.692 $0.692 $0.692 $0.692 $0.692 $0.692 $0.692 $0.692 $0.692 $8.300 OPEB Liability Adjustment 0.000 0.000 1.875 0.000 0.000 1.875 0.000 0.000 1.875 0.000 0.000 1.875 7.500 GASB 68 Pension Expense Adjustment 0.000 0.000 (0.125) 0.000 0.000 (0.125) 0.000 0.000 (0.125) 0.000 0.000 (0.125) (0.500)Environmental Remediation 0.000 0.000 0.000 0.000 0.000 0.000 0.000 0.000 0.000 0.000 0.000 0.000 0.000
Total Expenses After Non-Cash Liability Adjs. $6.917 $6.595 $8.423 $6.534 $6.702 $8.364 $6.716 $6.744 $8.410 $6.699 $6.761 $8.422 $87.285
Net Surplus/(Deficit) ($6.137) ($5.933) ($7.576) ($5.823) ($5.857) ($7.552) ($6.073) ($6.068) ($7.601) ($5.794) ($5.935) ($7.636) ($77.986)
VI-183

MTA STATEN ISLAND RAILWAYFebruary Financial Plan - 2017 Adopted Budget
Accrual Statement of Operations By Category($ in Millions)
Jan Feb Mar Apr May Jun Jul Aug Sep Oct Nov Dec TotalReimbursable
Operating RevenueFarebox Revenue $0.000 $0.000 $0.000 $0.000 $0.000 $0.000 $0.000 $0.000 $0.000 $0.000 $0.000 $0.000 $0.000 Other Operating Revenue 0.000 0.000 0.000 0.000 0.000 0.000 0.000 0.000 0.000 0.000 0.000 0.000 0.000 Capital and Other Reimbursements 0.207 0.201 0.213 0.206 0.208 0.209 0.206 0.214 0.211 0.212 0.208 0.214 2.510
Total Revenues $0.207 $0.201 $0.213 $0.206 $0.208 $0.209 $0.206 $0.214 $0.211 $0.212 $0.208 $0.214 $2.510
Operating ExpensesLabor:
Payroll $0.042 $0.036 $0.049 $0.042 $0.044 $0.044 $0.039 $0.047 $0.044 $0.045 $0.042 $0.047 $0.521 Overtime 0.124 0.124 0.124 0.124 0.124 0.125 0.126 0.126 0.126 0.126 0.126 0.126 1.500 Health and Welfare 0.000 0.000 0.000 0.000 0.000 0.000 0.000 0.000 0.000 0.000 0.000 0.000 0.000 OPEB Current Payments 0.000 0.000 0.000 0.000 0.000 0.000 0.000 0.000 0.000 0.000 0.000 0.000 0.000 Pension 0.000 0.000 0.000 0.000 0.000 0.000 0.000 0.000 0.000 0.000 0.000 0.000 0.000 Other Fringe Benefits 0.000 0.000 0.000 0.000 0.000 0.000 0.000 0.000 0.000 0.000 0.000 0.000 0.000 Reimbursable Overhead 0.041 0.041 0.041 0.041 0.041 0.041 0.041 0.041 0.041 0.041 0.041 0.041 0.489
Total Labor Expenses $0.207 $0.201 $0.213 $0.206 $0.208 $0.209 $0.206 $0.214 $0.211 $0.212 $0.208 $0.214 $2.510
Non-Labor:Electric Power $0.000 $0.000 $0.000 $0.000 $0.000 $0.000 $0.000 $0.000 $0.000 $0.000 $0.000 $0.000 $0.000 Fuel 0.000 0.000 0.000 0.000 0.000 0.000 0.000 0.000 0.000 0.000 0.000 0.000 0.000 Insurance 0.000 0.000 0.000 0.000 0.000 0.000 0.000 0.000 0.000 0.000 0.000 0.000 0.000 Claims 0.000 0.000 0.000 0.000 0.000 0.000 0.000 0.000 0.000 0.000 0.000 0.000 0.000 Paratransit Service Contracts 0.000 0.000 0.000 0.000 0.000 0.000 0.000 0.000 0.000 0.000 0.000 0.000 0.000 Maintenance and Other Operating Contracts 0.000 0.000 0.000 0.000 0.000 0.000 0.000 0.000 0.000 0.000 0.000 0.000 0.000 Professional Services Contracts 0.000 0.000 0.000 0.000 0.000 0.000 0.000 0.000 0.000 0.000 0.000 0.000 0.000 Materials and Supplies 0.000 0.000 0.000 0.000 0.000 0.000 0.000 0.000 0.000 0.000 0.000 0.000 0.000 Other Business Expenses 0.000 0.000 0.000 0.000 0.000 0.000 0.000 0.000 0.000 0.000 0.000 0.000 0.000
Total Non-Labor Expenses $0.000 $0.000 $0.000 $0.000 $0.000 $0.000 $0.000 $0.000 $0.000 $0.000 $0.000 $0.000 $0.000
Other Expense Adjustments:Other Expense Adjustments $0.000 $0.000 $0.000 $0.000 $0.000 $0.000 $0.000 $0.000 $0.000 $0.000 $0.000 $0.000 $0.000
Total Other Expense Adjustments $0.000 $0.000 $0.000 $0.000 $0.000 $0.000 $0.000 $0.000 $0.000 $0.000 $0.000 $0.000 $0.000
Total Expenses $0.207 $0.201 $0.213 $0.206 $0.208 $0.209 $0.206 $0.214 $0.211 $0.212 $0.208 $0.214 $2.510
Net Surplus/(Deficit) $0.000 $0.000 $0.000 $0.000 $0.000 $0.000 $0.000 $0.000 $0.000 $0.000 $0.000 $0.000 $0.000
VI-184
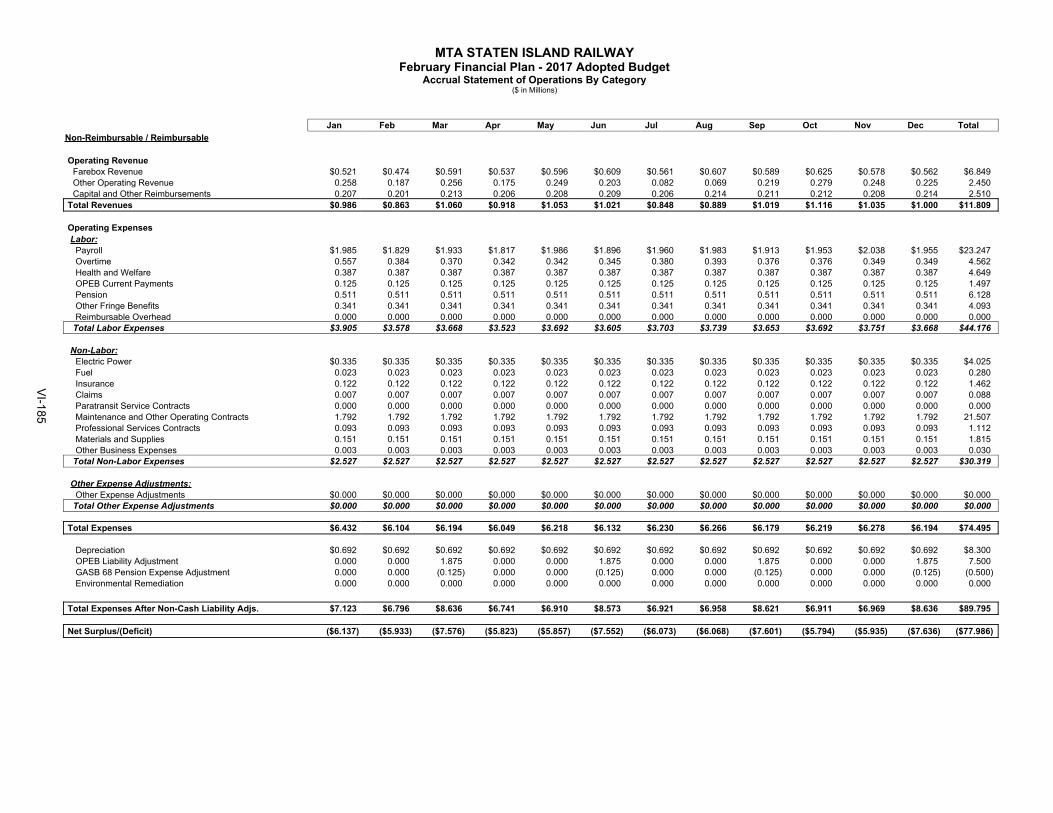
MTA STATEN ISLAND RAILWAYFebruary Financial Plan - 2017 Adopted Budget
Accrual Statement of Operations By Category($ in Millions)
Jan Feb Mar Apr May Jun Jul Aug Sep Oct Nov Dec TotalNon-Reimbursable / Reimbursable
Operating RevenueFarebox Revenue $0.521 $0.474 $0.591 $0.537 $0.596 $0.609 $0.561 $0.607 $0.589 $0.625 $0.578 $0.562 $6.849 Other Operating Revenue 0.258 0.187 0.256 0.175 0.249 0.203 0.082 0.069 0.219 0.279 0.248 0.225 2.450 Capital and Other Reimbursements 0.207 0.201 0.213 0.206 0.208 0.209 0.206 0.214 0.211 0.212 0.208 0.214 2.510
Total Revenues $0.986 $0.863 $1.060 $0.918 $1.053 $1.021 $0.848 $0.889 $1.019 $1.116 $1.035 $1.000 $11.809
Operating ExpensesLabor:
Payroll $1.985 $1.829 $1.933 $1.817 $1.986 $1.896 $1.960 $1.983 $1.913 $1.953 $2.038 $1.955 $23.247 Overtime 0.557 0.384 0.370 0.342 0.342 0.345 0.380 0.393 0.376 0.376 0.349 0.349 4.562 Health and Welfare 0.387 0.387 0.387 0.387 0.387 0.387 0.387 0.387 0.387 0.387 0.387 0.387 4.649 OPEB Current Payments 0.125 0.125 0.125 0.125 0.125 0.125 0.125 0.125 0.125 0.125 0.125 0.125 1.497 Pension 0.511 0.511 0.511 0.511 0.511 0.511 0.511 0.511 0.511 0.511 0.511 0.511 6.128 Other Fringe Benefits 0.341 0.341 0.341 0.341 0.341 0.341 0.341 0.341 0.341 0.341 0.341 0.341 4.093 Reimbursable Overhead 0.000 0.000 0.000 0.000 0.000 0.000 0.000 0.000 0.000 0.000 0.000 0.000 0.000
Total Labor Expenses $3.905 $3.578 $3.668 $3.523 $3.692 $3.605 $3.703 $3.739 $3.653 $3.692 $3.751 $3.668 $44.176
Non-Labor:Electric Power $0.335 $0.335 $0.335 $0.335 $0.335 $0.335 $0.335 $0.335 $0.335 $0.335 $0.335 $0.335 $4.025 Fuel 0.023 0.023 0.023 0.023 0.023 0.023 0.023 0.023 0.023 0.023 0.023 0.023 0.280 Insurance 0.122 0.122 0.122 0.122 0.122 0.122 0.122 0.122 0.122 0.122 0.122 0.122 1.462 Claims 0.007 0.007 0.007 0.007 0.007 0.007 0.007 0.007 0.007 0.007 0.007 0.007 0.088 Paratransit Service Contracts 0.000 0.000 0.000 0.000 0.000 0.000 0.000 0.000 0.000 0.000 0.000 0.000 0.000 Maintenance and Other Operating Contracts 1.792 1.792 1.792 1.792 1.792 1.792 1.792 1.792 1.792 1.792 1.792 1.792 21.507 Professional Services Contracts 0.093 0.093 0.093 0.093 0.093 0.093 0.093 0.093 0.093 0.093 0.093 0.093 1.112 Materials and Supplies 0.151 0.151 0.151 0.151 0.151 0.151 0.151 0.151 0.151 0.151 0.151 0.151 1.815 Other Business Expenses 0.003 0.003 0.003 0.003 0.003 0.003 0.003 0.003 0.003 0.003 0.003 0.003 0.030
Total Non-Labor Expenses $2.527 $2.527 $2.527 $2.527 $2.527 $2.527 $2.527 $2.527 $2.527 $2.527 $2.527 $2.527 $30.319
Other Expense Adjustments:Other Expense Adjustments $0.000 $0.000 $0.000 $0.000 $0.000 $0.000 $0.000 $0.000 $0.000 $0.000 $0.000 $0.000 $0.000
Total Other Expense Adjustments $0.000 $0.000 $0.000 $0.000 $0.000 $0.000 $0.000 $0.000 $0.000 $0.000 $0.000 $0.000 $0.000
Total Expenses $6.432 $6.104 $6.194 $6.049 $6.218 $6.132 $6.230 $6.266 $6.179 $6.219 $6.278 $6.194 $74.495
Depreciation $0.692 $0.692 $0.692 $0.692 $0.692 $0.692 $0.692 $0.692 $0.692 $0.692 $0.692 $0.692 $8.300 OPEB Liability Adjustment 0.000 0.000 1.875 0.000 0.000 1.875 0.000 0.000 1.875 0.000 0.000 1.875 7.500 GASB 68 Pension Expense Adjustment 0.000 0.000 (0.125) 0.000 0.000 (0.125) 0.000 0.000 (0.125) 0.000 0.000 (0.125) (0.500)Environmental Remediation 0.000 0.000 0.000 0.000 0.000 0.000 0.000 0.000 0.000 0.000 0.000 0.000 0.000
Total Expenses After Non-Cash Liability Adjs. $7.123 $6.796 $8.636 $6.741 $6.910 $8.573 $6.921 $6.958 $8.621 $6.911 $6.969 $8.636 $89.795
Net Surplus/(Deficit) ($6.137) ($5.933) ($7.576) ($5.823) ($5.857) ($7.552) ($6.073) ($6.068) ($7.601) ($5.794) ($5.935) ($7.636) ($77.986)
VI-185
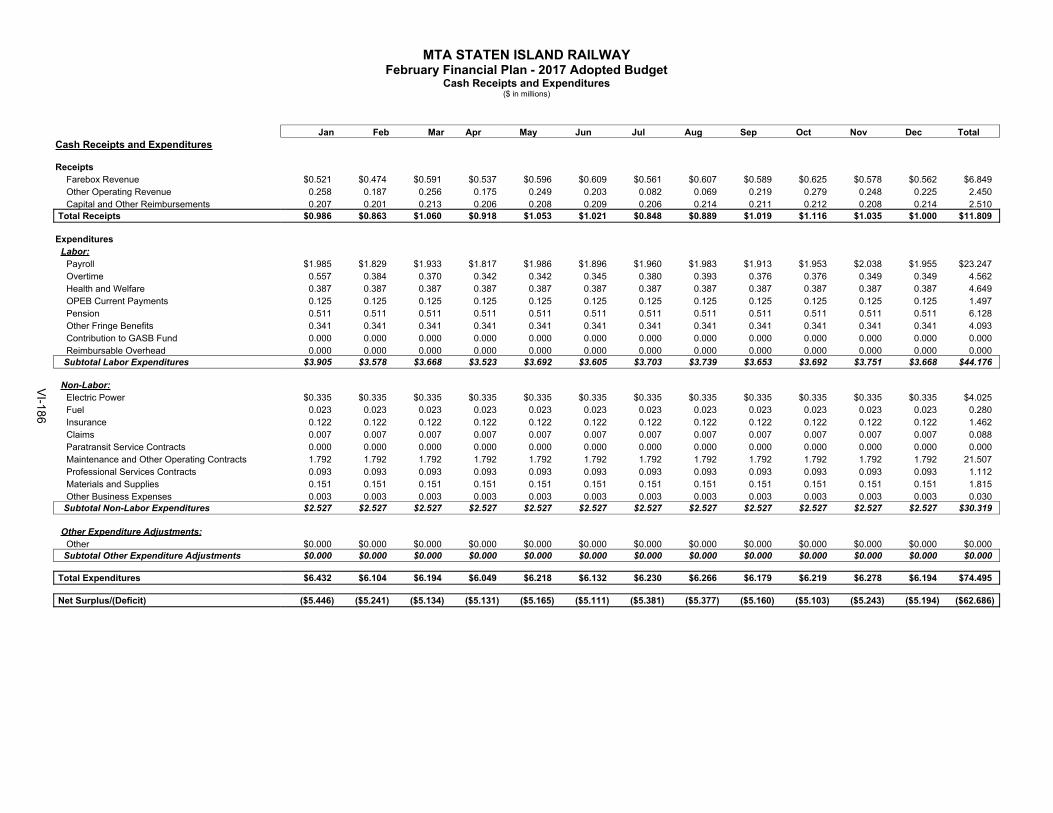
MTA STATEN ISLAND RAILWAYFebruary Financial Plan - 2017 Adopted Budget
Cash Receipts and Expenditures($ in millions)
Jan Feb Mar Apr May Jun Jul Aug Sep Oct Nov Dec TotalCash Receipts and Expenditures
ReceiptsFarebox Revenue $0.521 $0.474 $0.591 $0.537 $0.596 $0.609 $0.561 $0.607 $0.589 $0.625 $0.578 $0.562 $6.849 Other Operating Revenue 0.258 0.187 0.256 0.175 0.249 0.203 0.082 0.069 0.219 0.279 0.248 0.225 2.450 Capital and Other Reimbursements 0.207 0.201 0.213 0.206 0.208 0.209 0.206 0.214 0.211 0.212 0.208 0.214 2.510
Total Receipts $0.986 $0.863 $1.060 $0.918 $1.053 $1.021 $0.848 $0.889 $1.019 $1.116 $1.035 $1.000 $11.809
ExpendituresLabor:
Payroll $1.985 $1.829 $1.933 $1.817 $1.986 $1.896 $1.960 $1.983 $1.913 $1.953 $2.038 $1.955 $23.247 Overtime 0.557 0.384 0.370 0.342 0.342 0.345 0.380 0.393 0.376 0.376 0.349 0.349 4.562 Health and Welfare 0.387 0.387 0.387 0.387 0.387 0.387 0.387 0.387 0.387 0.387 0.387 0.387 4.649 OPEB Current Payments 0.125 0.125 0.125 0.125 0.125 0.125 0.125 0.125 0.125 0.125 0.125 0.125 1.497 Pension 0.511 0.511 0.511 0.511 0.511 0.511 0.511 0.511 0.511 0.511 0.511 0.511 6.128 Other Fringe Benefits 0.341 0.341 0.341 0.341 0.341 0.341 0.341 0.341 0.341 0.341 0.341 0.341 4.093 Contribution to GASB Fund 0.000 0.000 0.000 0.000 0.000 0.000 0.000 0.000 0.000 0.000 0.000 0.000 0.000 Reimbursable Overhead 0.000 0.000 0.000 0.000 0.000 0.000 0.000 0.000 0.000 0.000 0.000 0.000 0.000
Subtotal Labor Expenditures $3.905 $3.578 $3.668 $3.523 $3.692 $3.605 $3.703 $3.739 $3.653 $3.692 $3.751 $3.668 $44.176
Non-Labor:Electric Power $0.335 $0.335 $0.335 $0.335 $0.335 $0.335 $0.335 $0.335 $0.335 $0.335 $0.335 $0.335 $4.025 Fuel 0.023 0.023 0.023 0.023 0.023 0.023 0.023 0.023 0.023 0.023 0.023 0.023 0.280 Insurance 0.122 0.122 0.122 0.122 0.122 0.122 0.122 0.122 0.122 0.122 0.122 0.122 1.462 Claims 0.007 0.007 0.007 0.007 0.007 0.007 0.007 0.007 0.007 0.007 0.007 0.007 0.088 Paratransit Service Contracts 0.000 0.000 0.000 0.000 0.000 0.000 0.000 0.000 0.000 0.000 0.000 0.000 0.000 Maintenance and Other Operating Contracts 1.792 1.792 1.792 1.792 1.792 1.792 1.792 1.792 1.792 1.792 1.792 1.792 21.507 Professional Services Contracts 0.093 0.093 0.093 0.093 0.093 0.093 0.093 0.093 0.093 0.093 0.093 0.093 1.112 Materials and Supplies 0.151 0.151 0.151 0.151 0.151 0.151 0.151 0.151 0.151 0.151 0.151 0.151 1.815 Other Business Expenses 0.003 0.003 0.003 0.003 0.003 0.003 0.003 0.003 0.003 0.003 0.003 0.003 0.030
Subtotal Non-Labor Expenditures $2.527 $2.527 $2.527 $2.527 $2.527 $2.527 $2.527 $2.527 $2.527 $2.527 $2.527 $2.527 $30.319
Other Expenditure Adjustments:Other $0.000 $0.000 $0.000 $0.000 $0.000 $0.000 $0.000 $0.000 $0.000 $0.000 $0.000 $0.000 $0.000
Subtotal Other Expenditure Adjustments $0.000 $0.000 $0.000 $0.000 $0.000 $0.000 $0.000 $0.000 $0.000 $0.000 $0.000 $0.000 $0.000
Total Expenditures $6.432 $6.104 $6.194 $6.049 $6.218 $6.132 $6.230 $6.266 $6.179 $6.219 $6.278 $6.194 $74.495
Net Surplus/(Deficit) ($5.446) ($5.241) ($5.134) ($5.131) ($5.165) ($5.111) ($5.381) ($5.377) ($5.160) ($5.103) ($5.243) ($5.194) ($62.686)
VI-186

MTA STATEN ISLAND RAILWAYFebruary Financial Plan - 2017 Adopted Budget
Cash Conversion (Cash Flow Adjustments)Favorable/(Unfavorable)
($ in millions)
Jan Feb Mar Apr May Jun Jul Aug Sep Oct Nov Dec TotalCash Flow Adjustments
ReceiptsFarebox Revenue $0.000 $0.000 $0.000 $0.000 $0.000 $0.000 $0.000 $0.000 $0.000 $0.000 $0.000 $0.000 $0.000 Other Operating Revenue 0.000 0.000 0.000 0.000 0.000 0.000 0.000 0.000 0.000 0.000 0.000 0.000 0.000 Capital and Other Reimbursements 0.000 0.000 0.000 0.000 0.000 0.000 0.000 0.000 0.000 0.000 0.000 0.000 0.000
Total Receipts $0.000 $0.000 $0.000 $0.000 $0.000 $0.000 $0.000 $0.000 $0.000 $0.000 $0.000 $0.000 $0.000
ExpendituresLabor:
Payroll $0.000 $0.000 $0.000 $0.000 $0.000 $0.000 $0.000 $0.000 $0.000 $0.000 $0.000 $0.000 $0.000 Overtime 0.000 0.000 0.000 0.000 0.000 0.000 0.000 0.000 0.000 0.000 0.000 0.000 0.000 Health and Welfare 0.000 0.000 0.000 0.000 0.000 0.000 0.000 0.000 0.000 0.000 0.000 0.000 0.000 OPEB Current Payments 0.000 0.000 0.000 0.000 0.000 0.000 0.000 0.000 0.000 0.000 0.000 0.000 0.000 Pension 0.000 0.000 0.000 0.000 0.000 0.000 0.000 0.000 0.000 0.000 0.000 0.000 0.000 Other Fringe Benefits 0.000 0.000 0.000 0.000 0.000 0.000 0.000 0.000 0.000 0.000 0.000 0.000 0.000 Contribution to GASB Fund 0.000 0.000 0.000 0.000 0.000 0.000 0.000 0.000 0.000 0.000 0.000 0.000 0.000 Reimbursable Overhead 0.000 0.000 0.000 0.000 0.000 0.000 0.000 0.000 0.000 0.000 0.000 0.000 0.000
Subtotal Labor Expenditures $0.000 $0.000 $0.000 $0.000 $0.000 $0.000 $0.000 $0.000 $0.000 $0.000 $0.000 $0.000 $0.000
Non-Labor:Electric Power $0.000 $0.000 $0.000 $0.000 $0.000 $0.000 $0.000 $0.000 $0.000 $0.000 $0.000 $0.000 $0.000 Fuel 0.000 0.000 0.000 0.000 0.000 0.000 0.000 0.000 0.000 0.000 0.000 0.000 0.000 Insurance 0.000 0.000 0.000 0.000 0.000 0.000 0.000 0.000 0.000 0.000 0.000 0.000 0.000 Claims 0.000 0.000 0.000 0.000 0.000 0.000 0.000 0.000 0.000 0.000 0.000 0.000 0.000 Paratransit Service Contracts 0.000 0.000 0.000 0.000 0.000 0.000 0.000 0.000 0.000 0.000 0.000 0.000 0.000 Maintenance and Other Operating Contracts 0.000 0.000 0.000 0.000 0.000 0.000 0.000 0.000 0.000 0.000 0.000 0.000 0.000 Professional Services Contracts 0.000 0.000 0.000 0.000 0.000 0.000 0.000 0.000 0.000 0.000 0.000 0.000 0.000 Materials and Supplies 0.000 0.000 0.000 0.000 0.000 0.000 0.000 0.000 0.000 0.000 0.000 0.000 0.000 Other Business Expenses 0.000 0.000 0.000 0.000 0.000 0.000 0.000 0.000 0.000 0.000 0.000 0.000 0.000
Subtotal Non-Labor Expenditures $0.000 $0.000 $0.000 $0.000 $0.000 $0.000 $0.000 $0.000 $0.000 $0.000 $0.000 $0.000 $0.000
Other Expenditure Adjustments:Other $0.000 $0.000 $0.000 $0.000 $0.000 $0.000 $0.000 $0.000 $0.000 $0.000 $0.000 $0.000 $0.000
Subtotal Other Expenditure Adjustments $0.000 $0.000 $0.000 $0.000 $0.000 $0.000 $0.000 $0.000 $0.000 $0.000 $0.000 $0.000 $0.000
Total Expenditures $0.000 $0.000 $0.000 $0.000 $0.000 $0.000 $0.000 $0.000 $0.000 $0.000 $0.000 $0.000 $0.000
Total Cash Conversion before Non-Cash Liability Adjs. $0.000 $0.000 $0.000 $0.000 $0.000 $0.000 $0.000 $0.000 $0.000 $0.000 $0.000 $0.000 $0.000
Depreciation $0.692 $0.692 $0.692 $0.692 $0.692 $0.692 $0.692 $0.692 $0.692 $0.692 $0.692 $0.692 $8.300 OPEB Liability Adjustment 0.000 0.000 1.875 0.000 0.000 1.875 0.000 0.000 1.875 0.000 0.000 1.875 7.500 GASB 68 Pension Expense Adjustment 0.000 0.000 (0.125) 0.000 0.000 (0.125) 0.000 0.000 (0.125) 0.000 0.000 (0.125) (0.500)Environmental Remediation 0.000 0.000 0.000 0.000 0.000 0.000 0.000 0.000 0.000 0.000 0.000 0.000 0.000
Total Cash Conversion Adjustments $0.692 $0.692 $2.442 $0.692 $0.692 $2.442 $0.692 $0.692 $2.442 $0.692 $0.692 $2.442 $15.300
VI-187

MTA STATEN ISLAND RAILWAYFebruary Financial Plan - 2017 Adopted Budget
Ridership and Traffic Volume (Utilization)(in millions)
Jan Feb Mar Apr May Jun Jul Aug Sep Oct Nov Dec Total
RIDERSHIP
Fixed Route 0.386 0.333 0.420 0.351 0.411 0.398 0.326 0.349 0.394 0.437 0.400 0.385 4.590
Total Ridership 0.386 0.333 0.420 0.351 0.411 0.398 0.326 0.349 0.394 0.437 0.400 0.385 4.590
FAREBOX REVENUE
Fixed Route Farebox Revenue $0.521 $0.474 $0.591 $0.537 $0.596 $0.609 $0.561 $0.607 $0.589 $0.625 $0.578 $0.562 $6.849
Total Farebox Revenue $0.521 $0.474 $0.591 $0.537 $0.596 $0.609 $0.561 $0.607 $0.589 $0.625 $0.578 $0.562 $6.849
VI-188
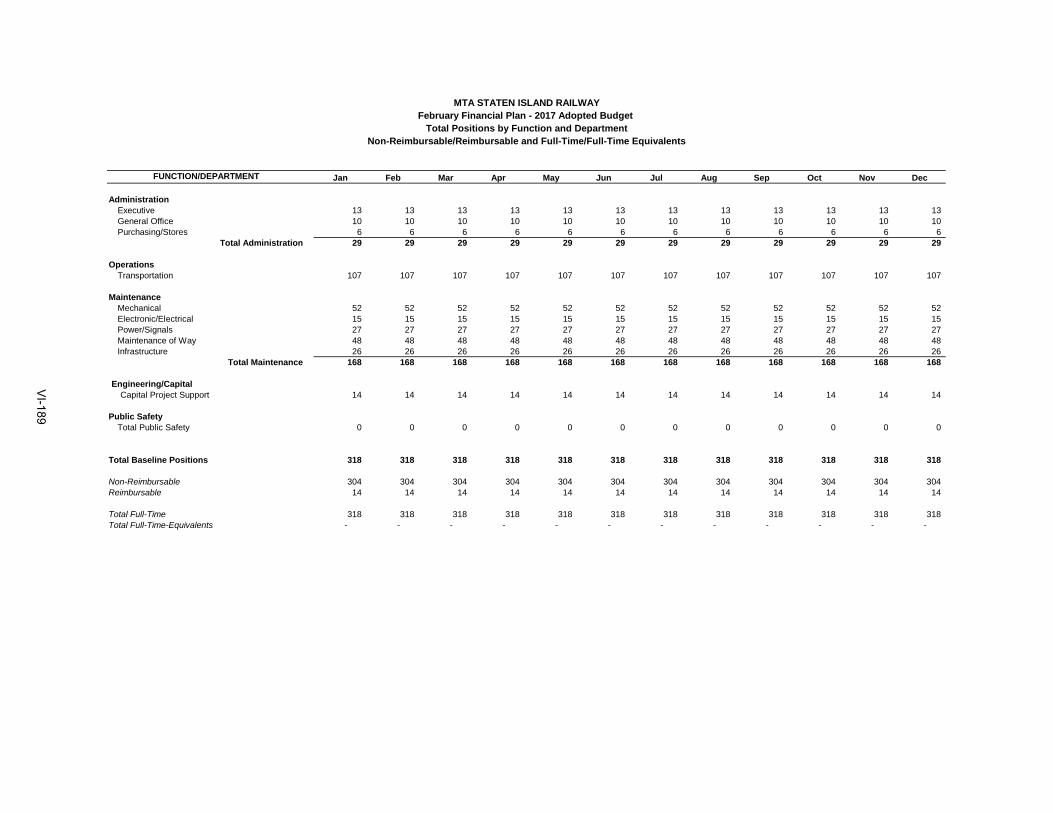
Jan Feb Mar Apr May Jun Jul Aug Sep Oct Nov Dec
AdministrationExecutive 13 13 13 13 13 13 13 13 13 13 13 13General Office 10 10 10 10 10 10 10 10 10 10 10 10Purchasing/Stores 6 6 6 6 6 6 6 6 6 6 6 6
Total Administration 29 29 29 29 29 29 29 29 29 29 29 29
OperationsTransportation 107 107 107 107 107 107 107 107 107 107 107 107
MaintenanceMechanical 52 52 52 52 52 52 52 52 52 52 52 52Electronic/Electrical 15 15 15 15 15 15 15 15 15 15 15 15Power/Signals 27 27 27 27 27 27 27 27 27 27 27 27Maintenance of Way 48 48 48 48 48 48 48 48 48 48 48 48Infrastructure 26 26 26 26 26 26 26 26 26 26 26 26
Total Maintenance 168 168 168 168 168 168 168 168 168 168 168 168
Engineering/CapitalCapital Project Support 14 14 14 14 14 14 14 14 14 14 14 14
Public SafetyTotal Public Safety 0 0 0 0 0 0 0 0 0 0 0 0
Total Baseline Positions 318 318 318 318 318 318 318 318 318 318 318 318
Non-Reimbursable 304 304 304 304 304 304 304 304 304 304 304 304Reimbursable 14 14 14 14 14 14 14 14 14 14 14 14
Total Full-Time 318 318 318 318 318 318 318 318 318 318 318 318Total Full-Time-Equivalents - - - - - - - - - - - -
MTA STATEN ISLAND RAILWAYFebruary Financial Plan - 2017 Adopted Budget
Total Positions by Function and DepartmentNon-Reimbursable/Reimbursable and Full-Time/Full-Time Equivalents
FUNCTION/DEPARTMENT
VI-189

MTA STATEN ISLAND RAILWAYFebruary Financial Plan - 2017 Adopted Budget
Total Positions by Function and Occupation
FUNCTION / OCCUPATION Jan Feb Mar Apr May Jun Jul Aug Sep Oct Nov Dec
AdministrationManagers/Supervisors 17 17 17 17 17 17 17 17 17 17 17 17 Professional/Technical/Clerical 12 12 12 12 12 12 12 12 12 12 12 12 Operational Hourlies 0 0 0 0 0 0 0 0 0 0 0 0
Total Administration Headcount 29 29 29 29 29 29 29 29 29 29 29 29
OperationsManagers/Supervisors 5 5 5 5 5 5 5 5 5 5 5 5 Professional/Technical/Clerical 3 3 3 3 3 3 3 3 3 3 3 3 Operational Hourlies 99 99 99 99 99 99 99 99 99 99 99 99
Total Operations Headcount 107 107 107 107 107 107 107 107 107 107 107 107
MaintenanceManagers/Supervisors 13 13 13 13 13 13 13 13 13 13 13 13 Professional/Technical/Clerical 6 6 6 6 6 6 6 6 6 6 6 6 Operational Hourlies 149 149 149 149 149 149 149 149 149 149 149 149
Total Maintenance Headcount 168 168 168 168 168 168 168 168 168 168 168 168
Engineering / CapitalManagers/Supervisors 3 3 3 3 3 3 3 3 3 3 3 3 Professional/Technical/Clerical 2 2 2 2 2 2 2 2 2 2 2 2 Operational Hourlies 9 9 9 9 9 9 9 9 9 9 9 9
Total Engineering Headcount 14 14 14 14 14 14 14 14 14 14 14 14
Public SafetyManagers/Supervisors 0 0 0 0 0 0 0 0 0 0 0 0 Professional, Technical, Clerical 0 0 0 0 0 0 0 0 0 0 0 0 Operational Hourlies 0 0 0 0 0 0 0 0 0 0 0 0
Total Public Safety Headcount 0 0 0 0 0 0 0 0 0 0 0 0
Total PositionsManagers/Supervisors 38 38 38 38 38 38 38 38 38 38 38 38 Professional, Technical, Clerical 23 23 23 23 23 23 23 23 23 23 23 23 Operational Hourlies 257 257 257 257 257 257 257 257 257 257 257 257
Total Positions 318 318 318 318 318 318 318 318 318 318 318 318
VI-190

VII. Appendix
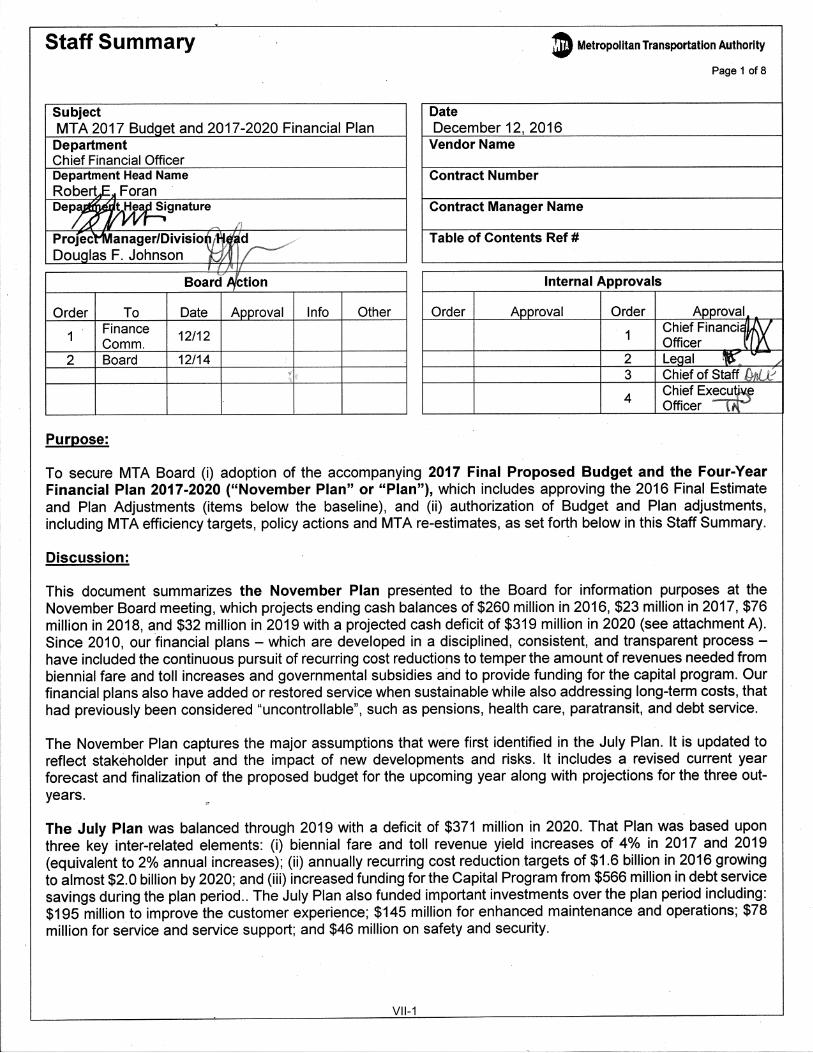
Staff Summary
Subject MTA 2017 Budget and 2017-2020 Financial Plan
Department Chief Financial Officer Department Head Name Robert.E,. Foran Dep~t/iJ~Signature
/.&J/YVI' ~ Profec't1VIanager/Divisio~jl Douglas F. Johnson '1:::.
Board· ~ction
Order
1
2
To Finance Comm. Board
Purpose:
Date Approval Info
12/12
12/14
Other
J> Metropolitan Transportation Authority
Page 1 of8
Date December 12, 2016
Vendor Name
Contract Number
Contract Manager Name
Table of Contents Ref#
Internal Approvals
Order Approval Order
1
2 3
4
Approval Chief. Financi~U.V Officer r ( i\ Legal "'" v
Chief of. Staff l».U:' Chief Execu~ Officer --ut"'
To secure MTA Board (i) adoption of the accompanying 2017 Final Proposed Budget and the Four-Year Financial Plan 2017-2020 ("November Plan" or "Plan"), which includes approving the 2016 Final Estimate and Plan Adjustments (items below the baseline), and (ii) authorization of Budget and Plan adjustments, including MTA efficiency targets, policy actions and MTA re-estimates, as set forth below in this Staff Summary.
Discussion:
This document summarizes the November Plan presented to the Board for information purposes at the November Board meeting, which projects ending cash balances of $260 million in 2016, $23 million in 2017, $76 million in 2018, ~nd $32 million in 2019 with a projected cash deficit of $319 million in 2020 (see attachment A). Since 2010, our financial plans - which are developed in a disciplined, consistent, and transparent process -have included the continuous pursuit of recurring cost reductions to temper the amount of revenues needed from biennial fare and toll increases and governmental subsidies and to provide funding for the capital program. Our financial plans also have added or restored service when sustainable while also addressing long-term costs, that had previously been considered "uncontrollable", such as pensions, health care, paratransit, and debt service.
The November Plan captures the major assumptions that were first identified in the July Plan. It is updated to reflect stakeholder input and the impact of new developments and risks. It includes a revised current year forecast and finalization of the proposed budget for the upcoming year along with projecti.ons for the three outyears.
The July Plan was balanced through 2019 with a deficit of $371 million in 2020. That Plan was based upon three key inter-related elements: (i) biennial fare and toll revenue yield increases of 4% in 2017 and 2019 (equivalent to 2% annual increases); (ii) annually recurring cost reduction targets of $1.6 billion in 2016 growing to almost $2.0 billion by 2020; and (iii) increased funding for the Capital Program from $566 million in debt service savings during the plan period .. The July Plan also funded important investments over the plan period including: $195 million to improve the customer experience; $145 million for enhanced maintenance and operations; $78 million for service and service support; and $46 million on safety and security.
VII-1
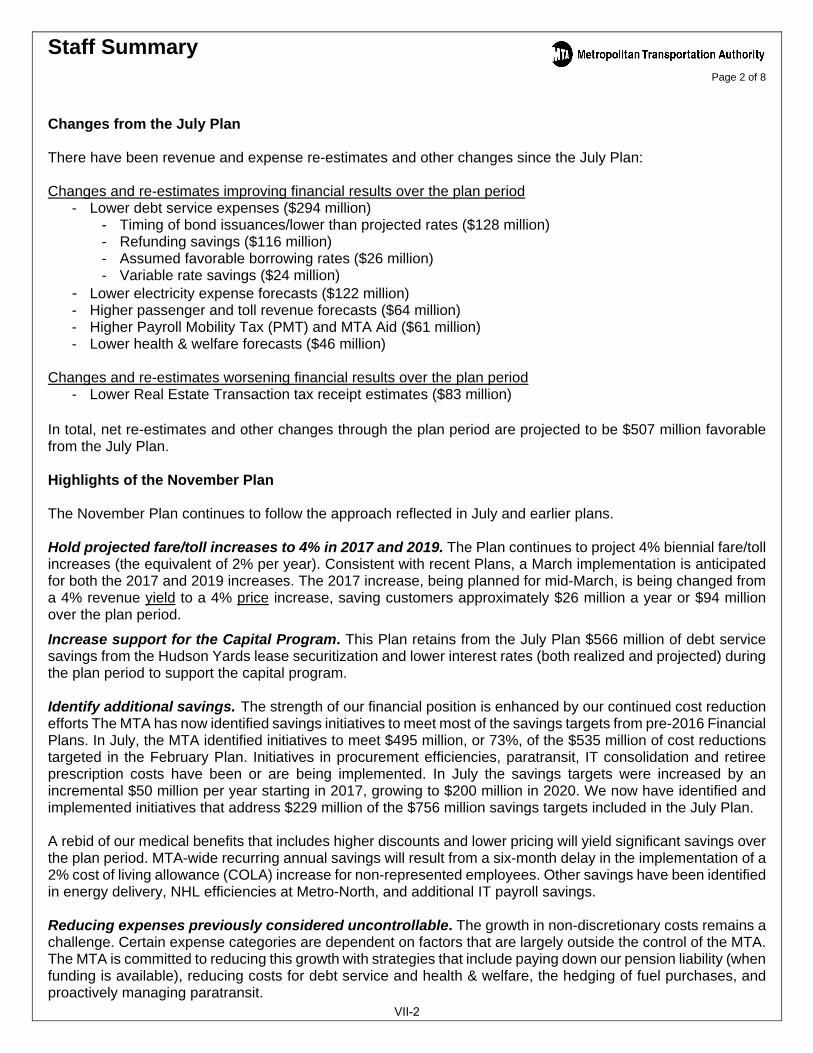
Staff Summary Page 2 of 8 Changes from the July Plan There have been revenue and expense re-estimates and other changes since the July Plan: Changes and re-estimates improving financial results over the plan period
- Lower debt service expenses ($294 million) - Timing of bond issuances/lower than projected rates ($128 million) - Refunding savings ($116 million) - Assumed favorable borrowing rates ($26 million) - Variable rate savings ($24 million)
- Lower electricity expense forecasts ($122 million) - Higher passenger and toll revenue forecasts ($64 million) - Higher Payroll Mobility Tax (PMT) and MTA Aid ($61 million) - Lower health & welfare forecasts ($46 million)
Changes and re-estimates worsening financial results over the plan period - Lower Real Estate Transaction tax receipt estimates ($83 million)
In total, net re-estimates and other changes through the plan period are projected to be $507 million favorable from the July Plan. Highlights of the November Plan The November Plan continues to follow the approach reflected in July and earlier plans. Hold projected fare/toll increases to 4% in 2017 and 2019. The Plan continues to project 4% biennial fare/toll increases (the equivalent of 2% per year). Consistent with recent Plans, a March implementation is anticipated for both the 2017 and 2019 increases. The 2017 increase, being planned for mid-March, is being changed from a 4% revenue yield to a 4% price increase, saving customers approximately $26 million a year or $94 million over the plan period.
Increase support for the Capital Program. This Plan retains from the July Plan $566 million of debt service savings from the Hudson Yards lease securitization and lower interest rates (both realized and projected) during the plan period to support the capital program. Identify additional savings. The strength of our financial position is enhanced by our continued cost reduction efforts The MTA has now identified savings initiatives to meet most of the savings targets from pre-2016 Financial Plans. In July, the MTA identified initiatives to meet $495 million, or 73%, of the $535 million of cost reductions targeted in the February Plan. Initiatives in procurement efficiencies, paratransit, IT consolidation and retiree prescription costs have been or are being implemented. In July the savings targets were increased by an incremental $50 million per year starting in 2017, growing to $200 million in 2020. We now have identified and implemented initiatives that address $229 million of the $756 million savings targets included in the July Plan. A rebid of our medical benefits that includes higher discounts and lower pricing will yield significant savings over the plan period. MTA-wide recurring annual savings will result from a six-month delay in the implementation of a 2% cost of living allowance (COLA) increase for non-represented employees. Other savings have been identified in energy delivery, NHL efficiencies at Metro-North, and additional IT payroll savings. Reducing expenses previously considered uncontrollable. The growth in non-discretionary costs remains a challenge. Certain expense categories are dependent on factors that are largely outside the control of the MTA. The MTA is committed to reducing this growth with strategies that include paying down our pension liability (when funding is available), reducing costs for debt service and health & welfare, the hedging of fuel purchases, and proactively managing paratransit. VII-2
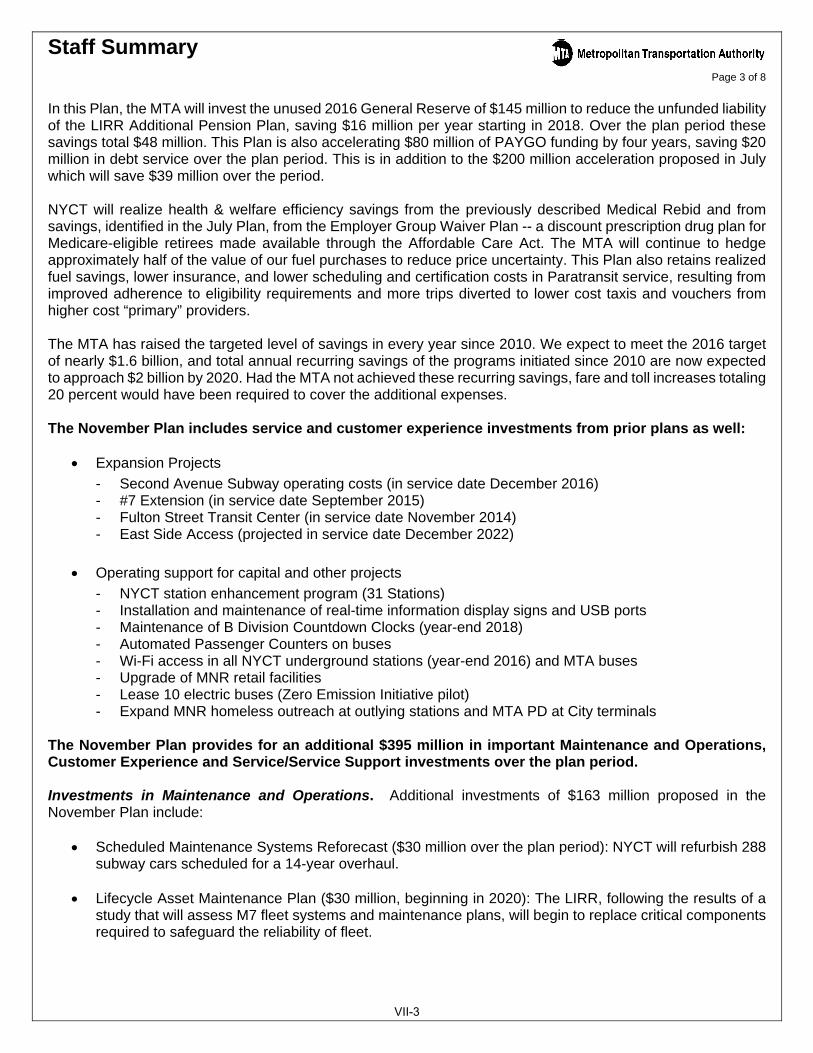
Staff Summary Page 3 of 8
In this Plan, the MTA will invest the unused 2016 General Reserve of $145 million to reduce the unfunded liability of the LIRR Additional Pension Plan, saving $16 million per year starting in 2018. Over the plan period these savings total $48 million. This Plan is also accelerating $80 million of PAYGO funding by four years, saving $20 million in debt service over the plan period. This is in addition to the $200 million acceleration proposed in July which will save $39 million over the period. NYCT will realize health & welfare efficiency savings from the previously described Medical Rebid and from savings, identified in the July Plan, from the Employer Group Waiver Plan -- a discount prescription drug plan for Medicare-eligible retirees made available through the Affordable Care Act. The MTA will continue to hedge approximately half of the value of our fuel purchases to reduce price uncertainty. This Plan also retains realized fuel savings, lower insurance, and lower scheduling and certification costs in Paratransit service, resulting from improved adherence to eligibility requirements and more trips diverted to lower cost taxis and vouchers from higher cost “primary” providers. The MTA has raised the targeted level of savings in every year since 2010. We expect to meet the 2016 target of nearly $1.6 billion, and total annual recurring savings of the programs initiated since 2010 are now expected to approach $2 billion by 2020. Had the MTA not achieved these recurring savings, fare and toll increases totaling 20 percent would have been required to cover the additional expenses. The November Plan includes service and customer experience investments from prior plans as well:
Expansion Projects
- Second Avenue Subway operating costs (in service date December 2016) - #7 Extension (in service date September 2015) - Fulton Street Transit Center (in service date November 2014) - East Side Access (projected in service date December 2022)
Operating support for capital and other projects
- NYCT station enhancement program (31 Stations) - Installation and maintenance of real-time information display signs and USB ports - Maintenance of B Division Countdown Clocks (year-end 2018) - Automated Passenger Counters on buses - Wi-Fi access in all NYCT underground stations (year-end 2016) and MTA buses - Upgrade of MNR retail facilities - Lease 10 electric buses (Zero Emission Initiative pilot) - Expand MNR homeless outreach at outlying stations and MTA PD at City terminals
The November Plan provides for an additional $395 million in important Maintenance and Operations, Customer Experience and Service/Service Support investments over the plan period. Investments in Maintenance and Operations. Additional investments of $163 million proposed in the November Plan include:
Scheduled Maintenance Systems Reforecast ($30 million over the plan period): NYCT will refurbish 288 subway cars scheduled for a 14-year overhaul.
Lifecycle Asset Maintenance Plan ($30 million, beginning in 2020): The LIRR, following the results of a study that will assess M7 fleet systems and maintenance plans, will begin to replace critical components required to safeguard the reliability of fleet.
VII-3
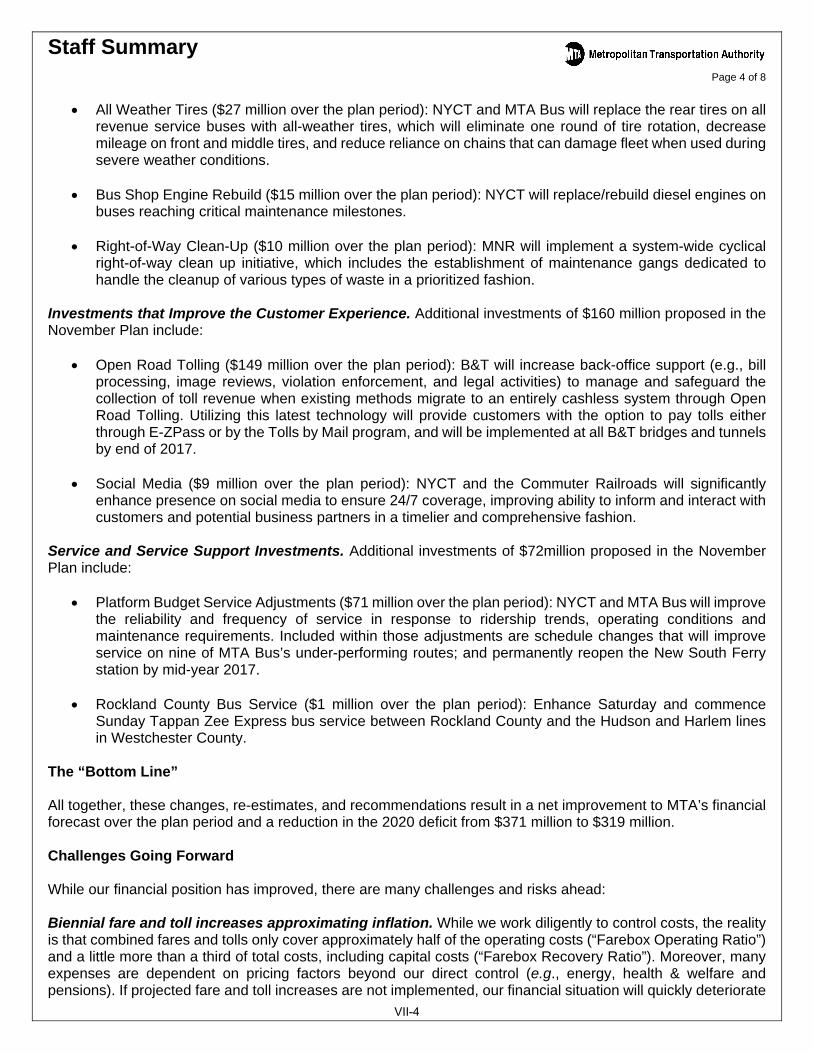
Staff Summary Page 4 of 8
All Weather Tires ($27 million over the plan period): NYCT and MTA Bus will replace the rear tires on all
revenue service buses with all-weather tires, which will eliminate one round of tire rotation, decrease mileage on front and middle tires, and reduce reliance on chains that can damage fleet when used during severe weather conditions.
Bus Shop Engine Rebuild ($15 million over the plan period): NYCT will replace/rebuild diesel engines on buses reaching critical maintenance milestones.
Right-of-Way Clean-Up ($10 million over the plan period): MNR will implement a system-wide cyclical
right-of-way clean up initiative, which includes the establishment of maintenance gangs dedicated to handle the cleanup of various types of waste in a prioritized fashion.
Investments that Improve the Customer Experience. Additional investments of $160 million proposed in the November Plan include:
Open Road Tolling ($149 million over the plan period): B&T will increase back-office support (e.g., bill processing, image reviews, violation enforcement, and legal activities) to manage and safeguard the collection of toll revenue when existing methods migrate to an entirely cashless system through Open Road Tolling. Utilizing this latest technology will provide customers with the option to pay tolls either through E-ZPass or by the Tolls by Mail program, and will be implemented at all B&T bridges and tunnels by end of 2017.
Social Media ($9 million over the plan period): NYCT and the Commuter Railroads will significantly enhance presence on social media to ensure 24/7 coverage, improving ability to inform and interact with customers and potential business partners in a timelier and comprehensive fashion.
Service and Service Support Investments. Additional investments of $72million proposed in the November Plan include:
Platform Budget Service Adjustments ($71 million over the plan period): NYCT and MTA Bus will improve the reliability and frequency of service in response to ridership trends, operating conditions and maintenance requirements. Included within those adjustments are schedule changes that will improve service on nine of MTA Bus’s under-performing routes; and permanently reopen the New South Ferry station by mid-year 2017.
Rockland County Bus Service ($1 million over the plan period): Enhance Saturday and commence
Sunday Tappan Zee Express bus service between Rockland County and the Hudson and Harlem lines in Westchester County.
The “Bottom Line” All together, these changes, re-estimates, and recommendations result in a net improvement to MTA’s financial forecast over the plan period and a reduction in the 2020 deficit from $371 million to $319 million. Challenges Going Forward While our financial position has improved, there are many challenges and risks ahead: Biennial fare and toll increases approximating inflation. While we work diligently to control costs, the reality is that combined fares and tolls only cover approximately half of the operating costs (“Farebox Operating Ratio”) and a little more than a third of total costs, including capital costs (“Farebox Recovery Ratio”). Moreover, many expenses are dependent on pricing factors beyond our direct control (e.g., energy, health & welfare and pensions). If projected fare and toll increases are not implemented, our financial situation will quickly deteriorate
VII-4

Staff Summary Page 5 of 8
as revenue will not be able to keep pace with inflation and other cost growth. Achieving efficiencies/consolidations. Efforts to reduce costs will continue, but it becomes increasingly challenging as much of the “low hanging fruit” has been harvested. We must, however, continue to pursue efficiencies and consolidations to maximize annually recurring savings. If we do not achieve our targets, deficits will occur earlier and be larger. We must also remain focused on existing cost control efforts to avoid backsliding. We cannot afford to “give back” any of the savings that we have worked so hard to achieve.
Expiring labor contracts. Labor contracts for the majority of the represented workforce will expire by mid-January of 2017. The July Plan assumes that settled contracts will result in annual net expense growth of 2% per year, which is consistent with inflation projections. Any contract settlements above this level will require reprioritization and reductions in other areas. Address chronic/looming cost issues. The MTA will continue to address chronic and looming cost issues that put pressure on our finances.
Outstanding liabilities for workers compensation and FELA (the commuter rail equivalent), judgments and claims have risen significantly in recent years. Workers compensations liability has more than doubled to $2.4 billion over the last 6 years. Incident prevention measures, improved case management and fraud detection efforts are underway. Health Care costs (including the “Cadillac Tax”), continue to be a concern. Employee and retiree health care costs have grown at a rate well in excess of inflation for many years. In addition, the “Cadillac Tax” component of the Affordable Care Act adds additional pressure. This is a 40% excise tax assessed on the premium cost of coverage for health plans that exceed a certain annual limit, originally scheduled for implementation in 2018, but since delayed until 2020. Final guidance from the Internal Revenue Service is still pending, but preliminary analysis projects that the MTA could be subject to an excise tax levy up to $70 million in 2020 with larger increases going forward as projected premium costs outpace the inflationary adjustments to the thresholds.
General economic conditions. The finances of the MTA are highly influenced by economic factors. Passenger and toll revenues, dedicated taxes and subsidies, debt service, pensions and energy costs are all impacted by the health of the economy. If the economic assumptions reflected in the Plan are not realized, the November Plan projected results could be adversely affected. Possibility of interest rates higher than forecast. Since 2008, we have benefitted from historically low interest rates. In December 2015, the Federal Open Markets Committee (FOMC) increased the federal funds rate for the first time since late 2008, by a quarter point to a target range of 0.25% to 0.50%, and indicated support for future actions that would return inflation to a 2 percent level. Recently, the FOMC noted that the labor market has continued to strengthen, and economic growth has picked up from the modest pace seen during the first half of 2016. While the FOMC has not increased rates further, it continues to target an eventual return to a 2 percent inflation rate and many economists believe the FOMC has indicated a rate increase is likely to be announced in the near term. While the November Financial Plan includes interest rate assumptions in line with the FOMC’s recent actions and policy statements on future actions, a sudden increase in economic activity may result in inflationary growth, which in turn could lead to an increasing of the federal funds rate beyond what is currently anticipated. Such an increase could lead to an increase in bond rates more than projected in the Plan, which would ultimately increase our debt service costs.
Maintaining discipline to use non-recurring revenues, favorable budget variances, excess resources to fund Contributions to Capital and/or reduce unfunded liabilities, such as OPEBs and pension liabilities. Simply put, this strategy converts favorable “one-shots” into recurring savings. Similarly, when possible, the MTA should reinvest debt service savings as Contributions to Capital, which has become an increasingly important source of funding for our Capital Program. VII-5
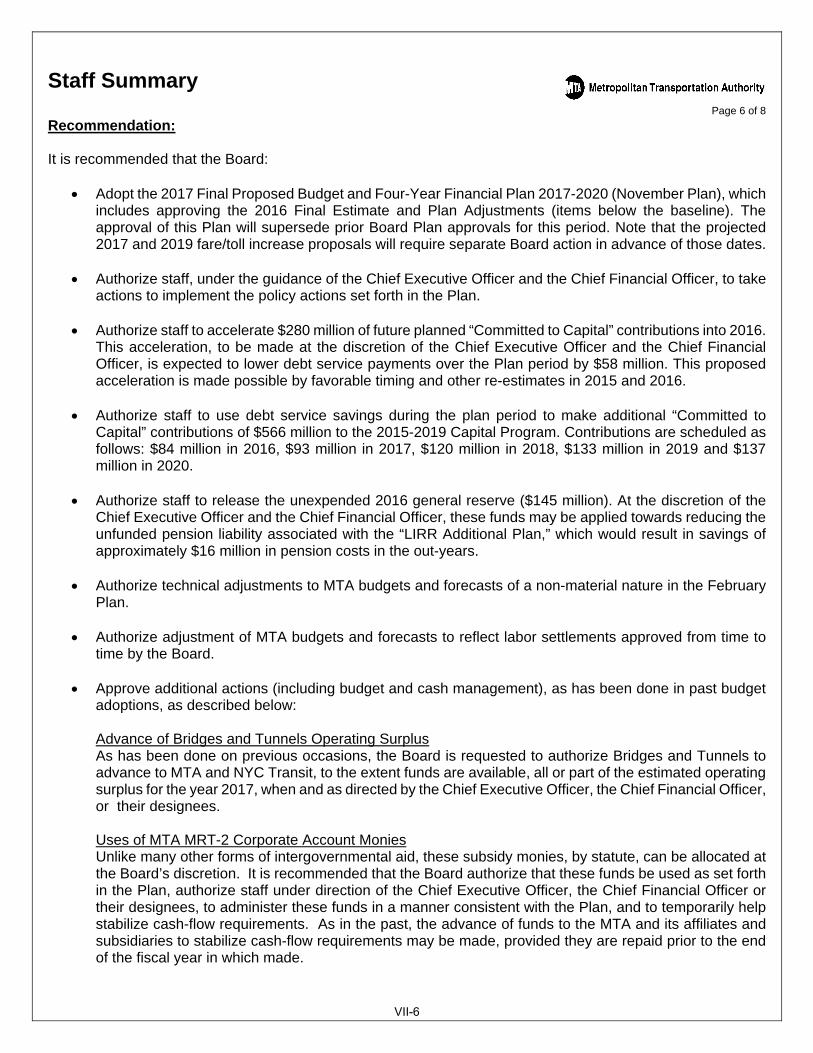
Staff Summary Page 6 of 8
Recommendation: It is recommended that the Board:
Adopt the 2017 Final Proposed Budget and Four-Year Financial Plan 2017-2020 (November Plan), which includes approving the 2016 Final Estimate and Plan Adjustments (items below the baseline). The approval of this Plan will supersede prior Board Plan approvals for this period. Note that the projected 2017 and 2019 fare/toll increase proposals will require separate Board action in advance of those dates.
Authorize staff, under the guidance of the Chief Executive Officer and the Chief Financial Officer, to take
actions to implement the policy actions set forth in the Plan.
Authorize staff to accelerate $280 million of future planned “Committed to Capital” contributions into 2016. This acceleration, to be made at the discretion of the Chief Executive Officer and the Chief Financial Officer, is expected to lower debt service payments over the Plan period by $58 million. This proposed acceleration is made possible by favorable timing and other re-estimates in 2015 and 2016.
Authorize staff to use debt service savings during the plan period to make additional “Committed to Capital” contributions of $566 million to the 2015-2019 Capital Program. Contributions are scheduled as follows: $84 million in 2016, $93 million in 2017, $120 million in 2018, $133 million in 2019 and $137 million in 2020.
Authorize staff to release the unexpended 2016 general reserve ($145 million). At the discretion of the Chief Executive Officer and the Chief Financial Officer, these funds may be applied towards reducing the unfunded pension liability associated with the “LIRR Additional Plan,” which would result in savings of approximately $16 million in pension costs in the out-years.
Authorize technical adjustments to MTA budgets and forecasts of a non-material nature in the February Plan.
Authorize adjustment of MTA budgets and forecasts to reflect labor settlements approved from time to
time by the Board.
Approve additional actions (including budget and cash management), as has been done in past budget adoptions, as described below:
Advance of Bridges and Tunnels Operating Surplus As has been done on previous occasions, the Board is requested to authorize Bridges and Tunnels to advance to MTA and NYC Transit, to the extent funds are available, all or part of the estimated operating surplus for the year 2017, when and as directed by the Chief Executive Officer, the Chief Financial Officer, or their designees. Uses of MTA MRT-2 Corporate Account Monies Unlike many other forms of intergovernmental aid, these subsidy monies, by statute, can be allocated at the Board’s discretion. It is recommended that the Board authorize that these funds be used as set forth in the Plan, authorize staff under direction of the Chief Executive Officer, the Chief Financial Officer or their designees, to administer these funds in a manner consistent with the Plan, and to temporarily help stabilize cash-flow requirements. As in the past, the advance of funds to the MTA and its affiliates and subsidiaries to stabilize cash-flow requirements may be made, provided they are repaid prior to the end of the fiscal year in which made.
VII-6
Staff Summary Page 7 of 8
Uses of Payroll Mobility Tax (and Replacement Funds) and MTA Aid Like the MRT-2 Corporate Account moneys, these subsidy monies, by statute, can be allocated at the Board’s discretion. It is recommended that the Board authorize that the revenues from the PMT (and Replacement Funds) be released as needed: (i) for pledged revenues by MTA to secure and be applied to the payment of bonds to be issued in the future, to fund capital projects of MTA, its subsidiaries, and MTA New York City Transit and its subsidiary and (ii) to pay capital costs, including debt service of MTA, its subsidiaries, and MTA New York City Transit and its subsidiary. It is further recommended that the Board authorize that subject to the provisions of any such pledge, or in the event there is no such pledge, the PMT Revenues be used by MTA to pay for costs, including operating and capital costs of MTA, its subsidiaries and MTA New York City Transit and its subsidiary, and that the Chief Executive Officer, the Chief Financial Officer, or their designees be authorized to release these funds as needed in any of these areas described above. Further, it is recommended that the Board authorize that the revenues in the MTA Aid Trust Account (derived from four fees and taxes imposed in the Metropolitan Commuter Transportation District – a supplemental motor vehicle license fee, a supplemental motor vehicle registration fee, a tax on medallion taxicab rides, and a supplemental tax on passenger car rentals) be released as needed and used as pledged revenues by MTA or pledged to the Triborough Bridge and Tunnel Authority to secure debt of MTA Bridges and Tunnels. Further subject to the provisions of such pledge, or in the event there is no such pledge, it is recommended that the Chief Executive Officer, the Chief Financial Officer or their designees be authorized to direct the release of these funds to be used by MTA for the payment of operating and capital costs of the MTA and its subsidiaries, and New York City Transit, and its subsidiary. Inter-Agency Loans The Board is requested to authorize the Chief Executive Officer, the Chief Financial Officer, or their designees, acting under Section1266 (6-a) of the Public Authorities Law, to enter into inter-agency loan agreements among the MTA and its affiliates and subsidiaries. This authorization would allow the temporary movement of funds among agencies to meet cash flow requirements for operating or capital purposes resulting from a mismatch between the receipt of subsidies and other monies and cash flow needs. The statute requires that any such inter-agency loans be repaid no later than the end of the next succeeding calendar year.
Use of Stabilization Reserve: Provision for Prompt Payment of Contractual Obligations In 1996, the Board approved the establishment of a Stabilization Reserve, to be held by the MTA Treasurer (the “Treasurer”), to stabilize MTA Agencies’ cash flow requirements. The fund consists of two accounts, the MTA New York City Transit Account (the “Transit Account”) and the MTA Commuter Railroad Account (the “Commuter Railroad Account”). The Board is requested to authorize the use of any balances in such accounts, plus any amounts authorized to be transferred to such accounts, to meet the cash flow requirements of MTA New York City Transit and the MTA Commuter Railroads and to authorize MTA New York City Transit to pay to the Treasurer for deposit in the Transit Account such amounts as it deems necessary to accomplish the purpose thereof, consistent with this Plan; and the Treasurer, subject to the approval of the Chief Executive Officer, the Chief Financial Officer or their designees, to pay into the Commuter Railroad Account, such amounts as are deemed necessary to accomplish the purpose thereof, consistent with this Plan. The Treasurer, upon request of MTA New York City Transit, shall pay to NYCT such amounts as are necessary to meet cash flow requirements of NYCT and as authorized by the Chief Executive Officer, the Chief Financial Officer, or their designees, shall transfer from the Commuter Railroad Account such amounts as are necessary to meet the cash flow requirements of MTA Commuter Railroads. The Treasurer shall also use such funds as from time to time may be necessary or convenient to timely make debt service payments on MTA bonds.
VII-7
Staff Summary Page 8 of 8
Government Accounting Standards Board (GASB) Contributions In June 2008, the MTA approved the establishment of the “MTA Retiree Welfare Benefits Trust” (“OPEB Trust”) to govern the administration and investment of the OPEB trust assets. Through 2014, $300 million was moved into the trust. The Treasurer will continue to hold the remaining funds set aside in discrete sub-accounts that comprise the GASB Account. The Treasurer is authorized to use the GASB accounts to fund intra-agency loans as well as inter-agency loans. If an agency uses its own GASB funds to meet 2017 cash flow needs, the amounts withdrawn in 2017 must be paid back by December 31, 2019. If the GASB funds are used as inter-agency loans in 2017, they would be subject to repayment no later than December 31, 2018, consistent with the Inter-Agency Loan provision described above.
VII-8

Attachment A
LineNo. Final 7 Final Proposed
8 Actual Estimate Budget 9 2015 2016 2017 2018 2019 2020
10 Operating Revenue
11 Farebox Revenue $5,961 $6,032 $6,087 $6,126 $6,149 $6,183
12 Toll Revenue 1,809 1,869 1,867 1,865 1,878 1,885
13 Other Revenue 689 688 707 733 762 790 14 Capital and Other Reimbursements 0 0 0 0 0 0
15 Total Operating Revenue $8,459 $8,589 $8,661 $8,725 $8,789 $8,858
16
17 Operating Expense
18 Labor Expenses:
19 Payroll $4,696 $4,840 $5,027 $5,160 $5,273 $5,418
20 Overtime 755 764 756 764 778 794
21 Health & Welfare 1,050 1,179 1,286 1,354 1,443 1,533
22 OPEB Current Payment 502 547 592 633 687 746
23 Pensions 1,249 1,355 1,317 1,330 1,332 1,322
24 Other-Fringe Benefits 861 867 874 910 934 966
25 Reimbursable Overhead (380) (419) (426) (406) (405) (400)
26 Sub-total Labor Expenses $8,732 $9,132 $9,426 $9,746 $10,042 $10,379
27
28 Non-Labor Expenses:
29 Electric Power $474 $412 $511 $531 $552 $591
30 Fuel 162 128 158 164 173 188
31 Insurance 57 43 51 60 66 76
32 Claims 331 275 281 287 295 301
33 Paratransit Service Contracts 379 391 411 435 472 511
34 Maintenance and Other Operating Contracts 579 678 789 765 767 797
35 Professional Service Contracts 380 436 530 465 451 463
36 Materials & Supplies 543 592 650 641 632 698
37 Other Business Expenses 196 178 185 183 193 199
38 Sub-total Non-Labor Expenses $3,101 $3,133 $3,565 $3,531 $3,602 $3,824
39
40 Other Expense Adjustments:
41 Other $37 $53 $46 $47 $49 $51
42 General Reserve 0 0 155 160 165 170
43 Sub-total Other Expense Adjustments $37 $53 $201 $207 $214 $221
44
45 Total Operating Expense before Non-Cash Liability Adj. $11,871 $12,318 $13,192 $13,484 $13,857 $14,424
46
47 Depreciation $2,443 $2,496 $2,588 $2,660 $2,728 $2,794
48 OPEB Liability Adjustment 1,490 1,850 1,939 2,008 2,081 2,158
49 GASB 68 Pension Expense Adjustment (410) (188) (94) (104) (101) (130)
50 Environmental Remediation 21 6 6 6 6 651
52 Total Operating Expense after Non-Cash Liability Adj. $15,414 $16,481 $17,631 $18,053 $18,572 $19,253
53
54 Conversion to Cash Basis: Non-Cash Liability Adjs. ($3,543) ($4,163) ($4,439) ($4,569) ($4,715) ($4,829)55
56 Debt Service (excludes Service Contract Bonds) 2,373 2,458 2,641 2,781 2,934 3,08557
58 Total Operating Expense with Debt Service $14,244 $14,776 $15,833 $16,265 $16,791 $17,509
59
60 Dedicated Taxes and State/Local Subsidies $6,596 $6,735 $6,789 $6,966 $7,127 $7,31861
62 Net Surplus/(Deficit) After Subsidies and Debt Service $811 $548 ($382) ($574) ($875) ($1,333)
63
64 Conversion to Cash Basis: GASB Account 0 0 0 (8) (18) (29)
65 Conversion to Cash Basis: All Other (661) (272) (96) 278 28 131
66
67 CASH BALANCE BEFORE PRIOR-YEAR CARRYOVER $150 $276 ($478) ($303) ($865) ($1,231)
68 ADJUSTMENTS 0 (496) 241 357 821 879
69 PRIOR-YEAR CARRYOVER 330 480 260 23 76 32
70 NET CASH BALANCE $480 $260 $23 $76 $32 ($319)
Page 1 of 2
Non-Reimbursable
November Financial Plan 2017-2020MTA Consolidated Statement Of Operations By Category
($ in millions)
METROPOLITAN TRANSPORTATION AUTHORITY
VII-9

Line
No. Final 7 Final Proposed 8 Actual Estimate Budget
9 2015 2016 2017 2018 2019 2020
10
11 Cash Balance Before Prior-Year Carry-over $150 $276 ($478) ($303) ($865) ($1,231)
12
13 Fare/Toll Increases:
14 Fare/Toll Increase in March 2017 (4% Rate) - 242 284 286 287
15 Fare/Toll Increase in March 2019 (4% Yield) - - - 277 326
16 Subsidy Impacts of 2017/2019 Fare/Toll Increase - (9) (8) (18) (18)
17 Sub-Total $0 $233 $276 $544 $59518
19 MTA Efficiencies: 1
20 MTA Efficiencies - Not Yet Implemented - - 13 17 8
21 Additional MTA Efficiencies - 2016 July Plan - 41 100 150 200 22 Sub-Total $0 $41 $113 $167 $20823
24 Policy Actions:
25 2016 July Plan:
26 Acceleration of Committed to Capital Contribution (200) - - 150 50
27 Debt Service Savings from Acceleration of Contribution - 12 12 12 3
28 Committed to Capital - Additional Funding from DS Savings (84) (81) (108) (121) (134)
29 Committed to Capital - DS Savings from Acceleration of Contribution - (12) (12) (12) (3)
30 2016 November Plan:
31 Acceleration of Committed to Capital Contribution (80) - - - 80
32 Debt Service Savings from Acceleration of Contribution - 5 5 5 5
33 Invest 2016 General Reserve to Reduce Pension Liability (145) - 16 16 16
34 Sub-Total ($509) ($76) ($87) $50 $17
35
36 MTA Re-estimates:
37 Debt Service Savings from Lower Variable Rates & New Refundings 6 17 18 20 19
38 Other MTA Re-estimates 7 26 36 40 40
39 Sub-Total $14 $43 $54 $61 $59
40
41 TOTAL ADJUSTMENTS ($496) $241 $357 $821 $879
42
43 Prior-Year Carry-Over 330 480 260 23 76 3244
45 Net Cash Surplus/(Deficit) $480 $260 $23 $76 $32 ($319)
1
Page 2 of 2
The MTA strives to increase the level of annually recurring savings and does so by assigning savings targets that are captured below-the-line inVolume 1 of its financial plans. As savings initiatives are identified, they are incorporated into Agency baselines (Volume 2) with a correspondingreduction to the unidentified target. The July Plan identified a significant level of efficiencies reducing the level of remaining targeted savings to $31million in 2017, $68 million in 2018, $82 million in 2019 and $76 million in 2020. As a result, the future targeted savings were increased in the JulyPlan by an incremental $50 million per year starting in 2017 with savings from these new targets growing to $200 million in 2020. The July Plan,therefore, assumed that $81 million in additional savings would still need to be identified in 2017. Since the release of the July Plan, the MTA hasidentified $40 million in savings towards the 2017 target (and further savings in the out years), reducing the remaining 2017 target to $41 million inthis Plan.
($ in millions)Plan Adjustments
November Financial Plan 2017-2020METROPOLITAN TRANSPORTATION AUTHORITY
VII-10
Certification of the Chairman and Chief Executive Officerof the
Metropolitan Transportation Authorityin accordance with Section 202.3(l)
of theState Comptrollerns Regulations
I, Veronique Hakim, Interim Executive Director of the Metropolitan TransportationAuthority ("MTA") hereby certify, to the best of my knowledge and belief after reasonableinquiry, including certifications from senior management at the MTA agencies, that the attachedbudget and financial plan is based on reasonable assumptions and methods of estimation and thatthe requirements of Section 202.3 and 202.4 of the Regulations referenced above have been
satisfied.
Metropolitan Transportation Authority
By: ,}\-Veronique Hakim
Interim Executive Director
Dated: February /6,Z0tl
VII-11

[THIS PAGE INTENTIONALLY LEFT BLANK]
VII-12

VIII. Other

The MTA Budget Process MTA budgeting is a rigorous and thorough on-going process and culminates with the passage of the Budget in December. In the course of a year, MTA prepares a February, July and November Financial Plan, and Adoption Materials in December. In addition to the existing year, each Plan requires Agencies to prepare four-year projections which include the upcoming and three following calendar years. Both the July and November Financial Plans are divided into two distinct volumes:
Volume I summarizes the complete financial plan, including the baseline as well as policy items and other “below-the-line” items;
Volume II includes detailed Agency information supporting baseline
revenue, expense, cash and headcount projections. Also included is detailed information supporting actions taken to increase savings as well as individual Agency deficit reduction programs.
July Plan The July Financial Plan provides the opportunity for the MTA to present a revised forecast of the current year’s finances, a preliminary presentation of the following year’s proposed budget, and a three year re-forecast of out-year finances. This Plan may include a series of gap closing proposals necessary to maintain a balanced budget and actions requiring public hearings. The Mid-Year Forecast becomes the basis on which monthly results are compared for the remainder of the year. November Plan After stakeholders weigh in and the impact of new developments and risks are quantified, a November Plan is prepared, which is an update to the July Financial Plan. The November Plan includes a revised current year and finalization of the proposed budget for the upcoming year and projections for the three out-years. December Adopted Budget In December, the November Plan is updated to capture further developments, risks and actions that are necessary to ensure budget balance and is presented to the MTA Board for review and approval. February Plan Finally, certain below-the-line policy issues included in the December Adopted Budget are moved into the baseline and technical adjustments are made. This results in what is called the February Plan. The Adopted Budget is allocated over the 12 month period and becomes the basis on which monthly results are compared.
VIII-1

[THIS PAGE INTENTIONALLY LEFT BLANK]
VIII-2