Embed Size (px)
Citation preview

MTH883 GRADE 8 MATHEMATICS 1
A - 1
Parsippany - Troy Hills School District
MTH883 –
Grade 8 Mathematics
A Course Outline for Mathematics
Approved by the Board of Education ____ Septemb er 12, 2014 ________
Developed: October 2012 Revised: A ugust 2015 Approved: September 2015
MTH883 GRADE 8 MATHEMATICS 2
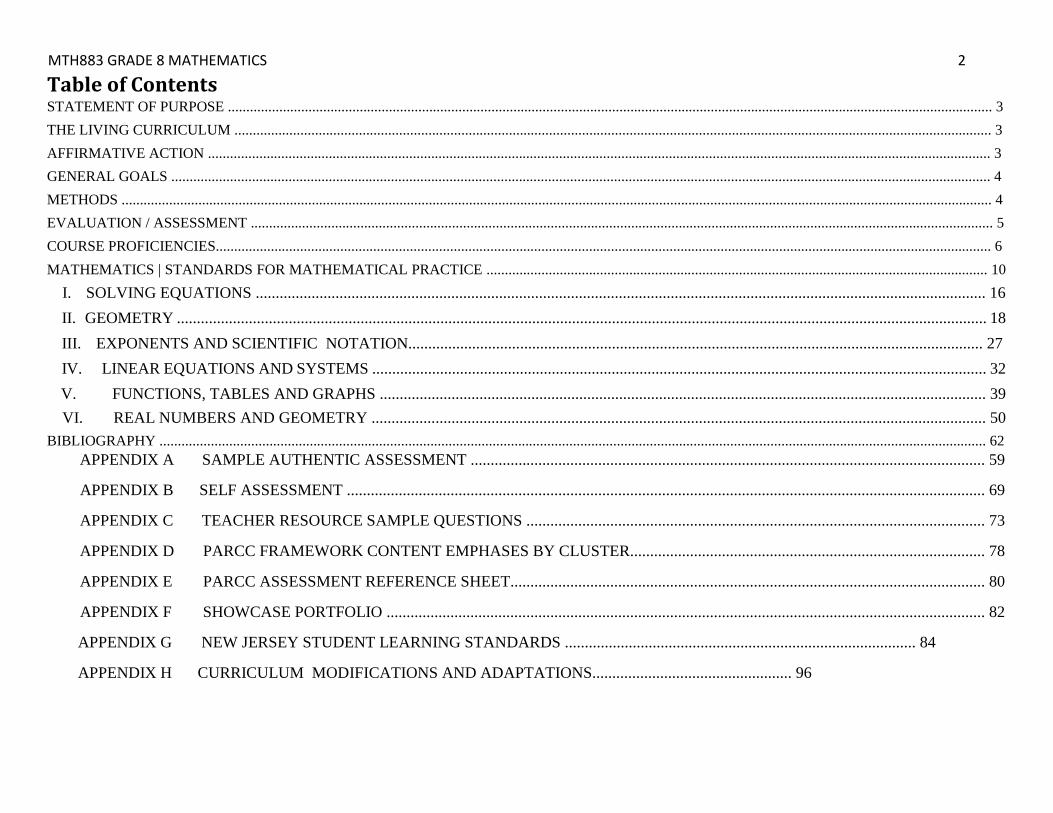
Table of Contents STATEMENT OF PURPOSE ................................................................................................................................................................................................................. 3 THE LIVING CURRICULUM ............................................................................................................................................................................................................... 3 AFFIRMATIVE ACTION ...................................................................................................................................................................................................................... 3 GENERAL GOALS ................................................................................................................................................................................................................................ 4 METHODS .............................................................................................................................................................................................................................................. 4 EVALUATION / ASSESSMENT ........................................................................................................................................................................................................... 5 COURSE PROFICIENCIES.................................................................................................................................................................................................................... 6 MATHEMATICS | STANDARDS FOR MATHEMATICAL PRACTICE ......................................................................................................................................... 10
I. SOLVING EQUATIONS ....................................................................................................................................................................................... 16
II. GEOMETRY ........................................................................................................................................................................................................... 18
III. EXPONENTS AND SCIENTIFIC NOTATION................................................................................................................................................ 27
IV. LINEAR EQUATIONS AND SYSTEMS .......................................................................................................................................................... 32
V. FUNCTIONS, TABLES AND GRAPHS ........................................................................................................................................................ 39 VI. REAL NUMBERS AND GEOMETRY .......................................................................................................................................................... 50
BIBLIOGRAPHY .................................................................................................................................................................................................................................. 62 APPENDIX A SAMPLE AUTHENTIC ASSESSMENT ................................................................................................................................. 59
APPENDIX B SELF ASSESSMENT ................................................................................................................................................................ 69
APPENDIX C TEACHER RESOURCE SAMPLE QUESTIONS ................................................................................................................... 73
APPENDIX D PARCC FRAMEWORK CONTENT EMPHASES BY CLUSTER......................................................................................... 78
APPENDIX E PARCC ASSESSMENT REFERENCE SHEET....................................................................................................................... 80
APPENDIX F SHOWCASE PORTFOLIO ...................................................................................................................................................... 82
APPENDIX G NEW JERSEY STUDENT LEARNING STANDARDS ........................................................................................ 84
APPENDIX H CURRICULUM MODIFICATIONS AND ADAPTATIONS.................................................. 96

MTH883 GRADE 8 MATHEMATICS 3
STATEMENT OF PURPOSE The purpose of this course, the third in the three-year middle school sequence, is to prepare students for higher level mathematics. It is aligned with the New Jersey Student Learning Standards for Mathematics and the New Jersey Student Learning Standards for Technology. Separately we assess students to gauge progress and inform instruction. Benchmark assessments for students in grades 6 through 8 are administered once per quarter.
THE LIVING CURRICULUM Curriculum guides are designed to be working documents. Teachers are encouraged to make notes in the margins. Written comments can serve as the basis for future revisions. In addition, the teachers and administrators are invited to discuss elements of the guides as implemented in the classroom and to work collaboratively to develop recommendations for curriculum reforms as needed.
AFFIRMATIVE ACTION During the development of this course of study, particular attention was paid to material, which might discriminate on the basis of sex, race, religion, national origin, or creed. Every effort has been made to uphold both the letter and spirit of affirmative action mandates as applied to the content, the texts and the instruction inherent in this course.
MODIFICATIONS AND ADAPTATIONS
For guidelines on how to modify and adapt curricula to best meet the needs of all students, instructional staff should refer to the Curriculum Modifications and Adaptations included as an Appendix in this curriculum. Instructional staff of students with Individualized Education Plans (IEPs) must adhere to the recommended modifications outlined in each individual plan.

MTH883 GRADE 8 MATHEMATICS 4
GENERAL GOALS The students will:
1. develop mathematical proficiency at the level required for successful completion of classroom, district, and state assessments such as the PARCC.
2. develop organizational and time management skills.
3. develop critical thinking and problem solving skills.
4. develop critical reading skills. 5. communicate ideas clearly through oral and written assessment.
6. work cooperatively with others.
7. use technology to gather, analyze and communicate mathematical information. 8. use self-assessment to identify their mathematical strengths and weaknesses and to help foster a better understanding of the concepts being
taught.
METHODS This course has been designed to further student understanding of mathematical concepts in each of five areas identified by the Common Core State Standards (CCSS) as critical in Grade 8: The Number System, Expressions & Equations, Functions, Statistics & Probability, and Geometry. Real-life problems and concrete representations of concepts will form the center of lessons that will implement this integration. The Common Core State Standards (CCSS) and the New Jersey Core Curriculum Content Standards for Technological Literacy (NJCCCS/TL) endorse the use of manipulatives, cooperative learning and technology as a means to effectively communicate mathematical ideas. A variety of assessment strategies, including open-ended problems, projects, and journals/portfolios in combination with traditional methods will provide a complete picture of student performance and progress.

MTH883 GRADE 8 MATHEMATICS 5 Questioning that is representative of conceptual understanding, application and written explanations such as those found on the NJASK and PARCC state assessment are methodologies that help the teacher assess student understanding of concepts. Throughout the entirety of this course, the students will demonstrate many of the technology literacy standards, 8.1, that are implemented within classroom activities that are integrated into the curriculum.
EVALUATION / ASSESSMENT
Marking Period Grades are determined according to Departmental and District Policy, the components of which are outlined below: SUMMATIVE (long or short term) Assessments = 80% These may include one or more of the following:
• Publisher prepared assessments and/or worksheets • Teacher prepared assessments and/or worksheets • Student Corrections / Aftermath • Authentic Assessments • Technology applications • Projects • Journals • Reports • Labs
FORMATIVE (daily or periodic) Assessments = 20% These may include one or more of the following:
• Homework • Do Now / Exit Questions • Problem Solving • Classwork • Journal Writing • Notebook – checks and open notebook assessments • Explorations • Activities using manipulatives • Problems of the Day (POD) Enrichment
MTH883 GRADE 8 MATHEMATICS 6
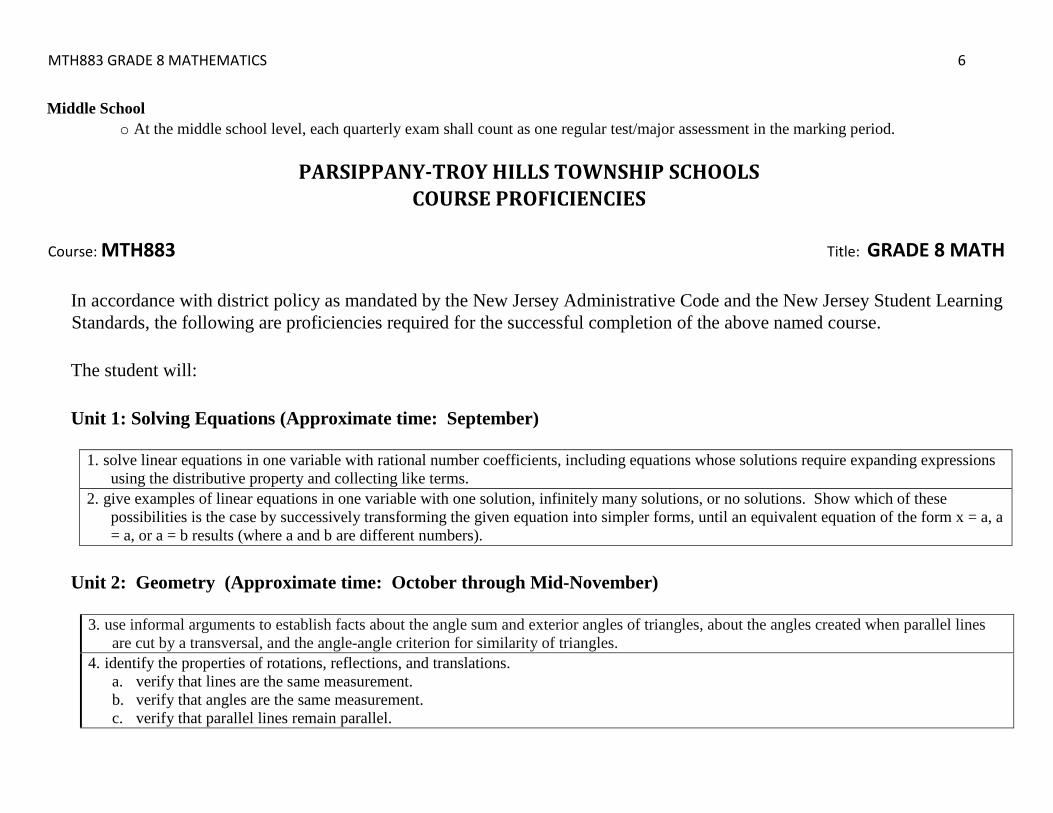
Middle School o At the middle school level, each quarterly exam shall count as one regular test/major assessment in the marking period.
PARSIPPANY-TROY HILLS TOWNSHIP SCHOOLS COURSE PROFICIENCIES
Course: MTH883 Title: GRADE 8 MATH
In accordance with district policy as mandated by the New Jersey Administrative Code and the New Jersey Student Learning Standards, the following are proficiencies required for the successful completion of the above named course.
The student will:
Unit 1: Solving Equations (Approximate time: September)
1. solve linear equations in one variable with rational number coefficients, including equations whose solutions require expanding expressions using the distributive property and collecting like terms.
2. give examples of linear equations in one variable with one solution, infinitely many solutions, or no solutions. Show which of these possibilities is the case by successively transforming the given equation into simpler forms, until an equivalent equation of the form x = a, a = a, or a = b results (where a and b are different numbers).
Unit 2: Geometry (Approximate time: October through Mid-November)
3. use informal arguments to establish facts about the angle sum and exterior angles of triangles, about the angles created when parallel lines are cut by a transversal, and the angle-angle criterion for similarity of triangles.
4. identify the properties of rotations, reflections, and translations. a. verify that lines are the same measurement. b. verify that angles are the same measurement. c. verify that parallel lines remain parallel.
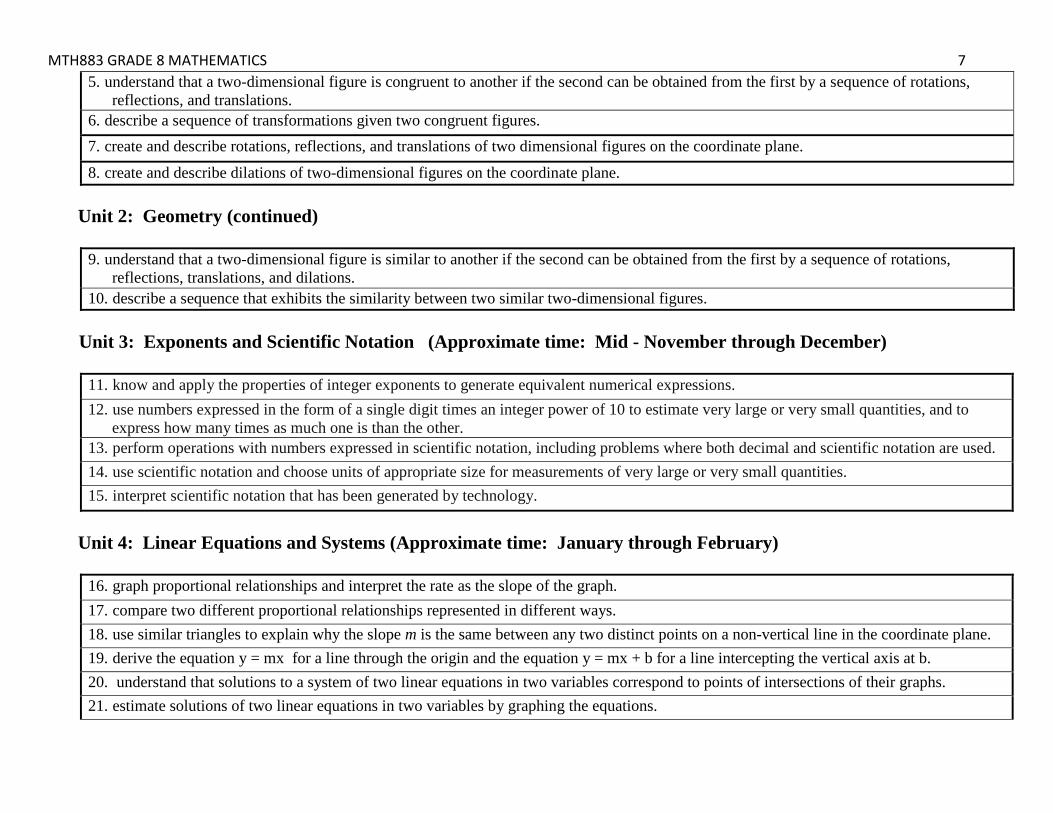
MTH883 GRADE 8 MATHEMATICS 7 5. understand that a two-dimensional figure is congruent to another if the second can be obtained from the first by a sequence of rotations,
reflections, and translations. 6. describe a sequence of transformations given two congruent figures. 7. create and describe rotations, reflections, and translations of two dimensional figures on the coordinate plane.
8. create and describe dilations of two-dimensional figures on the coordinate plane. Unit 2: Geometry (continued)
9. understand that a two-dimensional figure is similar to another if the second can be obtained from the first by a sequence of rotations,
reflections, translations, and dilations. 10. describe a sequence that exhibits the similarity between two similar two-dimensional figures.
Unit 3: Exponents and Scientific Notation (Approximate time: Mid - November through December)
11. know and apply the properties of integer exponents to generate equivalent numerical expressions. 12. use numbers expressed in the form of a single digit times an integer power of 10 to estimate very large or very small quantities, and to
express how many times as much one is than the other. 13. perform operations with numbers expressed in scientific notation, including problems where both decimal and scientific notation are used. 14. use scientific notation and choose units of appropriate size for measurements of very large or very small quantities. 15. interpret scientific notation that has been generated by technology.
Unit 4: Linear Equations and Systems (Approximate time: January through February)
16. graph proportional relationships and interpret the rate as the slope of the graph. 17. compare two different proportional relationships represented in different ways. 18. use similar triangles to explain why the slope m is the same between any two distinct points on a non-vertical line in the coordinate plane. 19. derive the equation y = mx for a line through the origin and the equation y = mx + b for a line intercepting the vertical axis at b. 20. understand that solutions to a system of two linear equations in two variables correspond to points of intersections of their graphs. 21. estimate solutions of two linear equations in two variables by graphing the equations.

MTH883 GRADE 8 MATHEMATICS 8 22. solve systems of two linear equations in two variables algebraically. 23. solve real-world and mathematical problems leading to two linear equations in two variables.
Unit 5: Functions, Tables, and Graphs (Approximate time: March through April)
24. understand that a function is a rule that assigns to each input exactly one output. 25. recognize that a graph of a function is the set of ordered pairs consisting of an input and corresponding output. 26. interpret the equation y=mx + b as defining a linear function and list examples of functions that are not linear. 27. construct a function to model a linear relationship between two quantities by determining and interpreting the rate of change and initial
value of the function from a description of the situation, from two (x, y) values, from a table, or from a graph. 28. compare properties of two functions each represented in a different way (algebraically, graphically, numerically in tables, or by verbal
descriptions). 29. describe qualitatively the functional relationship between two quantities by analyzing a graph (e.g. where the function is increasing or
decreasing, linear or non-linear). 30. sketch a graph that exhibits the qualitative features of a function that has been described in words. 31. construct and interpret scatter plots for bivariate measurement data. 32. using scatter plots, describe patterns such as clustering, outliers, positive or negative association, linear association, and non-linear
association. 33. know that straight lines are widely used to model relationships between two quantitative variables. 34. use the equation of a linear model to solve problems in the context of bivariate measurement data, interpreting the slope and intercept. 35. understand that patterns of association can also be seen in bivariate categorical data by displaying frequencies and relative frequencies in a
two way-table. 36. construct and interpret a two-way table summarizing data on two categorical variables collected from the same subjects; Use relative
frequencies calculated for rows or columns to describe possible association between two variables. Unit 6: Real Numbers and Geometry (Approximate time: May through June)
37. know that numbers that are not rational are called irrational.

MTH883 GRADE 8 MATHEMATICS 9 38. understand informally that every number has a decimal expansion; for rational numbers show that the decimal expansion repeats eventually,
and convert a decimal expansion, which repeats eventually into a rational number. 39. use rational approximations of irrational numbers to locate them on the number line. 40. use rational approximations of irrational numbers to compare the size of irrational numbers and estimate the value of expressions. 41. evaluate square roots of small perfect squares and cube roots of small perfect cubes.
42. use square root and cube root symbols to represent solutions to equations of the form x2 = p and x3 = p, where p is a positive rational number. 43. explain a proof of the Pythagorean Theorem and its converse. 44. apply the Pythagorean Theorem to determine unknown side lengths in right triangles in real-world and mathematical problems in two and
three dimensions. 45. apply the Pythagorean Theorem to find the distance between two points in a coordinate system. 46. know the formulas for the volumes of cones, cylinders, and spheres and use them to solve real- world and mathematical problems.
MTH883 GRADE 8 MATHEMATICS 10
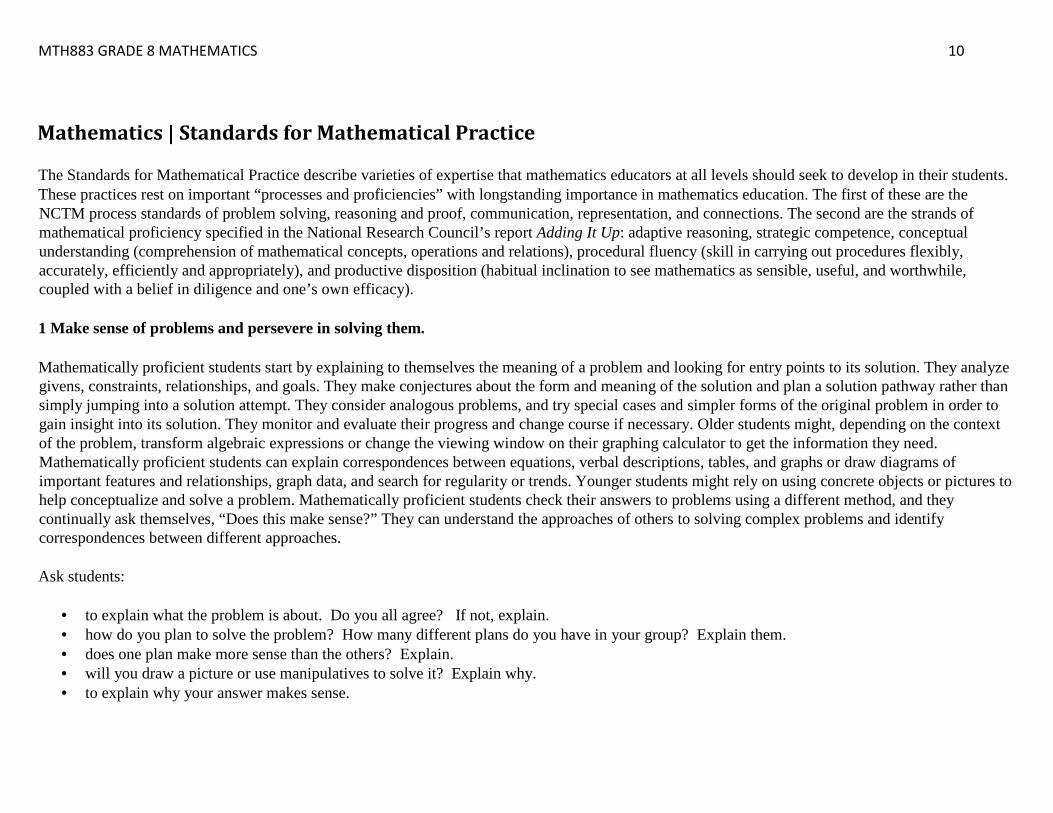
Mathematics | Standards for Mathematical Practice The Standards for Mathematical Practice describe varieties of expertise that mathematics educators at all levels should seek to develop in their students. These practices rest on important “processes and proficiencies” with longstanding importance in mathematics education. The first of these are the NCTM process standards of problem solving, reasoning and proof, communication, representation, and connections. The second are the strands of mathematical proficiency specified in the National Research Council’s report Adding It Up: adaptive reasoning, strategic competence, conceptual understanding (comprehension of mathematical concepts, operations and relations), procedural fluency (skill in carrying out procedures flexibly, accurately, efficiently and appropriately), and productive disposition (habitual inclination to see mathematics as sensible, useful, and worthwhile, coupled with a belief in diligence and one’s own efficacy). 1 Make sense of problems and persevere in solving them. Mathematically proficient students start by explaining to themselves the meaning of a problem and looking for entry points to its solution. They analyze givens, constraints, relationships, and goals. They make conjectures about the form and meaning of the solution and plan a solution pathway rather than simply jumping into a solution attempt. They consider analogous problems, and try special cases and simpler forms of the original problem in order to gain insight into its solution. They monitor and evaluate their progress and change course if necessary. Older students might, depending on the context of the problem, transform algebraic expressions or change the viewing window on their graphing calculator to get the information they need. Mathematically proficient students can explain correspondences between equations, verbal descriptions, tables, and graphs or draw diagrams of important features and relationships, graph data, and search for regularity or trends. Younger students might rely on using concrete objects or pictures to help conceptualize and solve a problem. Mathematically proficient students check their answers to problems using a different method, and they continually ask themselves, “Does this make sense?” They can understand the approaches of others to solving complex problems and identify correspondences between different approaches. Ask students:
• to explain what the problem is about. Do you all agree? If not, explain. • how do you plan to solve the problem? How many different plans do you have in your group? Explain them. • does one plan make more sense than the others? Explain. • will you draw a picture or use manipulatives to solve it? Explain why. • to explain why your answer makes sense.
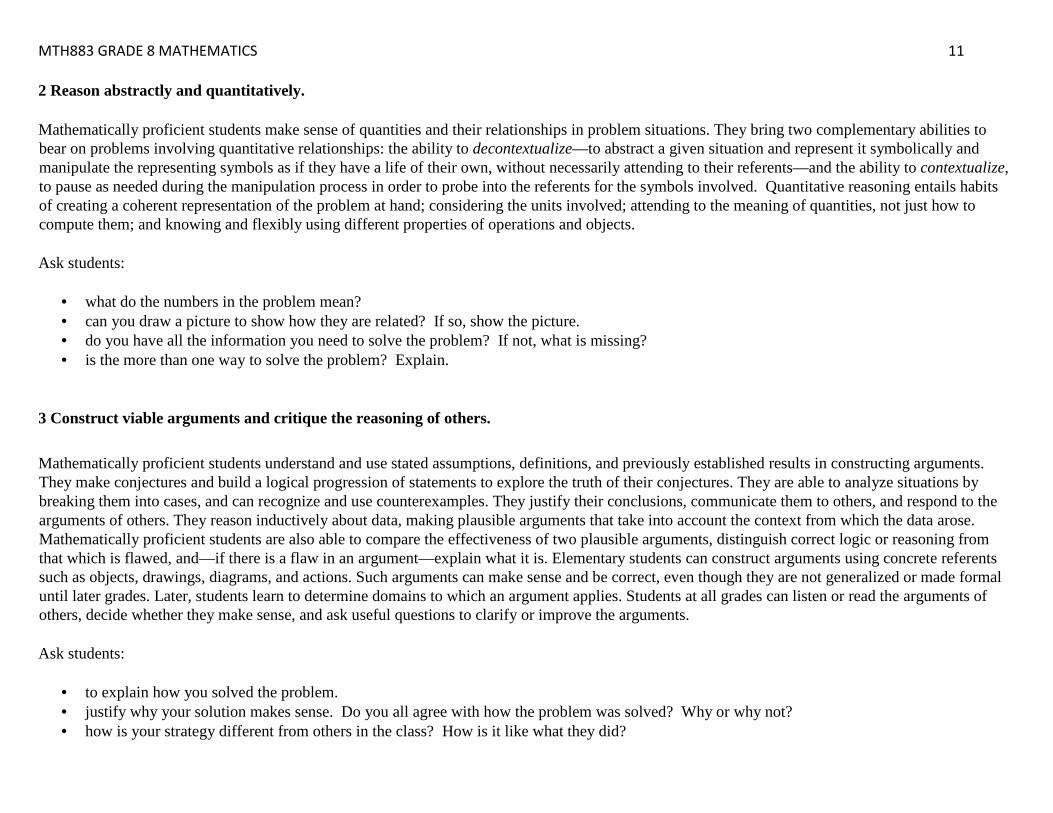
MTH883 GRADE 8 MATHEMATICS 11 2 Reason abstractly and quantitatively. Mathematically proficient students make sense of quantities and their relationships in problem situations. They bring two complementary abilities to bear on problems involving quantitative relationships: the ability to decontextualize—to abstract a given situation and represent it symbolically and manipulate the representing symbols as if they have a life of their own, without necessarily attending to their referents—and the ability to contextualize, to pause as needed during the manipulation process in order to probe into the referents for the symbols involved. Quantitative reasoning entails habits of creating a coherent representation of the problem at hand; considering the units involved; attending to the meaning of quantities, not just how to compute them; and knowing and flexibly using different properties of operations and objects. Ask students:
• what do the numbers in the problem mean? • can you draw a picture to show how they are related? If so, show the picture. • do you have all the information you need to solve the problem? If not, what is missing? • is the more than one way to solve the problem? Explain.
3 Construct viable arguments and critique the reasoning of others. Mathematically proficient students understand and use stated assumptions, definitions, and previously established results in constructing arguments. They make conjectures and build a logical progression of statements to explore the truth of their conjectures. They are able to analyze situations by breaking them into cases, and can recognize and use counterexamples. They justify their conclusions, communicate them to others, and respond to the arguments of others. They reason inductively about data, making plausible arguments that take into account the context from which the data arose. Mathematically proficient students are also able to compare the effectiveness of two plausible arguments, distinguish correct logic or reasoning from that which is flawed, and—if there is a flaw in an argument—explain what it is. Elementary students can construct arguments using concrete referents such as objects, drawings, diagrams, and actions. Such arguments can make sense and be correct, even though they are not generalized or made formal until later grades. Later, students learn to determine domains to which an argument applies. Students at all grades can listen or read the arguments of others, decide whether they make sense, and ask useful questions to clarify or improve the arguments. Ask students:
• to explain how you solved the problem. • justify why your solution makes sense. Do you all agree with how the problem was solved? Why or why not? • how is your strategy different from others in the class? How is it like what they did?
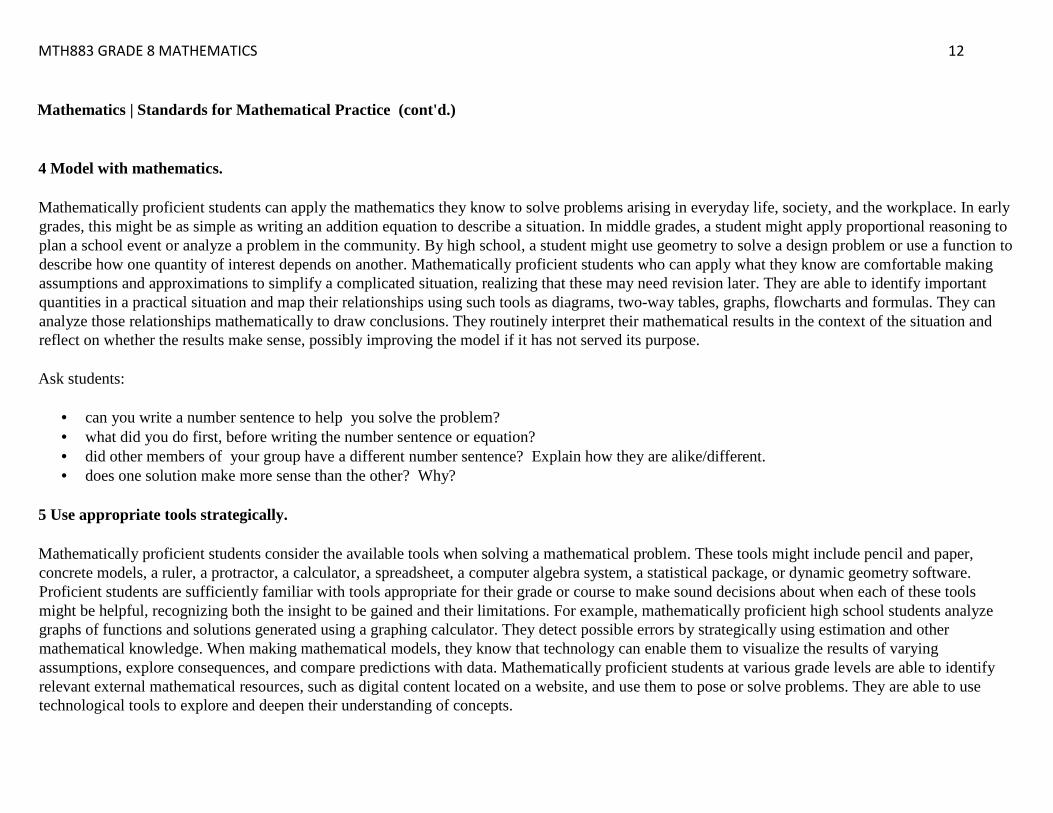
MTH883 GRADE 8 MATHEMATICS 12 Mathematics | Standards for Mathematical Practice (cont'd.) 4 Model with mathematics. Mathematically proficient students can apply the mathematics they know to solve problems arising in everyday life, society, and the workplace. In early grades, this might be as simple as writing an addition equation to describe a situation. In middle grades, a student might apply proportional reasoning to plan a school event or analyze a problem in the community. By high school, a student might use geometry to solve a design problem or use a function to describe how one quantity of interest depends on another. Mathematically proficient students who can apply what they know are comfortable making assumptions and approximations to simplify a complicated situation, realizing that these may need revision later. They are able to identify important quantities in a practical situation and map their relationships using such tools as diagrams, two-way tables, graphs, flowcharts and formulas. They can analyze those relationships mathematically to draw conclusions. They routinely interpret their mathematical results in the context of the situation and reflect on whether the results make sense, possibly improving the model if it has not served its purpose. Ask students:
• can you write a number sentence to help you solve the problem? • what did you do first, before writing the number sentence or equation? • did other members of your group have a different number sentence? Explain how they are alike/different. • does one solution make more sense than the other? Why?
5 Use appropriate tools strategically. Mathematically proficient students consider the available tools when solving a mathematical problem. These tools might include pencil and paper, concrete models, a ruler, a protractor, a calculator, a spreadsheet, a computer algebra system, a statistical package, or dynamic geometry software. Proficient students are sufficiently familiar with tools appropriate for their grade or course to make sound decisions about when each of these tools might be helpful, recognizing both the insight to be gained and their limitations. For example, mathematically proficient high school students analyze graphs of functions and solutions generated using a graphing calculator. They detect possible errors by strategically using estimation and other mathematical knowledge. When making mathematical models, they know that technology can enable them to visualize the results of varying assumptions, explore consequences, and compare predictions with data. Mathematically proficient students at various grade levels are able to identify relevant external mathematical resources, such as digital content located on a website, and use them to pose or solve problems. They are able to use technological tools to explore and deepen their understanding of concepts.
MTH883 GRADE 8 MATHEMATICS 13 Ask students:
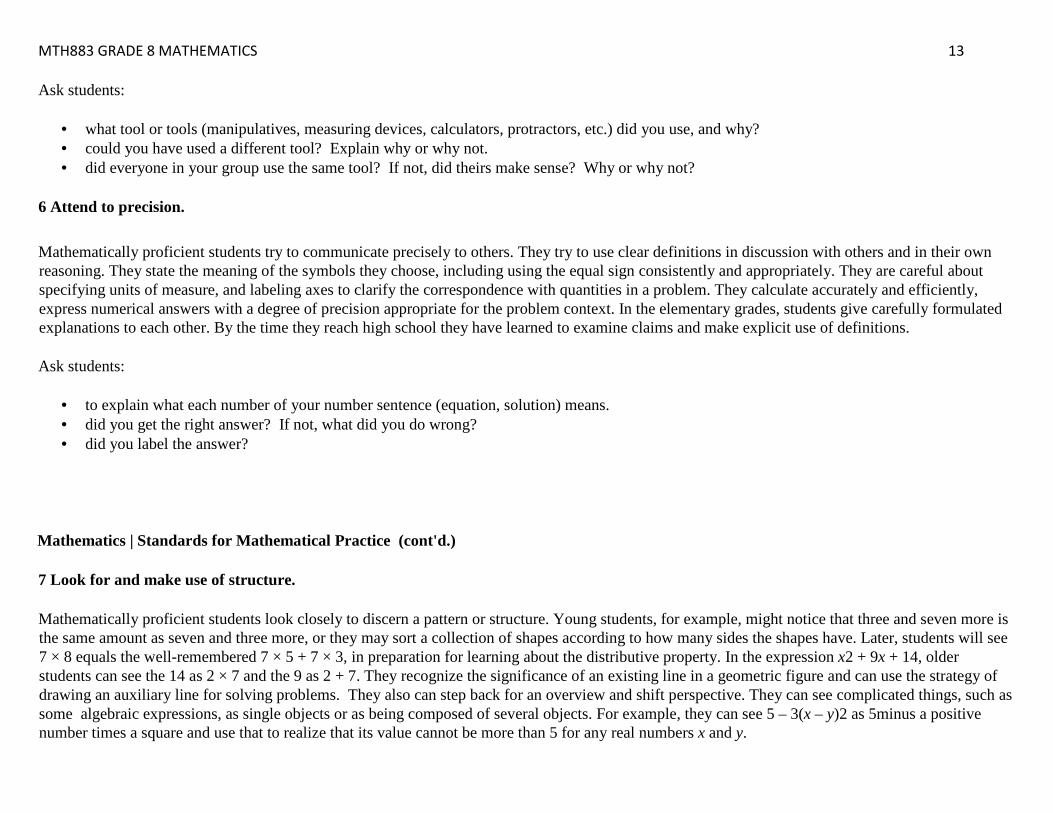
• what tool or tools (manipulatives, measuring devices, calculators, protractors, etc.) did you use, and why? • could you have used a different tool? Explain why or why not. • did everyone in your group use the same tool? If not, did theirs make sense? Why or why not?
6 Attend to precision. Mathematically proficient students try to communicate precisely to others. They try to use clear definitions in discussion with others and in their own reasoning. They state the meaning of the symbols they choose, including using the equal sign consistently and appropriately. They are careful about specifying units of measure, and labeling axes to clarify the correspondence with quantities in a problem. They calculate accurately and efficiently, express numerical answers with a degree of precision appropriate for the problem context. In the elementary grades, students give carefully formulated explanations to each other. By the time they reach high school they have learned to examine claims and make explicit use of definitions. Ask students:
• to explain what each number of your number sentence (equation, solution) means. • did you get the right answer? If not, what did you do wrong? • did you label the answer?
Mathematics | Standards for Mathematical Practice (cont'd.) 7 Look for and make use of structure. Mathematically proficient students look closely to discern a pattern or structure. Young students, for example, might notice that three and seven more is the same amount as seven and three more, or they may sort a collection of shapes according to how many sides the shapes have. Later, students will see 7 × 8 equals the well-remembered 7 × 5 + 7 × 3, in preparation for learning about the distributive property. In the expression x2 + 9x + 14, older students can see the 14 as 2 × 7 and the 9 as 2 + 7. They recognize the significance of an existing line in a geometric figure and can use the strategy of drawing an auxiliary line for solving problems. They also can step back for an overview and shift perspective. They can see complicated things, such as some algebraic expressions, as single objects or as being composed of several objects. For example, they can see 5 – 3(x – y)2 as 5minus a positive number times a square and use that to realize that its value cannot be more than 5 for any real numbers x and y.
MTH883 GRADE 8 MATHEMATICS 14 Ask students:
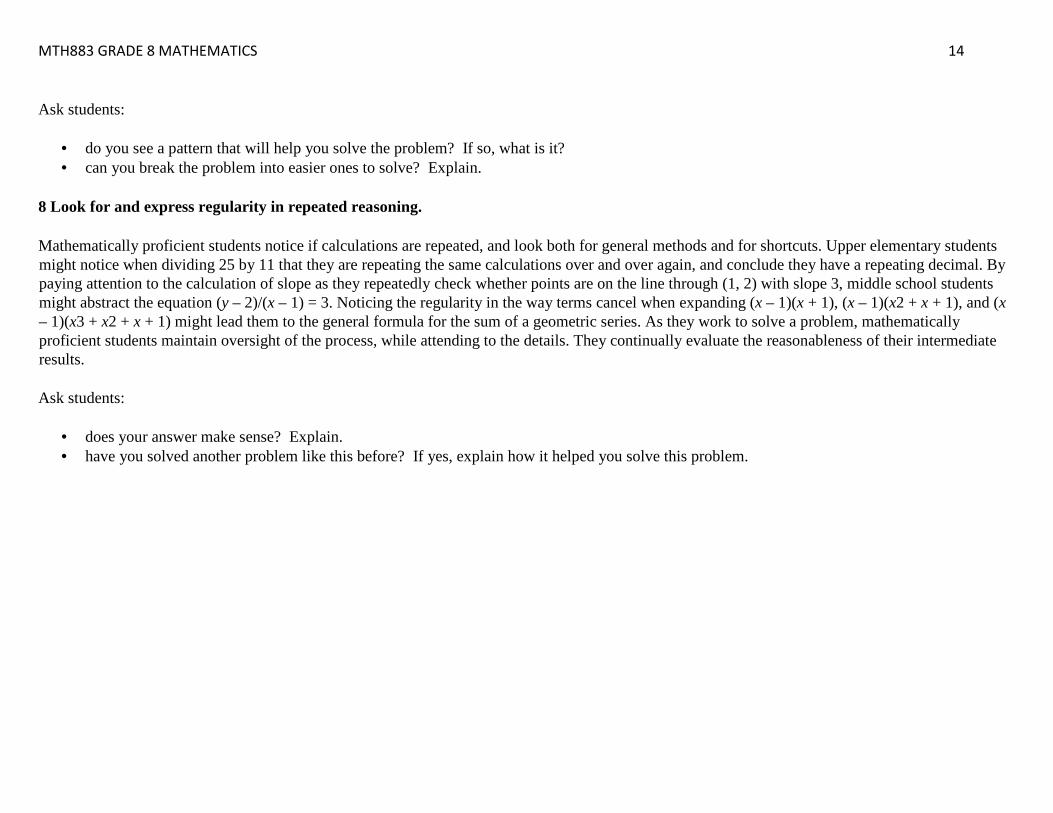
• do you see a pattern that will help you solve the problem? If so, what is it? • can you break the problem into easier ones to solve? Explain.
8 Look for and express regularity in repeated reasoning. Mathematically proficient students notice if calculations are repeated, and look both for general methods and for shortcuts. Upper elementary students might notice when dividing 25 by 11 that they are repeating the same calculations over and over again, and conclude they have a repeating decimal. By paying attention to the calculation of slope as they repeatedly check whether points are on the line through (1, 2) with slope 3, middle school students might abstract the equation (y – 2)/(x – 1) = 3. Noticing the regularity in the way terms cancel when expanding (x – 1)(x + 1), (x – 1)(x2 + x + 1), and (x – 1)(x3 + x2 + x + 1) might lead them to the general formula for the sum of a geometric series. As they work to solve a problem, mathematically proficient students maintain oversight of the process, while attending to the details. They continually evaluate the reasonableness of their intermediate results. Ask students:
• does your answer make sense? Explain. • have you solved another problem like this before? If yes, explain how it helped you solve this problem.

MTH883 GRADE 8 MATHEMATICS 15
Connecting the Standards for Mathematical Practice to the Standards for Mathematical Content The Standards for Mathematical Practice describe ways in which developing student practitioners of the discipline of mathematics increasingly ought to engage with the subject matter as they grow in mathematical maturity and expertise throughout the elementary, middle and high school years. Designers of curricula, assessments, and professional development should all attend to the need to connect the mathematical practices to mathematical content in mathematics instruction. The Standards for Mathematical Content are a balanced combination of procedure and understanding. Expectations that begin with the word “understand” are often especially good opportunities to connect the practices to the content. Students who lack understanding of a topic may rely on procedures too heavily. Without a flexible base from which to work, they may be less likely to consider analogous problems, represent problems coherently, justify conclusions, apply the mathematics to practical situations, use technology mindfully to work with the mathematics, explain the mathematics accurately to other students, step back for an overview, or deviate from a known procedure to find a shortcut. In short, a lack of understanding effectively prevents a student from engaging in the mathematical practices. In this respect, those content standards which set an expectation of understanding are potential “points of intersection” between the Standards for Mathematical Content and the Standards for Mathematical Practice. These points of intersection are intended to be weighted toward central and generative concepts in the school mathematics curriculum that most merit the time, resources, innovative energies, and focus necessary to qualitatively improve the curriculum, instruction, assessment, professional development, and student achievement in mathematics. High School Common Core State Standards The high school standards call on students to practice applying mathematical ways of thinking to real world issues and challenges; they prepare students to think and reason mathematically. The high school standards set a rigorous definition of college and career readiness, by helping students develop a depth of understanding and ability to apply mathematics to novel situations, as college students and employees regularly do. The high school standards emphasize mathematical modeling, the use of mathematics and statistics to analyze empirical situations, understand them better, and improve decisions. For example, the draft standards state: Modeling links classroom mathematics and statistics to everyday life, work, and decision-making. It is the process of choosing and using appropriate mathematics and statistics to analyze empirical situations, to understand them better, and to improve decisions. Quantities and their relationships in physical, economic, public policy, social and everyday situations can be modeled using mathematical and statistical methods. When making mathematical models, technology is valuable for varying assumptions, exploring consequences, and comparing predictions with data.
MTH883 GRADE 8 MATHEMATICS 16
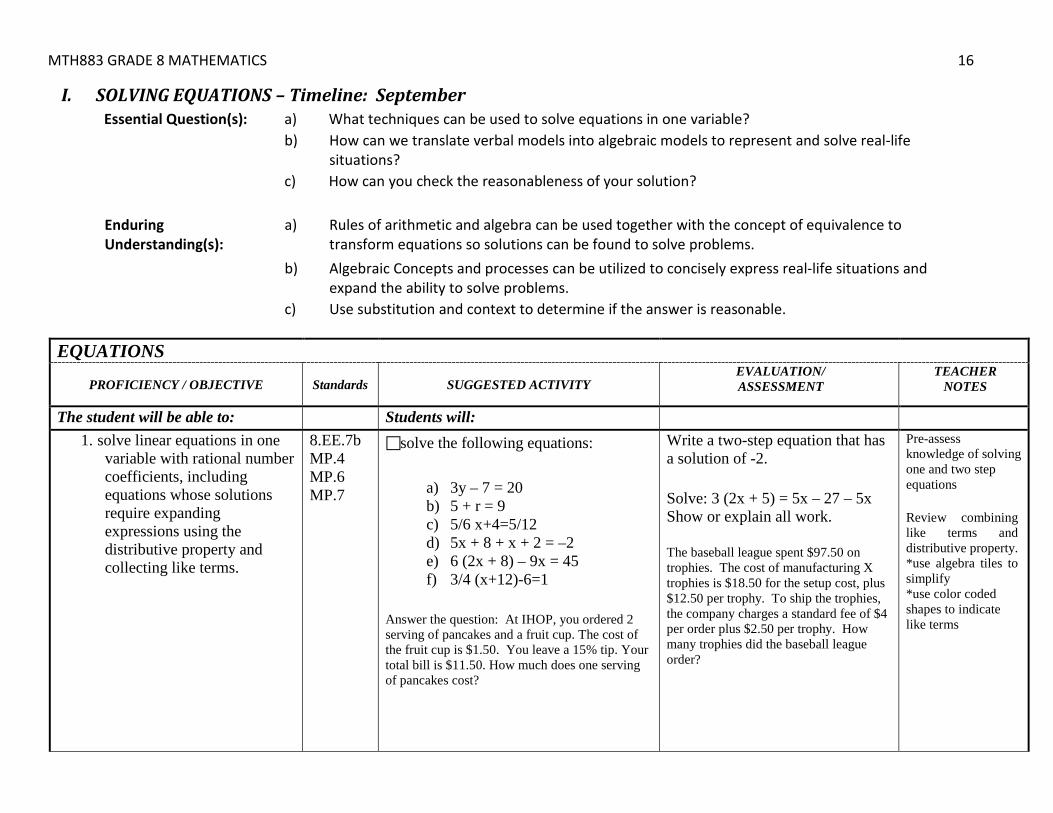
I. SOLVING EQUATIONS – Timeline: September Essential Question(s): a) What techniques can be used to solve equations in one variable? b) How can we translate verbal models into algebraic models to represent and solve real-life
situations? c)
How can you check the reasonableness of your solution?
Enduring Understanding(s):
a) Rules of arithmetic and algebra can be used together with the concept of equivalence to transform equations so solutions can be found to solve problems.
b) Algebraic Concepts and processes can be utilized to concisely express real-life situations and expand the ability to solve problems.
c) Use substitution and context to determine if the answer is reasonable. EQUATIONS
PROFICIENCY / OBJECTIVE Standards SUGGESTED ACTIVITY EVALUATION/ ASSESSMENT
TEACHER NOTES
The student will be able to: Students will:
1. solve linear equations in one variable with rational number coefficients, including equations whose solutions require expanding expressions using the distributive property and collecting like terms.
8.EE.7b MP.4 MP.6 MP.7
solve the following equations:
a) 3y – 7 = 20 b) 5 + r = 9 c) 5/6 x+4=5/12 d) 5x + 8 + x + 2 = –2 e) 6 (2x + 8) – 9x = 45 f) 3/4 (x+12)-6=1
Answer the question: At IHOP, you ordered 2 serving of pancakes and a fruit cup. The cost of the fruit cup is $1.50. You leave a 15% tip. Your total bill is $11.50. How much does one serving of pancakes cost?
Write a two-step equation that has a solution of -2. Solve: 3 (2x + 5) = 5x – 27 – 5x Show or explain all work. The baseball league spent $97.50 on trophies. The cost of manufacturing X trophies is $18.50 for the setup cost, plus $12.50 per trophy. To ship the trophies, the company charges a standard fee of $4 per order plus $2.50 per trophy. How many trophies did the baseball league order?
Pre-assess knowledge of solving one and two step equations Review combining like terms and distributive property. *use algebra tiles to simplify *use color coded shapes to indicate like terms
MTH883 GRADE 8 MATHEMATICS 17 EQUATIONS
PROFICIENCY / OBJECTIVE Standards SUGGESTED ACTIVITY EVALUATION/ ASSESSMENT TEACHER NOTES
The student will be able to: Students will:
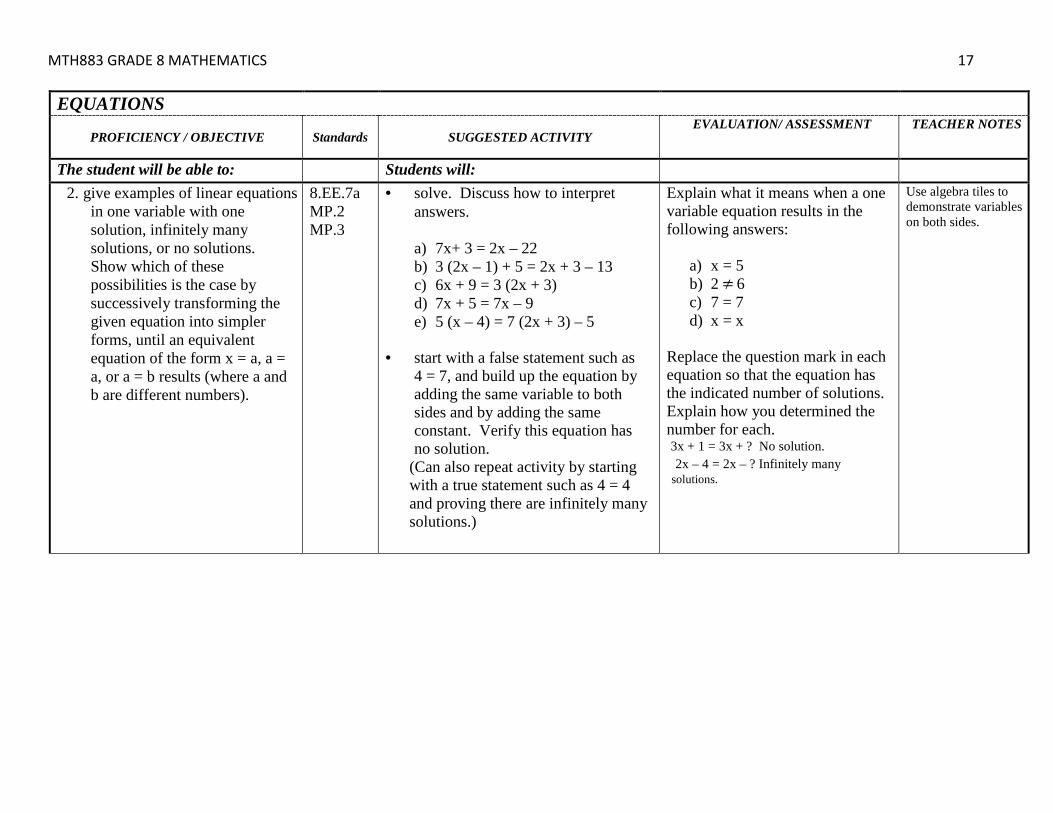
2. give examples of linear equations in one variable with one solution, infinitely many solutions, or no solutions. Show which of these possibilities is the case by successively transforming the given equation into simpler forms, until an equivalent equation of the form x = a, a = a, or a = b results (where a and b are different numbers).
8.EE.7a MP.2 MP.3
• solve. Discuss how to interpret answers.
a) 7x+ 3 = 2x – 22 b) 3 (2x – 1) + 5 = 2x + 3 – 13 c) 6x + 9 = 3 (2x + 3) d) 7x + 5 = 7x – 9 e) 5 (x – 4) = 7 (2x + 3) – 5
• start with a false statement such as
4 = 7, and build up the equation by adding the same variable to both sides and by adding the same constant. Verify this equation has no solution.
(Can also repeat activity by starting with a true statement such as 4 = 4 and proving there are infinitely many solutions.)
Explain what it means when a one variable equation results in the following answers:
a) x = 5 b) 2 6 c) 7 = 7 d) x = x
Replace the question mark in each equation so that the equation has the indicated number of solutions. Explain how you determined the number for each. 3x + 1 = 3x + ? No solution. 2x – 4 = 2x – ? Infinitely many solutions.
Use algebra tiles to demonstrate variables on both sides.

MTH883 GRADE 8 MATHEMATICS 18
II. GEOMETRY – Timeline: October through Mid-November
Essential Question(s): a) What properties of a figure are preserved under mathematical transformations? b) How do geometric relationships help us to solve problems? c) What is the difference between congruence and similarity? d) How can you describe the relationship among lines and angles? Enduring Understanding(s):
a) Shape, size, perimeter, and area are preserved during translations, reflections, and rotations. In dilations, only the shape remains the same.
b) Geometric relationships provide a means to make sense of geometric figures and can be used to construct geometric figures.
c) A constant ratio exists between corresponding lengths of sides of similar figures. d) Many congruent angles are created using parallel lines and transversals. The sum of the interior angels of
a triangle is 180 degrees. The measure of an exterior angle of a triangle is equal to the sum of the interior non-adjacent angles.

MTH883 GRADE 8 MATHEMATICS 19
GEOMETRY
CONTENT OUTLINE Standards SUGGESTED ACTIVITY EVALUATION/ ASSESSMENT
TEACHER NOTES
The student will be able to: Students will:
3. use informal arguments to establish facts about the angle sum and exterior angles of triangles, about the angles created when parallel lines are cut by a transversal, and the angle-angle criterion for similarity of triangles.
8.G.5 MP.3 MP.8
tear off the edges of a triangle. Arrange the new angles aligning the vertices to form a line, showing that angles in a triangle add to 180 degrees.
Given two angles of a triangle, students explain how to find the third angle. Find the angles in the triangle below.
MTH883 GRADE 8 MATHEMATICS 20
GEOMETRY
CONTENT OUTLINE Standards SUGGESTED ACTIVITY EVALUATION/ ASSESSMENT
TEACHER NOTES
The student will be able to: Students will:
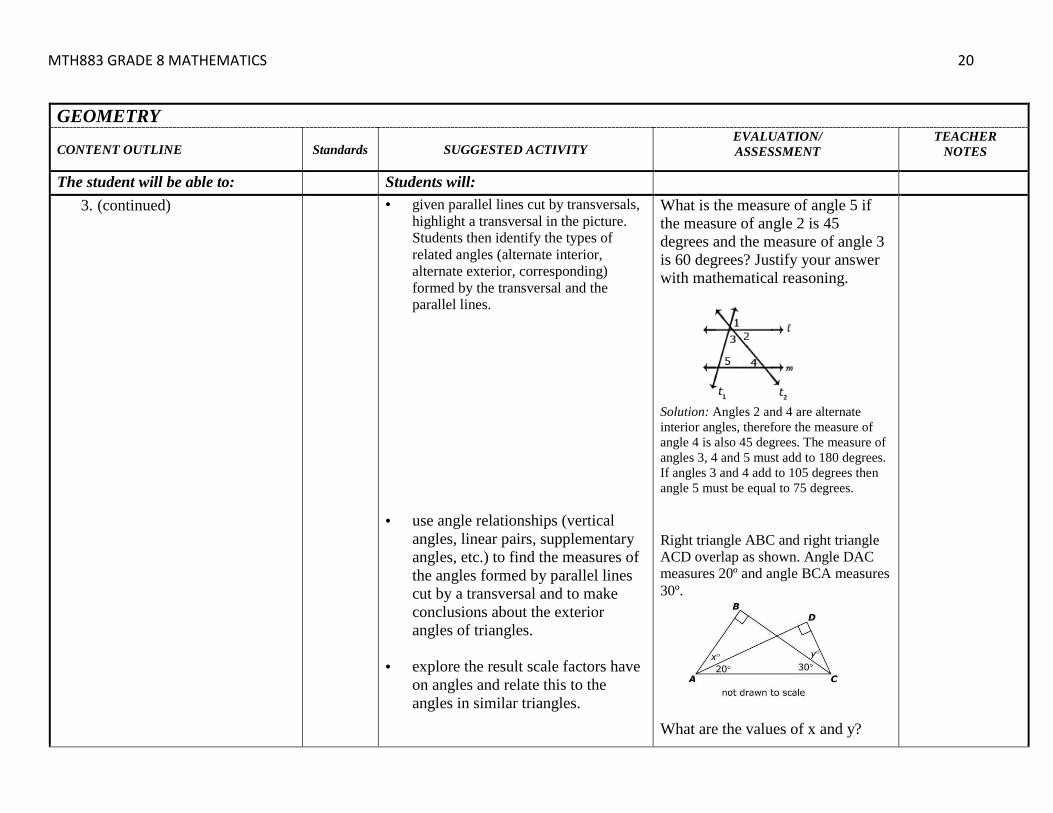
3. (continued)
• given parallel lines cut by transversals, highlight a transversal in the picture. Students then identify the types of related angles (alternate interior, alternate exterior, corresponding) formed by the transversal and the parallel lines.
• use angle relationships (vertical
angles, linear pairs, supplementary angles, etc.) to find the measures of the angles formed by parallel lines cut by a transversal and to make conclusions about the exterior angles of triangles.
• explore the result scale factors have on angles and relate this to the angles in similar triangles.
What is the measure of angle 5 if the measure of angle 2 is 45 degrees and the measure of angle 3 is 60 degrees? Justify your answer with mathematical reasoning.
Solution: Angles 2 and 4 are alternate interior angles, therefore the measure of angle 4 is also 45 degrees. The measure of angles 3, 4 and 5 must add to 180 degrees. If angles 3 and 4 add to 105 degrees then angle 5 must be equal to 75 degrees.
Right triangle ABC and right triangle ACD overlap as shown. Angle DAC measures 20º and angle BCA measures 30º.
What are the values of x and y?
MTH883 GRADE 8 MATHEMATICS 21 GEOMETRY
CONTENT OUTLINE Standards SUGGESTED ACTIVITY EVALUATION/ ASSESSMENT
TEACHER NOTES
The student will be able to: Students will:
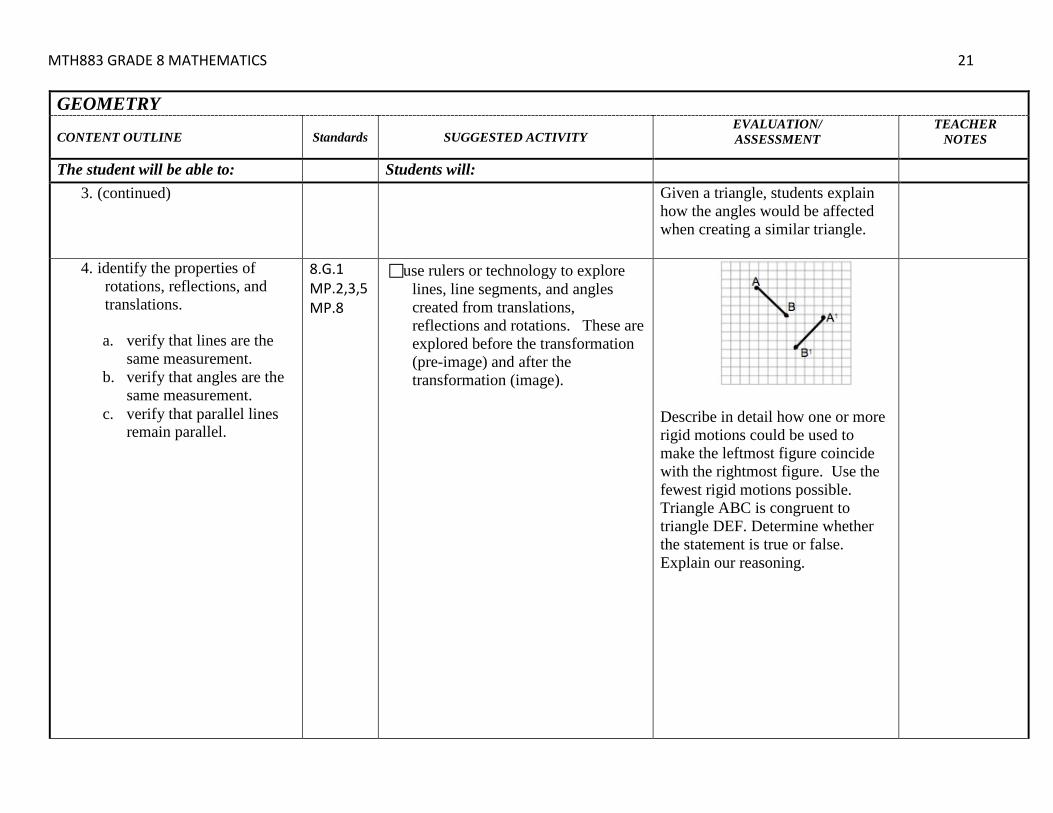
3. (continued) Given a triangle, students explain how the angles would be affected when creating a similar triangle.
4. identify the properties of rotations, reflections, and translations. a. verify that lines are the
same measurement. b. verify that angles are the
same measurement. c. verify that parallel lines
remain parallel.
8.G.1 MP.2,3,5 MP.8
use rulers or technology to explore lines, line segments, and angles created from translations, reflections and rotations. These are explored before the transformation (pre-image) and after the transformation (image).
Describe in detail how one or more rigid motions could be used to make the leftmost figure coincide with the rightmost figure. Use the fewest rigid motions possible. Triangle ABC is congruent to triangle DEF. Determine whether the statement is true or false. Explain our reasoning.
MTH883 GRADE 8 MATHEMATICS 22
GEOMETRY
CONTENT OUTLINE Standards SUGGESTED ACTIVITY EVALUATION/ ASSESSMENT
TEACHER NOTES
The student will be able to: Students will:
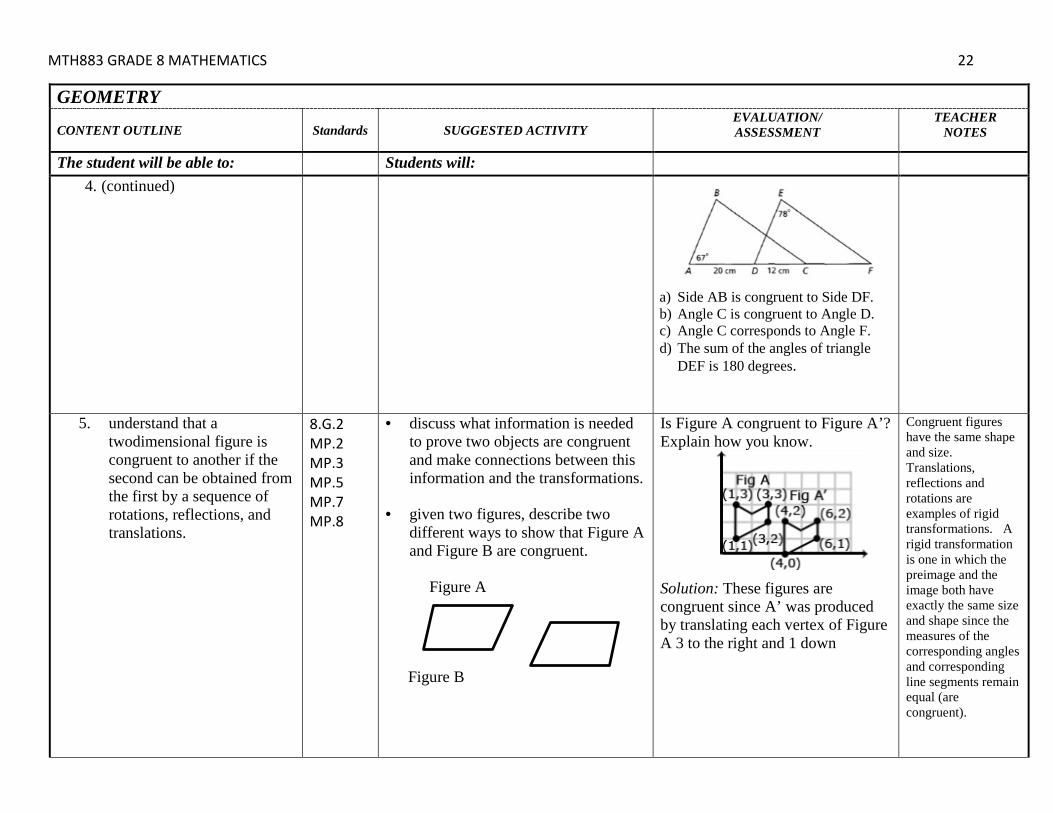
4. (continued)
a) Side AB is congruent to Side DF. b) Angle C is congruent to Angle D. c) Angle C corresponds to Angle F. d) The sum of the angles of triangle
DEF is 180 degrees.
5. understand that a twodimensional figure is congruent to another if the second can be obtained from the first by a sequence of rotations, reflections, and translations.
8.G.2 MP.2 MP.3 MP.5 MP.7 MP.8
• discuss what information is needed to prove two objects are congruent and make connections between this information and the transformations.
• given two figures, describe two different ways to show that Figure A and Figure B are congruent.
Figure A
Figure B
Is Figure A congruent to Figure A’? Explain how you know.
Solution: These figures are congruent since A’ was produced by translating each vertex of Figure A 3 to the right and 1 down
Congruent figures have the same shape and size. Translations, reflections and rotations are examples of rigid transformations. A rigid transformation is one in which the preimage and the image both have exactly the same size and shape since the measures of the corresponding angles and corresponding line segments remain equal (are congruent).
MTH883 GRADE 8 MATHEMATICS 23 GEOMETRY
CONTENT OUTLINE Standards SUGGESTED ACTIVITY EVALUATION/ ASSESSMENT
TEACHER NOTES
The student will be able to: Students will:
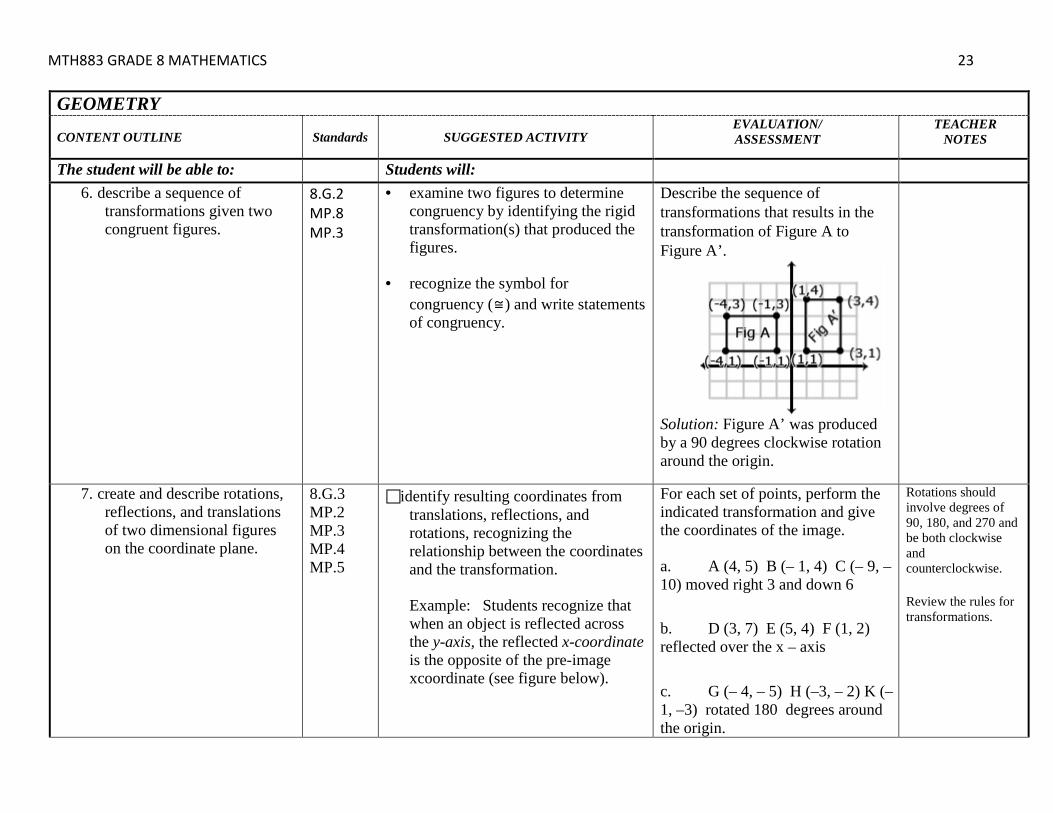
6. describe a sequence of transformations given two congruent figures.
8.G.2 MP.8 MP.3
• examine two figures to determine congruency by identifying the rigid transformation(s) that produced the figures.
• recognize the symbol for congruency (≅) and write statements of congruency.
Describe the sequence of transformations that results in the transformation of Figure A to Figure A’.
Solution: Figure A’ was produced by a 90 degrees clockwise rotation around the origin.
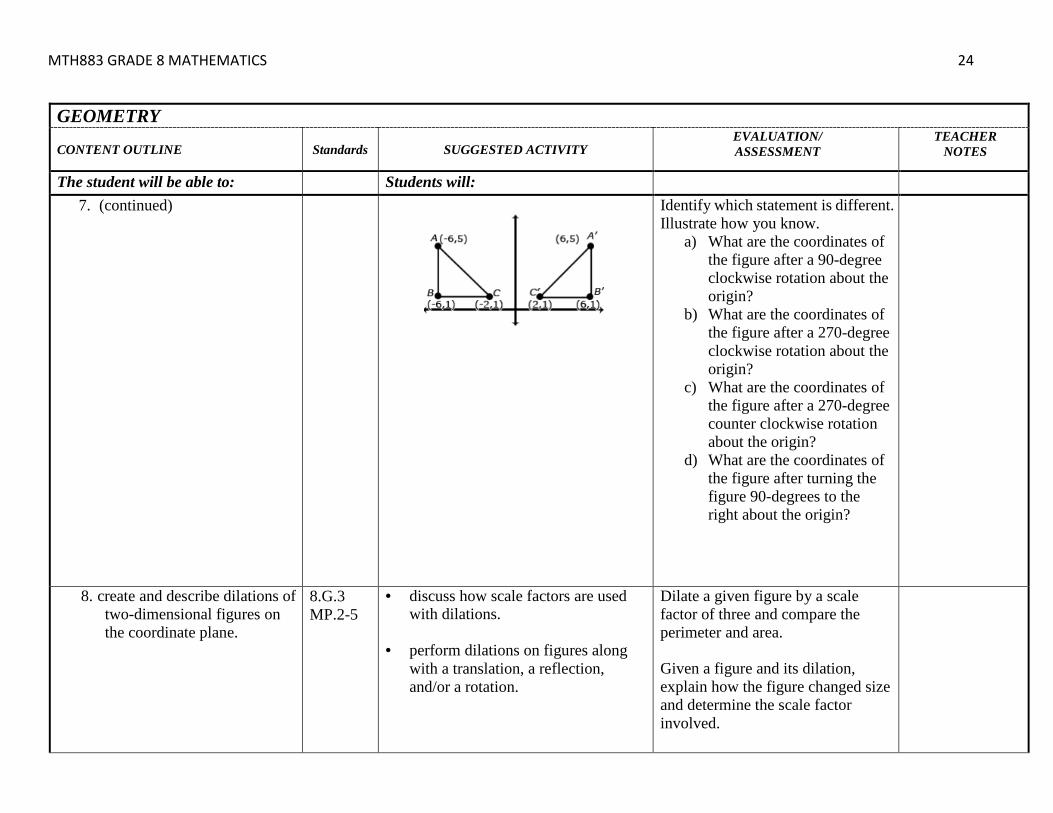
7. create and describe rotations, reflections, and translations of two dimensional figures on the coordinate plane.
8.G.3 MP.2 MP.3 MP.4 MP.5
identify resulting coordinates from translations, reflections, and rotations, recognizing the relationship between the coordinates and the transformation. Example: Students recognize that when an object is reflected across the y-axis, the reflected x-coordinate is the opposite of the pre-image xcoordinate (see figure below).
For each set of points, perform the indicated transformation and give the coordinates of the image. a. A (4, 5) B (– 1, 4) C (– 9, – 10) moved right 3 and down 6
b. D (3, 7) E (5, 4) F (1, 2) reflected over the x – axis
c. G (– 4, – 5) H (–3, – 2) K (–1, –3) rotated 180 degrees around the origin.
Rotations should involve degrees of 90, 180, and 270 and be both clockwise and counterclockwise. Review the rules for transformations.
MTH883 GRADE 8 MATHEMATICS 24
GEOMETRY
CONTENT OUTLINE Standards SUGGESTED ACTIVITY EVALUATION/ ASSESSMENT
TEACHER NOTES
The student will be able to: Students will:
7. (continued)
Identify which statement is different. Illustrate how you know.
a) What are the coordinates of the figure after a 90-degree clockwise rotation about the origin?
b) What are the coordinates of the figure after a 270-degree clockwise rotation about the origin?
c) What are the coordinates of the figure after a 270-degree counter clockwise rotation about the origin?
d) What are the coordinates of the figure after turning the figure 90-degrees to the right about the origin?
8. create and describe dilations of two-dimensional figures on the coordinate plane.
8.G.3 MP.2-5
• discuss how scale factors are used with dilations.
• perform dilations on figures along with a translation, a reflection, and/or a rotation.
Dilate a given figure by a scale factor of three and compare the perimeter and area. Given a figure and its dilation, explain how the figure changed size and determine the scale factor involved.
MTH883 GRADE 8 MATHEMATICS 25
GEOMETRY
CONTENT OUTLINE Standards SUGGESTED ACTIVITY EVALUATION/ ASSESSMENT TEACHER
NOTES
The student will be able to: Students will: 8. (continued)
discuss whether two figures that have
the same size and shape are similar.
Triangle ABC is dilated with the origin as the center of the dilation. Select all ordered pairs that could represent the image of point C (5, 2) after the dilation?
a) (2.5, 1) b) (5, –2) c) (7.5, 3) d) (8, 5) e) (–1, –4)
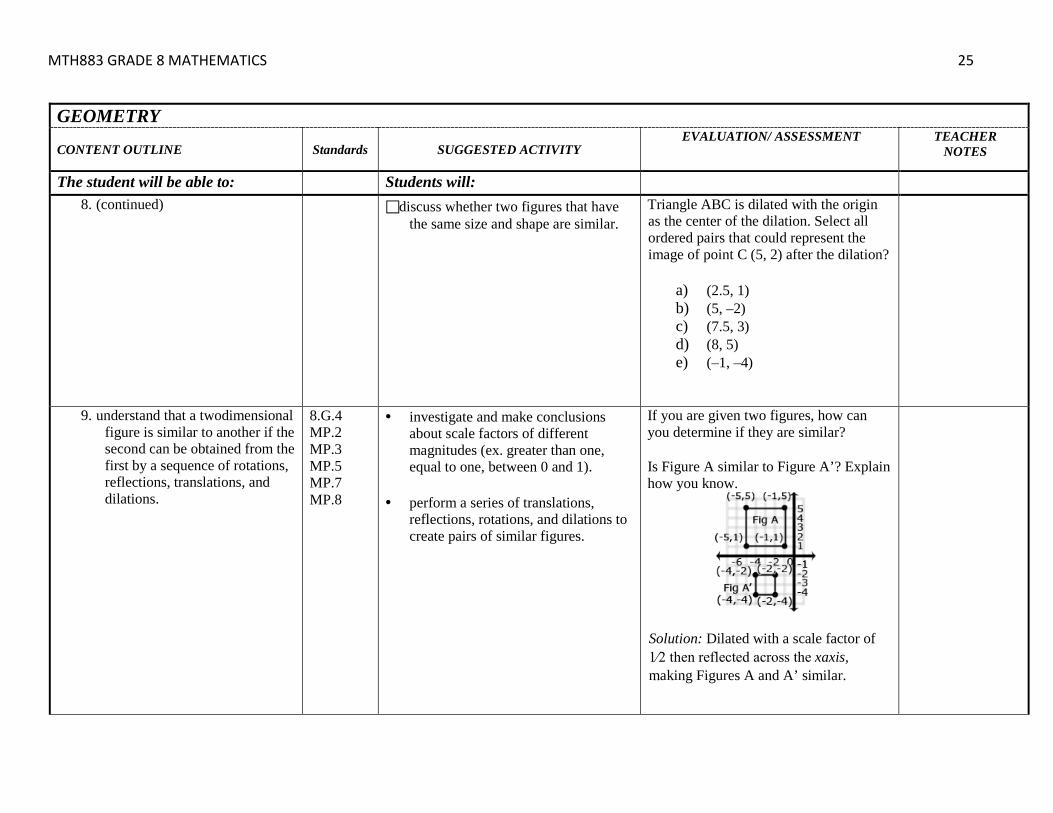
9. understand that a twodimensional figure is similar to another if the second can be obtained from the first by a sequence of rotations, reflections, translations, and dilations.
8.G.4 MP.2 MP.3 MP.5 MP.7 MP.8
• investigate and make conclusions about scale factors of different magnitudes (ex. greater than one, equal to one, between 0 and 1).
• perform a series of translations,
reflections, rotations, and dilations to create pairs of similar figures.
If you are given two figures, how can you determine if they are similar? Is Figure A similar to Figure A’? Explain how you know.
Solution: Dilated with a scale factor of 1⁄2 then reflected across the xaxis, making Figures A and A’ similar.
MTH883 GRADE 8 MATHEMATICS 26
GEOMETRY
CONTENT OUTLINE Standards SUGGESTED ACTIVITY EVALUATION/ ASSESSMENT
TEACHER NOTES
The student will be able to: Students will:
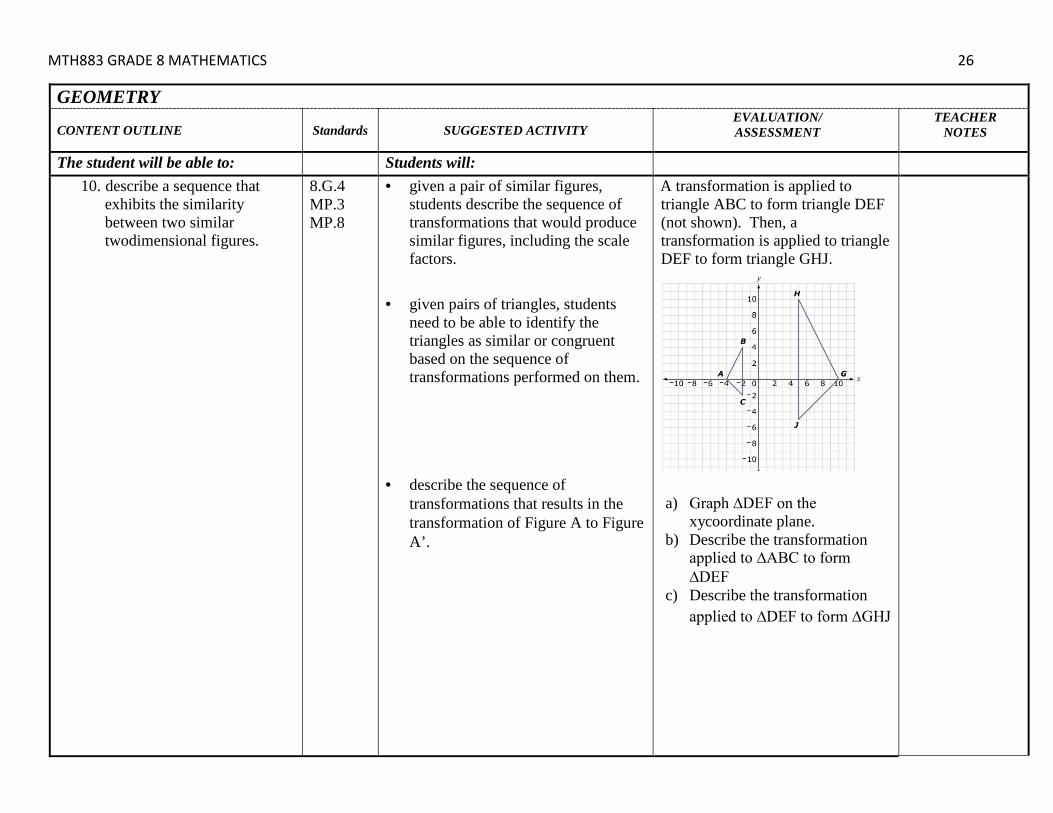
10. describe a sequence that exhibits the similarity between two similar twodimensional figures.
8.G.4 MP.3 MP.8
• given a pair of similar figures, students describe the sequence of transformations that would produce similar figures, including the scale factors.
• given pairs of triangles, students need to be able to identify the triangles as similar or congruent based on the sequence of transformations performed on them.
• describe the sequence of
transformations that results in the transformation of Figure A to Figure A’.
A transformation is applied to triangle ABC to form triangle DEF (not shown). Then, a transformation is applied to triangle DEF to form triangle GHJ.
a) Graph ∆DEF on the
xycoordinate plane. b) Describe the transformation
applied to ∆ABC to form ∆DEF
c) Describe the transformation applied to ∆DEF to form ∆GHJ

MTH883 GRADE 8 MATHEMATICS 27 GEOMETRY
CONTENT OUTLINE Standards SUGGESTED ACTIVITY EVALUATION/ ASSESSMENT TEACHER NOTES
The student will be able to: Students will:
10. (continued)
Solution: 90° clockwise rotation, translate 4 right and 2 up, dilation of 1⁄2. In this case, the scale factor of the dilation can be found by using the horizontal distances on the triangle (image = 2 units; pre-image = 4 units)
d) Select one statement that applies to the relationship between ∆GHJ and ∆ABC.
• ∆GHJ is congruent to ∆ABC. ∆GHJ is similar to ∆ABC.
• ∆GHJ is neither congruent nor similar to ∆ABC.
Explain your reasoning.

MTH883 GRADE 8 MATHEMATICS 28
III. EXPONENTS AND SCIENTIFIC NOTATION – Timeline: Mid-November through December Essential Question(s): a) Why is it important to understand the procedures for working with different forms of numbers? b) What techniques can be used to simplify numerical and exponential expressions?
Enduring a) Numerical fluency includes both the understanding of and the ability to appropriately use numbers. Understanding(s): b) The relationships among numbers, operations, and their properties promote computational fluency.
EXPONENTS AND SCIENTIFIC NOTATION
CONTENT OUTLINE Standards SUGGESTED ACTIVITY EVALUATION/ ASSESSMENT
TEACHER NOTES
The student will be able to: Students will:
11. know and apply the properties of integer exponents to generate equivalent numerical expressions.
8.EE.1 MP.8 MP.5 MP.7
• use a chart to investigate zero, positive, and negative exponents. The top heading of the chart should include the integer exponents from 3 to – 3. The row headings should be for the powers of 2, 3, and 4. [see activity on page 456 in McDougal Littell Algebra I (2004)].
• use charts to explore the various exponent properties. For example, when exploring the product of powers, the following headings can be used: product of powers, expanded product, number of factors, and product as a power. A few examples should be started for students to help them see a pattern.
Evaluate each expression. Leave your answer in exponential form.
35 •34 48
43
(52)4
[4]3 [ 9]
75 •78 87
84
63
68 •66
(32)5
3−6 •35
Final answers should be written with positive exponents. Tasks should involve a single common base and should include examples involving more than one exponent property.
MTH883 GRADE 8 MATHEMATICS 29
EXPONENTS AND SCIENTIFIC NOTATION
CONTENT OUTLINE Standards SUGGESTED ACTIVITY EVALUATION/ ASSESSMENT
TEACHER NOTES
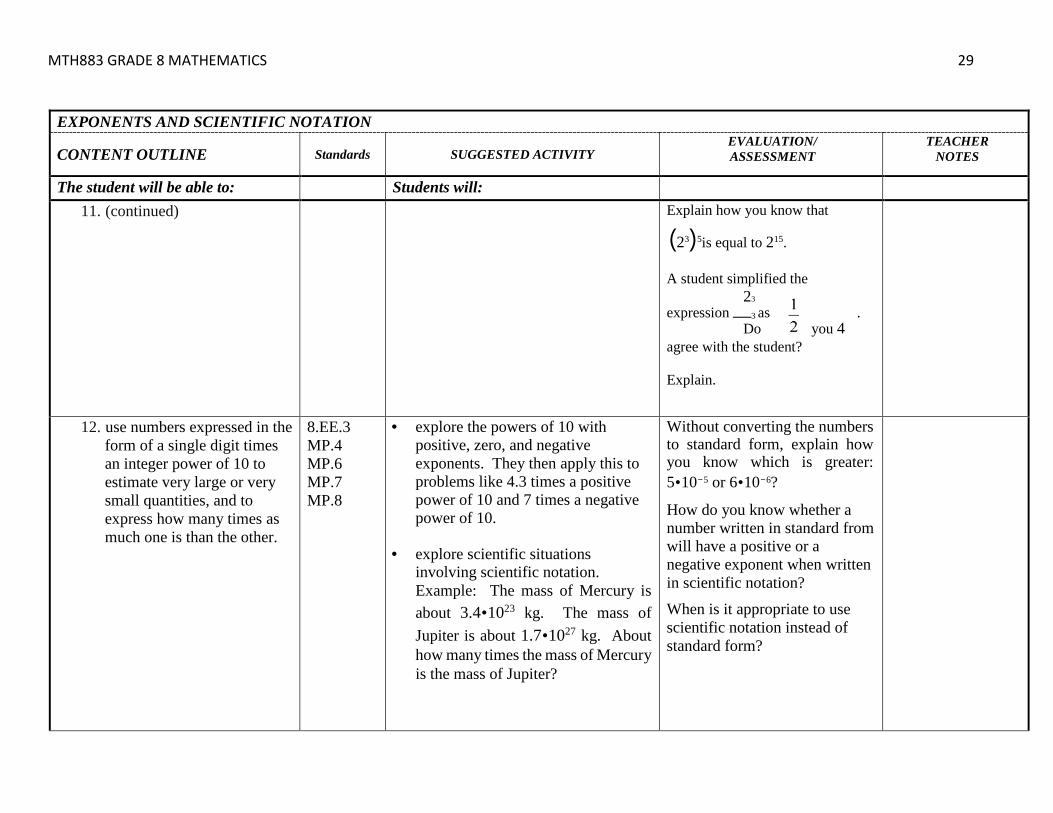
The student will be able to: Students will:
11. (continued)
Explain how you know that
(23)5is equal to 215. A student simplified the
23 expression 3 as .
you 4 Do agree with the student? Explain.
12. use numbers expressed in the form of a single digit times an integer power of 10 to estimate very large or very small quantities, and to express how many times as much one is than the other.
8.EE.3 MP.4 MP.6 MP.7 MP.8
• explore the powers of 10 with positive, zero, and negative exponents. They then apply this to problems like 4.3 times a positive power of 10 and 7 times a negative power of 10.
• explore scientific situations involving scientific notation. Example: The mass of Mercury is about 3.4•1023 kg. The mass of Jupiter is about 1.7•1027 kg. About how many times the mass of Mercury is the mass of Jupiter?
Without converting the numbers to standard form, explain how you know which is greater: 5•10−5 or 6•10−6?
How do you know whether a number written in standard from will have a positive or a negative exponent when written in scientific notation?
When is it appropriate to use scientific notation instead of standard form?
MTH883 GRADE 8 MATHEMATICS 30
EXPONENTS AND SCIENTIFIC NOTATION
CONTENT OUTLINE Standards SUGGESTED ACTIVITY EVALUATION/ ASSESSMENT
TEACHER NOTES
The student will be able to: Students will:
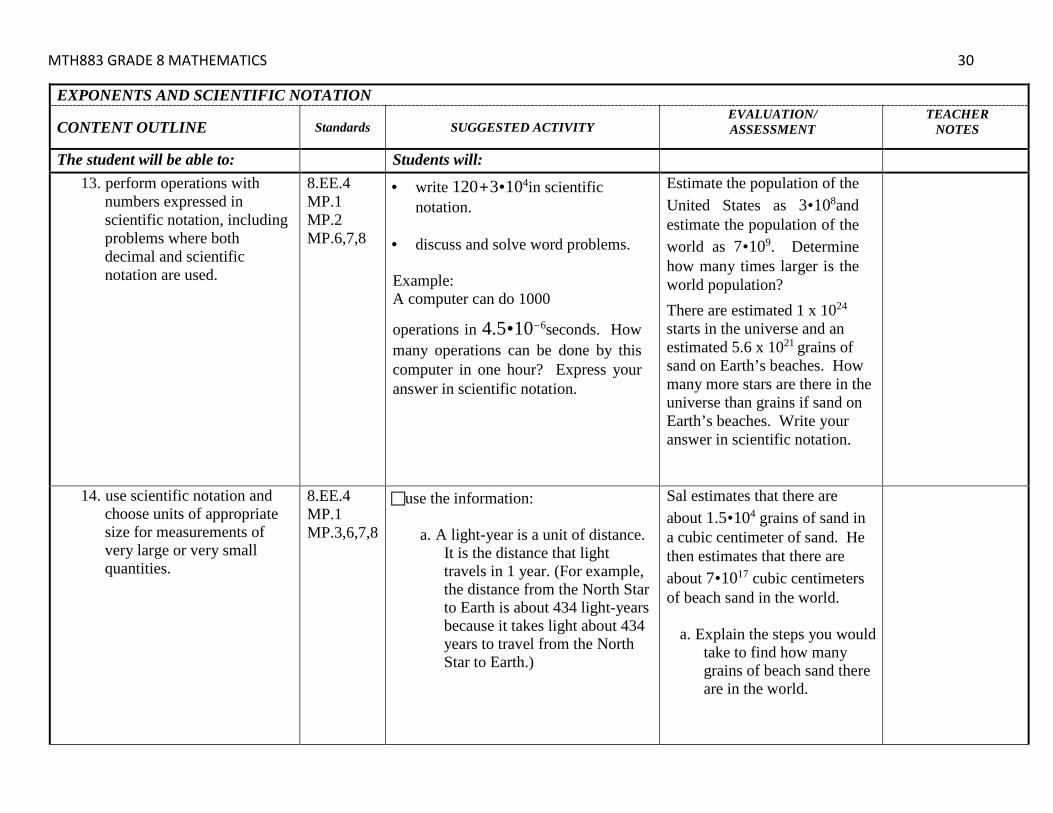
13. perform operations with numbers expressed in scientific notation, including problems where both decimal and scientific notation are used.
8.EE.4 MP.1 MP.2 MP.6,7,8
• write 120+3•104in scientific notation.
• discuss and solve word problems. Example: A computer can do 1000
operations in 4.5•10−6seconds. How many operations can be done by this computer in one hour? Express your answer in scientific notation.
Estimate the population of the United States as 3•108and estimate the population of the world as 7•109. Determine how many times larger is the world population? There are estimated 1 x 1024 starts in the universe and an estimated 5.6 x 10²¹ grains of sand on Earth’s beaches. How many more stars are there in the universe than grains if sand on Earth’s beaches. Write your answer in scientific notation.
14. use scientific notation and choose units of appropriate size for measurements of very large or very small quantities.
8.EE.4 MP.1 MP.3,6,7,8
use the information: a. A light-year is a unit of distance.
It is the distance that light travels in 1 year. (For example, the distance from the North Star to Earth is about 434 light-years because it takes light about 434 years to travel from the North Star to Earth.)
Sal estimates that there are about 1.5•104 grains of sand in a cubic centimeter of sand. He then estimates that there are about 7•1017 cubic centimeters of beach sand in the world.
a. Explain the steps you would take to find how many grains of beach sand there are in the world.
MTH883 GRADE 8 MATHEMATICS 31
EXPONENTS AND SCIENTIFIC NOTATION
CONTENT OUTLINE Standards SUGGESTED ACTIVITY EVALUATION/ ASSESSMENT
TEACHER NOTES
The student will be able to: Students will:
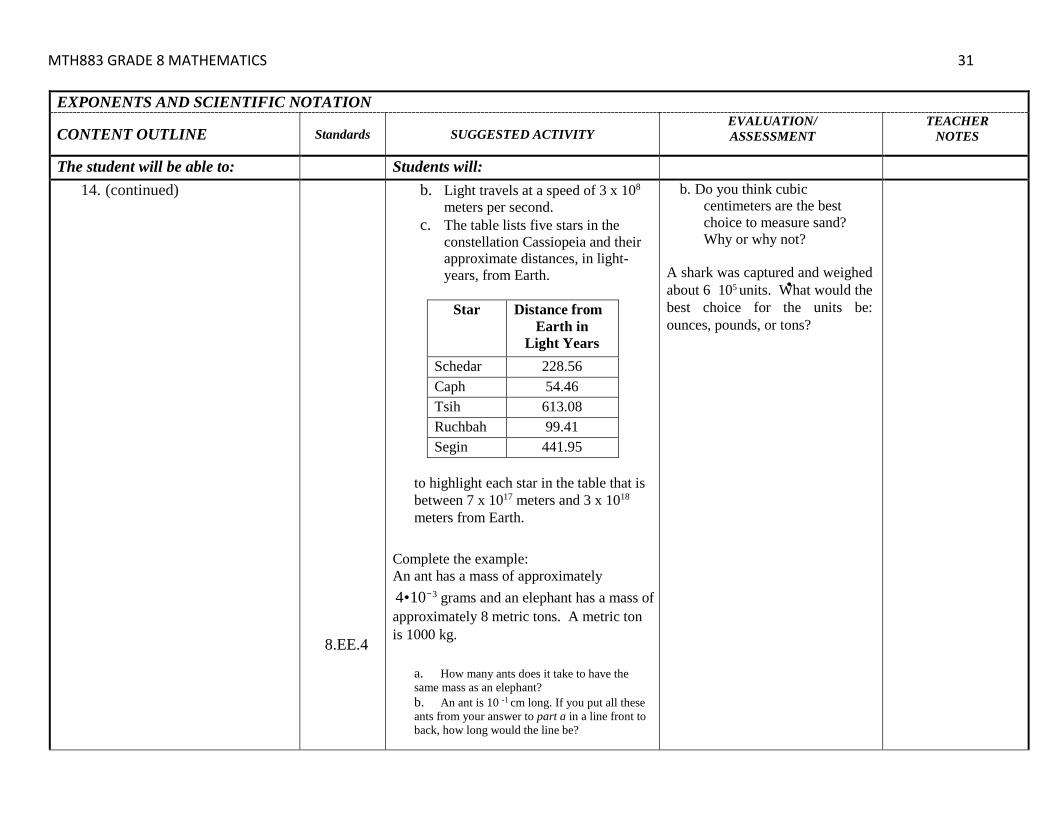
14. (continued)
8.EE.4
b. Light travels at a speed of 3 x 10⁸ meters per second.
c. The table lists five stars in the constellation Cassiopeia and their approximate distances, in light-years, from Earth.
Star Distance from
Earth in Light Years
Schedar 228.56 Caph 54.46 Tsih 613.08 Ruchbah 99.41 Segin 441.95
to highlight each star in the table that is between 7 x 10¹⁷ meters and 3 x 10¹⁸ meters from Earth.
Complete the example: An ant has a mass of approximately 4•10−3 grams and an elephant has a mass of approximately 8 metric tons. A metric ton is 1000 kg.
a. How many ants does it take to have the same mass as an elephant? b. An ant is 10 -1 cm long. If you put all these ants from your answer to part a in a line front to back, how long would the line be?
b. Do you think cubic centimeters are the best choice to measure sand? Why or why not?
A shark was captured and weighed about 6 105 units. What would the best choice for the units be: ounces, pounds, or tons?
MTH883 GRADE 8 MATHEMATICS 32
EXPONENTS AND SCIENTIFIC NOTATION
CONTENT OUTLINE Standards SUGGESTED ACTIVITY EVALUATION/ ASSESSMENT TEACHER NOTES
The student will be able to: Students will:
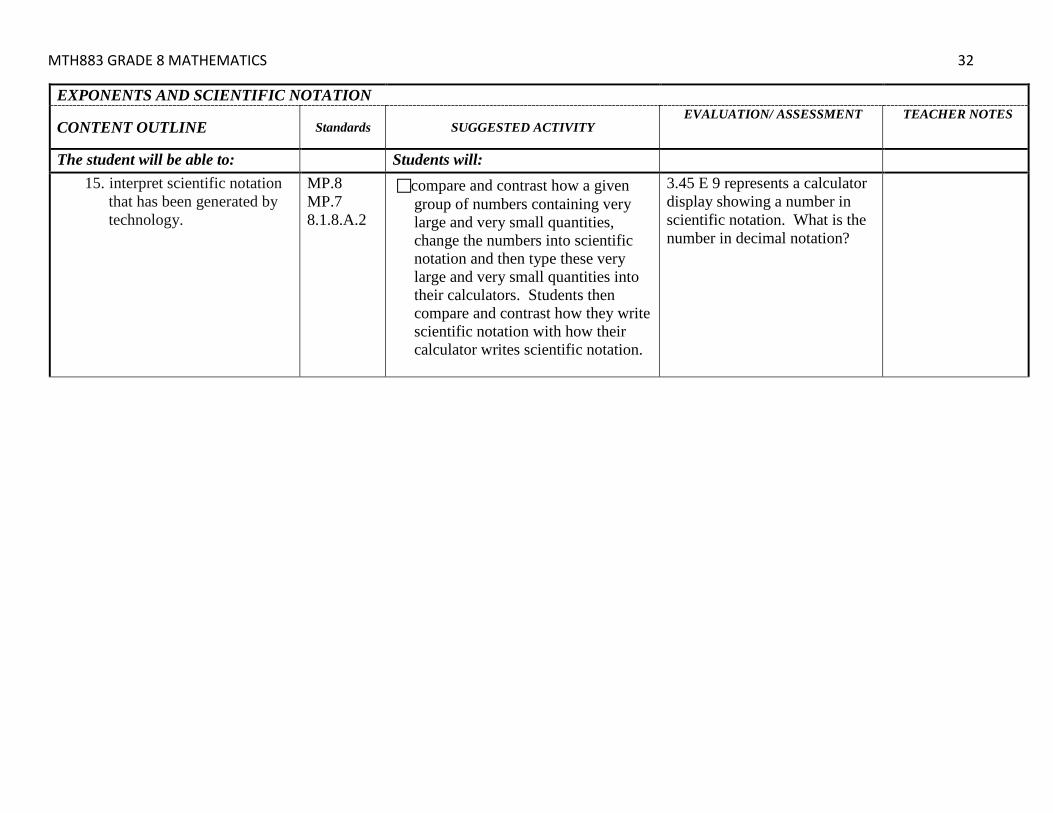
15. interpret scientific notation that has been generated by technology.
MP.8 MP.7 8.1.8.A.2
compare and contrast how a given group of numbers containing very large and very small quantities, change the numbers into scientific notation and then type these very large and very small quantities into their calculators. Students then compare and contrast how they write scientific notation with how their calculator writes scientific notation.
3.45 E 9 represents a calculator display showing a number in scientific notation. What is the number in decimal notation?
MTH883 GRADE 8 MATHEMATICS 33 IV. LINEAR EQUATIONS AND SYSTEMS – Timeline: January through February
Essential Question(s): a) Why is it important to understand the procedures for working with different forms of numbers? b) What techniques can be used to simplify numerical and exponential expressions? Enduring Understanding(s):
a) b)
Numerical fluency includes both the understanding of and the ability to appropriately use numbers. The relationships among numbers, operations, and their properties promote computational fluency.
LINEAR EQUATIONS AND SYSTEMS
CONTENT OUTLINE Standards SUGGESTED ACTIVITY EVALUATION/ ASSESSMENT
TEACHER NOTES
The student will be able to: Students will:
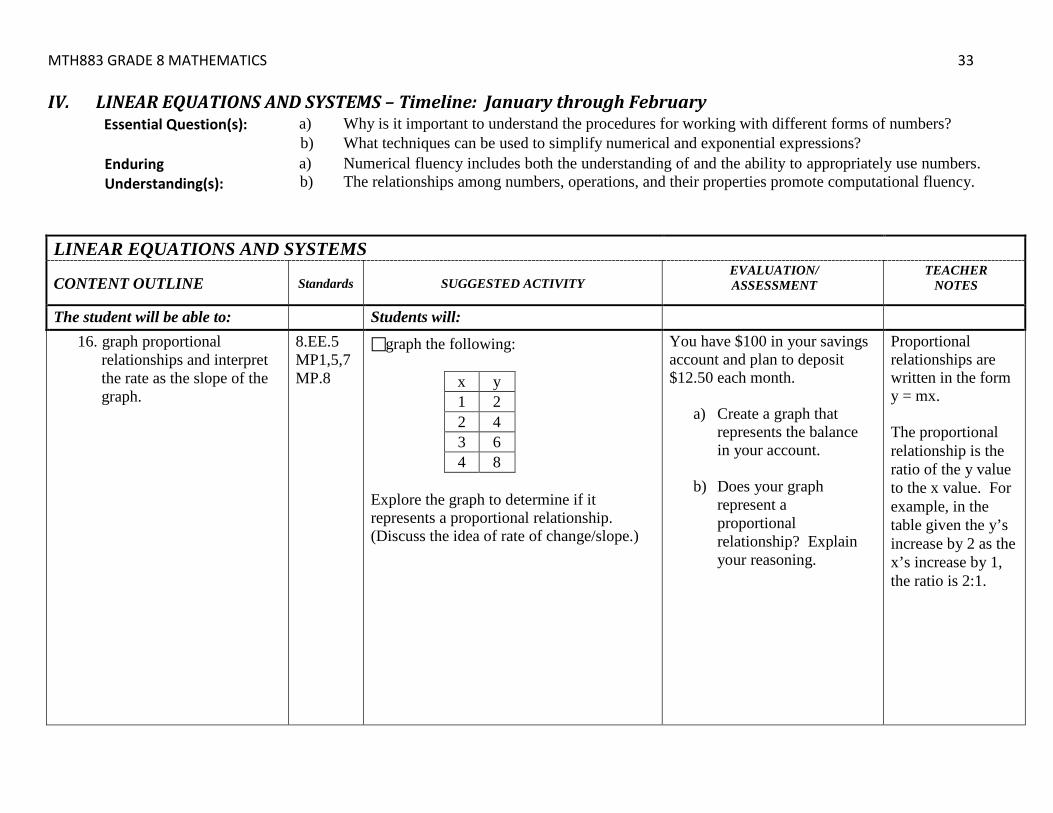
16. graph proportional relationships and interpret the rate as the slope of the graph.
8.EE.5 MP1,5,7 MP.8
graph the following:
x y 1 2 2 4 3 6 4 8
Explore the graph to determine if it represents a proportional relationship. (Discuss the idea of rate of change/slope.)
You have $100 in your savings account and plan to deposit $12.50 each month.
a) Create a graph that represents the balance in your account.
b) Does your graph represent a proportional relationship? Explain your reasoning.
Proportional relationships are written in the form y = mx. The proportional relationship is the ratio of the y value to the x value. For example, in the table given the y’s increase by 2 as the x’s increase by 1, the ratio is 2:1.

MTH883 GRADE 8 MATHEMATICS 34
LINEAR EQUATIONS AND SYSTEMS
CONTENT OUTLINE Standards SUGGESTED ACTIVITY EVALUATION/ ASSESSMENT
TEACHER NOTES
The student will be able to: Students will:
17. compare two different proportional relationships represented in different ways.
8.EE.5 MP.2 MP.3
read the following information:
a. Three students saved money for four weeks.
b. Antwan saved the same amount of
money each week for 4 weeks. He made this graph to show how much money he saved.
c. Carla saved the same amount of
money each week for 4 weeks. She made this table to show how much money she saved.
At the Algebra Gas Station the cost of gasoline can be found using the following equation: C = 3.35g where C is the cost and g is the number of gallons of gasoline. The table below shows the total cost for buying different amounts of gallons of gasoline at the Slope Gas Station.
Gallons Cost 2 7 4 14 6 21 8 28 10 35
Which station has the best buy? Justify your answer.

MTH883 GRADE 8 MATHEMATICS 35 LINEAR EQUATIONS AND SYSTEMS
CONTENT OUTLINE Standards SUGGESTED ACTIVITY EVALUATION/ ASSESSMENT
TEACHER NOTES
The student will be able to: Students will:
17. (continued) d. Omar saved the same amount of money each week for 4 weeks. He wrote the equation below to show how much he saved. In the equation, S is the total amount of money saved, in dollars, and w is the number of weeks
S = 2 5. w to identify who saved the greatest amount of money each week and the student who saved the least amount of money each week and to write the student’s name next to the appropriate description.
Antwan Carla Omar
Week Total Amount of Money Saved
1 $1.75 2 $3.50 3 $5.25 4 $7.00
Student Name: Student Description: Student who saved the greatest amount of money each week Student who saved the least amount of money each week
MTH883 GRADE 8 MATHEMATICS 36
LINEAR EQUATIONS AND SYSTEMS
CONTENT OUTLINE Standards SUGGESTED ACTIVITY EVALUATION/ ASSESSMENT
TEACHER NOTES
The student will be able to: Students will:
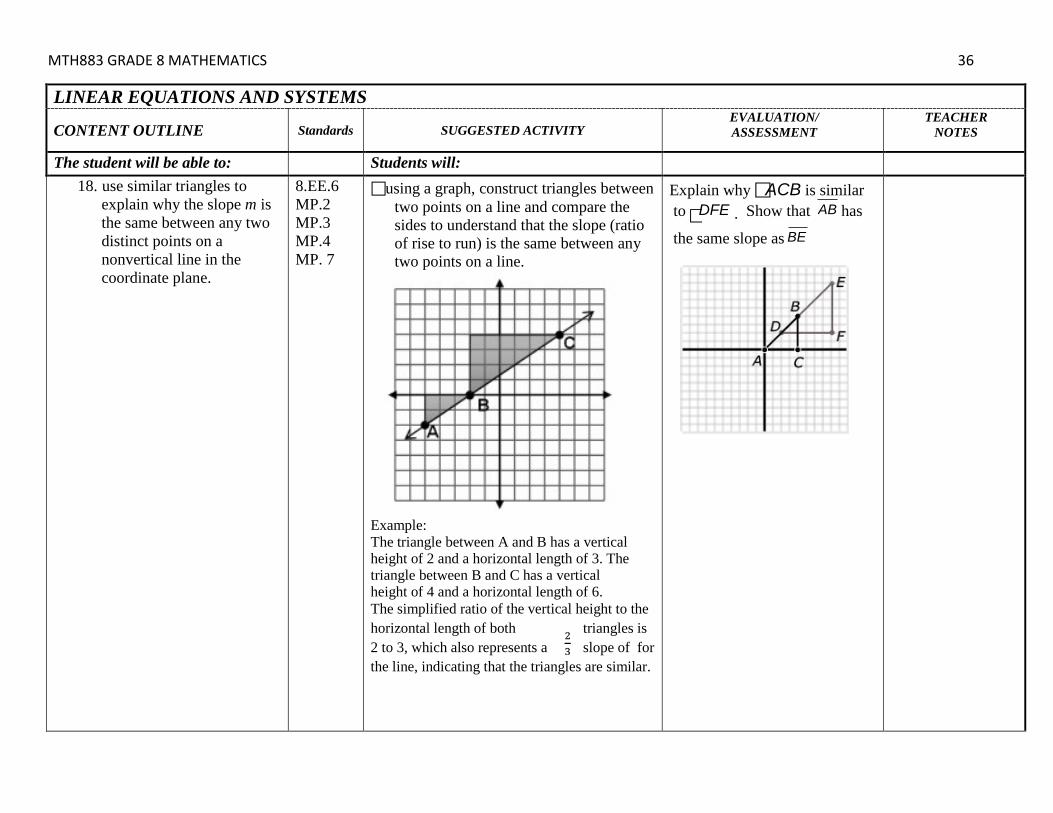
18. use similar triangles to explain why the slope m is the same between any two distinct points on a nonvertical line in the coordinate plane.
8.EE.6 MP.2 MP.3 MP.4 MP. 7
using a graph, construct triangles between two points on a line and compare the sides to understand that the slope (ratio of rise to run) is the same between any two points on a line.
Example: The triangle between A and B has a vertical height of 2 and a horizontal length of 3. The triangle between B and C has a vertical height of 4 and a horizontal length of 6. The simplified ratio of the vertical height to the horizontal length of both triangles is 2 to 3, which also represents a slope of for the line, indicating that the triangles are similar.
Explain why ACB is similar
to . Show that has
the same slope a s
DFE AB
BE
MTH883 GRADE 8 MATHEMATICS 37 LINEAR EQUATIONS AND SYSTEMS
CONTENT OUTLINE Standards SUGGESTED ACTIVITY EVALUATION/ ASSESSMENT
TEACHER NOTES
The student will be able to: Students will:
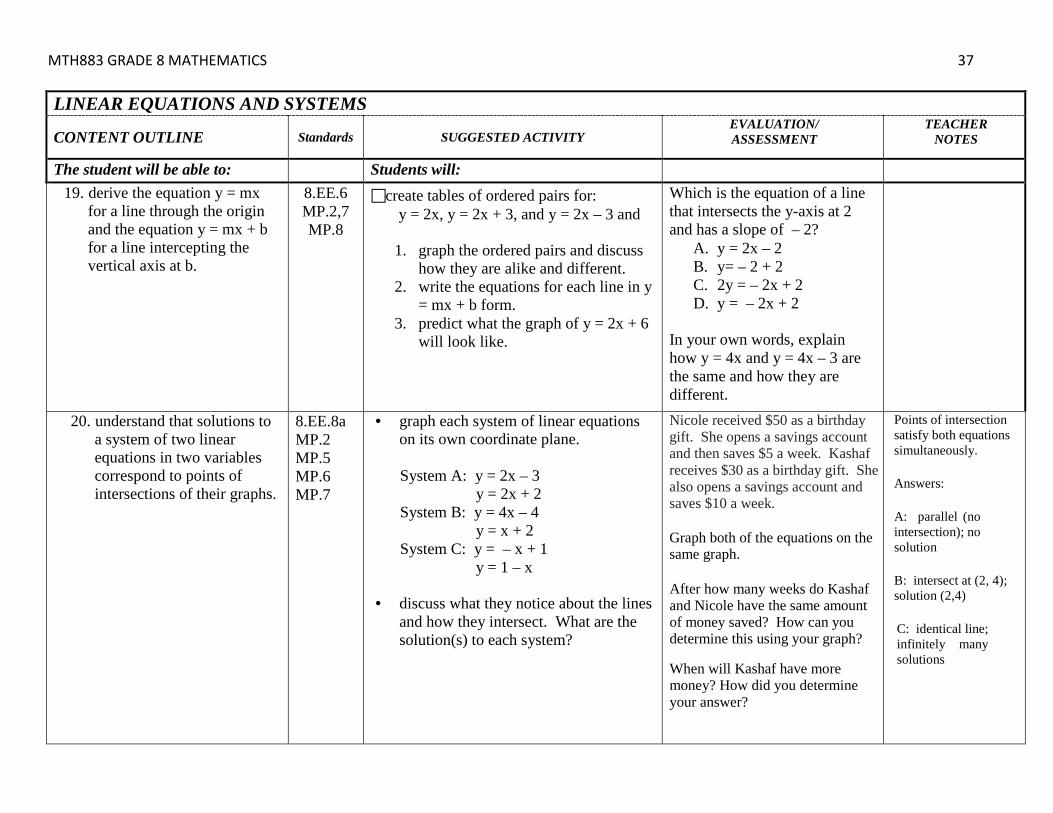
19. derive the equation y = mx for a line through the origin and the equation y = mx + b for a line intercepting the vertical axis at b.
8.EE.6 MP.2,7 MP.8
create tables of ordered pairs for: y = 2x, y = 2x + 3, and y = 2x – 3 and 1. graph the ordered pairs and discuss
how they are alike and different. 2. write the equations for each line in y
= mx + b form. 3. predict what the graph of y = 2x + 6
will look like.
Which is the equation of a line that intersects the y-axis at 2 and has a slope of – 2?
A. y = 2x – 2 B. y= – 2 + 2 C. 2y = – 2x + 2 D. y = – 2x + 2
In your own words, explain how y = 4x and y = 4x – 3 are the same and how they are different.
20. understand that solutions to a system of two linear equations in two variables correspond to points of intersections of their graphs.
8.EE.8a MP.2 MP.5 MP.6 MP.7
• graph each system of linear equations on its own coordinate plane.
System A: y = 2x – 3 y = 2x + 2 System B: y = 4x – 4 y = x + 2 System C: y = – x + 1 y = 1 – x
• discuss what they notice about the lines
and how they intersect. What are the solution(s) to each system?
Nicole received $50 as a birthday gift. She opens a savings account and then saves $5 a week. Kashaf receives $30 as a birthday gift. She also opens a savings account and saves $10 a week. Graph both of the equations on the same graph. After how many weeks do Kashaf and Nicole have the same amount of money saved? How can you determine this using your graph?
When will Kashaf have more money? How did you determine your answer?
Points of intersection satisfy both equations simultaneously. Answers: A: parallel (no intersection); no solution B: intersect at (2, 4); solution (2,4) C: identical line; infinitely many solutions

MTH883 GRADE 8 MATHEMATICS 38
LINEAR EQUATIONS AND SYSTEMS
CONTENT OUTLINE Standards SUGGESTED ACTIVITY EVALUATION/ ASSESSMENT TEACHER NOTES
The student will be able to: Students will:
21. estimate solutions of two linear equations in two variables by graphing the equations.
8.EE.8b MP.1 MP.5 MP.6 MP.7
graph the following systems and label the solutions.
System A: y = x + 6 y = 2x + 3 System B: – x + 2y = – 10 x – 5y = 10
Write a system of equations to model the situation and use graphing to solve the problem. Situation: Determine the number of movies downloaded in a month that would make the costs for two sites the same, when Site A charges $6 per month and $1.25 for each movie and Site B charges $2 for each movie and no monthly fee.
System-solving in Grade 8 should include estimating solutions graphically, solving using substitution, and solving using elimination. Provide opportunities for students to change forms of equations (from a given form to slope-intercept form) in order to compare equations.
22. solve systems of two linear equations in two variables algebraically.
8.EE.8b MP.4 MP.6 MP.7
solve the following systems without graphing. (Allow students to work on these problems in small groups or pairs.)
For Substitution method, beginning problems should look like this:
4x + y = 26 y = x – 4
For Linear Combination / Elimination method, beginning problems should look like this:
x + 3y = 12 x – 3y = 18
Solve the following system algebraically (without using graphing):
3x – 2y = 12 x – y = 60
Explain how you can tell the following system of equations has no solution without graphing the system.
3x + 2y = 5 3x + 2y = 6
Examine what no solution and infinitely many solutions look like when solving algebraically.

MTH883 GRADE 8 MATHEMATICS 39 LINEAR EQUATIONS AND SYSTEMS
CONTENT OUTLINE Standards SUGGESTED ACTIVITY EVALUATION/ ASSESSMENT TEACHER NOTES
The student will be able to: Students will:
23. solve real-world and mathematical problems leading to two linear equations in two variables.
8.EE.8c MP.1 MP.4 MP.5 MP.6 MP.7 8.1.8.A.1
compare the growth of plant A and plant B to determine when their heights will be the same.
Let W = number of weeks Let H = height of the plant after W weeks
Plant A W H 0 4 (0,4) 1 6 (1,6) 2 8 (2,8) 3 10 (3,10)
Plant B W H 0 2 (0,2) 1 6 (1,6) 2 10 (2,10) 3 14 (3,14)
a. Write an equation that represent the growth rate of Plant A and Plant B.
b. Graph the coordinates on the same coordinate plane.
c. At which week will the plants have the same height?
Solve the following problems use any method: Ex. 1 Nina has $5 bills and $10 bills in her wallet. She has a total of 7 bills with a value of $55. How many of each type of bill does she have? Ex. 2 The cost of 3 pizzas and 4 sandwiches at Ralph’s Deli is $68. The cost of 3 pizzas and 7 sandwiches is $92. What is the cost of one pizza and the cost of one sandwich?
MTH883 GRADE 8 MATHEMATICS 40
V. FUNCTIONS, TABLES AND GRAPHS – Timeline: March through April Essential Question(s): a) How can you use a function to describe a linear pattern?
b) How can functions rules, tables, graphs, and verbal models be used as tools to best describe and help explain real-life situations?
c) How can you use a graph to represent relationships between quantities without using numbers? How can you use data to predict an event and/or make decisions?
Enduring Understanding(s):
a) Algebraic and graphic representations can be used to generalize linear patterns and relationships. b) Functional relationships can be expressed in real contexts, graphs, algebraic equations, tables, and words;
each representation of a given function is simply a different way of expressing the same idea. The value of a particular representation depends on its purpose.
c) Analyze specific parts of a graph to identity the rate of change and be able to describe in words, a qualitative graph. Data is analyzed to understand relationships to predict and make decisions.
Cluster: Define, evaluate and compare functions. Investigate patterns of association in bivariate data.
FUNCTIONS, TABLES AND GRAPHS
CONTENT OUTLINE Standards SUGGESTED ACTIVITY EVALUATION/ ASSESSMENT
TEACHER NOTES
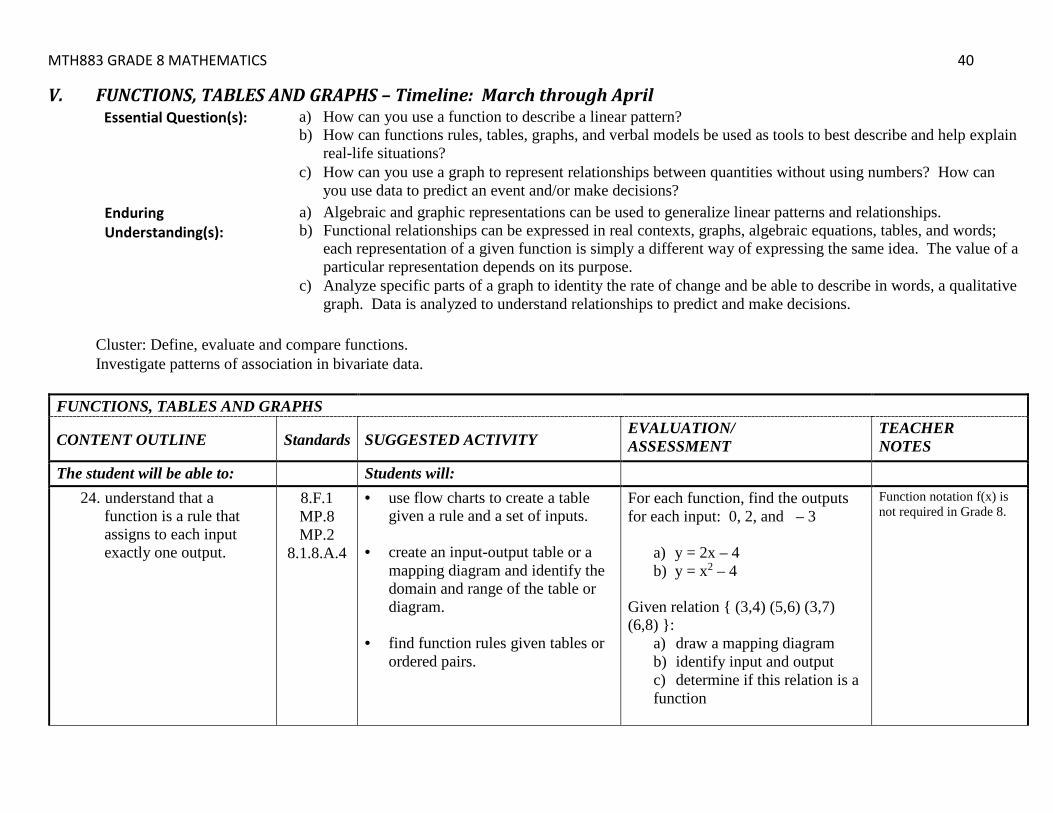
The student will be able to: Students will: 24. understand that a
function is a rule that assigns to each input exactly one output.
8.F.1 MP.8 MP.2
8.1.8.A.4
• use flow charts to create a table given a rule and a set of inputs.
• create an input-output table or a
mapping diagram and identify the domain and range of the table or diagram.
• find function rules given tables or
ordered pairs.
For each function, find the outputs for each input: 0, 2, and – 3
a) y = 2x – 4 b) y = x2 – 4
Given relation { (3,4) (5,6) (3,7) (6,8) }:
a) draw a mapping diagram b) identify input and output c) determine if this relation is a function
Function notation f(x) is not required in Grade 8.

MTH883 GRADE 8 MATHEMATICS 41
FUNCTIONS, TABLES AND GRAPHS
CONTENT OUTLINE Standards SUGGESTED ACTIVITY EVALUATION/ ASSESSMENT
TEACHER NOTES
The student will be able to: Students will: 24. (continued)
Following is a set of inputs and outputs for a mystery machine:
Create two equivalent two-step rules.
25. recognize that a graph of a function is the set of ordered pairs consisting of an input and corresponding output.
8.F.1 MP.8 MP.2 MP.4
generate function tables from rules and plot inputs and outputs on coordinate plane.
Create a table and a graph for a function rule:
a) y = 3x – 5 b) y = 5x
26. interpret the equation y=mx + b as defining a linear function and list examples of functions that are not linear.
8.F.3 MP.7 MP.3 MP.2
graph three given linear functions on their calculator. Repeat with three non-linear functions. For final activity, given a mixture of linear and non-linear functions and predict if graphs will be linear or non-linear before they graph them.
Determine which of the functions listed below are linear and which are not linear and explain your reasoning.
o y = -2x2 + 3 non linear o y = 2x linear o A = π non linear o y = 0.25 + 0.5(x – 2) linear
MTH883 GRADE 8 MATHEMATICS 42
FUNCTIONS, TABLES AND GRAPHS
CONTENT OUTLINE Standards SUGGESTED ACTIVITY EVALUATION/ ASSESSMENT
TEACHER NOTES
The student will be able to: Students will: 26. (continued) graph and identify as linear or
nonlinear. Discuss observation about the non-linear equations.
a) y = 2x – 3 b) y = x2 c) y = x3 d) y = 3x
d) y 𝑥𝑥
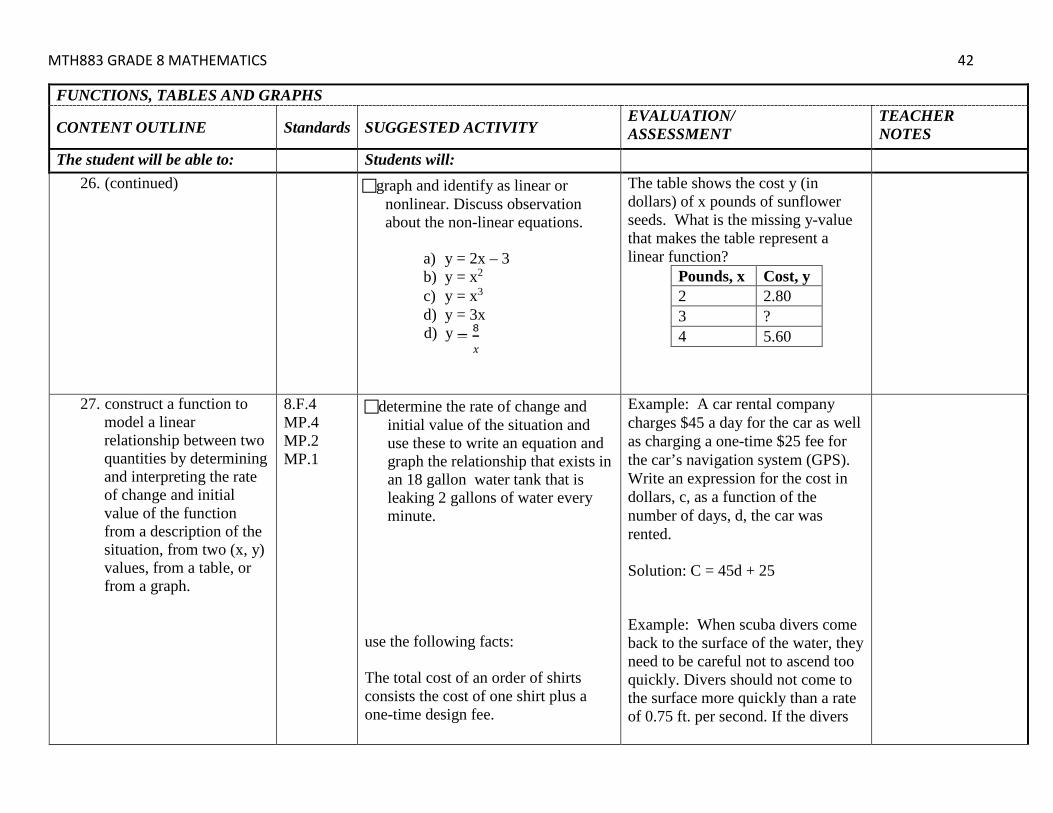
The table shows the cost y (in dollars) of x pounds of sunflower seeds. What is the missing y-value that makes the table represent a linear function?
Pounds, x Cost, y 2 2.80 3 ? 4 5.60
27. construct a function to model a linear relationship between two quantities by determining and interpreting the rate of change and initial value of the function from a description of the situation, from two (x, y) values, from a table, or from a graph.
8.F.4 MP.4 MP.2 MP.1
determine the rate of change and initial value of the situation and use these to write an equation and graph the relationship that exists in an 18 gallon water tank that is leaking 2 gallons of water every minute.
use the following facts: The total cost of an order of shirts consists the cost of one shirt plus a one-time design fee.
Example: A car rental company charges $45 a day for the car as well as charging a one-time $25 fee for the car’s navigation system (GPS). Write an expression for the cost in dollars, c, as a function of the number of days, d, the car was rented. Solution: C = 45d + 25 Example: When scuba divers come back to the surface of the water, they need to be careful not to ascend too quickly. Divers should not come to the surface more quickly than a rate of 0.75 ft. per second. If the divers
MTH883 GRADE 8 MATHEMATICS 43
FUNCTIONS, TABLES AND GRAPHS
CONTENT OUTLINE Standards SUGGESTED ACTIVITY EVALUATION/ ASSESSMENT
TEACHER NOTES
The student will be able to: Students will: 27. (continued) The cost of each shirt is the same
regardless of how many shirts are ordered. The store provides the following examples to help customers estimate the total cost of an order of shirts. 50 shirts cost $ 349.50 500 shirts cost $2,370.00 to determine:
a. the cost of each shirt, not including the one-time design fee. Explain how you determined your answer.
b. the cost of the one-time design
fee. Explain how you determined your answer.
start at a depth of 100 feet, the equation d = 0.75t – 100 shows the relationship between the time of the ascent in seconds (t) and the distance from the surface in feet (d). *Will they be at the surface in 5 minutes? How long will it take the divers to surface from their dive? *Make a table of values showing several times and the corresponding distance of the divers from the surface. Explain what your table shows. *How do the values in the table relate to the given equation?
28. compare properties of two functions each represented in a different way (algebraically, graphically, numerically in tables, or by verbal descriptions).
8.F.2 MP.3 MP.4
8.1.8.A.1
analyze a real-life situation involving the cost of a gym membership using tables and graphs to determine when it is better to take a membership or pay as you go.
Given the linear functions below, determine which one has the greater rate of change. Function 1: Gift Card Samantha starts with a $20 gift card for the book store. She spends $3.50

MTH883 GRADE 8 MATHEMATICS 44
FUNCTIONS, TABLES AND GRAPHS
CONTENT OUTLINE Standards SUGGESTED ACTIVITY EVALUATION/ ASSESSMENT
TEACHER NOTES
The student will be able to: Students will: 28. continued compare the two linear functions
listed below and determine which equation represents a greater rate of change (slope of the line or the coefficient of x).
Function 1 whose input and output are related by y = 3x + 7
Function 2 whose input and output are
related by y = 1x + 2
each week to buy a magazine. Let y be the amount remaining as a function of the number of weeks, x. (Give data for weeks 0 – 4 in a table for function 1). Function 2: A school rents graphing calculators for $5 a month. There is a nonrefundable fee of $10 for renting the calculator. Write the rule for the total cost, C, as a function of the number of months, m.
29. describe qualitatively the functional relationship between two quantities by analyzing a graph (e.g. where the function is increasing or decreasing, linear or nonlinear).
8.F.5 MP.2 MP.3 MP.8
use the graph of the function shown to describe the function’s behavior between x = 2 x = 5.
The graph below shows John’s trip to school. He walks to Sam’s house and, together, they ride a bus to school. The bus stops once before arriving at school. Describe how each part A – E of the graph relates to the story.

MTH883 GRADE 8 MATHEMATICS 45
FUNCTIONS, TABLES AND GRAPHS
CONTENT OUTLINE Standards SUGGESTED ACTIVITY EVALUATION/ ASSESSMENT
TEACHER NOTES
The student will be able to: Students will:
30. sketch a graph that
exhibits the qualitative features of a function that has been described in words.
8.F.5 MP.4 MP.5
work in pairs. One student will make up a story while the other student creates the graph to match the story.
Solution:
a. John is walking to Sam’s house at a constant rate.
b. John gets to Sam’s house and is waiting for the bus.
c. John and Sam are riding the bus to school. The bus is moving at a constant rate, faster than John’s walking rate.
d. The bus stops. e. The bus resumes at the same rate as
in part C. Create a graph that matches the following story:
MTH883 GRADE 8 MATHEMATICS 46
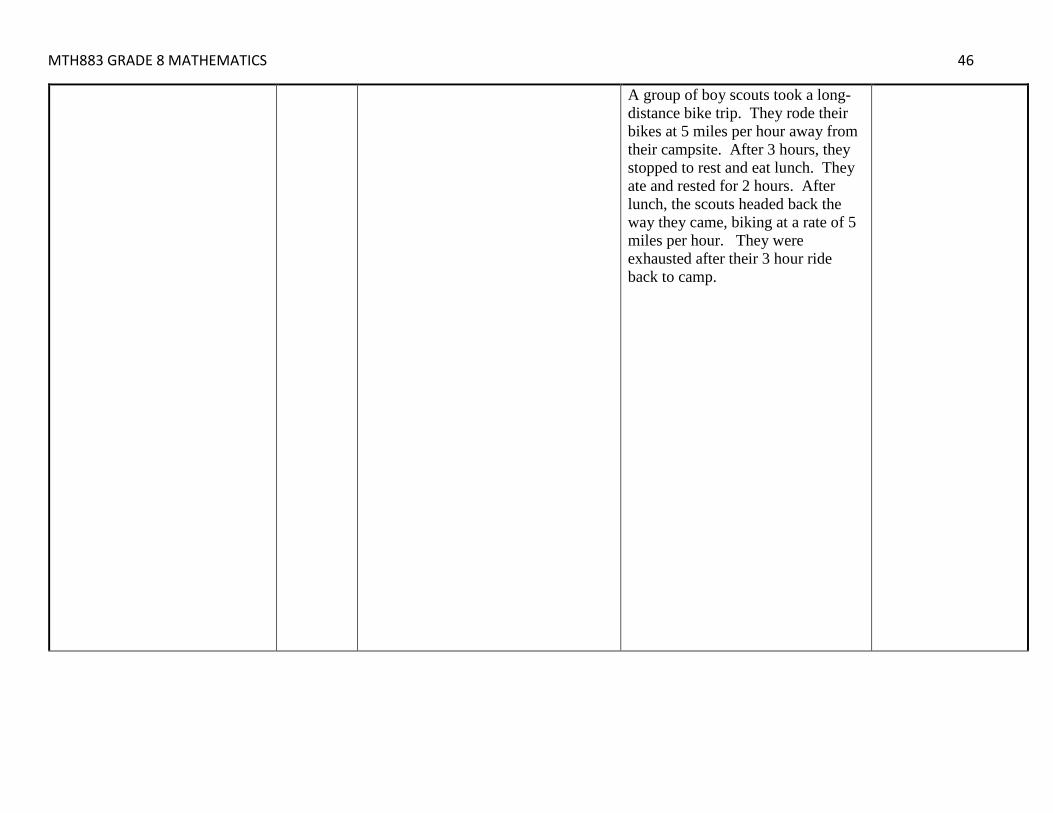
A group of boy scouts took a long-distance bike trip. They rode their bikes at 5 miles per hour away from their campsite. After 3 hours, they stopped to rest and eat lunch. They ate and rested for 2 hours. After lunch, the scouts headed back the way they came, biking at a rate of 5 miles per hour. They were exhausted after their 3 hour ride back to camp.
MTH883 GRADE 8 MATHEMATICS 47
FUNCTIONS, TABLES AND GRAPHS
CONTENT OUTLINE Standards SUGGESTED ACTIVITY EVALUATION/ ASSESSMENT
TEACHER NOTES
The student will be able to: Students will: 31. construct and interpret
scatter plots for bivariate measurement data.
32. using scatter plots, describe patterns such as clustering, outliers, positive or negative association, linear association, and nonlinear association.
8.SP.1 MP.3 MP.4 MP.5 8.1.8.A.4 8.1.8.F.1
8.SP.1 MP.2 MP.7 8.1.8.A.4 8.1.8.F.1
• given various sets of bivariate data, discuss how to create a scatter plot (axis label, units, scale, etc.) and then create it.
• given two data topics, raise right
hand to indicate positive correlation, raise left hand to indicate negative correlation, and raise both hands to indicate no correlation.
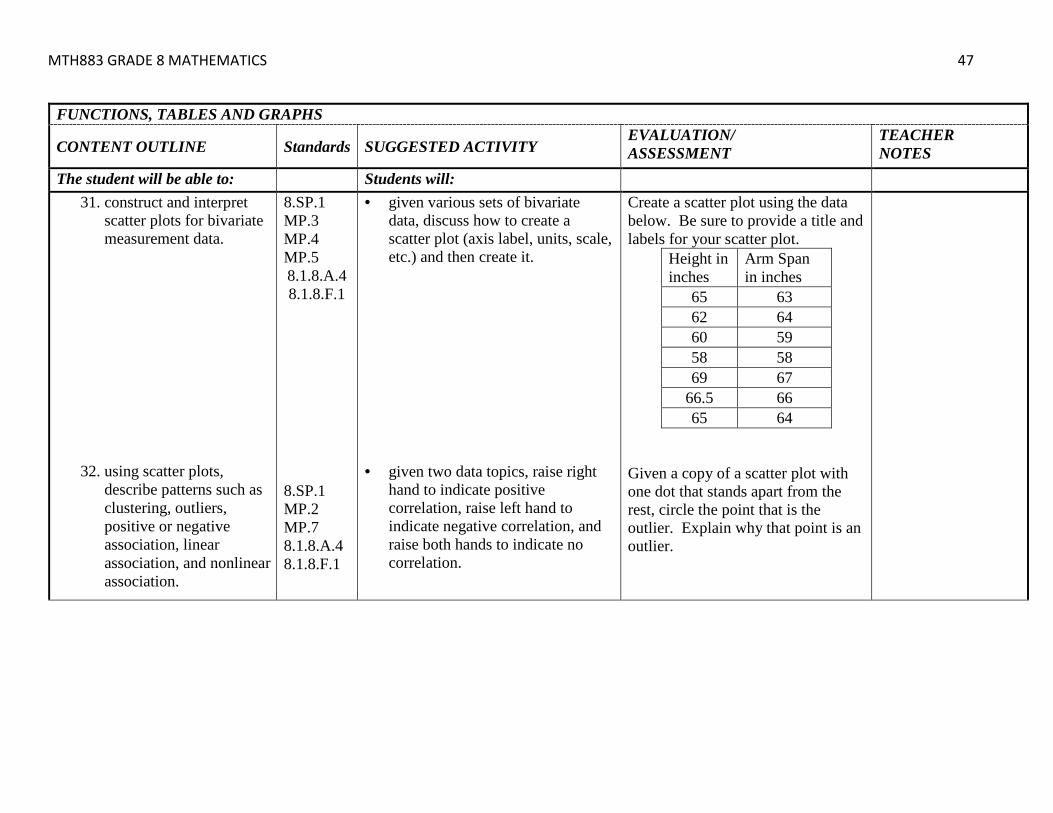
Create a scatter plot using the data below. Be sure to provide a title and labels for your scatter plot.
Height in inches
Arm Span in inches
65 63 62 64 60 59 58 58 69 67
66.5 66 65 64
Given a copy of a scatter plot with one dot that stands apart from the rest, circle the point that is the outlier. Explain why that point is an outlier.
MTH883 GRADE 8 MATHEMATICS 48
FUNCTIONS, TABLES AND GRAPHS
CONTENT OUTLINE Standards SUGGESTED ACTIVITY EVALUATION/ ASSESSMENT TEACHER
NOTES The student will be able to: Students will: Example: X data – outside
temperature versus Y – data number of people on beach; students will raise right hand for positive correlation show students various types of scatter plots and discuss patterns seen in the scatter plots. Scatter plots should be linear and nonlinear.
Given the following sets of data, tell if the correlation is positive, negative, or none and explain your answer choice:
X data: #of T-shirts ordered Y data: Price per T-shirt
33. know that straight lines are widely used to model relationships between two quantitative variables.
8.SP.2 MP.6 MP.7
• use angel hair pasta / spaghetti to approximate line of best fit and make predictions.
• find and graph the line of best fit for the data showing the different number of jumping jacks and the corresponding heart rate for ten students. Explain how heart rate is related to the number of Jumping Jacks completed
(Jumping Jacks, Heart Rate)
(0,78) (5,76) (10,84) (15,86) (20,93) (25,90) (30,96) (35,92) (40,100) (45,107)
Collect data from 10 classmates on their height and their forearm length. Organize this data in a table, form a scatter plot of this data, and use the data to predict the forearm length of a person 6’ 5”.
34. use the equation of a linear model to solve problems in the context of bivariate measurement data, interpreting the slope and intercept.
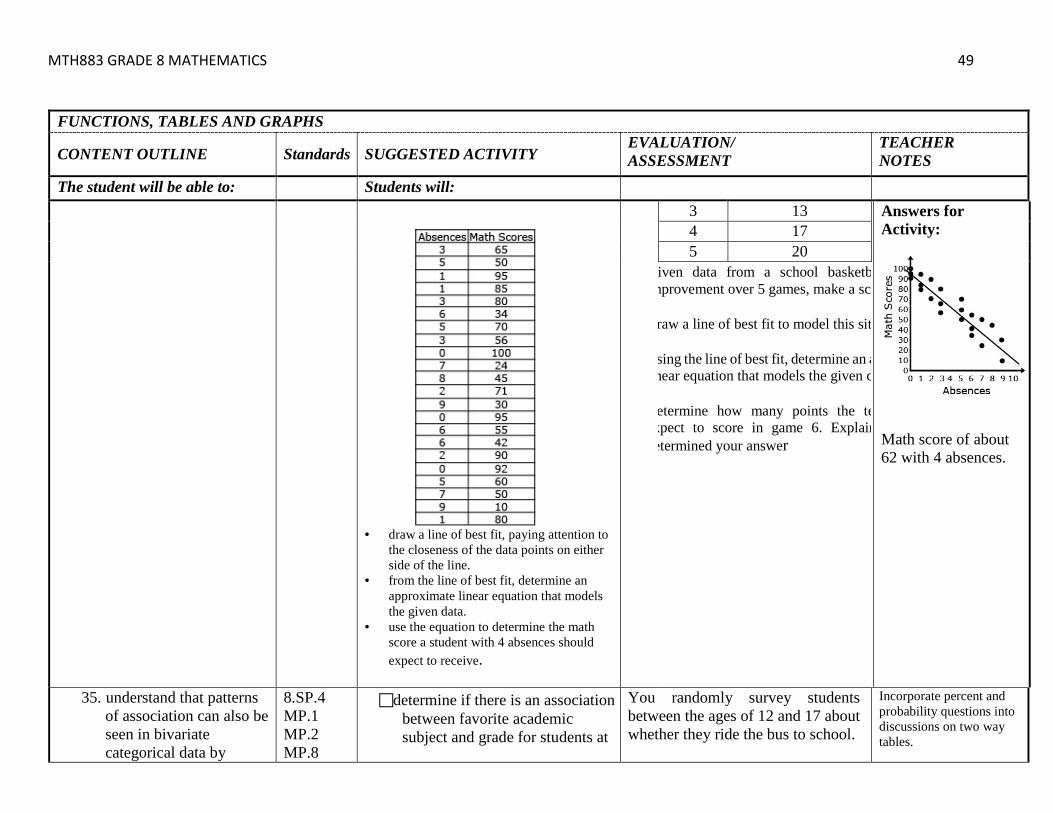
8.SP.3 MP.1 MP.5 MP.6 8.1.8.A.1 8.1.8.F.1
make a scatterplot given data from students’ math scores and absences.
Use the table below and answer the questions that follow:
Students should recognize the y intercept from the graph and find the slope from the graph.
Game Points Scored
1 8 2 11
MTH883 GRADE 8 MATHEMATICS 49
FUNCTIONS, TABLES AND GRAPHS
CONTENT OUTLINE Standards SUGGESTED ACTIVITY EVALUATION/ ASSESSMENT
TEACHER NOTES
The student will be able to: Students will:
• draw a line of best fit, paying attention to
the closeness of the data points on either side of the line.
• from the line of best fit, determine an approximate linear equation that models the given data.
• use the equation to determine the math score a student with 4 absences should expect to receive.
3 13
Answers for Activity:
Math score of about 62 with 4 absences.
4 17 5 20
iven data from a school basketb mprovement over 5 games, make a sca
raw a line of best fit to model this sit
sing the line of best fit, determine an a near equation that models the given d
etermine how many points the te xpect to score in game 6. Explain etermined your answer
35. understand that patterns of association can also be seen in bivariate categorical data by
8.SP.4 MP.1 MP.2 MP.8
determine if there is an association between favorite academic subject and grade for students at
You randomly survey students between the ages of 12 and 17 about whether they ride the bus to school.
Incorporate percent and probability questions into discussions on two way tables.
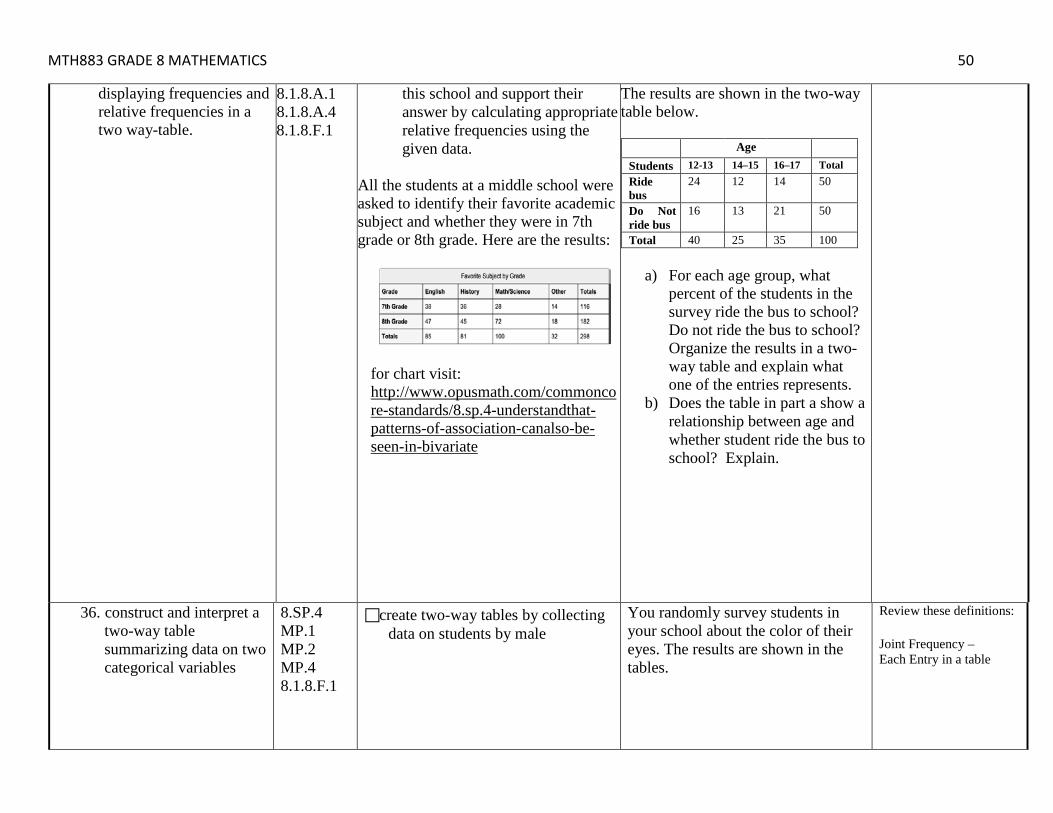
MTH883 GRADE 8 MATHEMATICS 50
displaying frequencies and relative frequencies in a two way-table.
8.1.8.A.1 8.1.8.A.4 8.1.8.F.1
this school and support their answer by calculating appropriate relative frequencies using the given data.
All the students at a middle school were asked to identify their favorite academic subject and whether they were in 7th grade or 8th grade. Here are the results:
for chart visit: http://www.opusmath.com/commoncore-standards/8.sp.4-understandthat-patterns-of-association-canalso-be-seen-in-bivariate
The results are shown in the two-way table below. Age Students 12-13 14–15 16–17 Total Ride bus
24 12 14 50
Do Not ride bus
16 13 21 50
Total 40 25 35 100
a) For each age group, what percent of the students in the survey ride the bus to school? Do not ride the bus to school? Organize the results in a two-way table and explain what one of the entries represents.
b) Does the table in part a show a relationship between age and whether student ride the bus to school? Explain.
36. construct and interpret a two-way table summarizing data on two categorical variables
8.SP.4 MP.1 MP.2 MP.4 8.1.8.F.1
create two-way tables by collecting data on students by male
You randomly survey students in your school about the color of their eyes. The results are shown in the tables.
Review these definitions: Joint Frequency – Each Entry in a table
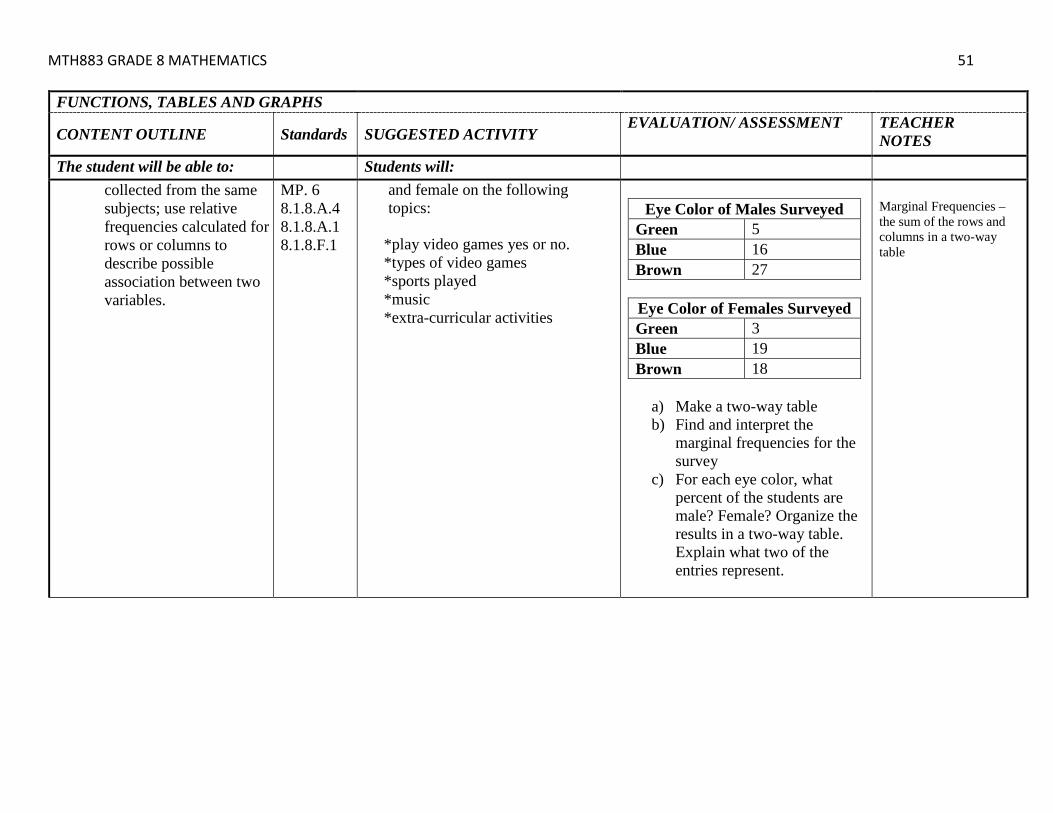
MTH883 GRADE 8 MATHEMATICS 51
FUNCTIONS, TABLES AND GRAPHS
CONTENT OUTLINE Standards SUGGESTED ACTIVITY EVALUATION/ ASSESSMENT TEACHER
NOTES The student will be able to: Students will:
collected from the same subjects; use relative frequencies calculated for rows or columns to describe possible association between two variables.
MP. 6 8.1.8.A.4 8.1.8.A.1 8.1.8.F.1
and female on the following topics:
*play video games yes or no. *types of video games *sports played *music *extra-curricular activities
Eye Color of Males Surveyed
Green 5 Blue 16 Brown 27
Eye Color of Females Surveyed Green 3 Blue 19 Brown 18
a) Make a two-way table b) Find and interpret the
marginal frequencies for the survey
c) For each eye color, what percent of the students are male? Female? Organize the results in a two-way table. Explain what two of the entries represent.
Marginal Frequencies – the sum of the rows and columns in a two-way table
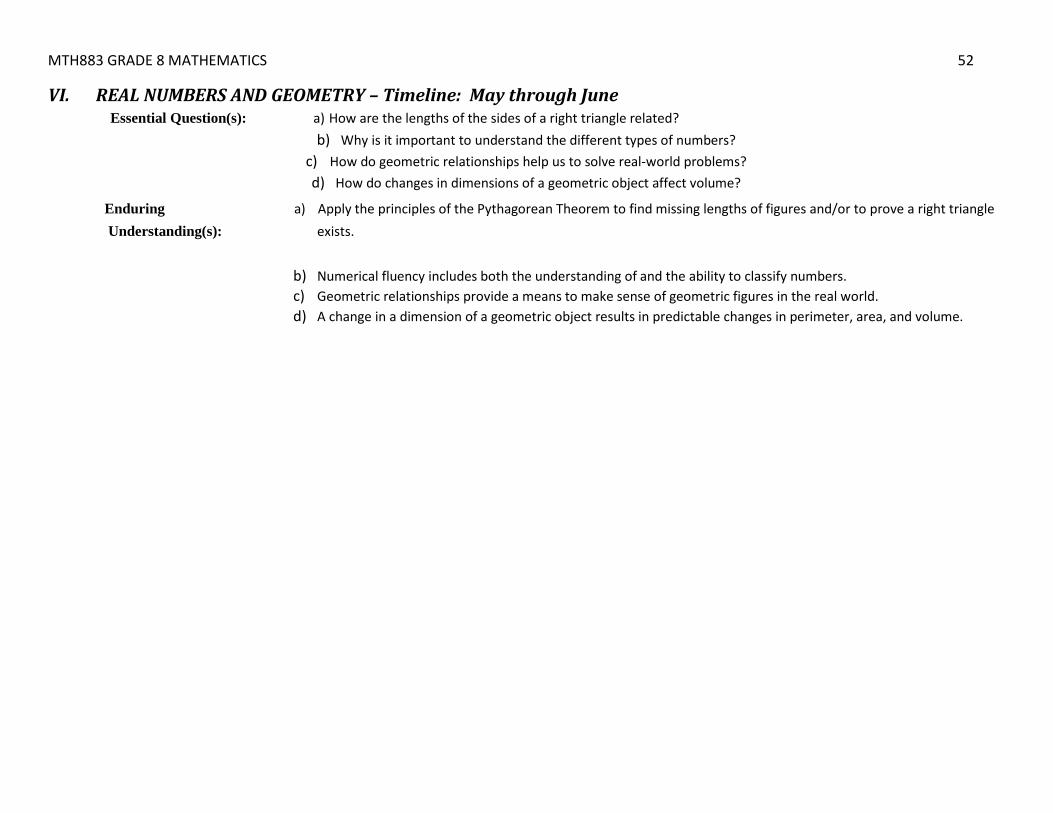
MTH883 GRADE 8 MATHEMATICS 52
VI. REAL NUMBERS AND GEOMETRY – Timeline: May through June Essential Question(s): a) How are the lengths of the sides of a right triangle related?
b) Why is it important to understand the different types of numbers? c) How do geometric relationships help us to solve real-world problems? d) How do changes in dimensions of a geometric object affect volume?
Enduring a) Apply the principles of the Pythagorean Theorem to find missing lengths of figures and/or to prove a right triangle Understanding(s): exists.
b) Numerical fluency includes both the understanding of and the ability to classify numbers. c) Geometric relationships provide a means to make sense of geometric figures in the real world. d) A change in a dimension of a geometric object results in predictable changes in perimeter, area, and volume.
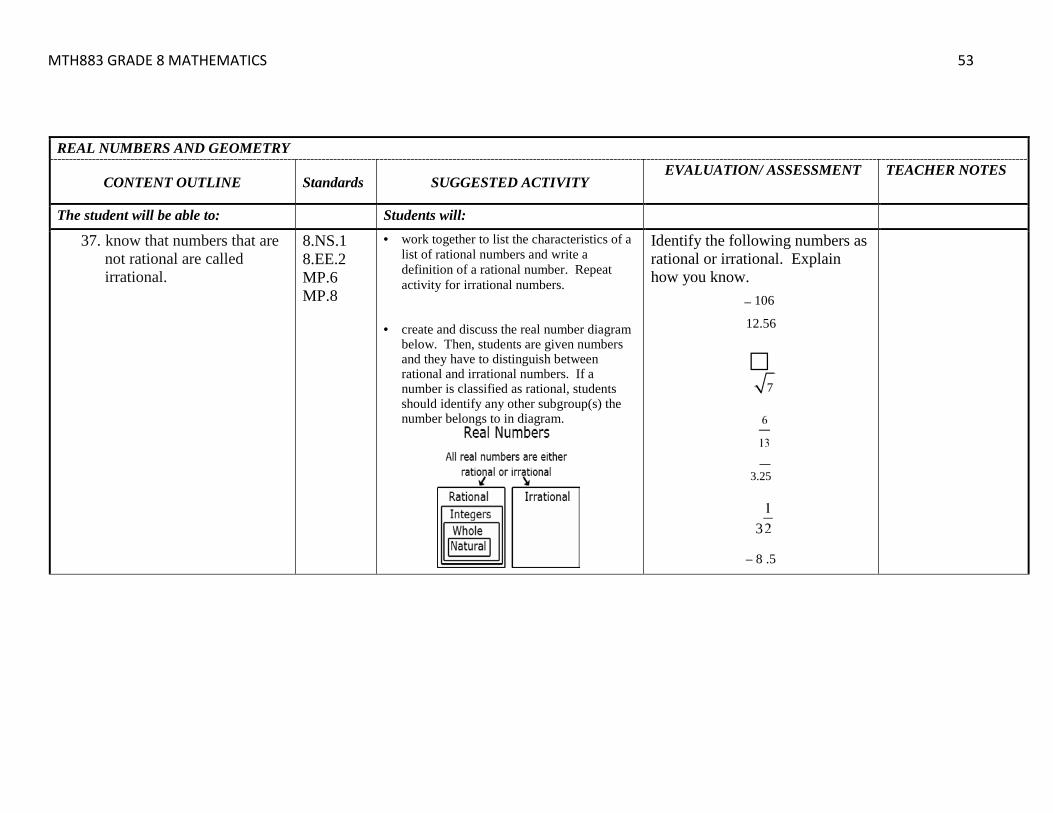
MTH883 GRADE 8 MATHEMATICS 53
REAL NUMBERS AND GEOMETRY
CONTENT OUTLINE Standards SUGGESTED ACTIVITY EVALUATION/ ASSESSMENT TEACHER NOTES
The student will be able to: Students will:
37. know that numbers that are not rational are called irrational.
8.NS.1 8.EE.2 MP.6 MP.8
• work together to list the characteristics of a list of rational numbers and write a definition of a rational number. Repeat activity for irrational numbers.
• create and discuss the real number diagram below. Then, students are given numbers and they have to distinguish between rational and irrational numbers. If a number is classified as rational, students should identify any other subgroup(s) the number belongs to in diagram.
Identify the following numbers as rational or irrational. Explain how you know. – 106
12.56
3.25
3
– 8 .5
7

MTH883 GRADE 8 MATHEMATICS 54
REAL NUMBERS AND GEOMETRY
CONTENT OUTLINE Standards SUGGESTED ACTIVITY EVALUATION/ ASSESSMENT TEACHER
NOTES The student will be able to: Students will:
38. understand informally that every number has a decimal expansion; for rational numbers show that the decimal expansion repeats eventually, and convert a decimal expansion, which repeats eventually into a rational number.
8.NS.1 MP.2 MP.7
• investigate repeating patterns that occur when fractions have denominators of 3, 7, 9, 99, or 11.
• convert repeating decimals into their fraction equivalent using patterns or algebraic reasoning.
Example: Change 0. 4 repeating to a fraction.
Step 1: Let x = 0.444444.....
Step 2: Multiply both sides so that the repeating digits will be in front of the decimal. In this example, one digit repeats so both sides are multiplied by 10, giving 10x = 4.4444444....
Step 3: Subtract the original equation from the new equation.
10x = 4.4444444.... – x = – 0.444444..... 9x = 4
Step 4: Solve the equation to determine the equivalent fraction.
9x4
x
Explain how to change a fraction to a decimal. How do you know if the resulting number is a repeating decimal?
Convert the repeating decimal to a fraction:
8.08
2.1

MTH883 GRADE 8 MATHEMATICS 55
REAL NUMBERS AND GEOMETRY
CONTENT OUTLINE Standards SUGGESTED ACTIVITY EVALUATION/ ASSESSMENT TEACHER
NOTES The student will be able to: Students will:
39. use rational approximations of irrational numbers to locate them on the number line.
8.NS.2 8.EE.2 MP.2 MP.7 MP.6
• explore the area of squares to determine and generate a list of perfect square numbers.
• find square roots of perfect square
numbers and square roots of nonperfect square numbers. Students discuss which square roots are rational and which square roots are irrational.
• plot rational square roots and
irrational square roots on a number line. For square roots of nonperfect squares, students find the two integers in which the square root falls between and create strategies for estimating square roots to the nearest tenth.
• explore plotting terminating, and
repeating decimals on a number line.
Without using your calculator, label approximate locations for the following numbers on a number line. Explain the strategy you used to determine your number line.
a) π
b) –(½π)
c) 2 √2
d) √17
Students work with negative square roots (ex. – √28 ) as well.

MTH883 GRADE 8 MATHEMATICS 56
REAL NUMBERS AND GEOMETRY
CONTENT OUTLINE Standards SUGGESTED ACTIVITY EVALUATION/ ASSESSMENT TEACHER
NOTES The student will be able to: Students will:
40. use rational approximations of irrational numbers to compare the size of irrational numbers and estimate the value of expressions.
8.NS.2 8.EE.2 MP.2 MP.6 MP.7
• compare and order rational and irrational numbers.
• develop strategies for estimating square roots to the nearest tenth.
• measure the diameter of circular objects and investigate both the estimated circumference and actual circumference of these objects.
Compare by estimating their values, plotting them on a number line, and making comparative statements. Solution: Statements for the
comparison could include:
are between the whole numbers 1 and 2 is between 1.7 and 1.8
is less than √3
While renovating his house, Archie needs two support beams. One beam has a length of 6 2 while another has a length of 2 6. Explain how you can find which beam is longer.
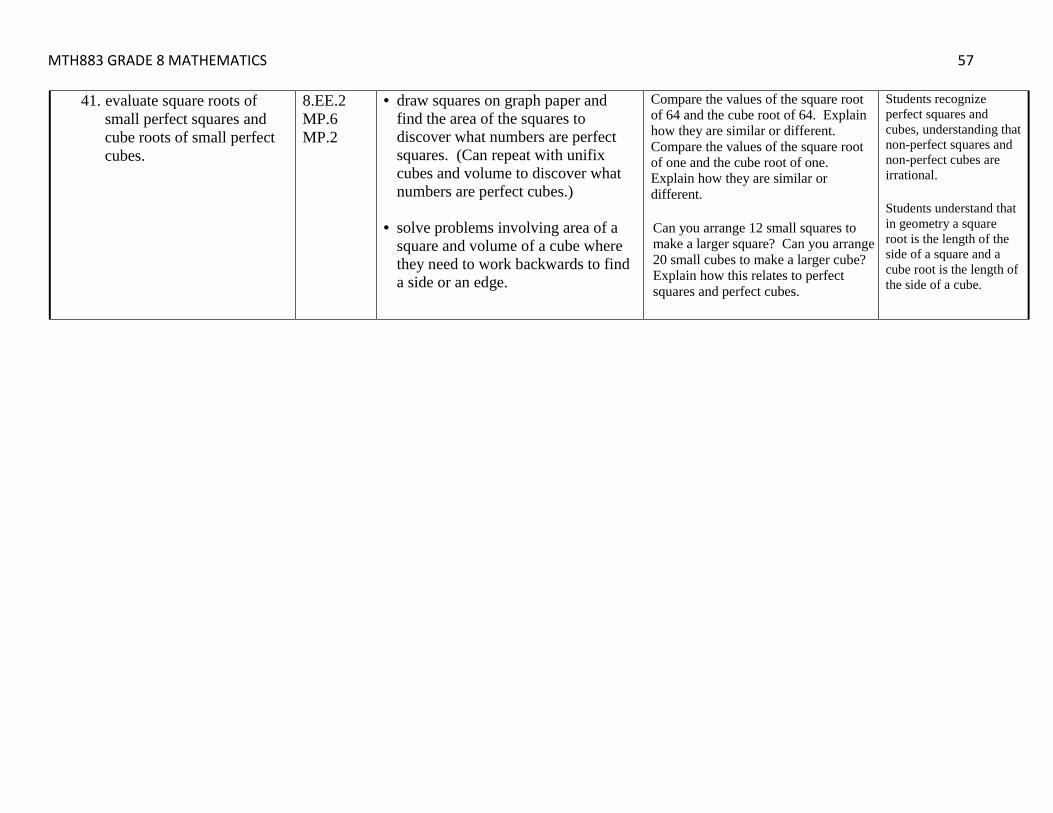
MTH883 GRADE 8 MATHEMATICS 57
41. evaluate square roots of small perfect squares and cube roots of small perfect cubes.
8.EE.2 MP.6 MP.2
• draw squares on graph paper and find the area of the squares to discover what numbers are perfect squares. (Can repeat with unifix cubes and volume to discover what numbers are perfect cubes.)
• solve problems involving area of a square and volume of a cube where they need to work backwards to find a side or an edge.
Compare the values of the square root of 64 and the cube root of 64. Explain how they are similar or different. Compare the values of the square root of one and the cube root of one. Explain how they are similar or different. Can you arrange 12 small squares to make a larger square? Can you arrange 20 small cubes to make a larger cube? Explain how this relates to perfect squares and perfect cubes.
Students recognize perfect squares and cubes, understanding that non-perfect squares and non-perfect cubes are irrational. Students understand that in geometry a square root is the length of the side of a square and a cube root is the length of the side of a cube.

MTH883 GRADE 8 MATHEMATICS 58
REAL NUMBERS AND GEOMETRY
CONTENT OUTLINE Standards SUGGESTED ACTIVITY EVALUATION/ ASSESSMENT TEACHER NOTES
The student will be able to: Students will: 42. use square root and cube root
symbols to represent solutions to equations of the form x2 = p and x3 = p, where p is a positive rational number.
8.EE.2 MP.4 MP.7 MP.8
review inverse operations and solving one step equations and create strategies for solving equations like
x 2 = 169 x 3 = 125.
Solve the following equations. Show work or explain.
x 2 = 9 x 3 = 8
Equations may include rational numbers such as x2 = 1/4, x2 = 4/9 or x3 = 1/8 (NOTE: Both the numerator and denominators are perfect squares or perfect cubes.)
43. explain a proof of the Pythagorean Theorem and its converse.
8.G.6 MP.2 MP.3
• using physical models and interactive digital applications, explore and explain the Pythagorean Theorem, showing that the sum of the squares of the legs is equal to the square of the hypotenuse in a right triangle. leg2
leg2 hypotenuse2
• complete a table similar to the one below to find Pythagorean Triples and make conclusions about which sets of numbers will make right triangles.
a b c a2 + b2 c2
The distance from Jonestown to Maryville is 180 miles, the distance from Maryville to Elm City is 300 miles, and the distance from Elm City to Jonestown is 240 miles. Do the three towns form a right triangle? Why or why not? Pick three numbers. Can these three numbers form the sides of a right triangle? Why or why not?
Students should be familiar with the common Pythagorean Triples. Emphasize: leg2 leg2 hypotenuse2

MTH883 GRADE 8 MATHEMATICS 59
REAL NUMBERS AND GEOMETRY
CONTENT OUTLINE Standards SUGGESTED ACTIVITY EVALUATION/ ASSESSMENT TEACHER
NOTES
The student will be able to: Students will: 44. apply the Pythagorean
Theorem to determine unknown side lengths in right triangles in real-world and mathematical problems in two and three dimensions.
8.G.7 MP.4 MP.7 MP.6 8.1.8.A.1
determine the straight line distance from Alyssa’s house to Sarah’s house if Alyssa bicycles 8 miles west to get from her house to school and after school, she bicycles 6 miles north to her friend Sarah’s house. How far is Alyssa’s house from Sarah’s house, measured in a straight line?
The diagram shown has a post is broken. What was the original height of the post?
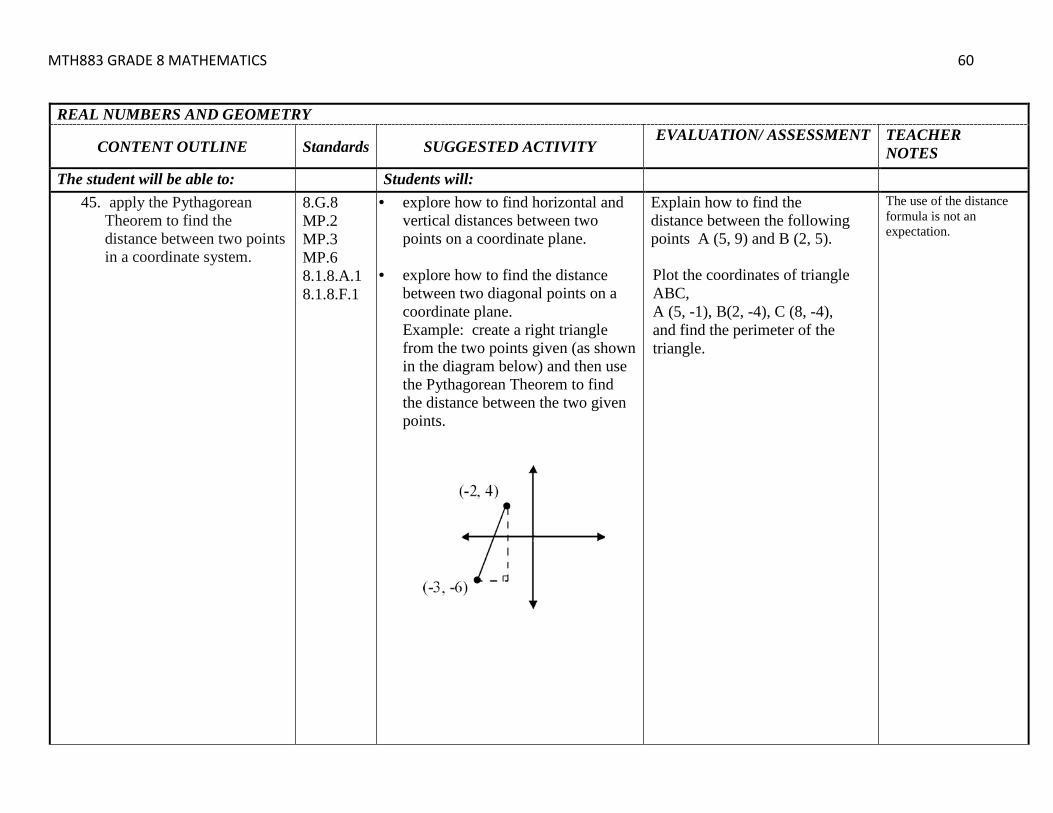
MTH883 GRADE 8 MATHEMATICS 60
REAL NUMBERS AND GEOMETRY
CONTENT OUTLINE Standards SUGGESTED ACTIVITY EVALUATION/ ASSESSMENT TEACHER
NOTES The student will be able to: Students will:
45. apply the Pythagorean Theorem to find the distance between two points in a coordinate system.
8.G.8 MP.2 MP.3 MP.6 8.1.8.A.1 8.1.8.F.1
• explore how to find horizontal and vertical distances between two points on a coordinate plane.
• explore how to find the distance
between two diagonal points on a coordinate plane. Example: create a right triangle from the two points given (as shown in the diagram below) and then use the Pythagorean Theorem to find the distance between the two given points.
Explain how to find the distance between the following points A (5, 9) and B (2, 5). Plot the coordinates of triangle ABC, A (5, -1), B(2, -4), C (8, -4), and find the perimeter of the triangle.
The use of the distance formula is not an expectation.

MTH883 GRADE 8 MATHEMATICS 61 REAL NUMBERS AND GEOMETRY
CONTENT OUTLINE Standards SUGGESTED ACTIVITY EVALUATION/ ASSESSMENT TEACHER NOTES
The student will be able to: Students will: 46. know the formulas for the
volumes of cones, cylinders, and spheres and use them to solve real- world and mathematical problems.
8.G.9 MP.1 MP.8 8.1.8.A.1
• use the formula for volume of a cylinder to perform an experiment to see how many full cones are needed to fill a cylinder with the same base size and same height as the cone. Students should then come up with a formula for finding the volume of a cone.
• explore real-life situations
involving volume. Example: James wanted to plant pansies in his new planter. He wondered how much potting soil he should buy to fill it. Use the measurements in the diagram below to determine the planter’s volume.
How much yogurt is needed to fill the cone below? Express your answers in terms of Pi.
Explain the relationship between the volume of a cylinder and a cone if they both have a radius of 6 cm and a height of 12 cm.
Answers may be left in terms of Pi.
MTH883 GRADE 8 MATHEMATICS 62
BIBLIOGRAPHY SOURCES Common Core State Standards – Mathematics. Washington, District of Columbia: National Governors Association Center for Best Practices and
Council of Chief State School Officers, 2010.
TEXTBOOKS McDougal-Littell Math, Course 3. Evanston, Illinois: McDougal-Littell, 2008. McDougal-Littell Algebra I, Evanston, Illinois: McDougal-Littell, 2004.
SUPPLEMENTAL TEXTBOOK MATERIALS Kaplan, Dr. Jerry. Common Core Coach – Mathematics 8. New York, New York: Triumph Learning, 2013. On Core Mathematics – Middle School Grade 8. Orlando, Florida: Houghton Mifflin Harcourt, 2010. The Common Core: Clarifying Expectations for Teachers & Students. Grade 8, Columbus, Ohio: Align, Assess, Achieve, LLC, 2011. Big Ideas Math. Grade 8, Erie, Pennsylvania: Big Ideas Learning LLC, 2014 Common Core Math Workouts, Grade 8, US: Mark Twain Media, Inc., 2014
RESOURCES 8th Grade Mathematics – Unpacked Content. Raleigh, North Carolina: North Carolina Department of Public Instruction, February 2012. Arizona Academic Content Standards, Grade 8. Phoenix, Arizona: Arizona Department of Education, 2010.
WEBSITES Alex.state.al.us/index.php. Alabama Department of Education, 2013. EngageNY.org. New York State Education Department, 2013. Illustrativemathematics.org. Institute for Mathematics and Education, 2013. InsideMathematics.org. Noyce Foundation, 2013. ixl.com/standards/common-core/math/grade-8. IXL Learning, 2013 MathScholastic.com. Scholastic, 2013. http://www.doe.k12.de.us/commoncore/math/teachertoolkit/sbac8.pdf http://www.doe.k12.de.us/aab/Mathematics/Mathematics_docs_folder/DE_CCSS_grade8.pdf http://www.opusmath.com/ http://www.corestandards.org/ https://www.parcconline.org/
MTH883 GRADE 8 MATHEMATICS 63
APPENDIX A SAMPLE AUTHENTIC ASSESSMENT
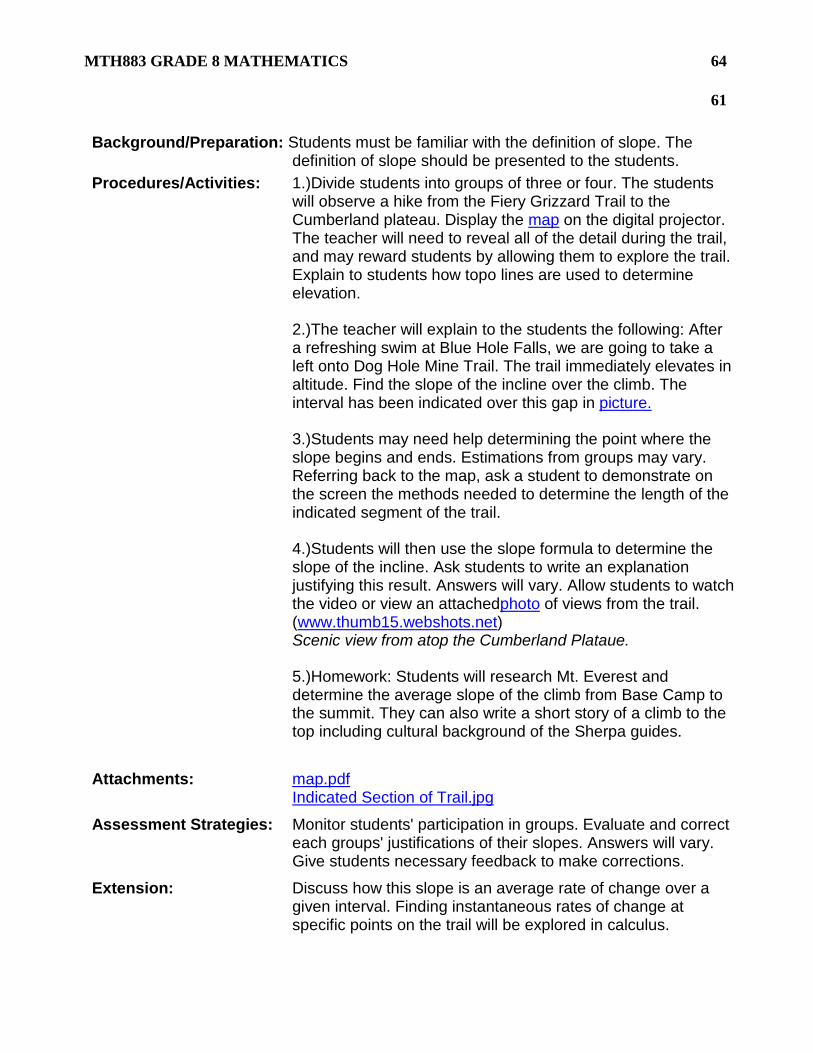
MTH883 GRADE 8 MATHEMATICS 64 61 Background/Preparation: Students must be familiar with the definition of slope. The definition of slope should be presented to the students. Procedures/Activities: 1.)Divide students into groups of three or four. The students
will observe a hike from the Fiery Grizzard Trail to the Cumberland plateau. Display the map on the digital projector. The teacher will need to reveal all of the detail during the trail, and may reward students by allowing them to explore the trail. Explain to students how topo lines are used to determine elevation. 2.)The teacher will explain to the students the following: After a refreshing swim at Blue Hole Falls, we are going to take a left onto Dog Hole Mine Trail. The trail immediately elevates in altitude. Find the slope of the incline over the climb. The interval has been indicated over this gap in picture. 3.)Students may need help determining the point where the slope begins and ends. Estimations from groups may vary. Referring back to the map, ask a student to demonstrate on the screen the methods needed to determine the length of the indicated segment of the trail. 4.)Students will then use the slope formula to determine the slope of the incline. Ask students to write an explanation justifying this result. Answers will vary. Allow students to watch the video or view an attachedphoto of views from the trail. (www.thumb15.webshots.net) Scenic view from atop the Cumberland Plataue. 5.)Homework: Students will research Mt. Everest and determine the average slope of the climb from Base Camp to the summit. They can also write a short story of a climb to the top including cultural background of the Sherpa guides.
Attachments: map.pdf Indicated Section of Trail.jpg
Assessment Strategies: Monitor students' participation in groups. Evaluate and correct each groups' justifications of their slopes. Answers will vary. Give students necessary feedback to make corrections.
Extension: Discuss how this slope is an average rate of change over a given interval. Finding instantaneous rates of change at specific points on the trail will be explored in calculus.

MTH883 GRADE 8 MATHEMATICS 65 62
FBI Scatterplot Assessment
Scenario: Today is your first day of work as a forensics expert for the FBI. Your first case has just been handed to you. State police in New Jersey have discovered a human radius bone which is 24.5 centimeters long. Your task is to determine the height of the person whose bone was found and give reasons to support this height. Part A: 1. Is there anything missing from the given scatter plot? If so, list the missing items here and fix
the scatter plot you were given. 2. What information is being represented by the x-coordinate? 3. What information is being represented by the y-coordinate? 4. For the data collected, how many people were surveyed? Explain how you determined this. 5. What was the tallest height recorded? 6. What was the length of the radius bone that was the mode of this data? Part B: 1. Give the correlation (pos., neg., or none) shown by each of the following scatter plots.
a. b. c.
a. ________________ b. ________________ c. _______________
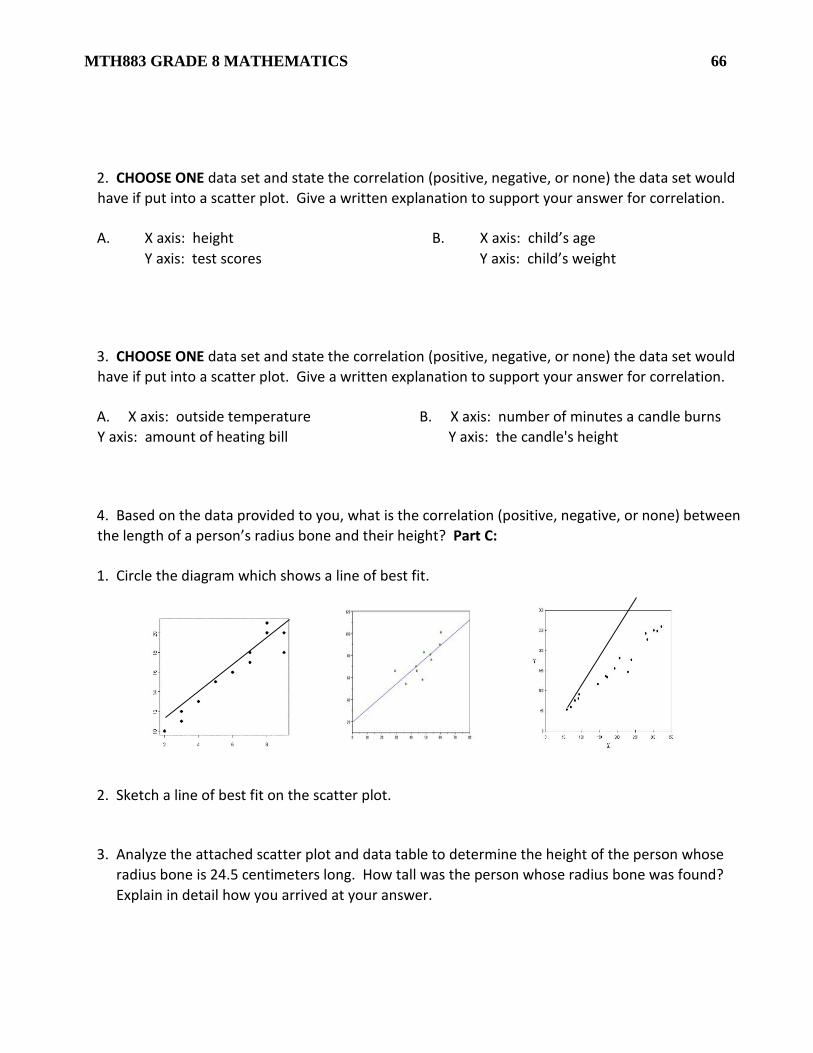
MTH883 GRADE 8 MATHEMATICS 66 2. CHOOSE ONE data set and state the correlation (positive, negative, or none) the data set would have if put into a scatter plot. Give a written explanation to support your answer for correlation.
A. X axis: height B. X axis: child’s age Y axis: test scores Y axis: child’s weight
3. CHOOSE ONE data set and state the correlation (positive, negative, or none) the data set would have if put into a scatter plot. Give a written explanation to support your answer for correlation. A. X axis: outside temperature B. X axis: number of minutes a candle burns Y axis: amount of heating bill Y axis: the candle's height 4. Based on the data provided to you, what is the correlation (positive, negative, or none) between the length of a person’s radius bone and their height? Part C: 1. Circle the diagram which shows a line of best fit.
2. Sketch a line of best fit on the scatter plot. 3. Analyze the attached scatter plot and data table to determine the height of the person whose
radius bone is 24.5 centimeters long. How tall was the person whose radius bone was found? Explain in detail how you arrived at your answer.

MTH883 GRADE 8 MATHEMATICS 67
The table below lists all ordered pairs of data used in the attached scatter plot.
Radius (cm) Height (cm)
21 151 22 160 23 150
23.5 152 23.5 162 24 159 24 155 25 166 25 158 26 168 26 156 26 165 27 167 27 170 27 177 27 169
27.5 183 27.5 179 28 180 29 177

MTH883 GRADE 8 MATHEMATICS 68
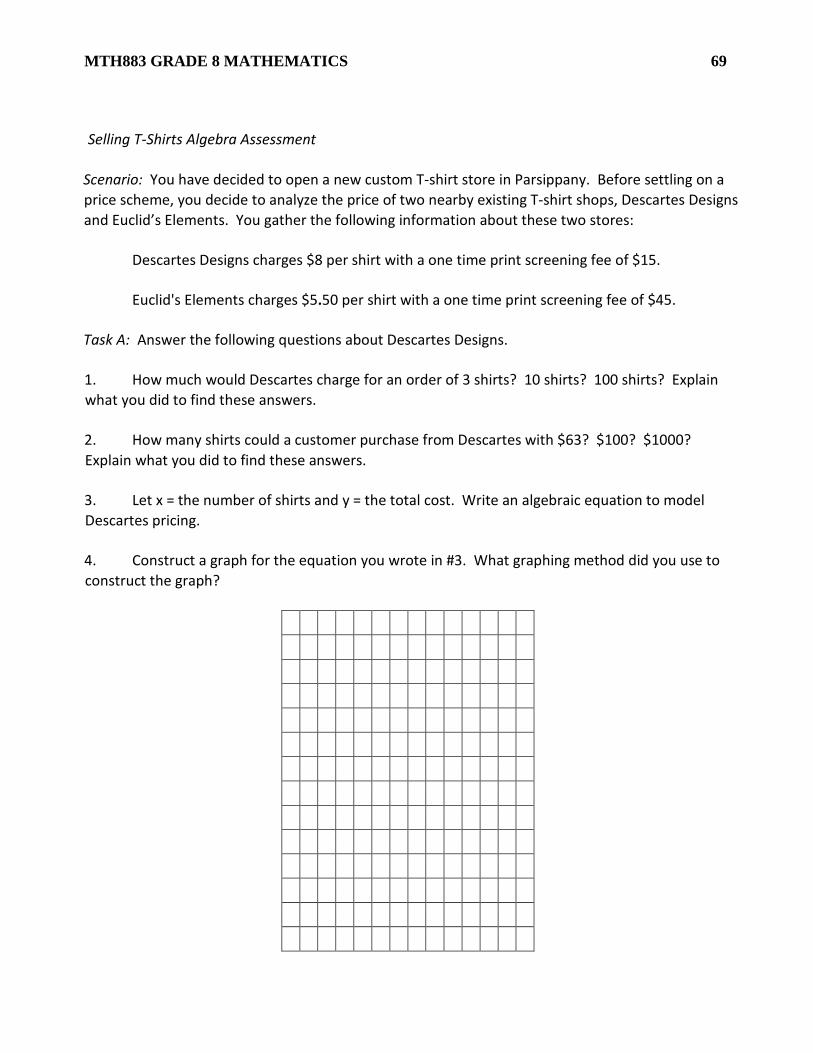
MTH883 GRADE 8 MATHEMATICS 69 Selling T-Shirts Algebra Assessment Scenario: You have decided to open a new custom T-shirt store in Parsippany. Before settling on a price scheme, you decide to analyze the price of two nearby existing T-shirt shops, Descartes Designs and Euclid’s Elements. You gather the following information about these two stores:
Descartes Designs charges $8 per shirt with a one time print screening fee of $15.
Euclid's Elements charges $5.50 per shirt with a one time print screening fee of $45. Task A: Answer the following questions about Descartes Designs. 1. How much would Descartes charge for an order of 3 shirts? 10 shirts? 100 shirts? Explain what you did to find these answers. 2. How many shirts could a customer purchase from Descartes with $63? $100? $1000? Explain what you did to find these answers. 3. Let x = the number of shirts and y = the total cost. Write an algebraic equation to model Descartes pricing. 4. Construct a graph for the equation you wrote in #3. What graphing method did you use to construct the graph?

MTH883 GRADE 8 MATHEMATICS 70 Scenario: You have decided to open a new custom T-shirt store in Parsippany. Before settling on a price scheme, you decide to analyze the prices of two nearby existing T-shirt shops, Descartes Designs and Euclid’s Elements. You gather the following information about these two stores:
Descartes Designs charges $8 per shirt with a one time print screening fee of $15.
Euclid's Elements charges $5.50 per shirt with a one time print screening fee of $45. Task B: Answer the following questions about Euclid’s Elements. 1. How much would Euclid's Elements charge for an order of 3 shirts? 10 shirts? 100 shirts? Explain what you did to find these answers. 2. How many shirts could a customer purchase from Euclid's Elements with $83.50? $100? $1000? Explain what you did to find these answers. 3. Let x = the number of shirts and y = the total cost. Write an algebraic equation to model Euclid’s pricing. 4. Construct a graph for the equation you wrote in #3. What graphing method did you use to construct the graph?
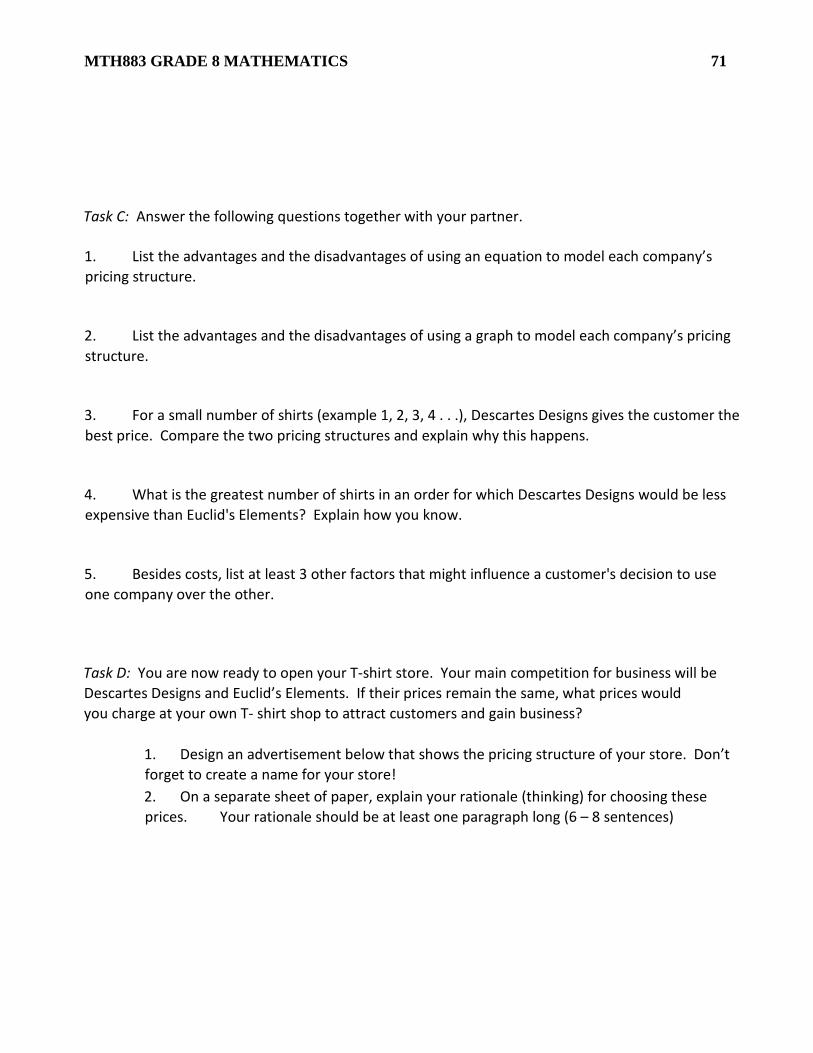
MTH883 GRADE 8 MATHEMATICS 71 Task C: Answer the following questions together with your partner. 1. List the advantages and the disadvantages of using an equation to model each company’s pricing structure. 2. List the advantages and the disadvantages of using a graph to model each company’s pricing structure. 3. For a small number of shirts (example 1, 2, 3, 4 . . .), Descartes Designs gives the customer the best price. Compare the two pricing structures and explain why this happens. 4. What is the greatest number of shirts in an order for which Descartes Designs would be less expensive than Euclid's Elements? Explain how you know. 5. Besides costs, list at least 3 other factors that might influence a customer's decision to use one company over the other. Task D: You are now ready to open your T-shirt store. Your main competition for business will be Descartes Designs and Euclid’s Elements. If their prices remain the same, what prices would you charge at your own T- shirt shop to attract customers and gain business?
1. Design an advertisement below that shows the pricing structure of your store. Don’t forget to create a name for your store! 2. On a separate sheet of paper, explain your rationale (thinking) for choosing these prices. Your rationale should be at least one paragraph long (6 – 8 sentences)
MTH883 GRADE 8 MATHEMATICS 69
APPENDIX B SELF-ASSESSMENT
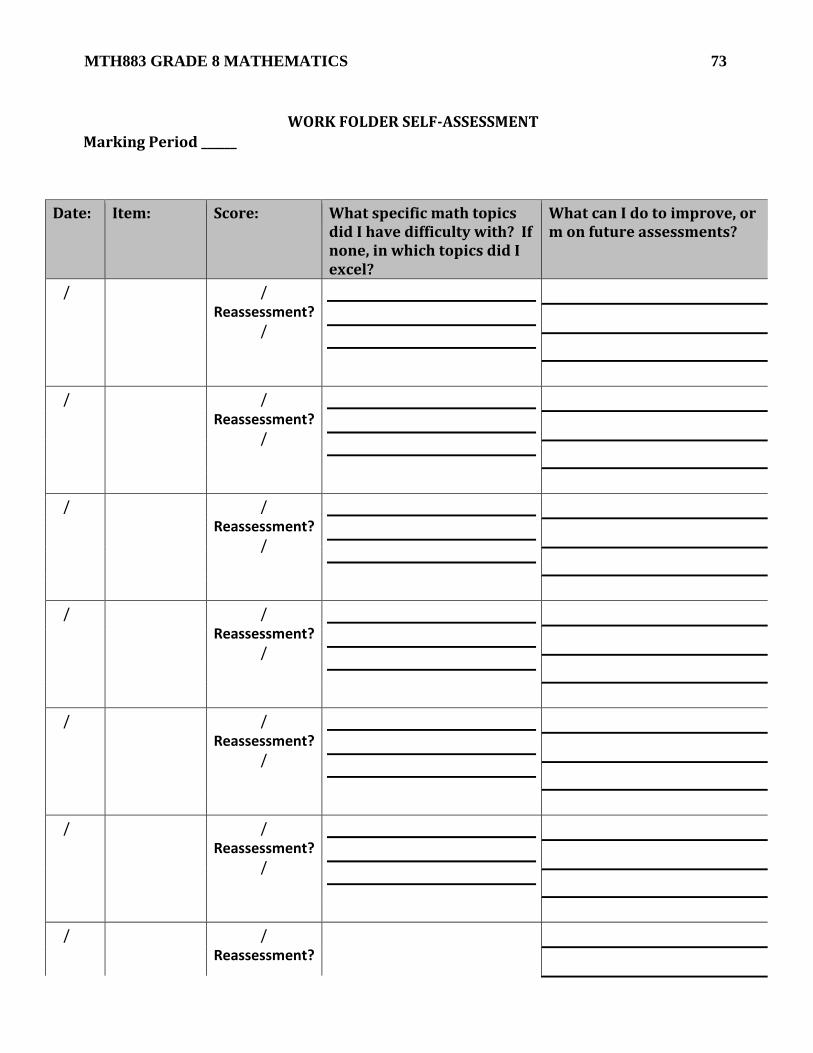
MTH883 GRADE 8 MATHEMATICS 73
WORK FOLDER SELF-ASSESSMENT Marking Period ______
Date: Item: Score: What specific math topics did I have difficulty with? If none, in which topics did I excel?
What can I do to improve, or m on future assessments?
/
/ Reassessment?
/
/
/ Reassessment?
/
/
/ Reassessment?
/
/
/ Reassessment?
/
/
/ Reassessment?
/
/
/ Reassessment?
/
/
/ Reassessment?

MTH883 GRADE 8 MATHEMATICS 74
NAME: ____________________________________________________ TEACHER: ______________________ All reflections must be at least one complete sentence with 12 or more words!
/
/
/ Reassessment?
/

MTH883 GRADE 8 MATHEMATICS 75
Name: Grade: 8
Date: Teacher: WORK FOLDER REFLECTION – MID YEAR Look through the various items in your work folder and take a moment to think about this school year. Answer the following questions in the form of a paragraph to reflect on your progress so far this year. What were some of your goals in the beginning of this school year? Have you made progress towards achieving them? What are some goals you have for the rest of this school year? In what areas did you have the most success? Be specific by indicating the topics in which you feel most confident. In what areas did you have difficulty? What are some ways you can improve in those areas? What can you do to prepare yourself for the final exam? Now that half of the year has passed, what are some things that you have learned that will help you next year? (i.e. study skills, putting more effort in homework, etc.)
MTH883 GRADE 8 MATHEMATICS 76 What are some things that you enjoy about this class? What are some things you don’t like? Do you have any suggestions as to what would make the class better?
Name: Grade: 8
Date: Teacher: WORK FOLDER REFLECTION – END OF YEAR Look through the various items in your work folder and take a moment to think about this past school year. Answer the following questions in the form of a paragraph to reflect on your progress. After looking over your work folder with all of your assessments from this year, what are your strengths? What are your weaknesses?
How can you continue to use your strengths to be successful? Be specific and explain. How can you improve your areas of weakness? Give yourself at least one goal in order to help you improve. Which assessment(s) make you the most proud? Explain why.
On which assessment(s) do you think you could have done better? Explain why and how.
What is a goal you want to achieve? How do you plan on doing this?
MTH883 GRADE 8 MATHEMATICS
APPENDIX C TEACHER RESOURCE SAMPLE QUESTIONS
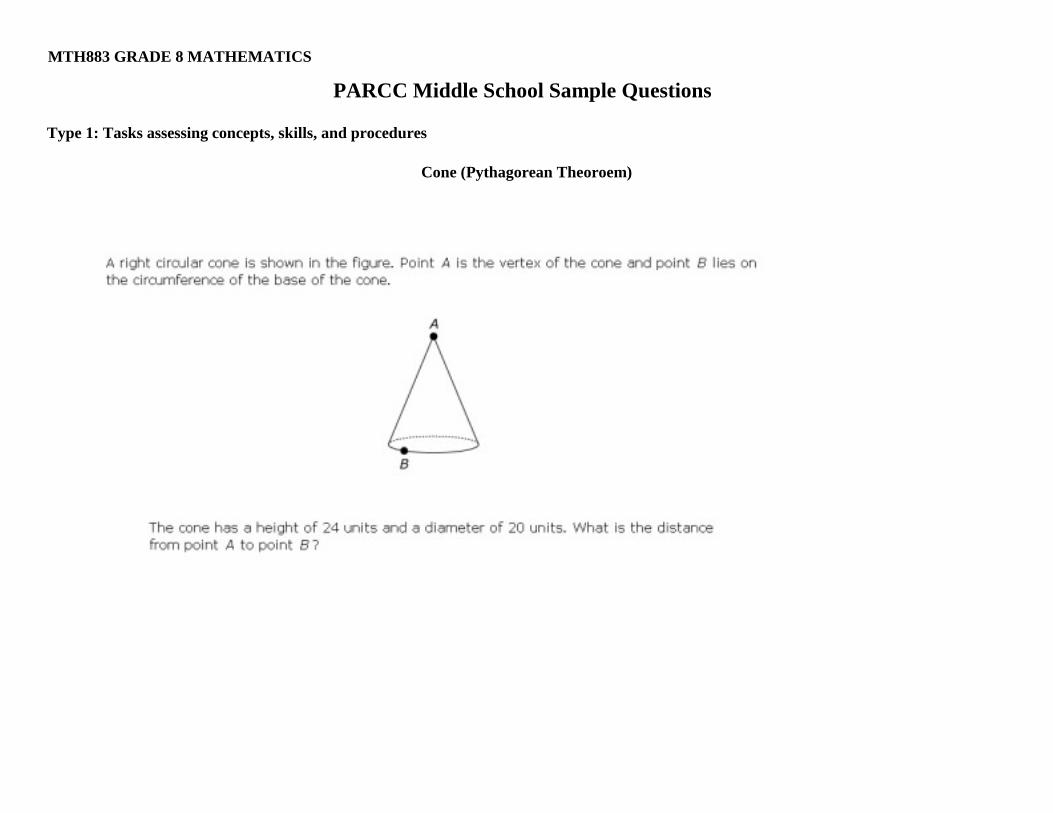
MTH883 GRADE 8 MATHEMATICS
PARCC Middle School Sample Questions Type 1: Tasks assessing concepts, skills, and procedures
Cone (Pythagorean Theoroem)

MTH883 GRADE 8 MATHEMATICS 79 Type 2: Tasks assessing expressing mathematical reasoning
Proportional Reasoning

MTH883 GRADE 8 MATHEMATICS 80 Type 3: Tasks assessing modeling or applications
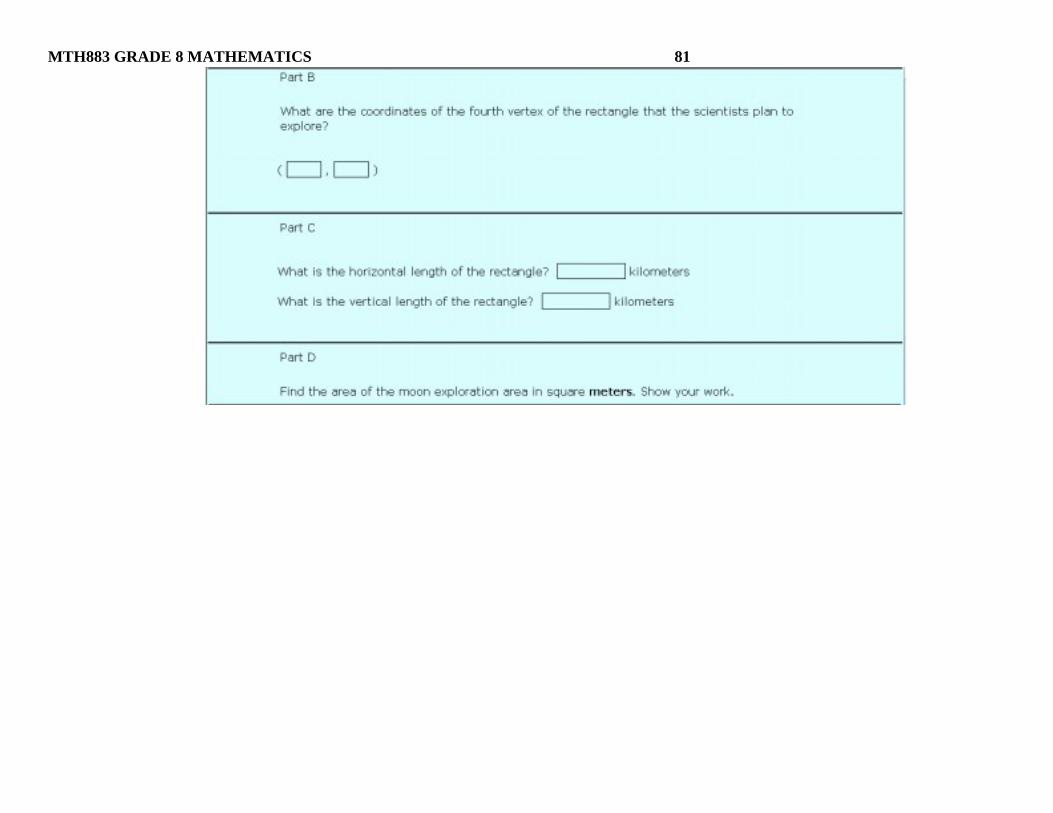
MTH883 GRADE 8 MATHEMATICS 81

MTH883 GRADE 8 MATHEMATICS 82
APPENDIX D PARCC FRMEWORK CONTENT EMPHASES BY CLUSTER
MTH883 GRADE 8 MATHEMATICS
Grade 8 - Content Emphases by Cluster Not all of the content in a given grade is emphasized equally in the standards. Some clusters require greater emphasis than the others based on the depth of the ideas, the time that they take to master, and/or their importance to future mathematics or the demands of college and career readiness. In addition, an intense focus on the most critical material at each grade allows depth in learning, which is carried out through the Standards for Mathematical Practice. To say that some things have greater emphasis is not to say that anything in the standards can safely be neglected in instruction. Neglecting material will leave gaps in student skill and understanding and may leave students unprepared for the challenges of a later grade. All standards figure in a mathematical education and will therefore be eligible for inclusion on the PARCC assessment. However, the assessments will strongly focus where the standards strongly focus. In addition to identifying the Major (M), Additional (A), and Supporting (S) Clusters for each grade, suggestions are given following the table on the next page for ways to connect the Supporting to the Major Clusters of the grade. Thus, rather than suggesting even inadvertently that some material not be taught, there is direct advice for teaching it, in ways that foster greater focus and coherence. The Number System S Know that there are numbers that are not rational, and approximate them by rational numbers. Expressions and Equations M Work with radicals and integer exponents. M Understand the connections between proportional relationships, lines and linear equations. M Analyze and solve linear equations and pairs of simultaneous linear equations. Functions M Define, evaluate and compare functions. M Use functions to model relationships between quantities. Geometry M Understand congruence and similarity using physical models, transparencies or geometry software. M Understand and apply the Pythagorean Theorem. A Solve real-world and mathematical problems involving volume of cylinders, cones and spheres. Statistics and Probability S Investigate patterns of association in bivariate data.
MTH883 GRADE 8 MATHEMATICS
APPENDIX E PARCC ASSESSMENT REFERENCE SHEET

MTH883 GRADE 8 MATHEMATICS 85
Assessment Reference Sheet
Grade 8
1 inch = 2.54 centimeters 1 kilometer = 0.62 mile 1 cup = 8 fluid ounces 1 meter = 30.37 inches 1 pound = 16 ounces 1 pint = 2 cups 1 mile = 5, 280 feet 1 pound = 0.454 kilograms 1 quart = 2 pints 1 mile = 1,760 yards 1 kilogram = 2.2 pounds 1 gallon = 3.785 liters 1 mile = 1.609 kilometers 1 ton = 2,000 pounds 1 gallon = 3.785 liters 1 liter = 0.264 gallons 1 liter = 1000 cubic centimeters
Triangle A=1/2 bh Parallelogram A= bh Circle A= πr 2 Circle C =πd or or C = 2πr General Prisms V =Bh Cylinder V=πr2h Sphere V=4/3 πr3 Cone V=4/3 πr2h Pythagorean Theorem a2+b2=c2
Approved as of 8/912 by PARCX Leadership Team

MTH883 GRADE 8 MATHEMATICS
APPENDIX F SHOWCASE PORTFOLIO

MTH883 GRADE 8 MATHEMATICS 87
Name: Grade: 8 Date: Teacher:
MATHEMATICS SHOWCASE PORTFOLIO The following items are required for your Mathematics Showcase Portfolio for this school year: (A) Three Summative Assessments:
• Geometry • Equations & Functions • Your choice
_________________
MTH883 GRADE 8 MATHEMATICS
APPENDIX G NEW JERSEY STUDENT LEARNING STANDARDS

MTH883 GRADE 8 MATHEMATICS
NEW JERSEY STUDENT LEARNING STANDARDS
4 - Mathematics
8 - Technology
9 - 21st Century Life and Careers


MTH883 GRADE 8 MATHEMATICS
APPENDIX H CURRICULUM MODIFICATIONS & ADAPTATIONS

MTH883 GRADE 8 MATHEMATICS
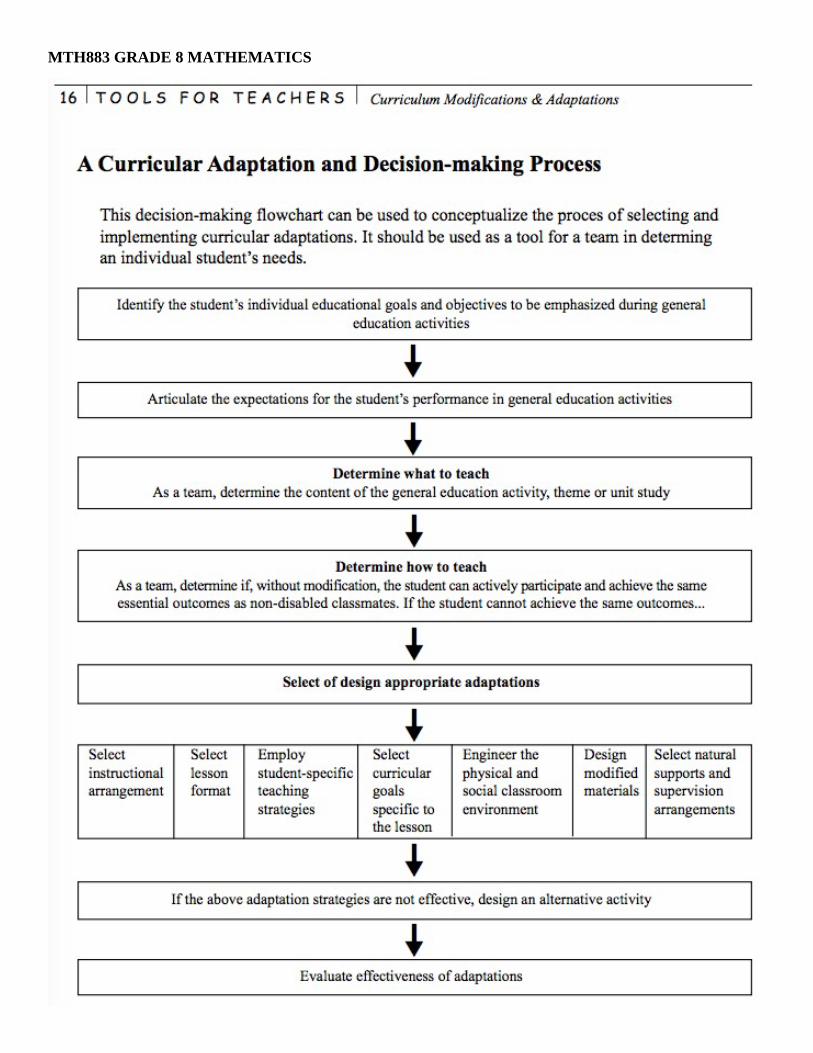
MTH883 GRADE 8 MATHEMATICS

MTH883 GRADE 8 MATHEMATICS

MTH883 GRADE 8 MATHEMATICS

MTH883 GRADE 8 MATHEMATICS

MTH883 GRADE 8 MATHEMATICS
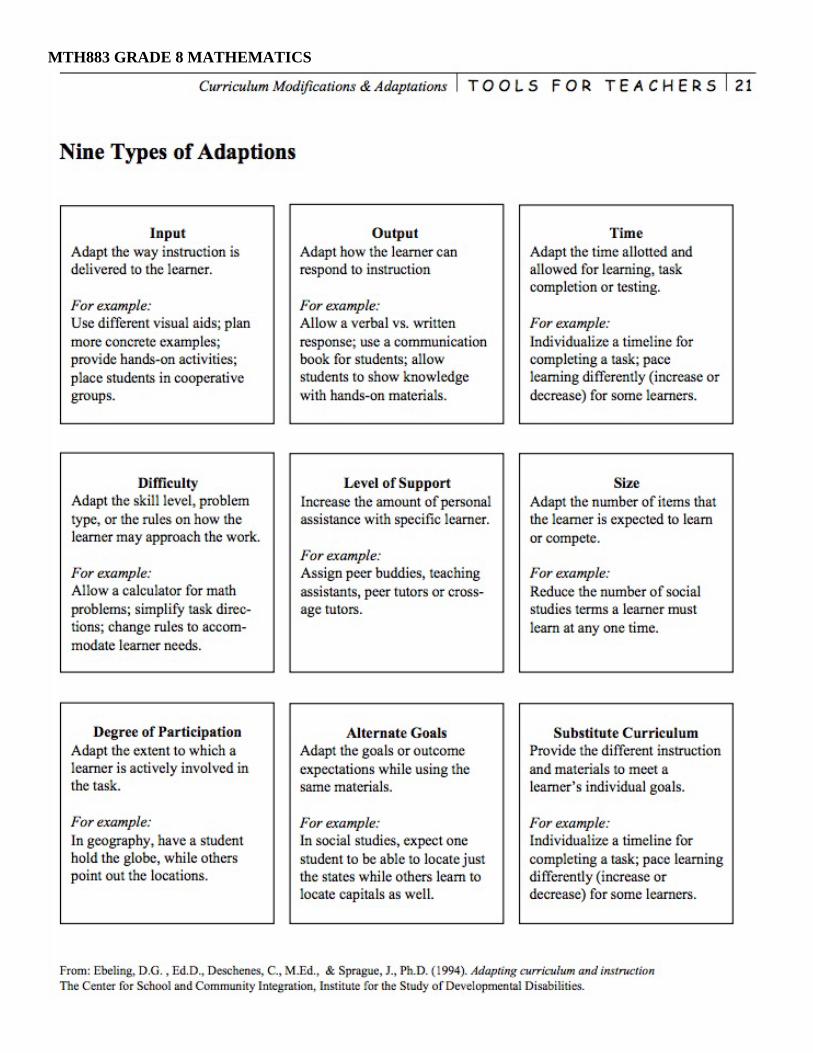
MTH883 GRADE 8 MATHEMATICS
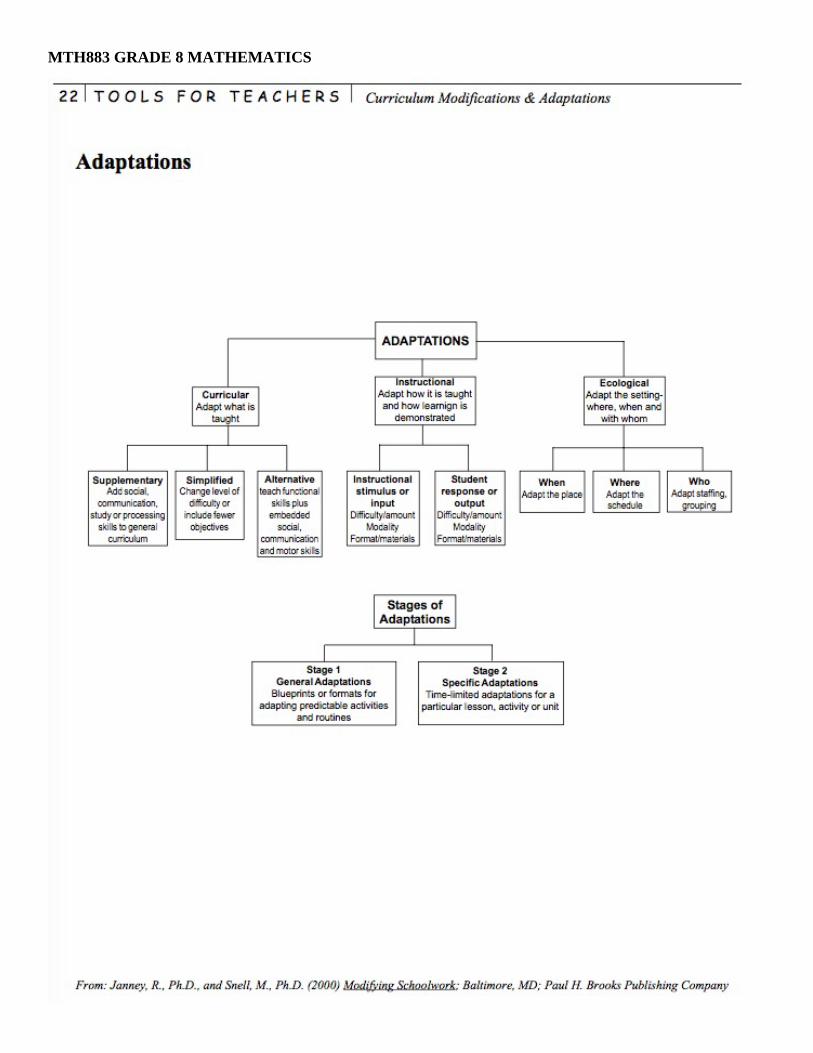
MTH883 GRADE 8 MATHEMATICS

MTH883 GRADE 8 MATHEMATICS

MTH883 GRADE 8 MATHEMATICS
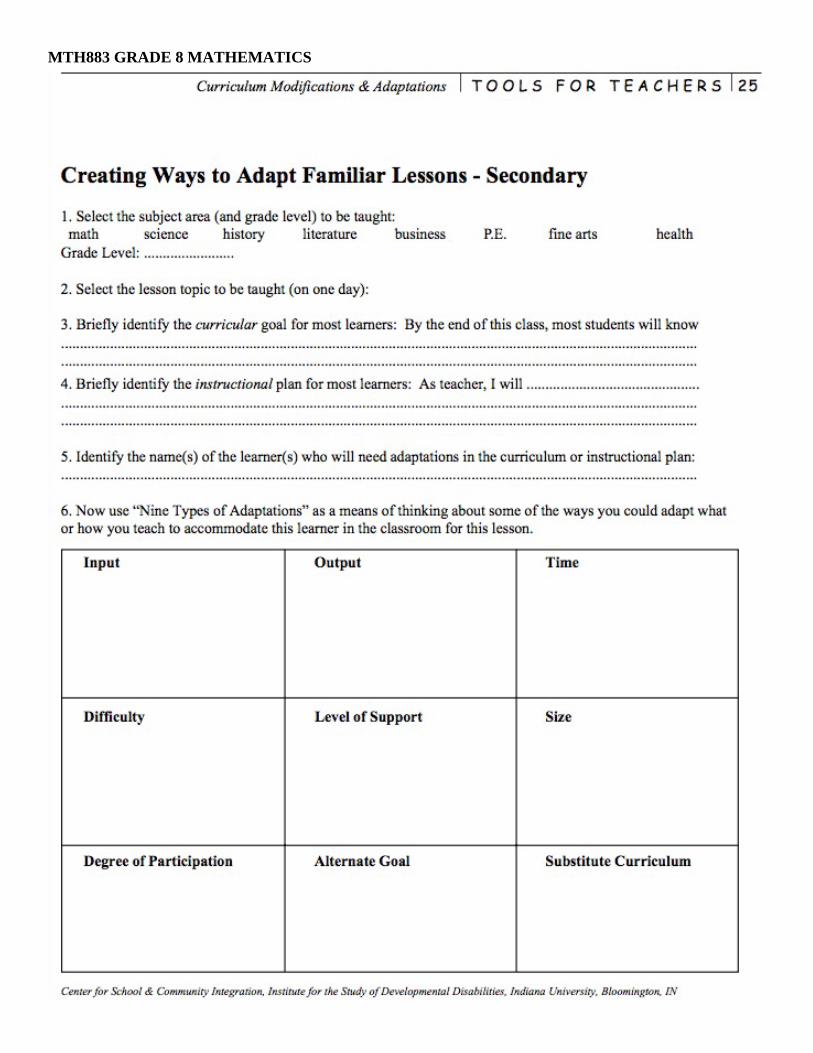
MTH883 GRADE 8 MATHEMATICS
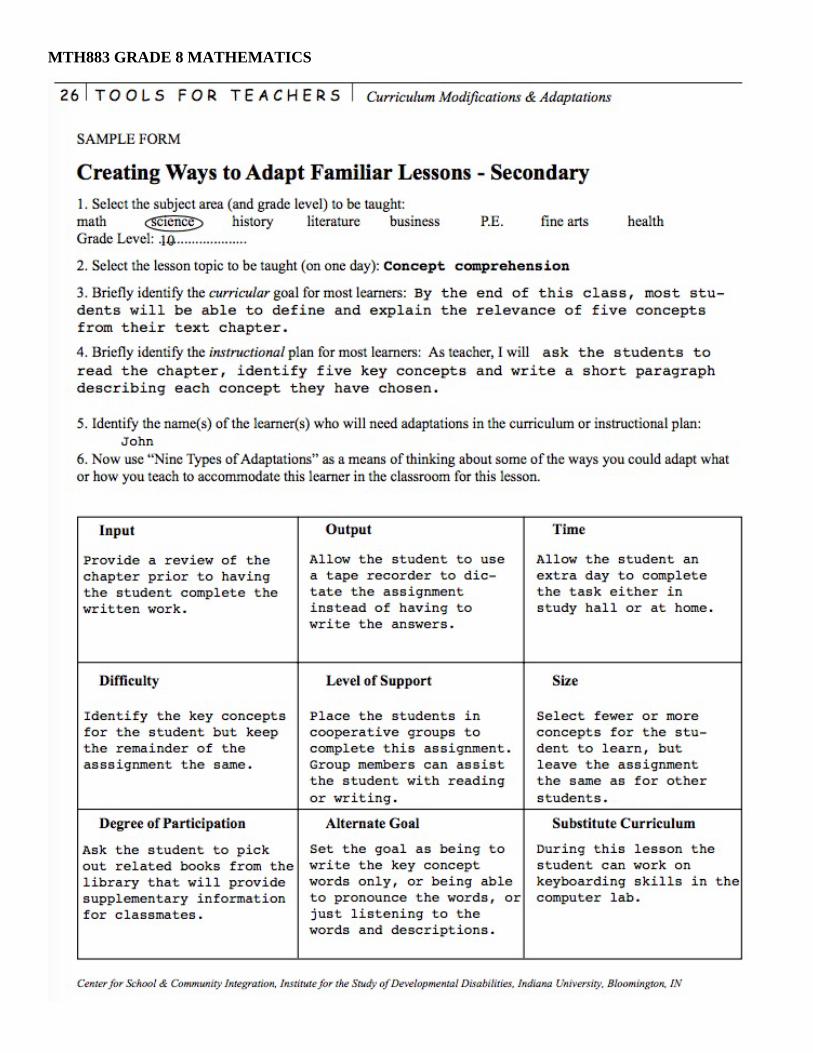
MTH883 GRADE 8 MATHEMATICS
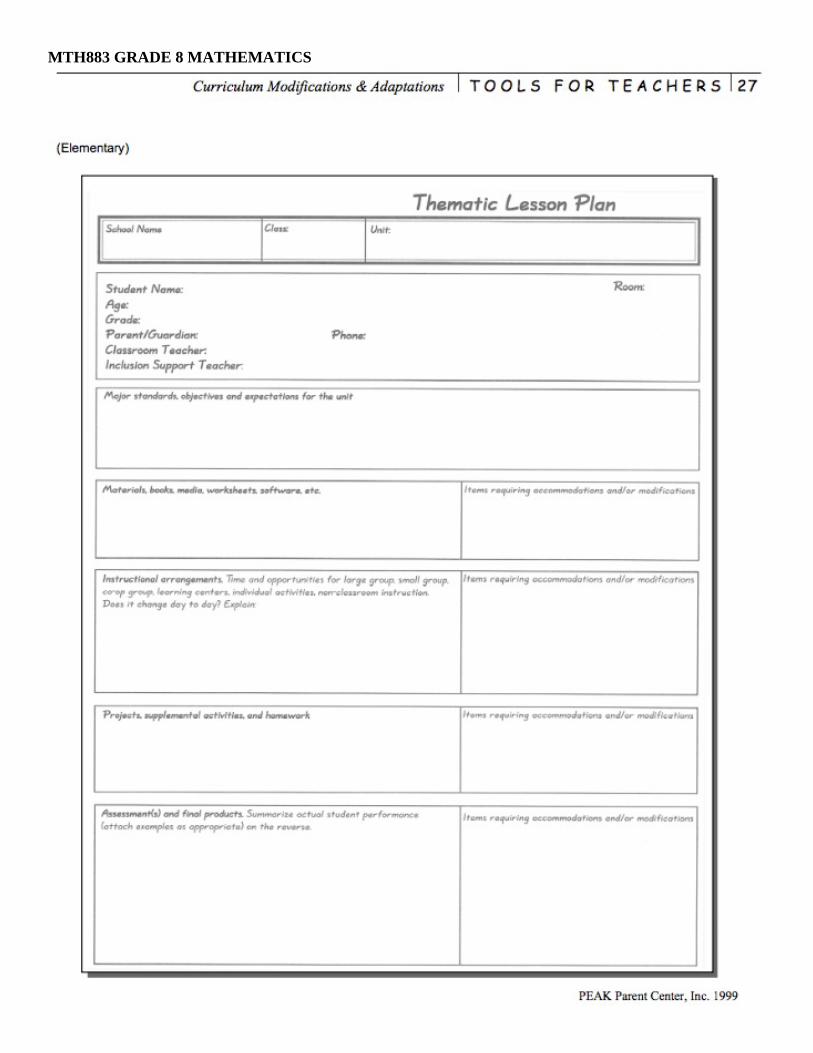
MTH883 GRADE 8 MATHEMATICS
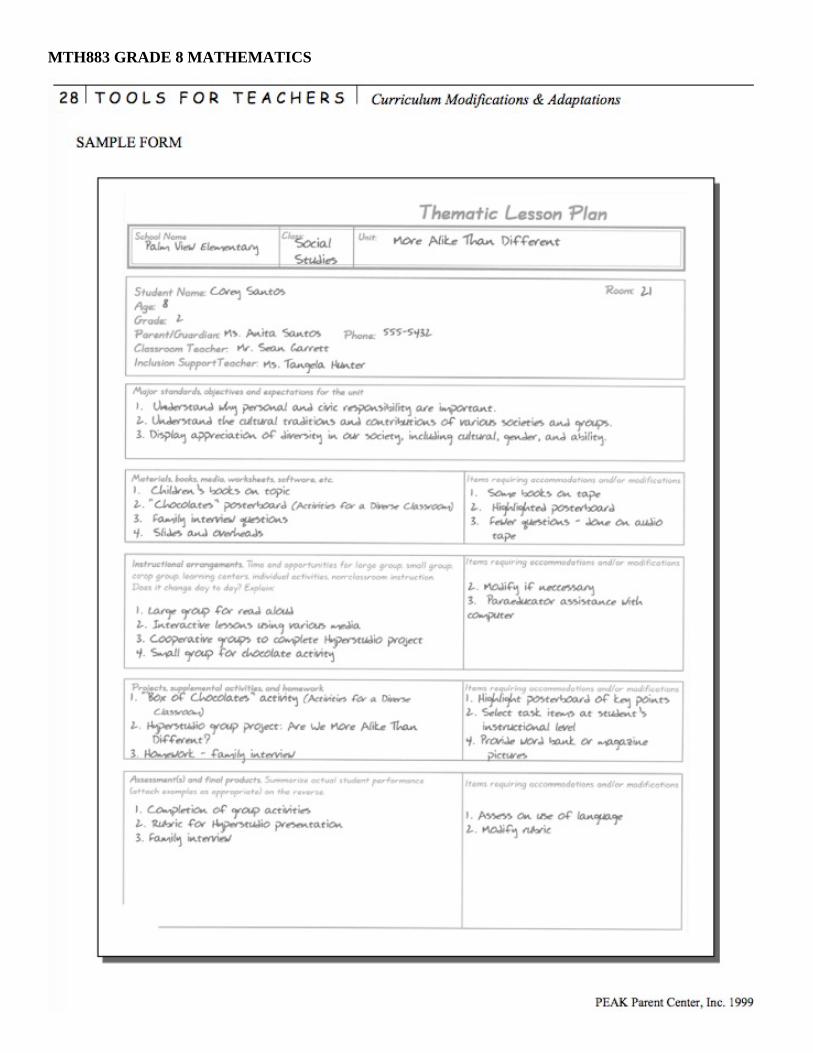
MTH883 GRADE 8 MATHEMATICS
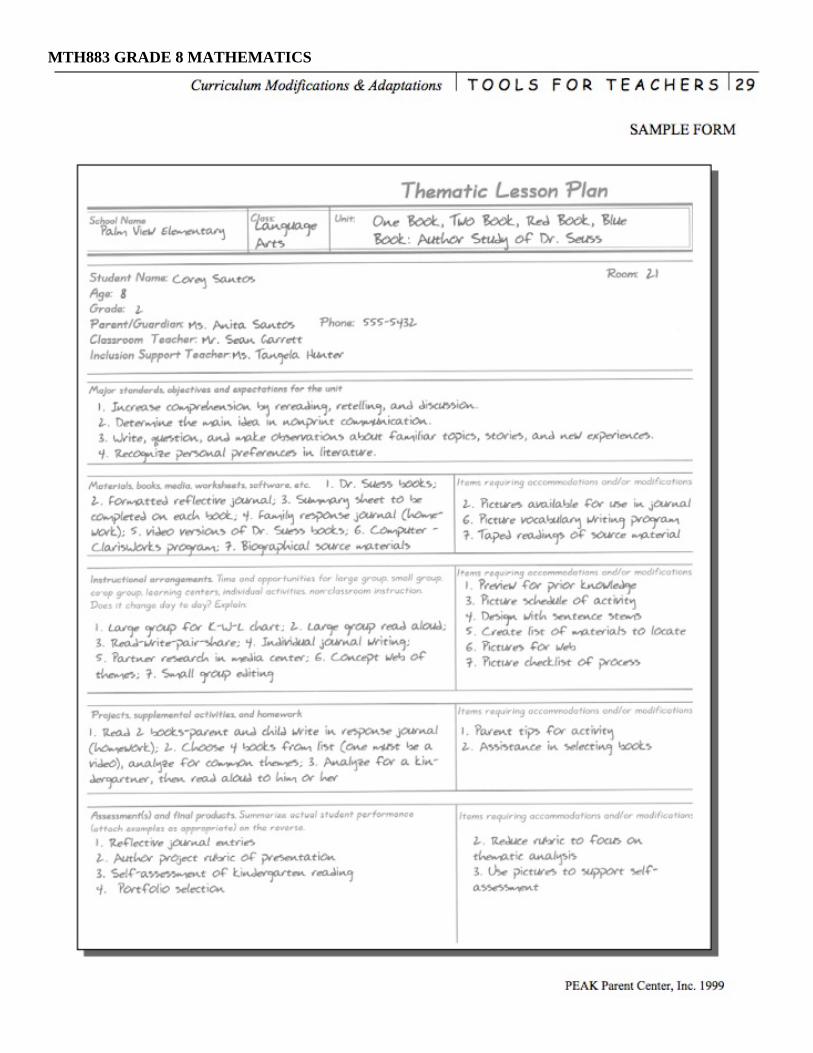
MTH883 GRADE 8 MATHEMATICS
MTH883 GRADE 8 MATHEMATICS
MTH883 GRADE 8 MATHEMATICS

MTH883 GRADE 8 MATHEMATICS

MTH883 GRADE 8 MATHEMATICS