Embed Size (px)
Citation preview

Multi-core Programming
Thread Checker

2
Topics
• What is Intel® Thread Checker?• Detecting race conditions • Thread Checker as threading assistant• Some other threading errors• Checking library thread-safety• Other features of Thread Checker

Intel® Thread Checker 3
Motivation
• Developing threaded applications can be a complex task
• New class of problems are caused by the interaction between concurrent threads– Data races or storage conflicts• More than one thread accesses memory without
synchronization
– Deadlocks • Thread waits for an event that will never happen

Intel® Thread Checker 4
Intel® Thread Checker
• Debugging tool for threaded software• Finds threading bugs in Windows*, POSIX*, and
OpenMP* threaded software• Locates bugs quickly that can take days to find
using traditional methods and tools– Isolates problems, not the symptoms– Bug does not have to occur to find it!
• Plug-in to VTune™ Performance Analyzer– Same look, feel, and interface as VTune™ environment

Intel® Thread Checker 5
Intel® Thread Checker Features
• Supports several different compilers– Intel® C++ and Fortran Compilers, v7 and higher– Microsoft* Visual* C++, v6– Microsoft* Visual* C++ .NET* 2002, 2003 & 2005
Editions • Integrated into Microsoft Visual Studio .NET* IDE
• View (drill-down to) source code for Diagnostics• One-click help for diagnostics– Possible causes and solution suggestions
• API for user-defined synchronization primitives

Intel® Thread Checker 6
Thread Checker: Analysis
• Dynamic as software runs– Data (workload) -driven execution
• Includes monitoring of:– Thread and Sync APIs used– Thread execution order • Scheduler impacts results
– Memory accesses between threads
Code path must be executed to be analyzed

Intel® Thread Checker 7
Thread Checker: Before You Start
• Instrumentation: background– Adds calls to library to record information
• Thread and Sync APIs• Memory accesses
– Increases execution time and size
• Use small data sets (workloads)– Execution time and space is expanded– Multiple runs over different paths yield best results
Workload selection is important! Workload selection is important!

Intel® Thread Checker 8
Workload Guidelines
• Execute problem code once per thread to be identified
• Use smallest possible working data set – Minimize data set size
• Smaller image sizes
– Minimize loop iterations or time steps• Simulate minutes rather than days
– Minimize update rates• Lower frames per second
Finds threading errors faster!Finds threading errors faster!

Intel® Thread Checker 9
Building for Thread Checker
• Compile– Use dynamically linked thread-safe runtime
libraries (/MD, /MDd)– Generate symbolic information (/Zi, /ZI, /Z7)– Disable optimization (/Od)
• Link – Preserve symbolic information (/debug)– Specify relocatable code sections (/fixed:no)

Intel® Thread Checker 10
Binary Instrumentation
• Build with supported compiler
• Running the application– Must be run from within Thread Checker– Application is instrumented when executed– External DLLs are instrumented as used

Intel® Thread Checker 11
Source Instrumentation
• Intel® C++ or Fortran Compilers– Compile with /Qtcheck
• Running the application– Start in VTune™ environment– Start from Windows* command line
• Data collected in threadchecker.thr results file• View results (.thr file) in VTune™ environment• Additional DLLs not instrumented or analyzed
More detailed diagnosticsMore detailed diagnostics

Intel® Thread Checker 12
Intel® Thread Checker Wizard
Intel® Thread Profiler Wizard
Advanced Activity Configuration
Starting Thread Checker
1) Must Select1) Must Select
Threading WizardsThreading Wizards
Intel® Thread Checker Wizard2) To see these Wizards
2) To see these Wizards

Intel® Thread Checker 13
Thread Checker Diagnostics

Intel® Thread Checker 14
Diagnostics Grouping

Intel® Thread Checker 15
Source Code Viewer

Intel® Thread Checker 16
Diagnostic Help
1) Right-click here . . .1) Right-click here . . .
2) More help!2) More help!

Intel® Thread Checker 17
Dependence Analysis
• Consider the serial code:
• Flow dependence between S1 and S2– Value of A updated in S1 is used in S2
• Anti dependence between S2 and S3– Value of A is read in S2 before written in S3
• Output dependence between S3 and S4– Value of A assigned in S3 must occur before assignment in S4
S1: A = 1.0;S2: B = A + 3.14;S3: A = 1/3 * (C – D);. . . . . . . . . . . . S4: A = (B * 3.8) / 2.7;

Intel® Thread Checker 18
Thread Checker Dependencies• Output dependence
– Write-Write conflict: one thread updates a variable that is subsequently updated by another thread
• Anti-dependence
– Read-Write conflict: one thread reads a variable that is subsequently updated by another thread
• Flow dependence
– Write-Read conflict: one thread updates a variable that is subsequently read by another thread

Intel® Thread Checker 19
Race Conditions
• Execution order is assumed but cannot be guaranteed– Concurrent access of same variable by multiple
threads• Most common error in multithreaded
programs• May not be apparent at all times

Intel® Thread Checker 20
Solving Race Conditions
• Solution: Scope variables to be local to threads• When to use– Value computed is not used outside parallel region– Temporary or “work” variables
• How to implement– OpenMP scoping clauses (private, shared)– Declare variables within threaded functions– Allocate variables on thread stack– TLS (Thread Local Storage) API

Intel® Thread Checker 21
Solving Race Conditions
• Solution: Control shared access with critical regions
• When to use– Value computed is used outside parallel region– Shared value is required by each thread
• How to implement– Mutual exclusion and synchronization– Lock, semaphore, event, critical section, atomic…– Rule of thumb: Use one lock per data element

Intel® Thread Checker 22
Implementation Assistant• When implementing threads
– Obvious shared and private variables can be identified and handled– Should you analyze remaining variables for dependencies?– What if parallel code is 100’s of lines long?– What about variable use in called functions?– Can you tell if pointers refer to same memory location?
• Use Thread Checker as a threading assistant– Speculatively insert threading (OpenMP prototype?)– Compile and run program in Thread Checker– Review diagnostics – Update directives and/or restructure
Let Thread Checker do the “heavy lifting”

Intel® Thread Checker 23
Deadlock
• Caused by thread waiting on some event that will never happen• Most common cause is locking hierarchies– Always lock and un-lock in the same order– Avoid hierarchies if possible
DWORD WINAPI threadA(LPVOID arg){ EnterCriticalSection(&L1); EnterCriticalSection(&L2); processA(data1, data2); LeaveCriticalSection(&L2); LeaveCriticalSection(&L1); return(0);}
DWORD WINAPI threadB(LPVOID arg){ EnterCriticalSection(&L2);
EnterCriticalSection(&L1); processB(data2, data1) ; LeaveCriticalSection(&L1);LeaveCriticalSection(&L2);
return(0);}
ThreadA: L1, then L2ThreadA: L1, then L2
ThreadB: L2, then L1ThreadB: L2, then L1

Intel® Thread Checker 24
Deadlock• Add lock per element• Lock only elements, not whole array of elements
void swap (shape_t A, shape_t B){ lock(a.mutex); lock(b.mutex);// Swap data between A & B unlock(b.mutex); unlock(a.mutex);}
typedef struct { // some data things SomeLockType mutex;} shape_t;
shape_t Q[1024];
swap(Q[986], Q[34]);Thread 4
swap(Q[34], Q[986]);Thread 1
Grabs mutex 34
Grabs mutex
986

Intel® Thread Checker 25
Thread Stalls
• Thread waits for an inordinate amount of time–Usually on a resource–Commonly caused by dangling locks
Be sure threads release all locks heldBe sure threads release all locks held

Intel® Thread Checker 26
What’s Wrong?
int data;
DWORD WINAPI threadFunc(LPVOID arg){ int localData; EnterCriticalSection(&lock); if (data == DONE_FLAG) return(1); localData = data; LeaveCriticalSection(&lock);
process(local_data); return(0);}
Lock never
released
Lock never
released

Intel® Thread Checker 27
Thread Safe Routines
• All routines called concurrently from multiple threads must be thread safe
• How to test for thread safety?–Use OpenMP and Thread Checker for
analysis• OpenMP simulator is systematic• Use sections to create concurrent execution

Intel® Thread Checker 28
Thread Safety Example• Check for safety issues between
– Multiple instances of routine1()
– Instances of routine1() and routine2()
• Set up sections to test all permutations
• Still need to provide data sets that exercise relevant portions of code
#pragma omp parallel sections
{
#pragma omp section
routine1(&data1);
#pragma omp section
routine1(&data2);
#pragma omp section
routine2(&data3);
}

Intel® Thread Checker 29
• Routines can be written to be reentrant – Any variables changed by the routine must be local to each invocation
• Don’t modify globally shared variables
• Routines can use mutual exclusion to avoid conflicts with other threads– If accessing shared variables cannot be avoided
• What if third-party libraries are not thread safe?– Will likely need to control threads access to library
It is better to make a routine reentrant than to add synchronization
Avoids potential overhead
Two Ways to Ensure Thread Safety

Intel® Thread Checker 30
Instrumentation LevelsInstrumentation Level
Description
Full Image Each instruction in the module is instrumented to be checked to see if it might generate a diagnostic message.
Custom Image Same as “Full Image” except user can disable selected functions from instrumentation.
All Functions Turns on full instrumentation for those parts of a module that were compiled with debugging information.
Custom Functions Same as “All Functions” except user can disable selected functions from instrumentation.
API Imports Only system API functions that are needed to be instrumented by the tool will be instrumented. No user code is instrumented.
Module Imports Disables instrumentation. This is default on system images, images without base relocations, and images not containing debug information.
• Higher levels increase memory usage and analysis time, but provide more details
• Binary instrumentation lowers level from default until successful
• Manually adjust level of instrumentation to increase speed or control amount of information gathered

Intel® Thread Checker 31
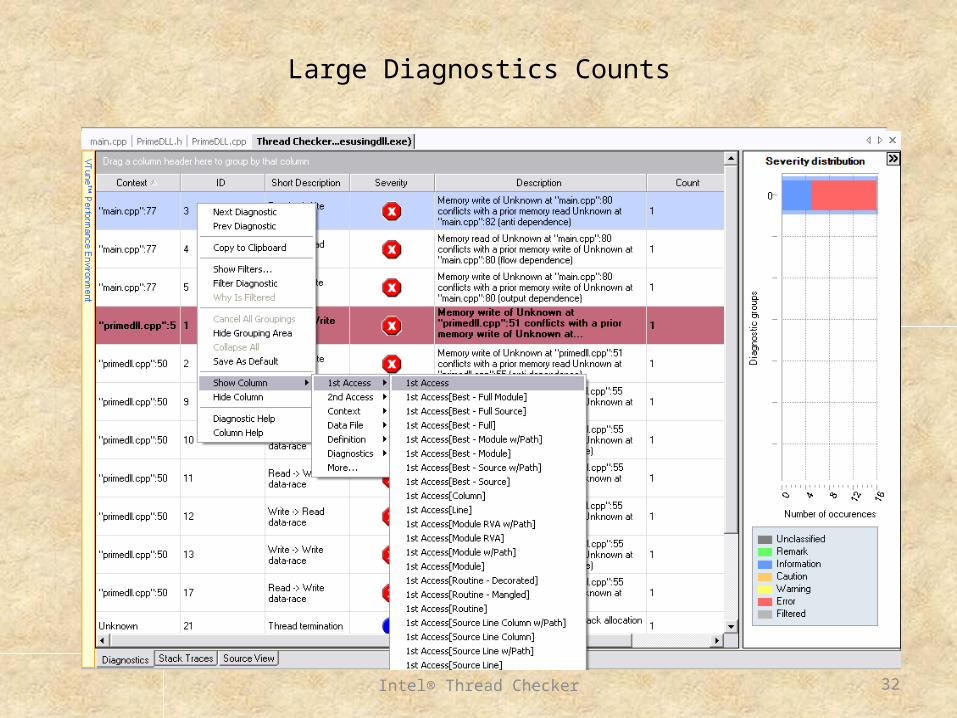
Large Diagnostics Counts
• What do you do if you have 5000 diagnostics?• Where do you begin debugging?• Are all the diagnostic messages equally
important/serious?
• Suggestions for organizing and prioritizing– Add “1st Access” column– Group by “1st Access”– Sort by “Short Description” column
Intel® Thread Checker 32
Large Diagnostics Counts
Add the “1st Access” column if it not already present

Intel® Thread Checker 33
Large Diagnostics Counts

Intel® Thread Checker 34
Large Diagnostics Counts
Groups errors reported for the
same source line; each group can be seen as the same
issue

Intel® Thread Checker 35
Large Diagnostics Counts
Sort on the “Short description”

Intel® Thread Checker 36
Intel® Thread CheckerWhat’s Been Covered
• Threading errors are easy to introduce• Debugging these errors by traditional
techniques is hard• Intel® Thread Checker catches these errors– Errors do not have to occur to be detected– Greatly reduces debugging time– Improves robustness of the application