Embed Size (px)
Citation preview
sensors
Article
Multi-Criteria Recommendation Systems to Foster Online Grocery
Manar Mohamed Hafez 1,* , Rebeca P. Díaz Redondo 2 , Ana Fernández Vilas 2 and Héctor Olivera Pazó 2
�����������������
Citation: Hafez, M.M.;
Díaz-Redondo, R.P.; Vilas, A.F.; Pazó,
H.O. Multi-Criteria Recommendation
Systems to Foster Online Grocery.
Sensors 2021, 21, 3747. https://
doi.org/10.3390/s21113747
Academic Editors: Lidia Ogiela,
Makoto Takizawa and Arcangelo
Castiglione
Received: 15 April 2021
Accepted: 24 May 2021
Published: 28 May 2021
Publisher’s Note: MDPI stays neutral
with regard to jurisdictional claims in
published maps and institutional affil-
iations.
Copyright: © 2021 by the authors.
Licensee MDPI, Basel, Switzerland.
This article is an open access article
distributed under the terms and
conditions of the Creative Commons
Attribution (CC BY) license (https://
creativecommons.org/licenses/by/
4.0/).
1 College of Computing and Information Technology, Arab Academy for Science,Technology and Maritime Transport (AASTMT)-Smart Village, Giza P.O. Box 12676, Egypt
2 AtlanTTic , Information & Computing Lab, Universidade de Vigo, 36310 Vigo, Spain;[email protected] (R.P.D.R.); [email protected] (A.F.V.); [email protected] (H.O.P.)
* Correspondence: [email protected]
Abstract: With the exponential increase in information, it has become imperative to design mecha-nisms that allow users to access what matters to them as quickly as possible. The recommendationsystem (RS) with information technology development is the solution, it is an intelligent system.Various types of data can be collected on items of interest to users and presented as recommendations.RS also play a very important role in e-commerce. The purpose of recommending a product isto designate the most appropriate designation for a specific product. The major challenge whenrecommending products is insufficient information about the products and the categories to whichthey belong. In this paper, we transform the product data using two methods of document rep-resentation: bag-of-words (BOW) and the neural network-based document combination knownas vector-based (Doc2Vec). We propose three-criteria recommendation systems (product, packageand health) for each document representation method to foster online grocery shopping, whichdepends on product characteristics such as composition, packaging, nutrition table, allergen, andso forth. For our evaluation, we conducted a user and expert survey. Finally, we compared theperformance of these three criteria for each document representation method, discovering that theneural network-based (Doc2Vec) performs better and completely alters the results.
Keywords: recommender systems; retail market; digital transformation; grocery industry; bag-of-word; Doc2Vec; nutrition table
1. Introduction
According to [1], digital transformation facilitates new ways of value creation at allstages of the consumer decision process: pre-purchase (need recognition, informationsearch, consideration or evaluation of alternatives), the purchase (choice, ordering, pay-ment), and the post-purchase (consumption, use, engagement, service requests). This valuecreation is especially relevant in retailing to ensure competitiveness and gain a largermarket share. Digital transformation came hand in hand with the penetration of mobiledevices and data science in e-commerce. Although digital transformation [2] has beenaddressed from several approaches; multi-channel solutions, user modeling, Internet ofThings, and so forth; all of them rely to some extent on the availability of information onoperations, supply chains and consumer and shopper behaviors. One of the imperatives inthis digital transformation is obtaining a view of customer insights.
From the early steps (Amazon, 2003 [3]), the time to select the desired product has beenthe main issue for customers, especially if the high volume and rhythm of incorporationof products are considered. From more than two decades, Recommender Systems (RS)in e-commerce have tried to provide the most suitable products of services, to mitigatethe product overload problem and to narrow down the set of choices [4–6]. Success ofmajor products & service providers mainly relies on RS, such as Amazon [3], Netflix [7],and Google [8]. RSs improve customer satisfaction by reducing customer search efforts andas a consequence, they increase product/service sales. RSs provide users with items based
Sensors 2021, 21, 3747. https://doi.org/10.3390/s21113747 https://www.mdpi.com/journal/sensors
Sensors 2021, 21, 3747 2 of 30
on their interests, the preferences of other users and the item attributes. The recommenda-tion can be carried out with several approaches depending on the type of data collectedand the ways it is used by the RS: Content-Based (CB) filtering, Collaborative Filtering(CF), and hybrid. Both systems CB and CF are widely used, and specially the item-basedcollaborative filtering where the similarity between items is calculated using users’ ratingsof those items. (developed by Amazon [3]).
Although RSs are used by users regularly in almost all digitalized sectors, its popu-larization in the grocery market, that is, a retail store that primarily sells food products,has been delayed as a consequence of the low penetration of online grocery shopping,the implementation of e-commerce for grocery goods. Recently, as well as in other sec-tors, the grocery industry is harnessing digital to innovate through data-drive businessmodels. Online grocery is considered a central element in the new normal. In this respect,grocery recommendation uses customer’s shopping history and product information toaddress various added value scenarios; predicting customers’ future shopping, selectingbest value for money products, offering new products user may like, and so forth. Besides,the availability of data about products and shopping positively affects the retailer by easinga sustainable business; offers & featured products, stock management, customer profiling,and so forth.
To meet the challenges above, in this paper, we use two document representationmethods—BOW and Doc2Vec—to manage product data. We also address the three-criteriarecommendation systems; Product, Package and Health for each document representationmodel to the specific problem of, given a source product P, applying RSs to suggestsimilar alternative products where similarity is defined on the basis of a product taxonomy,as well as product characteristics; composition, packaging, nutrition table, allergens, etc.The solution to this problem supports various regular use cases in the grocery market,such as out of stock products, inventory clearance, best value options, new products, etc.In order to obtain the recommender model and to validate them, we use a real grocerydataset, referred to as MDD-DS, provided by Midiadia, a Spanish company that workson grocery catalogs. MDD-DS was constructed by analyzing the product’s information(product labeling) and by experts’ manual annotation so that products are assigned to aspecific variety in a hierarchical structure for products. Therefore, the major contributionsof this research work are the following:
1. Definition of an appropriate data structure to manage the different kinds of informa-tion linked to commercial products (especially in the food industry).
2. Definition and identification of the appropriate document representation that workswith MDD-DS to represent the products.
3. Design and implementation of a RS that automatically provides alternative productswhen the user’s choice is not available. The RS do not work with user’s profile, it isexclusively based on the product’s characteristics and the available catalogue.
4. Design of three recommendation approaches based on the product’s characteristics;composition, packaging, nutritional table, allergens, etc.
5. Proof of concept and validation to test the RS performance. We have conducted asurvey for users and for experts to evaluate the RS approaches.
The rest of this document is organized as follows: In Section 2, we briefly reviewed RSand document representation methods to manage product data in RS. The grocery MDD-DSis describing in Section 3. In Section 4, the recommendation methodology is introduced withthree specific approaches to product similarity, based on product composition, packaging,and healthy characteristics. To implement these three approaches to product similarity,we deployed two kinds of document representation techniques: a simple BOW (Bag ofWords, in Section 5) and a neural network-based word embedding, Doc2Vec in Section 6.For the two product representation models, experimental evaluation and discussion aredescribed in Section 7. Finally, in Section 8, we conclude the current work with some futureresearch directions.
Sensors 2021, 21, 3747 3 of 30
2. Recommender Systems
RS are a fundamental task for e-commerce, as the personal RS recommends providingitems or products that satisfy the interests of different users according to their differentinterests and also recommends unknown items for the users that satisfy their interests [9].As mentioned above, the three most commonly used methods in the RS are CB filtering,CF, and hybrid approach.
CB filtering [10–12] is one of the standard techniques used by RS. CB identifies itemsbased on an analysis of the item’s content, similar to items known to be of interest to theuser. For example, a CB website recommendation service can work by analyzing the user’sfavorite web pages to generate a profile of commonly occurring terms. Then use this profileto find other web pages that include some or all of these terms.
CB technique has several issues and limitations [13–15]. For example, (i) having nomechanism to assess the quality of an item supported by CB methods. Furthermore, CBmethods generally require items to include some type of content that is amenable to featureextraction algorithms. As a result, CB technique tend to be ill-suited for recommendingproducts, movies, music titles, authors, restaurants and other types of items with little orno useful and analyzable content; (ii) CB is also have another problem that they rarelyreflect current user community preferences. In a technique that recommends products tousers, for example, there is no mechanism to favor items that are currently “hot sellers”.Moreover, existing systems do not provide a mechanism to recognize that the user cansearch for a particular type or category.
CF [16,17] is another common recommendation technique. In general, the CF recom-mends the item to the user based on a community of user interests, without any analysis ofthe item content. CF idea is to build a personal profile of ratings data through each itemsold and rate it through the user. Besides the CF technique’s concept to recommend the itemto the user, the user’s profile is initially compared with other users’ profiles to identify oneor more similar users. These similar users’ highly-rated items are recommended to the user.A significant benefit of CF is that it overcomes the previously mentioned shortcomings ofCB filtering.
The main issue in the above is how to measure user similarity. This problem in-spires memory-based methods [18], which can be implemented as user-based [19] or item-based [20,21]. User and item-based methods have similar mechanisms, but item-basedmethods are used more to perform better at scale and with a lower rating density.
A hybrid approach is an approach that combines CB and CF (user-based and item-based) filtration approaches with attempts to eliminate their flaws and provides a moreefficient result. It usually performs better than either filtering method alone. Here, the hy-brid approach does combine the CB and CF to solve the significant problems that are thecold start [22] and sparsity problems [23]. The cold start problem occurs when there is notenough new user data or ratings for a new item, so it is difficult to make recommendationsfor that new user or present new items to a user. Regarding sparsity, it occurs when theuser has not rated most of the items and the ratings are sparse.
In our work, we have some issues in providing a recommendation service and associ-ated methods for generating personalized items. Science, the recommendation is basedon the user’s interests without considering the user profile. This paper focuses solely onthe user’s interest and how to recommend suitable items to each user. The benefit of thiswork is also that recommended items are identified by lists of similar items to the desireditem. As mentioned above, in our paper we worked on combining CB filtering and CF(item-to-item), such as Amazon [3]. Amazon invented an algorithm that began lookingat items themselves. It analyzes the recommendations through the items purchased orrated by the user and matches them with similar items, using metrics and composinga list of recommendations. That algorithm is called “item-based collaborative filtering”.This approach was also very appropriate and faster, especially for huge data sets. It wasdeveloped in 2017 [24], to aggregate data about the user to develop an RS to rely on thedata and the user behavior in selecting the items. It is still based only on the analysis of
Sensors 2021, 21, 3747 4 of 30
the items. However, it combines the analysis of the items with the user’s data and choices.Regarding the related works, we see that the most widely used in the previous works iscollaborative filtering, as shown in the following paragraphs.
In [25], the authors used a collaborative filtering method to create the proposal forvarious items using accessible ratings and comments on Twitter. The authors have alsoevaluated the reviews given by blipper (a review website) for four unique products usingthe CF method. When dealing with video as data to find suitable items for the user, there arealso research works that apply collaborative filtering to recommend products through thiskind of data. For instance, in [26], the authors introduced an approach that includes item-to-item collaborative filtering to discover exciting and meaningful videos among the large-scale videos. This method runs on Qizmt, which is a.NET MapReduce framework. The RSin [27] also depends on monitoring the video content the user watches, the customer carrierdatabase, and the vector database of products; therefore, the idea is to identify an itemrelated to a part of the video content the user viewed that, and consequently determine theproduct category associated with the item, then analyze the characteristics of items similarto the item. That has been identified through the video’s visualization, and it compares thecustomer value vectors and the product characteristics vectors. Moreover, start showingthe recommended product to the customer. Other approaches take user interactions intoaccount to recommend the right products. For instance, in [28], the recommender systemcollaborative filtering uses user interactions and keeps them to benefit the recommendation.It does not stop at the items that have been selected only from the users, but the proposedsystem is related to the category of items.
Recommendation systems usually require a large amount of user data. Safeguardingthe privacy of this information is an important aspect that must be taken into account.For instance, in [29], an arbitrable remote data auditing scheme is proposed. This is basedon a non third-party auditor for the network storage-as-a-service paradigm. The authorshave designed a network storage service system based on blockchain, in which the userand the network storage service provider will generate the integrity metadata of thecorresponding original data block respectively. All of that reach a consensus on the matterby means of the use of the blockchain technique.
Other approaches solve some problems in the recommendation system, such as scala-bility and the cold start problem. For instance, the authors of [30] implement a user-basedcollaborative filtering algorithm on a distributed cloud computing platform that is Hadoopto solve the scalability problem of the collaborative filtering method. Besides, the authorsof [31] propose a keyword-Aware Service Recommendation method called KASR. Theyalso present a personalized service recommendation list and keywords used to indicateuser preferences. A user-based collaborative filtering algorithm is adopted to generatethe recommendations. They implemented KASR on Hadoop with real-world data setsto improve its scalability and efficiency in a big data environment. Furthermore, in [32]proposed a novel approach based on item-based CF use of BERT [33] to help understandthe items and work to show the connections between the items and solve problems thatare related to the traditional recommender system as cold start. This experiment wasperformed with an actual data set large scale with a whole cold start scenario, and thisapproach has overtaken the popular Bi-LSTM model. It used the item title as contentalong with the item token to solve the cold start problem. The approach also furtheridentifies the interests of the user. Other approaches consider recommending products thatare in line with the user’s interests without being affected by the problems faced by therecommendation system mentioned above and the problem of data sparsity. For instancein [34], a product recommendation system is proposed where an autoencoder based on acollaborative filtering method is employed. The experiment result shows a very low RootMean Squared Error (RMSE) value, considering that the users’ recommendations are inline with their interests and are not affected by the data sparsity problem as the datasetsare very sparse.
Sensors 2021, 21, 3747 5 of 30
In e-commerce, user data and purchasing behavior play an important role [35,36].However, in our scenario we are totally agnostic about the customer behavior. The com-pany Midiadia does not provide complete e-commerce solutions, but provides enrichedcatalogues to e-commerce platforms. Consequently, Midiadia has not information about thecustomers interactions, habits or any kind of profiling. To the best of our knowledge, noother study provides a solution to this problem (recommending a similar product) takingexclusively into account the product information: ingredients, size, packaging, healthmessages, allergens, etc. All this consideration without going back to the customer data,depends only on the product description, such as name, brand, ingredients, legal name,and size; likewise, other data helps to know that the product is also healthy, such as sugars,fats, carbohydrates and excluding all the contents that can cause allergies. Our propositionfills an exciting void for many e-commerce dominants.
Representation Models
Regarding document representation models, we provide some representation modelsregarding the techniques used in this paper. We start with simple techniques such as Bag-Of-Words, TF-IDF. First, Bag-Of-Words (a.k.a. BOW [37,38]) is a basic, popular, and moststraightforward approach among all other feature extraction methods. It is used to createdocument representations in Natural Language Processing (NLP) [39] and InformationRetrieval (IR) [40]. The text is represented as a bag that contains many words. It forms aword presence feature set from all the words of an instance. The method does not carehow often the word appears or the order of the words; the only thing that matters iswhether the word is in the word list. It is generally used to extract features from text datain various ways. A bag of words is the presentation of text data. It specifies the frequencyof words in the document. A feature generated by bag-of-words is a vector where n is thenumber of words in the input documents vocabulary. Second, TF-IDF [41] short for termfrequency–inverse document frequency, is a technique that can be used as a weightingfactor not only in IR solutions but also in text mining and user modeling. This method, as inthe bag-of-words model, counts how many times a word appears in a document. However,words which are repeated so many times like the stopwords (the, of, ...) are penalizedwith this technique because of the inverse documentary frequency weighting. Here, the moredocuments a word appears in, the less relevant it is. Therefore, a word that is distinctiveand frequent will be high-ranked if it appears in the query introduced by the user.
On the other hand, word embedding is a term used for the representation of wordsfor text analysis [42–45]. It also maps of words in vectors of real numbers using theneural network, the probabilistic model, or the dimension reduction on the word co-occurrence matrix. Word embeddings are also very useful in mitigating the curse ofdimensionality, a recurring problem in artificial intelligence [46]. Without word embedding,the unique identifiers representing the words generate scattered data, isolated points ina vast sparse representation [47]. With word embedding, on the other hand, the spacebecomes much more limited in terms of dimensionality with a widely richer amount ofsemantic information [48]. With such numerical features, it is easier for a computer toperform different mathematical operations like matrix factorization, dot product, and soforth, which are mandatory to use shallow and deep learning techniques.
Regarding word embedding, unfortunately, the representation of meaning with dif-ferent symbols cannot orchestrate the same meaning as words. Early attempts solved thisproblem by clustering words based on the meaning of their endings and representing thewords as high-dimensional spaced vectors. A new idea was recently proposed inspiredby the neural network language model, and the model proposed is known as Word toVector (word2vec) [49]. These embeddings are easy to work with since the vectors can bemanipulated by many algorithms like dimensionality reduction, clustering, classification,similarity searching, and many more.
Two models generate the representation of word2vec have been presented in order toproduce such dense word embeddings: the Continuous Bag of Word (CBOW) model [50]
Sensors 2021, 21, 3747 6 of 30
and the Skip-Gram model [51,52]. Each of the two models train a network to predictneighboring words. Suppose that a sequence of tokens (t1, . . . , tn)is provided. The CBOWmodel, first randomly initializes the vector of each word and then using a single layerneural network whose outcome is the vector of the predicted word, optimizes the originalguesses. One can easily understand that the size of the Neural Network controls the size ofthe word vector. The Skip-gram model uses the word, in order to predict the context words.After explaining the meaning of Word2Vec, however, the goal of doc2vec is to create adigital representation of the document, regardless of its length. Unlike words, documentsdon’t come in logical structures like words. In [53] they used Word2Vec template andadded below paragraph id to build doc2vec.
3. Dataset
The data set used in this paper was provided by Midiadia, a Spanish company whichworks to convert textual information in the product package into product category andproduct attributes by mixing automated natural language processing and manual anno-tation. The Midiadia DataSet (MDD-DS) is taxonomy where the 3 upper levels are calledCategory, Subcategory and Variety. Every product in MDD-DS includes; the taxonomyposition, that is, values for Category, Subcategory and Variety as well as a set of productattributes. for example, name, ingredients, legal name, brand, product size, and so forth,as shown the extract of real data in Table 1. We have also used these product componentsbefore in [54,55] to provide a solution to automatically categorize the constantly changingproducts in the market, which is the first part of our investigation.
• ’European Article Number’ (EAN) is an internationally recognized standard that de-scribes the barcode and numbering system used in world trade to identify a specificproduct that is specifically packaged and has a specific manufacturer in retail.
• ’Category’, ’Subcategory’, and ’Variety’ are a hierarchy and can be displayed by a com-pany as catalog organization levels in the classification. The companies manufacturethe products and each company has an identifying name and is listed as the brand.
• In addition, there are some properties compatible with the EU regulation [56], for ex-ample, name, legal name and ingredients, as indicated in Table 2.
• ’Servings’ is a number that determined based on the amount of product and is suffi-cient for how many people.
In addition, Midiadia supported us with two versions of MDD-DS to implementrecommendation systems and cover all the company’s requirements. The basic versionwhich was called MDD-DS1, contained all the above information plus some informationrelated to the nutrition table, such as sugar and fat, and some messages on the productpackaging such as the sugar-free or the free gluten and other messages on the cover of theproduct. Of course, these messages are placed according to the components of each product,as shown in Table 3.
Table 1. Extract of the MDD-DS.
EAN Category Subcategory Variety Brand Name Ingredients Legal Name Servings Size Unit
10,590 Fresh Fish &Shellfish
Other GenericMidiadia Congrio Conger
conger Congrio 1 330 mL
84,107 Beverages Beers Lager Moritz Cervezamoritz
Beer. 5.4%vol. alc. Ron 3 500 g
......
...... ...
......
......
......
843,654 Snacks andnuts
Nuts Seeds Facundo Gian SeedsSunflowerseeds andsalt (4%)
Roastedand salty 2 250 g
Sensors 2021, 21, 3747 7 of 30
Table 2. Product attributes in the dataset.
Field Levels Description
EAN Unique Product NumberCategory 16 1st Level Category
Subcategory 62 2nd Level CategoryVariety 159 3rd Level Category, referred to as varietyBrand 3015 Product BrandName 11,139 Product Customary Name
Legal Name 8442 Official product denomination regarding the EuropeanUnion provisions
Ingredients List of Ingredients in the product
Table 3. Extract of the MDD-DS1.
EAN Fat Sugar Message Message . . .
10,590 2.8 0 withoutsugar . . .
84,107 4.3 8 Roomtemperature . . .
......
......
......
843,654 2.18 30 Roomtemperature . . .
The extended version which was named MDD-DS2, contained all the above informa-tion besides the characteristics of the Brand Type and Brand attributes, and the price was alsoadded randomly besides more information about the nutrition table such as carbohydrates(Carbs), dietary fiber (d f ), and a percentage of saturated fat (s f ) and good fat (g f ), protein (pn)and salt (sa). It also contains allergens such as soy, fish, eggs, nuts, and so forth, as charac-teristics that will be mentioned in detail and how they are used in our research, as shownin Table 4.
• ’Carbohydrates’ are considered one of the three main food categories and a source ofenergy, and they are also basically sugars and starches that the body breaks down intoglucose (we can say that it is a simple sugar that the body can use to nourish its cells).
• ’Dietary Fiber’ is part of the food that has been separated from plants and cannot becompletely broken down by human digestive enzymes.
Table 4. Extract of the MDD-DS2.
EAN Brand Type Brand Attribute Carbs d f s f g f pn sa
10,590 manufacturer standard 2.8 0 0 0 10 2
84,107 manufacturer without gluten 4.3 8 15 0 4 10
......
...... ...
......
......
843,654 White standard 2.18 30 40 7 5 6
4. Methodology Overview
Taking into account our dataset, the proposed recommender system does not haveinformation about a user’s history so that CF should be excluded. An hybrid item-basedCF is designed for the specific scenario of finding similar products to a source product Pwhere similarly will be defined according to, first, the Variety of the product in the MDDtaxonomy and, second, other attributes of the product. The alternative product to P willbe a product in the same Variety which moreover meets other similarity requirements
Sensors 2021, 21, 3747 8 of 30
over the product attributes. Three similarity approaches have been defined: (i) ProductComposition (PRO-COM), where similarity is scored according to product composition(ingredient, name, legal name, etc.); (ii) Package-based (PK-BD), where similarity is scoredaccording to the size of the product chosen by the user; and (iii) Health-based (HTH-BD),where similarity is scored according to a healthy grade by using the product nutrition table.The recommendation methodology considers allergens apart from these three similarityapproaches as follows. In MDD-DS, several product attributes are related to allergens:(Nuts, egg, hazelnuts, fish, sulfates, peanuts, mollusks, lupine, gluten, mustard, soy, crustaceans,milk and its derivatives including lactose, sunflower seeds and sesame). Allergens are consideredpre-conditions for suggesting an alternative product, that is, if the user-chose a productwhich includes sugar, water and nuts), the allergen precondition for the alternative productsis possibly containing nuts but not other allergen. So, the alternative product may containnuts or not, but it should not contain other allergens.
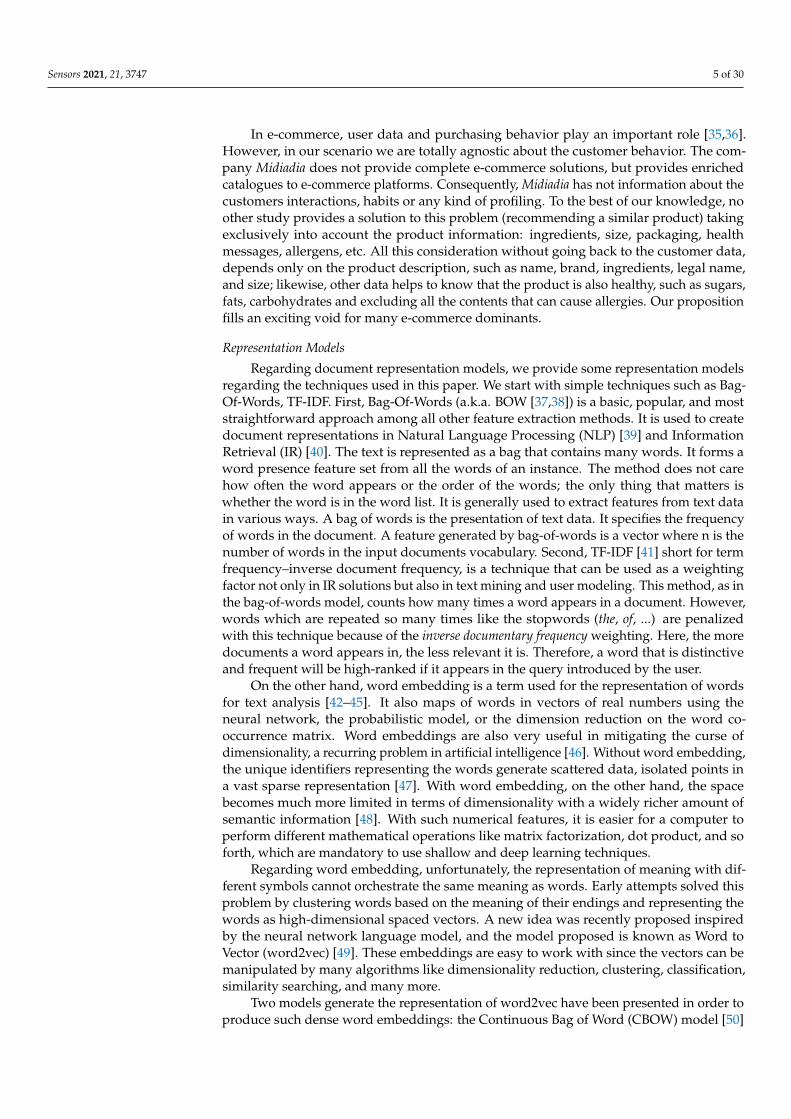
The proposed methodology is shown in Figure 1. In order to obtain the model,a training set is defined in order to obtain the recommender model with the following steps:(A) MDD-DS is preprocessed; (B) for every product P the dataset is filtered by allergenpreconditions; (C) the three similarity scores are obtained (PRO-COM, PK-BD, and HTH-BD). Then at the bottom of the model is the automated recommendation when the userselects the product. The recommendation system recommends an alternative based on thethree approaches. A survey is conducted to consider the users in the three approaches.
Figure 1. Description of the proposed model definition and evaluation.
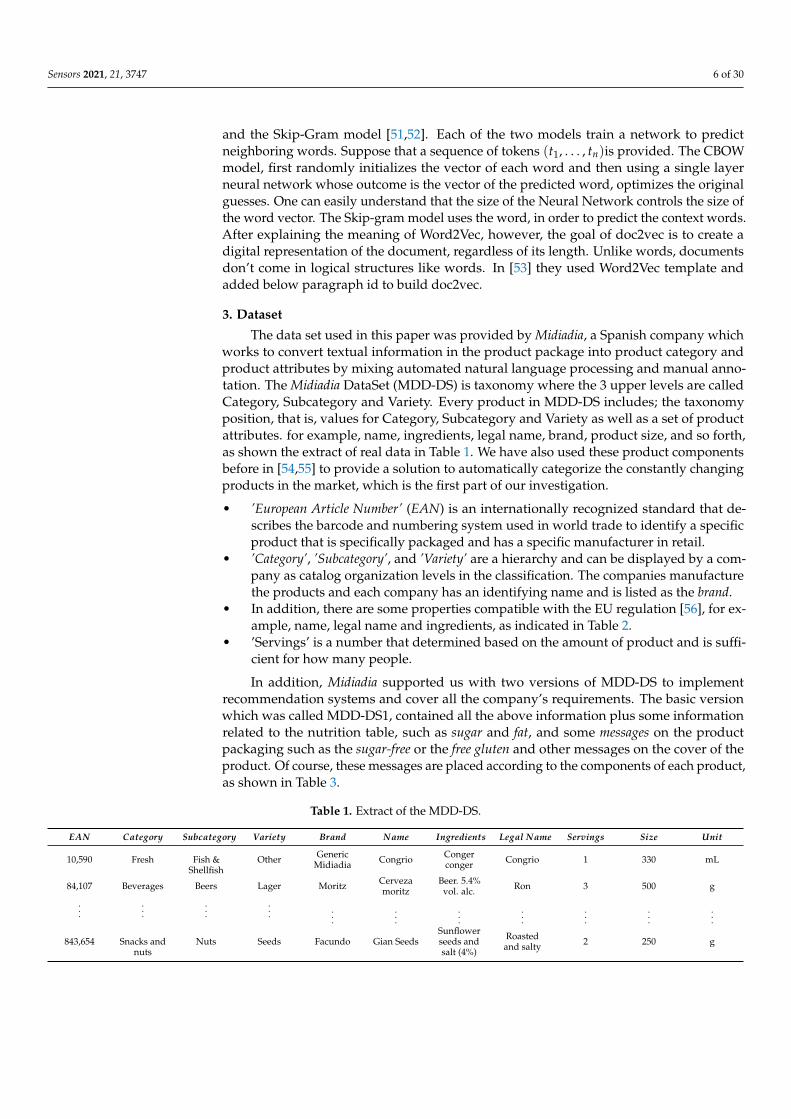
To implement the recommendation, we carried out collaborative filtering as a firstmodel. Then we add more features and a neural network solution to improve our results.The Figure 2, illustrate the strategy of this paper. First model, The dataset (MDD-DS1) isanalyzed by preprocessing. Three approaches were then developed, which are (PRO-COM,PK-BD, and HTH-BD) by collaborative filtering. A survey is carried out to take the users’opinions in the three approaches.
Figure 2. More details on description of the proposed model definition and evaluation.
Sensors 2021, 21, 3747 9 of 30
In the second model, the approaches are redeveloped based on user feedback. Weadded more features and more filters, such as filtering by allergen features. We addeda neural network solution to improve our results. Therefore, the company extends thedataset—called (MDD-DS2)—to contain additional features to develop the approaches,so the data are analyzed through preprocessing. A neural network is built on the products.Then, it extracts the product as a vector and compares it to the rest of the products usingsimilarity techniques and then makes the approaches (PRO-COM, HTH-BD, and PK-BD).
All three approaches take allergens’ features into account, which means that, as ex-plained above, if the product is, for example, nut-free, the alternative products are too. Thenthe approaches are sent to an expert by the company for evaluation. This has indicatedthat the modification is suitable for the company’s requirements. Hence, a questionnairewas published for users to evaluate the recommendation system after these modifications.Finally, a comparison of the evaluation of the users was carried out.
5. Recommendation System Based on Item-Based Collaborative Filtering (RS-CF)
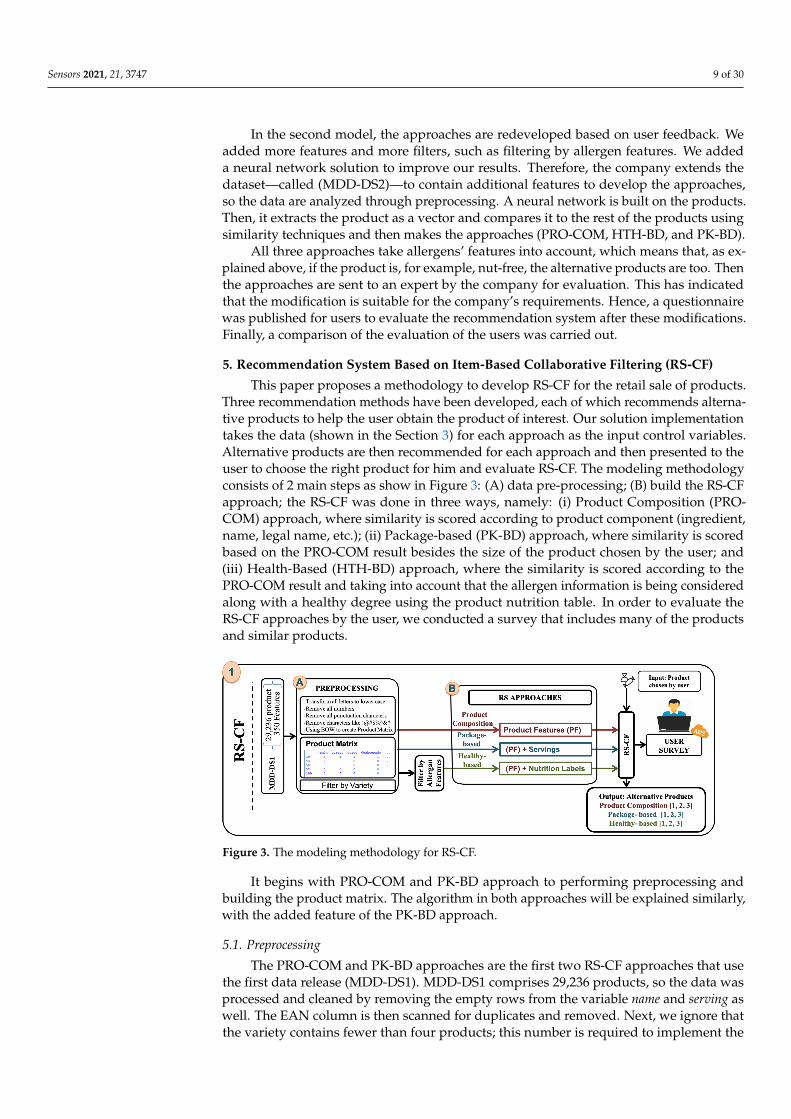
This paper proposes a methodology to develop RS-CF for the retail sale of products.Three recommendation methods have been developed, each of which recommends alterna-tive products to help the user obtain the product of interest. Our solution implementationtakes the data (shown in the Section 3) for each approach as the input control variables.Alternative products are then recommended for each approach and then presented to theuser to choose the right product for him and evaluate RS-CF. The modeling methodologyconsists of 2 main steps as show in Figure 3: (A) data pre-processing; (B) build the RS-CFapproach; the RS-CF was done in three ways, namely: (i) Product Composition (PRO-COM) approach, where similarity is scored according to product component (ingredient,name, legal name, etc.); (ii) Package-based (PK-BD) approach, where similarity is scoredbased on the PRO-COM result besides the size of the product chosen by the user; and(iii) Health-Based (HTH-BD) approach, where the similarity is scored according to thePRO-COM result and taking into account that the allergen information is being consideredalong with a healthy degree using the product nutrition table. In order to evaluate theRS-CF approaches by the user, we conducted a survey that includes many of the productsand similar products.
Figure 3. The modeling methodology for RS-CF.
It begins with PRO-COM and PK-BD approach to performing preprocessing andbuilding the product matrix. The algorithm in both approaches will be explained similarly,with the added feature of the PK-BD approach.
5.1. Preprocessing
The PRO-COM and PK-BD approaches are the first two RS-CF approaches that usethe first data release (MDD-DS1). MDD-DS1 comprises 29,236 products, so the data wasprocessed and cleaned by removing the empty rows from the variable name and serving aswell. The EAN column is then scanned for duplicates and removed. Next, we ignore thatthe variety contains fewer than four products; this number is required to implement the

Sensors 2021, 21, 3747 10 of 30
algorithm; the main focus of this investigation is when the primary product is not found.Therefore, keep at least three alternatives of the same variety. Therefore, the number ofproducts after cleaning the data is 20,371, we mentioned the last steps in Algorithm 1 asa Cleaning(MDD-DS1) step. The data is then preprocessed by extracting all the wordsfor the attributes name, legal name, and ingredients. Consider a Corpus C of each productp, C(p[Name], p[Legal Name], p[Ingredients]). That means that the three attributes arecombined in a single text to describe the product des(p). This description was obtained(des(p)) after cleaning the product Clean_p by following these steps: (i) transform theparentheses into space; (ii) the numbers, stopwords, punctuation, and extra spaces areremoved; (iii) all letters are converted to lowercase; and (iv) duplicate strings are removed.Algorithm 1 shows all the preprocessing steps for PRO-COM and PK-BD.
Algorithm 1 RS-CF: PRO-COM and PK-BD preprocessing pseudocode.
1: procedure PREPROCESS(MDD-DS1)2: Cleaning(MDD-DS1)3: product_words[]← new_list(m)4: all_products_words← new_vector (0)5: for i← 1 : m do6: p←MDD-DS1[i, ]7: des(p)← C(p[Name], p[Legal Name], p[Ingredients])8: des(p)← Clean_p (des(p))9: product_words[i]← des(p)
10: all_products_words11: ← all_products_words ∪ des(p)12: end for13: end procedure
Thus, the words are divided and a vector of words is created for product_words(p),an example is shown in Table 5.
Table 5. Examples of product_words for every p.
p id Product-Vector
1 [’parsley’, ’fresh’, ’leek’, ...]...
...218 [’milk’, ’skimmed’, ’leek’, ...]
......
29, 167 [’oil’, ’parsley’, ’lemon’, ...]
We obtain all_products_words unique tokens/words extracted from the corpusC(p[Name], p[Legal Name], p[Ingredients]), which is the different meaningful tokensin the dataset after preprocessing. Therefore, all_products_words contains 10,707 uniquetokens, an example (We have translated product_words(p) and all_products_words tomake it readable) shows in the Table 6. Let ~t be the n-dimensional vector obtainedfrom all_products_words such that~t = (t1, . . . , tn) and ∀ k ∈ [1, . . . , n], tk is a string ∈all_products_words and N = dim(all_products_words). The N tokens will form des(p)and the count vector size in product matrix X will be given by MxN.
Table 6. Extract from all_products_words.
[’parsley’, ’fresh’, ’leek’, ’raw’, ’cauliflower’, ’raw’, ’thistle’, ’cynara’, ’cardunculu’, ’panettone’,’flour’, ’wheat’, ’kind’, ’raisin’, ’egg’, ’butter’, ’sugar’, ’orange’,’candied’,’peel’,’lemon’,’syrup’,
’glucose’, ’fructose’, ’regulator’, ’acidity’, ’acid’, ’citric’, ’water’, ’yolk’, ’yeast’, ’bakery’,’emulsifier’, ’mono’, ’diglyceride’, ’fatty’, ’salt’, ’milk’, ’skimmed’, ’powder’, ’flavoring’,
’preservative’, ’sorbic’, ’plum’, ’conger eel’, ’conger’, ’canon’, ’valerianella’, ’locusta’, ’fruit’, . . . ]
Sensors 2021, 21, 3747 11 of 30
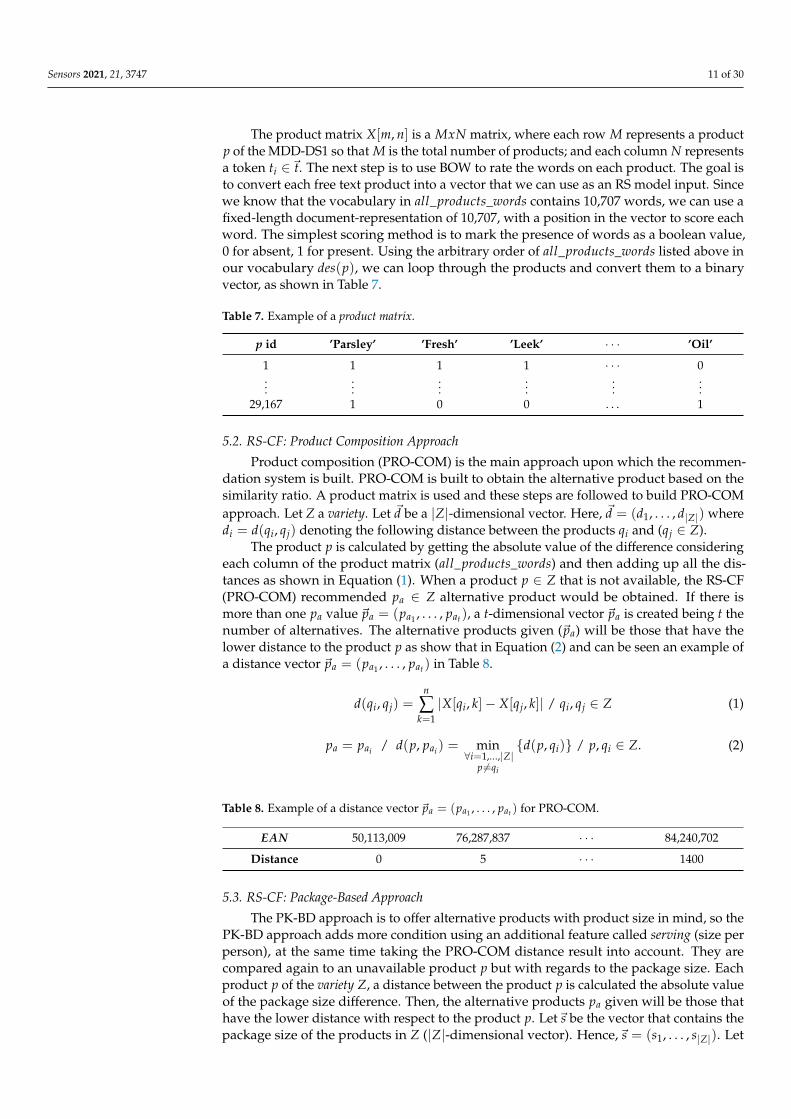
The product matrix X[m, n] is a MxN matrix, where each row M represents a productp of the MDD-DS1 so that M is the total number of products; and each column N representsa token ti ∈~t. The next step is to use BOW to rate the words on each product. The goal isto convert each free text product into a vector that we can use as an RS model input. Sincewe know that the vocabulary in all_products_words contains 10,707 words, we can use afixed-length document-representation of 10,707, with a position in the vector to score eachword. The simplest scoring method is to mark the presence of words as a boolean value,0 for absent, 1 for present. Using the arbitrary order of all_products_words listed above inour vocabulary des(p), we can loop through the products and convert them to a binaryvector, as shown in Table 7.
Table 7. Example of a product matrix.
p id ’Parsley’ ’Fresh’ ’Leek’ · · · ’Oil’
1 1 1 1 · · · 0...
......
......
...29,167 1 0 0 . . . 1
5.2. RS-CF: Product Composition Approach
Product composition (PRO-COM) is the main approach upon which the recommen-dation system is built. PRO-COM is built to obtain the alternative product based on thesimilarity ratio. A product matrix is used and these steps are followed to build PRO-COMapproach. Let Z a variety. Let ~d be a |Z|-dimensional vector. Here, ~d = (d1, . . . , d|Z|) wheredi = d(qi, qj) denoting the following distance between the products qi and (qj ∈ Z).
The product p is calculated by getting the absolute value of the difference consideringeach column of the product matrix (all_products_words) and then adding up all the dis-tances as shown in Equation (1). When a product p ∈ Z that is not available, the RS-CF(PRO-COM) recommended pa ∈ Z alternative product would be obtained. If there ismore than one pa value ~pa = (pa1 , . . . , pat), a t-dimensional vector ~pa is created being t thenumber of alternatives. The alternative products given (~pa) will be those that have thelower distance to the product p as show that in Equation (2) and can be seen an example ofa distance vector ~pa = (pa1 , . . . , pat) in Table 8.
d(qi, qj) =n
∑k=1|X[qi, k]− X[qj, k]| / qi, qj ∈ Z (1)
pa = pai / d(p, pai ) = min∀i=1,...,|Z|
p 6=qi
{d(p, qi)} / p, qi ∈ Z. (2)
Table 8. Example of a distance vector ~pa = (pa1 , . . . , pat ) for PRO-COM.
EAN 50,113,009 76,287,837 · · · 84,240,702
Distance 0 5 · · · 1400
5.3. RS-CF: Package-Based Approach
The PK-BD approach is to offer alternative products with product size in mind, so thePK-BD approach adds more condition using an additional feature called serving (size perperson), at the same time taking the PRO-COM distance result into account. They arecompared again to an unavailable product p but with regards to the package size. Eachproduct p of the variety Z, a distance between the product p is calculated the absolute valueof the package size difference. Then, the alternative products pa given will be those thathave the lower distance with respect to the product p. Let~s be the vector that contains thepackage size of the products in Z (|Z|-dimensional vector). Hence,~s = (s1, . . . , s|Z|). Let
Sensors 2021, 21, 3747 12 of 30
ds(qi, qj) the following distance between the products qi and qj according to their packagesize as shown in Equation (3).
ds(qi, qj) = |s[qi]− s[qj]| / qi, qj ∈ Z. (3)
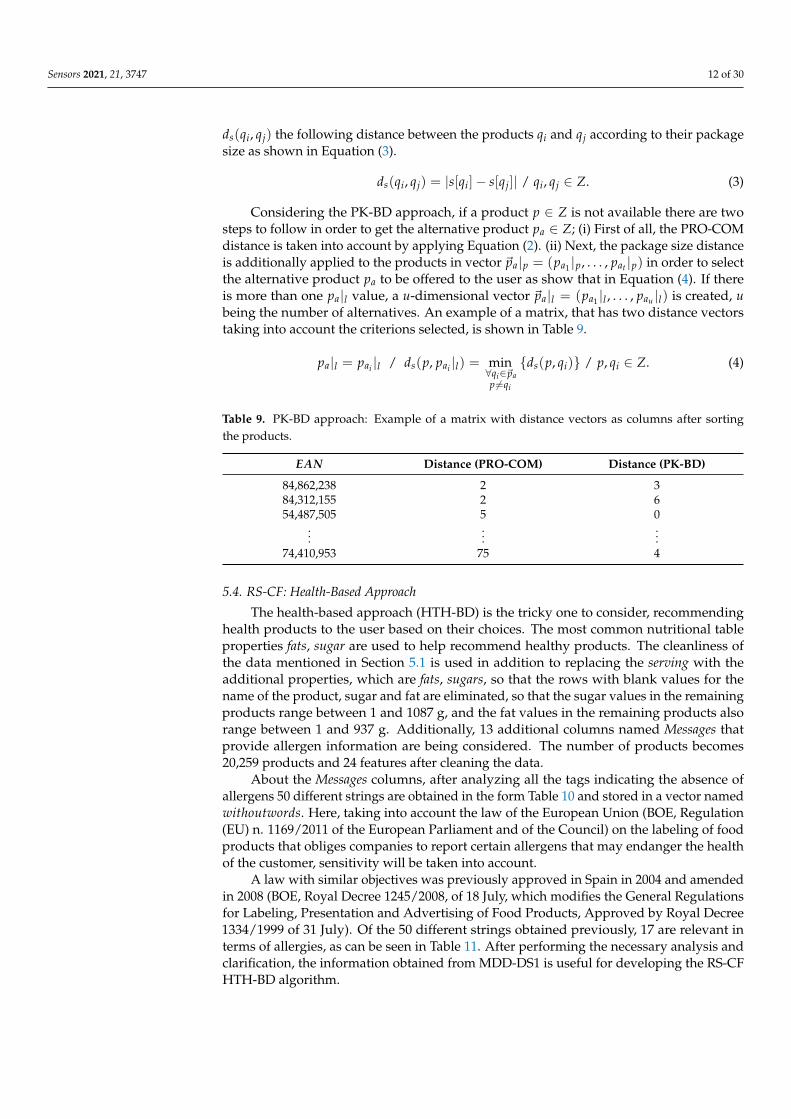
Considering the PK-BD approach, if a product p ∈ Z is not available there are twosteps to follow in order to get the alternative product pa ∈ Z; (i) First of all, the PRO-COMdistance is taken into account by applying Equation (2). (ii) Next, the package size distanceis additionally applied to the products in vector ~pa|p = (pa1 |p, . . . , pat |p) in order to selectthe alternative product pa to be offered to the user as show that in Equation (4). If thereis more than one pa|l value, a u-dimensional vector ~pa|l = (pa1 |l , . . . , pau |l) is created, ubeing the number of alternatives. An example of a matrix, that has two distance vectorstaking into account the criterions selected, is shown in Table 9.
pa|l = pai |l / ds(p, pai |l) = min∀qi∈~pap 6=qi
{ds(p, qi)} / p, qi ∈ Z. (4)
Table 9. PK-BD approach: Example of a matrix with distance vectors as columns after sortingthe products.
EAN Distance (PRO-COM) Distance (PK-BD)
84,862,238 2 384,312,155 2 654,487,505 5 0
......
...74,410,953 75 4
5.4. RS-CF: Health-Based Approach
The health-based approach (HTH-BD) is the tricky one to consider, recommendinghealth products to the user based on their choices. The most common nutritional tableproperties fats, sugar are used to help recommend healthy products. The cleanliness ofthe data mentioned in Section 5.1 is used in addition to replacing the serving with theadditional properties, which are fats, sugars, so that the rows with blank values for thename of the product, sugar and fat are eliminated, so that the sugar values in the remainingproducts range between 1 and 1087 g, and the fat values in the remaining products alsorange between 1 and 937 g. Additionally, 13 additional columns named Messages thatprovide allergen information are being considered. The number of products becomes20,259 products and 24 features after cleaning the data.
About the Messages columns, after analyzing all the tags indicating the absence ofallergens 50 different strings are obtained in the form Table 10 and stored in a vector namedwithoutwords. Here, taking into account the law of the European Union (BOE, Regulation(EU) n. 1169/2011 of the European Parliament and of the Council) on the labeling of foodproducts that obliges companies to report certain allergens that may endanger the healthof the customer, sensitivity will be taken into account.
A law with similar objectives was previously approved in Spain in 2004 and amendedin 2008 (BOE, Royal Decree 1245/2008, of 18 July, which modifies the General Regulationsfor Labeling, Presentation and Advertising of Food Products, Approved by Royal Decree1334/1999 of 31 July). Of the 50 different strings obtained previously, 17 are relevant interms of allergies, as can be seen in Table 11. After performing the necessary analysis andclarification, the information obtained from MDD-DS1 is useful for developing the RS-CFHTH-BD algorithm.
Sensors 2021, 21, 3747 13 of 30
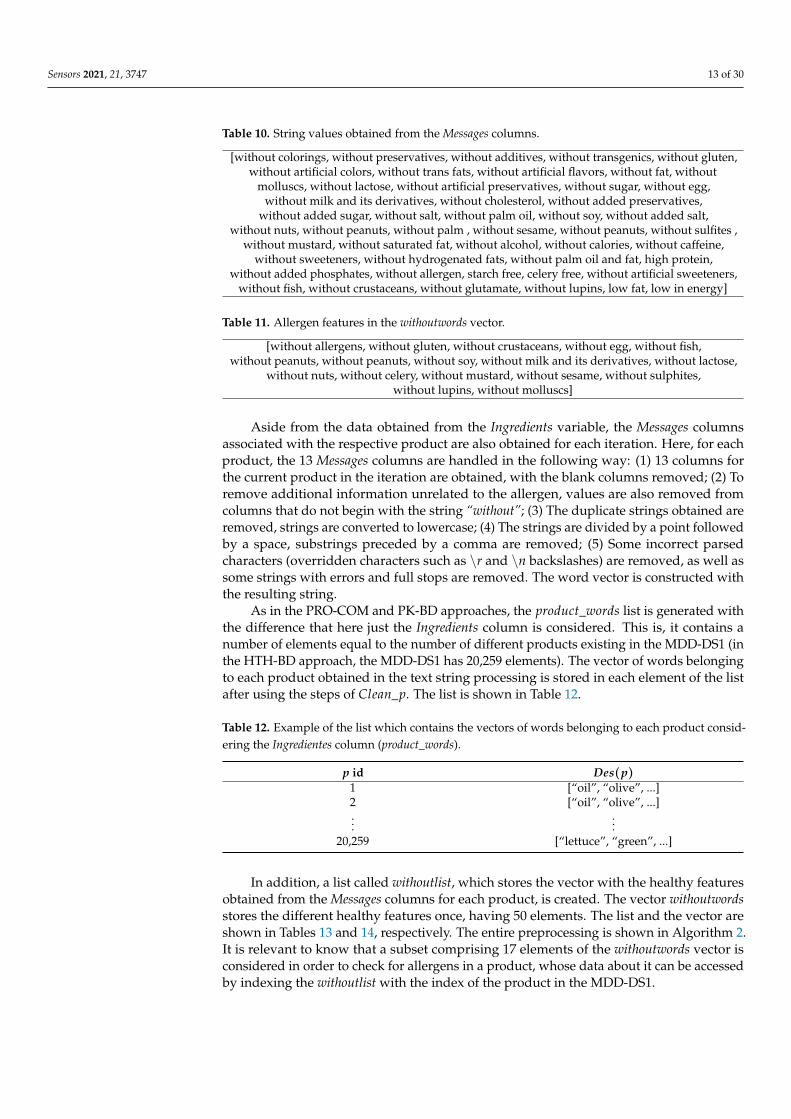
Table 10. String values obtained from the Messages columns.
[without colorings, without preservatives, without additives, without transgenics, without gluten,without artificial colors, without trans fats, without artificial flavors, without fat, without
molluscs, without lactose, without artificial preservatives, without sugar, without egg,without milk and its derivatives, without cholesterol, without added preservatives,
without added sugar, without salt, without palm oil, without soy, without added salt,without nuts, without peanuts, without palm , without sesame, without peanuts, without sulfites ,
without mustard, without saturated fat, without alcohol, without calories, without caffeine,without sweeteners, without hydrogenated fats, without palm oil and fat, high protein,
without added phosphates, without allergen, starch free, celery free, without artificial sweeteners,without fish, without crustaceans, without glutamate, without lupins, low fat, low in energy]
Table 11. Allergen features in the withoutwords vector.
[without allergens, without gluten, without crustaceans, without egg, without fish,without peanuts, without peanuts, without soy, without milk and its derivatives, without lactose,
without nuts, without celery, without mustard, without sesame, without sulphites,without lupins, without molluscs]
Aside from the data obtained from the Ingredients variable, the Messages columnsassociated with the respective product are also obtained for each iteration. Here, for eachproduct, the 13 Messages columns are handled in the following way: (1) 13 columns forthe current product in the iteration are obtained, with the blank columns removed; (2) Toremove additional information unrelated to the allergen, values are also removed fromcolumns that do not begin with the string “without”; (3) The duplicate strings obtained areremoved, strings are converted to lowercase; (4) The strings are divided by a point followedby a space, substrings preceded by a comma are removed; (5) Some incorrect parsedcharacters (overridden characters such as \r and \n backslashes) are removed, as well assome strings with errors and full stops are removed. The word vector is constructed withthe resulting string.
As in the PRO-COM and PK-BD approaches, the product_words list is generated withthe difference that here just the Ingredients column is considered. This is, it contains anumber of elements equal to the number of different products existing in the MDD-DS1 (inthe HTH-BD approach, the MDD-DS1 has 20,259 elements). The vector of words belongingto each product obtained in the text string processing is stored in each element of the listafter using the steps of Clean_p. The list is shown in Table 12.
Table 12. Example of the list which contains the vectors of words belonging to each product consid-ering the Ingredientes column (product_words).
p id Des(p)1 [“oil”, “olive”, ...]2 [“oil”, “olive”, ...]...
...20,259 [“lettuce”, “green”, ...]
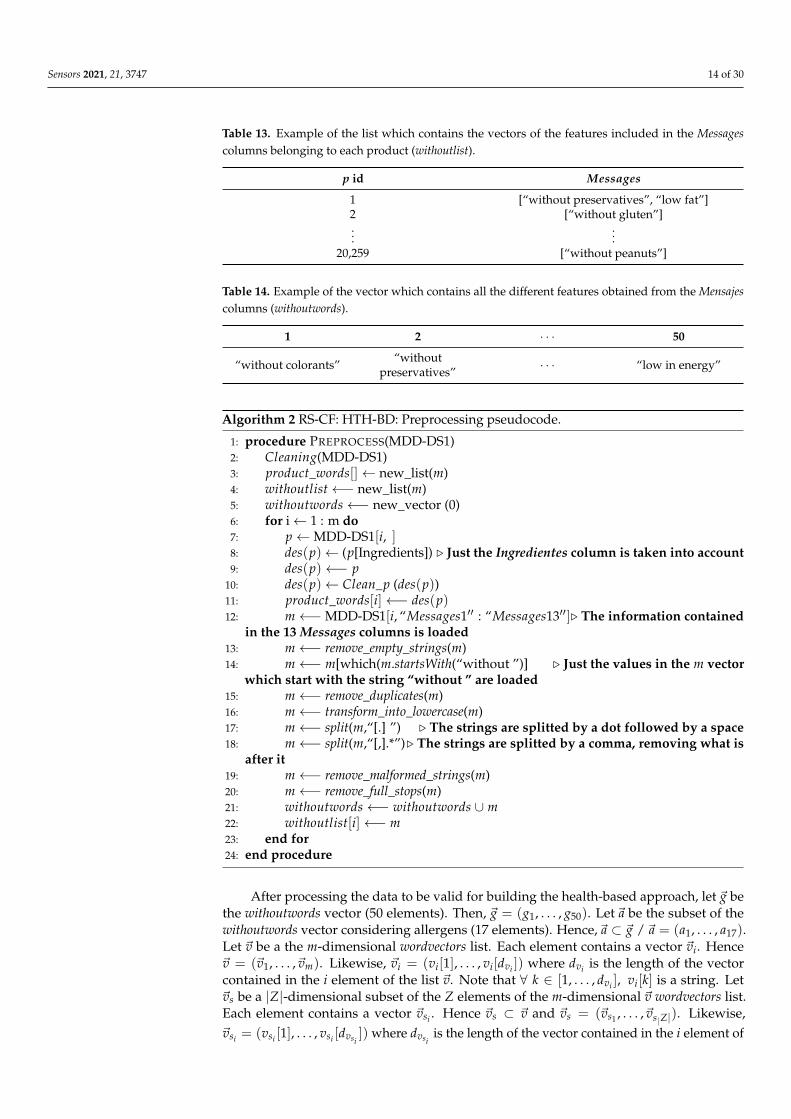
In addition, a list called withoutlist, which stores the vector with the healthy featuresobtained from the Messages columns for each product, is created. The vector withoutwordsstores the different healthy features once, having 50 elements. The list and the vector areshown in Tables 13 and 14, respectively. The entire preprocessing is shown in Algorithm 2.It is relevant to know that a subset comprising 17 elements of the withoutwords vector isconsidered in order to check for allergens in a product, whose data about it can be accessedby indexing the withoutlist with the index of the product in the MDD-DS1.
Sensors 2021, 21, 3747 14 of 30
Table 13. Example of the list which contains the vectors of the features included in the Messagescolumns belonging to each product (withoutlist).
p id Messages
1 [“without preservatives”, “low fat”]2 [“without gluten”]...
...20,259 [“without peanuts”]
Table 14. Example of the vector which contains all the different features obtained from the Mensajescolumns (withoutwords).
1 2 · · · 50
“without colorants” “withoutpreservatives” · · · “low in energy”
Algorithm 2 RS-CF: HTH-BD: Preprocessing pseudocode.
1: procedure PREPROCESS(MDD-DS1)2: Cleaning(MDD-DS1)3: product_words[]← new_list(m)4: withoutlist←− new_list(m)5: withoutwords←− new_vector (0)6: for i← 1 : m do7: p←MDD-DS1[i, ]8: des(p)← (p[Ingredients]) . Just the Ingredientes column is taken into account9: des(p)←− p
10: des(p)← Clean_p (des(p))11: product_words[i]←− des(p)12: m←−MDD-DS1[i, “Messages1′′ : “Messages13′′]. The information contained
in the 13 Messages columns is loaded13: m←− remove_empty_strings(m)14: m←− m[which(m.startsWith(“without ”)] . Just the values in the m vector
which start with the string “without ” are loaded15: m←− remove_duplicates(m)16: m←− transform_into_lowercase(m)17: m←− split(m,“[.] ”) . The strings are splitted by a dot followed by a space18: m←− split(m,“[,].*”). The strings are splitted by a comma, removing what is
after it19: m←− remove_malformed_strings(m)20: m←− remove_full_stops(m)21: withoutwords←− withoutwords ∪ m22: withoutlist[i]←− m23: end for24: end procedure
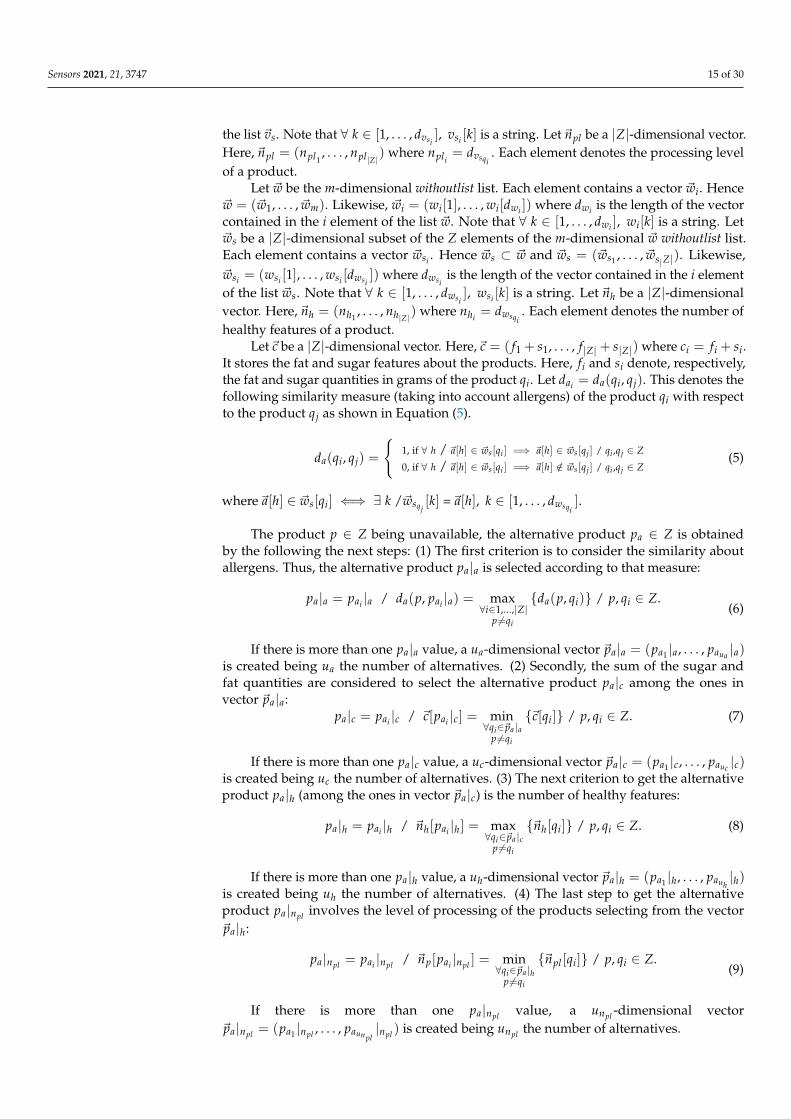
After processing the data to be valid for building the health-based approach, let ~g bethe withoutwords vector (50 elements). Then, ~g = (g1, . . . , g50). Let~a be the subset of thewithoutwords vector considering allergens (17 elements). Hence,~a ⊂ ~g /~a = (a1, . . . , a17).Let ~v be a the m-dimensional wordvectors list. Each element contains a vector ~vi. Hence~v = (~v1, . . . ,~vm). Likewise, ~vi = (vi[1], . . . , vi[dvi ]) where dvi is the length of the vectorcontained in the i element of the list ~v. Note that ∀ k ∈ [1, . . . , dvi ], vi[k] is a string. Let~vs be a |Z|-dimensional subset of the Z elements of the m-dimensional ~v wordvectors list.Each element contains a vector ~vsi . Hence ~vs ⊂ ~v and ~vs = (~vs1 , . . . ,~vs|Z|). Likewise,~vsi = (vsi [1], . . . , vsi [dvsi
]) where dvsiis the length of the vector contained in the i element of
Sensors 2021, 21, 3747 15 of 30
the list ~vs. Note that ∀ k ∈ [1, . . . , dvsi], vsi [k] is a string. Let~npl be a |Z|-dimensional vector.
Here,~npl = (npl1, . . . , npl|Z|) where npli
= dvsqi. Each element denotes the processing level
of a product.Let ~w be the m-dimensional withoutlist list. Each element contains a vector ~wi. Hence
~w = (~w1, . . . , ~wm). Likewise, ~wi = (wi[1], . . . , wi[dwi ]) where dwi is the length of the vectorcontained in the i element of the list ~w. Note that ∀ k ∈ [1, . . . , dwi ], wi[k] is a string. Let~ws be a |Z|-dimensional subset of the Z elements of the m-dimensional ~w withoutlist list.Each element contains a vector ~wsi . Hence ~ws ⊂ ~w and ~ws = (~ws1 , . . . , ~ws|Z|). Likewise,~wsi = (wsi [1], . . . , wsi [dwsi
]) where dwsiis the length of the vector contained in the i element
of the list ~ws. Note that ∀ k ∈ [1, . . . , dwsi], wsi [k] is a string. Let ~nh be a |Z|-dimensional
vector. Here,~nh = (nh1 , . . . , nh|Z|) where nhi= dwsqi
. Each element denotes the number ofhealthy features of a product.
Let~c be a |Z|-dimensional vector. Here,~c = ( f1 + s1, . . . , f|Z| + s|Z|) where ci = fi + si.It stores the fat and sugar features about the products. Here, fi and si denote, respectively,the fat and sugar quantities in grams of the product qi. Let dai = da(qi, qj). This denotes thefollowing similarity measure (taking into account allergens) of the product qi with respectto the product qj as shown in Equation (5).
da(qi, qj) =
{1, if ∀ h / ~a[h] ∈ ~ws [qi ] =⇒ ~a[h] ∈ ~ws [qj ] / qi ,qj ∈ Z
0, if ∀ h / ~a[h] ∈ ~ws [qi ] =⇒ ~a[h] /∈ ~ws [qj ] / qi ,qj ∈ Z(5)
where~a[h] ∈ ~ws[qi] ⇐⇒ ∃ k /~wsqj[k] =~a[h], k ∈ [1, . . . , dwsqi
].
The product p ∈ Z being unavailable, the alternative product pa ∈ Z is obtainedby the following the next steps: (1) The first criterion is to consider the similarity aboutallergens. Thus, the alternative product pa|a is selected according to that measure:
pa|a = pai |a / da(p, pai |a) = max∀i∈1,...,|Z|
p 6=qi
{da(p, qi)} / p, qi ∈ Z.(6)
If there is more than one pa|a value, a ua-dimensional vector ~pa|a = (pa1 |a, . . . , paua |a)is created being ua the number of alternatives. (2) Secondly, the sum of the sugar andfat quantities are considered to select the alternative product pa|c among the ones invector ~pa|a:
pa|c = pai |c / ~c[pai |c] = min∀qi∈~pa |a
p 6=qi
{~c[qi]} / p, qi ∈ Z. (7)
If there is more than one pa|c value, a uc-dimensional vector ~pa|c = (pa1 |c, . . . , pauc |c)is created being uc the number of alternatives. (3) The next criterion to get the alternativeproduct pa|h (among the ones in vector ~pa|c) is the number of healthy features:
pa|h = pai |h / ~nh[pai |h] = max∀qi∈~pa |c
p 6=qi
{~nh[qi]} / p, qi ∈ Z. (8)
If there is more than one pa|h value, a uh-dimensional vector ~pa|h = (pa1 |h, . . . , pauh|h)
is created being uh the number of alternatives. (4) The last step to get the alternativeproduct pa|npl involves the level of processing of the products selecting from the vector~pa|h:
pa|npl = pai |npl / ~np[pai |npl ] = min∀qi∈~pa |h
p 6=qi
{~npl [qi]} / p, qi ∈ Z.(9)
If there is more than one pa|npl value, a unpl -dimensional vector~pa|npl = (pa1 |npl , . . . , paunpl
|npl ) is created being unpl the number of alternatives.
Sensors 2021, 21, 3747 16 of 30
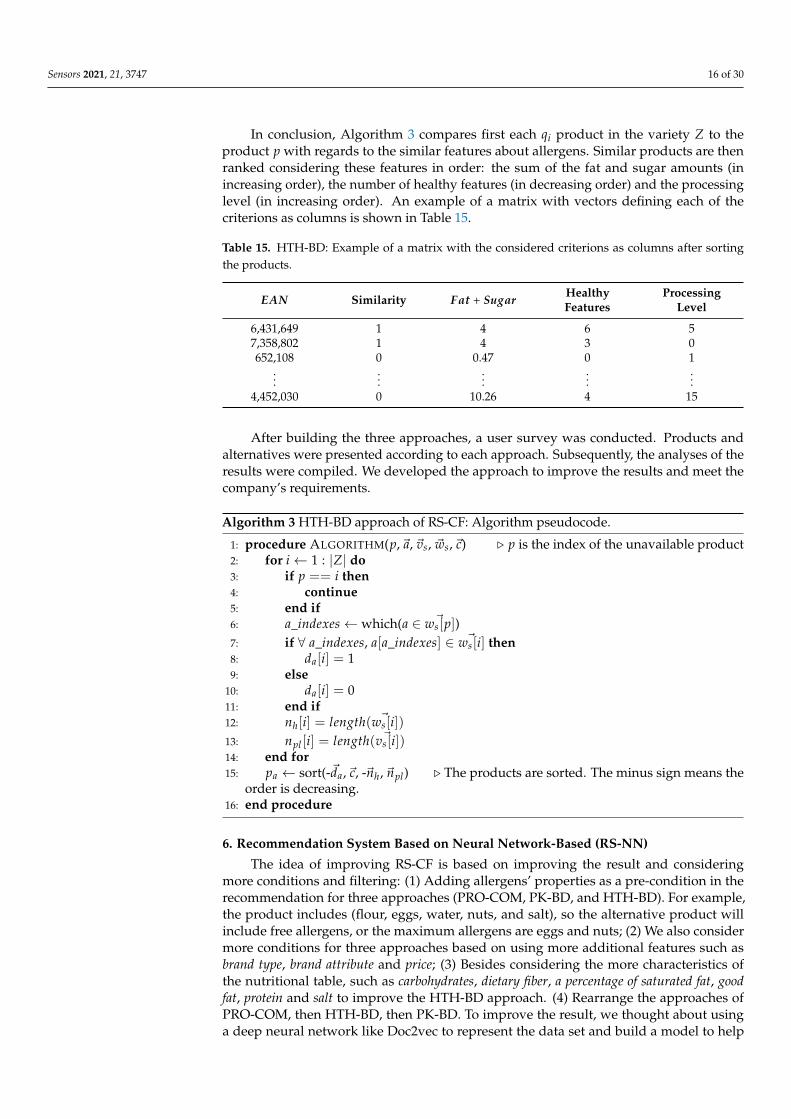
In conclusion, Algorithm 3 compares first each qi product in the variety Z to theproduct p with regards to the similar features about allergens. Similar products are thenranked considering these features in order: the sum of the fat and sugar amounts (inincreasing order), the number of healthy features (in decreasing order) and the processinglevel (in increasing order). An example of a matrix with vectors defining each of thecriterions as columns is shown in Table 15.
Table 15. HTH-BD: Example of a matrix with the considered criterions as columns after sortingthe products.
EAN Similarity Fat + Sugar HealthyFeatures
ProcessingLevel
6,431,649 1 4 6 57,358,802 1 4 3 0652,108 0 0.47 0 1
......
......
...4,452,030 0 10.26 4 15
After building the three approaches, a user survey was conducted. Products andalternatives were presented according to each approach. Subsequently, the analyses of theresults were compiled. We developed the approach to improve the results and meet thecompany’s requirements.
Algorithm 3 HTH-BD approach of RS-CF: Algorithm pseudocode.
1: procedure ALGORITHM(p,~a, ~vs, ~ws,~c) . p is the index of the unavailable product2: for i← 1 : |Z| do3: if p == i then4: continue5: end if6: a_indexes← which(a ∈ ~ws[p])7: if ∀ a_indexes, a[a_indexes] ∈ ~ws[i] then8: da[i] = 19: else
10: da[i] = 011: end if12: nh[i] = length( ~ws[i])13: npl [i] = length( ~vs[i])14: end for15: pa ← sort(-~da,~c, -~nh,~npl) . The products are sorted. The minus sign means the
order is decreasing.16: end procedure
6. Recommendation System Based on Neural Network-Based (RS-NN)
The idea of improving RS-CF is based on improving the result and consideringmore conditions and filtering: (1) Adding allergens’ properties as a pre-condition in therecommendation for three approaches (PRO-COM, PK-BD, and HTH-BD). For example,the product includes (flour, eggs, water, nuts, and salt), so the alternative product willinclude free allergens, or the maximum allergens are eggs and nuts; (2) We also considermore conditions for three approaches based on using more additional features such asbrand type, brand attribute and price; (3) Besides considering the more characteristics ofthe nutritional table, such as carbohydrates, dietary fiber, a percentage of saturated fat, goodfat, protein and salt to improve the HTH-BD approach. (4) Rearrange the approaches ofPRO-COM, then HTH-BD, then PK-BD. To improve the result, we thought about usinga deep neural network like Doc2vec to represent the data set and build a model to help
Sensors 2021, 21, 3747 17 of 30
obtain alternative products. That is why we call this model a Recommendation systembased on neural networks (RS-NN).
After that, we use many of the similarity techniques such as Cosine, Jaccard, Euclideanand Manhattan to obtain and sort similar products. Subsequently, we conduct a compar-ative study to determine which technique is best to sort similar products based on theexperts’ results.
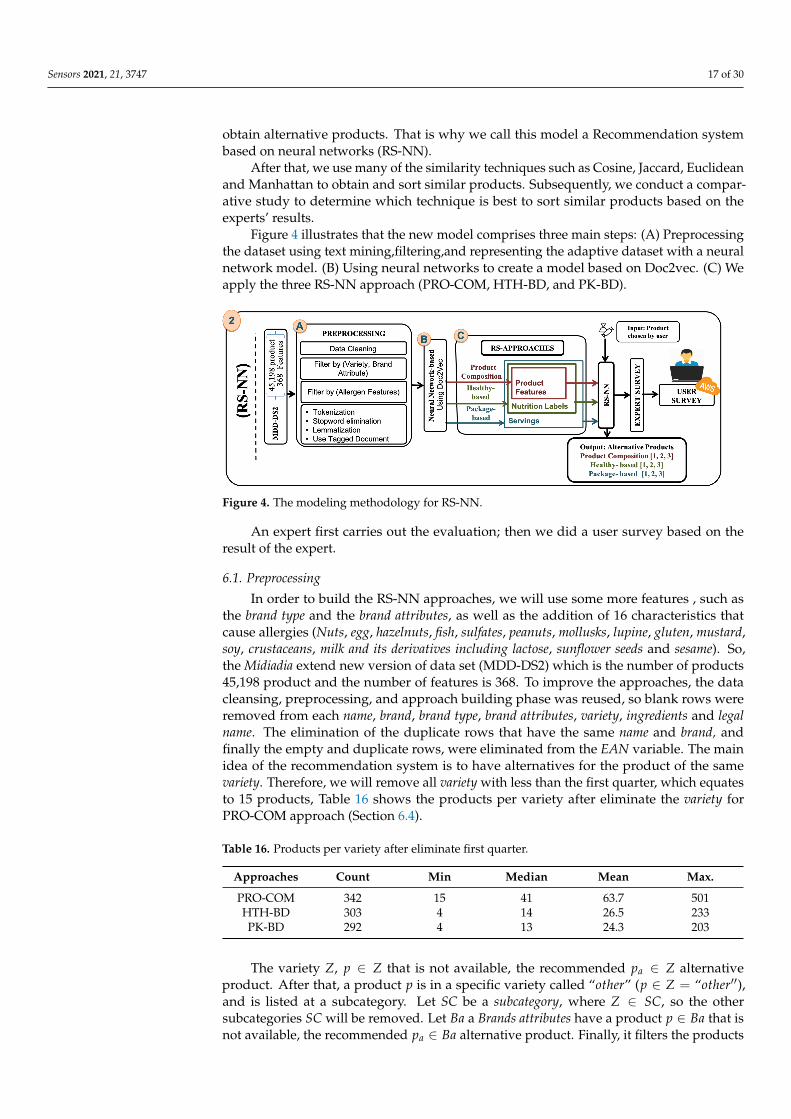
Figure 4 illustrates that the new model comprises three main steps: (A) Preprocessingthe dataset using text mining,filtering,and representing the adaptive dataset with a neuralnetwork model. (B) Using neural networks to create a model based on Doc2vec. (C) Weapply the three RS-NN approach (PRO-COM, HTH-BD, and PK-BD).
Figure 4. The modeling methodology for RS-NN.
An expert first carries out the evaluation; then we did a user survey based on theresult of the expert.
6.1. Preprocessing
In order to build the RS-NN approaches, we will use some more features , such asthe brand type and the brand attributes, as well as the addition of 16 characteristics thatcause allergies (Nuts, egg, hazelnuts, fish, sulfates, peanuts, mollusks, lupine, gluten, mustard,soy, crustaceans, milk and its derivatives including lactose, sunflower seeds and sesame). So,the Midiadia extend new version of data set (MDD-DS2) which is the number of products45,198 product and the number of features is 368. To improve the approaches, the datacleansing, preprocessing, and approach building phase was reused, so blank rows wereremoved from each name, brand, brand type, brand attributes, variety, ingredients and legalname. The elimination of the duplicate rows that have the same name and brand, andfinally the empty and duplicate rows, were eliminated from the EAN variable. The mainidea of the recommendation system is to have alternatives for the product of the samevariety. Therefore, we will remove all variety with less than the first quarter, which equatesto 15 products, Table 16 shows the products per variety after eliminate the variety forPRO-COM approach (Section 6.4).
Table 16. Products per variety after eliminate first quarter.
Approaches Count Min Median Mean Max.
PRO-COM 342 15 41 63.7 501HTH-BD 303 4 14 26.5 233PK-BD 292 4 13 24.3 203
The variety Z, p ∈ Z that is not available, the recommended pa ∈ Z alternativeproduct. After that, a product p is in a specific variety called “other” (p ∈ Z = “other′′),and is listed at a subcategory. Let SC be a subcategory, where Z ∈ SC, so the othersubcategories SC will be removed. Let Ba a Brands attributes have a product p ∈ Ba that isnot available, the recommended pa ∈ Ba alternative product. Finally, it filters the products
Sensors 2021, 21, 3747 18 of 30
p according to the allergens feature, let a f be allergen features. Eliminating all the productsthat contain more or different allergens feature a f .
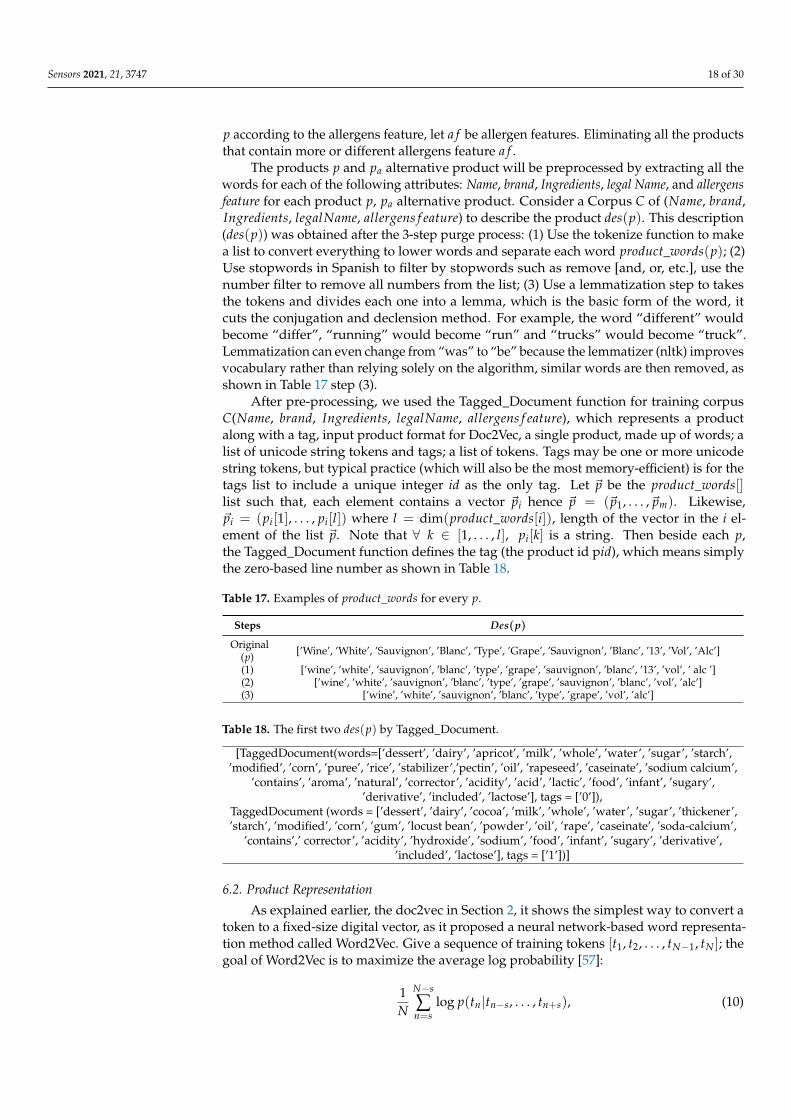
The products p and pa alternative product will be preprocessed by extracting all thewords for each of the following attributes: Name, brand, Ingredients, legal Name, and allergensfeature for each product p, pa alternative product. Consider a Corpus C of (Name, brand,Ingredients, legalName, allergens f eature) to describe the product des(p). This description(des(p)) was obtained after the 3-step purge process: (1) Use the tokenize function to makea list to convert everything to lower words and separate each word product_words(p); (2)Use stopwords in Spanish to filter by stopwords such as remove [and, or, etc.], use thenumber filter to remove all numbers from the list; (3) Use a lemmatization step to takesthe tokens and divides each one into a lemma, which is the basic form of the word, itcuts the conjugation and declension method. For example, the word “different” wouldbecome “differ”, “running” would become “run” and “trucks” would become “truck”.Lemmatization can even change from “was” to “be” because the lemmatizer (nltk) improvesvocabulary rather than relying solely on the algorithm, similar words are then removed, asshown in Table 17 step (3).
After pre-processing, we used the Tagged_Document function for training corpusC(Name, brand, Ingredients, legalName, allergens f eature), which represents a productalong with a tag, input product format for Doc2Vec, a single product, made up of words; alist of unicode string tokens and tags; a list of tokens. Tags may be one or more unicodestring tokens, but typical practice (which will also be the most memory-efficient) is for thetags list to include a unique integer id as the only tag. Let ~p be the product_words[]list such that, each element contains a vector ~pi hence ~p = (~p1, . . . ,~pm). Likewise,~pi = (pi[1], . . . , pi[l]) where l = dim(product_words[i]), length of the vector in the i el-ement of the list ~p. Note that ∀ k ∈ [1, . . . , l], pi[k] is a string. Then beside each p,the Tagged_Document function defines the tag (the product id pid), which means simplythe zero-based line number as shown in Table 18.
Table 17. Examples of product_words for every p.
Steps Des(p)
Original(p) [’Wine’, ’White’, ’Sauvignon’, ’Blanc’, ’Type’, ’Grape’, ’Sauvignon’, ’Blanc’, ’13’, ’Vol’, ’Alc’]
(1) [’wine’, ’white’, ’sauvignon’, ’blanc’, ’type’, ’grape’, ’sauvignon’, ’blanc’, ’13’, ’vol’, ’ alc ’](2) [’wine’, ’white’, ’sauvignon’, ’blanc’, ’type’, ’grape’, ’sauvignon’, ’blanc’, ’vol’, ’alc’](3) [’wine’, ’white’, ’sauvignon’, ’blanc’, ’type’, ’grape’, ’vol’, ’alc’]
Table 18. The first two des(p) by Tagged_Document.
[TaggedDocument(words=[’dessert’, ’dairy’, ’apricot’, ’milk’, ’whole’, ’water’, ’sugar’, ’starch’,’modified’, ’corn’, ’puree’, ’rice’, ’stabilizer’,’pectin’, ’oil’, ’rapeseed’, ’caseinate’, ’sodium calcium’,
’contains’, ’aroma’, ’natural’, ’corrector’, ’acidity’, ’acid’, ’lactic’, ’food’, ’infant’, ’sugary’,’derivative’, ’included’, ’lactose’], tags = [’0’]),
TaggedDocument (words = [’dessert’, ’dairy’, ’cocoa’, ’milk’, ’whole’, ’water’, ’sugar’, ’thickener’,’starch’, ’modified’, ’corn’, ’gum’, ’locust bean’, ’powder’, ’oil’, ’rape’, ’caseinate’, ’soda-calcium’,
’contains’,’ corrector’, ’acidity’, ’hydroxide’, ’sodium’, ’food’, ’infant’, ’sugary’, ’derivative’,’included’, ’lactose’], tags = [’1’])]
6.2. Product Representation
As explained earlier, the doc2vec in Section 2, it shows the simplest way to convert atoken to a fixed-size digital vector, as it proposed a neural network-based word representa-tion method called Word2Vec. Give a sequence of training tokens [t1, t2, . . . , tN−1, tN ]; thegoal of Word2Vec is to maximize the average log probability [57]:
1N
N−s
∑n=s
log p(tn|tn−s, . . . , tn+s), (10)

Sensors 2021, 21, 3747 19 of 30
where s is the size of the window to preserve contextual information, the token tn can beeasily be predicted using a multilabel classifier like SoftMax function:
p(tn|tn−s, . . . , tn+s) =ejtn
∑i ejti, (11)
where each jti is the (ti) output value of a feed-forward neural network calculated with
j = x + h f (tn−s, . . . , tn+s; R), (12)
where x, h, f , and R are terms for the bias between the hidden and output layers, the weightmatrix between the hidden and output layers, the mean or sequence of product tokens,and the word embedding matrix, respectively. Doc2Vec extends from Word2Vec, whichtries to define, in this case, a continuous vector fit to a product to preserve the semanticrelationship between the different products [58]. Like Word2Vec, each token is representedby a d-dimensional continuous vector (d << |v|, which is the size of the vocabulary in thedes(p)). Furthermore, the same product p is also represented by a continuous vector in thesame space as the word vectors. In Doc2Vec, each product p is assigned to a unique vectorthat is represented by a column in matrix D, while each token in the des(p) is assigned to aunique vector that is represented by a column in matrix T. Therefore, the only change inthe network formulation is to add D to the Equation (12) as follows:
j = x + h f (tn−s, . . . , tn+s; R, D). (13)
When the network is adequately trained, it can obtain a distributed representationof each of the products p. Therefore, the products were trained using three elements ofthe Doc2Vec model, vector size with 50 dimensions~a = (a1, . . . , a50), and iteration overthe training set 40 times. Set the minimum word count to two to ignore words with veryfew frequencies.
Finally, we have a product matrix X[m, n] is a MxN matrix where each column Nrepresents a vector for each product ~a = ([a1, . . . , a50], tag), ∀ k ∈ [1, . . . , 50], wheretag ∈ pid, and each row M represents a product p of the MDD-DS2 so that M is the totalnumber of products ~p = (p1, . . . , pm), as shown in Table 19.
Table 19. The vector for first product~a(p1).
array([ 0.00742837, −0.00540146, −0.14862166, −0.00862698, 0.31875622, 0.115518, 0.00795528,−0.06915003, 0.03247217, −0.12760445, −0.20222402, −0.09181757, −0.02992765, −0.09429716,
0.04839283, −0.08727524, −0.08463322, −0.09556159, −0.01945411, −0.0644968, 0.11707045,−0.09715877, −0.24429108, −0.08826657, −0.12004123, −0.17009708, 0.17322347, −0.04258763,
0.03453251, −0.19297938, −0.2081344, 0.23702264, 0.08457132, 0.0120729, 0.03960438, −0.21322013,0.09752178, −0.03770451, −0.06469689, 0.02615795, 0.20623626, −0.09590556, −0.00720048,
−0.12926176, −0.21335329, −0.11945274, 0.06031954, 0.0124997, 0.27832198, −0.10382865], dtype= float32)
6.3. Similarity
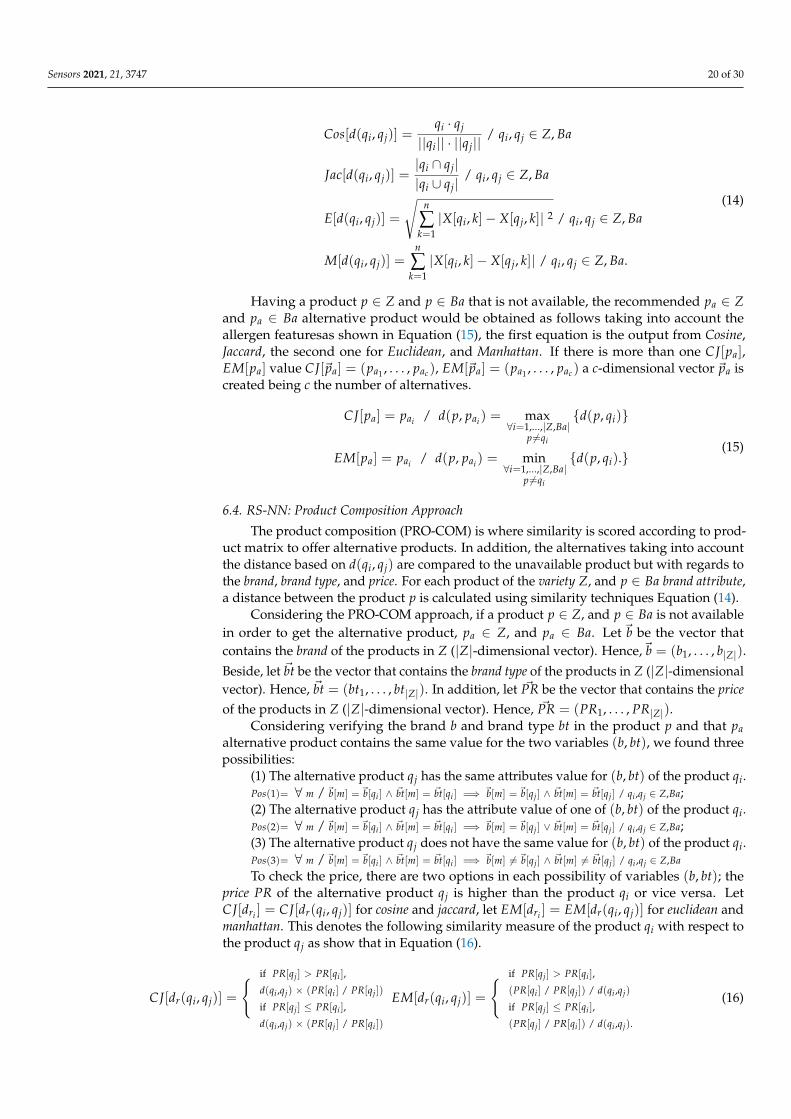
The RS-NN approaches used the similarity techniques such as (Cosine, Jaccard, Eu-clidean, and Manhattan) to calculate the distance between the product qi and qj. Letdi = d(qi, qj), this denotes the following similarity measure taking into account variety Z,brand attribute Ba, and allergens features a f of the product qi with respect to the product qjas show that in Equation (14).
Sensors 2021, 21, 3747 20 of 30
Cos[d(qi, qj)] =qi · qj
||qi|| · ||qj||/ qi, qj ∈ Z, Ba
Jac[d(qi, qj)] =|qi ∩ qj||qi ∪ qj|
/ qi, qj ∈ Z, Ba
E[d(qi, qj)] =
√n
∑k=1|X[qi, k]− X[qj, k]| 2 / qi, qj ∈ Z, Ba
M[d(qi, qj)] =n
∑k=1|X[qi, k]− X[qj, k]| / qi, qj ∈ Z, Ba.
(14)
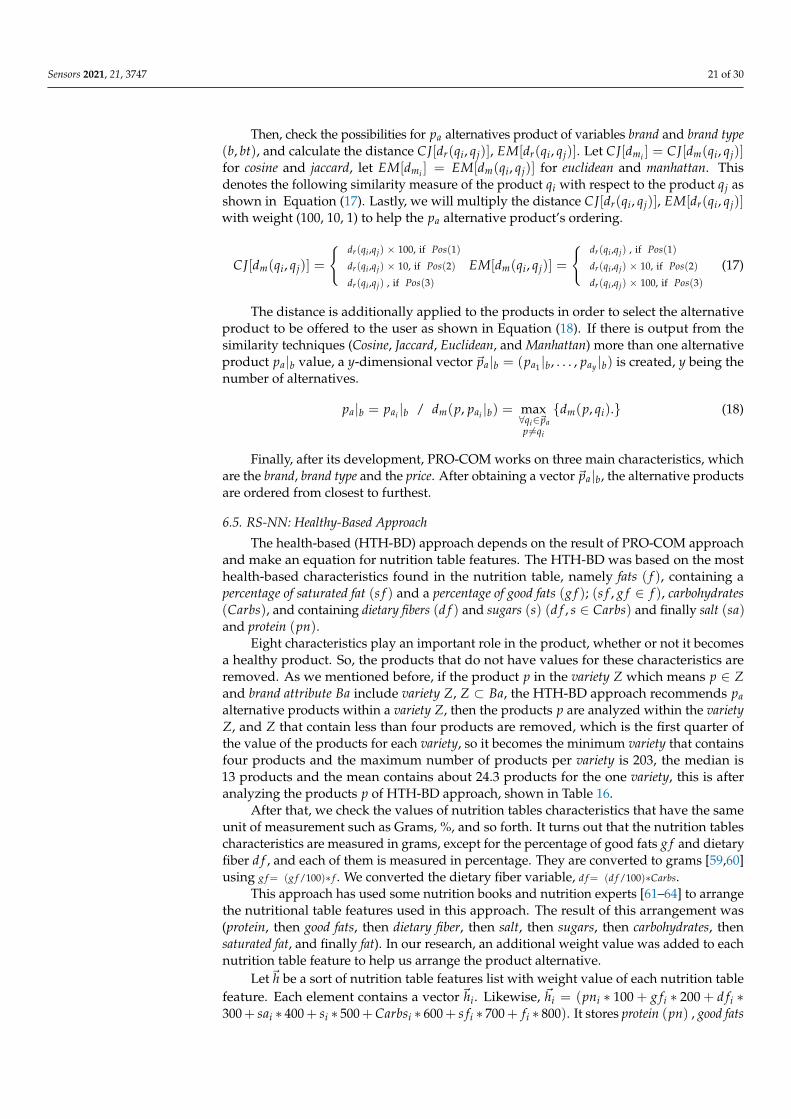
Having a product p ∈ Z and p ∈ Ba that is not available, the recommended pa ∈ Zand pa ∈ Ba alternative product would be obtained as follows taking into account theallergen featuresas shown in Equation (15), the first equation is the output from Cosine,Jaccard, the second one for Euclidean, and Manhattan. If there is more than one CJ[pa],EM[pa] value CJ[~pa] = (pa1 , . . . , pac), EM[~pa] = (pa1 , . . . , pac) a c-dimensional vector ~pa iscreated being c the number of alternatives.
CJ[pa] = pai / d(p, pai ) = max∀i=1,...,|Z,Ba|
p 6=qi
{d(p, qi)}
EM[pa] = pai / d(p, pai ) = min∀i=1,...,|Z,Ba|
p 6=qi
{d(p, qi).}(15)
6.4. RS-NN: Product Composition Approach
The product composition (PRO-COM) is where similarity is scored according to prod-uct matrix to offer alternative products. In addition, the alternatives taking into accountthe distance based on d(qi, qj) are compared to the unavailable product but with regards tothe brand, brand type, and price. For each product of the variety Z, and p ∈ Ba brand attribute,a distance between the product p is calculated using similarity techniques Equation (14).
Considering the PRO-COM approach, if a product p ∈ Z, and p ∈ Ba is not availablein order to get the alternative product, pa ∈ Z, and pa ∈ Ba. Let ~b be the vector thatcontains the brand of the products in Z (|Z|-dimensional vector). Hence,~b = (b1, . . . , b|Z|).Beside, let ~bt be the vector that contains the brand type of the products in Z (|Z|-dimensionalvector). Hence, ~bt = (bt1, . . . , bt|Z|). In addition, let ~PR be the vector that contains the priceof the products in Z (|Z|-dimensional vector). Hence, ~PR = (PR1, . . . , PR|Z|).
Considering verifying the brand b and brand type bt in the product p and that paalternative product contains the same value for the two variables (b, bt), we found threepossibilities:
(1) The alternative product qj has the same attributes value for (b, bt) of the product qi.Pos(1)= ∀ m / ~b[m] = ~b[qi ] ∧ ~bt[m] = ~bt[qi ] =⇒ ~b[m] = ~b[qj ] ∧ ~bt[m] = ~bt[qj ] / qi ,qj ∈ Z,Ba;(2) The alternative product qj has the attribute value of one of (b, bt) of the product qi.Pos(2)= ∀ m / ~b[m] = ~b[qi ] ∧ ~bt[m] = ~bt[qi ] =⇒ ~b[m] = ~b[qj ] ∨ ~bt[m] = ~bt[qj ] / qi ,qj ∈ Z,Ba;(3) The alternative product qj does not have the same value for (b, bt) of the product qi.Pos(3)= ∀ m / ~b[m] = ~b[qi ] ∧ ~bt[m] = ~bt[qi ] =⇒ ~b[m] 6= ~b[qj ] ∧ ~bt[m] 6= ~bt[qj ] / qi ,qj ∈ Z,Ba
To check the price, there are two options in each possibility of variables (b, bt); theprice PR of the alternative product qj is higher than the product qi or vice versa. LetCJ[dri ] = CJ[dr(qi, qj)] for cosine and jaccard, let EM[dri ] = EM[dr(qi, qj)] for euclidean andmanhattan. This denotes the following similarity measure of the product qi with respect tothe product qj as show that in Equation (16).
CJ[dr(qi, qj)] =
{ if PR[qj ] > PR[qi ],
d(qi ,qj) × (PR[qi ] / PR[qj ])
if PR[qj ] ≤ PR[qi ],
d(qi ,qj) × (PR[qj ] / PR[qi ])
EM[dr(qi, qj)] =
{ if PR[qj ] > PR[qi ],
(PR[qi ] / PR[qj ]) / d(qi ,qj)
if PR[qj ] ≤ PR[qi ],
(PR[qj ] / PR[qi ]) / d(qi ,qj).
(16)
Sensors 2021, 21, 3747 21 of 30
Then, check the possibilities for pa alternatives product of variables brand and brand type(b, bt), and calculate the distance CJ[dr(qi, qj)], EM[dr(qi, qj)]. Let CJ[dmi ] = CJ[dm(qi, qj)]for cosine and jaccard, let EM[dmi ] = EM[dm(qi, qj)] for euclidean and manhattan. Thisdenotes the following similarity measure of the product qi with respect to the product qj asshown in Equation (17). Lastly, we will multiply the distance CJ[dr(qi, qj)], EM[dr(qi, qj)]with weight (100, 10, 1) to help the pa alternative product’s ordering.
CJ[dm(qi, qj)] =
{ dr(qi ,qj) × 100, if Pos(1)
dr(qi ,qj) × 10, if Pos(2)
dr(qi ,qj) , if Pos(3)
EM[dm(qi, qj)] =
{ dr(qi ,qj) , if Pos(1)
dr(qi ,qj) × 10, if Pos(2)
dr(qi ,qj) × 100, if Pos(3)
(17)
The distance is additionally applied to the products in order to select the alternativeproduct to be offered to the user as shown in Equation (18). If there is output from thesimilarity techniques (Cosine, Jaccard, Euclidean, and Manhattan) more than one alternativeproduct pa|b value, a y-dimensional vector ~pa|b = (pa1 |b, . . . , pay |b) is created, y being thenumber of alternatives.
pa|b = pai |b / dm(p, pai |b) = max∀qi∈~pap 6=qi
{dm(p, qi).} (18)
Finally, after its development, PRO-COM works on three main characteristics, whichare the brand, brand type and the price. After obtaining a vector ~pa|b, the alternative productsare ordered from closest to furthest.
6.5. RS-NN: Healthy-Based Approach
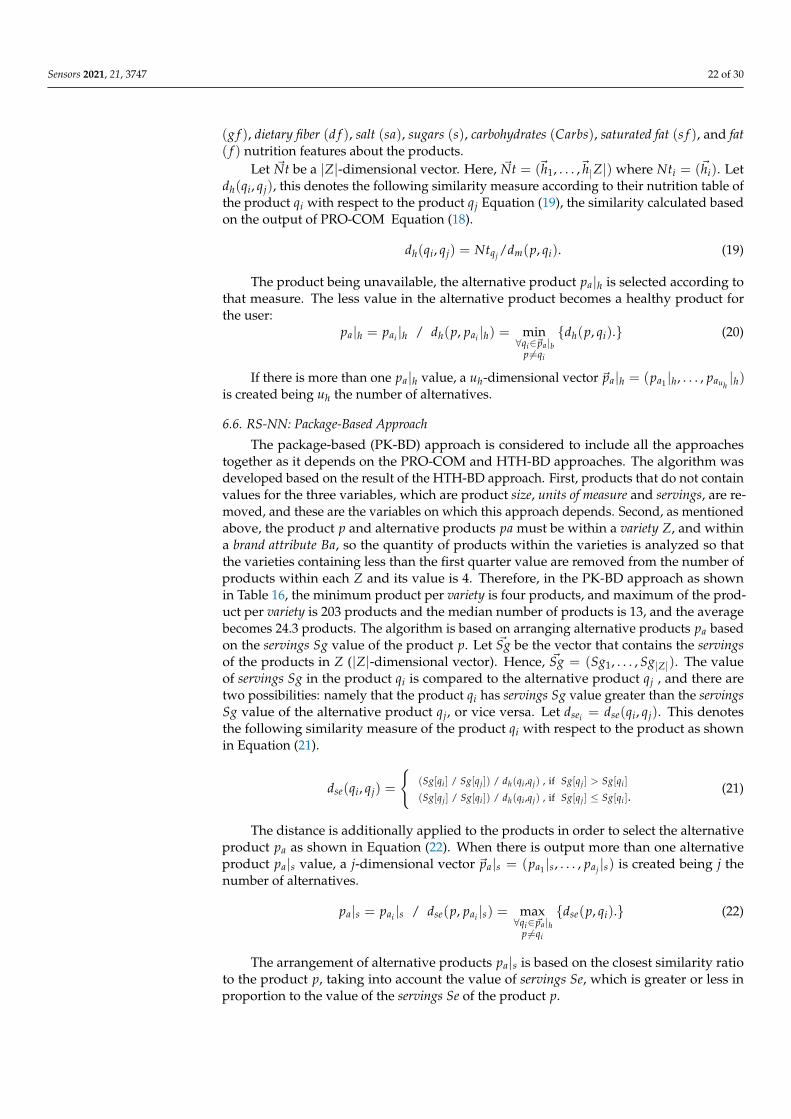
The health-based (HTH-BD) approach depends on the result of PRO-COM approachand make an equation for nutrition table features. The HTH-BD was based on the mosthealth-based characteristics found in the nutrition table, namely fats ( f ), containing apercentage of saturated fat (s f ) and a percentage of good fats (g f ); (s f , g f ∈ f ), carbohydrates(Carbs), and containing dietary fibers (d f ) and sugars (s) (d f , s ∈ Carbs) and finally salt (sa)and protein (pn).
Eight characteristics play an important role in the product, whether or not it becomesa healthy product. So, the products that do not have values for these characteristics areremoved. As we mentioned before, if the product p in the variety Z which means p ∈ Zand brand attribute Ba include variety Z, Z ⊂ Ba, the HTH-BD approach recommends paalternative products within a variety Z, then the products p are analyzed within the varietyZ, and Z that contain less than four products are removed, which is the first quarter ofthe value of the products for each variety, so it becomes the minimum variety that containsfour products and the maximum number of products per variety is 203, the median is13 products and the mean contains about 24.3 products for the one variety, this is afteranalyzing the products p of HTH-BD approach, shown in Table 16.
After that, we check the values of nutrition tables characteristics that have the sameunit of measurement such as Grams, %, and so forth. It turns out that the nutrition tablescharacteristics are measured in grams, except for the percentage of good fats g f and dietaryfiber d f , and each of them is measured in percentage. They are converted to grams [59,60]using g f= (g f /100)∗ f . We converted the dietary fiber variable, d f= (d f /100)∗Carbs.
This approach has used some nutrition books and nutrition experts [61–64] to arrangethe nutritional table features used in this approach. The result of this arrangement was(protein, then good fats, then dietary fiber, then salt, then sugars, then carbohydrates, thensaturated fat, and finally fat). In our research, an additional weight value was added to eachnutrition table feature to help us arrange the product alternative.
Let~h be a sort of nutrition table features list with weight value of each nutrition tablefeature. Each element contains a vector~hi. Likewise, ~hi = (pni ∗ 100 + g fi ∗ 200 + d fi ∗300+ sai ∗ 400+ si ∗ 500+Carbsi ∗ 600+ s fi ∗ 700+ fi ∗ 800). It stores protein (pn) , good fats
Sensors 2021, 21, 3747 22 of 30
(g f ), dietary fiber (d f ), salt (sa), sugars (s), carbohydrates (Carbs), saturated fat (s f ), and fat( f ) nutrition features about the products.
Let ~Nt be a |Z|-dimensional vector. Here, ~Nt = (~h1, . . . ,~h|Z|) where Nti = (~hi). Letdh(qi, qj), this denotes the following similarity measure according to their nutrition table ofthe product qi with respect to the product qj Equation (19), the similarity calculated basedon the output of PRO-COM Equation (18).
dh(qi, qj) = Ntqj /dm(p, qi). (19)
The product being unavailable, the alternative product pa|h is selected according tothat measure. The less value in the alternative product becomes a healthy product forthe user:
pa|h = pai |h / dh(p, pai |h) = min∀qi∈~pa |b
p 6=qi
{dh(p, qi).} (20)
If there is more than one pa|h value, a uh-dimensional vector ~pa|h = (pa1 |h, . . . , pauh|h)
is created being uh the number of alternatives.
6.6. RS-NN: Package-Based Approach
The package-based (PK-BD) approach is considered to include all the approachestogether as it depends on the PRO-COM and HTH-BD approaches. The algorithm wasdeveloped based on the result of the HTH-BD approach. First, products that do not containvalues for the three variables, which are product size, units of measure and servings, are re-moved, and these are the variables on which this approach depends. Second, as mentionedabove, the product p and alternative products pa must be within a variety Z, and withina brand attribute Ba, so the quantity of products within the varieties is analyzed so thatthe varieties containing less than the first quarter value are removed from the number ofproducts within each Z and its value is 4. Therefore, in the PK-BD approach as shownin Table 16, the minimum product per variety is four products, and maximum of the prod-uct per variety is 203 products and the median number of products is 13, and the averagebecomes 24.3 products. The algorithm is based on arranging alternative products pa basedon the servings Sg value of the product p. Let ~Sg be the vector that contains the servingsof the products in Z (|Z|-dimensional vector). Hence, ~Sg = (Sg1, . . . , Sg|Z|). The valueof servings Sg in the product qi is compared to the alternative product qj , and there aretwo possibilities: namely that the product qi has servings Sg value greater than the servingsSg value of the alternative product qj, or vice versa. Let dsei = dse(qi, qj). This denotesthe following similarity measure of the product qi with respect to the product as shownin Equation (21).
dse(qi, qj) =
{(Sg[qi ] / Sg[qj ]) / dh(qi ,qj) , if Sg[qj ] > Sg[qi ]
(Sg[qj ] / Sg[qi ]) / dh(qi ,qj) , if Sg[qj ] ≤ Sg[qi ].(21)
The distance is additionally applied to the products in order to select the alternativeproduct pa as shown in Equation (22). When there is output more than one alternativeproduct pa|s value, a j-dimensional vector ~pa|s = (pa1 |s, . . . , paj |s) is created being j thenumber of alternatives.
pa|s = pai |s / dse(p, pai |s) = max∀qi∈~pa |h
p 6=qi
{dse(p, qi).} (22)
The arrangement of alternative products pa|s is based on the closest similarity ratioto the product p, taking into account the value of servings Se, which is greater or less inproportion to the value of the servings Se of the product p.
Sensors 2021, 21, 3747 23 of 30
7. Experimental Evaluation
In order to evaluate the effectiveness and performance of our recommender system,which is exclusively based on the product characteristics, we have used the followinghardware and software equipment. We have selected the Python language to implementthe different recommender system approaches. Our system uses the Window 10 operat-ing system and hardware with the following specifications: Intel(R) Core(TM) i7-5500U,CPU (2.4 GHz), RAM (16 GB) and Storage (1 TB). The response time is very fast, takingapproximately 4 s to recommend alternative products of each desired product. In order toperform these tests, we randomly selected the products from MDD-DS for each approach.The alternative products given by the different RS approaches are displayed and stored ina report for the users and experts to check the results. Finally, and in order to deployed thesurvey, we have decided to conduct a web survey using Python [65] and Django [66,67] onAmazon Elastic Compute Cloud (Amazon EC2), with the following specifications: vCPU(8), Memory (32 GiB), Network Burst Bandwidth (Up to 5 Gbps).
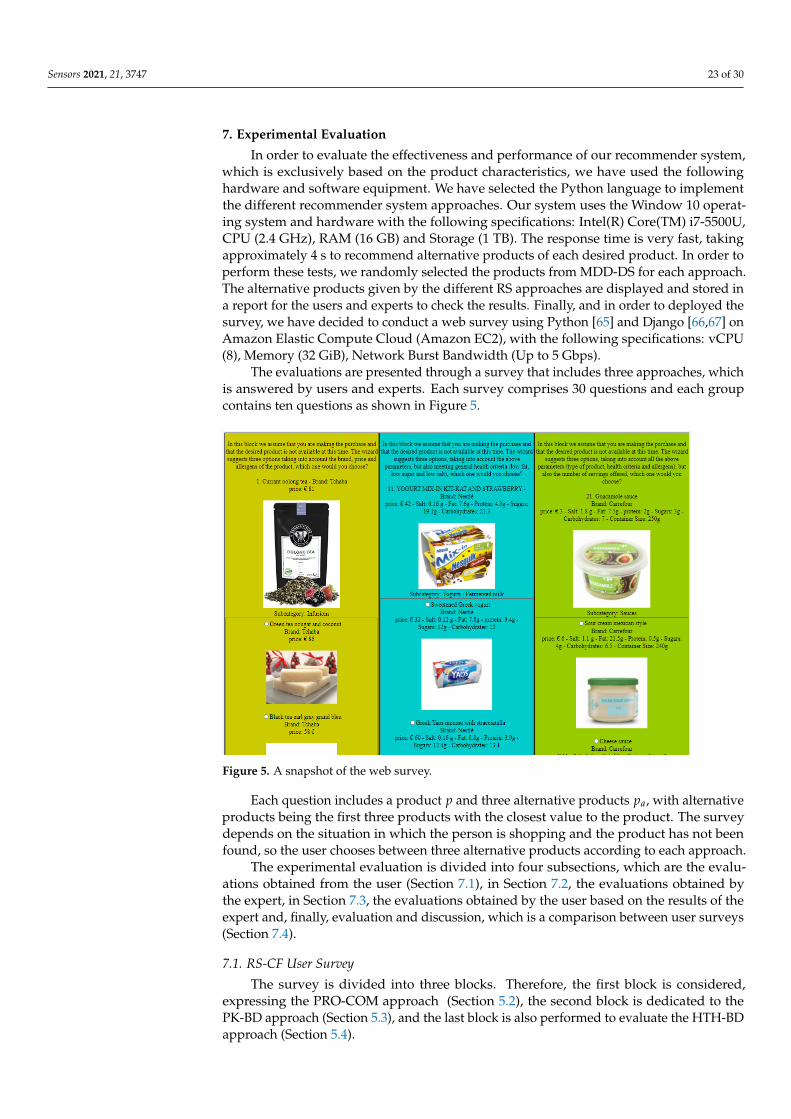
The evaluations are presented through a survey that includes three approaches, whichis answered by users and experts. Each survey comprises 30 questions and each groupcontains ten questions as shown in Figure 5.
Figure 5. A snapshot of the web survey.
Each question includes a product p and three alternative products pa, with alternativeproducts being the first three products with the closest value to the product. The surveydepends on the situation in which the person is shopping and the product has not beenfound, so the user chooses between three alternative products according to each approach.
The experimental evaluation is divided into four subsections, which are the evalu-ations obtained from the user (Section 7.1), in Section 7.2, the evaluations obtained bythe expert, in Section 7.3, the evaluations obtained by the user based on the results of theexpert and, finally, evaluation and discussion, which is a comparison between user surveys(Section 7.4).
7.1. RS-CF User Survey
The survey is divided into three blocks. Therefore, the first block is considered,expressing the PRO-COM approach (Section 5.2), the second block is dedicated to thePK-BD approach (Section 5.3), and the last block is also performed to evaluate the HTH-BDapproach (Section 5.4).
Sensors 2021, 21, 3747 24 of 30
Survey results were calculated using mean squared error (MSE) after 65 people hadresponsed. That said, once the products are sorted, there may be more than one substitute.Therefore, a link may occur between the highest-rated products recommended in the ordergiven by the various approaches of the RS, so that the MSE [68] has been calculated foreach approach taking into account the following three groups:
• Group 1: All the questions answered by the users are considered.• Group 2: The questions having untied answers and the questions in which just the
top-2 choices are tied are considered.• Group 3: Only questions with untied answers are considered.
The formula used to calculate the MSE is the following:
MSE =1n
n
∑i=1
(Yi −Yi)2, (23)
where the value Yi is the value of the answer chosen by the user and Yi is the top-1 product,always having a value of 1. The value of Yi would be (1; 0.5; 0) if the user chose the first,second or third product of the survey, respectively. The values would be (1; 1; 0.5) if thereis a tie between the top-2 products and it would be (1; 1; 1) if the tie happened between allthe products. The results are shown in Table 20, taking into account the three groups.
Table 20. The MSE considering the three approaches as well as the different groups of products tested.
Approaches Group 1 Group 2 Group 3
PRO-COM 0.13885 0.21539 0.26187PK-BD 0.22423 0.25304 0.26695
HTH-BD 0.33731 0.36002 0.36002
Accuracy (ACC) was also calculated for the result (only for Group 3) as shownin Equation (24).
ACC =∑n
i=1((xi = 1) ∨ (xi = 2))n
, (24)
where the value n is the number of questions in group 3 and xi is the answer chosen by theuser of group 3. It includes the answers in which the choice of the first or second productwill be declared as positive while the third product will be declared negative. The result isshown in Table 21.
Table 21. The accuracy considering the group 3.
Approaches Group 3
PRO-COM 81.33%PK-BD 79.28%
HTH-BD 70.77%
7.2. RS-NN Expert Survey
The company provided experts to evaluate the three approaches in the recommenda-tion system, and expert opinions are important in evaluating the recommendation systemfor several reasons, the most important of which is that the experts know the productsand also know the alternative products, so they can easily give their opinion whether therecommendation system recommends suitable alternative products or not. Four surveys ofeach approach were sent to the experts; the surveys are the result of the techniques used(Cosine, Jaccard, Euclidean and Manhattan similarity) and those mentioned in Section 6.3.In each survey, the expert must answer three questions, namely: (1) Would you selectany of these 3 options (alternative products)? (Yes/no); (2) If yes, select which one? (for
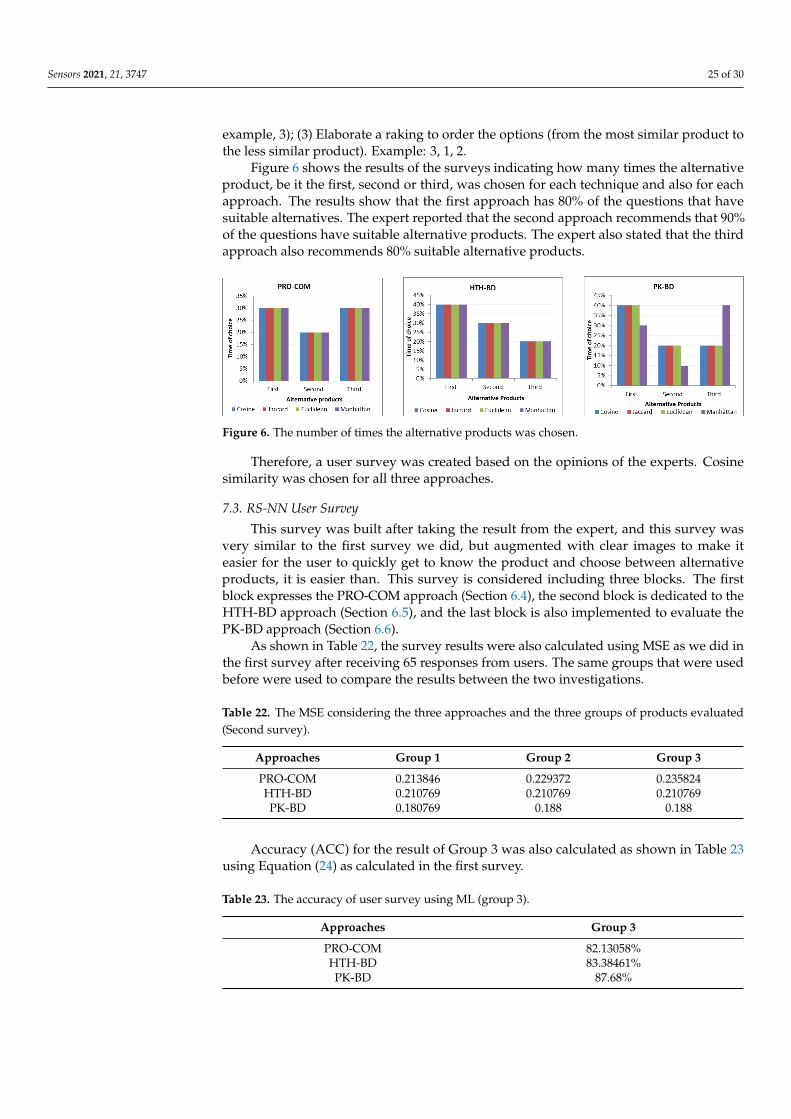
Sensors 2021, 21, 3747 25 of 30
example, 3); (3) Elaborate a raking to order the options (from the most similar product tothe less similar product). Example: 3, 1, 2.
Figure 6 shows the results of the surveys indicating how many times the alternativeproduct, be it the first, second or third, was chosen for each technique and also for eachapproach. The results show that the first approach has 80% of the questions that havesuitable alternatives. The expert reported that the second approach recommends that 90%of the questions have suitable alternative products. The expert also stated that the thirdapproach also recommends 80% suitable alternative products.
Figure 6. The number of times the alternative products was chosen.
Therefore, a user survey was created based on the opinions of the experts. Cosinesimilarity was chosen for all three approaches.
7.3. RS-NN User Survey
This survey was built after taking the result from the expert, and this survey wasvery similar to the first survey we did, but augmented with clear images to make iteasier for the user to quickly get to know the product and choose between alternativeproducts, it is easier than. This survey is considered including three blocks. The firstblock expresses the PRO-COM approach (Section 6.4), the second block is dedicated to theHTH-BD approach (Section 6.5), and the last block is also implemented to evaluate thePK-BD approach (Section 6.6).
As shown in Table 22, the survey results were also calculated using MSE as we did inthe first survey after receiving 65 responses from users. The same groups that were usedbefore were used to compare the results between the two investigations.
Table 22. The MSE considering the three approaches and the three groups of products evaluated(Second survey).
Approaches Group 1 Group 2 Group 3
PRO-COM 0.213846 0.229372 0.235824HTH-BD 0.210769 0.210769 0.210769PK-BD 0.180769 0.188 0.188
Accuracy (ACC) for the result of Group 3 was also calculated as shown in Table 23using Equation (24) as calculated in the first survey.
Table 23. The accuracy of user survey using ML (group 3).
Approaches Group 3
PRO-COM 82.13058%HTH-BD 83.38461%PK-BD 87.68%

Sensors 2021, 21, 3747 26 of 30
7.4. Evaluation and Discussion
Performing offline experiments by using a pre-collected data set to let users chooseor rate items is the usual way to estimate the performance of recommender systems, suchas prediction accuracy [69]. In this case, the dataset is usually divided into (i) a trainingsample to build the model based on the user rating and (ii) a test sample to calculatethe measurement parameters such as accuracy, precision, recall and f-score. Since ourrecommender system is uniquely based on the characteristics of the products and we arenot considering the customer profile, this kind of offline experiment is not provided forour evaluation purposes.
However, we have decided to opt by a most direct evaluation based on the feedbackfrom two important sectors: customers (users) and experts (workers in the food retailsector). For this, we created a large-scale experiment on a prototype through a usersurvey, that is, an online experiment. The results is the direct feedback and opinion of theperformance of the recommender system according to the users’ perspective. Consequently,the feedback obtained would depend on a variety of factors, such as the user’s intent (forexample: how specific their information needs are), the user’s context (for example: whatitems are they already familiar with, in addition, how much they trust the system) andthe interface through which the recommendations are presented. This is a more realisticscenario and it will provide strong evidence about the recommender system’s results: thatis, if the suggested product is one the user would buy instead of the required one or not,obtaining, therefore, a good value for the accuracy.
Since we do not have information about the customers (profiling, interactions etc.),we have worked on all the data without dividing the data set. In order to save time andoptimize operational performance when recommending alternative products, we tookthe following steps. We filtered and pre-processed the data set with two methods (BOW,Doc2Vec) for each approach based on the desired product characteristics, such as variety,size, allergen, and so forth. In RS-CF, we compared the desired product with the rest ofthe data and ordered the alternative based on the similarity ratio. In RS-NN, we built themodel for the desired product using the neural network and then classified the alternativebased on the similarity ratio.
Surveys evaluated the recommendation system, which is the RS-CF user survey andRS-NN user survey, where a comparison was made between them, as shown in Figure 7,which shows the difference between the accuracy results of the two surveys consideringgroup 3. The results showed that the RS-NN user survey performed better in all threeapproaches. Figure 8 shows the difference between the MSE results, as it showed that theRS-CF user survey results are the best for the PRO-COM approach for the first and secondgroups, but the RS-NN user survey is the best for the third group. The RS-NN user surveyis the best for both approaches: PK-BD and HTH-BD. The comparatives prove that usingthe neural network completely alters the results, and taking price and brand into accountwas something that users wanted. Using more nutrition table features gives better results.It also proved that a PK-BD approach based on the HTH-BD approach is far better thanrelying solely on a PRO-COM approach.
Finally, we evaluated the multi-criteria RS through a user survey using MSE to cal-culate the average error for the responses of the users of three groups, which is the mainevaluation of the users’ responses. We also use accuracy to evaluate the responses ofusers in group 3 only, because for the other two groups it resulted in approximately100% accuracy.
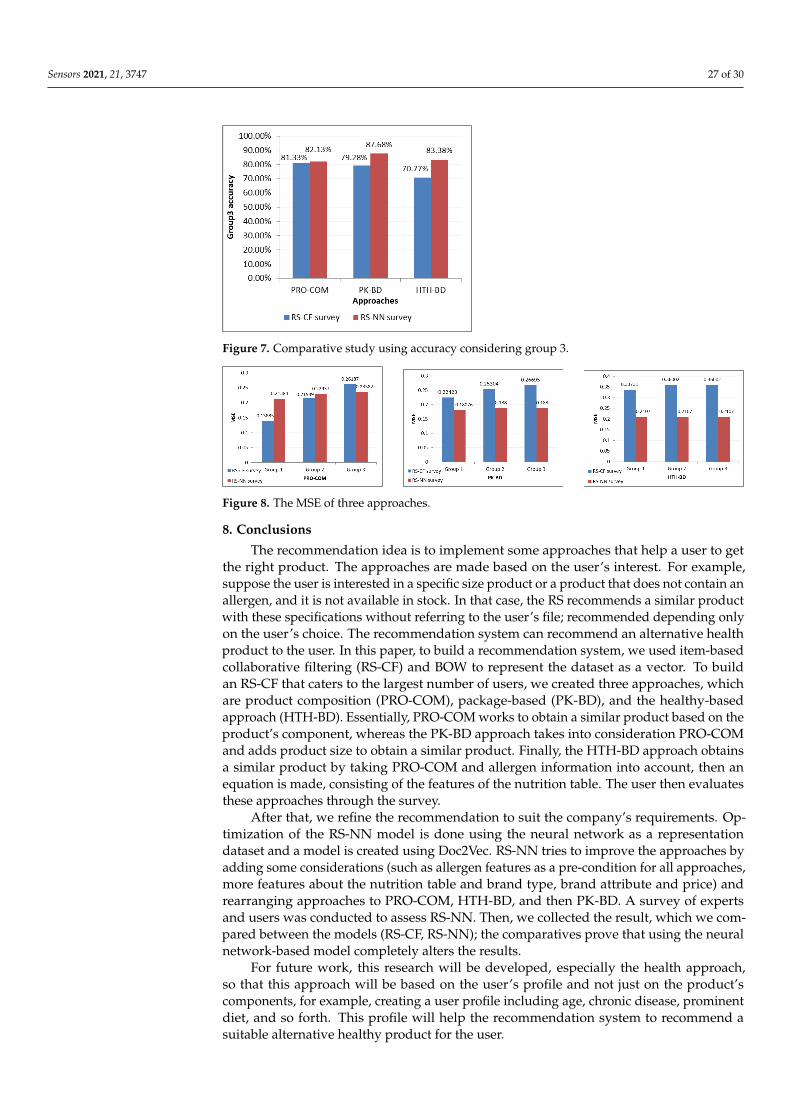
Sensors 2021, 21, 3747 27 of 30
Figure 7. Comparative study using accuracy considering group 3.
Figure 8. The MSE of three approaches.
8. Conclusions
The recommendation idea is to implement some approaches that help a user to getthe right product. The approaches are made based on the user’s interest. For example,suppose the user is interested in a specific size product or a product that does not contain anallergen, and it is not available in stock. In that case, the RS recommends a similar productwith these specifications without referring to the user’s file; recommended depending onlyon the user’s choice. The recommendation system can recommend an alternative healthproduct to the user. In this paper, to build a recommendation system, we used item-basedcollaborative filtering (RS-CF) and BOW to represent the dataset as a vector. To buildan RS-CF that caters to the largest number of users, we created three approaches, whichare product composition (PRO-COM), package-based (PK-BD), and the healthy-basedapproach (HTH-BD). Essentially, PRO-COM works to obtain a similar product based on theproduct’s component, whereas the PK-BD approach takes into consideration PRO-COMand adds product size to obtain a similar product. Finally, the HTH-BD approach obtainsa similar product by taking PRO-COM and allergen information into account, then anequation is made, consisting of the features of the nutrition table. The user then evaluatesthese approaches through the survey.
After that, we refine the recommendation to suit the company’s requirements. Op-timization of the RS-NN model is done using the neural network as a representationdataset and a model is created using Doc2Vec. RS-NN tries to improve the approaches byadding some considerations (such as allergen features as a pre-condition for all approaches,more features about the nutrition table and brand type, brand attribute and price) andrearranging approaches to PRO-COM, HTH-BD, and then PK-BD. A survey of expertsand users was conducted to assess RS-NN. Then, we collected the result, which we com-pared between the models (RS-CF, RS-NN); the comparatives prove that using the neuralnetwork-based model completely alters the results.
For future work, this research will be developed, especially the health approach,so that this approach will be based on the user’s profile and not just on the product’scomponents, for example, creating a user profile including age, chronic disease, prominentdiet, and so forth. This profile will help the recommendation system to recommend asuitable alternative healthy product for the user.
Sensors 2021, 21, 3747 28 of 30
Author Contributions: Conceptualization, M.M.H., R.P.D.R., A.F.V. and H.O.P.; Data curation,M.M.H. and H.O.P.; Formal analysis, M.M.H., R.P.D.R., A.F.V. and H.O.P.; Funding acquisition,R.P.D.R. and A.F.V.; Investigation, Manar Hafez, R.P.D.R., A.F.V. and H.O.P.; Methodology, M.M.H.,R.P.D.R., A.F.V. and H.O.P.; Resources, R.P.D.R. and A.F.V.; Software, M.M.H. and H.O.P.; Supervision,R.P.D.R. and A.F.V.; Validation, M.M.H. and H.O.P.; Visualization, M.M.H.; Writing—original draft,M.M.H., R.P.D.R. and A.F.V.; Writing—review & editing, M.M.H., R.P.D.R. and A.F.V. All authorshave read and agreed to the published version of the manuscript.
Funding: This work has received financial support from the European Regional Development Fund(ERDF) and the Galician Regional 7 Government, under the agreement for funding the Atlantic ResearchCenter for Information and Communication Technologies (atlanTTIC), and the Spanish Ministry ofEconomy and Competitiveness, under the National Science Program (TEC2017-84197-C4-2-R).
Institutional Review Board Statement: Not applicable.
Informed Consent Statement: Not applicable.
Data Availability Statement: Not applicable.
Acknowledgments: The authors would like to thank the European Regional Development Fund (ERDF)and the Galician Regional 7 Government, under the agreement for funding the Atlantic Research Centerfor Information and Communication Technologies (atlanTTIC), and the Spanish Ministry of Economyand Competitiveness, under the National Science Program (TEC2017-84197-C4-2-R).
Conflicts of Interest: The authors declare no conflict of interest.
References1. Reinartz, W.; Wiegand, N.; Imschloss, M. The impact of digital transformation on the retailing value chain. Int. J. Res. Mark. 2019,
36. [CrossRef]2. Wessel, L.; Baiyere, A.; Ologeanu-Taddei, R.; Cha, J.; Blegind Jensen, T. Unpacking the Difference between Digital Transformation
and IT-enabled Organizational Transformation. J. Assoc. Inf. Syst. 2020, 22, 102–129.3. Linden, G.; Smith, B.; York, J. Amazon. com recommendations: Item-to-item collaborative filtering. IEEE Internet Comput. 2003,
7, 76–80. [CrossRef]4. Thorat, P.B.; Goudar, R.; Barve, S. Survey on collaborative filtering, content-based filtering and hybrid recommendation system.
Int. J. Comput. Appl. 2015, 110, 31–36.5. Grbovic, M.; Radosavljevic, V.; Djuric, N.; Bhamidipati, N.; Savla, J.; Bhagwan, V.; Sharp, D. E-commerce in your inbox: Product
recommendations at scale. In Proceedings of the 21th ACM SIGKDD International Conference on Knowledge Discovery andData Mining, Sydney, Australia, 10–13 August 2015; pp. 1809–1818.
6. Shen, J.; Zhou, T.; Chen, L. Collaborative filtering-based recommendation system for big data. Int. J. Comput. Sci. Eng. 2020,21, 219–225. [CrossRef]
7. Bennett, J.; Lanning, S. The netflix prize. In Proceedings of the KDD Cup and Workshop, New York, NY, USA, 12 August 2007;Volume 2007, p. 35.
8. Das, A.S.; Datar, M.; Garg, A.; Rajaram, S. Google news personalization: Scalable online collaborative filtering. In Proceedings ofthe 16th International Conference on World Wide Web, Banff, AB, Canada, 8–12 May 2007; pp. 271–280.
9. Kumar, P.S. Recommendation System for E-Commerce by Memory Based and Model Based Collaborative Filtering. In Proceedingsof the 11th International Conference on Soft Computing and Pattern Recognition (SoCPaR 2019); Springer: Berlin/Heidelberg, Germany,2020; Volume 1182, p. 123.
10. Zhang, Y.; Yang, C.; Niu, Z. A research of job recommendation system based on collaborative filtering. In Proceedings of the2014 Seventh International Symposium on Computational Intelligence and Design, Hangzhou, China, 13–14 December 2014;Volume 1, pp. 533–538.
11. Pirasteh, P.; Jung, J.J.; Hwang, D. Item-based collaborative filtering with attribute correlation: A case study on movie recommen-dation. In Proceedings of the Asian Conference on Intelligent Information and Database Systems; Springer: Berlin/Heidelberg, Germany,2014; pp. 245–252.
12. Bag, S.; Kumar, S.K.; Tiwari, M.K. An efficient recommendation generation using relevant Jaccard similarity. Inf. Sci. 2019,483, 53–64. [CrossRef]
13. Van Meteren, R.; Van Someren, M. Using content-based filtering for recommendation. In Proceedings of the Machine Learning inthe New Information Age: MLnet/ECML2000 Workshop, MLNIA, Barcelona, Spain, 30 May 2000; Volume 30, pp. 47–56.
14. Lops, P.; De Gemmis, M.; Semeraro, G. Content-based recommender systems: State of the art and trends. In Recommender SystemsHandbook; Springer: Berlin/Heidelberg, Germany, 2011; pp. 73–105.
15. Saravanan, S. Design of large-scale Content-based recommender system using hadoop MapReduce framework. In Proceedingsof the 2015 Eighth International Conference on Contemporary Computing (IC3), Noida, India, 20–22 August 2015; pp. 302–307.

Sensors 2021, 21, 3747 29 of 30
16. Schafer, J.B.; Frankowski, D.; Herlocker, J.; Sen, S. Collaborative filtering recommender systems. In The Adaptive Web; Springer:Berlin/Heidelberg, Germany, 2007; pp. 291–324.
17. Elahi, M.; Ricci, F.; Rubens, N. A survey of active learning in collaborative filtering recommender systems. Comput. Sci. Rev. 2016,20, 29–50. [CrossRef]
18. Yu, K.; Schwaighofer, A.; Tresp, V.; Xu, X.; Kriegel, H.P. Probabilistic memory-based collaborative filtering. IEEE Trans. Knowl.Data Eng. 2004, 16, 56–69.
19. Koohi, H.; Kiani, K. User based Collaborative Filtering using fuzzy C-means. Measurement 2016, 91, 134–139. [CrossRef]20. Sarwar, B.; Karypis, G.; Konstan, J.; Riedl, J. Item-based collaborative filtering recommendation algorithms. In Proceedings of the
10th International Conference on World Wide Web, Hong Kong, China, 1–5 May 2001; pp. 285–295.21. Gao, M.; Wu, Z.; Jiang, F. Userrank for item-based collaborative filtering recommendation. Inf. Process. Lett. 2011, 111, 440–446.
[CrossRef]22. Wei, J.; He, J.; Chen, K.; Zhou, Y.; Tang, Z. Collaborative filtering and deep learning based recommendation system for cold start
items. Expert Syst. Appl. 2017, 69, 29–39. [CrossRef]23. Alaa, R.; Gawich, M.; Fernández-Veiga, M. Personalized Recommendation for Online Retail Applications Based on Ontology
Evolution. In Proceedings of the 2020 6th International Conference on Computer and Technology Applications, Antalya, Turkey,14–16 April 2020; pp. 12–16.
24. Smith, B.; Linden, G. Two decades of recommender systems at Amazon. com. IEEE Internet Comput. 2017, 21, 12–18. [CrossRef]25. Esparza, S.G.; O’Mahony, M.P.; Smyth, B. Mining the real-time web: A novel approach to product recommendation. Knowl. Based
Syst. 2012, 29, 3–11. [CrossRef]26. Jin, Y.; Hu, M.; Singh, H.; Rule, D.; Berlyant, M.; Xie, Z. MySpace video recommendation with map-reduce on qizmt. In Proceed-
ings of the 2010 IEEE Fourth International Conference on Semantic Computing, Pittsburgh, PA, USA, 22–24 September 2010; pp.126–133.
27. Wilkinson, B.W.; McHale, B.G.; Mattingly, T.D. Systems and Methods for Providing Content-Based Product Recommendations.U.S. Patent 10,614,504, 7 April 2020.
28. Singh, M.K.; Rishi, O.P. Event driven Recommendation System for E-commerce using Knowledge based Collaborative FilteringTechnique. Scalable Comput. Pract. Exp. 2020, 21, 369–378. [CrossRef]
29. Xu, Y.; Ren, J.; Zhang, Y.; Zhang, C.; Shen, B.; Zhang, Y. Blockchain empowered arbitrable data auditing scheme for networkstorage as a service. IEEE Trans. Serv. Comput. 2019, 13, 289–300. [CrossRef]
30. Zhao, Z.D.; Shang, M.S. User-based collaborative-filtering recommendation algorithms on hadoop. In Proceedings of the 2010Third International Conference on Knowledge Discovery and Data Mining, Phuket, Thailand, 9–10 January 2010; pp. 478–481.
31. Meng, S.; Dou, W.; Zhang, X.; Chen, J. KASR: A keyword-aware service recommendation method on mapreduce for big dataapplications. IEEE Trans. Parallel Distrib. Syst. 2014, 25, 3221–3231. [CrossRef]
32. Wang, T.; Fu, Y. Item-based Collaborative Filtering with BERT. In Proceedings of the 3rd Workshop on e-Commerce and NLP,Seattle, WA, USA, 10 July 2020; pp. 54–58.
33. Devlin, J.; Chang, M.W.; Lee, K.; Toutanova, K. Bert: Pre-training of deep bidirectional transformers for language understanding.arXiv 2018, arXiv:1810.04805.
34. Ferreira, D.; Silva, S.; Abelha, A.; Machado, J. Recommendation system using autoencoders. Appl. Sci. 2020, 10, 5510. [CrossRef]35. Olbrich, R.; Holsing, C. Modeling consumer purchasing behavior in social shopping communities with clickstream data. Int. J.
Electron. Commer. 2011, 16, 15–40. [CrossRef]36. Qiu, J.; Lin, Z.; Li, Y. Predicting customer purchase behavior in the e-commerce context. Electron. Commer. Res. 2015, 15, 427–452.
[CrossRef]37. Zhang, Y.; Jin, R.; Zhou, Z.H. Understanding bag-of-words model: A statistical framework. Int. J. Mach. Learn. Cybern. 2010,
1, 43–52. [CrossRef]38. Jiang, H.; Yang, D.; Xiao, Y.; Wang, W. Understanding a bag of words by conceptual labeling with prior weights. World Wide Web
2020, 23, 2429–2447. [CrossRef]39. Chowdhury, G.G. Natural language processing. Annu. Rev. Inf. Sci. Technol. 2003, 37, 51–89. [CrossRef]40. Baeza-Yates, R.; Ribeiro-Neto, B. Modern Information Retrieval; ACM Press: New York, NY, USA, 1999.41. Husain, M.S. Critical Concepts and Techniques for Information Retrieval System. In Natural Language Processing in Artificial
Intelligence; Apple Academic Press: New York, NY, USA, 2020; pp. 29–51.42. Lai, S.; Liu, K.; He, S.; Zhao, J. How to generate a good word embedding. IEEE Intell. Syst. 2016, 31, 5–14. [CrossRef]43. Li, Y.; Yang, T. Word embedding for understanding natural language: A survey. In Guide to Big Data Applications; Springer:
Berlin/Heidelberg, Germany, 2018; pp. 83–104.44. Hira, Z.M.; Gillies, D.F. A review of feature selection and feature extraction methods applied on microarray data. Adv. Bioinform.
2015, 2015. [CrossRef]45. Wang, Z.; Ma, L.; Zhang, Y. A hybrid document feature extraction method using latent Dirichlet allocation and word2vec.
In Proceedings of the 2016 IEEE first international conference on data science in cyberspace (DSC), Changsha, China, 13–16 June2016; pp. 98–103.
46. Yin, Z.; Shen, Y. On the dimensionality of word embedding. arXiv 2018, arXiv:1812.04224.

Sensors 2021, 21, 3747 30 of 30
47. Xing, C.; Wang, D.; Liu, C.; Lin, Y. Normalized word embedding and orthogonal transform for bilingual word translation.In Proceedings of the 2015 Conference of the North American Chapter of the Association for Computational Linguistics: HumanLanguage Technologies, Denver, CO, USA, 31 May–5 June 2015; pp. 1006–1011.
48. Ghannay, S.; Favre, B.; Esteve, Y.; Camelin, N. Word embedding evaluation and combination. In Proceedings of the TenthInternational Conference on Language Resources and Evaluation (LREC’16), Portoroz, Slovenia, 23–28 May 2016; pp. 300–305.
49. Mikolov, T.; Chen, K.; Corrado, G.; Dean, J. Efficient estimation of word representations in vector space. arXiv 2013,arXiv:1301.3781.
50. Wang, Q.; Xu, J.; Chen, H.; He, B. Two improved continuous bag-of-word models. In Proceedings of the 2017 International JointConference on Neural Networks (IJCNN), Anchorage, AK, USA, 14–19 May 2017; pp. 2851–2856.
51. Guthrie, D.; Allison, B.; Liu, W.; Guthrie, L.; Wilks, Y. A closer look at skip-gram modelling. In Proceedings of the LREC, Genoa,Italy, 22–28 May 2006; Volume 6, pp. 1222–1225.
52. Lazaridou, A.; Pham, N.T.; Baroni, M. Combining language and vision with a multimodal skip-gram model. arXiv 2015,arXiv:1501.02598.
53. Le, Q.; Mikolov, T. Distributed representations of sentences and documents. In Proceedings of the International Conference onMachine Learning, Beijing, China, 21–26 June 2014; pp. 1188–1196.
54. Hafez, M.M.; Redondo, R.P.D.; Vilas, A.F. A Comparative Performance Study of Naïve and Ensemble Algorithms for E-commerce.In Proceedings of the 2018 14th International Computer Engineering Conference (ICENCO), Cairo, Egypt, 29–30 December 2018;pp. 26–31.
55. Hafez, M.M.; Fernández Vilas, A.; Redondo, R.P.D.; Pazó, H.O. Classification of Retail Products: From Probabilistic Ranking toNeural Networks. Appl. Sci. 2021, 11, 4117. [CrossRef]
56. Commission, E. General Food Law. 2002. Available online: https://ec.europa.eu/food/safety/general_food_law_en (accessedon 20 March 2019).
57. Karvelis, P.; Gavrilis, D.; Georgoulas, G.; Stylios, C. Topic recommendation using Doc2Vec. In Proceedings of the 2018International Joint Conference on Neural Networks (IJCNN), Rio de Janeiro, Brazil, 8–13 July 2018, pp. 1–6.
58. Kim, D.; Seo, D.; Cho, S.; Kang, P. Multi-co-training for document classification using various document representations: TF–IDF,LDA, and Doc2Vec. Inf. Sci. 2019, 477, 15–29. [CrossRef]
59. Johnson, L. How to Calculate Percentages Into Grams. Updated on 6 November 2020. Available online: https://sciencing.com/calculate-percentages-grams-6942118.html (accessed on 25 November 2020 ).
60. Smith, C.C.; Follmer, D. Food preferences of squirrels. Ecology 1972, 53, 82–91. [CrossRef]61. Flynn, M.A.; Surprenant, T.; Craig, C.M.; Bergstrom, A. Is it good for me? A content analysis of the healthiness of foods advertised
in magazines. Atl. J. Commun. 2020, 1–15. [CrossRef]62. Egnell, M.; Talati, Z.; Galan, P.; Andreeva, V.; Vandevijvere, S.; Gombaud, M.; Dréano-Trécant, L.; Hercberg, S.; Pettigrew, S.; Julia,
C. Objective understanding of the front-of-pack nutrition label Nutri-Score by European consumers. Eur. J. Public Health 2020,30, ckaa165–902. [CrossRef]
63. Dréano-Trécant, L.; Egnell, M.; Hercberg, S.; Galan, P.; Soudon, J.; Fialon, M.; Touvier, M.; Kesse-Guyot, E.; Julia, C. Performanceof the Front-of-Pack Nutrition Label Nutri-Score to Discriminate the Nutritional Quality of Foods Products: A ComparativeStudy across 8 European Countries. Nutrients 2020, 12, 1303. [CrossRef]
64. Jamieson, J.A.; Neufeld, A. Food sources of energy and nutrients among Canadian adults following a gluten-free diet. PeerJ 2020,8, e9590. [CrossRef]
65. Swamynathan, M. Mastering Machine Learning with Python in Six Steps: A Practical Implementation Guide to Predictive Data AnalyticsUsing Python; Apress: New York, NY, USA, 2019.
66. Doan, D. A Developer’s Survey on Different Cloud Platforms. Ph.D. Thesis, University of California San Diego, San Diego, CA,USA, 2009.
67. Stigler, S.; Burdack, M. A practical approach of different programming techniques to implement a real-time application usingDjango. Athens J. Sci. 2020, 7, 43–66. [CrossRef]
68. Torabi, M.; Rao, J.N. Mean squared error estimators of small area means using survey weights. Can. J. Stat. 2010, 38, 598–608.[CrossRef]
69. Shani, G.; Gunawardana, A. Evaluating recommendation systems. In Recommender Systems Handbook; Springer: Berlin/Heidelberg,Germany, 2011; pp. 257–297.