Embed Size (px)
Citation preview
Abstract—Identification and exploitation of the new energy
sources is on the plane of all states wishing to provide security.
Energy activities have gained momentum lately, and at the
European Union level there is a constant concern in finding new
energy solutions that ensure the well-being of the continent. A
sector that is increasing in the recent years is the offshore area,
where, along with the steps made in substantial research, many
economic activities become possible. In this paper we propose to
realize a multi-criterial analysis by determining the
affordability of a threshold, which we've called ' supportability
factor ", an element that can make the difference if an activity is
viable or cannot be made. The supportability factor is a tool
that can be used both by the planners, decision makers and
other stakeholders, and can be used in the analysis of the
sustainability of a project in the costal and marine area.
Index Terms—Black Sea, drilling operations, offshore,
platform.
I. INTRODUCTION
Offshore petroleum activities in the area began in Romania
in the 1967-1969 period. Having the stated goal to increase
the production by the diversification potential, Romania has
been targeted, in addition to the onshore production
capabilities, and the Black Sea continental platform. Thus, it
was mounted a first installation in 1975, and the oil
production began in 1987. The platform was installed on the
offshore, in shallow waters, and in 2012 was made the first
discovery of the recoverable reserves, with a cubic capacity
of 42-84 billion. It has thus been demonstrated that Romania
has a significant potential for extracting the natural gas from
the area of the continental shelf of the Black Sea, plus
existing and potential onshore, which makes Romania an
important actor in the field of energy at the European Union
level.
To capitalise the fully energy potential by exploiting the
reserves of the natural gas on the Black Sea, it is necessary to
achieve significant investment. In this respect, Romania has
issued concessions for the exploitation areas towards the
famous actors worldwide exploitation of the natural gas,
which have the capacity and investment management to carry
out this activity. (Fig. 1) [1]. In parallel, Romania modifies
the legal regulations in a consistent and predictable manner
and in accordance with the provisions of the European Union
in this field, considering the environmental requirements.
Manuscript received April 25, 2019; revised May 9, 2019.
The authors are with “Dunărea de Jos” University Galati -Romania, 47
Domnească Street, 800008, Galati, Romania (e-mail: [email protected]).
Fig. 1. Romanian Black Sea perimeters [1].
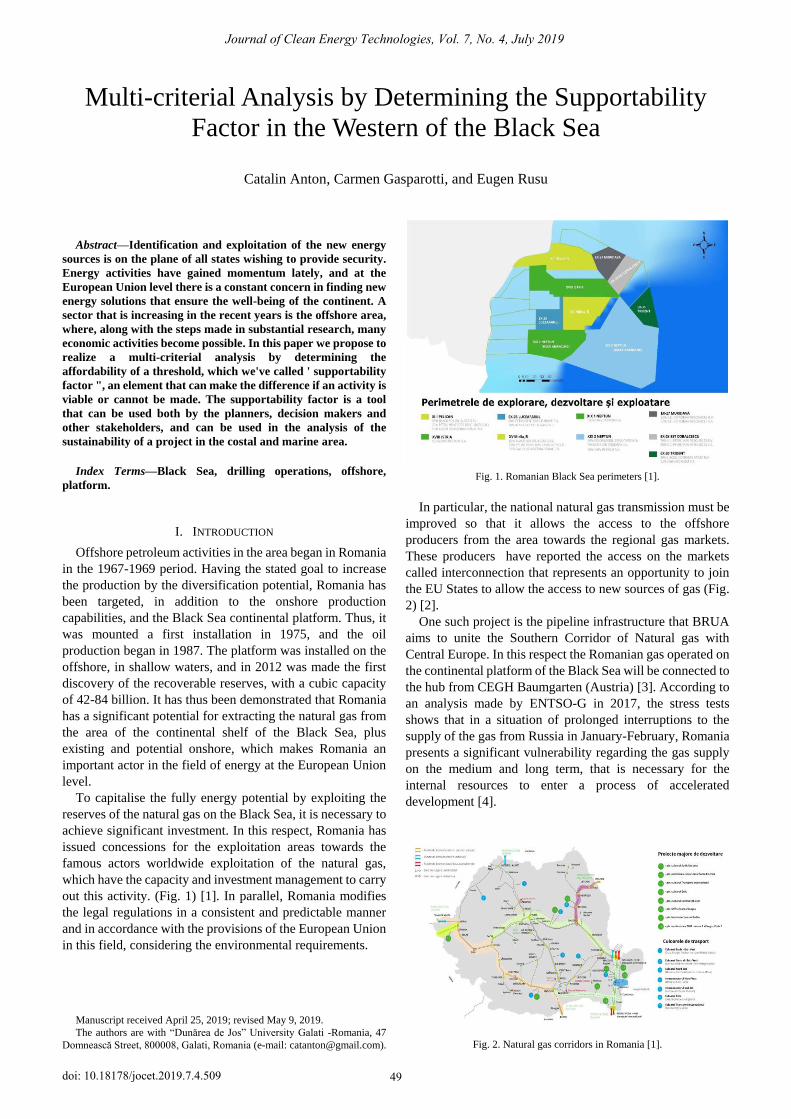
In particular, the national natural gas transmission must be
improved so that it allows the access to the offshore
producers from the area towards the regional gas markets.
These producers have reported the access on the markets
called interconnection that represents an opportunity to join
the EU States to allow the access to new sources of gas (Fig.
2) [2].
One such project is the pipeline infrastructure that BRUA
aims to unite the Southern Corridor of Natural gas with
Central Europe. In this respect the Romanian gas operated on
the continental platform of the Black Sea will be connected to
the hub from CEGH Baumgarten (Austria) [3]. According to
an analysis made by ENTSO-G in 2017, the stress tests
shows that in a situation of prolonged interruptions to the
supply of the gas from Russia in January-February, Romania
presents a significant vulnerability regarding the gas supply
on the medium and long term, that is necessary for the
internal resources to enter a process of accelerated
development [4].
Fig. 2. Natural gas corridors in Romania [1].
Multi-criterial Analysis by Determining the Supportability
Factor in the Western of the Black Sea
Catalin Anton, Carmen Gasparotti, and Eugen Rusu
Journal of Clean Energy Technologies, Vol. 7, No. 4, July 2019
49doi: 10.18178/jocet.2019.7.4.509

II. METHODOLOGY
Multi-Criteria Analysis is a method that is based on the
equity valuation through a weighted average. In this way it
takes into account the comparison of the different actions or
solutions depending on the variety or public policies.
The multi-criteria analysis method can be used to
determine which solution best suits to the decision makers'
expectations. But, in order for this to happen, together with
the decision-makers, a number of indicators and analysis
criteria must be determined. In our example, we analyzed the
indicators from four different areas, namely environmental,
economic, social and governance [5]. Finally, this method
can explain why a particular solution has been chosen.
In this paper we took into consideration the impact of the
planned drilling operations carried out within the block 30
EX TRIDENT by the LUKOIL OVERSEAS. "LUKOIL is
one of the largest oil companies in the world, being a leader
on international markets with a share of 2.1% of oil
production globally. His work includes both oil and gas
production and refining into the petroleum and petrochemical
products. Lukoil Overseas Atash BV. is present in Romania
in 2011, its branch located in Bucharest, the activity of which
is connected with the second concession blocks for
exploration and development in the area of the economic
exploitation-exclusive Black Sea." (according to the study
Report of environmental impact assessment project: "the
EXECUTION of PLANNED GEOLOGICAL DRILLINGS
of HYDROCARBON RESOURCES IN BLOCK 30 EX
TRIDENT OFF the BLACK SEA COAST"[6]).
Trident Ex-30 Block is located in the western part of the
continental shelf of the Black Sea, in the exclusive economic
zone, which legally has the status of "open sea", consisting of
sailing, free surveilling aerial installation, subsea pipeline,
resource harvesting (Fig. 3). Designate the proposed project
lies outside the limits of the (potentially) 0076 ROSPA
protection "Black Sea", and the Danube Delta-Sea (ROSCI
0066), Ex-29 Rhapsody block is situated in the following
distances:
Constanta ----------aprox.170 km
Sevastopol(Ucraina)------aprox.180 km
Sulina --------------aprox.120 km
Kavarna (Bulgaria)---------aprox.226 km The distance between the probes and the location of on the
shore operations-Midia Shipyard is about 192 km
(Daria-probe 1) and towards the point of the intervention for
the emergency situations, namely Tuzla Airfield, the distance
is approx. 197 km (Daria probe 1). Geological drillings
execution will be carried out using a conventional system
mounted on a rotating platform semi-submersible saw
(MODU) called "GSF Development Driller II" (hereinafter
referred to as "DD" GSF), designed and built in 2004, but
entered into the service of drilling in 2005.
On the platform there are storage tanks for ballast, fuel,
water, drilling mud, drilling fluids, and other bottled waters.
The platform is provided with 4 independent rooms of pumps,
containing pumps for seawater ballast, fuel, water for drilling
and one drinking water.
The platform is provided with:-systems of the intervention
in case of emergency-it come to life-saving appliances, fire
detectors, protective equipment, systems of combustible gas
detection and rescue ships. -Systems for the environment
protection-unit wastewater treatment plant, Blowout
Prevention System (BOP), equipment for cleaning and
drainage systems for the hazardous and non-hazardous
waters (in which the rainwater and/or small leakage is
collected in a tank manifold in order to treatment before
discharge into the sea, or transferred to the tanks that are
shipped to shore in order to eliminate the corresponding to an
authorized company) (Fig. 5).
Fig. 3. Block EX-29 Rapsodia [6].
Fig. 4. Platform GSF Development Driller II [6].
Fig. 5. Transversal section of platform [6].
Journal of Clean Energy Technologies, Vol. 7, No. 4, July 2019
50

Considering their production activities carried out they
will be divided in three stages, namely
- Phase of installation the extracting equipment
- Phase operational
- Phase of decommissioning of the equipment.
We also took into consideration the impact of social,
economic and environmental, but also the impact on the
administrative activities of the proposed project. Last but not
least we accomplished a delimitation of the area into three
zones, namely the impact on costal and bathing area,
nearshore and offshore area [7].
- Coastal and bathing area refers to the area of economic
activities physical geographic location, tourist and natural
ecosystems related to the marine environment. In this
sense, in this area belong to protect the natural areas such
as the Danube Delta Biosphere Reserve or Protected area
of the Techirghiol Lake, but also the economic activities or
tourist shipyards from Midia, Constanta or Mangalia, as
well as tourism Mamaia, Eforie-Costinesti or
Olympus-Mangalia, with bathing areas.
- Nearshore zone is the area close to the shoreline to a depth
of 12-15 meters, and includes both the economic activities
and environmental protection.
- Offshore area stretches from 12-15 m isobath where up to
the proposed objective.
Although the operational area of the project lies outside the
boundaries of the human settlements, and at the considerable
distances from the land, it cannot be asserted that there is no
environmental impact of the social environmental and
economic or cultural conditions, ethnic or cultural heritage
from the human settlements on the Black Sea coast[8]. The
work of mining for the natural gas from the offshore area of
the Black Sea can have an impact in terms of the quality of
people's living conditions offered so drilling platform and
support vessels, but also upon the communities in the coastal
area. The noise level during the drilling operations and
equipment on the platform (pumps, motors, etc.) can create
discomfort, as well as the handling and use of chemicals with
toxic properties may be hazardous in the handling and use of
them. Establishing a set of indicators of social, economic and
environmental, but also governance is absolutely necessary
in evaluating this important activity. [9]
In making this assessment we have approached a new
technique that we are trying to develop in the coastal area
technique called "supportability factor". Factor of
supportability threshold that represents the limit of the
moment activities performed can be conducted in the optimal
conditions and when the proposed activities cannot be
implemented.
III. RESULTS
In determining of the supportability factor has been
established as the factor of supportability to have value 1, as
the maximum value for an event, an action or activity can be
accepted. For example, the height of waves that may affect
the structure of the platform irreparably can be 10 meters. In
this case, the supportability of the platform with the waves is
1 that is h = 10 m (Fig. 6). Similar the supportability factor is
established for the other indicators of the economic, social
and environmental issues, considering that in coping with the
values indicated, the work would not be possible.
Fig. 6. The graph of the affordability factor.
Supportability factor analysis results for the various
indicators in the following way to the environmental factors
(Table I), economic factors (Table II), social factors (Table
III) and governance factors (Table IV).
TABLE I: DETERMINATION OF THE SUPPORTABILITY FACTOR BY ANALYSIS OF THE ENVIRONMENTAL INDICATORS
INDICATORS Description
Installation Operational Decommissioning
Coastal
&
bathing
zone
Nearshore Offshore
Coastal
&
bathing
zone
Nearshore Offshore
Coastal
&
bathing
zone
Nearshore Offshore
1. reduces waste,
prevents air, water
and soil pollution
and stimulates
material reuse and
recycles
air 0.3 0.5 0.8 0.4 0.6 1 0.3 0.5 0.8
water 0.2 0.3 0.9 0.3 0.6 1 0.2 0.3 0.9
soil 0.4 0.5 0.8 0.4 0.7 1 0.4 0.5 0.8
waste 0.2 0.3 0.8 0.2 0.3 0.9 0.2 0.3 0.8
2. Flood prevention,
protection and
mitigation
storm,
tornades NA NA 0.6 NA NA 0.9 NA NA 0.6
earthquake NA NA 0.8 NA NA 0.9 NA NA 0.8
3. improves the
status of water
(ecological and
chemical)
water
installation 0.4 0.5 0.9 0.2 0.3 0.7 0.4 0.5 0.9
4. protecte key
natural sites
(including marine
and nature scenic,
cultural, and wild
landscapes)
pollution
plan 0.5 0.5 0.9 0.5 0.5 0.9 0.5 0.5 0.9
emergency
plan against
meteo
phenomena
0.5 0.5 0.9 0.5 0.5 0.9 0.5 0.5 0.9
Journal of Clean Energy Technologies, Vol. 7, No. 4, July 2019
51

5. effects land use
planning and
management,
supports
environmentally
friendly rural
activities
0.5 0.5 0.9 0.5 0.5 0.9 0.5 0.5 0.9
6. affecting natural
habitats, biodiversity
and their quality
0.2 0.2 1.1 0.4 0.4 0.9 0.2 0.2 1.1
7. improves
sustainable
management of
coastal erosion
NA NA 1 NA NA 1 NA NA 1
8. increases the
resilience and
reduces vulnerability
to climate change
impacts
NA NA 1 NA NA 1 NA NA 1
9. increases energy
efficiency NA NA 1 NA NA 1 NA NA 1
10. impact of the use
of low-impact
transport and
supports sustainable
mobility in the
destination
quality and
quantity of
vessel
0.5 0.5 0.9 0.5 0.5 0.9 0.5 0.5 0.9
aircrafts 0.5 0.5 0.9 0.5 0.5 0.9 0.5 0.5 0.9
11. increase
environmental
awareness of the
population
campaign 0.5 0.5 0.9 0.5 0.5 0.9 0.5 0.5 0.9
reports 0.5 0.5 0.9 0.5 0.5 0.9 0.5 0.5 0.9
12. promotes
environmentally-frie
ndly processes and
products
0.5 0.5 0.9 0.5 0.5 0.9 0.5 0.5 0.9
TABLE II: DETERMINATION OF THE SUPPORTABILITY FACTOR BY ANALYSIS OF THE ECONOMIC INDICATORS
Indicator Initial Operational Final
1. effects financial policies and instruments to support economic stability and resilience 0.7 0.1 0.5
2. increases economic diversification 0.3 0.2 0.3
3. an acceptable employment and training opportunities for local residents 0.4 0.2 0.7
4. increases payments and investments in coastal management 0.3 0.6 0.7
5. promotes infrastructure development and increases environmental friendly transport 0.5 0.6 0.8
6. increases culturally and environmentally friendly, low-impact tourism 0.8 0.9 0.9
7. increases investment in innovation for green economy 0.7 0.8 0.8
8. increases productivity and use of sustainable agriculture and fisheries 0.8 0.8 0.9
9. increases investments on climate change and flood risk management 0.6 0.5 0.7
TABLE III: DETERMINATION OF THE SUPPORTABILITY FACTOR BY ANALYSIS OF THE SOCIAL INDICATORS
INDICATORS
Installation Operational Decommissioning
Coastal &
bathing
zone
Nearshore Offshor
e
Coastal &
bathing
zone
Nearshore Offshor
e
Coastal &
bathing
zone
Nearshore Offshor
e
1. promotes social justice and equal
opportunities for all members of
society
NA NA 0.5 NA NA 0.6 NA NA 0.6
2. improves quality of life (all
people have a home and access to
basic infrastructure and services)
NA NA 0.5 NA NA 0.6 NA NA 0.6
3. provides educational
opportunities, supports life-long
learning and increases awareness
about sustainability
0.3 0.4 0.7 0.3 0.4 0.2 0.3 0.4 0.7
4. protects, monitors, and
safeguards local resident access to
natural, historical, archaeological,
religious, spiritual, and cultural sites
0.8 0.8 0.2 0.5 0.5 0.1 0.8 0.8 0.2
5. supports the conservation of
cultural heritage (includes rural
heritage)
0.3 0.3 0.1 0.3 0.3 0.2 0.3 0.3 0.2
6. contributes to crime prevention
and increase perception of safety
among population
NA NA 0.2 NA NA 0.2 NA NA 0.2
7. increases production of local and
fair trade goods and services NA NA 0.2 NA NA 0.2 NA NA 0.2
Journal of Clean Energy Technologies, Vol. 7, No. 4, July 2019
52

8. promotes communication,
cooperation between citizens and
local authorities
0.2 NA 0.3 0.3 NA 0.2 0.2 NA 0.5
9. reduces vulnerability of people to
climate change and promotes
comprehensive risk based
assessment and prioritised action in
area
0.4 NA 0.2 0.3 NA 0.2 0.4 NA 0.3
TABLE IV: DETERMINATION OF THE SUPPORTABILITY FACTOR BY ANALYSIS OF THE GOVERNANCE INDICATORS
INDICATORS Initial Operational Final
1. A management team with broad competences and sufficient representation was built to lead the planning process 0.4 0.2 0.5
2. Human activities and associated stakeholder groups were determined 0.8 0.5 0.4
3. The issue was chosen driven by ecological, social or economic needs and targets were set 0.9 0.5 0.5
4. All possible measures were identified and compiled into alternative hypothetical scenarios 0.9 0.7 0.9
5. A strategy was developed how to assess the effect and ESE (Economic, Social, Ecologic) consequences of different
scenarios (e.g. modelling) 0.9 0.8 0.8
6. Different alternative scenarios were simulated and results discussed with stakeholders 0.9 0.8 0.8
7. Assessments were made of impacts on different stakeholders 0.3 0.3 0.5
8. Costs were calculated for different optional measures considered in the scenarios 0.5 0.4 0.5
9. There was a strategy for the issues of missing data and uncertainty in implementation process 0.8 0.9 0.9
10. The feasibility, costs end efficiency of scenarios were reviewed and evaluated 0.7 0.7 0.7
11. The entire process was documented and publicly available 0.6 0.5 0.5
12. The concept was implemented and accepted by the public 0.8 0.7 0.8
13. Effects of implemented measure are monitored on regular basis with respect to identified targets 0.8 0.7 0.8
14. The success of measure was evaluated 0.8 0.7 0.8
Taking into consideration these analyses of the economic,
social, environmental or governance, we set out for each of
these indicators of the supportability factor the total value
(Tables V-VIII).
TABLE V: ENVIRONMENT INDICATORS SUPPORTABILITY FACTOR
Environment indicator
Coastal
&
bathing
zone
Nearshore Offshore Total
1. reduces waste,
prevents air, water and
soil pollution and
stimulates material reuse
and recycles
0.50 0.62 0.50 0.54
2. Flood prevention,
protection and mitigation 0.70 0.90 0.70 0.77
3. improves the status of
water (ecological and
chemical)
0.60 0.40 0.60 0.53
4. protect key natural
sites (including marine
and nature scenic,
cultural, and wild
landscapes)
0.63 0.63 0.63 0.63
5. effects land use
planning and
management, supports
environmentally friendly
rural activities
0.63 0.63 0.63 0.63
6. affecting natural
habitats, biodiversity and
their quality
0.50 0.57 0.50 0.52
7. improves sustainable
management of coastal
erosion
1.00 1.00 1.00 1.00
8. increases the
resilience and reduces
vulnerability to climate
change impacts
1.00 1.00 1.00 1.00
9. increases energy
efficiency 1.00 1.00 1.00 1.00
10. impact of the use of 0.63 0.63 0.63 0.63
low-impact transport and
supports sustainable
mobility in the
destination
11. increase
environmental awareness
of the population
0.63 0.63 0.63 0.63
12. promotes
environmentally-friendly
processes and products
0.63 0.63 0.63 0.63
TABLE VI: ECONOMIC INDICATORS SUPPORTABILITY FACTOR
Indicator Total
1. effects financial policies and instruments to support economic
stability and resilience 0.43
2. increases economic diversification 0.27
3. an acceptable employment and training opportunities for local
residents 0.43
4. increases payments and investments in coastal management 0.53
5. promotes infrastructure development and increases
environmental friendly transport 0.63
6. increases culturally and environmentally friendly, low-impact
tourism 0.87
7. increases investment in innovation for green economy 0.77
8. increases productivity and use of sustainable agriculture and
fisheries 0.83
9. increases investments on climate change and flood risk
management 0.60
TABLE VII: SOCIAL INDICATORS SUPPORTABILITY FACTOR
INDICATOR
1. promotes social justice and equal opportunities for all members of
society 0.57
2. improves quality of life (all people have a home and access to basic
infrastructure and services) 0.57
3. provides educational opportunities, supports life-long learning and
increases awareness about sustainability 0.41
4. protects, monitors, and safeguards local resident access to natural,
historical, archaeological, religious, spiritual, and cultural sites 0.52
5. supports the conservation of cultural heritage (includes rural
heritage) 0.26
6. contributes to crime prevention and increase perception of safety
among population 0.20
7. increases production of local and fair trade goods and services 0.20
8. promotes communication, cooperation between citizens and local
authorities 0.28
9. reduces vulnerability of people to climate change and promotes
comprehensive risk based assessment and prioritised action in area 0.30
Journal of Clean Energy Technologies, Vol. 7, No. 4, July 2019
53

TABLE VIII: GOVERNANCE INDICATORS SUPPORTABILITY FACTOR
INDICATORS
1. A management team with broad competences and sufficient
representation was built to lead the planning process 0.37
2. Human activities and associated stakeholder groups were
determined 0.57
3. The issue was chosen driven by ecological, social or
economic needs and targets were set 0.63
4. All possible measures were identified and compiled into
alternative hypothetical scenarios 0.83
5. A strategy was developed how to assess the effect and ESE
(Economic, Social, Ecologic) consequences of different
scenarios (e.g. modelling) 0.83
6. Different alternative scenarios were simulated and results
discussed with stakeholders 0.83
7. Assessments were made of impacts on different stakeholders 0.37
8. Costs were calculated for different optional measures
considered in the scenarios 0.47
9. There was a strategy for the issues of missing data and
uncertainty in implementation process 0.87
10. The feasibility, costs end efficiency of scenarios were
reviewed and evaluated 0.70
11. The entire process was documented and publicly available 0.53
12. The concept was implemented and accepted by the public 0.77
13. Effects of implemented measure are monitored on regular
basis with respect to identified targets 0.77
14. The success of measure was evaluated 0.77
Considering these values we calculated the supportability
factor for each factor separately, as it can be seen in the
following table (Table IX).
TABLE IX: SUPPORTABILITY FACTOR (SF)
Type of factor SF
Environment factor 0,71
Economic factor 0,6
Social factor 0,37
Gouvernance factor 0,66
This table shows graphically in the following way (Fig. 7).
Fig. 7. Supportability factor graphics.
IV. DISCUSSION
Determining the supportability factor shows a picture of
the activity proposed in the context of a multi-criteria
analysis of the environmental factors, economic, social and
governance. Use indicators are indicators already
consecrated, use both at Sea level (determined by Coast
projects learn or Pegasso) but also at the level of the Baltic
Sea (project Baltcoast). Furthermore, the sustainability
matrix was developed within the project Baltcoast and used
by us to calculate the supportability factor.
In order to achieve a more realistic value of the factor of
supportability, must be used with a higher accuracy. These
data may be collected to the spot (weather, water, and data
about economic and social activities) as well as the statistical
data or other sources. [10] Calculate affordability factor will
take into account the limits stipulated in the national and
international official documents, list or other sources used in
an official and recognized widely. Each indicator in part must
have at least one method of calculating the supportability
factor. There are indicators that can be calculated more
affordability factors. For example, the environmental factor,
we have the indicator "1. Reduces waste, prevents air, water
and soil pollution and stimulates material reuse and recycles ",
for which you will calculate the affordability factor for each
of the elements: water, air, soil, waste. In this case, if we take
only the element "water", it must be analyzed in light of the
water framework directive, by performing qualitative and
quantitative analysis for the determination of good water
status [11]. If the values recorded for this item do not fulfill
the requirements of the directive, this means that the element
analyzed do not fit within the affordability factor. Similar
must proceed with other elements. In the example used
regarding the exploitation of the natural gas in the Black Sea,
we used the three stages of this activity, namely the initial
phase, the installation phase extracting platform became
operational and the uninstall phase of the equipment used.
[12]. In the case of the environmental factors and social
analysis of the indicators was done and in terms of the
influence of activity on offshore, nearshore zone or coastal
and bathing zone. In the case of the economic factors and
governance, this influence does not exist or is insignificant
between these areas. Supportability factor model shows us
the threshold up to which an activity can be conducted in
optimal conditions using the multi-criteria analysis method
and taking into account the different phases of the project.
Inter-relations of the various indicators and the cause of
conditionality between them are elements that make
supportability factor analysis method applied to determine a
specific State of affairs. Validation of the model substantially
depends on the quality of the data entered to determine the
threshold of the affordability. Also, the pattern is dependent
upon the inter-relations between different indicators
established for the coastal area and marine [13]. For example,
when we take into account the marine waves, these must be
related to the prevailing winds in that area, bathymetry area,
topography, existing marine currents, steelwork, etc.
Supportability threshold is given in this case by the
multi-criteria analysis of all elements that have an influence
on the item concerned [14].
V. CONCLUSION
From our point of view, an analysis of the supportability is
a factor up to a certain point. The data used should be of a
high accuracy and current. Analysis of the factor of the
affordability should be conducted periodically, because some
elements can have a different evolution over time and can
Journal of Clean Energy Technologies, Vol. 7, No. 4, July 2019
54

provide other values after a certain period of time. Analytical
model of the affordability factor which is focussed on the
impact of the planned drilling operations carried out within
the block 30 EX TRIDENT by the LUKOIL the investor
shows us that this activity has some elements (in particular
those of the environmental protection) that are affected, may
irreparably, but, at the same time, it is noticed that the social
and economic activities, improving the operational period of
the project. The analysis was conducted only on a single
drilling operation planned, namely that the block 30 EX
TRIDENT. As we already know at this time, on the
continental shelf of the Black Sea there will be more such
activities, and the results of all these activities could
substantially alter the thresholds laid down in this
supportability analysis [15].
Analysis of the factor of supportability is part of doctoral
research within the paper "Implementing of an integrated
coastal management through the application of the
sustainable development principles", to determine the
supportability factor, determining the threshold between the
inter-relations and proposed indicators are still in the early
stage, and the future models developed to be validated in
time.
ACKNOWLEDGMENT
This work was carried out in the framework of the
research project REMARC, supported by the Romanian
Executive Agency for Higher Education, Research,
Development, and Innovation Funding – UEFISCDI, grant
number PN-III-P4-IDPCE-2016-0017.
REFERENCES
[1] Contribution of the Exploration and Production Projects of the Black
Sea Hydrocarbons to the Development of the Romanian Economy,
Deloitte Study, 2011.
[2] V. Iuga and R. Dudau, “Prospects of natural gas in Romania and ways
to capitalize on these,” Bucharest, 2018.
[3] Sntgn Transgaz, “Study of environment assessment pipelines gas black
sea – Podisor,” Mediaș, 2018.
[4] INCDM “Grigore Antipa", Study of Environment Assessment Natural
gas development project Midia (MCD) - offshore component -
naturally gas natural gas storage submarine of natural gas combinations
under distillation of the natural gas transportation, gas transport
conduct naturale, annexes 5 natural gas production samples, 2018.
[5] C. Anton, E. Rusu, and R. Mateescu, “An analysis of the coastal risks in
Romanian nearshore,” Journal of Mechanical Testing and Diagnosis,
vol. 7, no. 1, pp. 18-27, 2017.
[6] Blumenfield SRL Constanta, Study of Environment Assessment
Performance of Planned Geological Exploration of Hydrocarbon
Resources in Ex-block 30 Except from Black Sea, 2018.
[7] C. Anton, C. Gasparotti, A. Raileanu, and E. Rusu, “Towards
integrated management and planning in the Romanian Black Sea
coastal zones,” Acta Universitatis Danubius. Oeconomica Journal, vol.
13, no. 5, pp. 59-71, 2017.
[8] C. Gasparotti and E. Rusu, “Methods for the risk assessment in maritime
transportation in the black sea basin,” Journal of Environmental Protection
and Ecology, vol. 13, no. 3A, pp. 1751-1759, 2012.
[9] A. Ivan, C. Gasparotti, and E. Rusu, “Influence of the interactions between
waves and currents on the navigation at the entrance of the Danube Delta,”
Journal of Environmental Protection and Ecology, vol. 13, no. 3A, pp.
1673-1682, 2012.
[10] F. Onea and E. Rusu, “An evaluation of the wind energy in the
north-west of the black sea,” International Journal of Green Energy,
vol. 11, no. 5, pp. 465-487, 2014.
[11] F. Onea and E. Rusu, “Efficiency assessments for some state of the art
wind turbines in the coastal environments of the black and the caspian
seas,” Energy Exploration & Exploitation, vol. 34, no. 2, pp. 217–234,
2016.
[12] E. Rusu and C. G. Soares, “Numerical modelling to estimate the spatial
distribution of the wave energy in the Portuguese nearshore,”
Renewable Energy, vol. 34, no. 6, pp. 1501-1516, 2009.
[13] E. Rusu, “Evaluation of the wave energy conversion efficiency in
various coastal environments,” Energies, vol. 7, no. 6, pp.
4002-4018, 2014.
[14] D. Silva, E. Rusu, and S. C. Guedes, “High-resolution wave energy
assessment in shallow water accounting for tides,” Energies, vol. 9, no.
9, pp. 761-779, 2016.
[15] A. Zanopol, T. F. Onea, and E. Rusu, “Coastal impact assessment of a
generic wave farm operating in the Romanian nearshore,” Energy, vol.
72, pp. 652-670, 2014.
Catalin Anton was born on August 17, 1975 in
Constanta, Romania, and is a PhD student at the
Lower Danube University in Galati, Romania, his
main research area includes the applicability of
sustainable models through integration into the
coastal area.
The main topic of this paper is the management
of the economic, social, environmental and
governance factors, which must be harmoniously
combined into a desirable model.
The applicability of the research themes has reached both the coastal
area and the marine area - onshore and offshore - and models from the
area of energy, transport, waste, or protected areas have been studied.
.
Author’s formal
photo
Journal of Clean Energy Technologies, Vol. 7, No. 4, July 2019
55