Embed Size (px)
Citation preview
Multi-Hazard Supply Chain Network Management: Assessment of Modeling Elements and Data Requirements for Pre- and Post- Disaster Restoration
June 26, 2013
Dr. Suzanna Long, Missouri S&TDr. Tom Shoberg, U.S. Geological Survey
Dr. Steven Corns, Missouri S&TDr. Héctor Carlo, University of Puerto Rico at
Mayaguez
Project #G13AC00028

2
Students Involved• Varun Ramachandran, PhD Student, Engineering
Management, Missouri S&T
• Wilson Alvarez, Graduate Student, Industrial Engineering, University of Puerto Rico at Mayaguez
• Alejandro Vigo, Undergraduate Student, Industrial Engineering, University of Puerto Rico at Mayaguez
• Victor David, Undergraduate Student, Industrial Engineering, University of Puerto Rico at Mayaguez
• Lizzette Pérez, PhD Student, Engineering Management, Missouri S&T
3
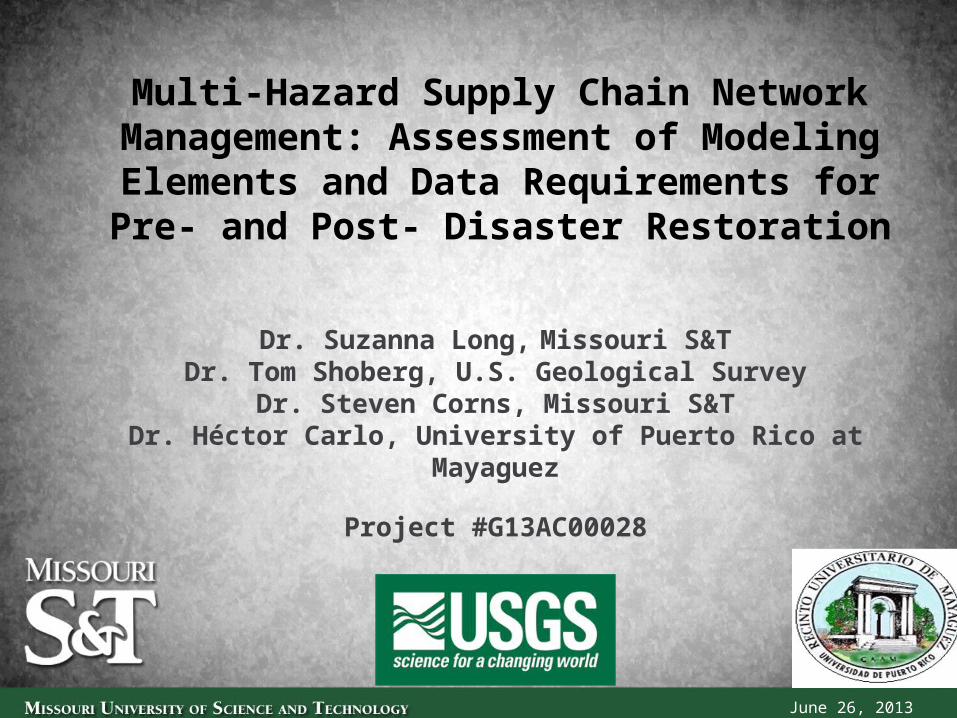
Aim:To approach SCSI restoration as a complex adaptive systems problem and define the necessary model elements, data needs/element, component interdependencies and metrics for success.
Resiliency and scalability are then incorporated into a multi-hazard management decision-making tool.
4
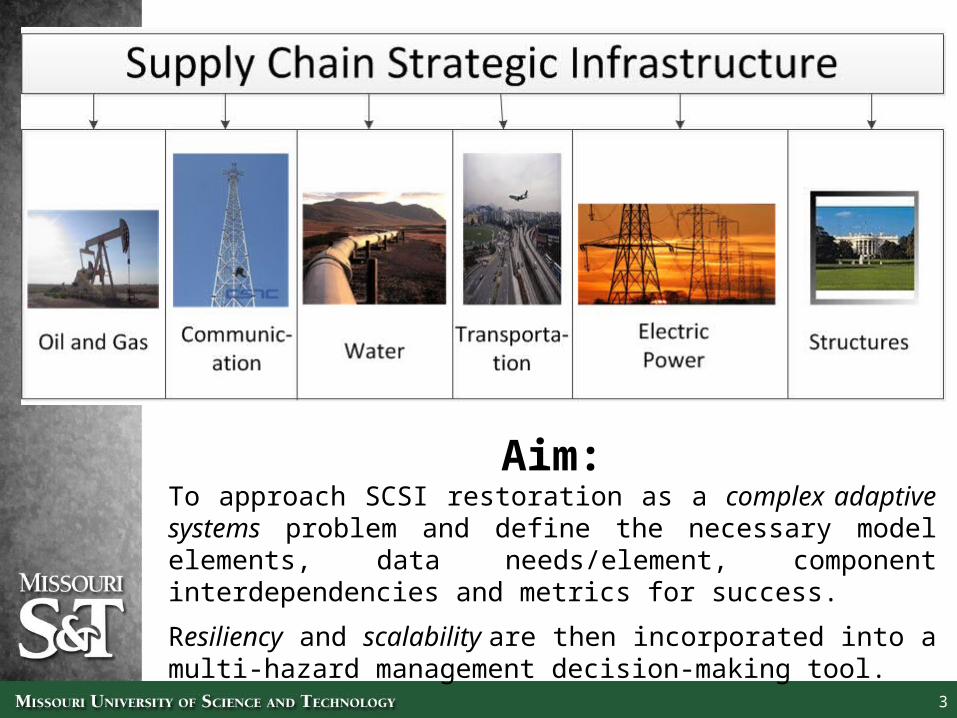
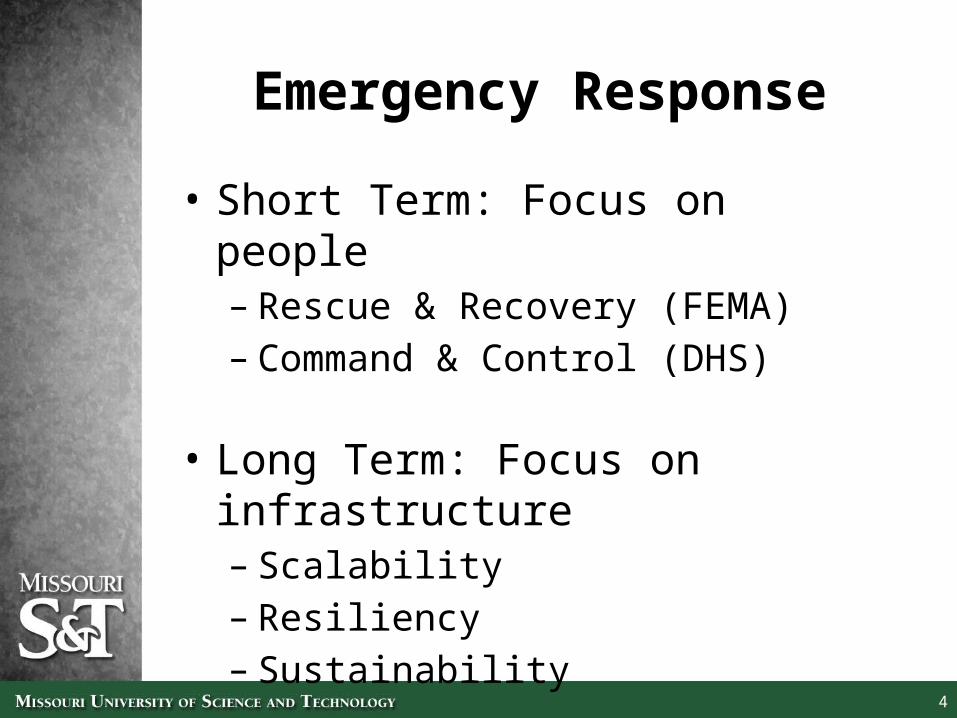
Emergency Response
• Short Term: Focus on people– Rescue & Recovery (FEMA)– Command & Control (DHS)
• Long Term: Focus on infrastructure – Scalability – Resiliency– Sustainability
5
Gap Analysis
• Medium- to long-term Supply Chain Strategic Infrastructure (SCSI) recovery after extreme event disruption has yet to be adequately modeled.
• Interdependencies between SCSI elements are not well mapped.
• Much infrastructure data are proprietary and, as such are difficult to acquire.
• Decision making and handoffs between private and public entities lead to restoration bottlenecks.
• No single approach exists to model SCSI recovery from planning stage to restoration stage.
6
Uniqueness of Approach
• Integration of geospatial and supply chain data.
• Model Based Systems Engineering (MBSE) and Complex Adaptive Systems (CAS) to account for the different elements of the supply chain network.
• Model considers:– Scalability – Resiliency– Sustainability
7
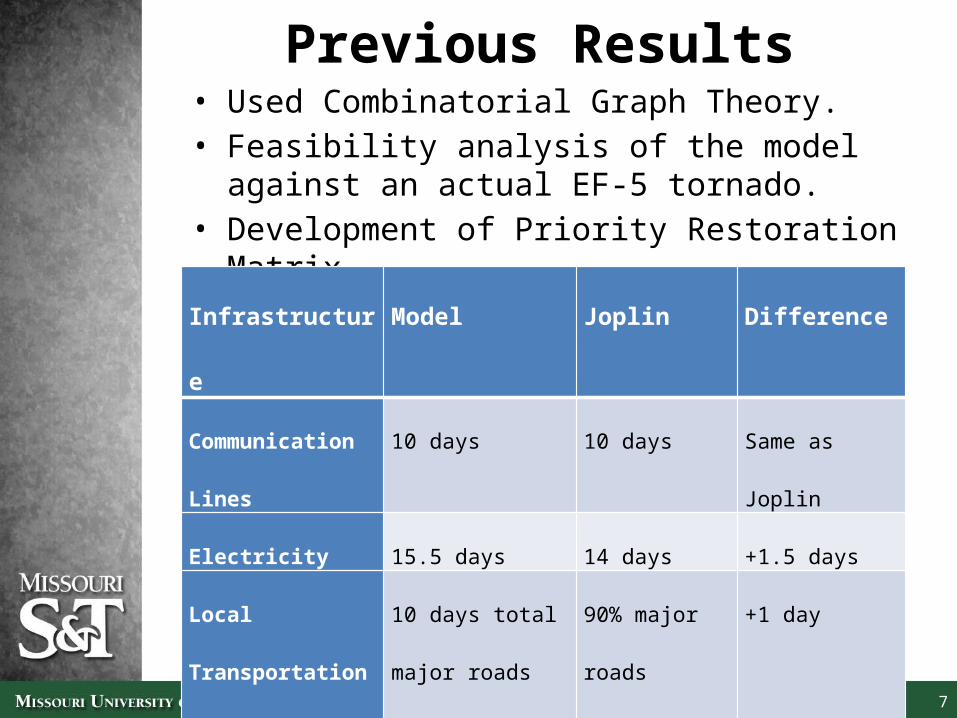
Previous Results• Used Combinatorial Graph Theory.• Feasibility analysis of the model against an
actual EF-5 tornado.• Development of Priority Restoration Matrix.
Infrastructure Model Joplin Difference
Communication
Lines
10 days 10 days Same as Joplin
Electricity 15.5 days 14 days +1.5 days
Local Transportation
Network
10 days total major
roads 5-6 days
90% major roads
cleared.
+1 day
Water Pipelines 8 days 10 days -2 days
Resiliency 22.5 +/- 2.5 days 24.5 +/- 3.5 days +/- 2 days
8
Project Goals
• Integration of information to make a comprehensive MBSE model.
• Develop a framework of how sub-system level resilience metric can be used to calculate resiliency time and cost to get sub-systems back to pre-event levels.
• Make scalable models that span multiple elements of the supply chain network across several regions in response to a variety of possible extreme events.
• Improve decision-making algorithms to approach optimal restoration associated with the destruction caused by an extreme event.
9
Tools to Approach the Project
• Model Based Systems Engineering (MBSE)
• Complex Adaptive Systems (CAS)
• Agent Based Modeling
What is Model Based Systems Engineering?
• Away of doing systems engineering using models
• The shift from a document centric systems engineering paradigm to a model centric (Friedenthal)
• New topic and still evolving
10
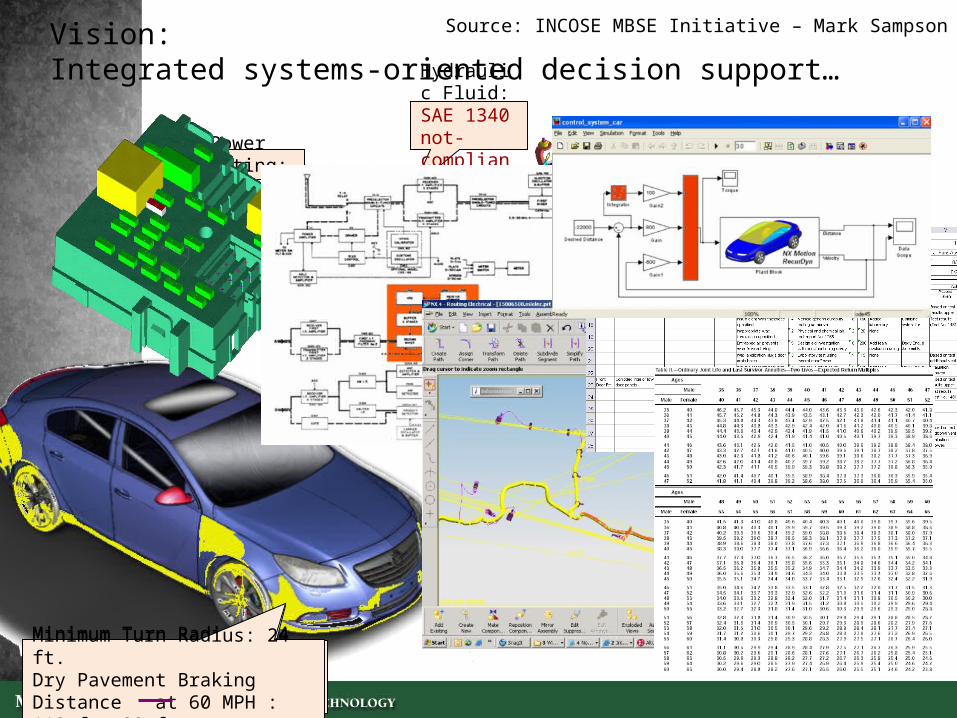
Vision: Integrated systems-oriented decision support…
Minimum Turn Radius: 24 ft.Dry Pavement Braking Distance at 60 MPH : 110 ft.
Automatic Cruise Control <FAULT>
Thermal/Heat
Dissipation: 780°Ergonomic/
Pedal Feedback: 34 ERGSHydraulic Pressure: 350 PSISensor
MTBF:3000 hrs
Power Rating:18 Amps
Hydraulic Fluid: SAE 1340 not-compliant
Minimum Turn Radius: 24 ft.Dry Pavement Braking Distance at 60 MPH : 110 ft. 90 ft
Source: INCOSE MBSE Initiative – Mark Sampson
12
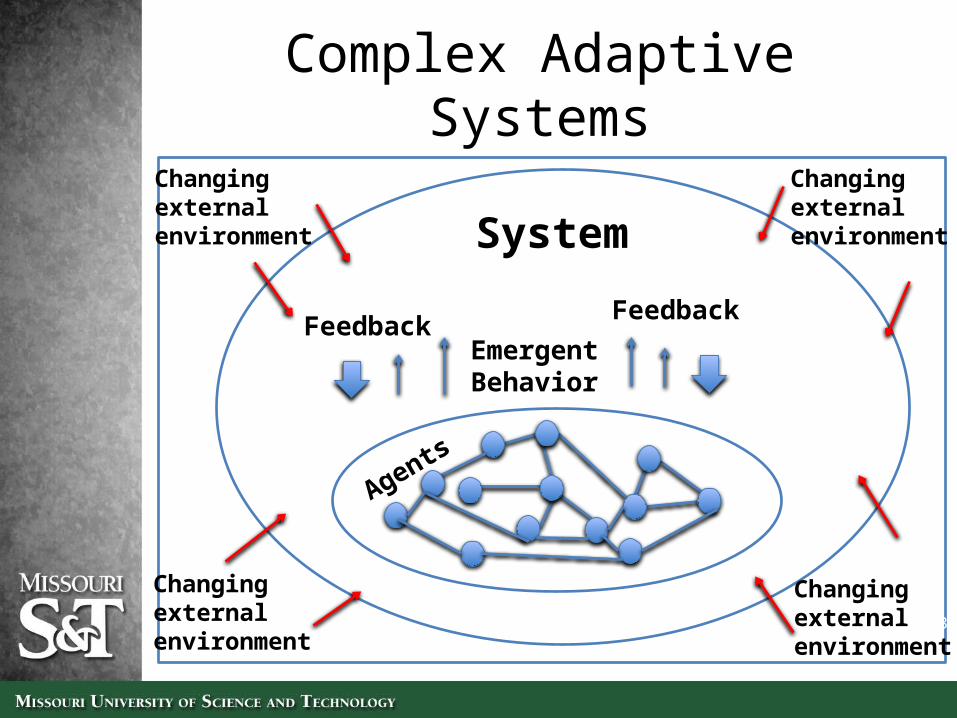
Complex Adaptive Systems
• Complex Adaptive Systems are dynamic systems that may represent cells, species, individuals, nations, constantly acting and reacting to what the other entities around them are doing.
• Because extreme event SCN restoration involves a large number of coupled, dynamic sub-systems, the reconstruction effort must be approached as a complex adaptive system.
Complex Adaptive Systems
13
Agents
EmergentBehavior
Feedback Feedback
SystemChangingexternal environment
Changingexternal environment
Changingexternal environment
Changingexternal environment
14
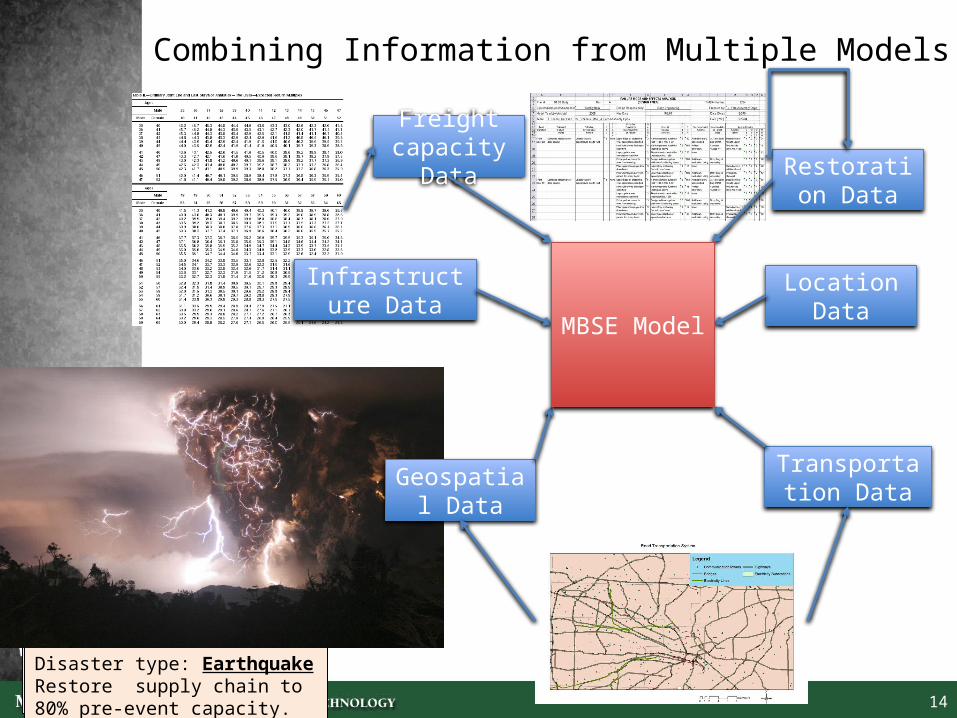
Combining Information from Multiple Models
Disaster type: TornadoRestore supply chain to 80% pre-event capacity.
Disaster type: EarthquakeRestore supply chain to 80% pre-event capacity.
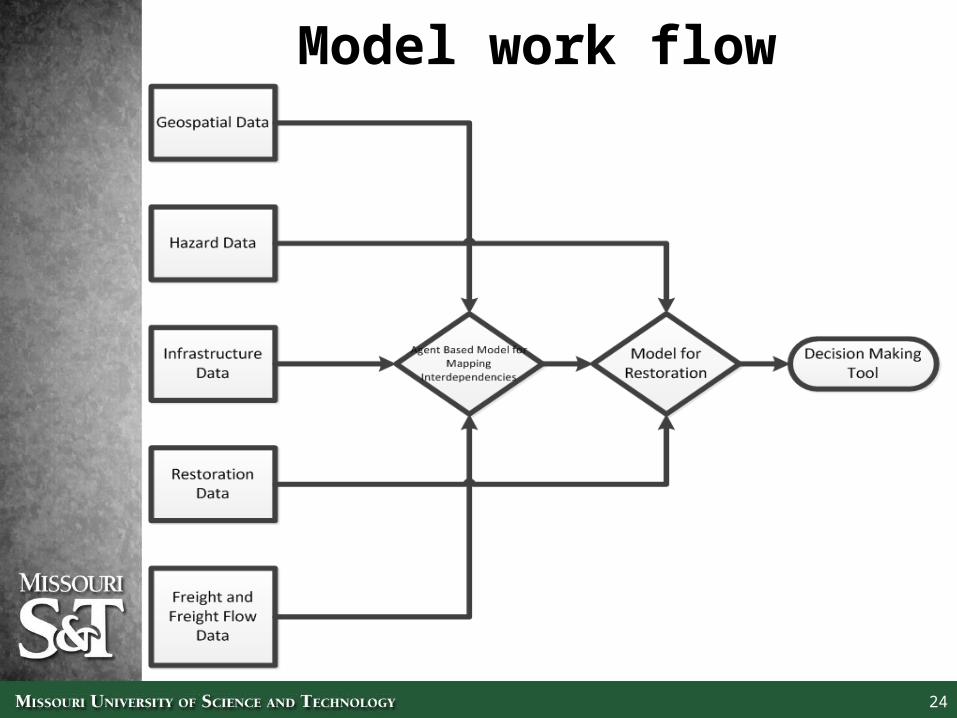
Geospatial Data
Freight capacity Data Restoration
Data
Infrastructure Data
Location Data
Transportation Data
MBSE Model
15
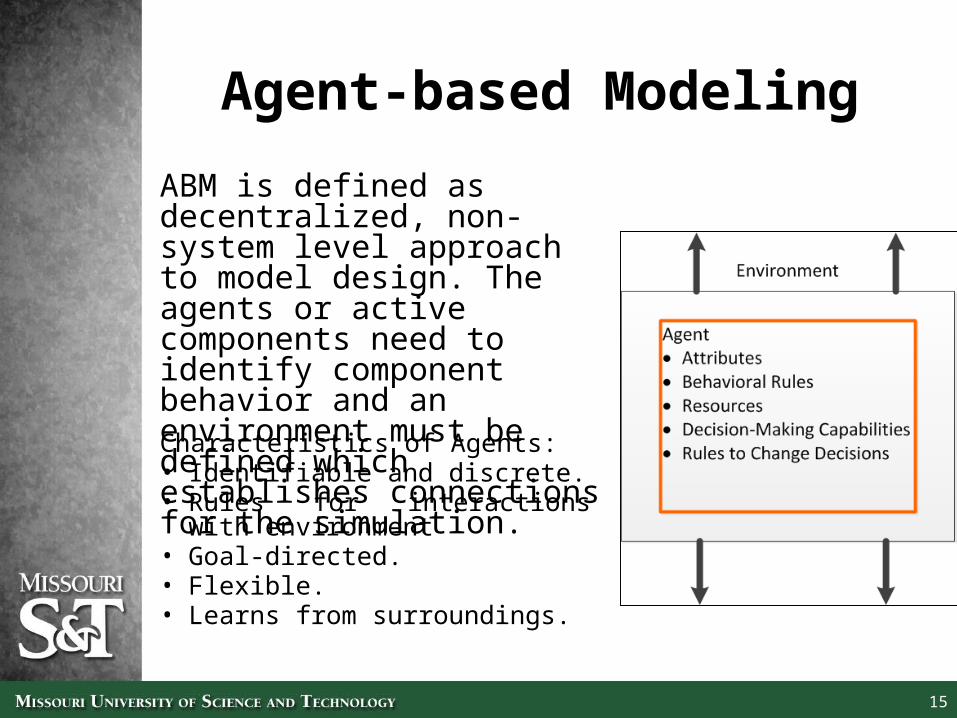
Agent-based Modeling
ABM is defined as decentralized, non- system level approach to model design. The agents or active components need to identify component behavior and an environment must be defined which establishes connections for the simulation.Characteristics of Agents:• Identifiable and discrete.• Rules for interactions with
environment• Goal-directed.• Flexible.• Learns from surroundings.
16
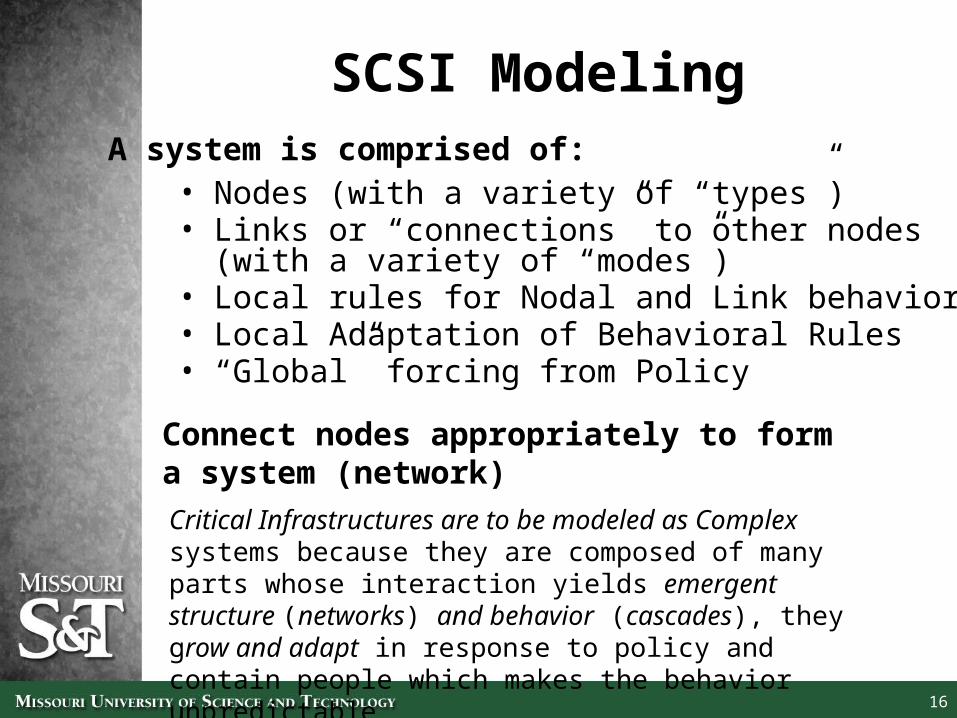
SCSI Modeling
• Nodes (with a variety of “types”)• Links or “connections” to other nodes (with a variety
of “modes”)• Local rules for Nodal and Link behavior• Local Adaptation of Behavioral Rules• “Global” forcing from Policy
A system is comprised of:
Connect nodes appropriately to form a system (network)Critical Infrastructures are to be modeled as Complex systems because they are composed of many parts whose interaction yields emergent structure (networks) and behavior (cascades), they grow and adapt in response to policy and contain people which makes the behavior unpredictable
17
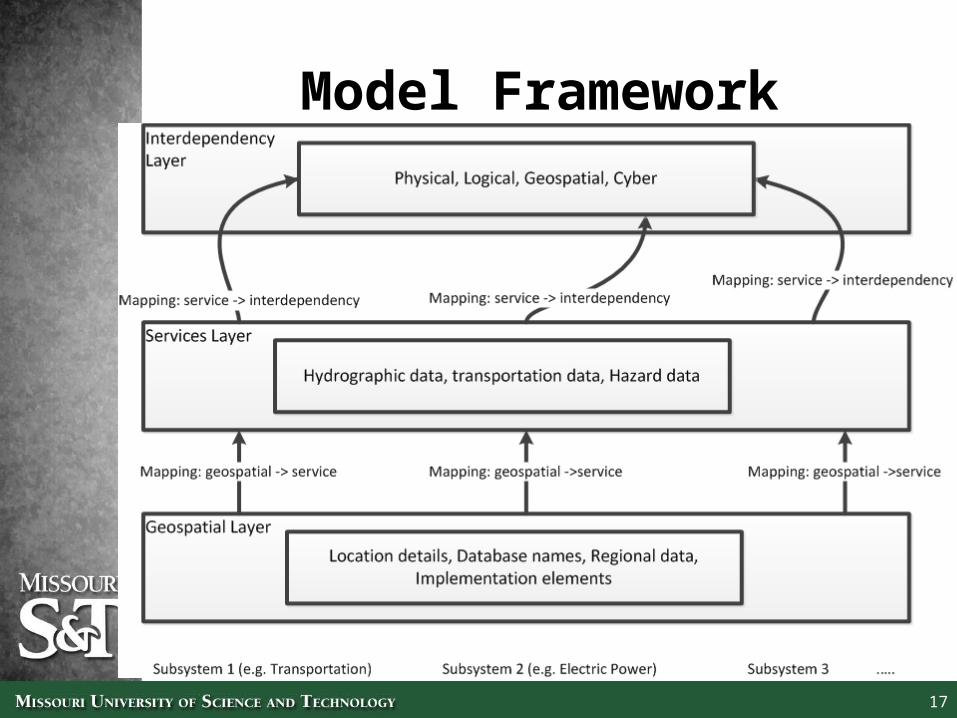
Model Framework
18
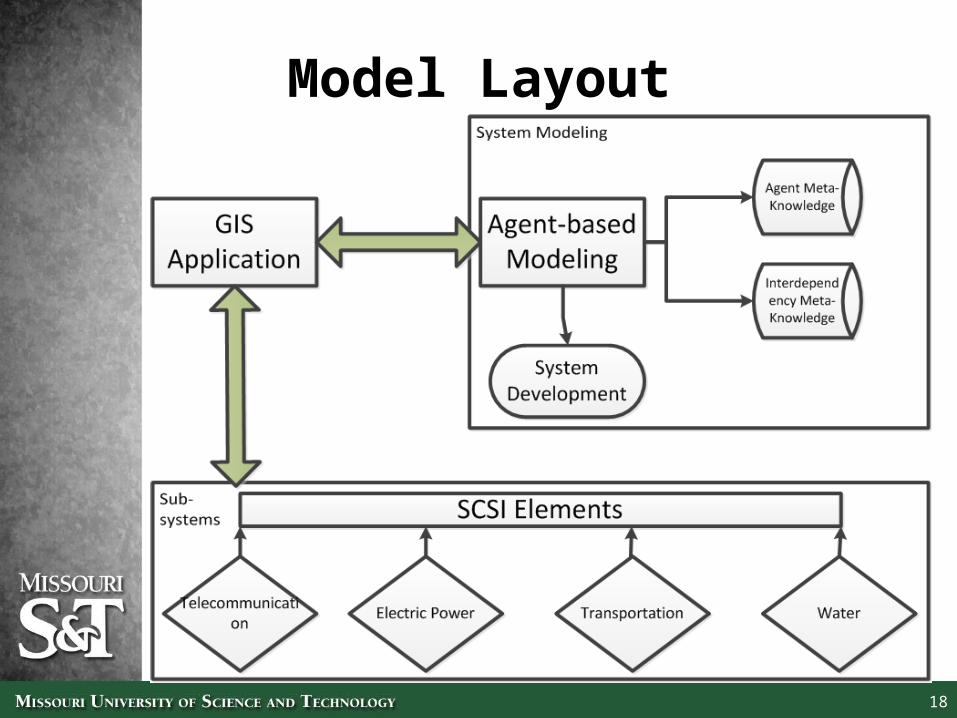
Model Layout
19
Sub-System Model
• A critical infrastructure model is constructed from three key data sources. – The National Map (TNM) of the U.S.
Geological Survey – Geospatial data– Infrastructure elements derived from these
data.– Missouri and Illinois departments of
transportation.• These are integrated with transportation capacity
data from the U. S. Department of Commerce to model the flow of goods and services through the urban center
20
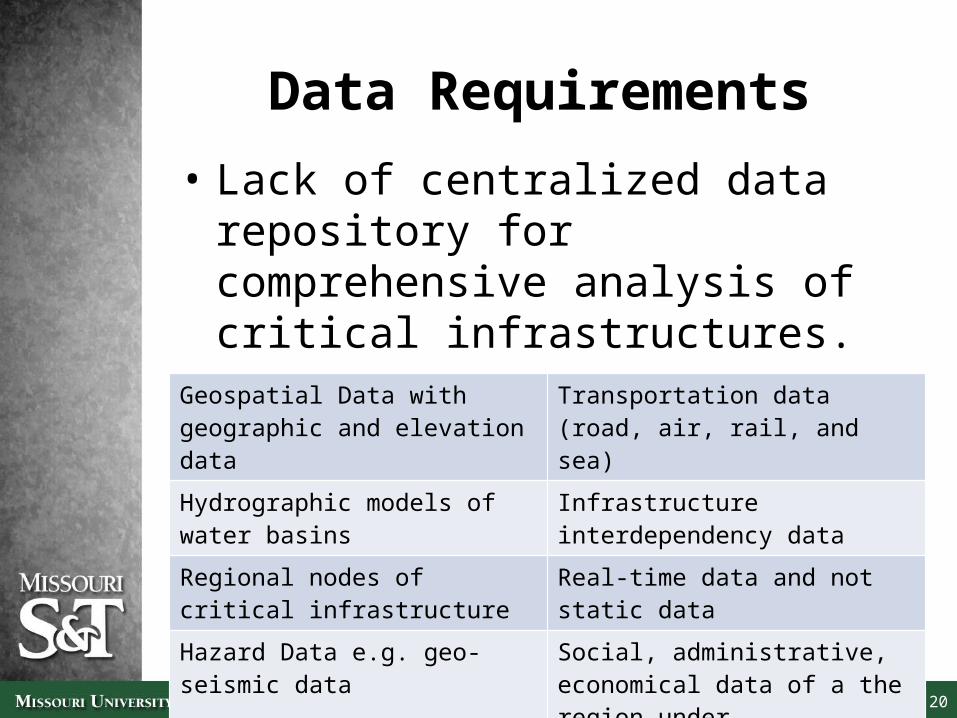
Data Requirements
• Lack of centralized data repository for comprehensive analysis of critical infrastructures.
• Data needed for this research:Geospatial Data with geographic and elevation data
Transportation data (road, air, rail, and sea)
Hydrographic models of water basins
Infrastructure interdependency data
Regional nodes of critical infrastructure
Real-time data and not static data
Hazard Data e.g. geo-seismic data Social, administrative, economical data of a the region under consideration
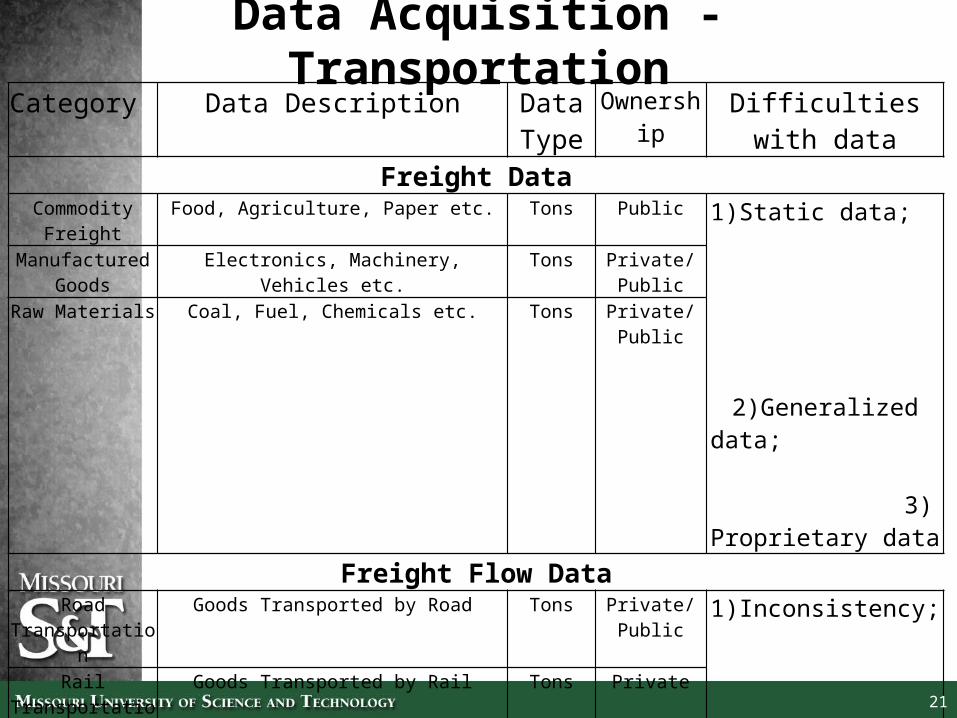
Data Acquisition - TransportationCategory Data Description Data
TypeOwnership Difficulties with data
Freight DataCommodity Freight Food, Agriculture, Paper etc. Tons Public 1)Static data;
2)Generalized data; 3)
Proprietary data
Manufactured Goods
Electronics, Machinery, Vehicles etc. Tons Private/Public
Raw Materials Coal, Fuel, Chemicals etc. Tons Private/Public
Freight Flow DataRoad
TransportationGoods Transported by Road Tons Private/
Public1)Inconsistency;
2)Estimation maybe required;
3)Private-Public ownership
Rail Transportation Goods Transported by Rail Tons PrivateAir Transportation Goods Transported by Air Tons Private
Water Transportation
Goods Transported by Water Tons Private/Public
Pipeline Transportation
Goods Transported by Pipeline Tons Private/Public
Infrastructure Capacity DataRoad- Hub Bulk, General Cargo, Containers Tons Private 1) Varied amount of data
required; 2) Different capabilities of
hubs; 3) Interdependency of data
Rail-Hub Bulk, Break Bulk, Intermodal, Shunting, etc. Tons PrivateWater-Hub Rail Car Storage, Dry Storage, Liquid Storage
etc.Tons/
BushelsPrivate
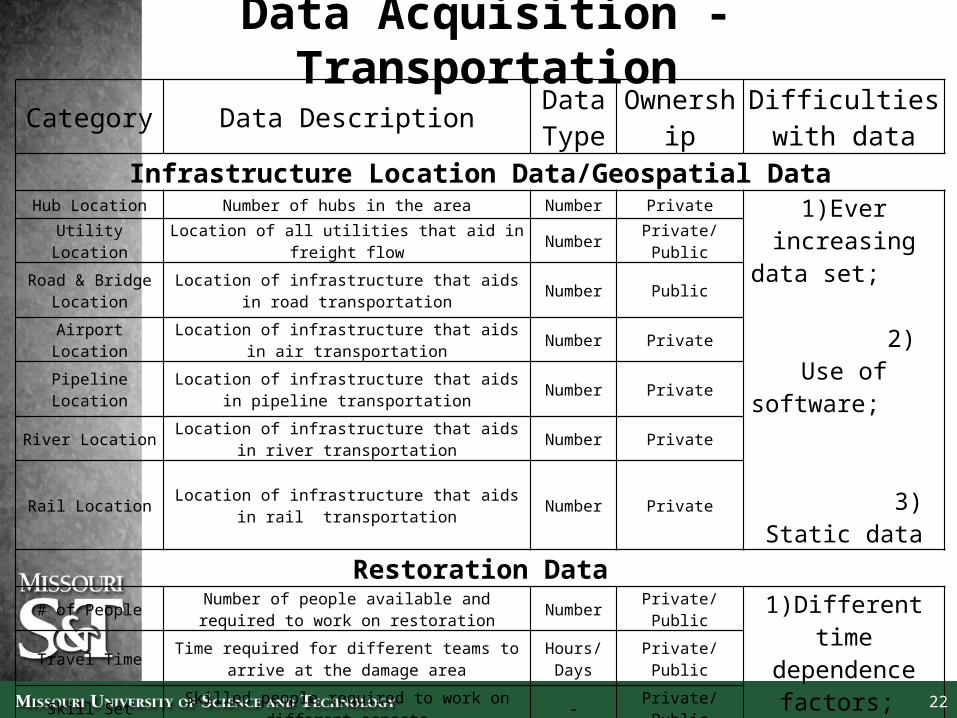
Data Acquisition - TransportationCategory Data Description Data
Type Ownership Difficulties with data
Infrastructure Location Data/Geospatial DataHub Location Number of hubs in the area Number Private
1)Ever increasing data set;
2) Use of software; 3) Static
data
Utility Location Location of all utilities that aid in freight flow Number Private/Public
Road & Bridge Location
Location of infrastructure that aids in road transportation Number Public
Airport Location Location of infrastructure that aids in air transportation Number Private
Pipeline Location Location of infrastructure that aids in pipeline transportation Number Private
River Location Location of infrastructure that aids in river transportation Number Private
Rail Location Location of infrastructure that aids in rail transportation Number Private
Restoration Data# of People Number of people available and required to work on
restoration Number Private/Public 1)Different time dependence factors;
2)Vast amount of data; 3) Scalability; 4)Ownership of
data
Travel Time Time required for different teams to arrive at the damage area Hours/Days Private/Public
Skill Set Skilled people required to work on different aspects - Private/Public
Mode Substitution If possible, substitution of mode to allow freight flow - Private/Public
Task Management Assignment and management of different tasks - Private/Public
Equipment Required Goods required for restoration to take place Tons/Pieces Private/Public
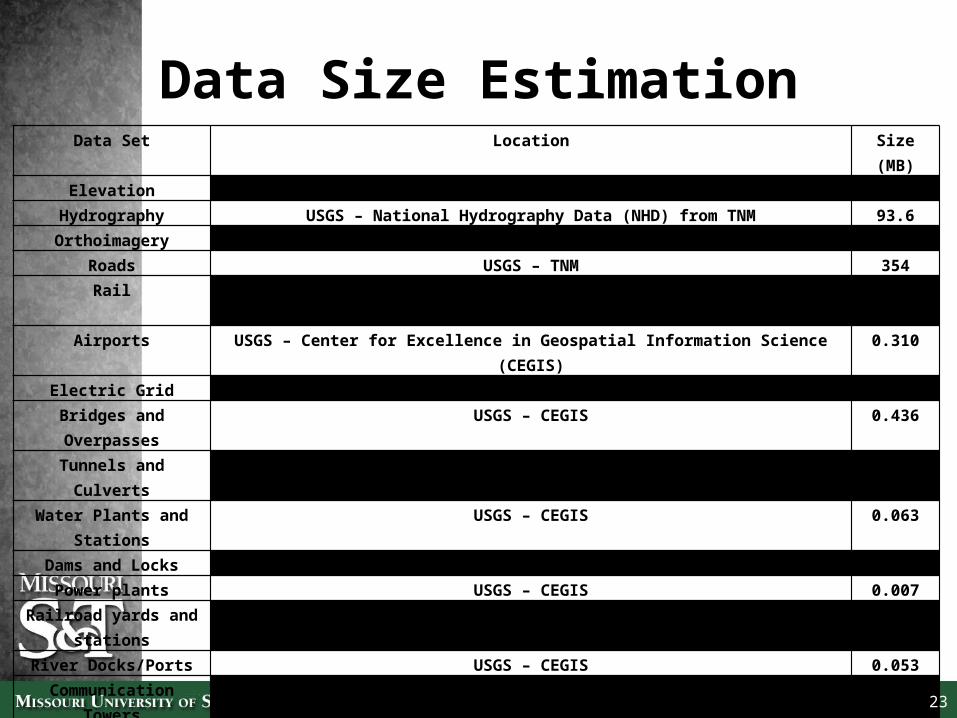
Data Size EstimationData Set Location Size (MB)Elevation U.S. Geological Survey (USGS) – The National Map (TNM) 2000
Hydrography USGS – National Hydrography Data (NHD) from TNM 93.6Orthoimagery USGS – TNM 674,000
Roads USGS – TNM 354Rail Missouri Department of Transportation (MoDoT) - Illinois Department of Transportation (IDoT) 85.2
Airports USGS – Center for Excellence in Geospatial Information Science (CEGIS) 0.310
Electric Grid USGS – CEGIS 0.980Bridges and Overpasses USGS – CEGIS 0.436
Tunnels and Culverts USGS – CEGIS 0.223Water Plants and Stations USGS – CEGIS 0.063
Dams and Locks USGS – CEGIS 0.053Power plants USGS – CEGIS 0.007
Railroad yards and stations USGS – CEGIS 0.031River Docks/Ports USGS – CEGIS 0.053
Communication Towers U. S. Federal Communications Commission (FCC) 0.020Restoration Rates Missouri University of Science and Technology (S&T) – Department of Engineering
Management and Systems Engineering (DEMSE) (Compiled from literature and interviews)0.250
Supply Chain Flow Rates U.S. Department of Commerce (Commerce), U.S. Department of Transportation (USDoT) and Private business (Compiled and housed at S&T – DEMSE)
50.56
Disaster Damage/Hazard Scenario
Simulated data from disaster scenario model, compiled and executed by USGS and S&T, housed at S&T
100.6
Total 676,686
24
Model work flow
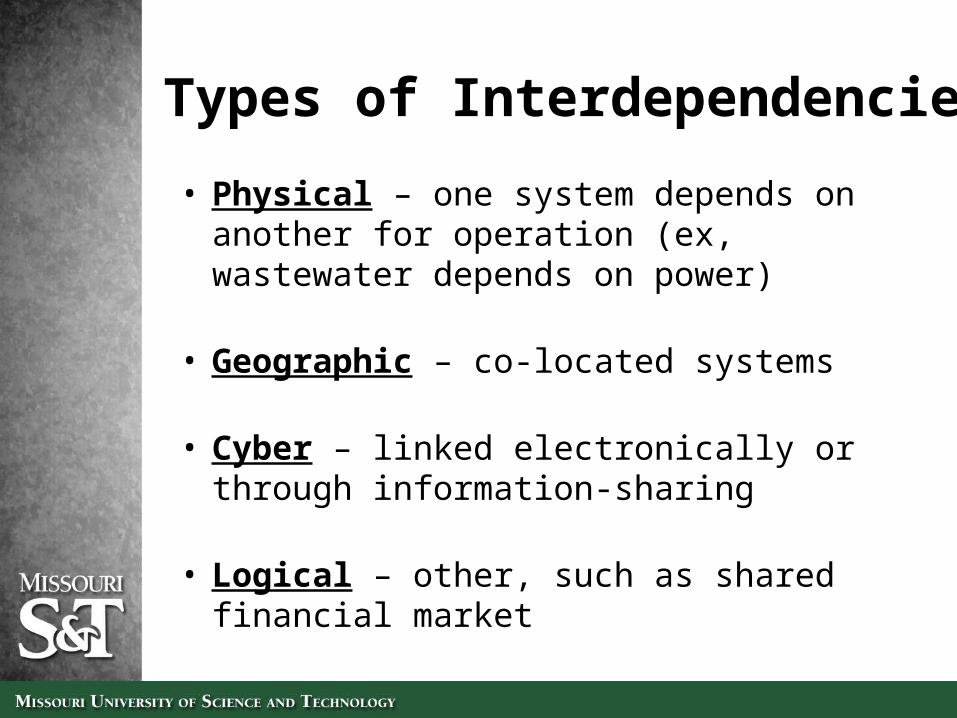
Types of Interdependencies
• Physical – one system depends on another for operation (ex, wastewater depends on power)
• Geographic – co-located systems
• Cyber – linked electronically or through information-sharing
• Logical – other, such as shared financial market
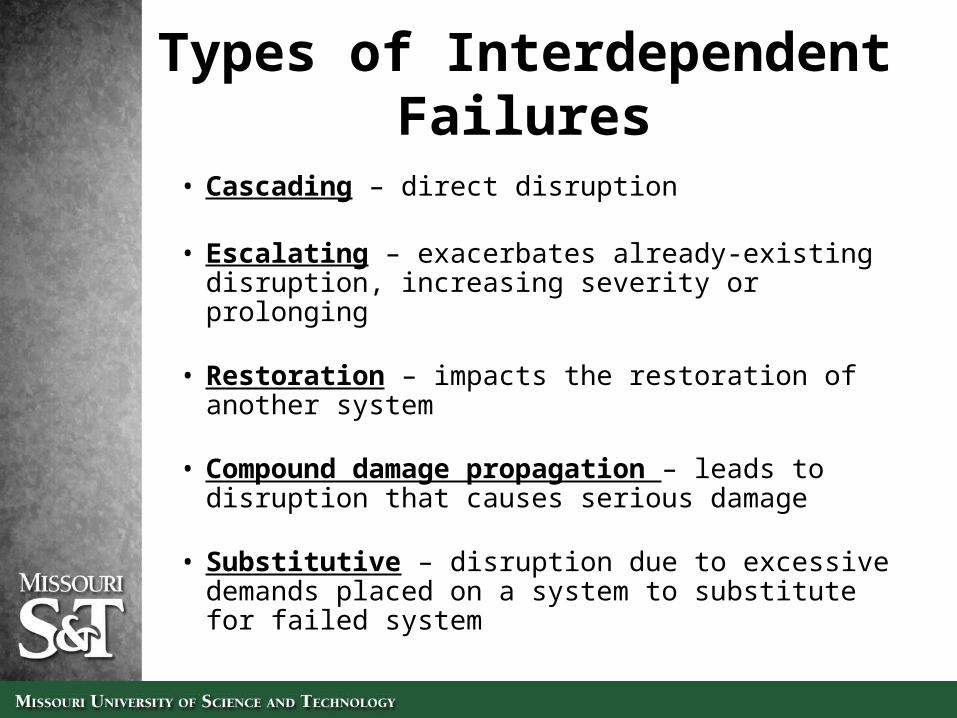
Types of Interdependent Failures
• Cascading – direct disruption
• Escalating – exacerbates already-existing disruption, increasing severity or prolonging
• Restoration – impacts the restoration of another system
• Compound damage propagation – leads to disruption that causes serious damage
• Substitutive – disruption due to excessive demands placed on a system to substitute for failed system
27
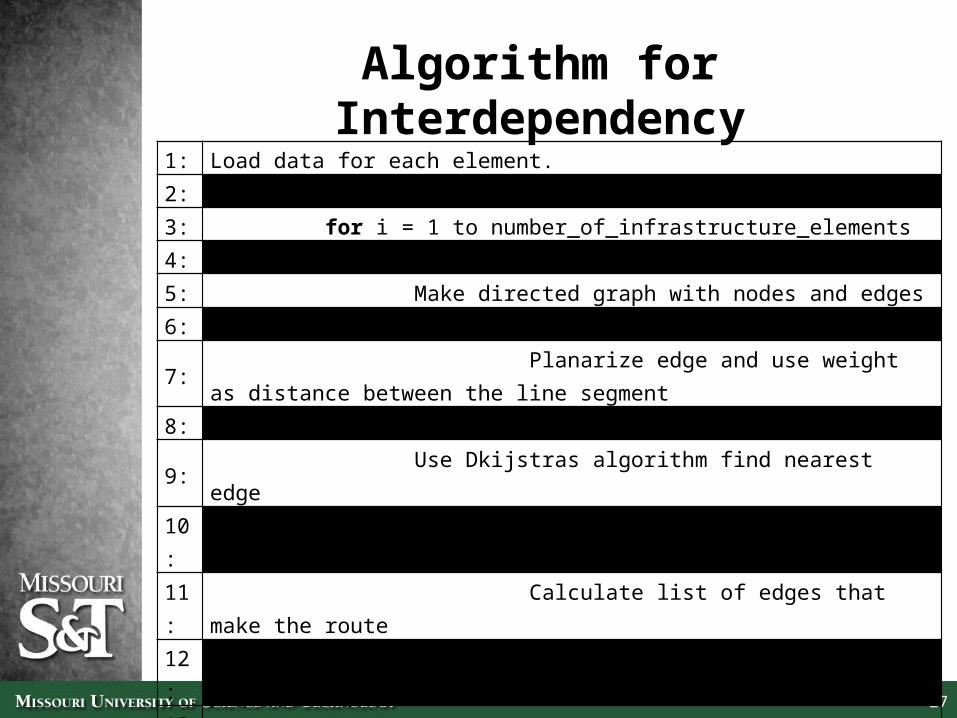
Algorithm for Interdependency1: Load data for each element.2: while data exists do 3: for i = 1 to number_of_infrastructure_elements4: Select one element5: Make directed graph with nodes and edges6: while intersection do
7: Planarize edge and use weight as distance between the line segment
8: end while9: Use Dkijstras algorithm find nearest edge10: while not reached end point of agents destination do11: Calculate list of edges that make the route12: for j = 1 to number_of_coordinates_to_pass13: Map according to rules14: end for 15: end while 11: Update database10: end for11: end while
28
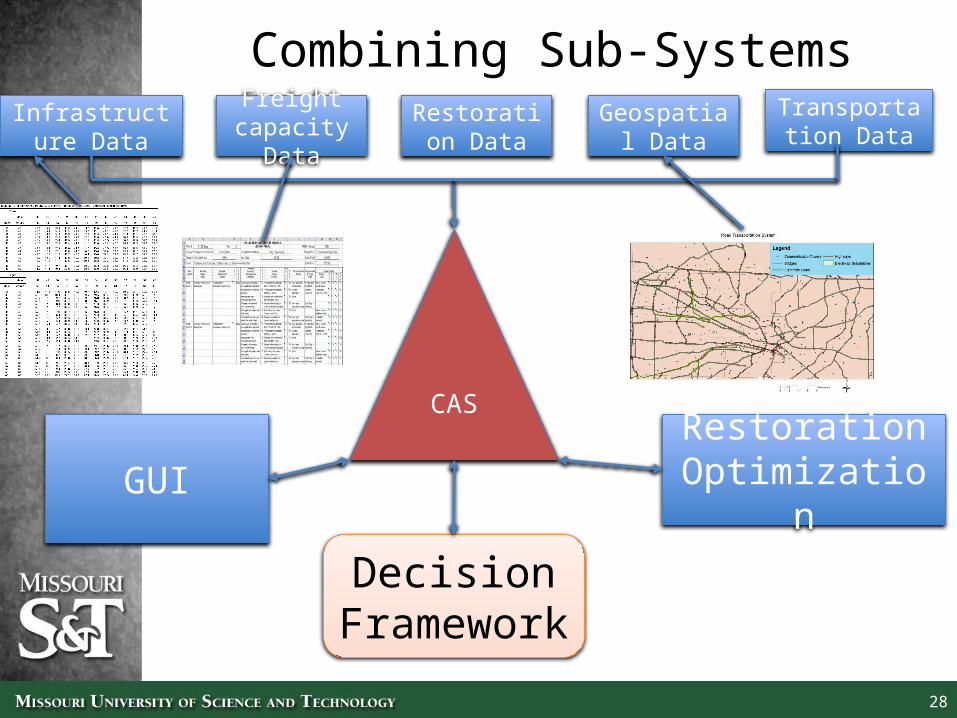
Combining Sub-SystemsGeospatial
DataFreight
capacity DataRestoration
DataInfrastructure
DataTransportation
Data
GUI
CAS
Restoration Optimization
Decision Framework
Summary
• An inventory of the necessary data is presented along with information on how well these data can be estimated and integrated from public access sources.
• Creating a SCSI model using public data is a daunting task, but is possible.
• ABM can be used for mapping interdependencies and creating simulations.
30
Summary
• Use SCN availability function to estimate the expected economic impact of a given extreme event.
• Restoration management routing decisions during extreme events
• Facility location in terms SCN resiliency• Using resilience as a metric of SCN
reliability during and after extreme events.
31
Summary
• Economic Recovery following extreme events dependent on robustness of supply chain networks.
• SCN highly dependent on geospatial data for facility location but this element is significantly under-designed
• Improving the SCN resilience and scalability after Extreme Events

32
Thank you
• Questions? • For more information contact:
Dr. Suzanna Long, EMSE
Telephone: 1-573-341-7621
Email: [email protected]
33
References• Guha, S., Moss, A., Naor, J., Schieber, B., 1999. Efficient recovery from power outage.
In: Vitter, J., Larmore, L., Leighton, F. (Eds.), Proceedings of the Symposium on Theory
of Computing (STOC). Atlanta, GA, USA
• Ang, C., 2006. Optimized recovery of damaged electrical power grids. Unpublished
master’s thesis, Naval Postgraduate School.
• Xu, N., Guikema, S., Davidson, R., Nozick, L., Cagnan, Z., Vaziri, K., 2007. Optimizing
scheduling of post-earthquake electric power restoration tasks. Earthquake Engineering
and Structural Dynamics 36 (2), 265–284.
• E.E. Lee, J.E. Mitchell, and W.A. Wallace. Restoration of services in interdependent
infrastructure systems: A network flows approach. IEEE Transactions on Systems, Man,
and Cybernetics, Part C: Applications and Reviews, 37(6):1303{1317, 2007.
• J. Gong, E.E. Lee, J.E. Mitchell, and W.A. Wallace. Logic-based multi-objective
optimization for restoration planning. In W. Chaovalitwongse, K.C. Furman, and P.M.
Pardalos, editors, Optimization and Logistics Challenges in the Enterprise, chapter 11.
Springer, 2009.
• Cavdaroglu, B., Hammel, E., Mitchell, J., Sharkey, T., Wallace, W.: Integrating restoration
and scheduling decisions for disrupted interdependent infrastructure systems. Annals OR
203(1 ): 279-294 (2013)
• Nurre, S., Cavdaroglu, B., Mitchell, J., Sharkey, T., Wallace, W.: Restoring infrastructure
systems: An integrated network design and scheduling (INDS) problem. European
Journal of Operational Research 223(3): 794-806 (2012)