Embed Size (px)
Citation preview

Multi-objective optimization of a nearly zero-energy building based on thermal and visual discomfort minimization using a non-dominated
sorting genetic algorithm (NSGA-II)
Salvatore Carlucci 1,*, Giulio Cattarin 2, Francesco Causone 2, and Lorenzo Pagliano 2
1 NTNU Norwegian University of Science and Technology, Department of Civil and Transport Engineering, Trondheim, Norway 2 eERG, end-use Efficiency Research Group, Department of Energy, Politecnico di Milano, Milano, Italy * Corresponding author. Tel.: +47 735 94634. E-mail address: [email protected] (S. Carlucci).
Table of contents
1 Introduction ................................................................................................................................................................................................ 3 2 Background ................................................................................................................................................................................................ 4
2.1 Optimization guided by thermal or visual comfort objectives ........................................................................................................... 4 2.2 Thermal comfort assessment in buildings .......................................................................................................................................... 5 2.3 Visual comfort assessment in buildings ............................................................................................................................................. 6
2.3.1 Useful daylight illuminance ...................................................................................................................................................... 6 2.3.2 Discomfort glare index ............................................................................................................................................................. 7
3 Formulation of the optimization problem ................................................................................................................................................... 7 3.1 Selection of design variables and alternatives .................................................................................................................................... 8 3.2 Objective functions and constraints ................................................................................................................................................... 8 3.3 Optimization strategy and algorithm .................................................................................................................................................. 9
4 Description of the building model ............................................................................................................................................................ 10 4.1 Location and geometrical description of the building ...................................................................................................................... 10 4.2 Selection and set-up of the whole building simulation engine ......................................................................................................... 11
4.2.1 Solar distribution method and choice of solar shading devices .............................................................................................. 11 4.2.2 Daylighting models ................................................................................................................................................................. 12 4.2.3 Availability of visual comfort indices ...................................................................................................................................... 12
5 Results and discussions ............................................................................................................................................................................ 13 5.1 Thermal comfort performance ......................................................................................................................................................... 14 5.2 Visual comfort performance ............................................................................................................................................................ 15 5.3 Winter performance ......................................................................................................................................................................... 16 5.4 Summer performance ...................................................................................................................................................................... 17 5.5 Pareto front identified by the genetic algorithm ............................................................................................................................... 18
6 Conclusions and steps forward ................................................................................................................................................................. 20
Keywords
Simulation-based optimization; Zero energy buildings; Genetic algorithm; NSGA-II; Multi-objective optimization; Thermal comfort; Visual
comfort; LPD; DGI; UDI.
Acronyms
ACR Air change rate
ALD ASHRAE Likelihood of Dissatisfied
ANSI American National Standards Institute
ASHRAE American society of heating, refrigerating, and air-conditioning engineers
BCVTB Building controls virtual test bed
CO2 Carbon dioxide
DGP Discomfort glare probability
DGI Discomfort glare index
EN European norm
EU European Union
HVAC Heating, ventilation and air conditioning
IEA International Energy Agency
1

JGAP Java genetic algorithms package
LBNL Lawrence Berkeley National Laboratory
LD Likelihood of dissatisfied
LPD Long-term percentage of dissatisfied
NE Northeast
NSGA-II Non-dominated sorting genetic algorithm
NW Northwest
nZEB Nearly zero-energy building
PCM Phase changing material
PID Proportional, integral and derivative (controller)
PMV Predicted mean vote
PPD Predicted percentage of dissatisfied
SE Southeast
SHC Solar Heating and Cooling
SW Southwest
UDI Useful daylight illuminance
2

Abstract
Multi-objective optimization methods provide a valid support to buildings’ design. They aim at identifying the
most promising building variants on the basis of diverse and potentially contrasting needs. However, optimization
has been mainly used to optimize the energy performance of buildings, giving secondary importance to thermal
comfort and usually neglecting visual comfort and the indoor air quality.
The present study addresses the design of a detached net zero-energy house located in Southern Italy to minimize
thermal and visual discomfort. The optimization problem admits four objective functions (thermal discomfort
during winter and summer and visual discomfort due to glare and an inappropriate quantity of daylight) and uses
the non-dominated sorting genetic algorithm, implemented in the GenOpt optimization engine through the Java
genetic algorithms package, to instruct the EnergyPlus simulation engine.
The simulation outcome is a four-dimensional solution set. The building variants of the Pareto frontier adopt
diverse and non-intuitive design alternatives. To derive good design practices, two-dimensional projections of the
solution set were also analyzed. Finally, in cases of complex optimization problems with many objective
functions, optimization techniques are recommended to effectively explore the large number of available building
variants in a relatively short time and, hence, identify viable non-intuitive solutions.
1 Introduction
Building energy efficiency turns out to be a key step in order to reduce the environmental footprint, control rising
energy costs, and increase the value and competitiveness of buildings. For these reasons, energy efficiency in
buildings has become a prime objective for energy policies and, at the same time, a source of benefits for
developers and investors [1]. In the European Union (EU), the recast version of the Energy performance of 5 buildings Directive (2010/31/EU) [2] is the main policy instrument that is fostering the introduction of high
performance buildings with very low energy consumption. The Directive states that the new buildings occupied or
owned by public authorities and all new buildings shall be nearly zero-energy buildings (nZEB) respectively after
31/12/2018 and after 31/12/2020 [2]. An nZEB is “a building that has a very high energy performance […]. The
nearly zero or very low amount of energy required should be covered to a very significant extent by energy from 10 renewable sources, including energy from renewable sources produced on-site or nearby” [2]. First attempts to
meet this building concept have been based on the idea of minimizing at first primary energy for space heating
and cooling (without detailed discussion about thermal comfort) and for lighting (typically in offices), then, of
covering residual energy by on-site energy production from renewable sources [3]; thus reducing the net primary
energy use to zero over a given time frame chosen for the balance. An analysis commissioned by Directorate-15 General for Energy of European Union concluded that the net primary energy use calculated over a year is
insufficient to describe adequately the performance of nZEBs. The study proposes that the primary energy balance
should hence be calculated on smaller time intervals and additional indexes should to be used in order to
quantitatively assess: (i) the thermal quality of the building fabric and of ventilation heat recovery, (ii) the
potentially adverse impact on the energy grids of a building concept which relies on the grid as a daily and inter-20 seasonal virtual storage, and (iii) the level of thermal comfort achieved by the building over the entire year [4].
In this paper, we propose a rational building design process towards nZEB that evolves from a mere minimization
of energy consumptions to a more complex, multivariable problem, including the evaluation of thermal and visual
3

comfort as a central topic. The needs of the occupants, which should always be considered fundamental in the
design phase, can be expressed by means of quantitative comfort criteria and have a strong influence on energy 25 demand. However, implications may be multiple, possibly increasing the complexity of the analysis. For example,
the European standard EN 15251 specifies different aspects of comfort that should be addressed, i.e. thermal and
visual comfort, indoor air quality and acoustics [5]. Since those aspects are interconnected, the design process has
to account for very diverse requirements that sometimes may even conflict with each other.
In this scenario, optimization techniques coupled with building performance simulation tools may effectively 30 support designers in identifying the most suitable set of technical solutions, in order to guarantee at the same time
a comfortable indoor environment and a minimum energy use. The idea behind the integrated design procedure
presented in this paper is to focus on the problem space consisting of a large number of available building variants
concerning the building envelope and passive strategies, and to search for the ones that minimize four objective
functions: two representing winter and summer thermal discomfort and two representing visual discomfort due to 35 glare and to a non-optimal quantity of light. This procedure is general and can be applied to both free-running and
mechanically conditioned buildings.
2 Background
Optimization techniques driven by thermal comfort indicators have already been used for optimizing the operation
and sizing of building systems’ components [6-8]. The present study goes further, exploring the possibility to 40 determine optimal building variants – specified by a set of design variables – that minimize both thermal and
visual discomfort.
In order to devise a reliable optimization procedure, the first step consists in identifying proper metrics for
assessing thermal and visual discomfort in a building. To this aim, we present background sections about (i)
optimization techniques guided by comfort objectives, (ii) a selection of metrics considered reliable for assessing 45 thermal discomfort according to the adaptive thermal comfort models [9, 10] and to the Fanger’s static thermal
comfort model [11] and (iii) a selection of visual comfort metrics with impact on the design choices of a building
envelope.
2.1 Optimization guided by thermal or visual comfort objectives
Studies reported so far have mainly addressed the optimization of energy performance of the building envelope 50 and systems, giving secondary importance to thermal comfort and usually neglecting visual comfort and indoor air
quality [12]. In addition, even when comfort issues are tackled, the large variety of metrics used often hinders the
possibility of a direct comparison of outcomes.
Regarding thermal comfort optimization, most researchers refer exclusively to the Fanger model [11] that assesses
thermal comfort conditions by means of two correlated indices: the Predicted mean vote (PMV) and the Predicted 55 percentage of dissatisfied (PPD). A few analyses use metrics based on one of the two available adaptive comfort
models, the EN version [5, 9] and the ASHRAE one [10, 13]. Finally, other works adopt simpler metrics that
assess thermal discomfort just counting the number of hours, or the percentage of hours, when indoor conditions
exceed a given fixed set-point temperature. As regards visual comfort optimization, most researchers only
consider the illuminance value in the occupancy area (usually at the center of the room), while only a few works 60 adopt more complex metrics or tackle uniformity of light distribution and glare risk.
4

Optimization techniques have considerably evolved in the last years: while the first research works adopted
scalarized approaches that require the minimization of a utility function (e.g., a weighted sum method or a
weighted exponential sum method), more recently research has shifted to multi-objective optimization, with a
strong preference for genetic algorithms. 65 For in-depth analyses, the reader may refer to the reviews conducted by Attia, Hamdy, O’Brien and Carlucci [12]
on optimization techniques and tools coupled to building performance simulation software and by Machairas,
Tsangrassoulis and Axarli [14] on algorithms used for optimizing building design.
2.2 Thermal comfort assessment in buildings
In the last decade, a number of methods and indices have been introduced in the scientific literature and some 70 standards for predicting the likelihood of long-term thermal discomfort in buildings. These metrics are useful tools
for defining objective functions of an optimization problem, although the choice of the long-term thermal
discomfort index has a strong impact on the assessment of the overall thermal condition in a building [15].
Many methods suggest to estimate thermal discomfort calculating the number of occupied hours or the percentage
of the occupation time when uncomfortable conditions are recorded, or cumulate the number of degree of 75 exceedance of a given thermal comfort temperature [16]. Thus, these methods do not accurately reflect the
predicted thermal response of a typical individual based on a subjacent comfort theory, rather they are ad hoc
analytical constructions, which give a very rough estimate of the occurrence and entity of thermal discomfort.
In order to overcome this limit and on the basis of the considerations developed in [15-17], the proposed
optimization adopts the Long-term percentage of dissatisfied (LPD) index [17]. This long-term thermal discomfort 80 index quantifies predicted thermal discomfort over a calculation period, by a weighted average of discomfort over
the thermal zones of a given building and over the time in a given calculation period:
(1)
where t is the counter for the time step of the calculation period, T is the last progressive time step of the
calculation period, z is the counter for the zones of a building, Z is the total number of the zones, pz,t is the zone 85 occupation rate at a certain time step, LDz,t is the Likelihood of dissatisfied inside a certain zone at a certain time
step and ht is the duration of a calculation time step (e.g., one hour).
The Likelihood of dissatisfied (LD) is an analytical function that estimates “the severity of the deviations from a
theoretical thermal comfort objective, given certain outdoor and indoor conditions at specified time and space
location” [17]. Since the theoretical thermal comfort objective depends on the reference comfort model, three 90 formulations of LD are considered:
1) for the EN adaptive thermal comfort model, the LD index corresponds to the so-called Overheating risk
proposed by Nicol, Hacker, Spires and Davies [18]
(2)
where ∆θop is the absolute value of the difference between the indoor operative temperature and the optimal 95 comfort temperature calculated accordingly to the European adaptive thermal comfort model.
2) for the ASHRAE adaptive thermal comfort model, we use the so-called ASHRAE likelihood of dissatisfied
(ALD) developed by Carlucci [17]
5

(3)
where ∆θop is the absolute value of the difference between the indoor operative temperature and the optimal 100 comfort temperature calculated accordingly to the ASHRAE adaptive model. It is a continuous function obtained
by the author using the statistical analysis of the comfort surveys in the ASHRAE RP-884 database [19], and it
overcomes the main problems arising when using the simplified and rough functions cited above.
3) for the Fanger thermal comfort model, the analytical indicator is PPD, which is directly computable from
PMV [11] 105
(4)
LPD can be, therefore, used for optimizing a building in free-running mode and in mechanically conditioned
mode just choosing the appropriate LD index among the three options above. According to [17], LPD in the
ASHRAE adaptive version and in the Fanger version have a similar ranking capability of indoor thermal
discomfort therefore these two versions should provide similar optimal building variants in an optimization run. 110 The choice of these two indexes hence allows avoiding discontinuities in the two-step procedure proposed by EN
15251, discontinuities which would occur with a different choice of the indexes.
LD and LPD are not direct outputs of any present dynamic software hence it is necessary to add tailored
programming codes in a building performance simulation tool in order to have available these outputs to be fed
into the optimization algorithm. Additional algorithms can be added to EnergyPlus by means of the EnergyPlus 115 runtime language and this is one of the reasons for its use in this analysis.
2.3 Visual comfort assessment in buildings
Visual comfort is defined as “a subjective condition of visual well-being induced by the visual environment” [20]
and depends on the physiology of the human eye, the amount of light and its distribution in a space, and the
spectral emission of the light source. Visual comfort has been commonly studied by evaluating four aspects: the 120 amount of light, the uniformity of light in a space, the risk of glare for occupants and the quality of artificial light
sources in rendering colors. A comprehensive review about visual discomfort indices discussing these four aspects
is presented in [21].
The aim of the presented optimization process consists in identifying optimal building envelope features and
controls for passive strategies, thus focusing on the exploitation of daylight while not considering artificial light 125 sources. In particular, the amount of light and the risk of glare for occupants are adopted as objective functions.
Useful daylight illuminance (UDI) is used for assessing the amount of light available in a given space and
Discomfort glare index (DGI) is used for assessing the risk of discomfort glare of occupants in a space, also taking
into account the present features of the simulation software adopted for the dynamic energy and lighting
simulation, which are discussed in the following section. 130
2.3.1 Useful daylight illuminance
Useful daylight illuminance (UDI) is defined as the fraction of time in a year when indoor horizontal illuminance
due to daylight at a given point falls within a selected comfort range. A lower and an upper illuminance limit
values are proposed in order to split the analyzed period into three bins, representing the percentage of time with
6

(i) an oversupply of daylight (UDIOverlit), (ii) an appropriate illuminance level (UDIPreferred) and (iii) an insufficient 135 availability of daylight (UDIUnderlit).
(5)
UDI is a long-term, local and two-tailed index that measures the quantity of natural light. According to [22], UDI
informs not only on the frequency of useful levels of daylight illuminance at a point of a given measurement
surface, but also on the frequency of occurrence of excessive levels of daylight that might cause occupant 140 discomfort, e.g., glare. The limits of use of UDI regard the lack of agreement on illuminance limit values [21] and
the risk of an unmanageable amount of information, since UDI provides three values for each point of the space in
which it is calculated.
2.3.2 Discomfort glare index
Discomfort glare index (DGI) aims at predicting glare from large sources, such as windows, described by their 145 luminance Lwin. It was introduced in [23] and has been later modified in [24], as follows:
(6)
where the subscript s is used for quantities depending on the observer position and i for quantities depending on
the light sources; ω is the solid angle subtending the source from the point of view of the observer; P is the Guth
position index, expressing the dependence of perceived discomfort glare on the position of the source i with 150 respect to the observer; Ls,i is the luminance in the direction connecting the observer with each source and Lb is
the background luminance that, for windows, is the average luminance of the wall excluding the window. DGI
values are associated with several levels of discomfort glare. A value of DGI equal to 22 is considered as a
reasonable acceptability upper threshold [24, 25]. DGI is affected by some limitations: (i) it refers only to uniform
light sources, not considering direct sunlight and non-uniform sources, for which the glare risk depends on the 155 angle formed with the line of sight [26]; (ii) DGI is not reliable when the source occupies approximately the
whole field of view and when the background luminance equals the source luminance [27]; (iii) the studies by
Bellia, Cesarano, Iuliano and Spada [27] and Boubekri and Boyer [28] report that the predictions by the DGI
underestimate the perceived glare in surveys conducted in real sky conditions.
3 Formulation of the optimization problem 160
The energy design of a building is a multivariable problem, leading to a large number of alternative solutions that
cannot be all simulated in a time span compatible with the design phase of a building.
7

In order to explore a very large number of building variants in a relatively short time, the adopted methodology
consists in (i) identifying the design parameters to be optimized, (ii) defining the options or the range of variation
for each design parameter, (iii) running the dynamic energy simulations of the building in free-running mode via a 165 dynamic simulation engine, (iv) driving the selection of the design parameters via an optimization engine.
Based on the experience developed in previous scalarized single-objective optimization [29, 30], the aim of this
optimization is to maximize thermal and visual comfort considering the problem space consisting of a large
number of building envelope variants. In the present work, EnergyPlus dynamic building simulation software is
coupled with the optimization engine GenOpt. In order to set up the optimization run, the steps are (i) creating the 170 input file of the building model in EnergyPlus; (ii) indicating the design variables, their variation ranges and the
optimization algorithm in the command file in GenOpt; (iii) searching the variants which minimize discomfort,
considering four objective functions and one constraint on indoor air quality.
3.1 Selection of design variables and alternatives
Since the optimization problem considers the building operating in free-running mode, the design variables are 175 selected among those that only influence the passive devices and the passive strategies (Table A-1). Each of the
selected physical quantities is allowed to vary over three values labeled with: ‘-‘ for a low performance, ‘o’ for a
medium performance, and ‘+’ for a high performance.
For the above-described optimization problem, the problem space consists of 17 006 112 possible solutions,
which clearly highlights the need for using an appropriate optimization process able to guide the simulation 180 towards the optimal solution without exploring explicitly all the variants that form the problem space.
3.2 Objective functions and constraints
Objective functions are based on the following indices: LPDS and LPDW [17] for thermal comfort, a modification
of the original UDI [22] and DGI [24] for visual comfort. The thermal objective functions are calculated
averaging over all the building zones, while the visual ones are computed as the sum over the two building zones 185 mainly occupied during daytime, i.e. the combined kitchen/dining room and the study room.
The optimization problem can be mathematically expressed as:
(7)
where LPDS (x) is the Long-term percentage of dissatisfied (LPD) calculated for the warm period (or summer);
LPDW(x) is the Long-term percentage of dissatisfied (LPD) calculated for the cold period (or winter); 190 UDIDiscomf(x) is the complement to one of the UDIPreferred; FDGI>22(x) is the percentage of time exceeding the
discomfort glare rate’s (DGI) threshold of 22; ACR(x) is the minimum air change rate, in h-1, set in all the
considered building variants.
The calculation of LPD is not originally available in EnergyPlus, but it can be implemented by programming in 195 the EnergyPlus runtime language. The Useful daylight illuminance (UDI), as defined in Nabil and Mardaljevic
[22], was used to assess the amount of indoor daylight. This metric splits the illuminance into three range of
values (UDIUnderlit, UDIPreferred, UDIOverlit); since the interest is in minimizing discomfort, the objective function is
calculated by summing UDIUnderlit and UDIOverlit in a term that we label UDIDiscomf.
8

In order to evaluate the glare risk over a certain time span, the percentage of time exceeding the DGI threshold of 200 22 was used.
Finally, indoor air quality requirements were satisfied by adopting in the simulations a minimum ACR of 0.6 h-1.
This recommended design ventilation rate was calculated according to EN 15251 assuming to meet the
requirements of Category II that represents a “Normal level of expectation and should be used for new buildings
and renovations” [5]. 205
3.3 Optimization strategy and algorithm
The energy simulations of the building were run with the software EnergyPlus version 6.0.0.23 [31]. Optimization
was run with the optimization engine GenOpt version 3.1 [32]. GenOpt is not provided of a multi-objective
optimization algorithm; therefore, the Java Genetic Algorithms Package (JGAP) was implemented in order to run
a multi-objective optimization using the non-dominated sorting genetic algorithm (NSGA-II). 210 JGAP is a mature and robust programming component that provides efficient chromosomes selector, mutation,
and crossover. Main features of a GA such as population size, number of generation, crossover probability and
mutation probability are quite tricky to be defined since they depend on the grade of nonlinearity of the
optimization problem, the typology of input variable (continuous or discrete), n the dimension of the problem
space, and a trade-off with the available computational capacity has to be met. Therefore, in order to tune suitably 215 NSGA-II, 68 papers dealing with optimization of building envelope and systems (reviewed in [12]) have been
analyzed with the statistical software package IBM SPSS Statistics, release 21, and represented with boxplots
(Figure 1).
Figure 1: Boxplot of main settings of the GA used in 68 papers dealing with optimization of building envelope and systems.
On the base of the literature analysis and to meet a trade-off with available computational capacity, for the 220 analysis reported in this paper, the following parameters have been set in NSGA-II: population size = 24,
maximum number of generations = 25, crossover probability = 0.9, and mutation probability = 0.0355.
The computer used to run the simulation was an Intel Core i7 (4 cores, 8 threads, 2.2 GHz) with 8 GB of RAM
and required about 13 hours to complete the optimization run. Less than 24 hours of computation time may be
9
considered as an adequate trade-off between accuracy and time availability for optimization in the pre-design 225 phase.
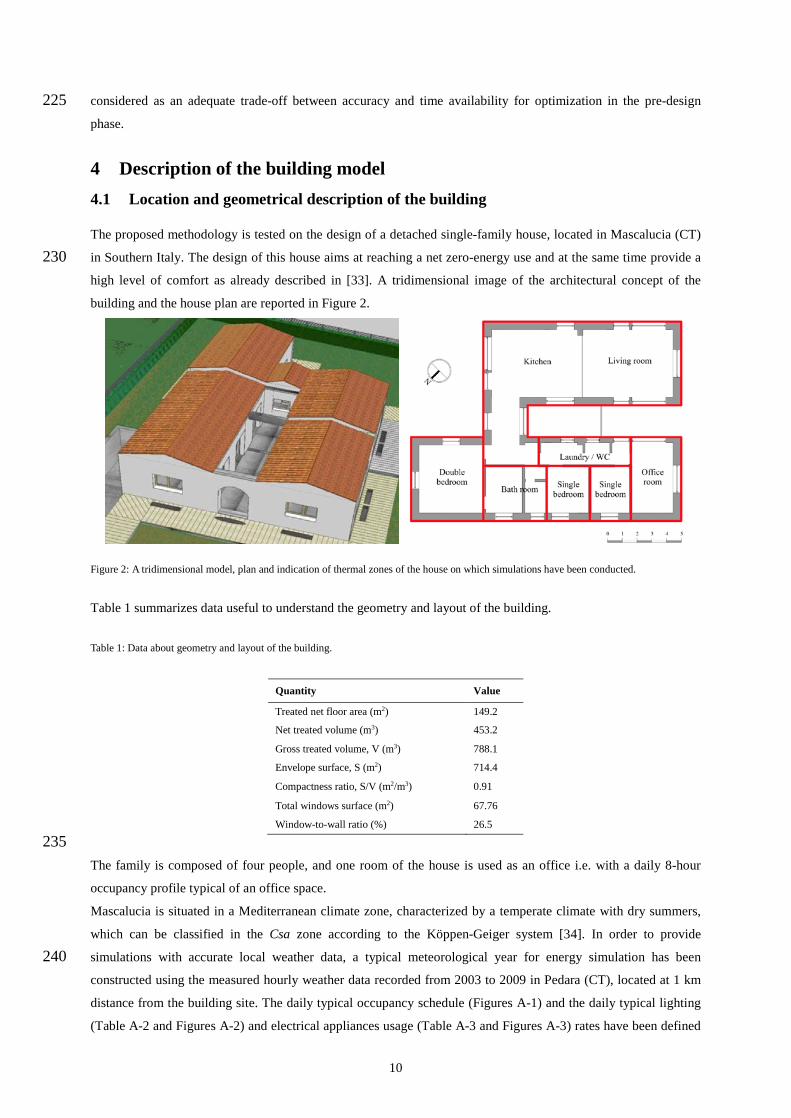
4 Description of the building model 4.1 Location and geometrical description of the building
The proposed methodology is tested on the design of a detached single-family house, located in Mascalucia (CT)
in Southern Italy. The design of this house aims at reaching a net zero-energy use and at the same time provide a 230 high level of comfort as already described in [33]. A tridimensional image of the architectural concept of the
building and the house plan are reported in Figure 2.
Figure 2: A tridimensional model, plan and indication of thermal zones of the house on which simulations have been conducted.
Table 1 summarizes data useful to understand the geometry and layout of the building.
Table 1: Data about geometry and layout of the building.
Quantity Value
Treated net floor area (m2) 149.2
Net treated volume (m3) 453.2
Gross treated volume, V (m3) 788.1
Envelope surface, S (m2) 714.4
Compactness ratio, S/V (m2/m3) 0.91
Total windows surface (m2) 67.76
Window-to-wall ratio (%) 26.5
235 The family is composed of four people, and one room of the house is used as an office i.e. with a daily 8-hour
occupancy profile typical of an office space.
Mascalucia is situated in a Mediterranean climate zone, characterized by a temperate climate with dry summers,
which can be classified in the Csa zone according to the Köppen-Geiger system [34]. In order to provide
simulations with accurate local weather data, a typical meteorological year for energy simulation has been 240 constructed using the measured hourly weather data recorded from 2003 to 2009 in Pedara (CT), located at 1 km
distance from the building site. The daily typical occupancy schedule (Figures A-1) and the daily typical lighting
(Table A-2 and Figures A-2) and electrical appliances usage (Table A-3 and Figures A-3) rates have been defined
10

interviewing the owner, considering the intended use of spaces, and making use of a database of measurements on
electric loads by the eERG [35]. A mechanical ventilation system with a high-efficiency heat recovery unit has 245 been included in the design, in order to ensure indoor air quality (estimated ACR of 0.6 h-1 according to EN
15251) and at the same time to reduce energy use.
4.2 Selection and set-up of the whole building simulation engine
The dynamic energy simulation of the building was performed using the software EnergyPlus [31], version
6.0.0.23. Each released version of EnergyPlus undergoes two major types of validation tests [36]: analytical tests, 250 according to ASHRAE Research Projects 865 and 1052, and comparative tests, according to ANSI/ASHRAE 140
[37] and IEA SHC Task34/Annex43 BESTest method. Within the capability of EnergyPlus, the building model
was set up in order to reproduce in detail the geometry of the building and the algorithms chosen to represent
physical phenomena were chosen in order to achieve a balance between accuracy and a reasonable computational
time of a single simulation run. 255 In detail, the update frequency for calculating sun paths was set to 20 days. The heat conduction through the
opaque envelope was calculated via the transfer function method with a 15-minute time step [38]. The natural
convection heat exchange near external and internal surfaces was calculated via the adaptive convection algorithm
[39], to meet the local conditions of each surface of the model. The initialization period of simulation was set at
25 days - instead of using the default value of seven days - to reduce the uncertainties connected to the thermal 260 initialization of the numerical model. The voluntary ventilation and involuntary air infiltration were calculated
with the AirflowNetwork module - instead of using the much simpler scheduled approach - to better calculate the
contribution of natural ventilation.
Unfortunately, tools for the dynamic analysis of the energy performance of a building inherently compute
simplified visual comfort metrics, such as illuminance maps, but do not calculate complex visual comfort metrics. 265 Moreover, some visual comfort metrics require complex geometrical calculations that are basically carried out by
specialized software such as Radiant. Therefore, two options are possible for users who want to run simulations
that combine thermal and visual comfort issues: running a co-simulation of the same input model in a building
performance simulation tool specialized in thermal and energy calculations and in another specialized in lighting
calculations [40] or to adopt a dynamic energy simulation software that provides simple visual comfort metrics. In 270 the present paper, we choose to adopt dynamic energy simulation software that also provides a few visual metrics
because this approach currently seems closer to be adopted in the professional design practice. The energy
simulations of the building have been run with the software EnergyPlus v. 6.0.0.23 [31]. The detail in modeling
the physical phenomena of the individual energy simulation was adapted to the approach provided by EnergyPlus,
in order to limit the computational time of the optimization. The main approximations and limitations are 275 discussed here.
4.2.1 Solar distribution method and choice of solar shading devices
All the direct solar radiation entering the zone is assumed to fall on the floor, where it is absorbed according to the
solar absorbance of its finishing layer. The direct radiation reflected by the floor is added to the transmitted
diffuse radiation, and they are both assumed to be uniformly distributed on all the interior surfaces. 280
11

In the present study, movable external blinds are selected as solar shading devices among those available in
EnergyPlus, since they allow to control solar radiation with precision and flexibility.
4.2.2 Daylighting models
EnergyPlus offers two approaches to daylighting: the Daylight detailed method and the DElight method. They can
be employed at the same time, but not in the same zone of the building model. The main differences between the 285 two methods are: (i) DElight is capable to evaluate advanced fenestration systems, including geometrically
complex shading systems and optically complex glazing (e.g., prismatic or holographic glass) while Daylight
detailed cannot; (ii) DElight calculates the total contribution from all apertures to each reference point, while the
Daylight detailed method calculates initial illuminance values at reference points for each pair of reference point
and aperture (windows and skylights) in the zone; (iii) DElight uses a radiosity method for assessing the effect of 290 inter-reflection of the initial interior illuminance/luminance between interior reflecting surfaces (it subdivides each
reflecting surface into nodal patches and uses view factors between each pair of nodal patch in an iterative
calculation of the total contribution of reflected light within the zone), while the Daylight detailed method uses the
split-flux method and the former “definitely has an edge over the Split-flux method when it comes to accuracy”
[41]; (iv) DElight allows to arbitrarily allocate up to 100 reference points in each zone, while Daylight detailed 295 provides just a maximum of two reference points; (v) DElight does not support dynamic control of fenestration
shading, while Daylight detailed can; (vi) DElight is unable to assess glare while Daylight detailed computes DGI
at each of the two reference points.
In the present work, the Daylight detailed method is adopted (i) thanks to its capability to dynamically control
solar shading devices whether given thermal and/or visual conditions are exceeded and (ii) since, at the same time, 300 it can assess glare through DGI (even if this index is affected by the limitations discussed in the section 2.3.2) and
a DGI threshold can be set to trigger a change in the position/orientation of solar shading devices.
4.2.3 Availability of visual comfort indices
For the scope of the present work two main aspects of visual comfort were assessed: amount of light and glare.
Among the many indices assessing the amount of light, the Useful daylight illuminance (UDI), as defined in [22] 305 has two main features that make it of particular interest: (i) it is a long-term index i.e. able to summarize hourly
values in a single value and (ii) it accounts for discomfort caused by a too high or low illuminance level. The
calculation of UDI is not currently implemented in EnergyPlus, however, since it is based on horizontal daylight
illuminance, its calculation is possible by adding a dedicated custom routine written in the EnergyPlus runtime
language. This routine can be explained as follows: at every time step, if the zone is occupied, horizontal daylight 310 illuminance is evaluated at a given point in that zone. The illuminance range is then split into three bins (underlit,
comfort lit, overlit) and a variable is defined for each of them (UDIUnderlit, UDIComflit, UDIOverlit). Thus, at every
simulation time-step, the appropriate variable is increased of a unit depending on the value of illuminance, while a
counter sums all occupied time steps. The three cumulated UDI values are obtained dividing each of the
cumulated variables by the cumulated value of the counter and they can be finally read as an output at the end of 315 the simulation period. Since the interest is in minimizing visual discomfort, the objective function is calculated by
summing UDIUnderlit and UDIOverlit in a variable called UDIDiscomflit. It should be noted that, due to the limitations
12

of the Daylight Detailed method, the evaluation was possible just at one point in each zone, thus neglecting
distribution aspects and causing results to be dependent on the chosen position.
Concerning glare risk, the decision was taken to use the DGI in this optimization because it is directly calculated 320 by EnergyPlus, giving a measure of the potential discomfort glare at every time step. Then, in order to derive a
long-term variable on a set time period, the percentage of time exceeding the DGI threshold was used. An
advantage of this choice is that minimizing the time exceeding the DGI limit should lead to the design of a robust
building that does not rely solely on the shading strategy. For this reason, all shading control strategies based on
glare were deployed in the simulations. 325
5 Results and discussions
The results of a multi-objective simulation are represented graphically since the visualization of the Pareto front
makes the interpretation of the results more immediate. However, in the present work the four-objective
optimization generates a four-dimensional (4D) problem space that cannot be represented in a three-dimensional
graph. When projecting the 4D-Pareto front on a bi-dimensional (2D) graph, points belonging to the front may 330 (incorrectly) appear to be dominated variants. Taking into account this risk, the present analysis compares two
objective functions at a time, allowing to show how objectives interact with each other, i.e. whether they are
synergic or antagonist (Figure 3). Each of the 2D-graphs provides information about a specific behavior that
allows discussing various aspects of the optimization run, i.e. (i) thermal comfort performance, (ii) visual comfort
performance, (iii) summer behavior, and (iv) winter behavior. 335
Figure 3: Bi-dimensional projections of the analyzed 4D-problem space (‘w’ stays for winter; ‘s’ stays for summer, ‘g’ stays for glare; ‘a’ stays
for amount of light)
13

5.1 Thermal comfort performance
The 2D-projection of the simulated variants in the 4D-problem space on the plane of long-term thermal
discomfort indices (Figure 4) assumes a triangular shape pointing to the origin of the 2D-plan. In essence, the
graph shows that the variants that minimize LPDS have also small values of LPDW. This means that the two 340 objectives are not antagonist, and the building variants that are closer to the origin of the axes are optimized with
respect to both winter and summer thermal conditions.
Figure 4: Values of winter (LPDW) and summer (LPDS) long-term thermal discomfort indexes of all simulated variants. The dashed lines
enclose the group of analyzed building variants.
Although the traditional design procedures often evaluate separately the building performance in winter and
summer time, sometimes considering the two situations antagonist, this thermal comfort based design procedure 345 shows that the two optimization criteria are not antagonistic and lead to similar optimal variants, at least in the
case study here analyzed. In order to get design insights, all building variants with both LPDS and LPDW lower
than 10 % are analyzed and outcome is reported in Figure 5.
14

Figure 5: Frequency analysis of design options for each design variable in those building variants with both LPDS and LPDW lower than 10 %.
They show rather homogeneous design alternatives, which rely on highly insulated and medium weighted walls 350 and roofs (100 % of cases), less insulated floors, glazing units with a low thermal transmittance and a low solar
factor, and the essential adoption of both a control strategy of solar shading devices – optimized with respect to
the solar irradiance incident on each window – and a control strategy that exploits night cooling in summertime
whenever outdoor air temperature is lower than the indoor one.
5.2 Visual comfort performance 355
The visual comfort conditions in an indoor environment depend on the quantity and quality of light available. The
quantity of daylighting available in an indoor environment varies with the optical properties of glazing, the
extension and orientation of windows and the typology and operation of solar shading devices. However, these
design variables affect also the thermal performance of a building and hence the control strategies to be
implemented. As a consequence, two different building variants presenting the same glazing, but adopting 360 different options for the opaque envelope and the control strategy for window opening during summer nighttime,
could result in different values of long-term visual discomfort indices such as UDIDiscomf and FDGI>22. The analysis
of the 4D-problem space by mean of a 2D-projection shows that the two visual comfort indices appear markedly
antagonist (Figure 6): the maximization of useful daylight is in contrast with glare avoidance.
365
Figure 6: Glare discomfort index versus Illuminance discomfort index of simulated variants. Variants situated below the dashed line are
15

analyzed in detail below.
However, it has to be considered that the definition of the UDIdiscomf includes both the occurrence of overlit and
underlit conditions. Therefore, the definition of the threshold values for the UDI has an important influence on the
evaluation of the available quantity of light in a given luminous environment. Moreover, the strategy used to
control solar shading devices with the objective to control solar gains (and hence indoor air temperature) in
summer can strongly influence the FDGI>22 and UDIDiscomf. 370 In order to highlight general design good practices, the options for every design variable of building variants
closer to the Pareto front are considered here i.e. those that are located below the dashed line in Figure 7.
Figure 7: Frequency analysis of design options for each design variable in those building variants closer to the Pareto front drawn in Figure 6.
The optimization run shows that the building variants that minimize visual discomfort and those which minimize 375 thermal discomfort are characterized by similar options for the external walls, roof, floor, and control strategy for
solar shading devices, but the former present glazing with lower energy transmittance and higher visible
transmittances, and they require a lower use of the night ventilative cooling.
5.3 Winter performance
The graphs in Figure 7 show the projection of the simulated building variants on the planes constituted by winter 380 thermal discomfort (LPDW), on the y-axis, and respectively visual discomfort due to too much and too little light
(Figure 8, a), and glare (Figure 8, b). The LPDW and the UDIDiscomf can be scaled down to quite low values (range
of 7 ÷ 20 %); instead the FDGI>22 never falls below 25 % and assumes values higher than 60 % when the LPDW
drops below 10 %.
16

385
Figure 8: Variation of discomfort indexes due to amount of light and glare in winter. The analyzed building variants are those below the dashed
lines.
Referring to the best building variants, it seems that those building variants that reduce thermal discomfort during
winter also provide a pleasant luminous indoor environment (amount of light not too high or too low), but are
likely to cause glare to occupants. Although UDI admits an upper threshold intended to predict those conditions
characterized by a too high illuminance level, which can also be cause of glare, the two Figures 8 show that UDI
is characterized by a behavior different with respect to DGI, since is not able to gather the complexity of the glare 390 phenomenon.
In next steps of this optimization work hence one would need to add other variables to describe the possibility to
decouple daylight harvesting from glare occurrence. In the physical world this might be done by introducing e.g.,
internal light diffusing shades and appropriate controls either manual or automated. Another option would be the
adoption of solar screens specifically designed for this aim, e.g., able to achieve different blade angles in the lower 395 and upper part of the blind system; the lower might then be fully closed, while the upper part (above eye level)
angled with the aim to reflect light towards the ceiling. Examples of this more sofisticated blinds and controls are
commercially available.
In such more advanced simulation and optimization work, one would also need to introduce a glare discomfort
index able to deal with more complex geometrical information than possible with DGI. 400
5.4 Summer performance
The outcomes of this specific optimization run show (when analyzing the complete 4-D space) that best optimal
building variants can reach values of LPDS lower than 10 %, UDIDiscomf lower than 20 % and FDGI>22 lower than
30 %, but none of the variants meets these three performances at once. Also in the subset of building variants
optimized with respect to summer, increasing the use of daylight entails an increase of glare occurrences 405 (Figure 9), as it happens in winter. As discussed in the winter performance section, also for summer a next step of
analysis and optimization should include devices able to decouple daylight harvesting and their description in the
simulation algorithms.
17

Figure 9: Variation of discomfort due to amount of light and glare in summer. The analyzed building variants are those below the dashed lines.
5.5 Pareto front identified by the genetic algorithm 410
The 24 variants of the last generation identified by the NSGA-II algorithm during the optimization run belong to
the Pareto front of optimization and can be considered the optimal building variants according to the presented
4D-optimization problem. Table A-4 shows the values of objective functions and the options of design variables.
Each of those variants performs quite differently with respect to the individual objective functions. Each building
variant belonging to the 4D-Pareto front is represented on a radar diagram (Figure 10), reporting on the four axes 415 the values of each objective function.
Figure 10: Comparison of the 24 best building variants identified by the optimization algorithm.
18

Among the best solutions of this optimization problem, the variations of the summer and winter thermal
discomfort are quite limited, while glare and inappropriate amount of illuminance have a large spread. The
distributions of the values achieved by all building variants of the 4D-Pareto front are represented in boxplots and 420 reported in Figure 11.
Figure 11: Boxplot of the values achieved by all building variants of the 4D-Pareto front.
Theoretically, the set of all variants on the Pareto front are solution of the multi-objective optimization problem.
In order to derive design insights, a frequency analysis of the most common options for each design variable has
been performed. However, it does not show a clear trend for any of the design variables considered (Figure 12), in 425 contrast to what happens for single thermal comfort optimization (Section 5.1) or visual comfort optimization
(Section 5.2).
Figure 12: Frequency analysis of design options for each design variable in those building variants belonging to the 4D-Pareto front.
19

This means that, when thermal optimization is coupled with visual optimization, although several optimal building 430 variants can be viable, the optimal option for each building variable are not simple to be identified, rather it is
fundamental to combine them properly. It could be generalized that, for designing buildings optimized with
respect to multiple nonlinear objectives, advanced simulation techniques, such as (mathematical) optimization, are
required to effectively support designers in selecting right building concepts.
6 Conclusions and steps forward 435
The design of high-performance buildings, up to zero-energy buildings is a multivariable problem, including
essential requirements such as energy, visual and thermal comfort performance. Inclusive metrics able to adapt
and synthetize the different issues are still under development, as well as simulation techniques that may provide
comprehensive information to the design team in a reasonable lapse of time.
In the first part of the paper, we summarized some useful visual and thermal comfort indices available in 440 literature, which can be used in a multivariable analysis for a high performance building optimization. An
optimization approach including both thermal and visual comfort has then been discussed showing possibilities
and limitation of an application to a widely adopted open-source simulation tool such as EnergyPlus.
When the building design aims at meeting several goals, i.e. the optimization problem admits many objective
functions simultaneously (as it is generally the case in practical design work), design procedures unsupported by 445 automated optimization tools might find a hard challenge in exploring the entire problem space and converging
towards optimal solutions. Rather, it would be useful to adopt automatized, advanced simulation-based techniques
to explore the vast problem space of available building variants in order to identify the most suitable ones. Multi-
objective optimization techniques are promising candidates to provide a valid support to a complex design
process, helping the designer to identify the most promising building variants and selecting a range of best 450 technical choices, among which to make a final choice. The theoretical basis for multi-objective optimization was
here discussed, showing its possible application to a real multi-objective case study, a single-family nZEB located
in Southern Italy.
The study showed that existing energy simulation tools may be subject to analysis limitations, mostly related to
the accuracy in light distribution models, with respect to other dedicated software such as Radiance and to the 455 availability of the indices discussed in the review. The latter limitation was overcome by coding additional
calculation routines: this was the case of the thermal Long-term percentage of dissatisfied (LDP) and the visual
Useful daylight illuminance (UDI). The evaluation of the UDI was possible just at one point in each zone, thus
neglecting distribution aspects and limiting the results to the chosen position. Within the analysis, most critical
was the evaluation of glare. Since the software does not allow the calculation of physical quantities necessary to 460 calculate the Discomfort glare probability (DGP), the choice was to use the Discomfort glare index (DGI). This
index is already available in EnergyPlus and it is possible to evaluate the long-term effect of glare by means of the
percentage of occupied time exceeding a threshold value (DGILimit = 22).
The studied four-objective optimization problem generated a four-dimensional problem space that cannot be
represented in a three-dimensional space. We therefore decided to compare two objective functions at a time, 465 allowing to show how objectives interact with each other, i.e. whether they were synergic or antagonist. This
approach may be used for similar problems, nevertheless it shows the fundamental role of a consultant to
“translate” optimization results to the final designer/decision maker. In order to overcome this limitation, when
20

some of the indexes are synergic (as in this case the minimizations of summer and winter thermal discomfort), a
possible improvement might be to to set up a new hybrid optimization problem, where the two thermal discomfort 470 objective functions are scalarized in one utility function (e.g., using the exponential weighted sum method) and,
hence, the here discussed 4D-optimization problem, could be reduced to a 3D-optimization problem without
strongly interfering with the selection process, but simplifying the representation of the outcome of the
optimization run and so the identification of general design good practices.
The optimization process can represent a valid tool to be used when dealing with complex buildings design. Since 475 detailed computer simulation programs are increasingly used in the design of buildings and computation power is
constantly growing, an automated procedure exploring a very large number of building variants may now be
accomplished in a relatively short time and hence be compatible with the time scale of the design phases.
Nevertheless presently, in order to proficiently use most of the optimization software, experience and skills are
requested not only in the design and energy field but also in computer language and coding. Finally, multi-480 objective optimization does not aim at finding a unique solution; it could support the designer, or better the design
team, in achieving a pool of variants that present simultaneously relatively good values of all the considered
objective functions. The designer will then be able to evaluate the influence of the main design variables on a
manageable number of good variants rather than facing the overwhelming task of exploring “manually” the entire
problem space, and to make a final informed decision. 485
Acknowledgements
The authors would thank Dr. Vasilis Maheras for the help and effort in setting the optimization engine, Eng.
Carmelo Sapienza and Eng. Marco Pietrobon for the helpful discussions, and Eng. Francesco de Rosa for the help
in running the simulations.
References 490
[1] S. Carlucci, L. Pagliano, M. Pietrobon, Analysis of 85 green buildings within the greenbuildingplus project: A basis for supporting energy efficient investments, Advanced Materials Research, 689 (2013) 49-53.
[2] European Parliament and Council, Energy performance of buildings, in: Directive 2010/31/EU, Official Journal of the European Union, Luxembourg, 2010.
[3] R. Charron, A. Athienitis, Design and Optimization of Net Zero Energy Solar Homes, ASHRAE Transcations, 495 112 (2) (2006) 285-295.
[4] A. Hermelink, S. Schimschar, T. Boermans, L. Pagliano, P. Zangheri, R. Armani, K. Voss, E. Musall, Towards nearly zero-energy buildings: Definition of common principles under the EPBD in, Ecofys, Politecnico di Milano - eERG, University of Wuppertal, 2013, pp. 1-469.
[5] CEN, Indoor Environmental Input Parameters for Design and Assessment of Energy Performance of Buildings 500 Addressing Indoor Air Quality, Thermal Environment, Lighting and Acoustics, in, European Committee for Standardization, Brussels, Belgium, 2007.
[6] A. Mahdavi, Simulation-based control of building systems operation, Build Environ, 36 (2001) 789-796. [7] S.W. Wang, X.Q. Jin, Model-based optimal control of VAV air-conditioning system using genetic algorithm,
Build Environ, 35 (6) (2000) 471-487. 505 [8] W. Huang, H.N. Lam, Using genetic algorithms to optimize controller parameters for HVAC systems, Energ
Buildings, 26 (1997) 277-282. [9] J.F. Nicol, M.A. Humphreys, Adaptive thermal comfort and sustainable thermal standards for buildings, Energ
Buildings, 34 (6) (2002) 563-572. [10] R.J. de Dear, G.S. Brager, Developing an adaptive model of thermal comfort and preference, in: Proceedings 510
of the 1998 ASHRAE Winter Meeting, ASHRAE, San Francisco, CA, USA, 1998, pp. 145-167.
21

[11] P.O. Fanger, Thermal comfort: Analysis and applications in environmental engineering, Danish Technical Press, 1970.
[12] S. Attia, M. Hamdy, W. O’Brien, S. Carlucci, Assessing gaps and needs for integrating building performance optimization tools in net zero energy buildings design, Energ Buildings, 60 (0) (2013) 110-124. 515
[13] ANSI/ASHRAE, Thermal Environmental Conditions for Human Occupancy, in, American Society of Heating, Refrigerating and Air-Conditioning Engineers, Atlanta, USA, 2010.
[14] V. Machairas, A. Tsangrassoulis, K. Axarli, Algorithms for optimization of building design: A review, Renewable and Sustainable Energy Reviews, 31 (2014) 101-112.
[15] S. Carlucci, L. Pagliano, A. Sangalli, Statistical analysis of ranking capability of long-term thermal 520 discomfort indices and their adoption in optimization processes to support building design, Build Environ, 75 (2014) 114-131.
[16] S. Carlucci, L. Pagliano, A review of indices for the long-term evaluation of the general thermal comfort conditions in buildings, Energ Buildings, 53 (2012) 194-205.
[17] S. Carlucci, Thermal Comfort Assessment of Buildings, Springer, London, 2013. 525 [18] J.F. Nicol, J. Hacker, B. Spires, H. Davies, Suggestion for new approach to overheating diagnostics, Building
Research and Information, 37 (4) (2009) 348-357. [19] R.J. de Dear, Global database of thermal comfort field experiments, in: Proceedings of the 1998 ASHRAE
Winter Meeting., ASHRAE, San Francisco, CA, USA, 1998, pp. 1141-1152. [20] EN 12665, Light and lighting - Basic terms and criteria for specifying lighting requirements, in, European 530
Committee for Standardization, Brussels, Belgium, 2011. [21] S. Carlucci, F. Causone, F. De Rosa, L. Pagliano, A review of indices for assessing visual comfort with a
view to their use in optimization processes to support building integrated design, Renewable and Sustainable Energy Reviews, (2015).
[22] A. Nabil, J. Mardaljevic, Useful daylight illuminances: A replacement for daylight factors, Energ Buildings, 535 38 (7) (2006) 905-913.
[23] R.G. Hopkinson, Glare from daylighting in buildings, Applied Ergonomics, 3 (4) (1972) 206-215. [24] P. Chauvel, J. Collins, R. Dogniaux, J. Longmore, Glare from windows: current views of the problem,
Lighting Research and Technology, 14 (1) (1982) 31-46. [25] P. Chaiwiwatworakul, S. Chirarattananon, P. Rakkwamsuk, Application of automated blind for daylighting in 540
tropical region, Energy Conversion and Management, 50 (12) (2009) 2927-2943. [26] C. Waters, R. Mistrick, C. Bernecker, Discomfort Glare from Sources of Non-uniform Luminance, Journal of
the Illuminating Engineering Society, 24 (2) (1995) 73–85. [27] L. Bellia, E. Cesarano, G. Iuliano, G. Spada, Daylight glare: A review of discomfort indexes, in: Visual
Quality and Energy Efficiency in Indoor Lighting: Today for Tomorrow Rome (IT) 2008. 545 [28] M. Boubekri, L. Boyer, Effect of window size and sunlight presence on glare, Lighting Research and
Technology, 24 (2) (1992) 69–74. [29] S. Carlucci, L. Pagliano, An optimization procedure based on thermal discomfort minimization to support the
design of comfortable net zero energy buildings, in: 13th Conference of the International Building Performance Simulation Association, BS 2013, Chambery, France, 2013, pp. 3690-3697. 550
[30] S. Carlucci, L. Pagliano, P. Zangheri, Optimization by discomfort minimization for designing a comfortable net zero energy building in the mediterranean climate, Advanced Materials Research, 689 (2013) 44-48.
[31] D.B. Crawley, L.K. Lawrie, F.C. Winkelmann, W.F. Buhl, Y.J. Huang, C.O. Pedersen, R.K. Strand, R.J. Liesen, D.E. Fisher, M.J. Witte, J. Glazer, EnergyPlus: Creating a new-generation building energy simulation program, Energ Buildings, 33 (4) (2001) 319-331. 555
[32] M. Wetter, GenOpt - A Generic Optimization Program, in: Seventh International IBPSA Conference, Rio de Janeiro, 2001, pp. 601 - 608.
[33] F. Causone, S. Carlucci, L. Pagliano, M. Pietrobon, A zero energy concept building for the Mediterranean climate, Energy Procedia, 62 (2014) 280-288.
[34] W.P. Köppen, R. Geiger, Handbuch der klimatologie, Gebrüder Borntraeger, Berlin, 1930. 560 [35] eERG, Misure dei consumi di energia elettrica nel settore domestico - Risultati delle campagne di
rilevamento dei consumi elettrici presso 110 abitazioni in Italia, in, End-use Efficiency Research Group (eERG), 2004.
[36] US-DoE, Testing and Validation, in: U.S.D.o. Energy (Ed.) EnergyPlus Energy Simulation Software, 2012. [37] ANSI/ASHRAE 140, Standard Method of Test for the Evaluation of Building Energy Analysis Computer 565
Programs, in, American Society of Heating, Refrigerating and Air-Conditioning Engineers, Atlanta (GA), USA, 2011, pp. 272.
[38] G. Beccali, M. Cellura, M. Lo Brano, A. Orioli, Is the transfer function method reliable in a EN building context? A theoretical analysis and a case study in the south of Italy, Applied Thermal Engineering, 25 (2005) 341-357. 570
22

[39] US-DoE, InputOutput Reference: The Encyclopedic Reference to EnergyPlus Input and Output, U.S. Department of Energy, 2010.
[40] F. Garde, M. David, A. Lenoir, E. Ottenwelter, Towards Net Zero Energy Buildings in Hot Climates: Part 1, New Tools and Methods, ASHRAE Transactions, 117 (1) (2011).
[41] Y.B. Yoon, R. Manandhar, K.H. Lee, Comparative Study of Two Daylighting Analysis Methods with Regard 575 to Window Orientation and Interior Wall Reflectance, Energies, 7 (2014) 5825-5846.
23

Annex A
Table A-1: Design parameters and alternative options used in the optimization run.
Design variable Physical parameters Code of alternative options
Values
External walls U-value (W m-2K-1) | Phase shift S (h) U+ | S+
U+ | So
U+ | S-
Uo | S+
Uo | So
Uo | S-
U- | S+
U- | So
U- | S-
0.149 | 14.0
0.147 | 9.9
0.152 | 4.6
0.261 | 12.9
0.254 | 9.2
0.246 | 2.9
0.387 | 12.6
0.387 | 8.9
0.410 | 2.2
Roof U-value (W m-2K-1) | Phase shift S (h) U+ | S+
U+ | So
U+ | S-
Uo | S+
Uo | So
Uo | S-
U- | S+
U- | So
U- | S-
0.154 | 12.3
0.148 | 8.2
0.147 | 4.9
0.252 | 13.1
0.251 | 9.4
0.248 | 5.0
0.398 | 12.3
0.404 | 9.3
0.381 | 5.8
Floor U-value (W m-2K-1) | Phase shift S (h) U+ | S+
U+ | So
U+ | S-
Uo | S+
Uo | So
Uo | S-
U- | S+
U- | So
U- | S-
0.143 | 12.8
0.150 | 9.6
0.152 | 5.7
0.250 | 13.1
0.240 | 9.0
0.246 | 5.4
0.397 | 12.9
0.401 | 9.3
0.401 | 4.8
Glazing units - southeast U-value (W m-2K-1) | g-value (%) | Visible
transmittance at normal incidence* tvis (%)
U+ | g+ | t+
U+ | go | to
Uo | g+ | t+
Uo | go | t-
U- | g+ | t+
U- | g- | t-
0.586 | 32.3 | 57.7
0.582 | 43.6 | 69.0
1.099 | 38.3 | 59.6
1.065 | 52.6 | 71.0
2.667 | 34.6 | 33.4
2.667 | 75.7 | 80.7
Glazing units – southwest U-value (W m-2K-1) | g-value (%) | Visible
transmittance at normal incidence* tvis (%)
U+ | g+ | t+
U+ | go | to
Uo | g+ | t+
Uo | go | t-
U- | g+ | t+
U- | g- | t-
0.586 | 32.3 | 57.7
0.582 | 43.6 | 69.0
1.099 | 38.3 | 59.6
1.065 | 52.6 | 71.0
2.667 | 34.6 | 33.4
2.667 | 75.7 | 80.7
Glazing units – northeast/northwest U-value (W m-2K-1) | g-value (%) | Visible
transmittance at normal incidence* tvis (%)
U+ | g+ | t+
U+ | go | to
Uo | g+ | t+
Uo | go | t-
U- | g+ | t+
0.586 | 32.3 | 57.7
0.582 | 43.6 | 69.0
1.099 | 38.3 | 59.6
1.065 | 52.6 | 71.0
2.667 | 34.6 | 33.4
24

Design variable Physical parameters Code of alternative options
Values
U- | g- | t- 2.667 | 75.7 | 80.7
Glazing units – central court U-value (W m-2K-1) | g-value (%) | Visible
transmittance at normal incidence* tvis (%)
U+ | g+ | t+
U+ | go | to
Uo | g+ | t+
Uo | go | t-
U- | g+ | t+
U- | g- | t-
0.586 | 32.3 | 57.7
0.582 | 43.6 | 69.0
1.099 | 38.3 | 59.6
1.065 | 52.6 | 71.0
2.667 | 34.6 | 33.4
2.667 | 75.7 | 80.7
Control strategy for closing solar shading
devices
Set-point variables and threshold Tair,int
Tair,out
Ig,w
Tair,int > 25 °C ⇒ ON
Tair,out > 25 °C ⇒ ON
Ig,w > 100 W/m2 ⇒ ON
Opening pivoted windows during summer
nighttime
Percentage of the window area opened (%) APW 0
100
Opening double-leaf windows during
summer nighttime (if Tair,int > Tair,out)
Percentage of the window area opened (%) ADLW 0
50
100
* tvis is not a design variable. It is reported to complete information about the energy and visual performance of the tested glazing systems.
Figure A-1: Daily schedule for occupancy. The maximum predicted occupation is 4 people in the dining room and kitchen, 2 people in the
double bedroom and 1 person in the office room and in the two single bedrooms.
Table A-2: Installed electric power for lighting.
Zone Name Net floor area (m2) Installed electric power per net floor area (W/m2)
Installed electric power per zone (W)
Living room + kitchen 70.8 12 850
25

Office room 14.3 10 143
Double bedroom 20.5 5 103
Single bedroom 9.0 10 90
Bathrooms (total) 17.5 10 175
Laundry room 7.3 10 73
Figure A-2: Daily schedule for lighting.
Table A-3: Installed electric power used by electric equipment.
Zone Name Net floor area (m2) Installed electric power per net floor area (W/m2)
Installed electric power per zone (W)
Living room + kitchen 70.8 10 708
Office room 14.3 15 215
Double bedroom 20.5 10 205
Single bedroom 9.0 10 90
Bathrooms (total) 17.5 0 0
Laundry room 7.3 13 95
26

Figure A-3: Daily schedules for electric equipment (household appliances and office equipment).
Table A-4: Performance and design options of those variants belonging to the Pareto front of optimization.
Variant number
LDIS LDIW UDIDiscomf FDGI>22 External walls
Roof Floor SW glazing
SE glazing
NE-NW glazing
Court glazing
Control strategy of
solar shading devices
Opening of pivoted
windows
Opening of
double-leaf
windows
1 0.0871 0.0813 0.1915 0.7404 U+|So U+|So U-|S- Uo|go U+|g+ U+|g+ U+|g+ WinSol Open Open
2 0.0958 0.2752 0.6985 0.2923 U-|So U-|S- U-|S- U+|g+ U+|g+ U+|g+ U+|g+ WinSol Open Open
3 0.0963 0.0950 0.2946 0.6756 U+|So U+|S- U-|S- U+|g+ U+|g+ U+|go U+|g+ WinSol Close Open
4 0.0968 0.1047 0.2309 0.6909 U+|So U+|S- U-|S- U+|go U+|g+ U+|g+ Uo|g+ WinSol Close Open
5 0.0974 0.1025 0.1412 0.8792 U+|So U+|S- U-|S- Uo|go U+|g+ U+|g+ U+|g+ WinSol Open Open
6 0.0994 0.2783 0.5414 0.2857 U-|So U-|S- U-|S- U+|g+ U+|g+ U+|g+ U+|g+ WinSol Open Open
7 0.1000 0.2368 0.5317 0.4293 Uo|So U-|S- U-|S- U+|g+ U+|g+ U+|go U+|g+ InTemp Open Open
8 0.1061 0.2161 0.6280 0.3947 U-|So Uo|S+ U-|S- U+|g+ Uo|go U+|g+ U+|g+ WinSol Open Open
9 0.1089 0.1724 0.1006 0.9454 Uo|S- Uo|S- Uo|S- Uo|go U+|g+ U+|g+ U+|g+ WinSol Open Open
10 0.1240 0.1413 0.4659 0.2807 U+|S- U+|S- U+|S- U+|go U+|g+ U+|go U+|g+ WinSol Close Open
11 0.1268 0.1537 0.4457 0.2788 U+|S- U+|S- Uo|So Uo|go U+|g+ Uo|g+ U+|g+ WinSol Open Half
12 0.1324 0.1469 0.3351 0.4976 Uo|S+ U+|So U-|S- U+|g+ U+|g+ U+|g+ U+|g+ InTemp Open Close
13 0.1348 0.1711 0.3651 0.2683 U+|S- U+|S- Uo|So U+|g+ U+|g+ U+|g+ U+|g+ WinSol Open Half
14 0.1444 0.0729 0.1704 0.7723 U+|So U+|So U-|S- Uo|go Uo|go U+|g+ U+|g+ WinSol Close Half
15 0.1525 0.1284 0.6535 0.3592 U+|S- U+|S- Uo|So U+|g+ U+|g+ U+|g+ U+|g+ WinSol Close Half
16 0.1558 0.1857 0.3116 0.5602 Uo|S+ U+|So U-|S+ U+|g+ U+|g+ U+|g+ U+|g+ InTemp Open Close
17 0.2006 0.0889 0.1638 0.7821 U+|S+ U+|So U+|So Uo|go U+|go U+|go Uo|g+ WinSol Close Half
18 0.2231 0.0974 0.1457 0.8054 Uo|S- U+|S- U-|S- Uo|go U+|g+ U+|go U+|g+ WinSol Close Close
27

Variant number
LDIS LDIW UDIDiscomf FDGI>22 External walls
Roof Floor SW glazing
SE glazing
NE-NW glazing
Court glazing
Control strategy of
solar shading devices
Opening of pivoted
windows
Opening of
double-leaf
windows
19 0.2329 0.1374 0.5491 0.3416 U+|So U+|S- U+|S- U+|go U+|g+ U+|g+ U+|g+ InTemp Close Close
20 0.2485 0.1394 0.3937 0.4524 U+|S- U+|S- Uo|So U+|g+ Uo|go U+|g+ U+|g+ InTemp Close Close
21 0.2785 0.1786 0.0698 0.9399 U-|S+ U+|S- U+|S+ U+|go U+|g+ U+|g+ U+|g+ WinSol Close Close
22 0.2795 0.1092 0.3870 0.6236 U+|So U+|S- U+|So Uo|go U+|g+ U+|g+ Uo|g+ InTemp Close Close
23 0.3139 0.1105 0.4244 0.5984 U+|So U+|S- U+|So Uo|go U+|go U+|go U+|g+ InTemp Close Close
24 0.3403 0.1062 0.1274 0.8622 U+|So U+|S- U+|S- Uo|go Uo|go Uo|go Uo|go WinSol Close Close 580
28