Embed Size (px)
Citation preview
Project NATURA MIÑO-MINHO “Valorización de los recursos
de la cuenca hidrográfica del MIÑO-MINHO”
Activity 1 report – Part 1
Multi-parameter characterization of surface
sediments from the Minho estuary
Mário Mil-Homens1, Ana M. Costa1, Cristina Lopes1, Henrique Duarte1, Teresa
Rodrigues1, Célia Santos1, Ana Aranda1, Sandra Mateus1, Catarina Cavaleiro1, Fátima
Abrantes1
Sandra Fonseca2, Raquel Serrano2
Maria A. Trancoso3, Rita Sousa3, Manuela Mateus3, Zenaida Melo3
1 CIIMAR / Unidade de Geologia Marinha - Laboratório Nacional de Energia e Geologia 2 Núcleo Operacional de Química Inorgânica - Laboratório de Referência do Ambiente – Agência
Portuguesa do Ambiente 3 Laboratório de Biocombustíveis e Ambiente - Laboratório Nacional de Energia e Geologia

Table of Contents
Abstract ............................................................................................................................................................................ 1
Introduction ...................................................................................................................................................................... 1
Materials and Methods ..................................................................................................................................................... 5
Sediment sampling ........................................................................................................................................................ 5
Grain size analysis ........................................................................................................................................................ 5
Quality control .............................................................................................................................................................................. 7
Diatoms ......................................................................................................................................................................... 7
Sample preparation for geochemical analysis and analytical techniques .......................................................................... 7
Organic carbon and total nitrogen ................................................................................................................................................. 8 Biomarkers ................................................................................................................................................................................... 8 Major elements ............................................................................................................................................................................. 9 Trace elements (As, Cr, Cu, Li, Pb, Sn and Zn) ............................................................................................................................. 9 Mercury ........................................................................................................................................................................................ 9
Quality assurance / Quality control (QA/QC) for major and trace elements determinations ............................................. 10
Major elements ........................................................................................................................................................................... 10 Trace elements .......................................................................................................................................................................... 10 Mercury ...................................................................................................................................................................................... 12
Factor analysis ............................................................................................................................................................ 12
Definition of Regional Geochemical Baselines for the Minho estuary ............................................................................. 13
Results and Discussion .................................................................................................................................................. 14
Grain-size characterization........................................................................................................................................... 14
Diatoms ....................................................................................................................................................................... 20
Biomarkers .................................................................................................................................................................. 20
Organic carbon origin .................................................................................................................................................. 21
Elemental spatial distribution ........................................................................................................................................ 25
Sediment components ................................................................................................................................................. 30
Detrital coarse and fine-grained sediment components ................................................................................................................ 30 Component associated with urban and industrial contamination ................................................................................................... 31 Mn oxi-hydroxide sediment component ....................................................................................................................................... 31 Component associated with contamination by nautical activities .................................................................................................. 31
Surface distribution of dominant sediment components ................................................................................................. 31
Regional Geochemical Baseline (As, Cu, Cr, Hg & Zn) models ..................................................................................... 34
Conclusions .................................................................................................................................................................... 36
Recommendations.......................................................................................................................................................... 38
Acknowledgments .......................................................................................................................................................... 38
References ...................................................................................................................................................................... 38

1
Abstract
The overall objective of the Natura Miño-Minho project is to contribute for a better understanding of the Minho River
ecosystem to assure a correct management and preservation of the natural resources. The activity 1 report of the Natura
Miño-Minho project was split in two distinct parts focused on the study of sediments as a tool for characterizing the most
recent sediments reflecting the actual situation in terms of textural and geochemical composition and also as a key for
improving the knowledge associated with climatic variability and description of anthropogenic impacts through time. The
former constitutes the main objective of the present report based on the study of forty-nine surface sediment samples from
the Minho River sector between Tui and Caminha. These samples were analyzed for grain-size, siliceous microfossils
(diatoms), biomarkers, organic carbon, total nitrogen, major and trace element concentrations. Diatom identification
together with biomarkers (n-alkanes, n-alcohols, alkenones) quantification was only possible in 10 and 30 samples,
respectively, due to the general sandy character of surface sediments. Factor Analysis was used to reduce twenty selected
variables (major (Si, Al, Fe, Ca, Mg, Na, K, Ti and Mn) and trace elements (As, Cr, Cu, Hg, Li, Pb, Rb, Sn and Zn),
organic carbon and total nitrogen) into four factors accounting for 87.3% of the total variance explained, suggesting
distinct elemental sources. While factors 1 (detrital component; elements strongly associated with fine (Na, Mg, Ti, Li,
Cr, Cu, Fe, Al) and coarse-grained sediments (Si, K, Rb)) and 3 (Mn oxi-hydroxide sediment component; Mn) are
interpreted as reflecting predominance of natural contributions, factors 2 (urban & industrial contamination; sediment
components (Pb, Hg, Corg, Ntot) attributed to urban and industrial discharge) and 4 (component associated with
contamination by nautical activities; association of Sn and Ca) seems to indicate anthropogenic contributions. Spatial
distribution of dominant factor scores shows the dominance of factors 2 and 4 between Tui and Vila Nova de Cerveira,
while samples dominated by factors 3 and 1 are found between Lanhelas and Seixas and in the Caminha area,
respectively. Despite the dominance of factor score 1 in the Caminha area, the distribution pattern reveals samples
dominated by other factor scores that can be explained by dredging activities in this river sector that restore ancient
sedimentary characteristics or expose contaminated sediments. Selected trace elements (As, Cu, Cr, Hg & Zn)
distributions were normalized against Al in order to account for natural grain-size variability. Lead not reveal significant
relationship with Al. Assuming the general non-impacted metal character of the Minho estuary sediments, regional
geochemical baselines (RGB) are defined for differentiating between natural and anthropogenic metal contributions.
Based on RGB defined for each metal, the degree of metal enrichment is estimated through enrichment factors (EF).
Despite relatively low total metal concentrations, defined RGB for As, Cr, Cu, Hg and Zn identifies very few samples
characterized by presenting metal enrichments relatively to Al. Mercury is the element showing the highest level of
enrichment. Samples considered as belonging to an enriched population are in general enriched in more than
one metal suggests that these locations (nearby Tui, Valença and Amizade bridges, and the lower part of the
estuary) are affected by diverse anthropogenic influences or reflecting favorable environmental conditions for
occurring the accumulation of contaminated particles.
Introduction
NATURA MIÑO-MINHO project – “Valorización de los recursos de la cuenca hidrográfica del
Miño-Minho” is a project developed between Portugal and Spain financed by European Union
through the Programa de Cooperação Transfronteiriça Espanha-Portugal (POCTEP/FEDER) in order
2
to get scientific knowledge related to environmental conditions existing in the Minho estuary and
adjacent shelf area, to evaluate climatic changes in the NW Portuguese Margin and the influence of
human activities in local environments. Improvement of the knowledge’s level will allow
implementing management policies assuring preservation and integration of natural resources,
promotion of sustainable development and biodiversity conservation of Natura 2000 network habitats.
The work developed in Activity 1 was only possible due to the establishment of collaboration
protocols with other research groups not considered in the project proposal (Núcleo Operacional de
Química Inorgânica - Laboratório de Referência do Ambiente – Agência Portuguesa do Ambiente,
Laboratório de Biocombustiveis e Ambiente - Laboratório Nacional de Energia e Geologia, Unidade
de Sondagens - Laboratório Nacional de Energia e Geologia, Universidad de Vigo, Royal Netherlands
Institute for Sea Research - Department of Marine Geology).
Previous studies developed by Alves (1996) and Balsinha et al. (2009) characterized grain-size
distributions in the Minho River estuary revealing the sandy character of sediments. To our
knowledge, the first published works of geochemical characterization of the Minho River estuary
were developed in beginning of the nineties (Gouveia et al., 1993; Paiva et al., 1993). Surface
samples used in both works were collected in the estuary and along the navigable course of the river
(Tui) during the cruise Sedminho91/1 in 1991. Gouveia et al. (1993) studied the Rare Earth Elements
(REE) distribution. The relative distributions of REE were very similar along the river, presenting
high variability both in the estuary and upstream. The REE-normalized pattern is flat for the samples
collected along the river, which suggests a distribution pattern representing the average of the
composition of rocks in the drainage basin. The REE-normalized values obtained for the estuarine
samples were characterized by large variability and also by an increase of the REE concentrations
probably due to an increase of the salinity (which may cause a REE removal from solution).
Furthermore, high quantities of fine-grained sediments certainly influence the REE concentrations.
According to Paiva et al. (1993), surface samples were mainly composed by sand. The estuarine
samples together with the sample collected nearby Tui are characterized by having the highest values
(< 20%) of fine fraction (< 63m). The later sample presents the highest levels of Cu, Pb and Zn,
reflecting influence of the Louro River (a tributary of Minho River characterized by different inputs
such as agriculture, industry (Porriño industrial area) and domestic effluents). Filgueiras et al. (2004)
studied the distribution of heavy metals (Pb, Cd, Cr, Cu and Ni) in 11 surface sediments collected
along Minho course. This work used both a total digestion and a three-stage sequential extraction
scheme (i.e. soluble, reducible and oxidisable fractions). Obtained results suggest that Pb and Cu are
associated with organic carbon that is mainly discharged from urban wastes, whereas Cr and Ni are
3
from electroplating and galvanizing industries. Despite relatively high metal concentrations they are
mostly distributed in the residual fraction, hence showing a low risk of mobility. Cadmium is present
in the most mobile fraction in many sampling points and a variety of pollution sources may contribute
to the Cd presence in the sediment. Moreno et al. (2005) compared geochemical results from a set of
samples collected in the Minho estuary (22 samples) with other set collected in the Caminha salt
marsh (22 samples). Results suggests that chemical composition of sediments reflects the geology of
the drainage area, the distribution of fine-grained sediments and also the marine influence restricted
to the lower part of the estuary and the tidal marsh. Based on the determination of metal enrichment
factors calculated according to the formula EF = ((Me/Al)sample/(Me/Al)crust)), major metal (Cr, Cu,
Pb, Zn) enrichment is observed in the tidal marsh (2<EF<3). The crustal values were obtained in
(Wedepohl, 1995). Fatela et al. (2009) also presented a set of geochemical results pertaining to two
groups of samples; one collected at the Caminha salt marsh and other collected along the Minho
River (from the estuary until Tui). In this study, geochemical results were uniquely compared with
average shales compiled by Salomons and Förstner (1984), and the total concentrations in Cr, Cu,
Mn, Fe, Ni and Zn do not exceed the average values for published values for non-polluted sediments.
Reis et al. (2009) studied ten surface samples collected in the Caminha salt marsh with the main goal
of evaluating the possibility that this area was suffering an increase of anthropogenic contamination.
Surface samples present very low contents of fine fraction, excepting one sample containing ca. 30%.
Obtained results suggest slight anthropogenic contamination at two sites. In addition, metal
availability in sediments was studied using two approaches: an enzymatic digestion with Pepsin A
and a sequential extraction procedure (only the exchangeable fraction of metal). The results of these
tests suggest metal levels in sediments are in chemical forms that were not easily available to
organisms. This indicates that these sediments probably will not have negative influences in salt
marsh organisms; although no life-form ecological safety tests have been carried out. So far,
published works considers the Minho estuary a pristine area. However, the majority of these works
were based on comparison of total metal concentrations with global reference values, which not
accounts with regional variability and with analytical measurements uncertainties.
Distinct environmental settings induce regional variability of sediments’ composition. Metals
derived from both natural and anthropogenic sources tend to accumulate simultaneously, being
difficult to determine what proportion belongs to each source (Loring and Rantala, 1992). Changes in
sediment grain-size, mineralogical composition and organic carbon content influence the total metal
concentrations in sediments (Loring, 1991). Due to its physical and chemical characteristics fine-
grained particles (clay minerals, organic and inorganic colloids) have greater capacity to adsorb
4
metals in their structures, thus forming the principal way of metal transport in aquatic environments.
Therefore, fine-grained sediments are in general characterized by having higher metal concentrations
than coarse-grained sediments. The later, where grains of quartz, feldspars and carbonate are
included, are relatively metal poor when compared to metal-rich phases (e.g. clay minerals) and thus
serve to dilute sediment metal concentrations (Windom et al., 1989). Other important factor that can
affect metal concentration in sediments relates to metals derived from weathering of natural metal
enriched formations (Karageorgis et al., 2002). Therefore, high total metal concentrations do not
necessarily indicate the degree of contamination (Tam and Yao, 1998), except in cases of extremely
high contamination. The assessment of anthropogenic contributions to sediments must be
accompanied by the estimation of metal contribution by natural processes (Windom et al., 1989). In
order to compensate for the natural variability of sediments, to detect and quantify anthropogenic
enrichments, several normalization procedures have been developed (Cato, 1977 and 1989; Loring,
1991; Loring and Rantala, 1992; Stevenson, 2001; Summers et al., 1996; Szefer et al., 1995; Windom
et al., 1989). Geochemical normalization is based on the assumption that the conservative element
(ideally not affected by anthropogenic contributions) chosen as normalizer element (e.g. Al, Fe, Li,
Sc) act as a proxy of the fine-grained aluminossilicated fraction and reflect the metal natural
variability.
This report firstly describes the sedimentologcal properties of modern sediments from the Minho
estuary, which are essential to characterize depositional environments (Folk and Ward, 1957),
followed by a general characterization of sediments in terms of siliceous microfossils (diatoms),
biomarkers, organic carbon, total nitrogen, major and trace element concentrations. Considering the
Minho estuary as a metal “clean” area, we proposed to define regional geochemical baselines (RGB)
with intention of estimating metal contributions associated with natural processes. Briefly, RGBs are
defined based on the relationship between metal vs. normalizing element and in the definition of its
linear regression that represent the regional geochemical variability. The natural geochemical
population is defined by the 95% confidence band, indicating the level of probability that points
falling within this interval belong to a normal population and those falling outside belong to an
anomalous population (Loring and Rantala, 1992). After defined the natural variability of the studied
elements in the sediments and with the main objective of assessing human impacts, the level of metal
enrichment is estimated through the determination of enrichment factors (EF), considering the
baseline values defined by the RGBs. Furthermore, multivariate analysis (Factor Analysis) is used to
characterize the elemental relationships and to reduce the number of variables to a smaller group of
components that can help in the interpretation of possible contamination sources.
5
Materials and Methods
Sediment sampling
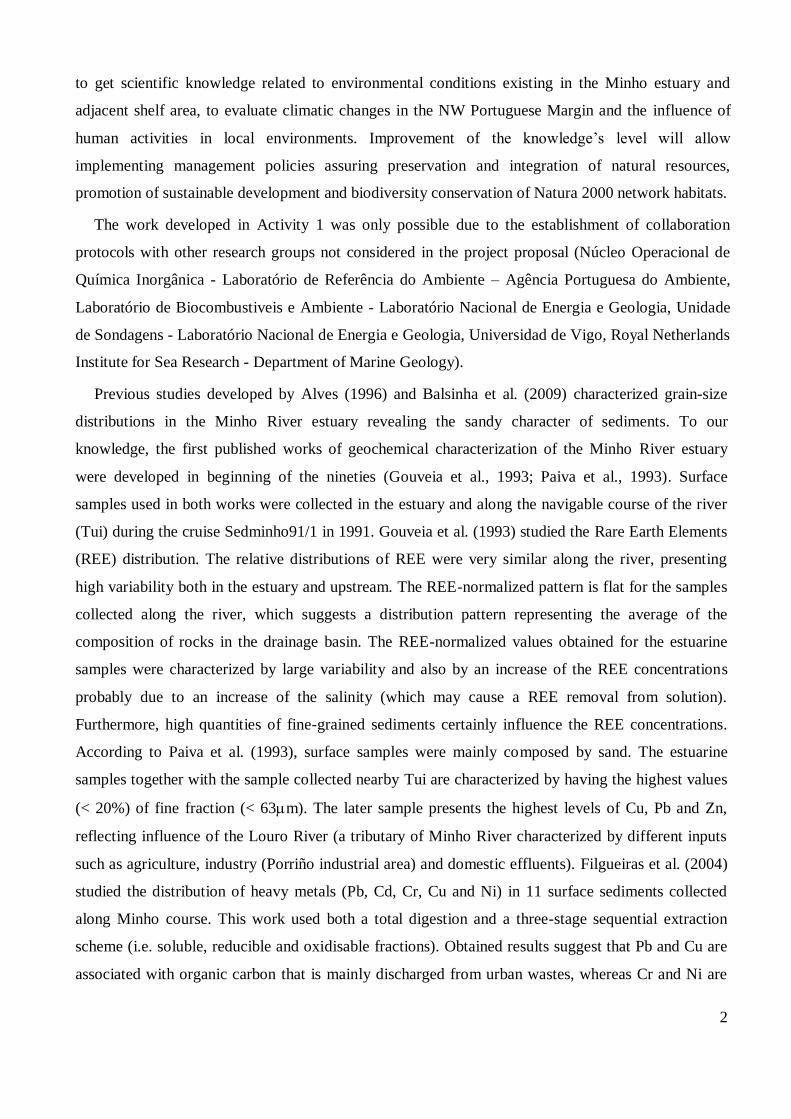
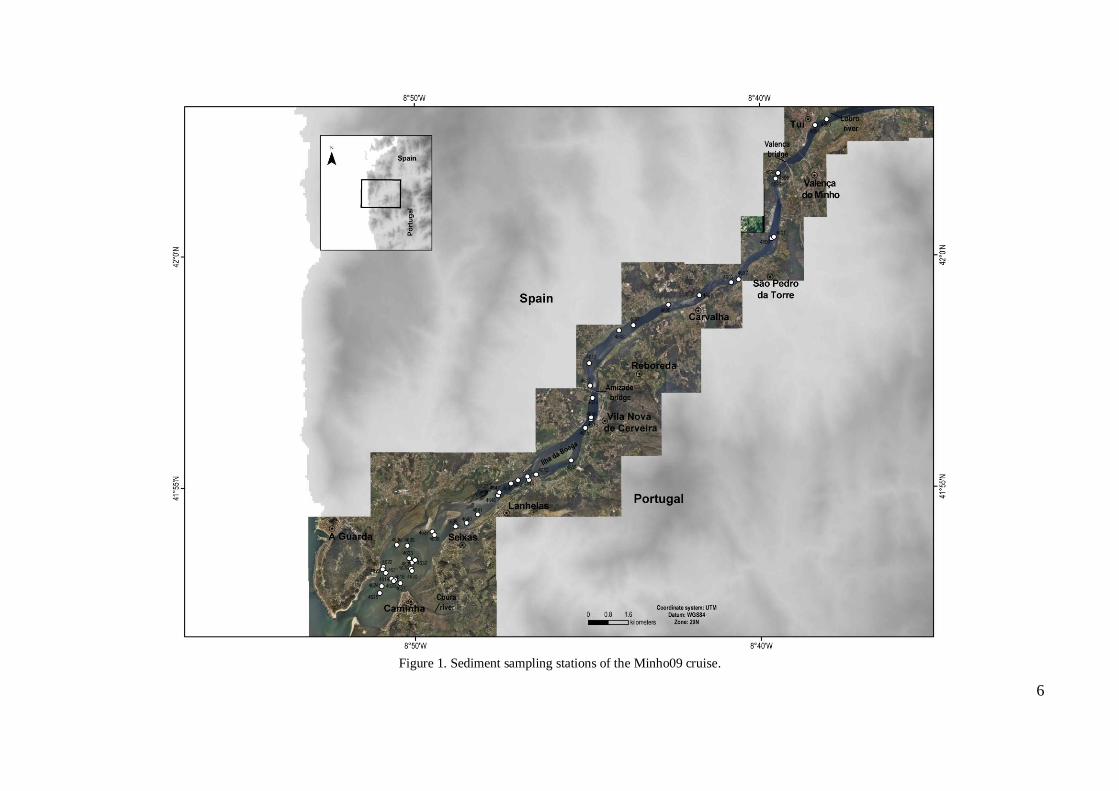
Forty-nine sediment surface samples were collected along the Minho River between Tui and
Caminha (Fig. 1) during the Minho09 cruise (August 2009) aboard RV Atlantic Leopard using a Van
Veen grab. Sample locations were selected based on the side scan sonar mosaic in order to sample
main types of sonar echoes and features. All samples were described (texture, color imagery) on
board, sub-sampled for several studies (textural, geochemical, biomarkers, foraminifera and diatoms)
at the AQUAMUSEU laboratory facilities (Vila Nova de Cerveira) and stored refrigerated (ca. 2 ºC).
Surface samples are assumed to reflect most recent accumulation; nevertheless surface mixing and
sampling artifacts might affect its quality and representativeness.
Grain size analysis
Grain size was determined using a Coulter Laser LS230 analyzer (measuring grain-sizes in the
range of 0.04-2000 µm) according to an in-house methodology from Laboratório de Sedimentologia e
Micropaleontologia da Unidade de Geologia Marinha - Laboratóro Nacional de Energia e Geologia
(UGM – LNEG). Taking into account this methodology, samples are weighted; wet sieved in a 2000
µm sieve and the fraction over 2000 µm is weighted. The difference between the total sample weight
and the over 2000 µm fraction weight allows the determination of the gravel percentage in the
sample. The fraction below 2000 µm was pre-treated for organic matter destruction. In a first step, 1
ml of 0.033 M of sodium hexa-metaphosphate (Calgon) and 200 ml of deionised water were added to
the sample for 48 hours for disaggregation. After this, different volumes (25 to 75 ml per day, for at
least 4 days) of hydrogen peroxide with ammonia (NH3O + H2O2; 0.5 ml of NH3O per 100 ml of
H2O2) were added to remove organic matter. The necessary volume of H2O2 depends on the quantity
of organic matter contained in each sample. In order to remove the exceeding H2O2 released during
the previous chemical reaction, the solution was heated in a water bath at 60ºC during 24 hours. For
quickly eliminating the excess liquid, samples were washed approximately 6 times with 1000 ml of
deionized water, using candle ceramic filters. The samples were poured in a glass flask with 1 ml of
Calgon to prevent flocculation and one drop of formaldehyde was added to avoid fungi development.
Before Coulter analysis, the samples were homogenized with a vertical stirrer (700 rpm) for, at least,
15 minutes. In this study four grain-size classes were used and defined as: clay < 4 µm; 4 µm < silt <
63 µm; 63 µm < sand < 2000 µm; 2000 µm < gravel. The classification of samples into those four
classes was determined through the use of the ternary diagram defined by Shepard (1954) and
modified by Schlee (1973), and with the support of the visual basic program developed by Poppe et
al. (2003) to classify sediments based on grain-size measurements.
6
Figure 1. Sediment sampling stations of the Minho09 cruise.
7
Quality control
The quality of the grain-size results were evaluated through the measurement of 2-3
replicates, excepting two samples (4603 and 4605) which were only analyzed one time, since the
sample material was not enough for making more analysis. Precision was determined by the
calculation of the Relative Standard Deviation (% RSD) determined from the mean ( X ) and the
standard deviation ( S ) of the repeated analysis. The RSD was smaller than 10%.
Diatoms
Siliceous microfossils analysis (diatoms and plant phytoliths) were carried out on surface
samples, following the procedure of Abrantes et al. (2005). Sediment samples (2 – 2.5 g of bulk
sediment) are placed in glass jars and are treated with Calgon in order to disaggregate the clays.
After this, alternate treatments with H2O2 and hydrochloric acid (HCl), in room temperature and
over hot plates, were applied until all the organic matter and carbonate contents were removed.
Distilled water is then used to wash the samples through siphoning in order to remove the clay
content (this process is made with a minimum of 8 hour interval between siphoning). Calgon is
then added as needed in order to release any extra clay content. Diatom slides were prepared
using sedimentation trays (Battarbee, 1973), and mounted with Permount medium. Absolute
abundance of diatoms (marine, brackish and freshwater) and phytoliths were determined after
slide quantification with x 1000 magnification, using the counting protocol of Schrader &
Gersonde (1978) and Abrantes (1988). Absolute abundances are based on the median value from
counting of 100 random fields of view on three replicate slides from each level, and are
expressed as number of valves/phytoliths per gram of sediment. Due to the sand contents in
sediments and to the fact that diatom preservation is dependent on the fine fraction, the final
absolute abundances were corrected assuming that all the sediment was composed by fine
fraction.
Sample preparation for geochemical analysis and analytical techniques
Before proceeding to sample preparation, sub-samples were freeze-dried. The fraction lower
than 2 mm was ground at the UGM-LNEG laboratory facilities. After ground, samples were
transferred to labeled plastic vials until required for analysis. Different analytical techniques are
summarized in Table 1.
8
Table 1. Summary of analytical techniques used in the present study. (Analytical technique codes: WD-XRF, wavelength dispersive X-ray fluorescence spectrometry; AAS, atomic absorption spectrometry; ICP-OES,
inductively coupled plasma optical emission spectrometry; ICP-MS, inductively coupled plasma mass
spectrometry. Laboratory codes: LBA-LNEG - Laboratório de Biocombustiveis e Ambiente, Laboratório
Nacional de Energia e Geologia; UGM-LNEG - Unidade de Geologia Marinha, Laboratório Nacional de
Energia e Geologia; LRA-APA: Laboratório de Referência do Ambiente, Agência Portuguesa do Ambiente).
Objective Techniques Laboratory
Corg & Ntot Combustion, Leco CHNS932 UGM-LNEG
Biomarkers GC-FID UGM-LNEG
Major elements WD-XRF LBA-LNEG
Hg Pyrolisis AAS LBA-LNEG
Trace elements Total mineralization (adapted US
EPA3052 method); ICP-OES & ICP-MS
UGM-LNEG (mineralization)
LRA-APA (analytical determinations)
Organic carbon and total nitrogen
Organic carbon and total nitrogen were obtained on approximately 0.2 g of freeze-dried
ground and homogenized sediment using a LECO CHNS 932, according to an in-house method
used at the UGM-LNEG. Briefly, the combustion of organic carbon in the fraction < 2 mm for 3
hours at 400ºC allows the subsequent measurement of inorganic carbon content. Both raw and
combusted sample were analysed two times. If the difference between 2 repeated sample
measurements were lower than 0.10 wt.%, average of both measurements corresponds to the
accepted value to be used in the determination of organic carbon content. Organic carbon content
was obtained from the difference between total carbon and inorganic carbon contents.
Biomarkers
The analytical procedure started with sample preparation and lipids extraction. Sediment
samples are freeze-dried and manually ground for homogeneity. From an aliquot of the dried
material, the lipids are extracted by treating them three times with 8 mL of dichloromethane in
an ultrasonic bath (15 min) after adding 10 l of an internal standard containing n-nonadecan-1-
ol, n-hexatriacontane and n-tetracontane. The extracts are combined and evaporated to dryness
under a nitrogen flow. The evaporated extracts are hydrolyzed with 3 mL of 10% KOH in
methanol and stored overnight for elimination of wax ester interferences. Non-acid compounds
are recovered by extraction with n-hexane (3 x 3 mL). The resulting extracts are washed with
extracted distilled water, evaporated under a nitrogen stream, and derivatized with 40-60 l of
N,O-Bis(trimethylsilyl)trifluoroacetamide (BSTFA) and diluted in toluene. Samples are stored in
darkness at 4°C before gas chromatographic analyses (GC-FID, GC-MSD).
The alkenones quantification by GC-FID was developed according to an in house
methodology used at UGM-LNEG. The following setting was used. An Varian gas
chromatograph GC-8300 coupled with a flame ionization detector (GC-FID) using a capillary
column (50 m length, 0.32 mm internal diameter) and hydrogen as carrier gas. Samples are
9
injected on-column. After an initial period of 1 min at 90°C, the column is heated rapidly to
170°C at 20°C/min, then to 280°C at 6°C/min, followed by an isothermal period of 70 min, and a
final temperature ramp of 10°C/min up to 310°C, and held for 5 min. Quantification is
performed by comparison of the peak areas with the area of the hexatriacontane peak. Sea
Surface Temperatures (SST) determinations were based on the alkenone unsaturation index,
UK’
37, which was calibrated to the temperature equation of (Muler et al., 1998). Replicate
injections and sample dilution tests allowed assessing measurement errors below 0.5ºC (Grimalt
et al., 2001).
Major elements
Major elements (SiO2, Al2O3, Fe2O3, MgO, CaO, Na2O, K2O, TiO2 and MnO) were
determined by wavelength dispersive X-ray fluorescence spectrometry measured on fusion beads
following a LBA-LNEG in-house method. A set of 16 NCS Certified Reference Materials
(CRM) from the China National Analysis Center, with a range of analytes and matrices similar
to those of the samples and treated in the same way, was used to establish calibration curves. To
correct for matrix effects, theoretical α correction factors were applied. According to the
laboratory quality control procedures, calibration was validated by daily analysis of CRM.
Trace elements (As, Cr, Cu, Li, Pb, Rb, Sn and Zn)
For trace elements analysis approximately 0.25 g of sediment was weighed directly into
pressure vessels. Samples were mineralized by a combination of 3mL HCl (36%), 9 mL nitric
acid (HNO3) (69%) and 5 mL hydrofluoric acid (HF) (48%) in a CEM microwave oven Mars
Xpress. After microwave digestion, remaining solutions were transferred to Teflon vessels and
placed on hotplate at 150ºC until near dryness. Twenty mL of Milli-Q water and 2.5 mL HNO3
(69%) were added to residue to bring the solution to a final volume, the solution was heated at
80ºC during 3 hours, and then after cooling transferred to 50 mL volumetric flask and finally
poured in a labeled plastic bottle. Copper and Zn concentrations were determined by ICP-OES,
while As, Cr, Li, Pb, Rb and Sn were measured by ICP-MS.
Mercury
Total mercury concentration in sediments was quantified using a Milestone Direct Mercury
Analyzer DMA 80. All mercury in the sample (ca. 0.5 g) was combusted in a stream of oxygen,
volatilized and trapped by amalgamation on a gold substrate and was thermally desorbed and
quantitated by atomic absorption spectrophotometry.
10
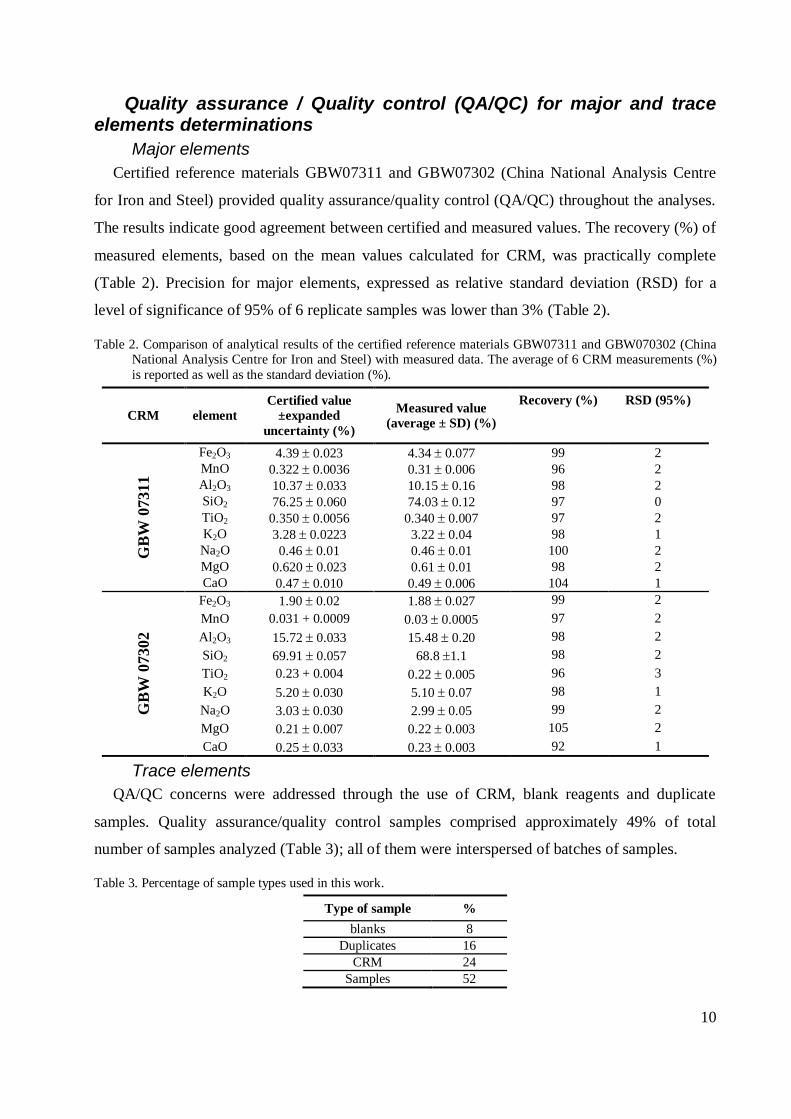
Quality assurance / Quality control (QA/QC) for major and trace elements determinations
Major elements
Certified reference materials GBW07311 and GBW07302 (China National Analysis Centre
for Iron and Steel) provided quality assurance/quality control (QA/QC) throughout the analyses.
The results indicate good agreement between certified and measured values. The recovery (%) of
measured elements, based on the mean values calculated for CRM, was practically complete
(Table 2). Precision for major elements, expressed as relative standard deviation (RSD) for a
level of significance of 95% of 6 replicate samples was lower than 3% (Table 2).
Table 2. Comparison of analytical results of the certified reference materials GBW07311 and GBW070302 (China National Analysis Centre for Iron and Steel) with measured data. The average of 6 CRM measurements (%)
is reported as well as the standard deviation (%).
CRM element
Certified value
±expanded
uncertainty (%)
Measured value
(average ± SD) (%)
Recovery (%) RSD (95%)
GB
W 0
7311
Fe2O3 4.39 0.023 4.34 0.077 99 2
MnO 0.322 0.0036 0.31 0.006 96 2
Al2O3 10.37 0.033 10.15 0.16 98 2
SiO2 76.25 0.060 74.03 0.12 97 0
TiO2 0.350 0.0056 0.340 0.007 97 2
K2O 3.28 0.0223 3.22 0.04 98 1
Na2O 0.46 0.01 0.46 0.01 100 2
MgO 0.620 0.023 0.61 0.01 98 2
CaO 0.47 0.010 0.49 0.006 104 1
GB
W 0
7302
Fe2O3 1.90 0.02 1.88 0.027 99 2
MnO 0.031 + 0.0009 0.03 0.0005 97 2
Al2O3 15.72 0.033 15.48 0.20 98 2
SiO2 69.91 0.057 68.8 1.1 98 2
TiO2 0.23 + 0.004 0.22 0.005 96 3
K2O 5.20 0.030 5.10 0.07 98 1
Na2O 3.03 0.030 2.99 0.05 99 2
MgO 0.21 0.007 0.22 0.003 105 2
CaO 0.25 0.033 0.23 0.003 92 1
Trace elements
QA/QC concerns were addressed through the use of CRM, blank reagents and duplicate
samples. Quality assurance/quality control samples comprised approximately 49% of total
number of samples analyzed (Table 3); all of them were interspersed of batches of samples.
Table 3. Percentage of sample types used in this work.
Type of sample %
blanks 8
Duplicates 16
CRM 24
Samples 52
11
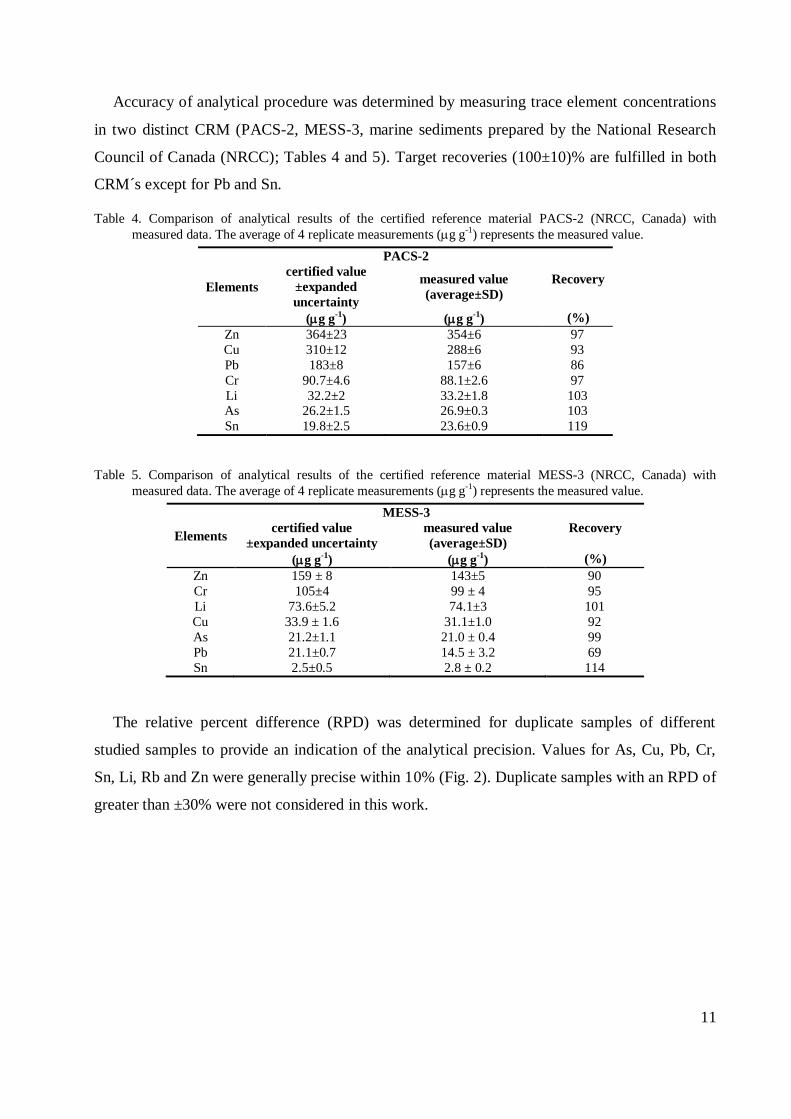
Accuracy of analytical procedure was determined by measuring trace element concentrations
in two distinct CRM (PACS-2, MESS-3, marine sediments prepared by the National Research
Council of Canada (NRCC); Tables 4 and 5). Target recoveries (100±10)% are fulfilled in both
CRM´s except for Pb and Sn.
Table 4. Comparison of analytical results of the certified reference material PACS-2 (NRCC, Canada) with
measured data. The average of 4 replicate measurements (g g-1) represents the measured value.
PACS-2
Elements
certified value
±expanded
uncertainty
measured value
(average±SD)
Recovery
(g g-1
) (g g-1
) (%)
Zn 364±23 354±6 97
Cu 310±12 288±6 93
Pb 183±8 157±6 86
Cr 90.7±4.6 88.1±2.6 97
Li 32.2±2 33.2±1.8 103 As 26.2±1.5 26.9±0.3 103
Sn 19.8±2.5 23.6±0.9 119
Table 5. Comparison of analytical results of the certified reference material MESS-3 (NRCC, Canada) with
measured data. The average of 4 replicate measurements (g g-1) represents the measured value.
MESS-3
Elements
certified value
±expanded uncertainty
measured value
(average±SD)
Recovery
(g g-1
) (g g-1
) (%)
Zn 159 ± 8 143±5 90
Cr 105±4 99 ± 4 95
Li 73.6±5.2 74.1±3 101
Cu 33.9 ± 1.6 31.1±1.0 92
As 21.2±1.1 21.0 ± 0.4 99
Pb 21.1±0.7 14.5 ± 3.2 69
Sn 2.5±0.5 2.8 ± 0.2 114
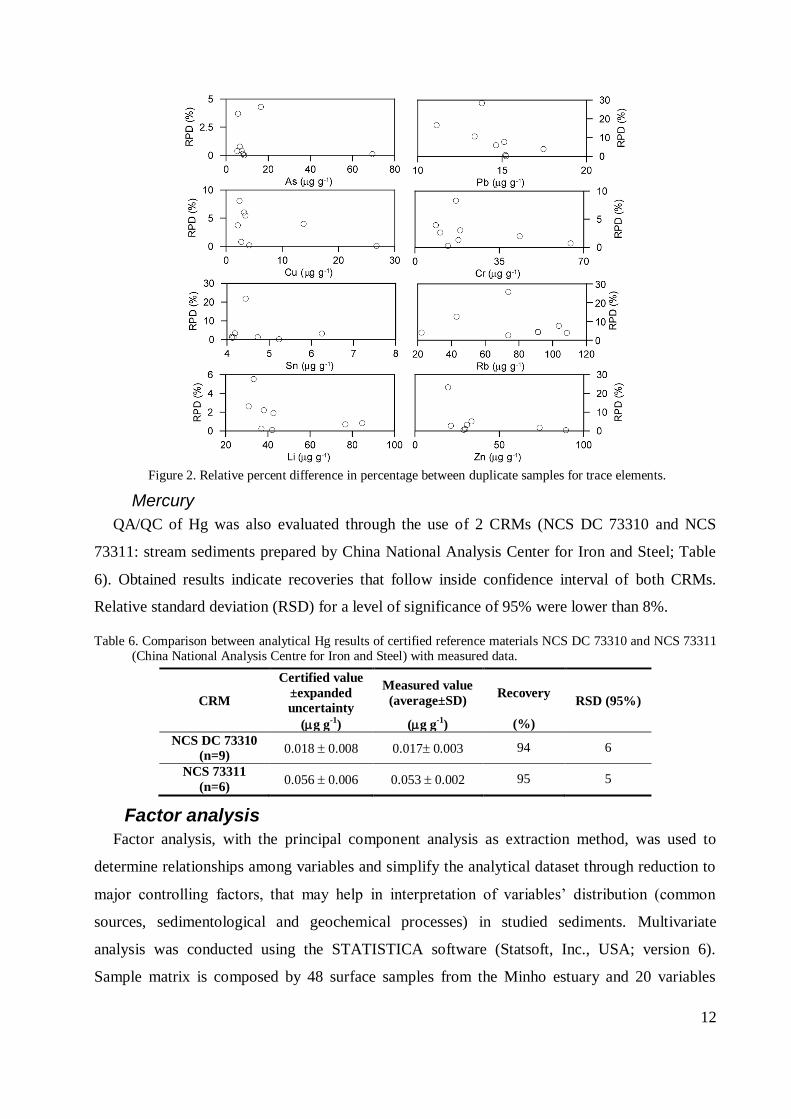
The relative percent difference (RPD) was determined for duplicate samples of different
studied samples to provide an indication of the analytical precision. Values for As, Cu, Pb, Cr,
Sn, Li, Rb and Zn were generally precise within 10% (Fig. 2). Duplicate samples with an RPD of
greater than ±30% were not considered in this work.
12
Figure 2. Relative percent difference in percentage between duplicate samples for trace elements.
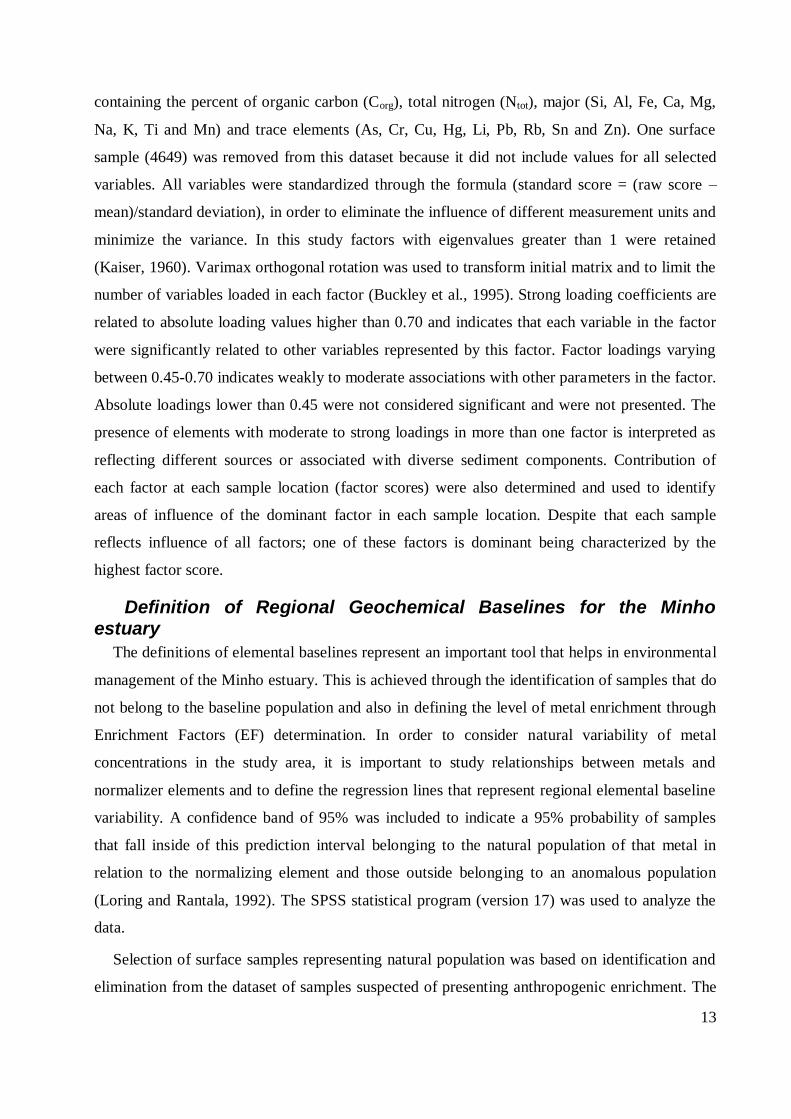
Mercury
QA/QC of Hg was also evaluated through the use of 2 CRMs (NCS DC 73310 and NCS
73311: stream sediments prepared by China National Analysis Center for Iron and Steel; Table
6). Obtained results indicate recoveries that follow inside confidence interval of both CRMs.
Relative standard deviation (RSD) for a level of significance of 95% were lower than 8%.
Table 6. Comparison between analytical Hg results of certified reference materials NCS DC 73310 and NCS 73311 (China National Analysis Centre for Iron and Steel) with measured data.
CRM
Certified value
±expanded
uncertainty
Measured value
(average±SD) Recovery
RSD (95%)
(g g-1
) (g g-1
) (%)
NCS DC 73310
(n=9) 0.018 0.008 0.017 0.003 94 6
NCS 73311
(n=6) 0.056 0.006 0.053 0.002 95 5
Factor analysis
Factor analysis, with the principal component analysis as extraction method, was used to
determine relationships among variables and simplify the analytical dataset through reduction to
major controlling factors, that may help in interpretation of variables’ distribution (common
sources, sedimentological and geochemical processes) in studied sediments. Multivariate
analysis was conducted using the STATISTICA software (Statsoft, Inc., USA; version 6).
Sample matrix is composed by 48 surface samples from the Minho estuary and 20 variables
13
containing the percent of organic carbon (Corg), total nitrogen (Ntot), major (Si, Al, Fe, Ca, Mg,
Na, K, Ti and Mn) and trace elements (As, Cr, Cu, Hg, Li, Pb, Rb, Sn and Zn). One surface
sample (4649) was removed from this dataset because it did not include values for all selected
variables. All variables were standardized through the formula (standard score = (raw score –
mean)/standard deviation), in order to eliminate the influence of different measurement units and
minimize the variance. In this study factors with eigenvalues greater than 1 were retained
(Kaiser, 1960). Varimax orthogonal rotation was used to transform initial matrix and to limit the
number of variables loaded in each factor (Buckley et al., 1995). Strong loading coefficients are
related to absolute loading values higher than 0.70 and indicates that each variable in the factor
were significantly related to other variables represented by this factor. Factor loadings varying
between 0.45-0.70 indicates weakly to moderate associations with other parameters in the factor.
Absolute loadings lower than 0.45 were not considered significant and were not presented. The
presence of elements with moderate to strong loadings in more than one factor is interpreted as
reflecting different sources or associated with diverse sediment components. Contribution of
each factor at each sample location (factor scores) were also determined and used to identify
areas of influence of the dominant factor in each sample location. Despite that each sample
reflects influence of all factors; one of these factors is dominant being characterized by the
highest factor score.
Definition of Regional Geochemical Baselines for the Minho estuary
The definitions of elemental baselines represent an important tool that helps in environmental
management of the Minho estuary. This is achieved through the identification of samples that do
not belong to the baseline population and also in defining the level of metal enrichment through
Enrichment Factors (EF) determination. In order to consider natural variability of metal
concentrations in the study area, it is important to study relationships between metals and
normalizer elements and to define the regression lines that represent regional elemental baseline
variability. A confidence band of 95% was included to indicate a 95% probability of samples
that fall inside of this prediction interval belonging to the natural population of that metal in
relation to the normalizing element and those outside belonging to an anomalous population
(Loring and Rantala, 1992). The SPSS statistical program (version 17) was used to analyze the
data.
Selection of surface samples representing natural population was based on identification and
elimination from the dataset of samples suspected of presenting anthropogenic enrichment. The
14
second criterion used was the identification of statistical outliers and influential cases from the
remaining sites through regression analysis using Cook’s Distance, Leverage levels and residual
plots. Shapiro-Wilk test was used to test the normality of distributions. Appropriated
transformations (inverse, logarithm, square root) were used to meet assumptions of normality
and stability of variance (Schropp et al., 1990; Summers et al., 1996). The process of testing for
normality and selection of outliers was iterated until a normal distribution was achieved (Schiff
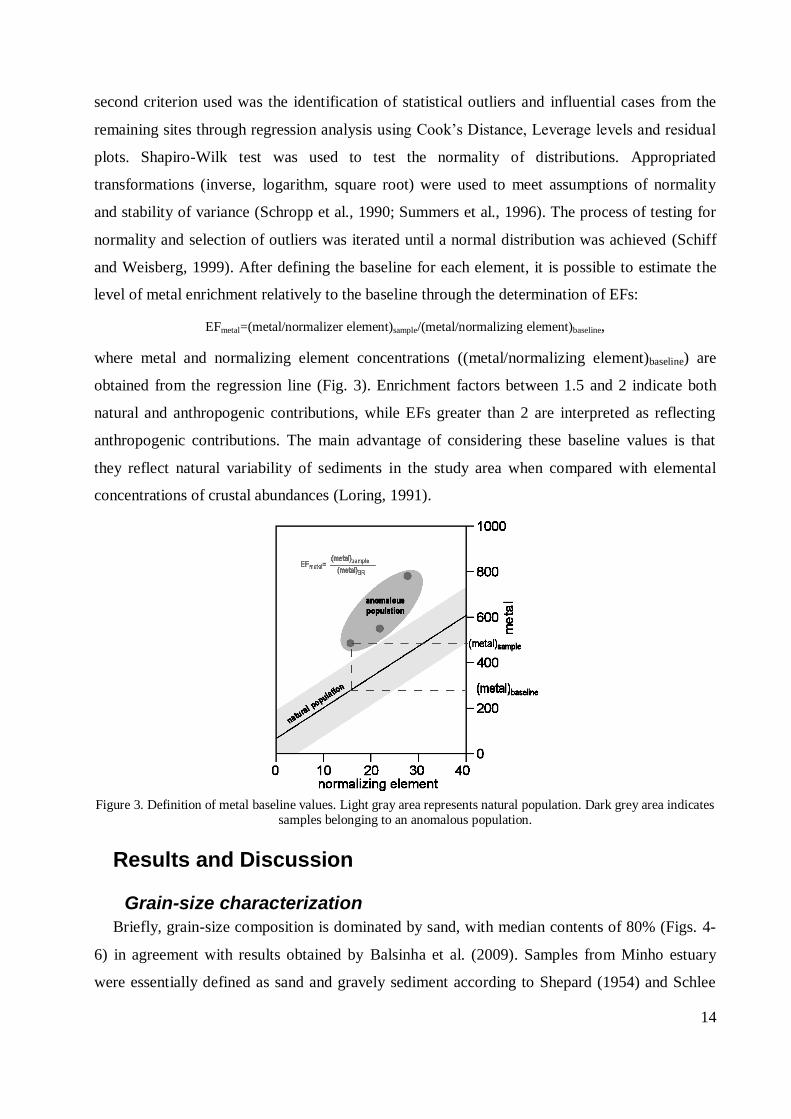
and Weisberg, 1999). After defining the baseline for each element, it is possible to estimate the
level of metal enrichment relatively to the baseline through the determination of EFs:
EFmetal=(metal/normalizer element)sample/(metal/normalizing element)baseline,
where metal and normalizing element concentrations ((metal/normalizing element)baseline) are
obtained from the regression line (Fig. 3). Enrichment factors between 1.5 and 2 indicate both
natural and anthropogenic contributions, while EFs greater than 2 are interpreted as reflecting
anthropogenic contributions. The main advantage of considering these baseline values is that
they reflect natural variability of sediments in the study area when compared with elemental
concentrations of crustal abundances (Loring, 1991).
Figure 3. Definition of metal baseline values. Light gray area represents natural population. Dark grey area indicates
samples belonging to an anomalous population.
Results and Discussion
Grain-size characterization
Briefly, grain-size composition is dominated by sand, with median contents of 80% (Figs. 4-
6) in agreement with results obtained by Balsinha et al. (2009). Samples from Minho estuary
were essentially defined as sand and gravely sediment according to Shepard (1954) and Schlee
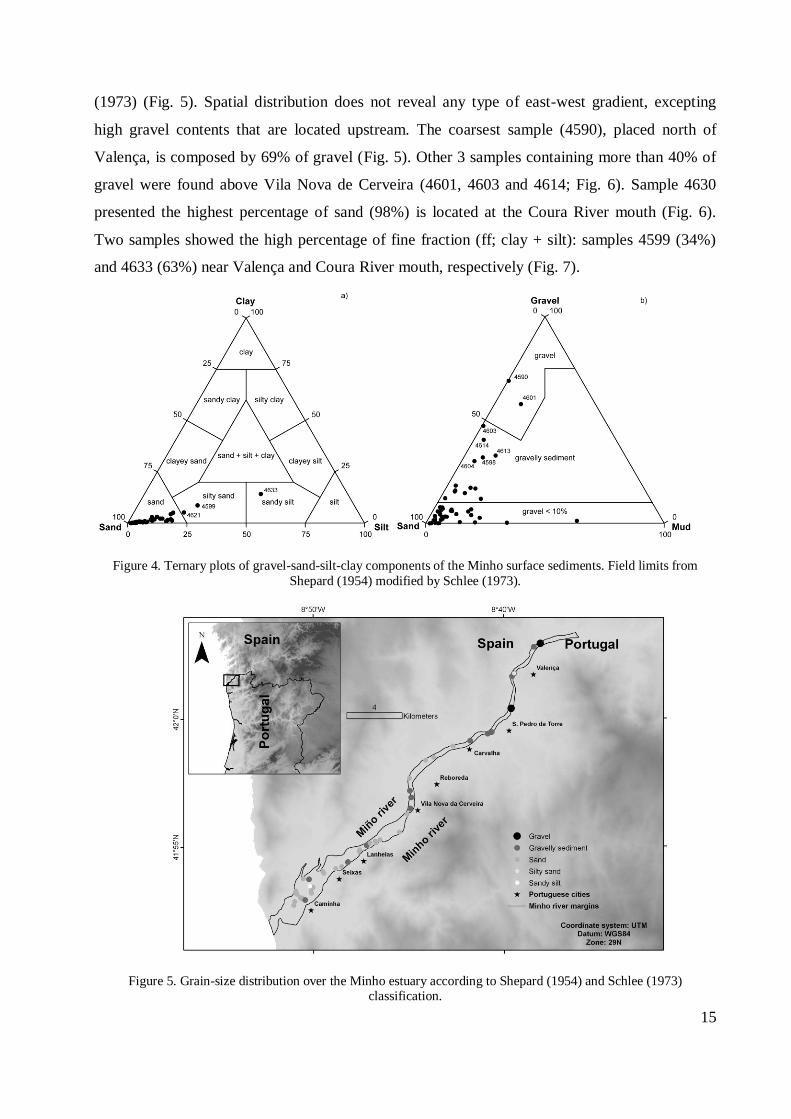
15
(1973) (Fig. 5). Spatial distribution does not reveal any type of east-west gradient, excepting
high gravel contents that are located upstream. The coarsest sample (4590), placed north of
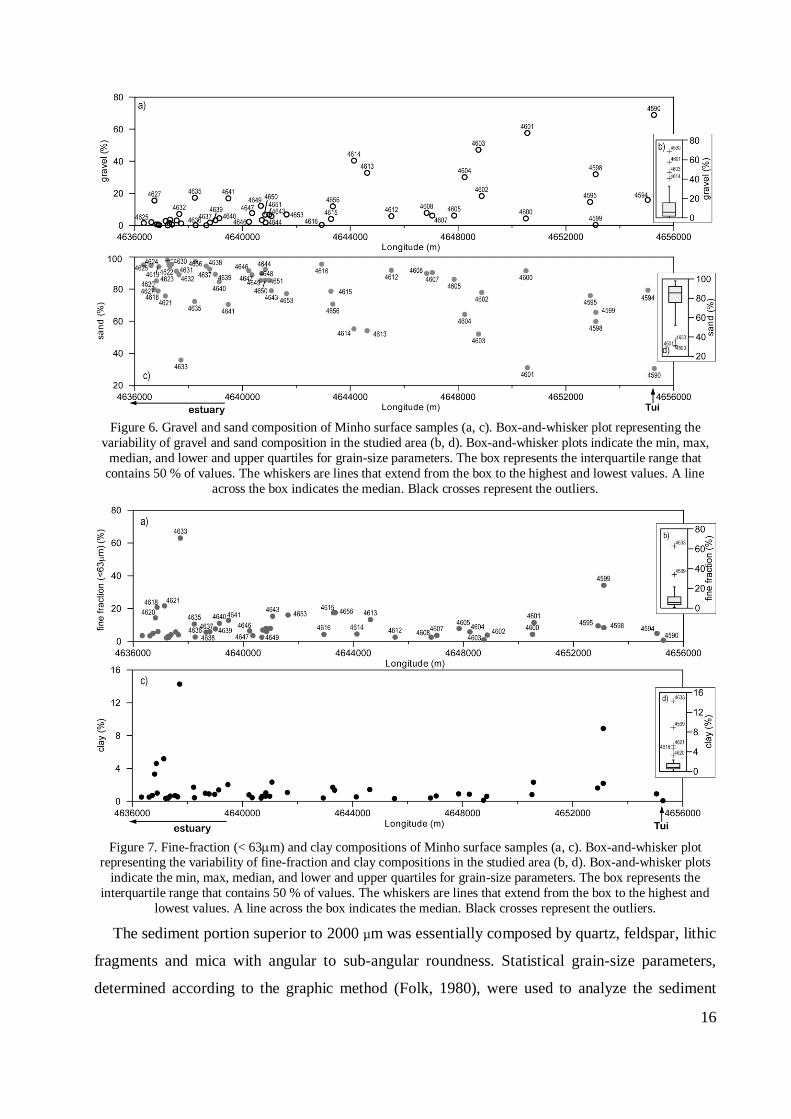
Valença, is composed by 69% of gravel (Fig. 5). Other 3 samples containing more than 40% of
gravel were found above Vila Nova de Cerveira (4601, 4603 and 4614; Fig. 6). Sample 4630
presented the highest percentage of sand (98%) is located at the Coura River mouth (Fig. 6).
Two samples showed the high percentage of fine fraction (ff; clay + silt): samples 4599 (34%)
and 4633 (63%) near Valença and Coura River mouth, respectively (Fig. 7).
Figure 4. Ternary plots of gravel-sand-silt-clay components of the Minho surface sediments. Field limits from
Shepard (1954) modified by Schlee (1973).
Figure 5. Grain-size distribution over the Minho estuary according to Shepard (1954) and Schlee (1973) classification.
16
Figure 6. Gravel and sand composition of Minho surface samples (a, c). Box-and-whisker plot representing the
variability of gravel and sand composition in the studied area (b, d). Box-and-whisker plots indicate the min, max,
median, and lower and upper quartiles for grain-size parameters. The box represents the interquartile range that
contains 50 % of values. The whiskers are lines that extend from the box to the highest and lowest values. A line
across the box indicates the median. Black crosses represent the outliers.
Figure 7. Fine-fraction (< 63m) and clay compositions of Minho surface samples (a, c). Box-and-whisker plot representing the variability of fine-fraction and clay compositions in the studied area (b, d). Box-and-whisker plots
indicate the min, max, median, and lower and upper quartiles for grain-size parameters. The box represents the
interquartile range that contains 50 % of values. The whiskers are lines that extend from the box to the highest and
lowest values. A line across the box indicates the median. Black crosses represent the outliers.
The sediment portion superior to 2000 µm was essentially composed by quartz, feldspar, lithic
fragments and mica with angular to sub-angular roundness. Statistical grain-size parameters,
determined according to the graphic method (Folk, 1980), were used to analyze the sediment
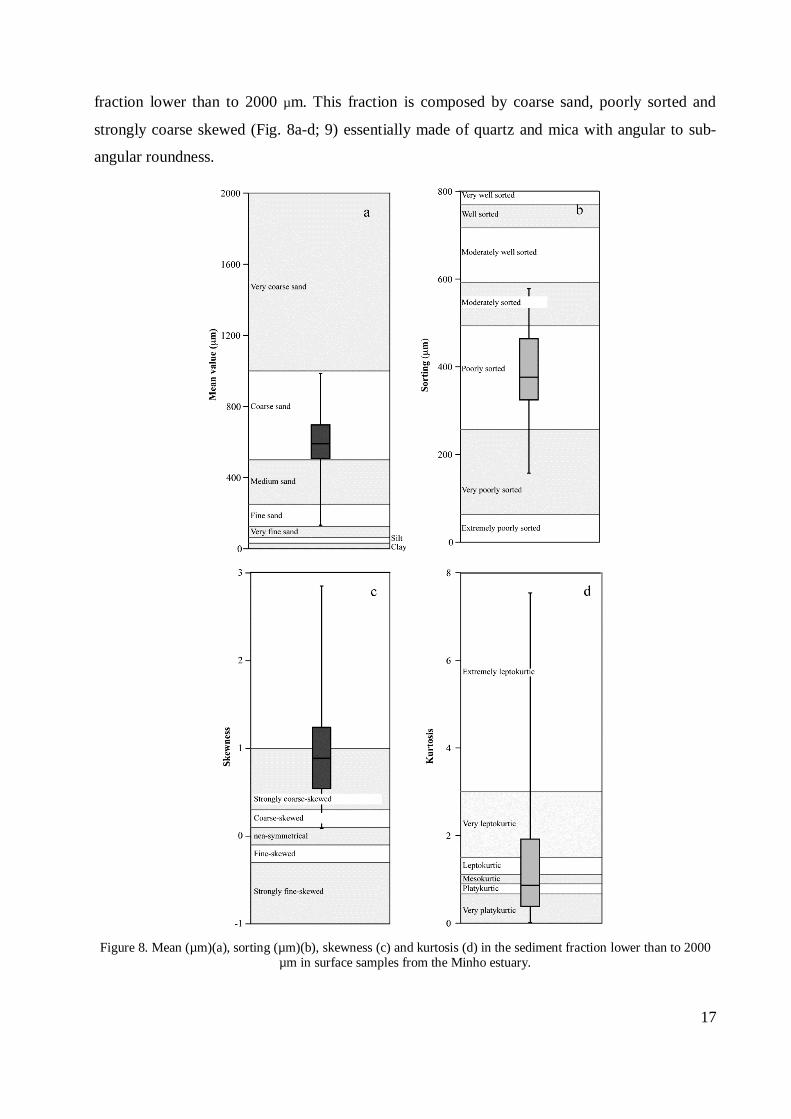
17
fraction lower than to 2000 µm. This fraction is composed by coarse sand, poorly sorted and
strongly coarse skewed (Fig. 8a-d; 9) essentially made of quartz and mica with angular to sub-
angular roundness.
Figure 8. Mean (µm)(a), sorting (µm)(b), skewness (c) and kurtosis (d) in the sediment fraction lower than to 2000
µm in surface samples from the Minho estuary.
18
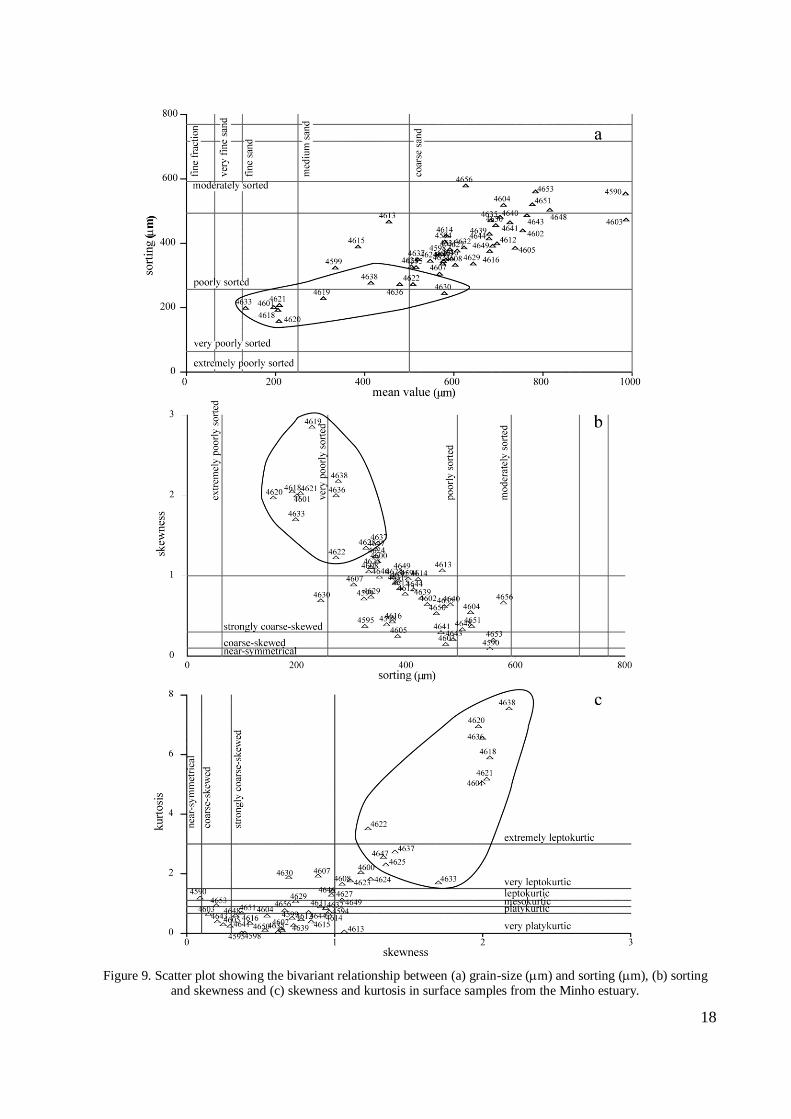
Figure 9. Scatter plot showing the bivariant relationship between (a) grain-size (m) and sorting (m), (b) sorting and skewness and (c) skewness and kurtosis in surface samples from the Minho estuary.
19
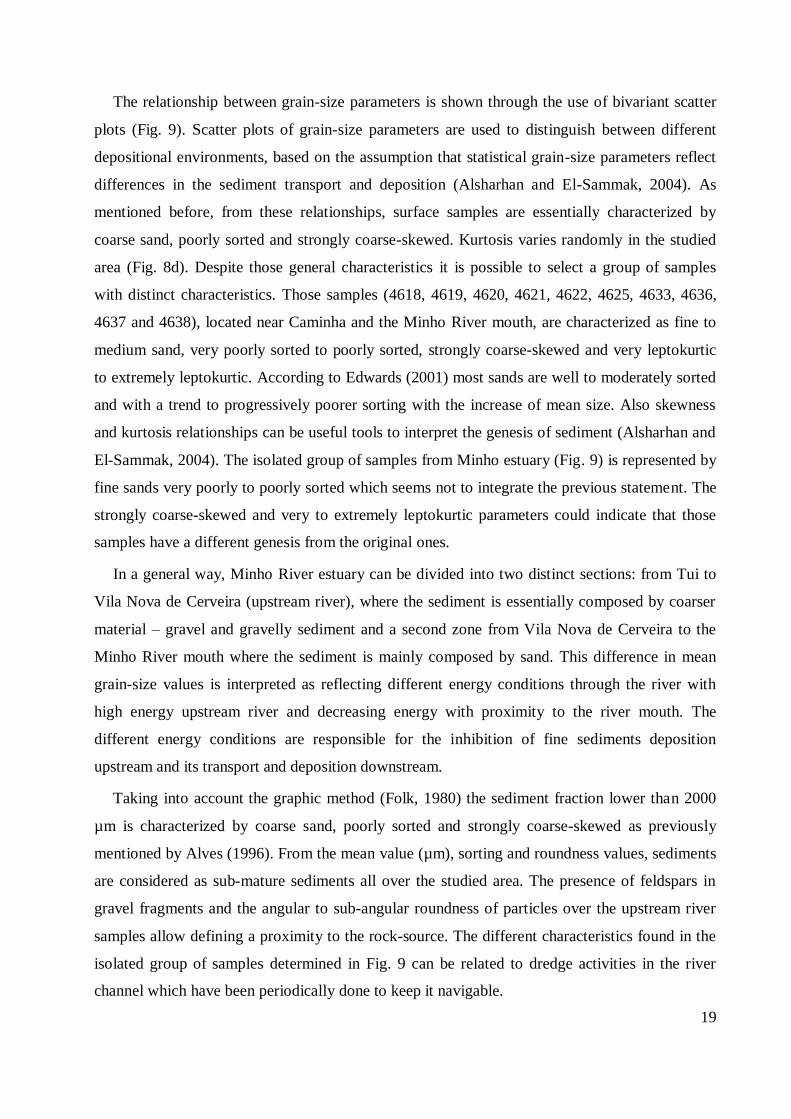
The relationship between grain-size parameters is shown through the use of bivariant scatter
plots (Fig. 9). Scatter plots of grain-size parameters are used to distinguish between different
depositional environments, based on the assumption that statistical grain-size parameters reflect
differences in the sediment transport and deposition (Alsharhan and El-Sammak, 2004). As
mentioned before, from these relationships, surface samples are essentially characterized by
coarse sand, poorly sorted and strongly coarse-skewed. Kurtosis varies randomly in the studied
area (Fig. 8d). Despite those general characteristics it is possible to select a group of samples
with distinct characteristics. Those samples (4618, 4619, 4620, 4621, 4622, 4625, 4633, 4636,
4637 and 4638), located near Caminha and the Minho River mouth, are characterized as fine to
medium sand, very poorly sorted to poorly sorted, strongly coarse-skewed and very leptokurtic
to extremely leptokurtic. According to Edwards (2001) most sands are well to moderately sorted
and with a trend to progressively poorer sorting with the increase of mean size. Also skewness
and kurtosis relationships can be useful tools to interpret the genesis of sediment (Alsharhan and
El-Sammak, 2004). The isolated group of samples from Minho estuary (Fig. 9) is represented by
fine sands very poorly to poorly sorted which seems not to integrate the previous statement. The
strongly coarse-skewed and very to extremely leptokurtic parameters could indicate that those
samples have a different genesis from the original ones.
In a general way, Minho River estuary can be divided into two distinct sections: from Tui to
Vila Nova de Cerveira (upstream river), where the sediment is essentially composed by coarser
material – gravel and gravelly sediment and a second zone from Vila Nova de Cerveira to the
Minho River mouth where the sediment is mainly composed by sand. This difference in mean
grain-size values is interpreted as reflecting different energy conditions through the river with
high energy upstream river and decreasing energy with proximity to the river mouth. The
different energy conditions are responsible for the inhibition of fine sediments deposition
upstream and its transport and deposition downstream.
Taking into account the graphic method (Folk, 1980) the sediment fraction lower than 2000
µm is characterized by coarse sand, poorly sorted and strongly coarse-skewed as previously
mentioned by Alves (1996). From the mean value (µm), sorting and roundness values, sediments
are considered as sub-mature sediments all over the studied area. The presence of feldspars in
gravel fragments and the angular to sub-angular roundness of particles over the upstream river
samples allow defining a proximity to the rock-source. The different characteristics found in the
isolated group of samples determined in Fig. 9 can be related to dredge activities in the river
channel which have been periodically done to keep it navigable.
20
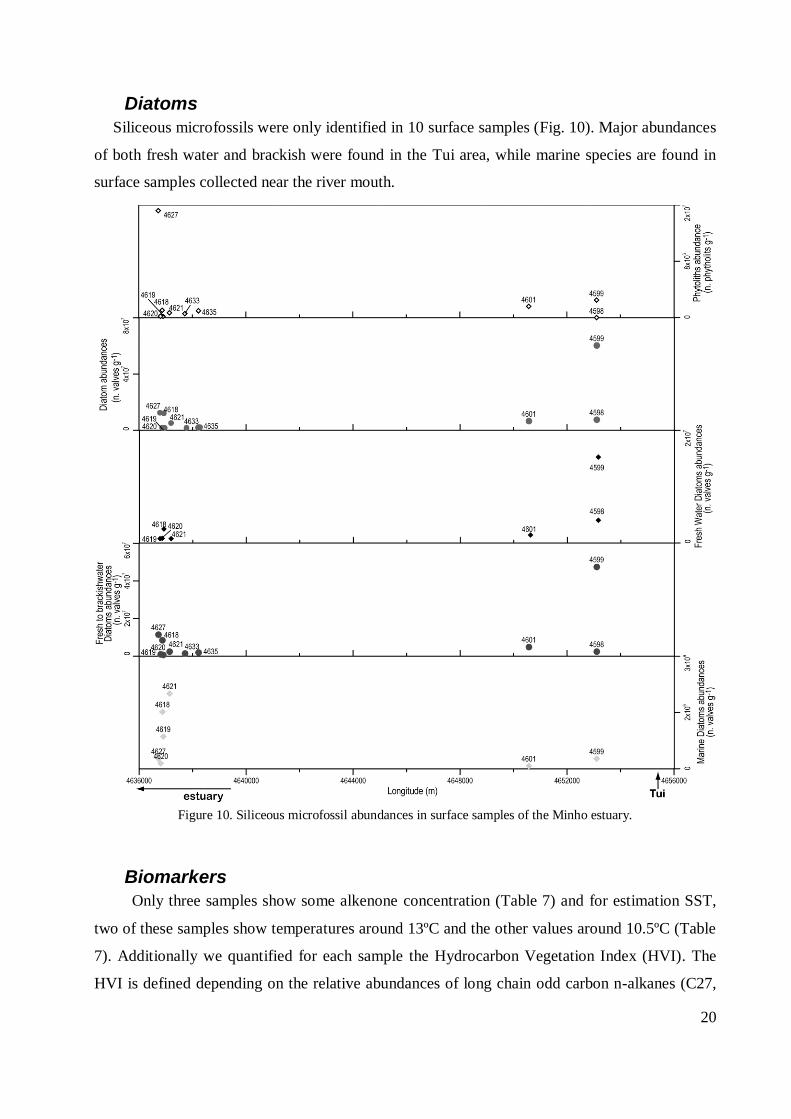
Diatoms
Siliceous microfossils were only identified in 10 surface samples (Fig. 10). Major abundances
of both fresh water and brackish were found in the Tui area, while marine species are found in
surface samples collected near the river mouth.
Figure 10. Siliceous microfossil abundances in surface samples of the Minho estuary.
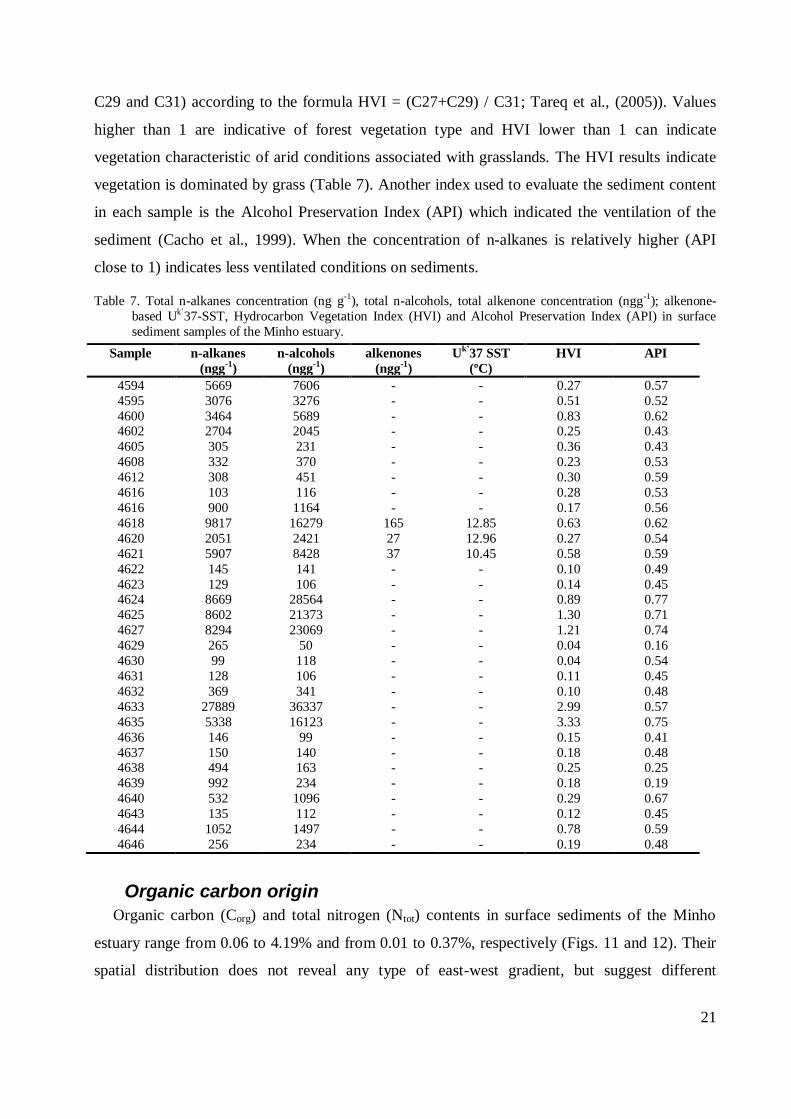
Biomarkers
Only three samples show some alkenone concentration (Table 7) and for estimation SST,
two of these samples show temperatures around 13ºC and the other values around 10.5ºC (Table
7). Additionally we quantified for each sample the Hydrocarbon Vegetation Index (HVI). The
HVI is defined depending on the relative abundances of long chain odd carbon n-alkanes (C27,
21
C29 and C31) according to the formula HVI = (C27+C29) / C31; Tareq et al., (2005)). Values
higher than 1 are indicative of forest vegetation type and HVI lower than 1 can indicate
vegetation characteristic of arid conditions associated with grasslands. The HVI results indicate
vegetation is dominated by grass (Table 7). Another index used to evaluate the sediment content
in each sample is the Alcohol Preservation Index (API) which indicated the ventilation of the
sediment (Cacho et al., 1999). When the concentration of n-alkanes is relatively higher (API
close to 1) indicates less ventilated conditions on sediments.
Table 7. Total n-alkanes concentration (ng g-1), total n-alcohols, total alkenone concentration (ngg-1); alkenone-
based Uk’37-SST, Hydrocarbon Vegetation Index (HVI) and Alcohol Preservation Index (API) in surface
sediment samples of the Minho estuary.
Sample n-alkanes
(ngg-1
)
n-alcohols
(ngg-1
)
alkenones
(ngg-1
)
Uk’
37 SST
(ºC)
HVI API
4594 5669 7606 - - 0.27 0.57
4595 3076 3276 - - 0.51 0.52
4600 3464 5689 - - 0.83 0.62 4602 2704 2045 - - 0.25 0.43
4605 305 231 - - 0.36 0.43
4608 332 370 - - 0.23 0.53
4612 308 451 - - 0.30 0.59
4616 103 116 - - 0.28 0.53
4616 900 1164 - - 0.17 0.56
4618 9817 16279 165 12.85 0.63 0.62
4620 2051 2421 27 12.96 0.27 0.54
4621 5907 8428 37 10.45 0.58 0.59
4622 145 141 - - 0.10 0.49
4623 129 106 - - 0.14 0.45 4624 8669 28564 - - 0.89 0.77
4625 8602 21373 - - 1.30 0.71
4627 8294 23069 - - 1.21 0.74
4629 265 50 - - 0.04 0.16
4630 99 118 - - 0.04 0.54
4631 128 106 - - 0.11 0.45
4632 369 341 - - 0.10 0.48
4633 27889 36337 - - 2.99 0.57
4635 5338 16123 - - 3.33 0.75
4636 146 99 - - 0.15 0.41
4637 150 140 - - 0.18 0.48 4638 494 163 - - 0.25 0.25
4639 992 234 - - 0.18 0.19
4640 532 1096 - - 0.29 0.67
4643 135 112 - - 0.12 0.45
4644 1052 1497 - - 0.78 0.59
4646 256 234 - - 0.19 0.48
Organic carbon origin
Organic carbon (Corg) and total nitrogen (Ntot) contents in surface sediments of the Minho
estuary range from 0.06 to 4.19% and from 0.01 to 0.37%, respectively (Figs. 11 and 12). Their
spatial distribution does not reveal any type of east-west gradient, but suggest different
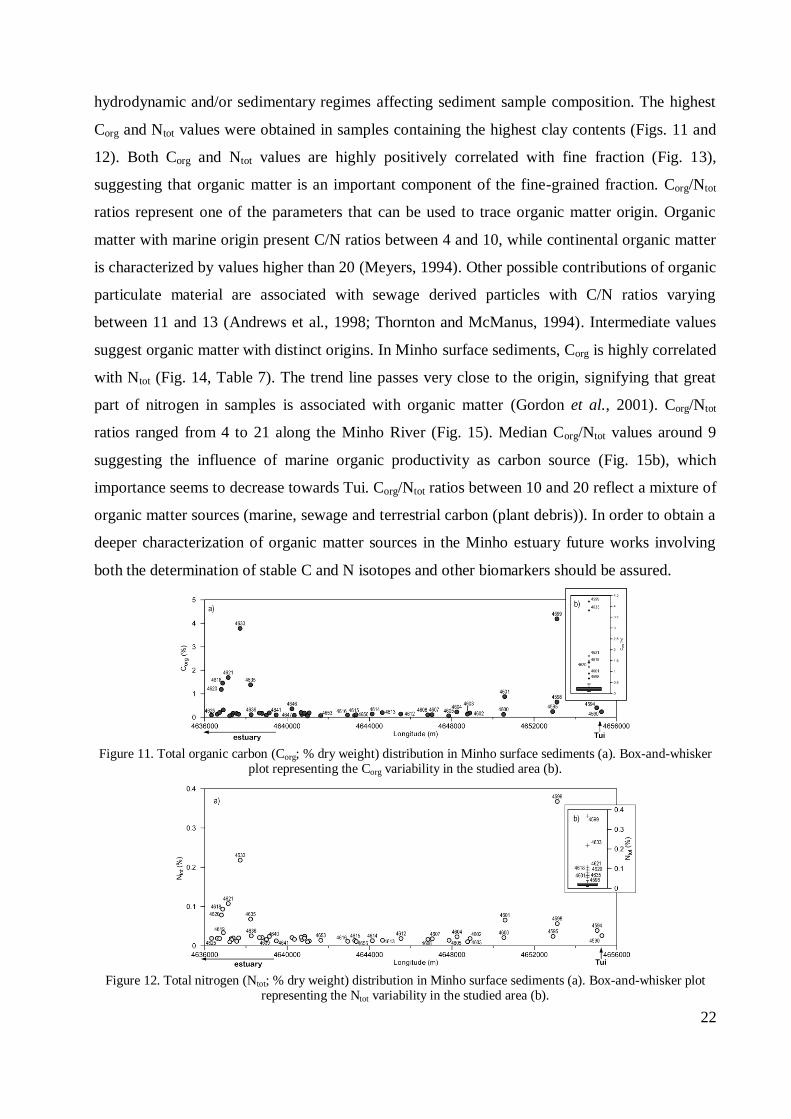
22
hydrodynamic and/or sedimentary regimes affecting sediment sample composition. The highest
Corg and Ntot values were obtained in samples containing the highest clay contents (Figs. 11 and
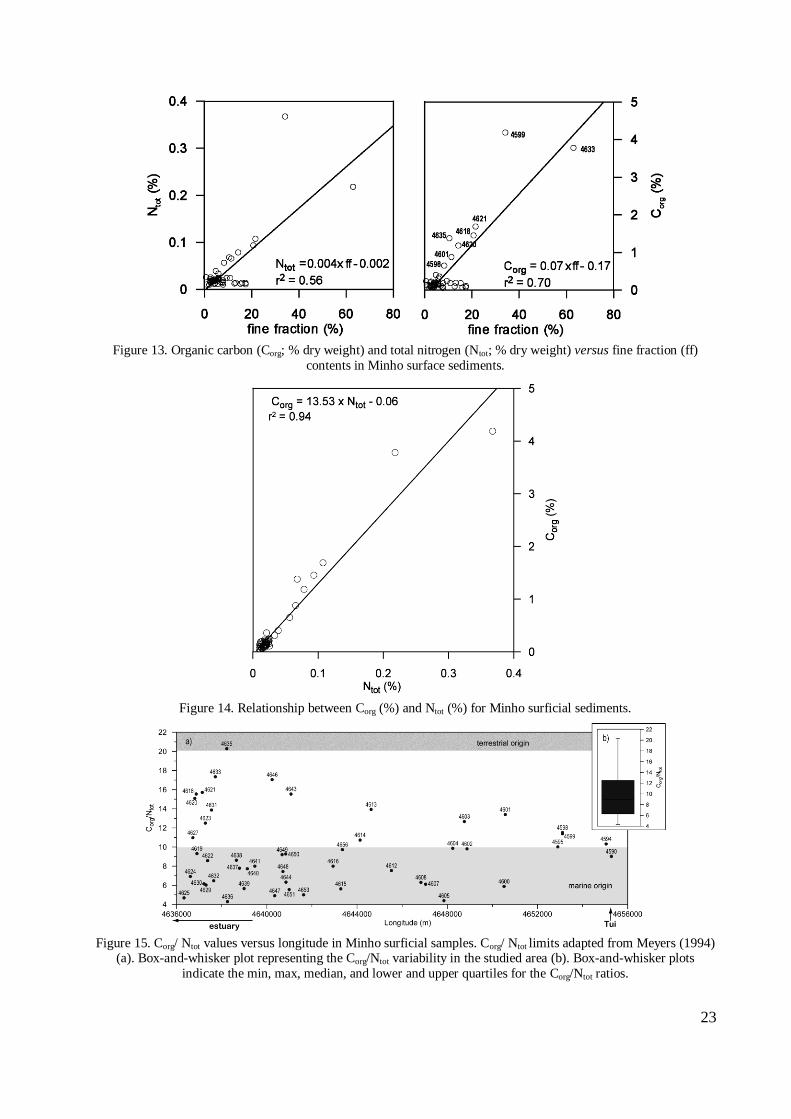
12). Both Corg and Ntot values are highly positively correlated with fine fraction (Fig. 13),
suggesting that organic matter is an important component of the fine-grained fraction. Corg/Ntot
ratios represent one of the parameters that can be used to trace organic matter origin. Organic
matter with marine origin present C/N ratios between 4 and 10, while continental organic matter
is characterized by values higher than 20 (Meyers, 1994). Other possible contributions of organic
particulate material are associated with sewage derived particles with C/N ratios varying
between 11 and 13 (Andrews et al., 1998; Thornton and McManus, 1994). Intermediate values
suggest organic matter with distinct origins. In Minho surface sediments, Corg is highly correlated
with Ntot (Fig. 14, Table 7). The trend line passes very close to the origin, signifying that great
part of nitrogen in samples is associated with organic matter (Gordon et al., 2001). Corg/Ntot
ratios ranged from 4 to 21 along the Minho River (Fig. 15). Median Corg/Ntot values around 9
suggesting the influence of marine organic productivity as carbon source (Fig. 15b), which
importance seems to decrease towards Tui. Corg/Ntot ratios between 10 and 20 reflect a mixture of
organic matter sources (marine, sewage and terrestrial carbon (plant debris)). In order to obtain a
deeper characterization of organic matter sources in the Minho estuary future works involving
both the determination of stable C and N isotopes and other biomarkers should be assured.
Figure 11. Total organic carbon (Corg; % dry weight) distribution in Minho surface sediments (a). Box-and-whisker
plot representing the Corg variability in the studied area (b).
Figure 12. Total nitrogen (Ntot; % dry weight) distribution in Minho surface sediments (a). Box-and-whisker plot representing the Ntot variability in the studied area (b).
23
Figure 13. Organic carbon (Corg; % dry weight) and total nitrogen (Ntot; % dry weight) versus fine fraction (ff)
contents in Minho surface sediments.
Figure 14. Relationship between Corg (%) and Ntot (%) for Minho surficial sediments.
Figure 15. Corg/ Ntot values versus longitude in Minho surficial samples. Corg/ Ntot limits adapted from Meyers (1994) (a). Box-and-whisker plot representing the Corg/Ntot variability in the studied area (b). Box-and-whisker plots
indicate the min, max, median, and lower and upper quartiles for the Corg/Ntot ratios.
24
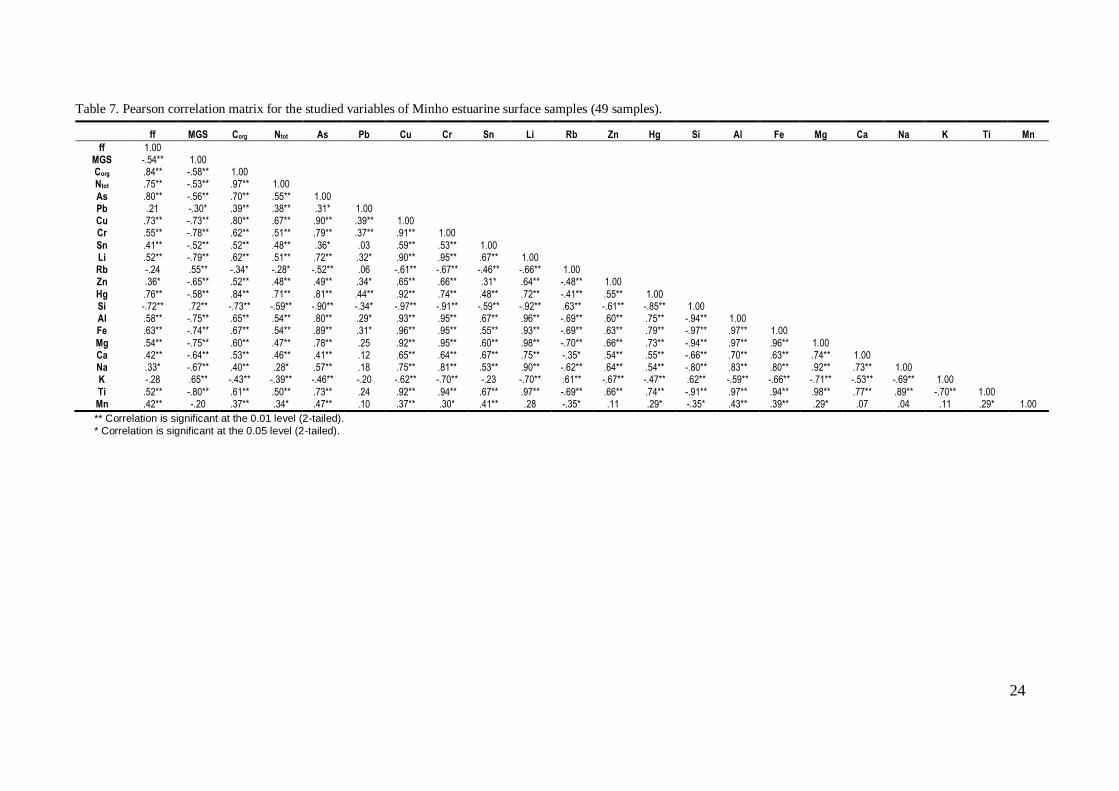
Table 7. Pearson correlation matrix for the studied variables of Minho estuarine surface samples (49 samples).
ff MGS Corg Ntot As Pb Cu Cr Sn Li Rb Zn Hg Si Al Fe Mg Ca Na K Ti Mn
ff 1.00 MGS -.54** 1.00 Corg .84** -.58** 1.00 Ntot .75** -.53** .97** 1.00
As .80** -.56** .70** .55** 1.00 Pb .21 -.30* .39** .38** .31* 1.00 Cu .73** -.73** .80** .67** .90** .39** 1.00 Cr .55** -.78** .62** .51** .79** .37** .91** 1.00
Sn .41** -.52** .52** .48** .36* .03 .59** .53** 1.00 Li .52** -.79** .62** .51** .72** .32* .90** .95** .67** 1.00 Rb -.24 .55** -.34* -.28* -.52** .06 -.61** -.67** -.46** -.66** 1.00 Zn .36* -.65** .52** .48** .49** .34* .65** .66** .31* .64** -.48** 1.00
Hg .76** -.58** .84** .71** .81** .44** .92** .74** .48** .72** -.41** .55** 1.00 Si -.72** .72** -.73** -.59** -.90** -.34* -.97** -.91** -.59** -.92** .63** -.61** -.85** 1.00 Al .58** -.75** .65** .54** .80** .29* .93** .95** .67** .96** -.69** .60** .75** -.94** 1.00 Fe .63** -.74** .67** .54** .89** .31* .96** .95** .55** .93** -.69** .63** .79** -.97** .97** 1.00
Mg .54** -.75** .60** .47** .78** .25 .92** .95** .60** .98** -.70** .66** .73** -.94** .97** .96** 1.00 Ca .42** -.64** .53** .46** .41** .12 .65** .64** .67** .75** -.35* .54** .55** -.66** .70** .63** .74** 1.00 Na .33* -.67** .40** .28* .57** .18 .75** .81** .53** .90** -.62** .64** .54** -.80** .83** .80** .92** .73** 1.00 K -.28 .65** -.43** -.39** -.46** -.20 -.62** -.70** -.23 -.70** .61** -.67** -.47** .62** -.59** -.66** -.71** -.53** -.69** 1.00
Ti .52** -.80** .61** .50** .73** .24 .92** .94** .67** .97** -.69** .66** .74** -.91** .97** .94** .98** .77** .89** -.70** 1.00 Mn .42** -.20 .37** .34* .47** .10 .37** .30* .41** .28 -.35* .11 .29* -.35* .43** .39** .29* .07 .04 .11 .29* 1.00
** Correlation is significant at the 0.01 level (2-tailed).
* Correlation is significant at the 0.05 level (2-tailed).
25
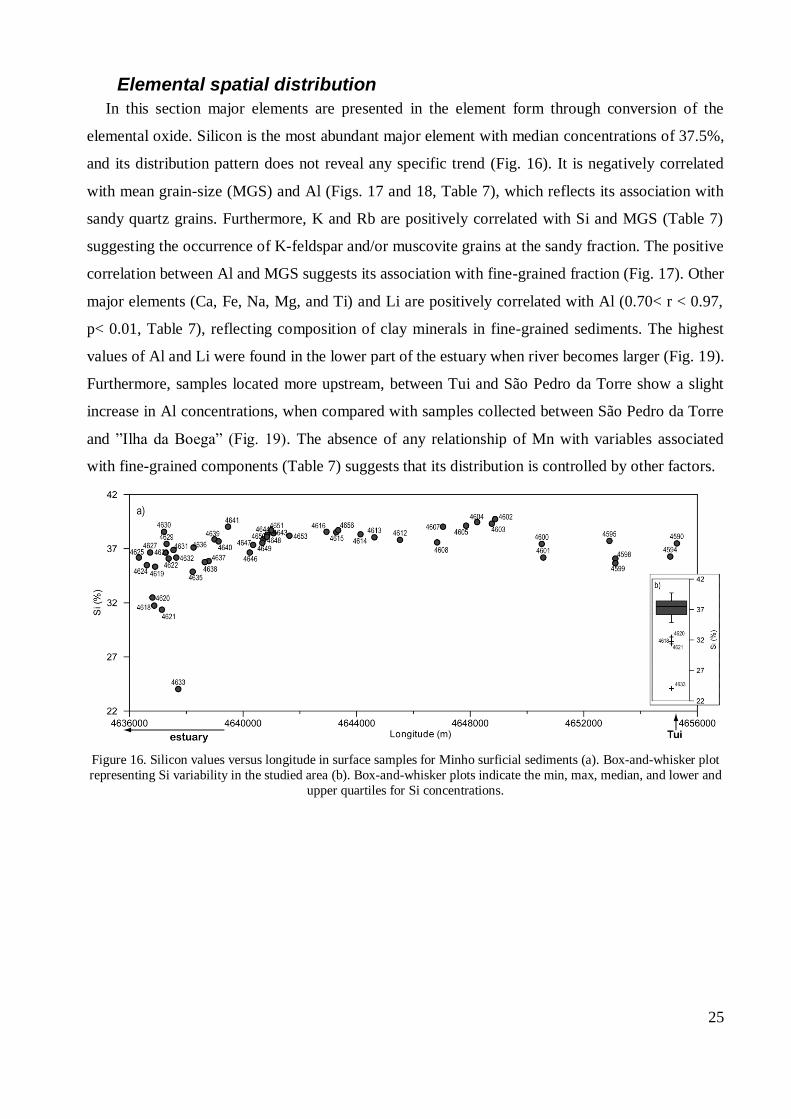
Elemental spatial distribution
In this section major elements are presented in the element form through conversion of the
elemental oxide. Silicon is the most abundant major element with median concentrations of 37.5%,
and its distribution pattern does not reveal any specific trend (Fig. 16). It is negatively correlated
with mean grain-size (MGS) and Al (Figs. 17 and 18, Table 7), which reflects its association with
sandy quartz grains. Furthermore, K and Rb are positively correlated with Si and MGS (Table 7)
suggesting the occurrence of K-feldspar and/or muscovite grains at the sandy fraction. The positive
correlation between Al and MGS suggests its association with fine-grained fraction (Fig. 17). Other
major elements (Ca, Fe, Na, Mg, and Ti) and Li are positively correlated with Al (0.70< r < 0.97,
p< 0.01, Table 7), reflecting composition of clay minerals in fine-grained sediments. The highest
values of Al and Li were found in the lower part of the estuary when river becomes larger (Fig. 19).
Furthermore, samples located more upstream, between Tui and São Pedro da Torre show a slight
increase in Al concentrations, when compared with samples collected between São Pedro da Torre
and ”Ilha da Boega” (Fig. 19). The absence of any relationship of Mn with variables associated
with fine-grained components (Table 7) suggests that its distribution is controlled by other factors.
Figure 16. Silicon values versus longitude in surface samples for Minho surficial sediments (a). Box-and-whisker plot
representing Si variability in the studied area (b). Box-and-whisker plots indicate the min, max, median, and lower and
upper quartiles for Si concentrations.
26
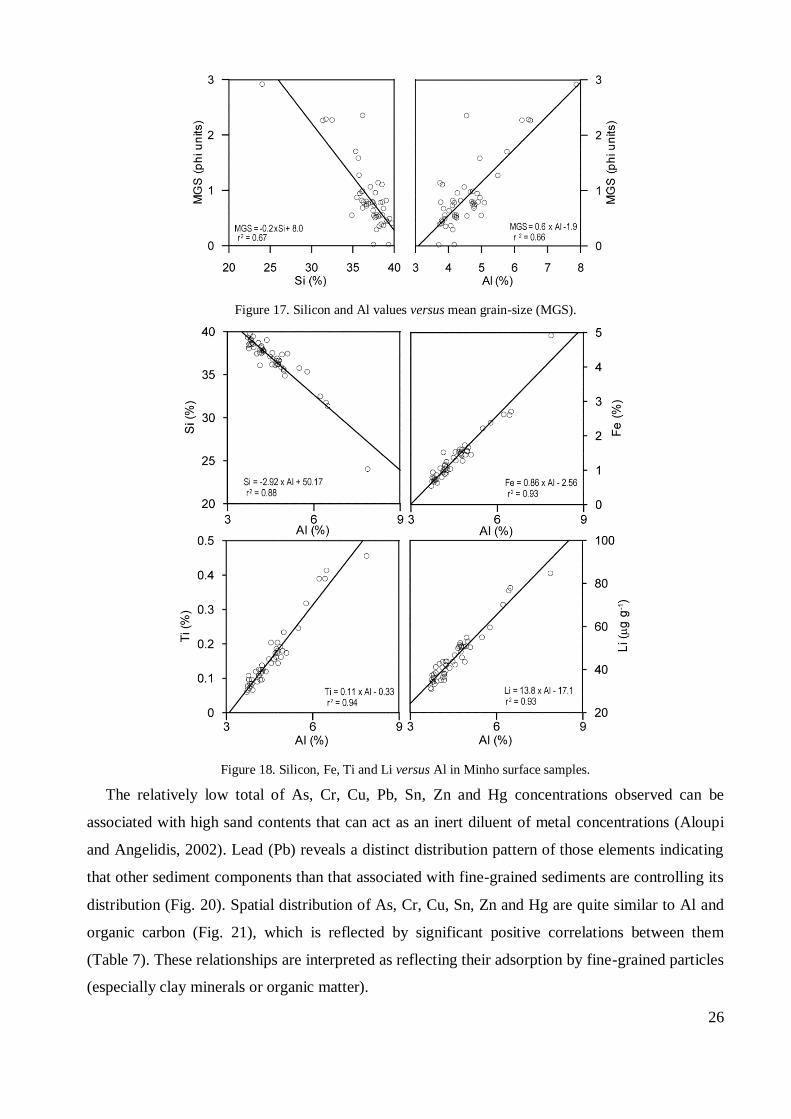
Figure 17. Silicon and Al values versus mean grain-size (MGS).
Figure 18. Silicon, Fe, Ti and Li versus Al in Minho surface samples.
The relatively low total of As, Cr, Cu, Pb, Sn, Zn and Hg concentrations observed can be
associated with high sand contents that can act as an inert diluent of metal concentrations (Aloupi
and Angelidis, 2002). Lead (Pb) reveals a distinct distribution pattern of those elements indicating
that other sediment components than that associated with fine-grained sediments are controlling its
distribution (Fig. 20). Spatial distribution of As, Cr, Cu, Sn, Zn and Hg are quite similar to Al and
organic carbon (Fig. 21), which is reflected by significant positive correlations between them
(Table 7). These relationships are interpreted as reflecting their adsorption by fine-grained particles
(especially clay minerals or organic matter).
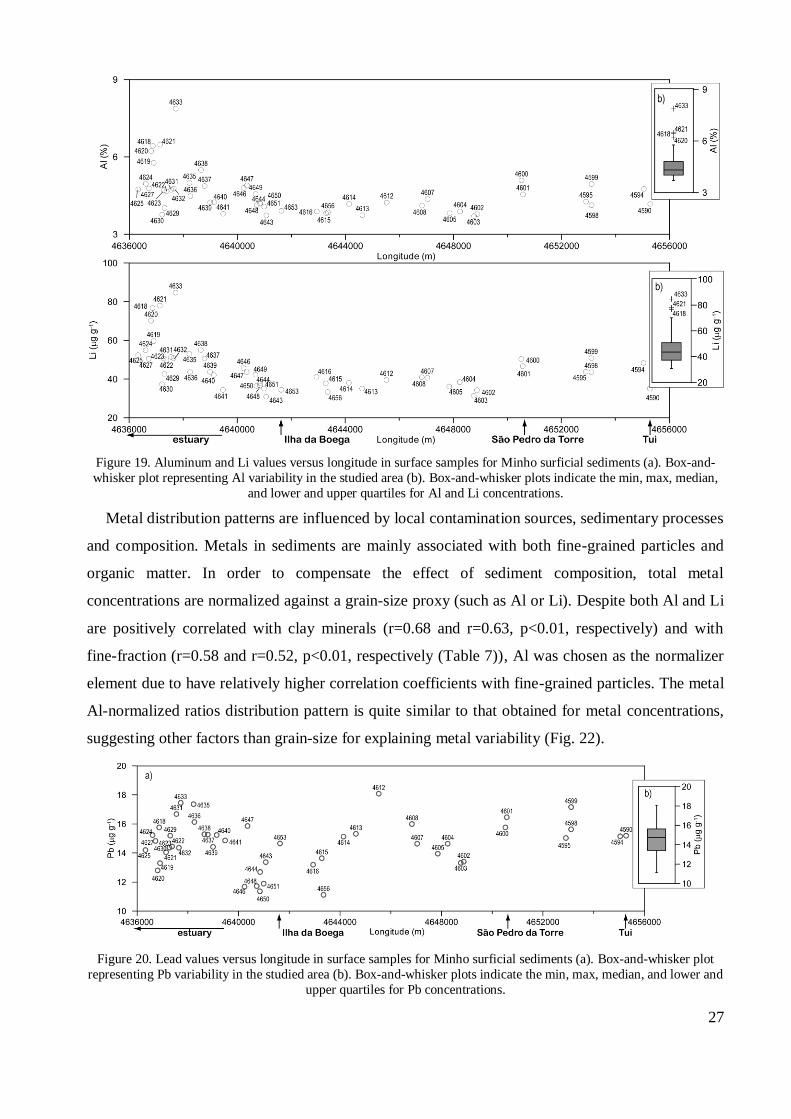
27
Figure 19. Aluminum and Li values versus longitude in surface samples for Minho surficial sediments (a). Box-and-
whisker plot representing Al variability in the studied area (b). Box-and-whisker plots indicate the min, max, median,
and lower and upper quartiles for Al and Li concentrations.
Metal distribution patterns are influenced by local contamination sources, sedimentary processes
and composition. Metals in sediments are mainly associated with both fine-grained particles and
organic matter. In order to compensate the effect of sediment composition, total metal
concentrations are normalized against a grain-size proxy (such as Al or Li). Despite both Al and Li
are positively correlated with clay minerals (r=0.68 and r=0.63, p<0.01, respectively) and with
fine-fraction (r=0.58 and r=0.52, p<0.01, respectively (Table 7)), Al was chosen as the normalizer
element due to have relatively higher correlation coefficients with fine-grained particles. The metal
Al-normalized ratios distribution pattern is quite similar to that obtained for metal concentrations,
suggesting other factors than grain-size for explaining metal variability (Fig. 22).
Figure 20. Lead values versus longitude in surface samples for Minho surficial sediments (a). Box-and-whisker plot
representing Pb variability in the studied area (b). Box-and-whisker plots indicate the min, max, median, and lower and
upper quartiles for Pb concentrations.
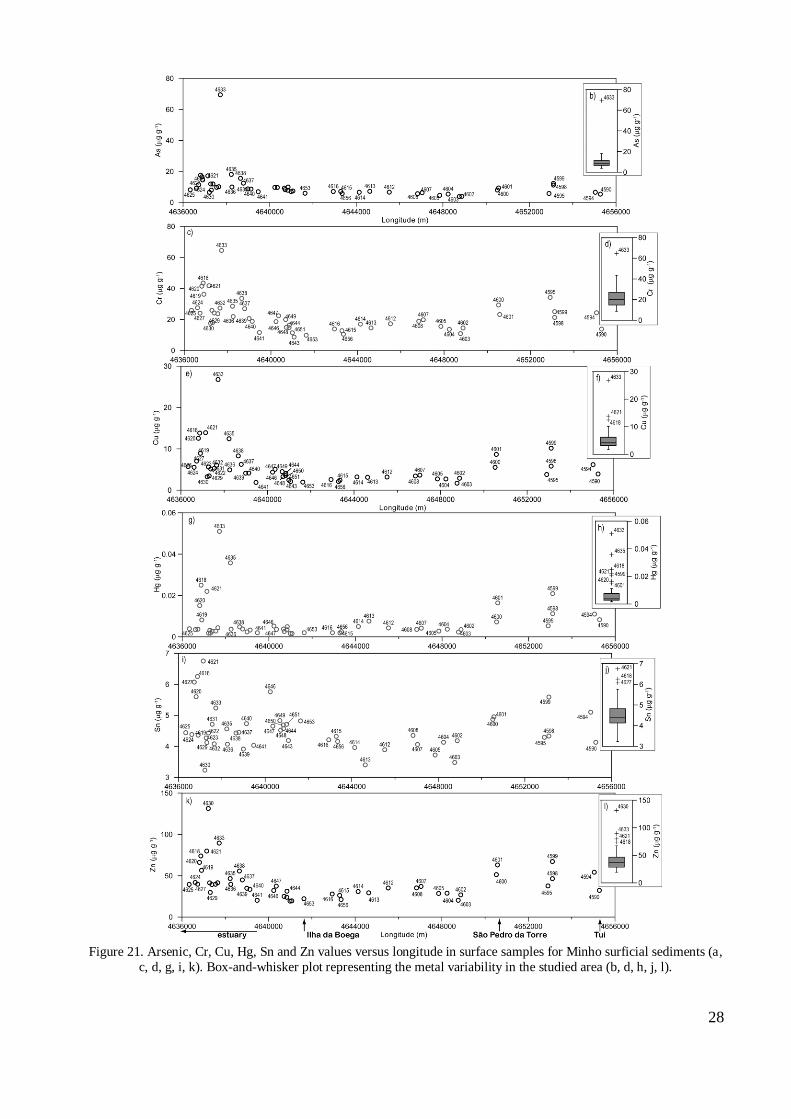
28
Figure 21. Arsenic, Cr, Cu, Hg, Sn and Zn values versus longitude in surface samples for Minho surficial sediments (a,
c, d, g, i, k). Box-and-whisker plot representing the metal variability in the studied area (b, d, h, j, l).
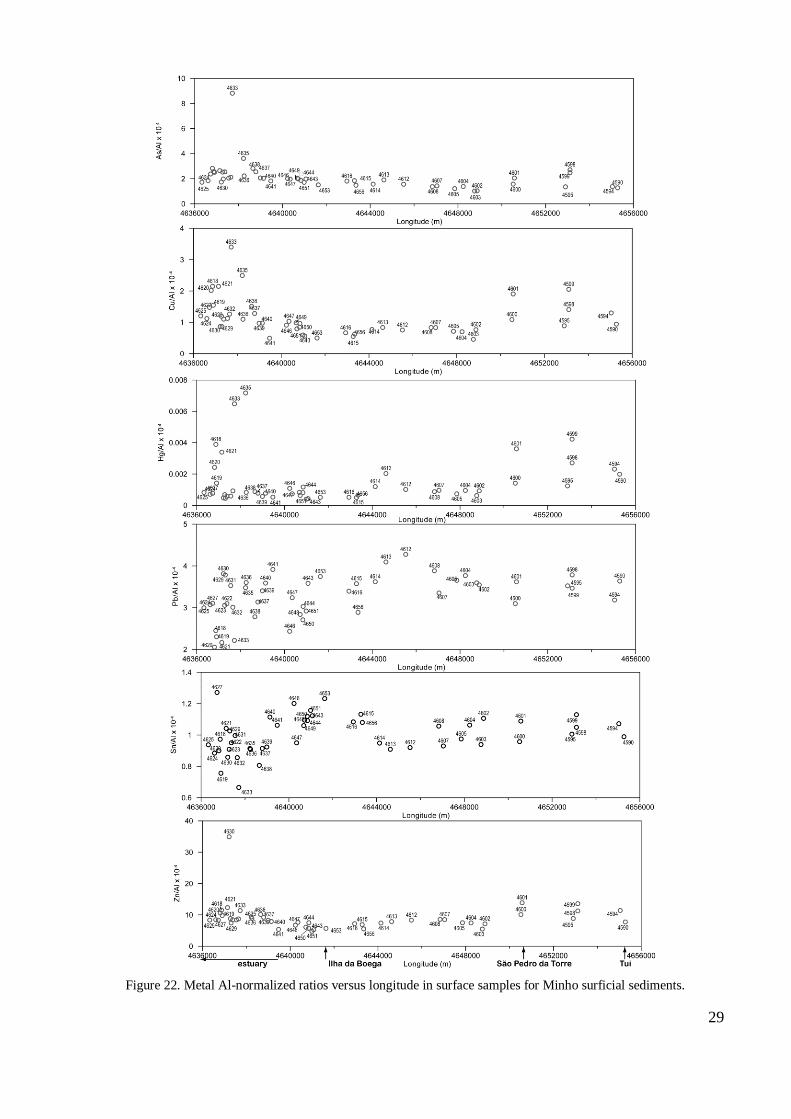
29
Figure 22. Metal Al-normalized ratios versus longitude in surface samples for Minho surficial sediments.
30
Sediment components
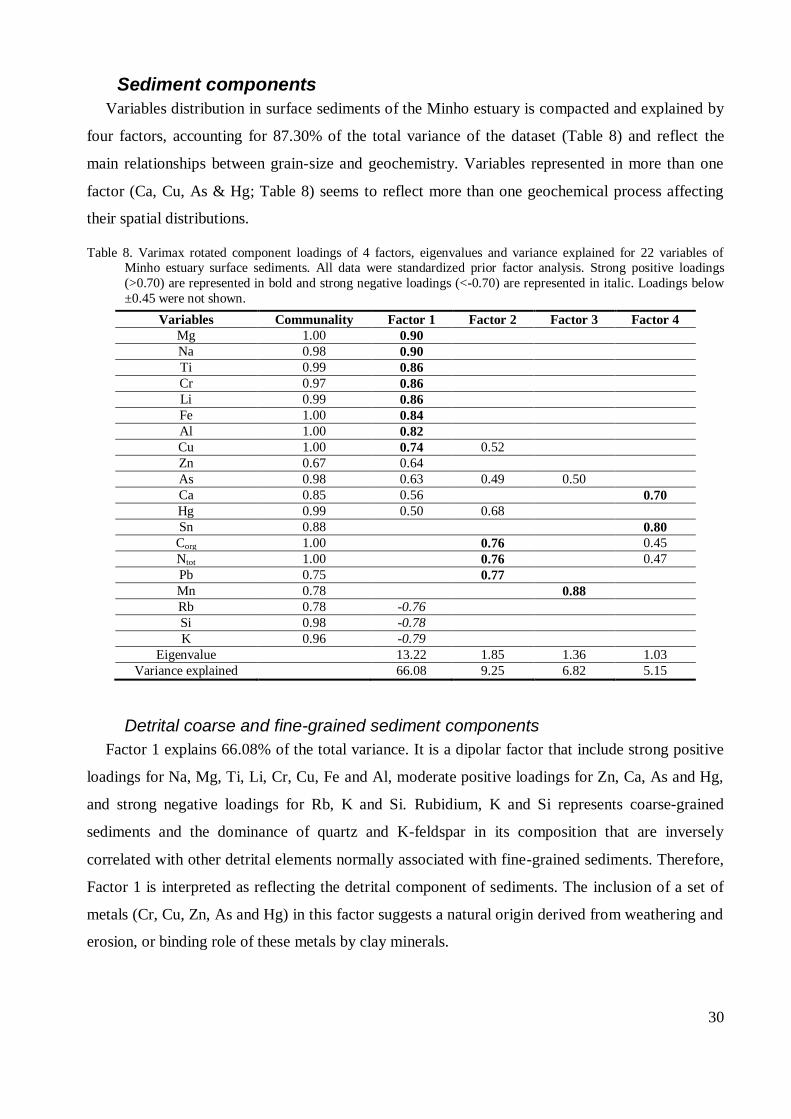
Variables distribution in surface sediments of the Minho estuary is compacted and explained by
four factors, accounting for 87.30% of the total variance of the dataset (Table 8) and reflect the
main relationships between grain-size and geochemistry. Variables represented in more than one
factor (Ca, Cu, As & Hg; Table 8) seems to reflect more than one geochemical process affecting
their spatial distributions.
Table 8. Varimax rotated component loadings of 4 factors, eigenvalues and variance explained for 22 variables of Minho estuary surface sediments. All data were standardized prior factor analysis. Strong positive loadings
(>0.70) are represented in bold and strong negative loadings (<-0.70) are represented in italic. Loadings below
±0.45 were not shown.
Variables Communality Factor 1 Factor 2 Factor 3 Factor 4
Mg 1.00 0.90
Na 0.98 0.90
Ti 0.99 0.86
Cr 0.97 0.86
Li 0.99 0.86
Fe 1.00 0.84
Al 1.00 0.82
Cu 1.00 0.74 0.52
Zn 0.67 0.64
As 0.98 0.63 0.49 0.50
Ca 0.85 0.56 0.70
Hg 0.99 0.50 0.68
Sn 0.88 0.80
Corg 1.00 0.76 0.45
Ntot 1.00 0.76 0.47
Pb 0.75 0.77
Mn 0.78 0.88
Rb 0.78 -0.76
Si 0.98 -0.78
K 0.96 -0.79
Eigenvalue 13.22 1.85 1.36 1.03
Variance explained 66.08 9.25 6.82 5.15
Detrital coarse and fine-grained sediment components
Factor 1 explains 66.08% of the total variance. It is a dipolar factor that include strong positive
loadings for Na, Mg, Ti, Li, Cr, Cu, Fe and Al, moderate positive loadings for Zn, Ca, As and Hg,
and strong negative loadings for Rb, K and Si. Rubidium, K and Si represents coarse-grained
sediments and the dominance of quartz and K-feldspar in its composition that are inversely
correlated with other detrital elements normally associated with fine-grained sediments. Therefore,
Factor 1 is interpreted as reflecting the detrital component of sediments. The inclusion of a set of
metals (Cr, Cu, Zn, As and Hg) in this factor suggests a natural origin derived from weathering and
erosion, or binding role of these metals by clay minerals.
31
Component associated with urban and industrial contamination
Factor 2 contains variables that together represent 9.25% of the total variance. This component
includes strong positive loadings for Corg, Ntot and Pb, and moderate positive loadings for Hg and
Cu, suggesting binding of metals (Pb, Hg and Cu) to organic matter and indicating its role as
controlling agent of the distribution of these metals in Minho surface sediments. A similar behavior
for Pb and Cu (Hg was not determined) was obtained in sediments of the Louro River (one of the
last tributary of the Minho River, see Fig. 1) that drains important industrial and urban areas
(Filgueiras et al., 2004). Furthermore, this result agrees with the 2000 report “Plano de Bacia
Hidrográfica do Rio Minho” that identifies water fecal contamination as one of the major concerns
threatening quality of the Minho River waters (FBO-HLC-DRENA-PROFABRIL-AGRI-
PROAmbiente, 2000), that can be imprinted in sediments. The obtained results suggest a
contamination source related to urban and industrial effluents.
Mn oxi-hydroxide sediment component
Variables included in Factor 3 accounts for 6.82% of the total variance. Manganese showed the
stronger loading in this factor, while As is also identified. Association between Mn and As suggests
that As can be binded to Mn oxi-hydroxides coatings in its structure. A possible origin for As (like
for Sn) can be related to its use in anti-fouling paints. Nevertheless, the presence of As at three
factors (1, 2 and 3) with moderate loadings suggests distinct origins, or geochemical processes that
affect As distribution.
Component associated with contamination by nautical activities
Factor 4 accounts for 5.15% of the total variance. It shows strong positive loadings for Sn and
Ca, and moderate positive loadings for Corg and Ntot. This factor seems to reflect binding of Sn and
Ca with organic matter. The presence of Sn could be associated with nautical activities sources
(recreational boats) through the use of Sn compounds in anti-fouling paints. Despite their use being
forbidden since 2008, obtained results for surface samples suggest persistency of contamination
sources or remobilization of pre-2008 contaminated sediments.
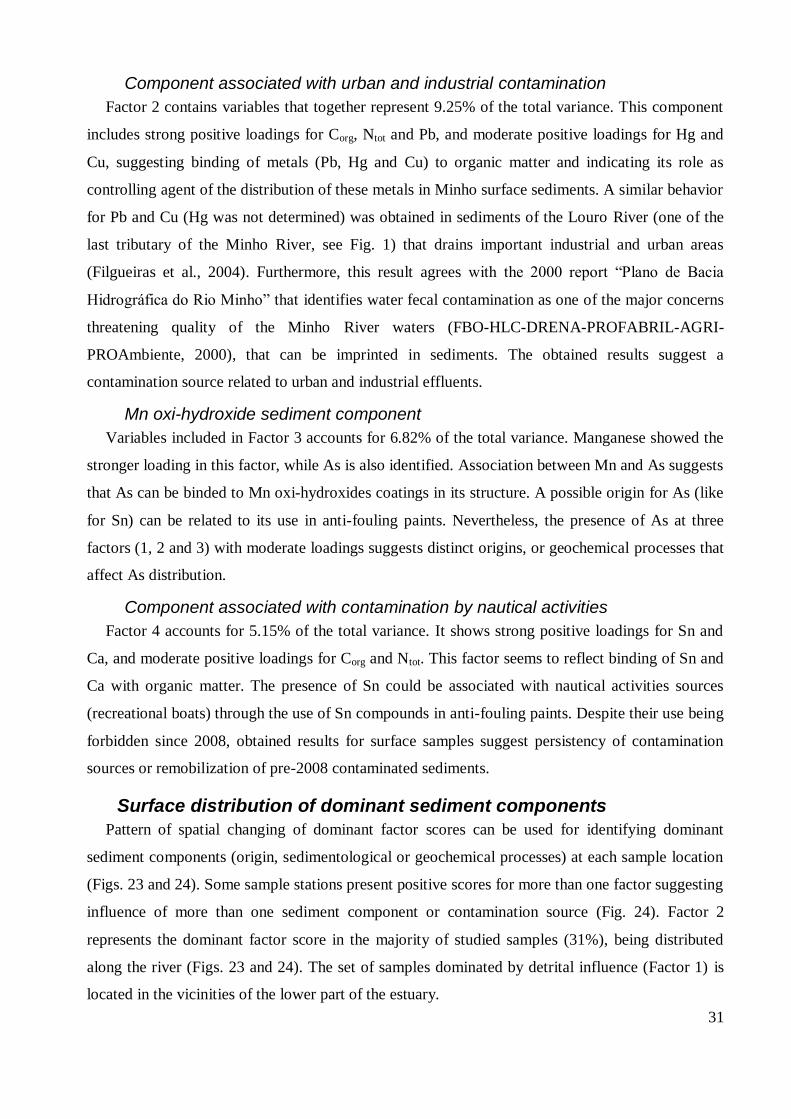
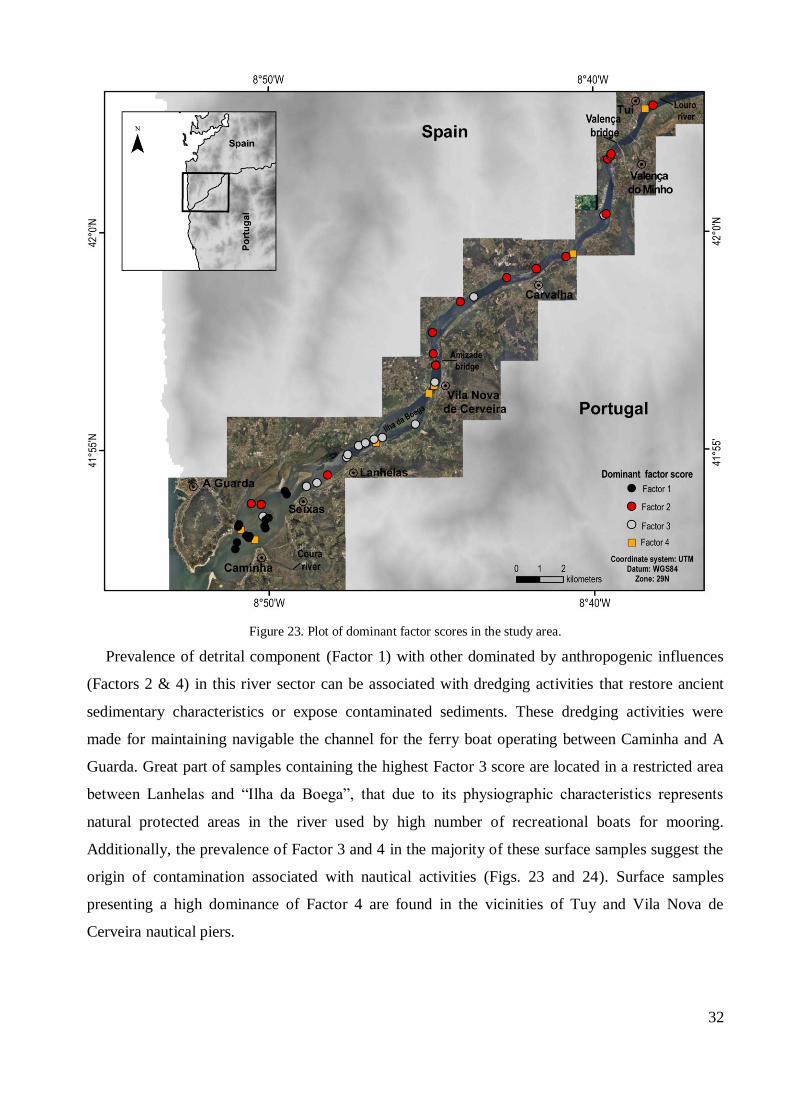
Surface distribution of dominant sediment components
Pattern of spatial changing of dominant factor scores can be used for identifying dominant
sediment components (origin, sedimentological or geochemical processes) at each sample location
(Figs. 23 and 24). Some sample stations present positive scores for more than one factor suggesting
influence of more than one sediment component or contamination source (Fig. 24). Factor 2
represents the dominant factor score in the majority of studied samples (31%), being distributed
along the river (Figs. 23 and 24). The set of samples dominated by detrital influence (Factor 1) is
located in the vicinities of the lower part of the estuary.
32
Figure 23. Plot of dominant factor scores in the study area.
Prevalence of detrital component (Factor 1) with other dominated by anthropogenic influences
(Factors 2 & 4) in this river sector can be associated with dredging activities that restore ancient
sedimentary characteristics or expose contaminated sediments. These dredging activities were
made for maintaining navigable the channel for the ferry boat operating between Caminha and A
Guarda. Great part of samples containing the highest Factor 3 score are located in a restricted area
between Lanhelas and “Ilha da Boega”, that due to its physiographic characteristics represents
natural protected areas in the river used by high number of recreational boats for mooring.
Additionally, the prevalence of Factor 3 and 4 in the majority of these surface samples suggest the
origin of contamination associated with nautical activities (Figs. 23 and 24). Surface samples
presenting a high dominance of Factor 4 are found in the vicinities of Tuy and Vila Nova de
Cerveira nautical piers.
33
Figure 24. Factor scores for each studied sample.
34
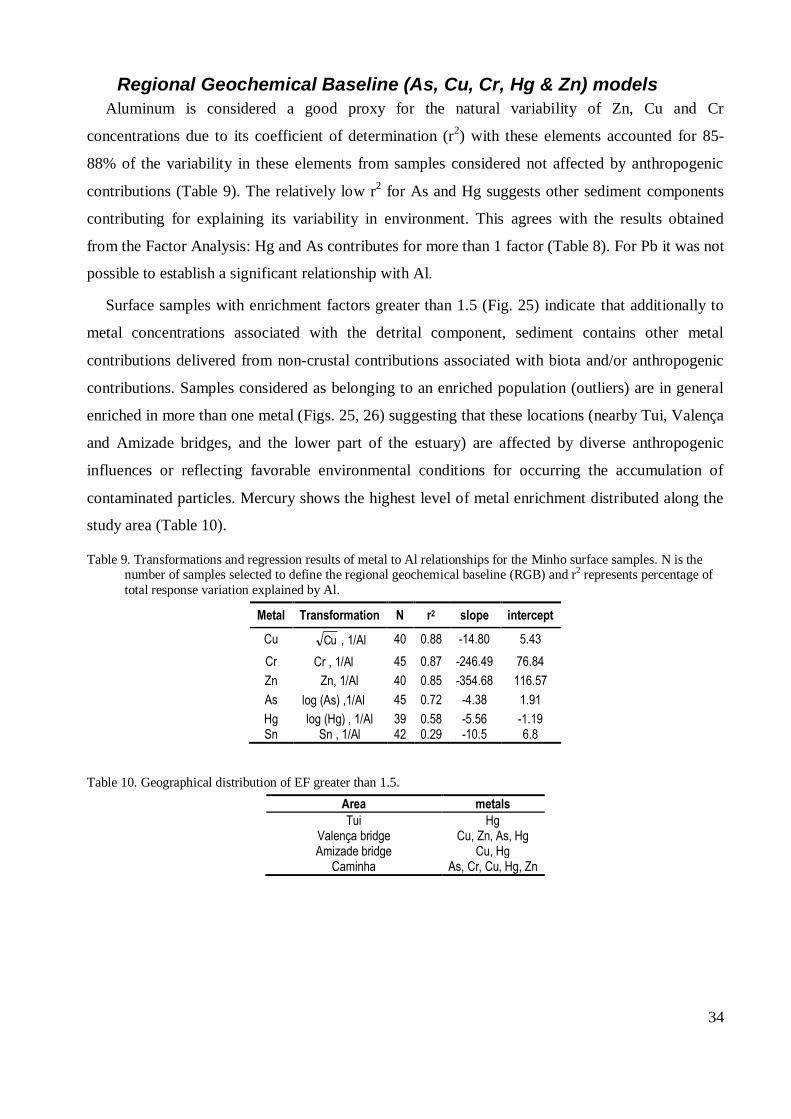
Regional Geochemical Baseline (As, Cu, Cr, Hg & Zn) models
Aluminum is considered a good proxy for the natural variability of Zn, Cu and Cr
concentrations due to its coefficient of determination (r2) with these elements accounted for 85-
88% of the variability in these elements from samples considered not affected by anthropogenic
contributions (Table 9). The relatively low r2 for As and Hg suggests other sediment components
contributing for explaining its variability in environment. This agrees with the results obtained
from the Factor Analysis: Hg and As contributes for more than 1 factor (Table 8). For Pb it was not
possible to establish a significant relationship with Al.
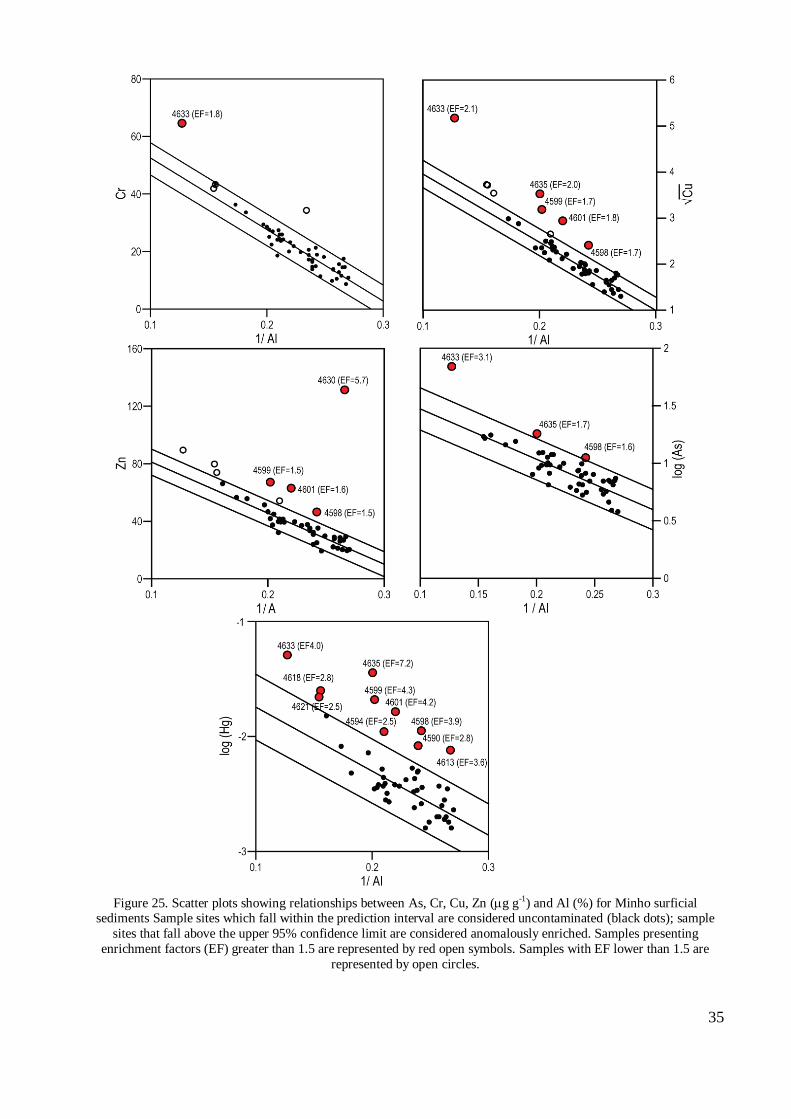
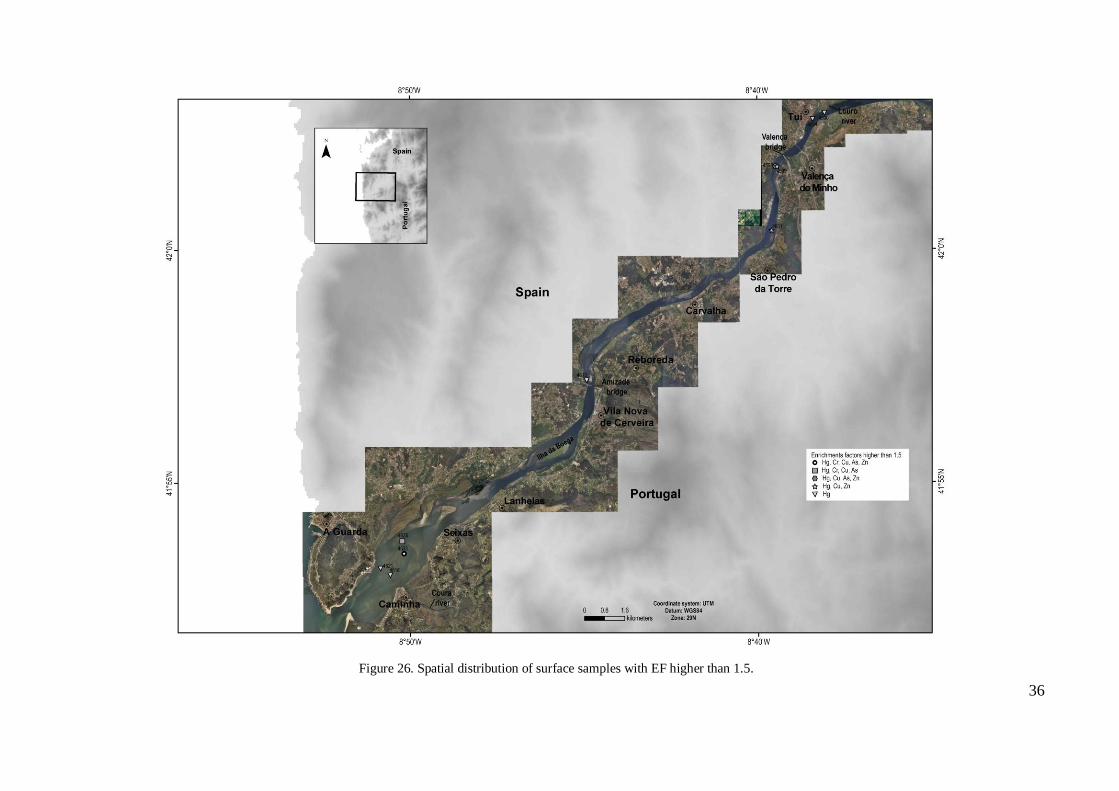
Surface samples with enrichment factors greater than 1.5 (Fig. 25) indicate that additionally to
metal concentrations associated with the detrital component, sediment contains other metal
contributions delivered from non-crustal contributions associated with biota and/or anthropogenic
contributions. Samples considered as belonging to an enriched population (outliers) are in general
enriched in more than one metal (Figs. 25, 26) suggesting that these locations (nearby Tui, Valença
and Amizade bridges, and the lower part of the estuary) are affected by diverse anthropogenic
influences or reflecting favorable environmental conditions for occurring the accumulation of
contaminated particles. Mercury shows the highest level of metal enrichment distributed along the
study area (Table 10).
Table 9. Transformations and regression results of metal to Al relationships for the Minho surface samples. N is the number of samples selected to define the regional geochemical baseline (RGB) and r2 represents percentage of
total response variation explained by Al.
Metal Transformation N r2 slope intercept
Cu Cu , 1/Al 40 0.88 -14.80 5.43
Cr Cr , 1/Al 45 0.87 -246.49 76.84
Zn Zn, 1/Al 40 0.85 -354.68 116.57
As log (As) ,1/Al 45 0.72 -4.38 1.91
Hg log (Hg) , 1/Al 39 0.58 -5.56 -1.19 Sn Sn , 1/Al 42 0.29 -10.5 6.8
Table 10. Geographical distribution of EF greater than 1.5.
Area metals
Tui Hg Valença bridge Cu, Zn, As, Hg Amizade bridge Cu, Hg
Caminha As, Cr, Cu, Hg, Zn
35
Figure 25. Scatter plots showing relationships between As, Cr, Cu, Zn (g g-1) and Al (%) for Minho surficial
sediments Sample sites which fall within the prediction interval are considered uncontaminated (black dots); sample
sites that fall above the upper 95% confidence limit are considered anomalously enriched. Samples presenting
enrichment factors (EF) greater than 1.5 are represented by red open symbols. Samples with EF lower than 1.5 are
represented by open circles.
36
Figure 26. Spatial distribution of surface samples with EF higher than 1.5.
37
Conclusions
The sandy character of surface sediments reflects the high river dynamics that are responsible
for maintaining in suspension fine-grained particles and exporting them to the sea. The relatively
coarse-grained composition of surface sediments studied explains the relatively low total metal
concentrations. Due to that, the comparison of total metal concentrations with reference values by
itself was not considered adequate for a correct identification of possible anthropogenic
enrichments because not accounts for the regional variability. The research approach applied in this
study integrates multivariate analysis together with definition of regional metal baselines. While
Factor Analysis allows grouping elements according to sediment properties (geochemical
processes) that can be related to identification of contamination sources, regional baseline models
allows to estimate natural components of studied metals in sediments, to identify enriched samples
and to estimate the level of metal enrichment.
Factor Analysis of Minho River sediments geochemical dataset explained 87.30% of the total
variability, reflecting the elemental relationships with grain size and their natural and
anthropogenic sources. The elements grouped in Factor 1 are associated with both fine (Na-Mg-Ti-
Li-Cr-Cu-Fe-Al-Zn-Ca-As-Hg) and coarse-grained (Rb-K-Si) sediment components. The group
Corg-Ntot-Pb-Hg-Cu, named Factor 2, is related to urban and industrial contamination sources and
reflecting the importance of organic matter in binding Pb, Cu and Hg in its structure. Factor 3, that
grouped Mn and As, probably reflect the retention of As in the structure of Mn oxi-hydroxides
coatings. The group of Sn-Ca- Corg-Ntot, named Factor 4, suggests the binding of Sn and Ca with
organic matter. Tin (Sn) is interpreted as derived from nautical activities sources (recreational
boats) through the use of Sn compounds in anti-fouling paints. The spatial distribution of the
dominant factor scores allows evidencing spatial patterns of contamination, with urban and
industrial contamination component spread through the study area. In the lower part of the Minho
River, coexisting all sediment components being the detrital component the dominant component
in the surface sediments, probably reflecting the effects of dredging activities that are happening
periodically.
Normalization of metal concentrations to Al allows estimating the detrital component of As, Cu,
Cr and Zn in Minho River sediments. The relatively low coefficient of determination (r2) for Hg
and Sn relatively to Al suggests the influence of other sediment components (in a minor scale Hg),
such as organic matter, controlling its spatial distribution. The identification of metal enriched
locations in areas characterized by coarse-grained sediments (and consequently low total metal
38
concentrations) demonstrates the importance of considering normalized metal concentrations
together with the definition of regional baseline models represents an interpretative approach that
help in the environmental characterization and used as a monitoring tool.
Recommendations
Despite the level of metal enrichment being relatively low, regular sediment sampling
campaigns and sediment chemical analysis needs to be performed in order to monitor the evolution
of sediment contamination, particularly in critical areas, nearby Tui, Vila Nova de Cerveira and in
the vicinities of both bridges. The obtained results should be compared with RGBs determined in
the present study allowing to characterize temporal trends in metal contamination. In order to
assess potential adverse impacts of this contamination on biological organisms, ecotoxicity tests
should be implemented.
The distinct behavior of Sn together with the high number of recreational boats existing in the
Minho River suggests that a set of analytical determinations of boat related compounds, such as
persistent organic pollutants (e.g. polycyclic aromatic hydrocarbons (PAH)) and tin organic
substances ((tributyltin (TBT), dibutyltin (DBT) and monobutyltin (MBT)) should be developed. In
order to get a better characterization of organic matter sources it is suggested to determine, if
possible, stable carbon and nitrogen isotopes and a set of biomarkers (e.g. coprostanol and other
sterols) that are tracers of sewage contamination.
Acknowledgments
This work was financially supported by the Natura Miño-Minho Project (0234 NATURA
MIÑO_MINHO_1_E). We would like to express our gratitude to the RV Atlantic leopard crew.
We also thank to Carlos Antunes for Aquamuseu laboratory facilities support (storage and
sampling of surface sediments during the Minho09 cruise). Special thanks for all UGM-LNEG
collaborators (Cremilde Monteiro, Daniel Ferreira, Sandra Lemos, Warley Soares and Rúben
Borges), who participated in the Minho09 cruise and helped in laboratorial work.
References
Abrantes, F., 1988. Diatoms assemblages as coastal upwelling indicators in surface sediments off Portugal. Marine Geology, 85: 15–39.
Abrantes, F., Gil, I., Lopes, C., Castro, M., 2005. Quantitative diatom analyses – a faster cleaning procedure. Deep Sea Research I, 52: 189–98.
39
Alsharhan, A.S., El-Sammak, A.A., 2004. Grain-size analysis and characterization of sedimentary environments of The United Arab Emirates coastal area. Journal of Coastal Research 20: 464-477.
Aloupi, M., Angelidis, M., 2002. The significance of coarse sediments in metal pollution studies in the coastal zone. Water, Air and Soil Pollution, 133: 121-131.
Alves, A.M.C., 1996. Causas e processos da dinâmica sedimentar na evolução actual do litoral do Alto Minho, PhD thesis, Universidade do Minho, Braga, 442pp.
Andrews, J., Greenaway, A., Dennis, P., 1998. Combined carbon isotope and C/N ratios as indicators of source and fate of organic matter in a poorly flushed, tropical estuary: Hunts Bay, Kingston Harbour, Jamaica. Estuarine, Coastal and Shelf Science, 46: 743 - 756.
Balsinha, M., Santos, I., Alves, A., Oliveira, A., 2009. Textural Composition of Sediments from Minho and Douro Estuaries (Portugal) and Its Relation with Hydrodynamics Journal of Coastal Research, Special Issue 56: 1330-1334.
Battarbee, R.W., 1973. A new method for estimation of absolute microfossil numbers with reference especially to diatoms. Limnology and Oceanography 18, 647–652.
Buckley, D., Smith, J., Winters, G., 1995. Accumulation of contaminant metals in marine sediments of Halifax Harbour, Nova Scotia: environmental factors and historical trends. Applied Geochemistry, 10(2): 175-195.
Cacho, I., Grimalt, J.O., Pelejero, C., Canals, M., Sierro, F.J., Flores, J.A., Shackleton, N., 1999. Dansgaard-Oeschger and Heinrich Event Imprints in Alboran Sea Paleotemperatures. Paleoceanography, 14(6): 698-705.
Cato, I., 1977. Recent sedimentological and geochemical conditions and pollution problems in two marine areas in Soutwestern Sweden, Striae, pp. 1 - 150.
Cato, I., 1989. Normalization of heavy metal data by the gradient method, ICES, pp. 88-108.
Edwards, A.C., 2001. Grain-size and sorting in modern sands, Journal of Coastal Research, 17: 38-52.
Fatela, F., Moreno, J., Moreno, F., Araújo, M.F., Valente, T., Antunes, C., Taborda, R., Andrade, C., Drago, T., 2009. Environmental constraints of foraminiferal assemblages distribution across a brackish tidal marsh (Caminha, NW Portugal). Marine Micropaleontology, 70(1-2): 70-88.
FBO-HLC-DRENA-PROFABRIL-AGRI-PROAmbiente, 2000. Plano de Bacia Hidrográfica do Rio Minho.
Filgueiras, A., Lavilla, I., Bendicho, C., 2004. Evaluation of distribution, mobility and binding behaviour of heavy metals in surficial sediments of Louro River (Galicia, Spain) using chemometric analysis: a case study. Science of The Total Environment, 330(1-3): 115-129.
Folk, R., Ward, W., 1957. Brazos river bar: A study in the significance of grain size parameters, Journal of Sedimentary Petrology, 27: 3-36.
Folk, R., 1980. Petrology of sedimentary rocks, Hemphill Publishing Company, 182pp.
Gordon, E., Goni, M., Roberts, Q., Kineke, G., Allison, M., 2001. Organic matter distribution and accumulation on the inner Louisiana shelf west of the Atchafalaya River. Continental Shelf Research, 21: 1691 - 1721.
Gouveia, M.A., Araújo, M.F.D., Dias, J.M.A., 1993. Rare earth element distribution in sediments from the Minho river and estuary (Portugal) -- a preliminary study. Chemical Geology, 107(3-4): 379-383.
Grimalt, J.O., Calvo, E., Pelejero, C., 2001. Sea Surface pleotemperature errors in Uk'37 estimation due to alkenone measurements near the limit of detection. Paleoceanography, 16: 226-232
Kaiser, H., 1960. The application of electronic computers to factor analysis. Educational and Psychological Measurement, 20: 141-151.
Karageorgis, A., Sioulas, A., Anagnostou, C., 2002. Use of surface sediments in Pagassitikos Gulf, Greece, to detect anthropogenic influence. Geo-Marine Letters, 21: 200-211.
Loring, D., 1991. Normalization of heavy-metal data from estuarine and coastal sediments. ICES Journal Marine Science, 48: 101-115.
Loring, D., Rantala, R., 1992. Manual for the geochemical analyses of marine sediments and suspended particulate matter. Earth-Science Reviews, 32: 235-283.
Meyers, P., 1994. Preservation of elemental and isotopic source identification of sedimentary organic matter. Chemical Geology, 114(3-4): 289-302.
Moreno, F., Araújo, M.F., Moreno, J., Fatela, F., Drago, T., 2005. Caracterização geoquímica de sedimentos superficiais do estuário do Minho e do sapal de Caminha (NW de Portugal)-estimativa do potencial de stress biológico, Proceedings of the XIV Week of Geochemistry / VIII Congress of Geochemistry of Countries of Portuguese Language, University of Aveiro, pp. 675-678.
Muler, P., Kirst, G., Ruhland, G., Storch, I.v., Rosell-Melé, A., 1998. Calibration of the alkenone index Uk'37 based on core-tops the eastern South Atlantic and global ocean (60ºN-60ºS). Geochimica et Cosmochimica Acta, 62: 1757-1772.
Paiva, P., Araujo, M.C., Dias, J.M., Jouanneau, J.-M., 1993. Distribuição Elementar em Sedimentos do Rio Minho. In: Noronha, F., Marques, M., Nogueira, P. (Editors), 9th Week Geochemistry and the 2nd Congress of Geochemistry of Countries of Portuguese
40
Language. Department of Mineralogy and Geology, Faculty of Sciences, University of Oporto., Proceedings of the 9 th Week Geochemistry and the 2nd Congress of Geochemistry of Countries of Portuguese Language, pp. 561–566.
Poppe, L.J., Eliason, A.H., Hastings, M.E. 2003. A Visual Basic program to classify sediments based on gravel-sand-silt-clay ratios. Computer and Geosciences, 29(6): 805-809.
Reis, P., Antunes, J., Almeida, C., 2009. Metal levels in sediments from the Minho estuary salt marsh: a metal clean area? Environmental Monitoring and Assessment, 159(1): 191-205.
Salomons, W., Förstner, U., 1984. Metals in the Hydrocycle. Springer-Verlag, Berlin, 349 pp.
Schiff, K., Weisberg, S., 1999. Iron as a reference element for determining trace metal enrichment in Southern California coastal shelf sediments. Marine Environmental Research, 48: 161-176.
Schlee, J.S., 1973. Atlantic continental shelf and slope of the United States – sediment texture of the northeastern part. US Geological Survey, Professional paper 529-L, 64 pp.
Schrader, H.J., Gersonde, R. 1978. Diatoms and silicoflagelates. Ultrecht Micropaleontology Bulletin 17: 125-132.
Schropp, S., Lewis, F., Windom, H., Ryan, J., Calder, F., Burney, L., 1990. Interpretation of metal concentrations in estuarine sediments of Florida using aluminum as a reference element. Estuaries, 13(3): 227-235.
Shepard, F., 1954. Nomenclature based on sand-silt-clay ratios. Journal of Sedimentary Petrology, 24: 151-158.
Stevenson, A., 2001. Metal concentrations in marine sediments around Scotland: a Baseline for environmental studies. Continental Shelf Research, 21: 879-897.
Summers, J., Wade, T., Engle, D., Malaeb, Z., 1996. Normalization of metal concentrations in estuarine sediments from the Gulf of Mexico. Estuaries, 19(3): 581-594.
Szefer, P., Kusak, A., Szefer, K., Jankowska, H., Wolowicz, M., Ali, A., 1995. Distribution of selected metals in sediment cores of Puck Bay, Baltic Sea. Marine Pollution Bulletin, 30(9): 615 - 618..
Tam, N., Yao, M., 1998. Normalisation and heavy metal contamination in mangrove sediments. Science of the Total Environment, 216(1-2): 33-39.
Tareq, S.M., Tanoue, E., Tsuji, H., Tanaka, N., Ohta, K., 2005. Hydrocarbon and elemental carbon signatures in a tropical wetland: Biogeochemical evidence of forest fire and vegetation changes. Chemosphere, 59(11): 1655-1665.
Thornton, S., McManus, J., 1994. Application of organic carbon and nitrogen stable Isotope and C/N ratios as source indicators of organic matter provenance in estuarine systems: Evidence from the Tay Estuary, Scotland. Estuarine, Coastal and Shelf Science, 38(3): 219-233.
Wedepohl, K., 1995. The composition of the continental crust. Geochimica et Cosmochimica Acta, 59(7): 1217-1232.
Windom, H., Schropp, S., Calder, F., Ryan, J., Smith, R., Burney, L., Lewis, F., Rawlinson, C., 1989. Natural trace metal concentrations in estuarine and coastal marine sediments of the southeastern United States. Environmental Science and Technology, 23(3): 314-320.