Embed Size (px)
Citation preview

Scholars' Mine Scholars' Mine
Doctoral Dissertations Student Theses and Dissertations
Summer 2020
Multi-physics-based approach to active microwave thermography Multi-physics-based approach to active microwave thermography
Seyed Ali Mirala
Follow this and additional works at: https://scholarsmine.mst.edu/doctoral_dissertations
Part of the Electromagnetics and Photonics Commons
Department: Electrical and Computer Engineering Department: Electrical and Computer Engineering
Recommended Citation Recommended Citation Mirala, Seyed Ali, "Multi-physics-based approach to active microwave thermography" (2020). Doctoral Dissertations. 2917. https://scholarsmine.mst.edu/doctoral_dissertations/2917
This thesis is brought to you by Scholars' Mine, a service of the Missouri S&T Library and Learning Resources. This work is protected by U. S. Copyright Law. Unauthorized use including reproduction for redistribution requires the permission of the copyright holder. For more information, please contact [email protected].

A MULTI-PHYSICS-BASED APPROACH TO ACTIVE MICROWAVE
THERMOGRAPHY
by
SEYED ALI MIRALA
A DISSERTATION
Presented to the Faculty of the Graduate School of the
MISSOURI UNIVERSITY OF SCIENCE AND TECHNOLOGY
In Partial Fulfillment of the Requirements for the Degree
DOCTOR OF PHILOSOPHY
in
ELECTRICAL ENGINEERING
2020
Approved by:
Dr. Kristen M. Donnell, Advisor Dr. Mohammad Tayeb Al Qaseer
Dr. Chulsoon Hwang Dr. Garry Grubbs Dr. Lesley Sneed

© 2020
Seyed Ali Mirala
All Rights Reserved
PUBLICATION DISSERTATION OPTION
iii
This dissertation consists of the following three articles, formatted in the style used
by the Missouri University of Science and Technology:
Paper I (pages 9-34): “Detection of Flat-Bottom Holes in Conductive Composites
Using Active Microwave Thermography,” published in ASME Journal of Nondestructive
Evaluation, Diagnostics and Prognostics of Engineering Systems (JNDE).
Paper II (pages 35-64): “Active Microwave Thermography to Detect and Locate
Water Ingress,” accepted for publication in IEEE Transactions on Instrumentation &
Measurement.
Paper III (pages 65-95): “Efficient Health Monitoring of RAM-Coated Structures
by Active Microwave Thermography,” to be submitted to IEEE Transactions on
Instrumentation & Measurement.

iv
ABSTRACT
The goal of this work is to advance a novel nondestructive testing (NDT) method
for controlled, rapid, and effective inspection of a structure through the integration of
microwave NDT and thermography, referred to as Active Microwave Thermography
(AMT). In AMT, the structure under test is exposed to microwave radiation and the thermal
profile of the structure is monitored via a thermal camera in order to obtain desired
information regarding the structure. This new technique is applicable across a wide range
of NDT needs including detection of voids, delamination, water ingress, debonding, and
cracks in numerous structures such as carbon fiber and glass fiber reinforced polymers
(CFRP and GFRP, respectively), cement-based materials, corroded metals, and structures
coated with radio-frequency absorbing materials (RAM). This research is dedicated to
three special cases among these applications of AMT; detection of voids in CFRP,
evaluation of water ingress, and detection of delamination in RAM-coated structures. The
effect of the structures’ properties, excitation parameters, and defect size and location on
the thermal response are investigated through analyses of technical outputs such as thermal
contrast and signal-to-noise ratio. The main contributions of this research are first, enabling
defect quantification through a formulation of the microwave heating and subsequently
calculating the temperature’s temporal and spatial variation. This formu lation is validated
through commercial simulation software and measurement. Second, it is shown (through
simulation and measurement) that AMT is a reliable NDT technique that may be superior
to other techniques for specific applications such as water ingress detection and inspection
of RAM-coated structures.
v
ACKNOWLEDGMENTS
I am grateful with all of my being to my beloved wife, Mahshid Roshandelpir, for
her dedication, enthusiasm, and love, and to my parents, for everything they gave me
during my life. I believe I never could have embarked on my Ph.D. journey and finished it
without an overwhelming support from them.
I would like to express my utmost gratitude to my advisor, Dr. Kristen M. Donnell,
and Dr. Mohammad Tayeb Al Qaseer for their earnest support, inspirations, and the many
hours they have devoted to me. It has been an extraordinary pleasure to work with them.
I am also grateful to Dr. Garry Grubbs and Dr. Lesley Sneed for their major
contributions to this research and brilliant ideas, and to Dr. Chulsoon Hwang for serving
on my committee and his valuable guidance.
This work was partially supported by the National Science Foundation Division of
Electrical, Communication, and Cyber Systems (ECCS), Award No. 1609470, “A Multi
Physics-Based Approach to Active Microwave Thermography”.

vi
TABLE OF CONTENTS
Page
PUBLICATION DISSERTATION OPTION.......................................................................... iii
ABSTRACT.................................................................................................................................. iv
ACKNOWLEDGMENTS........................................................................................................... v
LIST OF ILLUSTRATIONS......................................................................................................ix
LIST OF TABLES......................................................................................................................xii
SECTION
1. INTRODUCTION..................................................................................................... 1
1.1. ACTIVE MICROWAVE THERMOGRAPHY......................................1
1.2. RESEARCH OBJECTIVE........................................................................ 3
1.3. ORGANIZATION OF THE DISSERTATION...................................... 6
PAPER
I. DETECTION OF FLAT-BOTTOM HOLES IN CONDUCTIVE COMPOSITES USING ACTIVE MICROWAVE THERMOGRAPHY...........9
ABSTRACT...................................................................................................................... 9
1. INTRODUCTION.......................................................................................................9
2. SIMULATION AND ANALYSIS..........................................................................12
3. MEASUREMENT RESULTS.................................................................................23
4. CONCLUSION.......................................................................................................... 31
FUNDING D A T A ......................................................................................................... 32
REFERENCES ............................................................................................................. 32
II. ACTIVE MICROWAVE THERMOGRAPHY TO DETECT ANDLOCATE WATER INGRESS................................................................................ 35

ABSTRACT....................................................................................................................35
1. INTRODUCTION.....................................................................................................35
2. MODELING AND THEORY................................................................................. 38
2.1. BASIC FORMULATION........................................................................ 38
2.2. SIMULATIONS....................................................................................... 42
2.3. DEPTH EVALUATION.......................................................................... 48
2.4. EFFECT OF BACKGROUND M ATERIAL........................................51
3. MEASUREMENTS...................................................................................................55
3.1. M ETHOD...................................................................................................55
3.2. RESULTS...................................................................................................56
4. CONCLUSION.......................................................................................................... 60
REFERENCES ............................................................................................................. 61
III. EFFICIENT HEALTH MONITORING OF RAM-COATEDSTRUCTURES BY ACTIVE MICROWAVE THERMOGRAPHY............65
ABSTRACT................................................................................................................... 65
1. INTRODUCTION.....................................................................................................66
2. MODELING AND FORMULATION...................................................................68
2.1. ELECTROMAGNETIC FORMULATION..........................................69
2.2. THERMAL FORMULATION................................................................74
3. SIMULATIONS........................................................................................................ 78
4. MEASUREMENT RESULTS................................................................................. 85
5. CONCLUSION......................................................................................................... 92
REFERENCES ............................................................................................................. 93
SECTION
vii
2. CONCLUSIONS AND FUTURE WORK 96

2.1. CONCLUSIONS........................................................................................96
2.2. FUTURE W ORK.......................................................................................98
BIBLIOGRAPHY..................................................................................................................... 100
VITA........................................................................................................................................... 103
viii

ix
LIST OF ILLUSTRATIONS
PAPER I Page
Figure 1. Geometry of the simulated m odel......................................................................... 12
Figure 2. Thermal contrast versus FBH depth for different radii obtained throughnumerical analysis and CST MPS simulations..................................................... 19
Figure 3. Thermal contrast isothermal contours for different radii and depths ofF B H s.......................................................................................................................... 20
Figure 4. Thermal contrast as a function of frequency for different microwaveexcitation pow ers......................................................................................................22
Figure 5. Photograph of the CFRP sample with 9 (machined) FBHs with differentradii and depths.........................................................................................................23
Figure 6. Active microwave thermography measurement setup .........................................25
Figure 7. Thermal profile images for FBH with r = 20 mm and d = 2 mm capturedat different instants of tim e ..................................................................................... 26
Figure 8. Thermal contrast as a function of time for FBHs of (a) r = 20 mm anddifferent depths and (b) d = 2 mm and different radii........................................ 27
Figure 9. Thermal contrast for different lift-offs and polarizations....................................28
Figure 10. Signal-to-noise ratio for three FHBs with dimensions given in the figurelegend ....................................................................................................................... 30
Figure 11. Signal-to-noise ratio image for FBH with r = 20 mm and d = 2 mm atdifferent instants of tim e.........................................................................................31
PAPER II
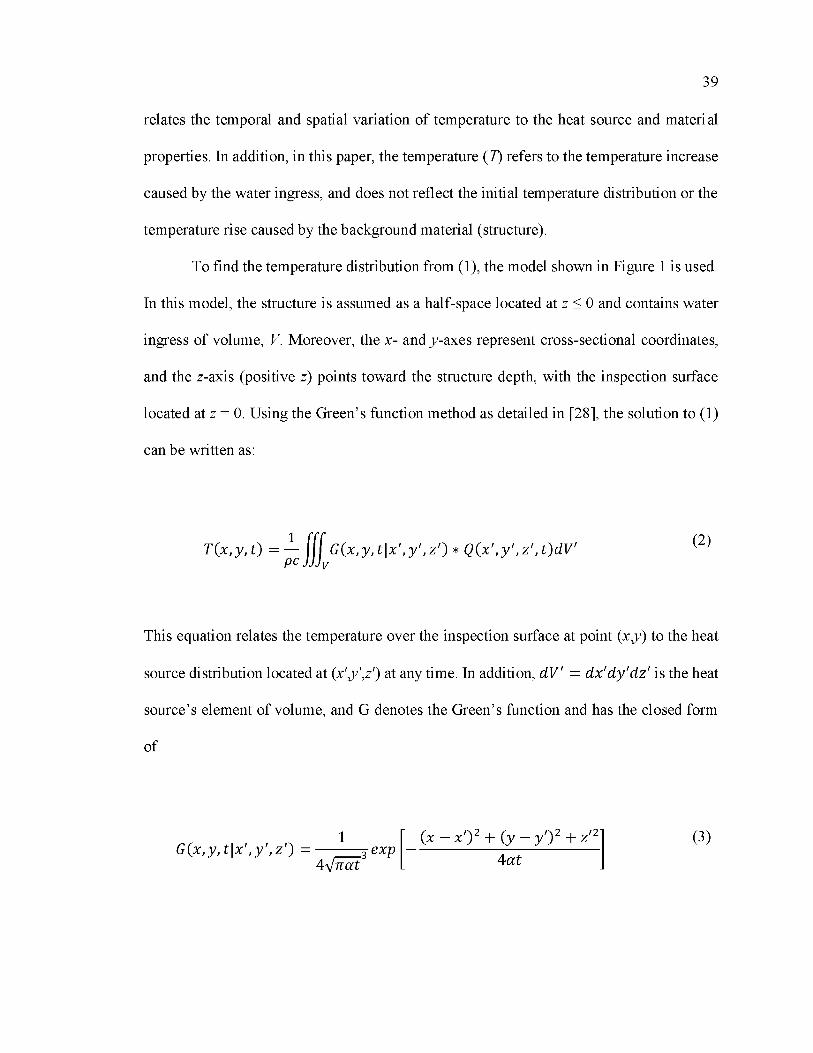
Figure 1. Basic model used to formulate and analyze water detection using A M T .........40
Figure 2. Temperature versus time (a) and position over the structure surface (b) for 0.05 mL water ingress at depths of 6, 9, and 12 mm, calculated analytically and by coupled electromagnetic/thermal simulations.....................44
Figure 3. 3D distribution of stored thermal energy for water ingress with d = 9 mmat different instances of tim e................................................................................... 45
Figure 4. Maximum of temperature vs. depth for different values of heating tim e..........47

x
Figure 5. The microwave excitation pulse shape and temperature response to thisexcitation for near-surface and deeper water ingress cases................................50
Figure 6. (a) Rectangular model used to study the relation between water depth andthe delay time, At, and (b) special water distributions....................................... 51
Figure 7. Temperature increase versus time for 0.05 mL of water ingress at a depthof 9 mm, calculated for different materials..........................................................53
Figure 8. Maximum of temperature increase and At versus a and k ...................................54
Figure 9. AMT system for water detection.............................................................................56
Figure 10. Thermal images related to different volumes and depths of water atdifferent times obtained through AMT measurements....................................58
Figure 11. Experimental and numerical evaluation of temperature (normalized) caused by water ingress at different depths and the effect of depth on the temporal evolution of temperature curves.................................................. 59
PAPER III
Figure 1. Schematic of a RAM-coated structure containing a defect under an AMTinspection ................................................................................................................. 68
Figure 2. Interaction of electromagnetic fields with a RAM-coated conductivestructure...................................................................................................................... 70
Figure 3. Geormetry of a RAM-coated CFRP structure containing a delamination..........75
Figure 4. Absorbed power density (in dB) along the depth of the magnetic and electric RAMs obtained through analytical expressions and CST simulations................................................................................................................. 79
Figure 5. Normalized absorbed power density versus frequency for the two RAMtypes.............................................................................................................................81
Figure 6. Normalized power density versus incidence angle for different frequencies and perpendicular and parallel polarizations for the (a) magnetic and (b) electric RAMs...........................................................................82
Figure 7. TC obtained through numerical analysis and CST simulations for differentdiameters (a) and depths (b).....................................................................................85
Figure 8. The experimental setup for AMT measurements................................................... 86
Figure 9. The RAM-coated CFRP structure: (a) stack-up, (b) top surface, and (c) amachined hole serving a as a delamination............................................................87

xi
Figure 10. Temperature increase after 180 sec of microwave excitation versus radial distance from the delamination for different delamination diamater and depth and the case of no delamination................................................................. 88
Figure 11. Td, Ts, and TC profiles at t = 180 sec for Case 1................................................89
Figure 12. TC profiles (unit: °C) at different times for delmainations of givendiameters and depths............................................................................................ 91
Figure 13. TC over time obtained experimentally and numerically....................................92

LIST OF TABLES
PAPER I Page
Table 1. Material properties........................................................................................................15
Table 2. Thermal camera specifications...................................................................................24
PAPER II
Table 1. Properties of water and rubber................................................................................... 42
Table 2. Materials properties......................................................................................................52
Table 3. Calculated depths of water and their errors.............................................................. 60
PAPER III
Table 1. Thermal properties of the RAM and CFRP.............................................................83
xii

SECTION
1. INTRODUCTION
1.1. ACTIVE MICROWAVE THERMOGRAPHY
Nondestructive testing and evaluation (NDT&E) of materials and structures plays
an important role in aerospace and civil/infrastructure industries. In fact, many failures
occur because of the presence of defects and imperfections in construction materials [1].
As such, many NDT&E techniques have been developed for structural health monitoring
including visual inspection [2], microwave [3], ultrasound [4], X-ray [5], and
thermography [6]-[8]. In thermography, the structure under test is exposed to a heat source
that causes a temperature increase within the volume and over the surface of the structure.
Typically, an active approach is used, meaning an active thermal source is utilized to
induce thermal energy into the structure (as opposed to the passive approach in which the
thermal source is natural, e.g., solar energy). The most commonly used thermal sources in
active thermography are optical (i.e., flash lamp thermography, also often referred to as
conventional thermography) [6], ultrasonic [9], eddy current [10], and more recently,
microwave [11].
Active microwave thermography, or AMT, is a relatively new active thermographic
method that has demonstrated potential in recent years for many NDY&E applications
including health monitoring of carbon fiber reinforced polymer (CFRP) structures
[12],[13], assessment of microwave absorbing structures [14], detection and evaluation of
surface cracks in metal structures [15], characterization of corroded reinforcing steel bars
2
[16], evaluation of steel fiber distribution in cement-based mortars [17], defect detection
of CFRP-strengthened cement-based materials [18],[19], and mines detection [20].
In AMT, the structure under test is exposed to microwave radiation. Depending on
the electromagnetic properties of the structure’s constitutive materials, two heating
mechanisms may occur that are referred to as dielectric heating and Joule heating [21],[22].
Dielectric heating results from absorption of microwave energy in lossy dielectric
materials. Generally, dielectric materials are described by their (relative to freespace)
complex dielectric properties as Sr = s / - j e r ", where e / (relative permittivity) represents
the ability of a dielectric material to store microwave energy, and er " (relative loss factor)
represents the ability of a material to absorb energy. Thus, when a lossy material is
irradiated with microwave energy, dielectric heating occurs as a result of the absorbed
energy. Joule heating, on the other hand, occurs due to current induced on the surface of
conductive materials. More specifically, when a microwave signal impinges on a
conductive material, surface current is induced on the conductor surface due to the electric
conductivity (a) of the material, which in turn results in ohmic losses. In addition, this
induced surface current can serve as a source of radiated (or scattered) microwave energy,
which in turn may be absorbed by nearby dielectric materials.
Subsequent to the microwave-induced heating, the thermal energy (heat) diffuses
inside the structure and causes a temperature increase within the volume and over the
surface of the structure. The existence of any inconsistency in the structure (such as a
defect) affects the heat diffusion and in turn affects the surface temperature distribution
which is monitored via a thermal camera. Thermal images captured over time by the
thermal camera may provide information regarding potential defects in the structure. Void-

3
type defects such as holes and open cracks act as thermal insulators that impede against
further diffusion of the heat to the deeper parts of the structure and lead to a high
concentration of thermal energy. This manifests as a hot spot on the structure surface and
is evident in the thermal measurements. Therefore, the temperature increase can be used as
a metric to evaluate the defects. In another case, the defect may act as a source of thermal
energy when it is exposed to the microwave radiation. For example, water ingress or
moisture within a (lower loss) dielectric structure can absorb microwave energy, resulting
in generation of heat and a subsequent thermal contrast that can be monitored via the
thermal camera.
In general, AMT has several advantages including short inspection times for
relatively large areas, non-contact interrogation and inspection, and easy-to-interpret
results (results are obtained in an image format and can be visually interpreted to some
extent). Beside these advantages that AMT shares with other thermographic methods [23],
microwave radiation as the thermal excitation can be superior to other excitations (e.g.,
optical, in conventional thermography) in special cases, as is discussed in the following
section.
1.2. RESEARCH OBJECTIVE
The goal of this dissertation is to provide a comprehensive quantitative analysis
tool that relates AMT outputs to potential defect features as well as to introduce new
applications for this technique.
When the application of AMT in several cases, such as defect detection of CFRP-
strengthened cement-based materials, is already established (as a proof-of-concept), there

4
often remains a lack of quantitative and comparative analysis for the particular inspection.
This research aims to fill this gap by proposing a physical model and pertinent
mathematical formulation. This is accomplished for three distinct applications. In the first
case, detection of void-type defects, standardized as flat-bottom holes (FBH), in conductive
composites, in particular CFRP, is quantitatively studied. In this case, since conductive
materials (such as CFRP) do not allow penetration of electromagnetic energy, the
microwave excitation solely generates a surface thermal source through induced surface
current (as mentioned above). In this way, this thermal generation is similar to conventional
thermography where the optical impulse is only absorbed at the surface of the sample. After
calculating the surface thermal source from induced surface currents and the Joule heating
principle, the heat equation, which relates the temperature distribution to the thermal
sources, is solved numerically using a finite difference approach. Specifically, to include
the effect of an FBH on the temperature, an adiabatic boundary condition is applied over
the boundaries of FBH, meaning that there is no heat flux through the boundary. As an
FBH impedes the diffusion of thermal energy further into the deeper parts of the sample, a
higher temperature will be observed over the FBH on the sample surface. To quantify this
effect, the thermal contrast is defined as the difference between the temperature increase
of a defective area and that of a sound/healthy area. For a successful detection of an FBH,
the thermal contrast must exceed the thermal camera’s sensitivity. Based on this, detection
likelihood is quantified through calculation of thermal contrast caused by an FBH and its
diameter and depth. In other words, a dimensional analysis of detectable FBHs is provided
including a radius-to-depth ratio threshold for successful detection. The mathematical
formulation discussed above (and formulated here for the first time) also enables

5
investigation of the effect of microwave excitation power and frequency on the AMT
results. This mathematical analysis is validated via comparison with a coupled full wave
electromagnetic/thermal model developed using CST Microwave Studio® (CST MWS)
and CST MultiPhysics Studio® (CST MPS), as well as through several measurements.
Another objective for this research arises from the fact that use of a microwave
excitation is particularly well-suited for detection of water ingress due to the fact that water
is highly absorptive to electromagnetic energy in the microwave frequency range.
Evaluation of water ingress and moisture content in composited (mainly GFRP and
honeycomb structures) is very important to ensure that mechanical properties of
composites are negatively unaffected. For this application, AMT offers the advantage of
selective heating as the thermal excitation is applied solely to the water ingress, with
reduced interaction with the background material. In other words, unlike conventional
thermography, the defect (water) acts as a heat source, rather than merely affecting the heat
diffusion. To formulate this case, the interaction of the incident microwave energy and the
water volume (a dielectric) is considered. More specifically, the electromagnetic loss (and
hence the generated heat) inside the water ingress is calculated. Knowing the heat source
as such, the temperature is calculated via the Green’s function method [24]. Using the
Green’s function method as an analytical approach is computationally more efficient (i.e.,
is faster and requires reduced memory resources) than numerical techniques and
commercial simulation software packages. The selective heating of water ingress and the
need for detection of water ingress in structures including aviation, submarine acoustic
tiles, heavy electrical component insulators, etc. show the importance of AMT for this
application, as discussed in this dissertation.

6
As the third case studied in this dissertation, the use of AMT for detection of
delamination in RAM-coated structures (extensively used in aerospace and military
applications) is quantitatively studied for the first time. AMT is an especially good
candidate for inspection of such structures due to the inherent electromagnetic properties
of the RAM itself. In other words, these materials are designed to reduce (through energy
absorption) the amount of electromagnetic energy that is scattered (or reflected) from
(subsurface) conductive materials. Thus, from an AMT perspective, the RAM, when under
microwave illumination, absorbs the energy and subsequently undergoes a temperature
increase; an essential component in thermographic techniques. In addition, unlike
conventional thermography in which heat is generated mostly at the surface, the microwave
heating takes place throughout the RAM volume (as well as its surface). In this way, the
thermal source is located flush against the substructure rather than at the surface of the
coating and hence the detection capability may be improved. In these cases, AMT is
uniquely effective and potentially superior to other thermographic methods and as such,
this dissertation is dedicated to such applications.
1.3. ORGANIZATION OF THE DISSERTATION
This dissertation focuses on three distinct applications of AMT as are summarized
below.
PAPER I, titled “Detection of Flat-Bottom Holes in Conductive Composites Using
Active Microwave Thermography” investigates the potential of AMT for detection of flat-
bottom holes (FBHs) in conductive composites such as carbon fiber-based composites. To
this end, a formulation is first established as mentioned in the previous section. Then, the

7
simulation (using CST MWS and MPS) and experimental results are presented that validate
the formulation and show the AMT outcomes in potential situations where a carbon fiber
reinforced polymer (CFRP) laminate contains FBHs. These results illustrate the potential
for AMT as a nondestructive testing (NDT) tool for inspection of CFRP structures. More
specifically, the effect of FBH radius and depth (or combined as the radius-to-depth ratio)
on the detection likelihood is studied. By considering the thermal contrast, it is shown that
detection likelihood can be improved by increasing the microwave frequency or power
level. Furthermore, AMT measurements are presented for a number of FBHs machined in
a multidirectional CFRP sheet, and the signal-to-noise ratio (SNR) in thermal images over
time is monitored that shows a high level of defect information relative to background noise
(>20 dB) is achievable after about 60 sec of microwave excitation.
PAPER II, titled “Active Microwave Thermography to Detect a nd Locate Water
Ingress,” reports on the application of AMT to detect and locate water ingress within a
structure. This paper presents a mathematical formulation (as discussed previously) along
with simulation and measurement results. The mathematical formulation relates the water
volumetric distribution and location to the temperature distribution over the inspection
surface. Moreover, a method for evaluating the depth of water ingress is developed which
is based on the delayed time when the maximum of temperature rise occurs. This
formulation is considered for three water ingress cross-sectional distributions named as
point (like drops), linear (such as water seeped into a crack or vein), and extended.
Following the analysis, AMT measurement results of a small volume of water, placed in a
rubber sample at predetermined locations, are presented. Analysis of the measurement data
indicates the potential of AMT for not only detection of water ingress, but also accurate

8
depth estimation of small amounts of water ingress. Specifically, 0.5 mL of water
(equivalent to 10 drops) is clearly detected (experimentally) after 120 seconds of
microwave excitation, in a rubber sample. More importantly, the depth of water is
estimated using experimental data and a mathematical formulation, with an average
quantification error of ~5%. In addition, the relationship between the detectability of water
and test parameters including the microwave excitation frequency and power, water
volume and depth, structure constitutive properties, and the heating time is studied.
In PAPER III, titled “Efficient Health Monitoring of RAM-Coated Structures by
Active Microwave Thermography,” results of a comprehensive study on the application of
AMT for health monitoring of structures coated with radio-frequency absorbing materials
(RAM) is presented. It is shown that AMT is unique for this particular application since
the microwave excitation acts as a highly efficient thermal source due to the inherent
absorptive electromagnetic properties of RAM-coated structures. In addition, the
microwave-induced heating takes place within the volume of a RAM-coated structure (as
the microwave energy propagates through the RAM), as opposed to solely heating the
surface (as is the case in conventional thermography). Specifically, this work focuses on
detection of delamination, which is a common defect in CFRP structures, via AMT. To this
end, as mentioned earlier, a mathematical model is developed that relates the thermal
contrast to the delamination, microwave excitation, and the structure properties.
Subsequently, measurements are conducted showing that delaminations with a diameter as
small as 1 cm concealed under a 2-mm thick layer of RAM can be reliably detected by
applying 1 minute of microwave excitation.

9
I. DETECTION OF FLAT-BOTTOM HOLES IN CONDUCTIVE COMPOSITES USING ACTIVE MICROWAVE THERMOGRAPHY
ABSTRACT
Active Microwave Thermography (AMT) is an integrated nondestructive testing
(NDT) technique that utilizes a microwave-based thermal excitation and subsequent
thermal measurement. AMT has shown potential for applications in the transportation,
infrastructure, and aerospace industries. This paper investigates the potential of AMT for
detection of defects referred to as flat-bottom holes (FBHs) in composites with high
electrical conductivity such as carbon fiber-based composites. Specifically, FBHs of
different dimensions machined in a carbon fiber reinforced polymer (CFRP) composite
sheet are considered. Simulation and measurement results illustrate the potential for AMT
as a nondestructive testing (NDT) tool for inspection of CFRP structures. In addition, a
dimensional analysis of detectable defects is provided including a radius-to-depth ratio
threshold for successful detection.
1. INTRODUCTION
PAPER
Nondestructive testing (NDT) of infrastructure is important to many industries
including aeronautics and transportation as it relates to the inspection of carbon fiber
reinforced polymer (CFRP) structures. Several NDT methods including microwave,

10
ultrasound, x-ray, and thermography (active and passive) have been applied to the
aeronautical and transportation industries (with varying levels of success) for inspection of
infrastructure and composites [1]-[7]. Among these methods, microwave NDT is very
limited for inspection of subsurface defects in conductive materials due to the lack of
penetration of microwave energy into such materials. Additionally, while surface
inspections of conductive materials are feasible, often the inspection time may be
significant due to the need for raster scanning of the area of interest. Acoustic methods are
successful in many arenas and are well-established. However, they often require operator
expertise and contact with the material/structure under test. X-ray or computed tomography
is also quite promising for many applications, but brings significant safety requirements
and precautions [4]. Thermography, both active and passive, is another well-established
and successful technique. Passive thermography utilizes natural sources of thermal energy
such as solar energy, structural loading, moisture evaporation, air movement, etc. On the
other hand, active thermography utilizes an active source of thermal energy such as a flash
lamp (as is used in traditional thermography), quartz lamp, electromagnetic, acoustic, etc.
Passive thermography implies no control of the applied energy; rather, simply observing
with an infrared camera, whereas active thermography implies control of the applied
energy (for the purpose of inspection). Active thermography has been successfully applied
to a number of NDT needs including defect detection in composite materials [5]-[7].
Active microwave thermography (AMT) is a relatively new NDT technique that is
based on the integration of microwave and thermographic NDT [8]-[15]. In AMT,
microwave energy is utilized to heat a structure of interest, and the resulting surface thermal
profile is monitored via a thermal camera. Compared to traditional (flash lamp)

11
thermography, AMT does not require substantial amounts of power [12], and several
(electromagnetic) parameters can be optimized in order to tailor the inspection to a specific
material including frequency and polarization. Recently, AMT has been utilized for
detection of corrosion on steel [11], evaluation of steel-fiber reinforced concrete [12], and
inspection of structures strengthened with unidirectional CFRP [13]-[15], with promising
results.
In general, when using a microwave-based thermal excitation, there are two
possible heating mechanisms that may take place; dielectric heating and Joule heating.
Dielectric heating takes place when the structure under test contains (lossy) dielectric
materials. In general, the ability of a dielectric to generate heat is determined by its loss
factor (e") which appears as the imaginary part of its complex dielectric constant (e = s' -
je"). Due to the lossy electromagnetic properties of the material, microwave energy is
absorbed and converted into heat. The real part of dielectric constant, on the other hand,
represents the ability of the material to store electromagnetic energy. The other heating
mechanism, Joule heating, occurs when conductive materials are present in the structure.
When a conductor is exposed to electromagnetic radiation, depending on its electrical
conductivity (a), currents are induced on the surface of the conductive material. These
currents serve as a secondary thermal excitation, as ohmic losses (which cause a subsequent
thermal increase) occur when currents flow in a conductive material. In addition to direct
ohmic losses, these induced currents may also serve as a secondary source of (reradiated)
electromagnetic energy which can be subsequently absorbed by other nearby lossy
dielectrics (such as the epoxy in CFRP materials).
12
In all cases, the heat generated from the electromagnetic energy diffuses throughout
the material. Since defects and discontinuities affect the heat diffusion, a temperature
difference on the surface of the structure will result if a defect is present. Analyzing the
surface temperature profiles captured during an AMT inspection allows the defects to not
only be detected, but also characterized. As such, this paper investigates a new application
of AMT as an NDT tool for inspecting defects in conductive (specifically CFRP)
composites. The defects are modeled as cylindrical holes that are referred to as flat-bottom
holes (FBHs) [16]. Representative simulated and measurement results are provided,
showing the applicability of AMT for such inspections.
2. SIMULATION AND ANALYSIS
In order to investigate the utility of AMT for inspection of FBHs in conductive
materials, numerical modeling was conducted. More specifically, a finite slab containing
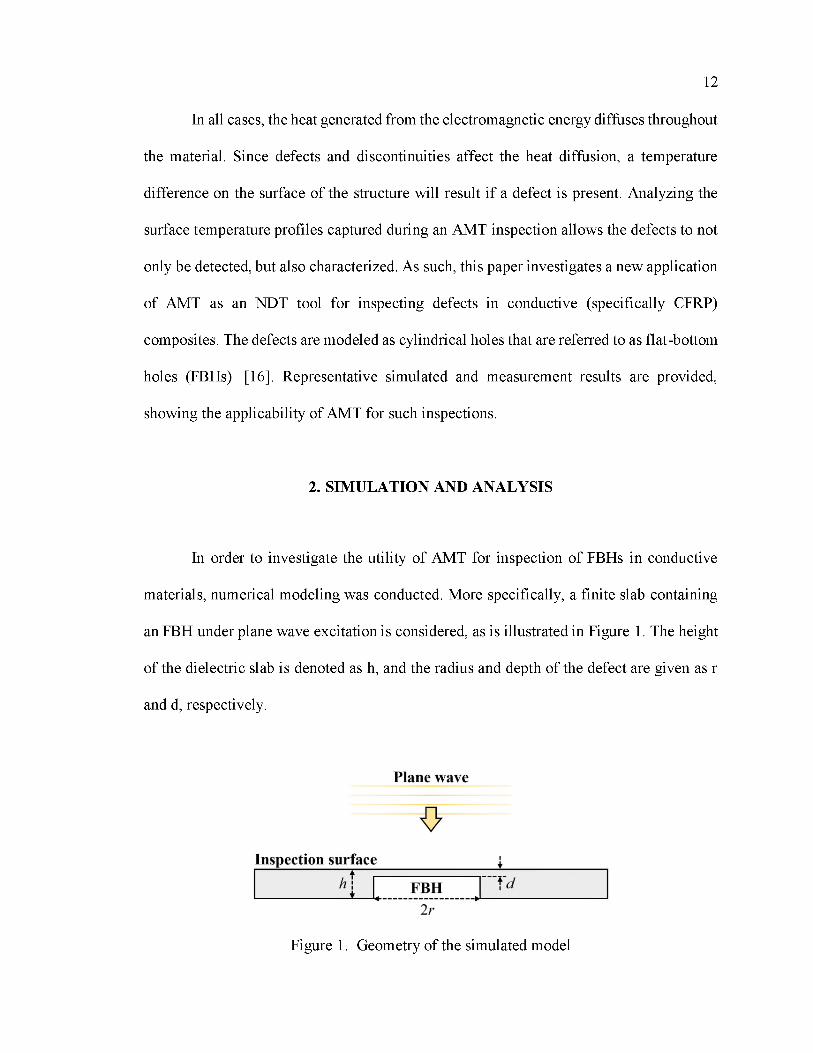
an FBH under plane wave excitation is considered, as is illustrated in Figure 1. The height
of the dielectric slab is denoted as h, and the radius and depth of the defect are given as r
and d, respectively.
Figure 1. Geometry of the simulated model

13
Upon contact with the structure under inspection, portions of the incident plane
wave will be reflected, absorbed by, and transmitted through the material. The absorbed
energy is converted to heat and therefore can be considered as a thermal source. For a
highly conductive material, there will be not be any energy transmitted through the
material. Thus, the incident energy is either reflected or absorbed. Further, for highly
conductive materials, most of the incident energy will be reflected. The energy that is not
reflected is absorbed within a very thin layer (essentially the surface) of the material. This
layer is dimensionally on the order of the material’s skin depth, 5, which is defined as S =
J l / n f j i a , where f and p are the incident wave frequency and material permeability,
respectively. A CFRP laminate with electrical conductivity of o = 50,000 S/m, for example,
has a skin depth of ~46 pm at f = 2.4 GHz. As such, the thermal source can be considered
as a uniform (due to the plane wave excitation) surface heat source, Qs, on the surface of
the structure. Specifically, Qs may be quantified as:
Qs = Pine — Pref = Pinc(1 — IH2) (1)
where Pinc and Pref are the incident and reflected wave power densities and r denotes the
electromagnetic wave reflection coefficient of the air-structure interface and is defined at
r = (v — Vo)/(V + Vo). In this formula, n is the characteristic impedance (ratio of electric
to magnetic fields of any electromagnetic wave in the medium) of the conductive material
and is given by n = j M p / a , and no is the characteristic impedance of freespace (i.e., 120n)
[17].

14
The heat source of Eq. (1) generates thermal energy which extends throughout the
structure volume over time. To calculate the time-dependent temperature distribution, T,
the source-free heat equation given in Eq. (2) should be solved. The volumetric heat source
in Eq. (2) is considered to be zero since there is no heat source inside the structure and the
surface heat source over the inspection surface will be applied as an inflow heat flux
boundary condition.
dTpCp̂ t =V' (k'
(2)
Here p, C p, and k are the density, specific heat, and thermal conductivity tensor,
respectively. The thermal conductivity, k, is considered a tensor due to the potential
anisotropy of the structure. For example and as it relates to this work, the thermal
conductivity for a CFRP laminate differs for the in-plane and along-the-depth (or
transverse) directions (i.e., parallel and perpendicular to its embodied fibers, respectively).
However, the same thermal conductivity is assumed along any in-plane direction. This
assumption is valid for multidirectional fiber-reinforced composites as their fibers are
oriented in several in-plane directions, rendering the same electrical and thermal behavior
along these directions. Unidirectional composites, on the other hand, have different
behaviors along the two in-plane normal directions of parallel- and perpendicular-to-the-
fibers, requiring assignment of different values to the electrical and thermal conductivities
in these directions. Taking this into consideration and assuming a cylindrical coordinate
system with the z-axis being the axis of the FBH (modeled as a cylinder), the in-plane
15
isotropy of thermal conductivity leads to angular symmetry of temperature (i.e. dT/dp = 0).
As such, Eq. (2) can be expressed in cylindrical coordinates as [18]
dTpCp~di~
1 3 / d T \ d ( dT \ r dr \ ^ r d r ) + dz \ z d z )
(3)
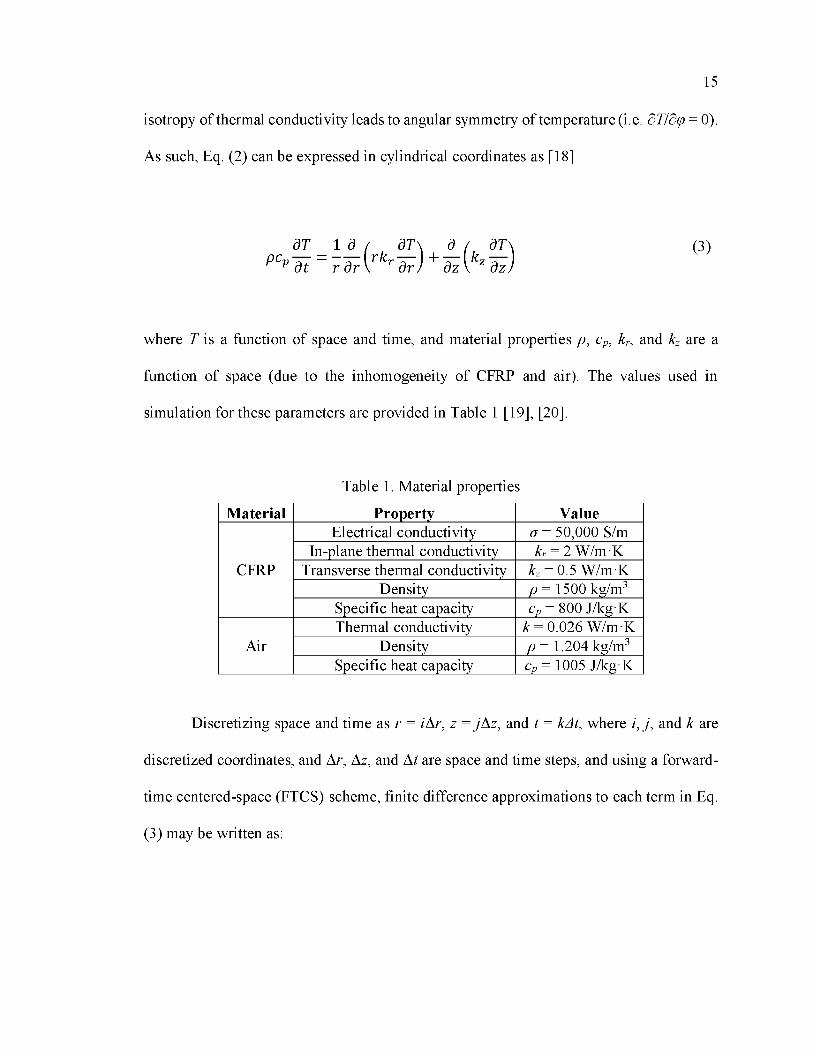
where T is a function of space and time, and material properties p, Cp, kr, and kz are a
function of space (due to the inhomogeneity of CFRP and air). The values used in
simulation for these parameters are provided in Table 1 [19], [20].
Table 1. Material properties
Material Property Value
CFRP
Electrical conductivity a = 50,000 S/mIn-plane thermal conductivity kr = 2 W /m K
Transverse thermal conductivity kz = 0.5 W /m KDensity p = 1500 kg/m3
Specific heat capacity Cp = 800 J/kgK
AirThermal conductivity k = 0.026 W /m K
Density p = 1.204 kg/m3Specific heat capacity Cp = 1005 J/kgK
Discretizing space and time as r = iAr, z = jAz, and t = kAt, where i, j , and k are
discretized coordinates, and Ar, Az, and At are space and time steps, and using a forward
time centered-space (FTCS) scheme, finite difference approximations to each term in Eq.
(3) may be written as:

16
dT ^ . , T k+1( i , j ) - T k (i ,j)pCpH i ^ p ( l , j ) cP( l , j ) ----------- At------------
(4)
1 d t dT\ 1r dr V r d r ) iAr
x ^ ( [ ( i + 1 /2 )A r]kr (i + 1 / 2 , j ) T {l + 1>il r T (l’J)
(5)
[(i - 1 /2 )Ar]kr (i - 1 / 2 , j )T k ( i , j ) - T k ( i - 1 , j ) ]
Ar 1
d ( dT\ 1 (Tz { k^ ) = rz { k*(i’i + 1 /2)
T k ( i , j + 1 ) - T k (i, j) Az
k z ( i , j - 1/ 2)T k ( i , j ) - T k ( i , j - 1 ) ]
Az '
(6)
Also, boundary conditions are incorporated as:
k n ^ ~ = Qs - h c(T - T a)dTdn
dT<d^ = °
top su r fa c e
all other su r fa c e s(7)
where n, hc, and Ta denote the direction normal to the boundary, convective heat transfer
coefficient, and ambient temperature, respectively. The top surface boundary condition of
Eq. (7) represents the heat generated by the microwave excitation and thermal energy loss
due to convection. The remaining surfaces utilize the adiabatic boundary condition,

17
meaning that the heat flux from these boundaries is assumed zero. A stable solution of Eqs.
(4)-(6) satisfies the stability condition [21] given as
1f _ 2amax(1/ A r2 + 1/ Az2)
(8)
where amax denotes the maximum thermal diffusivity of the materials involved.
The numerical model given above provides the temporal evolution of temperature
in the material/structure. The temperature is subsequently analyzed over the inspection
surface of the structure to predict the thermal profiles captured in practice by a thermal
camera during an AMT inspection. Using this numerical technique is advantageous over
commercial electromagnetic/thermal simulation software packages since it utilizes an
analytical electromagnetic solution given in Eq. (1), instead of a time-consuming full-wave
numerical solution. Specifically, due to the small skin depth (micrometers or less) of
conductive materials, the mesh size should be taken comparably small and subsequently
require a huge memory resource and processing time. Furthermore, the spatial two
dimensional heat transfer equation given in Eq. (3) (which has two spatial coordinates, r
and z) is used rather than a three-dimensional simulation. Therefore, the simulations may
run remarkably faster while providing accurate results (as will be shown later). The
simulation time becomes specifically important when evaluating defects by a reverse
approach. In such cases, the simulation is iteratively solved with swept values for
dimensions in order to find the best match between the simulation and measurement results.

18
To quantify the temperature variation over the structure’s inspection surface (in
order to evaluate potential defects), the temporal temperature increase, AT(x,y,f) is defined
as
AT(x, y , t ) = T (x, y , t ) - T (x, y, 0) (9)
where T(x,y,t) is the temperature distribution on the surface under inspection at a given
time t, and T(xy,t) is the initial temperature distribution. Using AT instead of the absolute
temperature, T, eliminates the effect of the initial temperature distribution over the surface
and represents the temperature change resulting only from the microwave excitation.
Another important parameter, referred to as the thermal contrast, (TC), is defined
(temporally) as:
TC(t) = (A T (x ,y , t ) )D - (A T (x ,y , t ) ) s (10)
where (^)s and {•)d denote the average over a given sound and defective area, respectively.
Defective and sound areas refer to areas on the inspection surface above the location of
defective and sound areas within the structure (as most defects are located beneath the
surface). Therefore, the TC, as defined in Eq. (10), represents the temperature difference
caused by the defect and can be used to evaluate the defect.
For an air-filled defect such as an FBH, a positive TC is expected as the air is a
good thermal insulator and therefore reduces the loss of thermal energy through diffusion.

19
As it relates to heat diffusion, FBHs with larger cross-sections and smaller depths will
result in less radial and transverse heat diffusion, as compared to smaller or deeper FBHs.
Therefore, the TC is expected to increase with FBH radius and decrease with depth. To
verify these expectations and further study the detectability of FBHs as a function of
dimensions, the TC obtained using the numerical technique discussed above and a coupled
electromagnetic/thermal model created in CST MPHYSICS STUDIO (CST MPS) are
shown as a function of depth for FBHs with 10, 15, and 20 mm radii in Figure 2. The
structure’s height (h) is assumed to be 5 mm and the microwave excitation is applied for
420 sec. Also, the frequency and power level of the incident energy are 2.4 GHz and 50 W
(respectively) in all simulations (to be consistent with the measurement results given in
Measurement Results Section).
Figure 2. Thermal contrast versus FBH depth for different radii obtained through numerical analysis and CST MPS simulations

20
The results of Figure 2 show good agreement between those of the above-
mentioned numerical model and those obtained via CST MPS. As a result, the numerical
approach developed for this work is used for all simulations hereafter. As is also evident
in Figure 2, the TC is dependent on the depth and radius of the FBHs. This quantity can be
used to estimate the detection likelihood of a FBH with a certain r and d. To this end, TC
is provided as isothermal contours versus r and d in Figure 3. From this, it’s noticeable that
the TC decreases from the top-left corner of the r-d plane, which represents high r/d ratios,
to the right-bottom corner, where r/d ratios are small. This ratio, called aspect ratio, is often
used to estimate the detectability of a defect in traditional thermography [16]. Similarly,
this ratio can be used as an estimate of defect detectability in AMT.
Figure 3. Thermal contrast isothermal contours for different radii and depths of FBHs

21
Theoretically, the minimum TC required for a successful detection is equal to the
sensitivity of thermal camera used for measurement. As such, for any given structure,
microwave excitation, and thermal camera, a region in r-d plane exists which yields any
combination of r and d for which FBHs are likely not detectable. In Figure 3, this
undetectable region occurs when TC falls below 30 mK, the sensitivity of the thermal
camera used for measurements. However, in order to improve detection of such defects,
the power level or frequency of the microwave excitation can be increased in order to
increase the TC or using a thermal camera with lower sensitivity. In fact, according to Eq.
(1), the surface heat source (Qs) is linearly proportional to the incident power (Pinc). Also,
the intrinsic impedance of a conductor increases with frequency (^ m ^ /a ) and becomes
more similar to that of freespace, thereby reducing the amount of reflected energy and
increasing the absorbed energy. Therefore, as the TC is proportional to the absorbed power,
it would will also increase with increased excitation power and frequency. To verify this,
Figure 4 shows the TC after applying 420 sec of microwave excitation as a function of
frequency (in the operational band of the AMT system used for measurements) and
excitation power for an FBH with r = 8 and d = 4 mm (an undetectable FBH per Figure 3).
According to Figure 4, the TC meets the measurement threshold for a 75 W microwave
excitation operating at a frequency greater than 3 GHz, or with a 100 W excitation and a
frequency greater than 1.7 GHz. Therefore, for detection of any given FBH and
temperature measurement sensitivity, there is a combination of minimum excitation power
and frequency that must be met. However, practically speaking, this threshold may not be
achievable, as increasing the power level and frequency both increase system cost. In
addition, safety risks may also result as the power is increased. More specifically, for

22
normal environmental conditions and for incident electromagnetic energy of frequencies
from 10 MHz to 100 GHz, the radiation protection guide regulated by the Occupational
Safety and Health Administration (OSHA) is 10 mW/cm 2 as averaged over any possible
0.1-hour period [22]. In this work, compliance with the OSHA radiation standard is
achieved at least ~80 cm from the horn antenna aperture. As it relates to the safety of the
operator, if the operator remains outside of this area, OSHA compliance is achieved.
Furthermore, utilization of specific frequencies may be restricted by the United States’
Federal Communications Commission (FCC), or similar regulatory bodies in other
countries. To comply with FCC regulations, the operating frequency of 2.4 GHz is used,
which is in the unlicensed frequency band allocated for industrial, scientific and medical
(ISM) applications.
Figure 4. Thermal contrast as a function of frequency for different microwave excitationpowers

23
3. M EASUREM ENT RESULTS
In order to further illustrate the potential for AMT to inspect CFRP structures,
representative measurements on a CFRP sample, shown in Figure 5, were made. The
sample has a thickness (h) of 5 mm, and includes nine FBHs with radii of 10, 15, and 20
mm, each with depths of 2, 3, and 4 mm. The other side of the sample is intact and is the
interrogation and viewing side (i.e., surface that is excited by microwave energy and
subsequently viewed with the thermal camera). The CFRP sample consists of a number of
thin carbon fiber layers placed at various angles with respect to each other. Thus, the overall
sample consists of fibers that can be assumed to be located at all angles (from 0 deg to 180
deg). As such, the thermal and electrical properties of the sample are identical along any
in-plane direction (as discussed above for CFRP of this type). However, the fibers are
transverse to the sheet normal direction which causes the along-the-depth properties differ
from those of the in-plane.
Figure 5. Photograph of the CFRP sample with 9 (machined) FBHs with different radiiand depths

24
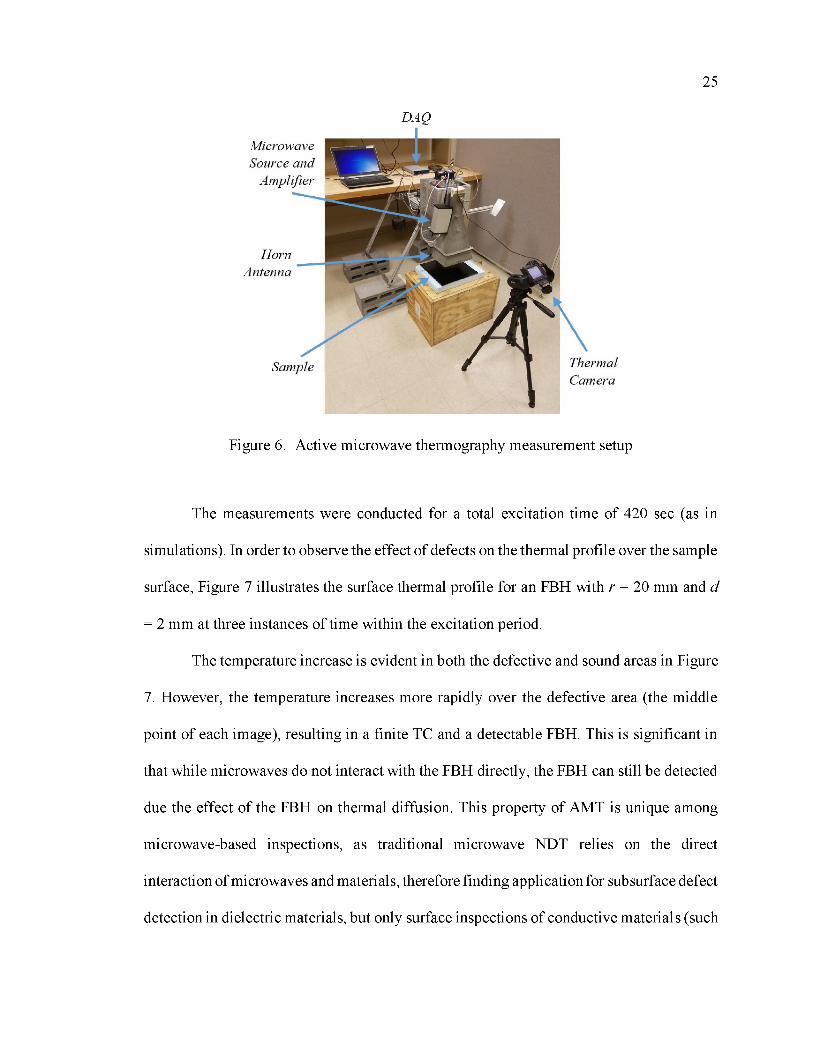
The measurement setup is shown in Figure 6 and consists of a microwave source
and amplifier, horn antenna, thermal camera, and control and data acquisition (DAQ) unit.
The thermal camera used in this work is the FLIR T430sc, with the specifications shown
in Table 2. The control and DAQ units synchronize the microwave and thermal segments
of the AMT system. All measurements are conducted at a frequency of 2.4 GHz and power
level of 50 W. The horn antenna faces directly toward the sample surface to maximize the
microwave-induced heat over the surface. The sample was placed a distance of 17 cm from
the antenna’s aperture (herein referred to as the lift-off distance). This distance was chosen
to ensure that the microwave excitation was sufficiently uniform over the inspection area
but also allowed viewing of the sample surface with the thermal camera. More specifically,
as a result of the electric field distribution of the horn antenna at the location of the sample,
the energy is mostly focused over an area commensurate with the aperture size (23x17
cm2). The camera has a skewed view of the sample surface. The measurement setup is fixed
during the entire measurement process. The thermal profiles taken by the thermal camera
are subsequently rotated by post-processing in order to remove the effect of the skew angle.
The sample is placed on a thermal insulator (Styrofoam) to avoid thermal losses from the
bottom surface.
Table 2. Thermal camera specifications
Parameter ValueDetector type Uncooled microbolomer
Wavelength band 7.5 - 13.0 pmDetector size 320 x 240
Temperature resolution (NETD) < 30 mKTemperature range -20oC - 120oC
Optics Integrated lens 18 mm (25o)Frame rate 30 Hz
25
DAQ
Figure 6 . Active microwave thermography measurement setup
The measurements were conducted for a total excitation time of 420 sec (as in
simulations). In order to observe the effect of defects on the thermal profile over the sample
surface, Figure 7 illustrates the surface thermal profile for an FBH with r = 20 mm and d
= 2 mm at three instances of time within the excitation period.
The temperature increase is evident in both the defective and sound areas in Figure
7. However, the temperature increases more rapidly over the defective area (the middle
point of each image), resulting in a finite TC and a detectable FBH. This is significant in
that while microwaves do not interact with the FBH directly, the FBH can still be detected
due the effect of the FBH on thermal diffusion. This property of AMT is unique among
microwave-based inspections, as traditional microwave NDT relies on the direct
interaction of microwaves and materials, therefore finding application for subsurface defect
detection in dielectric materials, but only surface inspections of conductive materials (such

26
as CFRP). The variations in the background are partly due the proximity of other FBHs
and the sample edges to the main FBH under inspection. Furthermore, noise from
environment (e.g., thermal energy from undesired sources reflected by the sample and
captured by thermal camera), emissivity variations over the inspection surface, thermal
camera noise, etc. show up in the thermal profiles. As the temperature values are small, the
temperature variations are significant and easily seen.
Figure 7. Thermal profile images for FBH with r = 20 mm and d = 2 mm captured atdifferent instants of time
To illustrate the effect of FBH radius and depth on the TC, measurement results for
three FBHs with a 20 mm radius and depths of 2, 3, and 4 mm are shown in Figure 8 (a),
and measurement results of three additional FBHs with a depth of 2 mm and radii of 20,
15, and 10 mm are shown in Figure 8 (b). Each measurement is repeated three times and
the results are averaged. The TC is calculated based on the average measured temperature
over 1 0 0 pixels for both defective and sound areas, in addition to a temporal average that
is calculated over 100 frames. These averaging processes highly suppress temperature
fluctuations due to noise. As seen in Figure 8 (a), the TC increases at a slower rate for

27
deeper FBHs. In addition, the asymptotic maximum TC is also inversely proportional to
depth. Similarly, as is evident in Figure 8 (b), the rate of increase of the TC is also
proportional to FBH radius (i.e., larger radius, larger rate of increase). Both of these
behaviors are as expected, per the results of simulations. Specifically, the TC at t = 420 sec
for the curves of Figure 8 (a) are roughly 260, 160, and 110 mK and they are 260, 150, and
90 mK for the curves given in Figure 8 (b). These values are in good accordance with the
corresponding simulated TC values given in Figure 2 for the simulated FBHs with the same
radius and depth. This validates the presented simulation model as well as illustrates the
potential of AMT for detection of FBHs in electromagnetically conductive structures.
Figure 8 . Thermal contrast as a function of time for FBHs of (a) r = 20 mm and differentdepths and (b) d = 2 mm and different radii

28
To investigate the effect of sample distance and orientation with respect to the
antenna on the AMT inspection results, Figure 9 illustrates the TC versus time for an FBH
of r = 2 0 mm and d = 2 mm for two different lift-offs and two orthogonal polarizations
(referred to as P1 and P2). The polarization refers to the orientation of the incident electric
field. Since the antenna is linearly polarized, the sample was rotated 90° with respect to the
antenna to see the effect of polarization. As is evident in Figure 9, a smaller lift-off results
in a larger TC due to the increase in incident power level impinging on the sample surface
(i.e., reduced free-space losses). In addition, for a given lift-off, the TC is independent of
polarization. This is due the multidirectional nature of the fibers within the CFRP sample
(discussed above), causing the same electrical and thermal properties for all in-plane
directions. Hence, selection of the polarization of the microwave excitation is not a concern
for this sample. However, if the fibers are oriented in a single direction (i.e. unidirectional
CFRP), the optimum electric field polarization is perpendicular to the fiber orientation so
that the incident energy can penetrate into the sample and generate more heat, thereby
providing a better TC (as is shown in Ref. [13]).
Figure 9. Thermal contrast for different lift-offs and polarizations
29
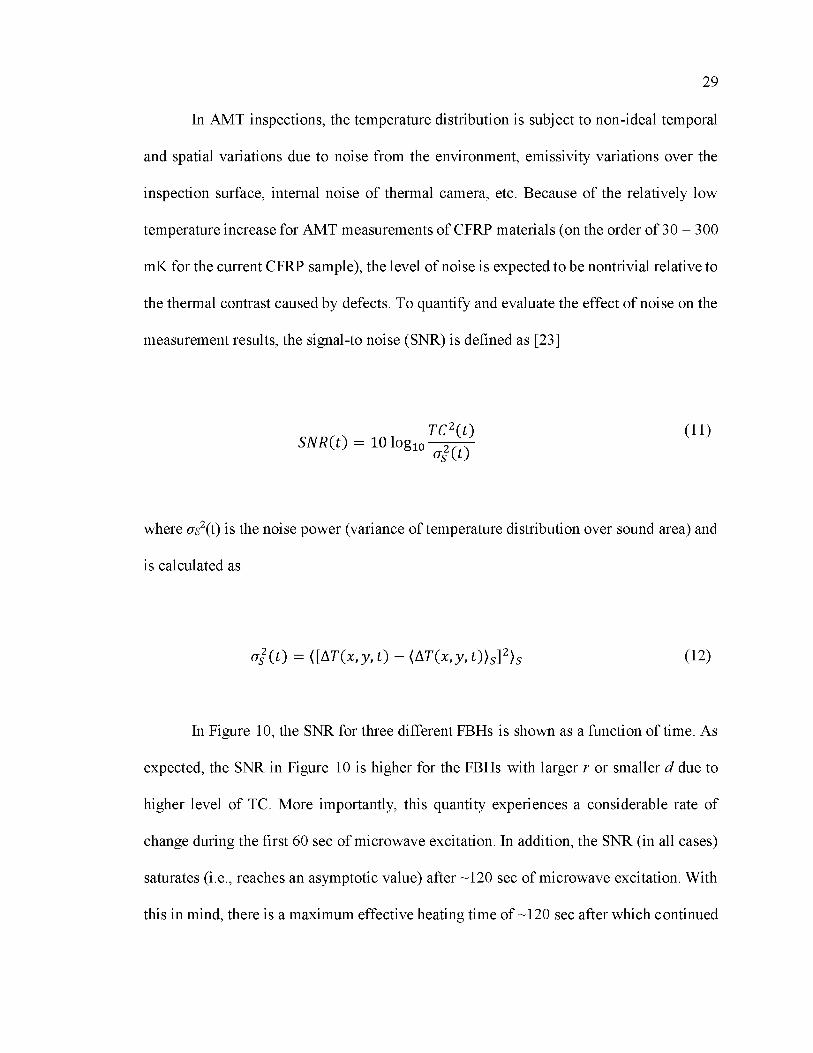
In AMT inspections, the temperature distribution is subject to non-ideal temporal
and spatial variations due to noise from the environment, emissivity variations over the
inspection surface, internal noise of thermal camera, etc. Because of the relatively low
temperature increase for AMT measurements of CFRP materials (on the order of 30 - 300
mK for the current CFRP sample), the level of noise is expected to be nontrivial relative to
the thermal contrast caused by defects. To quantify and evaluate the effect of noise on the
measurement results, the signal-to noise (SNR) is defined as [23]
, , TC2( t )S N R ( t ) = 10 lo g io -2 7 7 T
°5 W( 1 1 )
where us2 (t) is the noise power (variance of temperature distribution over sound area) and
is calculated as
0s2(O = ([AT(x , y , t ) - (AT (x , y , t ))s]2)s (12)
In Figure 10, the SNR for three different FBHs is shown as a function of time. As
expected, the SNR in Figure 10 is higher for the FBHs with larger r or smaller d due to
higher level of TC. More importantly, this quantity experiences a considerable rate of
change during the first 60 sec of microwave excitation. In addition, the SNR (in all cases)
saturates (i.e., reaches an asymptotic value) after ~120 sec of microwave excitation. With
this in mind, there is a maximum effective heating time of ~ 1 2 0 sec after which continued

30
excitation does not improve the SNR. Therefore, the optimum (fastest inspection without
loss of quality) inspection time can be considered ~ 1 2 0 sec for this application.
Figure 10. Signal-to-noise ratio for three FHBs with dimensions given in the figurelegend
The SNR as defined in Eq. (11) uses the thermal contrast between defective and
sound areas to evaluate the signal level. The SNR can also be considered from an image
point-of-view (i.e., similar to the thermal images of Figure 7) in order to observe its
saturation and evaluate the noise level throughout the inspection surface. Thus, the SNR
over the whole inspection surface may be defined as:
S N R ( x , y , t ) = 10 logic[AT (x ,y , Q - {AT(x ,y , Q ) 5 ] 2
0 s2(O(13)
Using Eq. (13), SNR images are presented in Figure 11 for three different excitation times.
As can be seen in Figure 11, the defective area appears after only an excitation time of ~30
sec due to the steep increase in the signal (TC) level relative to noise shown in Figure 10.
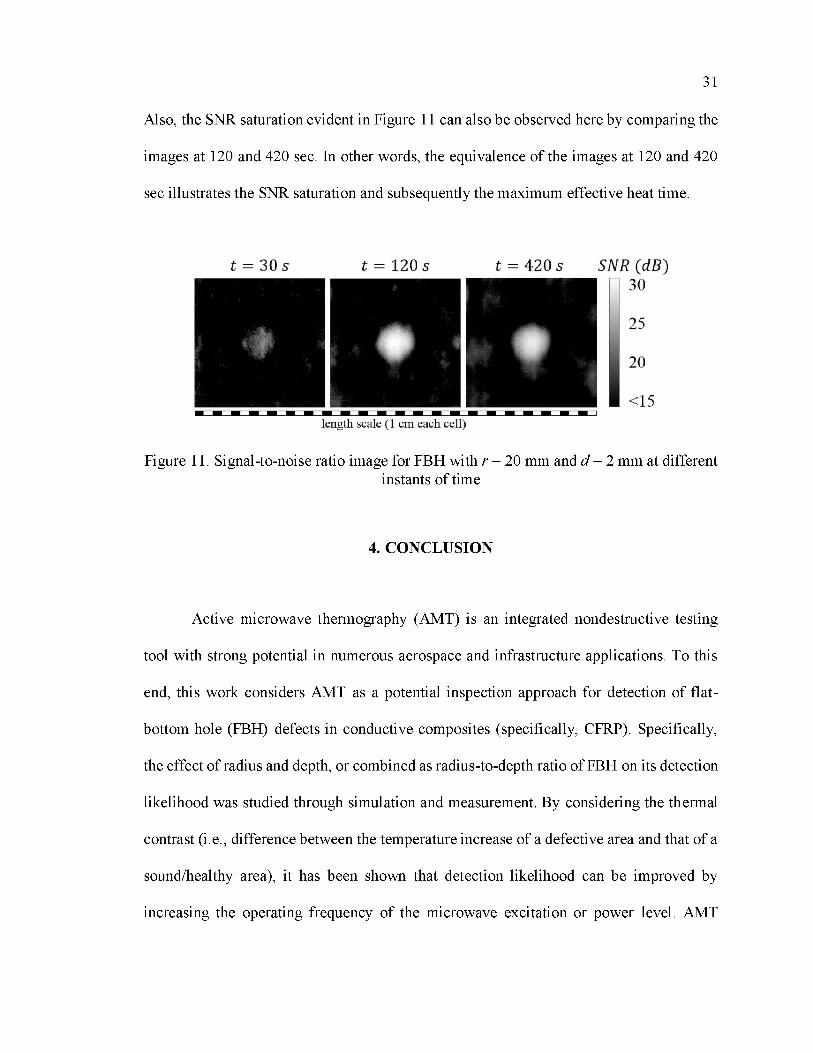
31
Also, the SNR saturation evident in Figure 11 can also be observed here by comparing the
images at 120 and 420 sec. In other words, the equivalence of the images at 120 and 420
sec illustrates the SNR saturation and subsequently the maximum effective heat time.
Figure 11. Signal-to-noise ratio image for FBH with r = 20 mm and d = 2 mm at differentinstants of time
4. CONCLUSION
Active microwave thermography (AMT) is an integrated nondestructive testing
tool with strong potential in numerous aerospace and infrastructure applications. To this
end, this work considers AMT as a potential inspection approach for detection of flat-
bottom hole (FBH) defects in conductive composites (specifically, CFRP). Specifically,
the effect of radius and depth, or combined as radius-to-depth ratio of FBH on its detection
likelihood was studied through simulation and measurement. By considering the thermal
contrast (i.e., difference between the temperature increase of a defective area and that of a
sound/healthy area), it has been shown that detection likelihood can be improved by
increasing the operating frequency of the microwave excitation or power level. AMT
32
measurements were conducted for a number of FBHs machined in a multidirectional CFRP
sheet showing practical possibility of detecting defects in conductive composites. The
results showed that TC is independent of polarization selection for multidirectional (unlike
unidirectional) CFRP due to its in-plane symmetrical structure. Ultimately, monitoring the
signal-to-noise ratio (SNR) over time showed that a high level of defect information
relative to background noise (>20 dB) is achievable after ~60 sec of microwave excitation,
and a maximum effective heat time of 1 2 0 sec.
FUNDING DATA
Division of Electrical, Communications and Cyber Systems National Science
Foundation under (Grant No. 1609470).
REFERENCES
[1] Zoughi, R., 2000, Microwave non-destructive testing and evaluation principles, vol. 4, Kluwer, Dordrecht, The Netherlands.
[2] Mirala, A., and Sarraf Shirazi, R., 2017, “Detection of surface cracks in metals using time-domain microwave non-destructive testing technique,” IET Microw. Antennas Propag., 11(4), pp. 564-569.
[3] Ricci, M., Senni, L., and Burrascano, P., 2012, “Exploiting pseudorandom sequences to enhance noise immunity for air-coupled ultrasonic nondestructive testing,” IEEE Trans. Instrum. Meas., 61(11), pp. 2905-2915.
[4] Abou-Khousa, M. A., Ryley, A., Kharkovsky, S., Zoughi, R., Daniels, D., Kreitinger, N. Steffes, G., 2006, “Comparison of X-Ray, Millimeter Wave, Shearography and Through-Transmission Ultrasonic Methods for Inspection of Honeycomb Composites,” Proc. Rev. Prog. Quantitative Nondestr. Eval., 11(26B), pp. 999-1006.

33
[5] Ibarra-Castanedo, C., and Maldague, X., 2013, “Infrared thermography,” Handbook of Technical Diagnostics, Springer-Verlag Berlin Heidelberg, pp. 1752 2 0 .
[6 ] Poudel, A., Mitchell, K. R., Chu, T. P., Neidigk, S., and Jacques, C., 2016, “Nondestructive evaluation of composite repairs by using infrared thermography,” Journal of Composite Materials, 50(3), pp. 351-363.
[7] Yang, R., and He, Y., 2016, “Optically and Non-optically Excited Thermography for Composites: A Review,” Infrared Physics & Technology, 75, pp. 26-50.
[8 ] Balageas, D., and Levesque, P., 2002, “Mines detection using the EMIR method,” Proc. QIRT, pp. 71-78.
[9] DiMarzio, C. A., Rappaport, C. M., Li, W., Kilmer, M. E., and Sauermann, G. O., 1999, “Microwave-enhanced infrared thermography,” Proc. SPIE, Photonics, Photonics East (ISAM, VVDC, IEMB), pp. 337-342.
[10] Keo, S., Defer, D., Breaban, F., and Brachelet, F., 2013, “Comparison between microwave infrared thermography and CO2 Laser infrared thermography in defect detection in applications with CFRP,” Mater. Sci. Appl., 4(10), pp. 600-605.
[11] Foudazi, A., Ghasr, M. T., and Donnell, K. M., 2015, “Characterization of corroded reinforced steel bars by active microwave the rmography,” IEEE Trans. Instrum. Meas., 64(9), pp. 2583-2585.
[12] Foudazi, A., Mehdipour, I., Donnell, K. M., and Khayat, K. H., 2016, “Evaluation of steel fiber distribution in cement-based mortars using active microwave thermography,” Mater. Struct., 49(12), pp. 5051-5065.
[13] Foudazi, A., Edwards, C. A., Ghasr, M. T., and Donnell, K. M., 2016, “Active Microwave Thermography for Defect Detection of CFRP-Strengthened Cement- Based Materials,” IEEE Trans. Instrum. Meas., 65(11), pp. 2612-2620.
[14] Foudazi, A., Ghasr, M. T., and Donnell, K. M., 2014, “Application of active microwave thermography to inspection of carbon fiber reinforced composites,” Proc. IEEE AUTOTESTCON, pp. 318-322.
[15] Foudazi, A., Donnell, K. M., and Ghasr, M. T., 2014, “Application of active microwave thermography to delamination detection,” Proc. IEEE Int. Instrum. Meas. Technol. Conf. (I2MTC), pp. 1567-1571.
[16] Beemer, M. F., and Shepard, S. M., 2017, “Aspect ratio considerations for flat bottom hole defects in active thermography,” Quantitative InfraRed Thermography Journal.

34
[17] Paul, C. R., 2006, Introduction to Electromagnetic Compatibility, 2nd ed. Wiley, New York, Chap. 10.
[18] Lienhard IV, J. H., and Lienhard V, J. H., 2017, A Heat Transfer Textbook, 4th ed., Philogiston, Cambridge, Massachusetts, USA.
[19] Tian, T., 2011, “Anisotropic Thermal Property Measurement of Carbon- fiber/Epoxy Composite Materials,” Ph.D. dissertation, Dept. Mech. & Mater. Eng., Univ. Nebraska-Lincoln, Lincoln, NE, USA.
[20] Turi, E. A., 1997, Thermal Characterization of polymetric Materials, 2nd ed., Academic Press, San Diego, California, USA.
[21] Pletcher, R. H., Tannehill, J. C., and Anderson, D. A., 2012, Computational Fluid Mechanics and Heat Transfer, 3rd ed., CRC Press.
[22] Occupational Safety and Health Administration (OSHA) nonionizing radiation regulations,https://www.osha.gov/pls/oshaweb/owadisp.show_document?p_table=STANDARDS&p_id=9745.
[23] Meola, C., Carlomagno, G. M., 2004, “Recent advances in the use of infrared thermography,” Meas. Sci. Technol., 15(9), pp. 27-58.
35
II. ACTIVE MICROWAVE THERMOGRAPHY TO DETECT AND LOCATEWATER INGRESS
ABSTRACT
This paper reports on the application of a new and efficient nondestructive testing
and evaluation (NDT&E) technique referred to as active microwave thermography (AMT)
used to detect and locate water ingress within a structure. First, a mathematical formulation
and analysis is established that relates the water extension and location to the temperature
distribution over the inspection surface and enables evaluation of water from the measured
temperature data. Following the analysis, AMT measurement results of a small volume of
water, placed in a rubber sample at a predetermined location, are reported. The results
verify the analysis and demonstrate the potential of AMT for water detection. Additionally,
analysis of the measurement data indicates the potential of AMT for not only detection of
water ingress, but also accurate depth estimation of small amounts of water ingress.
1. INTRODUCTION
Fluid absorption or the existence of undesired fluid, especially water ingress, may
degrade the mechanical performance of composites and lead to structural failure [ 1 ]-[6 ].
Also, leakage from buried parts of water distribution networks and reservoirs can result in
a serious amount of lost water [7]-[14]. Therefore, several nondestructive testing and
evaluation (NDT&E) techniques are already employed to detect and locate the water
ingress in composites and civil structures such as glass-fiber-reinforced polymer (GFRP)
36
composites, aerospace honeycomb structures, and buried pipes. These techniques include
infrared (IR) thermography, electromagnetic and microwave methods, ground penetrating
radar (GPR), and acoustic methods [1]-[14].
Active microwave thermography (AMT) is a relatively new NDT&E method which
has shown strong potential in detection and evaluation of various defect types such as
crack, void, and delamination that impact composites and infrastructure [15]-[24]. This
paper extends the spectrum of AMT applications to include detection and evaluation of
water ingress. In AMT, a microwave signal of medium power (in the order of tens of watts)
is radiated towards the inspection surface of the structure under test. For dielectric
structures and depending on the structure’s electromagnetic properties, a portion of the
incident microwave energy penetrates the structure. Generally speaking, dielectric
materials are described by their complex permittivity (often expressed relative to that of
free-space, s 0 ) as Sr = s / - jsr" where e / (or dielectric constant) represents the ability of a
dielectric material to store microwave energy, and Sr” (or loss factor) represents the ability
of a material to absorb energy. Dielectric heating results from absorption of microwave
energy in lossy dielectric materials. Thus, when a lossy dielectric is irradiated with
microwave energy, dielectric heating occurs as a result of the absorbed energy. As it relates
specifically to this work, in the case where there is water (a lossy dielectric) ingress within
a structure, the water will interact with the penetrating microwave radiation and convert
this energy into heat (i.e., thermal energy), resulting in dielectric heating. This is different
from Joule heating, which takes place in conductors exposed to electromagnetic radiation.
While this microwave-based heat generation takes place everywhere in the
structure, it will be greater in the water than in the background material, as the loss factor

37
of water is substantial [25]. Therefore, the area of the structure undergoing water ingress
acts as a non-uniform volumetric heat source. Moreover, the amount of heat generated in
the water depends on its volumetric distribution within the structure and the interrogating
microwave energy parameters such as its strength (power level) and frequency.
Subsequently, the generated heat diffuses inside the structure and reaches the inspection
surface, where it causes a non-uniform temperature distribution that is greater in areas near
the water ingress. Like other thermographic techniques, the inspection surface in AMT is
monitored via a thermal camera which enables measurement of the temperature
distribution. Spatial and temporal variations of the temperature distribution then are
analyzed in order to obtain information regarding the water ingress. This information may
include approximate volume and extension of the water ingress and its depth. As it relates
to depth determination, often an approximate cross-sectional extension of the defect can be
easily and directly identified in thermal images (generally speaking for thermographic
techniques). However, evaluation of the depth of a defect often requires complex analysis
on the temporal evolution of the thermal images, as is the case in this work.
In general, AMT has several advantages including short inspection times for
relatively large areas, non-contact interrogation and inspection, and easy-to-interpret
results (results are obtained in an image format and can be visually interpreted to some
extent). Beside these advantages that AMT shares with other thermographic methods [26],
microwave radiation as the thermal excitation is particularly well-suited for detection of
water ingress due to the fact that water is highly absorptive to electromagnetic energy in
the microwave frequency range [25]. In fact, AMT offers the advantage of selective heating
as the heat source is exerted only upon the defect (water ingress), with less interaction with

38
the background material. In this case, unlike conventional thermography, the defect acts as
a heat source, rather than merely affecting the heat diffusion. As such, AMT is uniquely
effective and potentially superior to other thermographic methods.
In this research, microwave radiation at 2.4 GHz is utilized because water has a
high absorption of microwaves at this frequency. Further, this frequency is in the license-
free industrial, scientific and medical (ISM) radio band. Measurement results are provided
in Section III, after the modeling results of Section II, that show a high efficacy of AMT
for water detection and validate the relevant formulation and analysis provided next.
2.1. BASIC FORMULATION
As mentioned, the temperature distribution over the surface of structure is measured
structure. The relationship between the defect (water ingress) acting as a heat source, Q,
2 . MODELING AND THEORY
in an AMT inspection and used to extract information regarding defects within the
and the temperature distribution induced by this source, T, can be established by the heat
equation as [27]:
( 1 )
where a, p, and c denote the thermal diffusivity, density, and the specific heat capacity of
the structure in which heat diffuses, respectively. In other words, the heat equation of (1)
39
relates the temporal and spatial variation of temperature to the heat source and material
properties. In addition, in this paper, the temperature (T) refers to the temperature increase
caused by the water ingress, and does not reflect the initial temperature distribution or the
temperature rise caused by the background material (structure).
To find the temperature distribution from (1), the model shown in Figure 1 is used.
In this model, the structure is assumed as a half-space located at z < 0 and contains water
ingress of volume, V. Moreover, the x- and y-axes represent cross-sectional coordinates,
and the z-axis (positive z) points toward the structure depth, with the inspection surface
located at z = 0. Using the Green’s function method as detailed in [28], the solution to (1)
can be written as:
(2 )
This equation relates the temperature over the inspection surface at point (xy) to the heat
source distribution located at (x'y',z') at any time. In addition, dV' = dx 'dy 'dz ' is the heat
source’s element of volume, and G denotes the Green’s function and has the closed form
of
1 (x - x ' )2 + (y — y ' ) 2 + z 4 a t
J\2 ,/\2 ,/2 "| (3)G ( x ,y , t |x ' , y ' , z ' ) = 3 exp —
4 ^ n a t
40
for the model of Figure 1 when the thermal boundary condition is assumed to be adiabatic
on the inspection surface. For controlled environments and small temperature increases
over the structure surface (as in AMT), this assumption is very accurate since the air is
In order to use (2) to determine the surface temperature distribution (T), the thermal
source’s power density (Q) as a function of space and time must be known. In AMT, the
microwave excitation is continuously applied for a certain time, referred to as heating time
(denoted by t). In addition, the cooling period starts when the microwave excitation is
removed. Therefore, the power density due to the dielectric heating may be written as:
steady above the surface and has a low temperature difference with the surface.
Structure
Figure 1. Basic model used to formulate and analyze water detection using AMT
0 < t < T otherwise
(4)
where f , e/', and E are the microwave frequency, dielectric loss factor of water, and the
magnitude of the incident electric field in the water, respectively. The complex permittivity
of water at 2.4 GHz and room temperature is 77 - j9 [25]. This value remains constant

41
throughout this research because the frequency is fixed and the temperature change does
not exceed 4 °C. As mentioned earlier, high value of water’s dielectric loss factor results
in high absorption of microwave energy by water, thereby enabling water ingress detection
by AMT efficiently. In addition, the value of E depends on many factors including the
incident microwave power density, material properties of the background structure (here,
rubber), and the location and distribution of the water ingress.
A closed form solution to (2) cannot be obtained in most cases due to the
complexity of the integrals and the convolution operator within the integrals. Hence, it is
often numerically evaluated. However, a closed form solution for the temperature
distribution over the structure surface can be calculated from (2 ) for an infinitesimal
volume of water, V, located at (0,0,d), and is given as:
T ( r , t ) = Q0V2 nkr
e r f |^ 4 a ( t — r ) u ( t = ^ ) —'e r / ( v ^ )
(5)r
where k = ape is the thermal conductivity of the structure and r = ^ x 2 + y 2 + d 2 is the
distance from the water ingress to the measurement point on the surface. Also, Q0 =
n f £ 0£ f E 2, which is, generally speaking, a function of water ingress distribution (i.e., its
volume). However, this quantity is independent of volume when V is infinitesimal such
that the scattering of the microwave fields by the water ingress be insignificant and the
electric field be considered constant within the entire water volume. This condition requires
the water to be thinner than approximately one-tenth of the wavelength of the microwave

42
in the water [29] (in this case, approximately 1.4 mm). As a result, the temperature is a
linear function of volume according to (5) for infinitesimal V.
2.2. SIMULATIONS
To verify the formulation of (5) and investigate the effect of water ingress depth on
temperature, an AMT test to detect a small rectangular volume of water with V = 0.05 mL,
equal to volume of an average water drop [30], is simulated and compared with the
temperature as calculated using the analytical expression of (5). Specifically, full wave
simulations are conducted using a coupled electromagnetic/thermal model created using
CST Microwave Studio and Multiphysics Studio software packages. The simulated
structure consists of a piece of rubber exposed to 300 seconds of microwave radiation with
50 W incident power at 2.4 GHz. The water ingress is placed at depths of 6 , 9, and 12 mm.
The electromagnetic and thermal properties of water and rubber are given in Table 1, and
the simulated results are given in Figure 2 as a function of time and position on the structure
surface (cross-sectionally above the location of water ingress).
Table 1. Properties of water and rubber [25],[31],[32]
Material Property Value
Water Dielectric Constant (£r) 77Dielectric Loss Factor (Sr”) 9
Dielectric Constant (£r) 2.4Rubber Thermal Diffusivity (a) 0 . 1 1 mm2/s
Thermal Conductivity J k ) 0.16 W/m K

43
In Figure 2(a), temperature on the rubber surface above the location of water ingress
is shown versus time. As expected, the temperature rises during the heating period and
reduces during the cooling period. The temperature decay has a delay from the cooling
period start-point (i.e., t = 300 5 ) which is a function of water depth, as is discussed later.
Also, the absolute temperature values are highly affected by the depth of water. That is to
say, the maximum temperature increase for the cases with depths of 6, 9, and 12 mm is
1.56, 0.66, and 0.32 °C, respectively. In addition, as the thermal camera used in this work
has a temperature sensitivity of 0.03 °C, shown by the green line in Figure 2(a), detection
of very small volumes of water (one drop, in the current case) is possible after a few
minutes. More specifically, a heating period of 1 minute is sufficient for detection of a drop
at a depth of up to 15 mm, 4 minutes for detection up to 25 mm, and a 10-minute inspection
can theoretically detect this volume of water at a maximum depth of 34 mm.
In Figure 2(b), the temperature distribution on the structure surface is shown versus
position over the water ingress. As seen, when the heat source (water ingress) is located
deeper in the structure, the temperature curves have wider spatial distributions. In fact, the
thermal energy spreads more extensively before reaching the surface for larger depths. As
a result, the spatial temperature distribution is better confined to the corresponding physical
distribution when the source is closer to the surface and therefore is a better indication of
the cross-sectional extension of water. This will also be shown in the next section with the
results of experimental AMT tests.

44
0.4
00 200 300 400 500 600t (sec)
d = 6 mm (Analytical) —- d = 9 nnn (Analytical) — d = 12 mm (Analytical)d = 6 mm (Simulation) - - d = 9 nun (Simulation) d = 12 mm (Simulation)
(a)
■3 -2 -1 0 1 2 3x (cm)
(b)
Figure 2. Temperature versus time (a) and position over the structure surface (b) for 0.05 mL water ingress at depths of 6 , 9, and 12 mm, calculated analytically and by coupled
electromagnetic/thermal simulations
In Figure 3, a 3D representation of the distribution of the stored thermal energy
density (in J/cm3) generated by microwave heating, inside and over the surface of the
structure, is shown for the case of d = 9 mm at t = 180, 360, and 540 sec. This quantity is
calculated by the proposed analytical formulation and the equation q = pcT [27]. As
shown, the thermal energy is highly concentrated at and around the location of water

45
ingress during the heating period, as shown for t = 180 sec. As the time increases (i.e., t =
360 sec), a significant amount of thermal energy has reached to the surface of the sample
and the temperature on the sample surface is maximum (see Figure 2a). During the cooling
period, on the other hand, heat diffuses further into the sample away from the location of
water ingress, as can be seen at t = 540 sec.
Figure 3. 3D distribution of stored thermal energy for water ingress with d = 9 mm atdifferent instances of time
For a better observation of the dependence of temperature on depth, the maximum
value of temperature is calculated by (5) for different values of d and t for the same
microwave power, water volume, and structure as given before, with the results depicted

46
in Figure 4. Specifically, in Figure 4(a), the maximum temperature is calculated for depths
of 5-15 mm with the heating time ranging from 1-10 min. As seen, the temperature highly
depends on the depth and exponentially decreases for larger depths. This leads to reduced
detectability of the water since detectability of a defect depends on the induced surface
temperature along with the sensitivity of the thermal camera [15]. Moreover, the
temperature and subsequent detectability increases with the heating time, as expected. This,
however, requires longer inspections. More specifically, for deeper defects, the
temperature may have a maximum that is below the temperature measurement sensitivity,
as shown in Figure 4(b), where the maximum temperature is shown for depths of 20-50
mm. For a thermal camera with a sensitivity of 0.03 °C (as is used for this work), water
ingress that yields a temperature less than this value are undetectable, as indicated in the
figure. For example, with a heating time of 300 sec, the maximum depth for a detectable
defect is 27 mm, but this value is 34 mm if the heating time is 600 sec. These values are
for the specific structure, microwave excitation, and water ingress distribution as are given
here and must be recalculated for different inspection scenarios. In addition, as is apparent
in Figure 4 (both), the temperature does not monotonically grow with the heating time and
the curves of high t asymptotically approach a limit. More specifically, in the limit of
infinite heating time, (5) reduces to Tmax = QdV/2nkd. By considering a theoretical
detectability criteria defined as Tmax > S, where S is the sensitivity of the thermal camera,
a relationship between depth and sensitivity can be defined as d < Q0V/2nkS. For the
parameters used here, a defect deeper than 669 mm is (theoretically) undetectable, even
with an infinitely long heating time, according to this relation. This relation also indicates
an inverse proportionality between detectable depth and the structure’s background

47
material’s thermal conductivity. This means that AMT is more efficient in detection of
water in structures with lower thermal conductivities, while in conventional thermographic
techniques, the difference between thermal conductivities of the structure and the defect is
important [33]. This may make AMT superior to conventional thermography for structures
with a thermal conductivity close to that of water. In addition, it should be noted that one
way to increase the induced heat is to employ a higher frequency or microwave excitation
power as Q0 k f E 2. However, increasing the power level and frequency both increase
system cost along with regulatory and safety limits that may be imposed [15].
(a)
(b)
Figure 4. Maximum of temperature vs. depth for different values of heating time

48
2.3. DEPTH EVALUATION
According to Figure 2, beside the impact of depth on the maximum value of
temperature increase, for a deeper water ingress, the rate of temperature change is less than
that of shallower ingress in both the heating and cooling periods. In addition, the transition
between the increasing and decreasing temperature takes place at a later time (relative to
the shallower depths). In fact, for near-surface water ingress, the temperature reaches its
maximum at the end of heating time and starts decreasing immediately in the cooling
period, while, due to the distance between the water and the inspection surface for deeper
water ingress, the temperature maximum occurs with a delay, At with respect to t. This
concept is illustrated in Figure 5. Moreover, this delay, which can be measured in any AMT
inspection, can be used to estimate the depth of water ingress inside the structure. Based
on this, as the rate of change of T with respect to time is zero at the maximum of T, the
equation d T / d t \ t=to = 0 is considered to find the relation between t 0 = t + At and d. As
the desired relation depends on the distribution of water ingress, a simple model shown in
Figure 6 (a) is used here. In this model, a very thin rectangular layer of water with height,
h, and cross-sectional dimensions, l and w, is placed in a depth of d inside the structure.
The heat source then is considered as
q = \QohS(z - d)
0
l w\x\ < - , \y \ < —, 0 < t < t
otherwise
(6)
Using (2) and (6 ) and applying d T / d t = 0, the depth can be found as:

49
d =4 a t 0At -----— In
Te r f ( l / 4 V a A t ) e r f ( w / 4VaAt)
e r f ( £ / 4 j a t 0) e r f ( w / 4 j a t 0)
(7)
which can be used once the length and width of water ingress is estimated from the thermal
images. As it relates to practical inspections, in many cases, ingressed water distributions
are of the special forms shown in Figure 6 (b): extended (when water ingress has a large
cross-sectional area), linear (such as water seeped into a crack or vein), and point (like
drops) [34]. In all of these cases, (7) can be simplified as:
d = k2 a t 0At f t 0\
f - ^ in y (8 )
where k ( 1 , w ^ m) = 1, ^ m ,w ^ 0) = V2 and k ( 1 , w ^ 0 ) = V3, for extended,
linear, and point distributions, respectively. Here, k is a coefficient that depends on the
cross-sectional extension of the water and is always 1 < k < V3. Using (8 ) for the three
cases of Figure 2 with ft = 319, 357, and 427 sec (extracted from the curves in Figure 2)
yields exact values for ingress depths of 6 , 9, and 12 mm (the precise values used in
simulation above). The formulation given in this section, therefore, is validated by
comparing the results of (8 ) to the simulation results obtained from commercial software
CST Microwave Studio and Multiphysics Studio.

50
Figure 5. The microwave excitation pulse shape and temperature response to this excitation for near-surface and deeper water ingress cases

51
(a)
(b)
Figure 6 . (a) Rectangular model used to study the relation between water depth and the delay time, At, and (b) special water distributions
2.4. EFFECT OF BACKGROUND MATERIAL
For the simulation results provided in the previous sections and measurements
provided in the next section, rubber, as a representative material within which water ingress
may occur, was assumed to be the background material. Detection of water ingress in
rubber finds application in inspection of submarine acoustic tiles [35], heavy electrical
component insulators [36], sealed cabins of aircraft and ships as well as in high-
temperature and high-pressure water and oil seal rings [37]. The application of AMT for
water ingress detection, however, is not limited to rubber and can be considered for any
material which allows microwave energy to penetrate. This includes a variety of materials
such as GFRP, honeycomb, and mortar. For good electrical conductors and dielectrics with

52
significant loss, the application of AMT for detection of water ingress will be very limited,
since the microwave energy does not penetrate the surface and hence will not reach the
water. Therefore, in order to study the effect of background material properties on the
efficacy of AMT, a number of simulation results are presented here.
In general, permittivity (er), thermal diffusivity (a), and thermal conductivity (k)
are the parameters which fully characterize the background material’s effect on the thermal
response of water ingress. These parameters are given for GFRP, HRH-10 honeycomb, and
mortar in Table 2. The HRH-10 honeycomb is a dielectric honeycomb structure which is
widely used throughout the aerospace industry, as most of the interior panels of commercial
jets and exterior aircraft parts such as radomes, fairings, helicopter blades, flaps, etc., are
made with this material [40]. As this structure is a very low-loss dielectric, AMT is
expected to easily detect water ingress trapped within its cells.
Table 2. Materials properties [38]-[41]
Material £r a (mm2/s) k (W/ m K)Rubber 2.4 0 . 1 1 0.16GFRP 3.5 - j 0.07 0.26 0.43
Honeycomb 1 . 1 1 0.07Mortar 4.8 - j 0.05 0 . 6 1 . 2
The thermal response to the microwave excitation is given in (5) and was evaluated
for rubber, as shown in Figure 2. For the same case shown in Figure 2 (V = 0.05 mL and d
= 9 mm) but with different background materials, the temperature versus time is depicted
in Figure 7. As seen in this figure, different materials render different responses to AMT.
Specifically, for rubber, GFRP, honeycomb, and mortar, the maximum of temperature
occurs at different times with At = 57, 17, 3, and 5 sec, respectively. According to these

53
values and also from (8), for a material with a lower diffusivity, the maximum temperature
occurs at a later time. More importantly, the maximum values of temperature increase for
the rubber, GFRP, honeycomb, and mortar are 0.66, 0.43, 2.26, and 0.20 °C, respectively.
These values show how thermal conductivity of the background material affects the
maximum temperature rise and thus the detectability of a defect. In fact, according to (5),
for a constant a, the maximum temperature is inversely proportional to the thermal
conductivity. Therefore, the low thermal conductivity of honeycomb (which is due to its
low mass density [40]), the temperature has a much steeper increase and this results in a
faster detection of water ingress. On the other hand, mortar is a weak thermal conductor
and therefore the rate of temperature increase is reduced.
Figure 7. Temperature increase versus time for 0.05 mL of water ingress at a depth of 9mm, calculated for different materials
For a better demonstration of the effect of background material properties on the
maximum temperature increase and the time at which this maximum occurs, Tmax and At
are shown versus a and k when other parameters are constant (er = 2.4, V = 0.05 mL, d = 9

54
mm, and t = 300 sec), in Figure 8. As expected, At is smaller for higher values of a since
a higher thermal diffusivity means that the heat diffuses faster in the materials and that
shortens the time required for the heat to reach the sample surface. Tmax, however, is a
function of both a and k, and increases significantly for lower values of k. The effect of
background material’s thermal diffusivity and conductivity on thermal responses in AMT
tests was shown in this section (in Figure 7 and Figure 8) and can be extrapolated to other
materials when detection of water ingress is desired. It should be also noted that AMT’s
success is limited when background materials, such as conductive materials, do not allow
penetration of microwave radiation into their depth.
Figure 8. Maximum of temperature increase and At versus a and k

55
3. MEASUREMENTS
3.1. METHOD
The AMT system is depicted in Figure 9. The system consists of an RF source
locked at 2.4 GHz and a 50 W microwave amplifier. A ridged horn antenna is used to direct
the microwave radiation onto the structure surface. This antenna is capable of handling and
radiating high-power microwave energy in the operational frequency range of 1 -4 GHz
with a gain of 14 dBi at 2.4 GHz. The antenna has a total length of 40 cm and aperture
dimensions of 23*17 cm2. A thermal camera (FLIR T430sc) with sensitivity and frame rate
of respectively 0.03 °C and 30 Hz is used to measure the surface thermal profile of the
structure. The thermal camera captures thermal images with a resolution of 320 * 240
pixels. The spatial resolution of the thermal images of the sample surface depends on the
camera’s field-of-view. In this work, thermal images have a resolution of 0.6 * 1.1 mm2
over the sample’s surface. The RF source, power amplifier, and thermal camera are
controlled and synchronized by the control unit. The control unit consists of a data
acquisition (DAQ) device which is controlled by the software package MATLAB.
MATLAB’s data acquisition and image acquisition toolboxes work simultaneously to
control the microwave excitation and record thermal images.
The distance between the antenna and surface of the structure under test is referred
to as the lift-off distance. For AMT inspections, the lift-off distance must be such that the
incident power over the inspection area results in a measurable temperature increase but
also allows viewing of the sample surface with the thermal camera. For this work, the lift
off distance is 13 cm for all measurements. The radiation from the horn antenna covers the

56
region containing the defect that is located in the saturated paper towel. For cases where a
large inspection area is needed, sections of the structure can be inspected individually by
raster scanning, or by using an antenna, or multiple antennas with a wider radiation pattern.
In any case, the analysis method and outcomes reported herein remain the same.
Figure 9. AMT system for water detection
3.2. RESULTS
A number of tests were performed using the AMT system as described above, to
investigate the practical efficacy of AMT for water detection. The water was added to a
4x4 cm2 piece of paper towel and the paper towel was sandwiched between a thick (2 cm)
rubber sample at the bottom and thin (1-7 mm) layers of the same rubber at the top. The
thickness of the top rubber layer is then considered as the depth of the water. Three different
volumes of water, 0.5, 1, and 2 mL, were added to the paper towel and correspond to h =
0.3125, 0.6250, and 0.9375 mm, respectively. As a result, the water distribution was

57
assumed to be that illustrated in Figure 6(a) (rectangular with dimensions l, w, and h and
depth d from the surface). The microwave excitation of 50 W at 2.4 GHz was applied for
300 sec, with an additional 300 sec of cooling time (i.e., a total test duration of 600 sec).
Thermal images were recorded and post-processed in order to yield temporal and positional
temperature behavior. Also, the initial thermal image at t = 0 sec is subtracted from all
subsequent thermal images in order to obtain the temperature increase (considered above
in the simulated and analytical results) instead of the absolute temperature. In Figure 10,
the thermal images are shown for the cases of d = 1 and 4 mm and all three volumes at t =
120, 300, 330, and 600 sec. Dashed black lines over the thermal images show the physical
cross-sections of water below the surface. As seen and expected, the temperature is greatest
at a location centered on the location of water, and the hot area is considerably confined
within the water boundaries. In addition, small volumes of water such as 0.5 mL are clearly
detected after 120 sec of microwave heating. In addition, due to thermal diffusion, the
temperature is not zero outside the boundaries, especially at latter instances of time. More
specifically, the temperature becomes more uniform at t = 600 sec since by this time in the
cooling period, the heat has diffused significantly to adjacent areas. Furthermore, it can be
noted that for deeper water (4 mm depth), the temperature is more spread over the
inspection surface, as was discussed and shown in Figure 2(b). This fact makes it harder to
estimate the physical extension of deeper water, as the thermal images lose contrast.
Another important aspect seen in the thermal images of Figure 10 is that for the
depth of 1 mm, the temperature is maximum at t = 300 sec, while it is maximum at t =
330 sec for the depth of 4 mm. In fact, the depth of 4 mm corresponds to t0 = 326 sec as

58
calculated by (8) for the maximum of the temperature, indicating good agreement
between the theory above and measurement results.
Figure 10. Thermal images related to different volumes and depths of water at different times obtained through AMT measurements
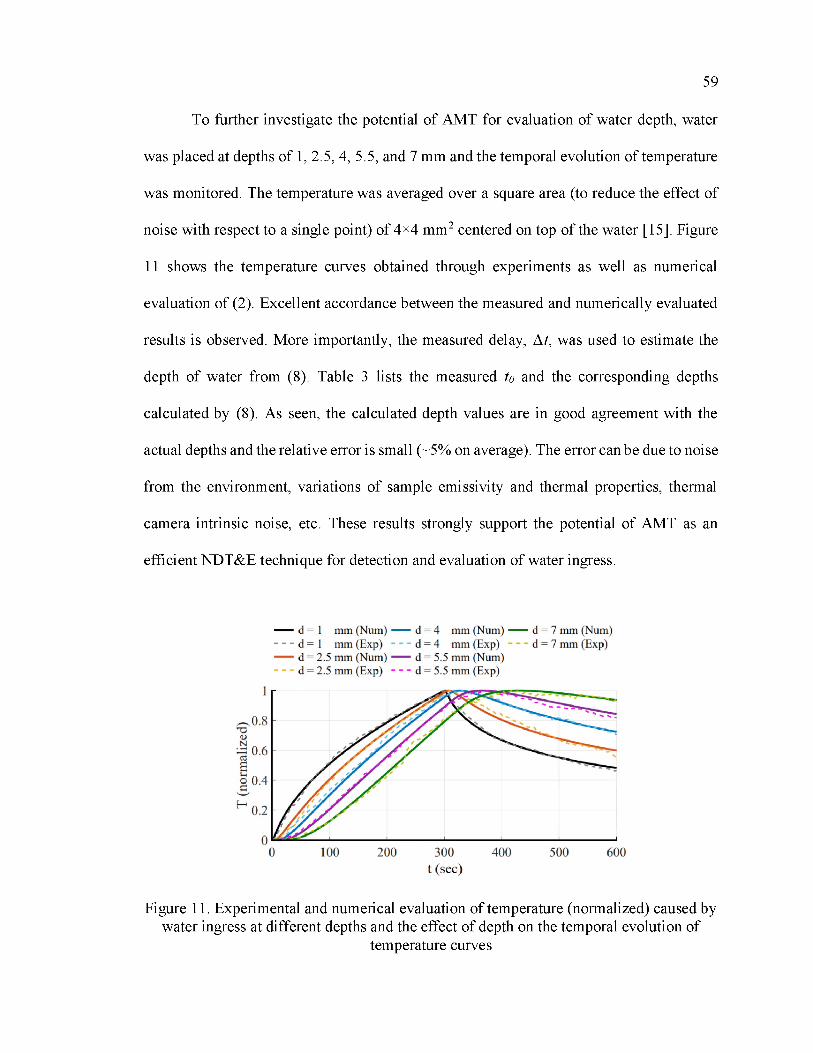
59
To further investigate the potential of AMT for evaluation of water depth, water
was placed at depths of 1, 2.5, 4, 5.5, and 7 mm and the temporal evolution of temperature
was monitored. The temperature was averaged over a square area (to reduce the effect of
noise with respect to a single point) of 4*4 mm2 centered on top of the water [15]. Figure
11 shows the temperature curves obtained through experiments as well as numerical
evaluation of (2). Excellent accordance between the measured and numerically evaluated
results is observed. More importantly, the measured delay, At, was used to estimate the
depth of water from (8). Table 3 lists the measured to and the corresponding depths
calculated by (8). As seen, the calculated depth values are in good agreement with the
actual depths and the relative error is small (~5% on average). The error can be due to noise
from the environment, variations of sample emissivity and thermal properties, thermal
camera intrinsic noise, etc. These results strongly support the potential of AMT as an
efficient NDT&E technique for detection and evaluation of water ingress.
Figure 11. Experimental and numerical evaluation of temperature (normalized) caused by water ingress at different depths and the effect of depth on the temporal evolution of
temperature curves

60
Table 3. Calculated depths of water and their errors
Actual d (mm) Measured to (sec) Calculated d (mm) Error (%)1 301 1.1279 12.8
2.5 308 2.5897 3.64 330 4.2383 6.0
5.5 367 5.7069 3.87 420 7.2065 2.9
4. CONCLUSION
The potential of active microwave thermography (AMT) as an inspection tool for
detection of ingressed water was assessed through mathematical analysis, simulations, and
measurement. The results indicate that AMT has strong potential to detect and locate small
volumes of water ingress after a few minutes of microwave excitation. Specifically, an
amount of water on the order of a few drops was detected in a rubber sample at a depth of
a few millimeters. More importantly, the depth of water was estimated using experimental
data and mathematical formulation, with an average error of ~5%. To this end, a simple
formulation was proposed to relate the temporal behavior of the temperature obtained
through AMT measurements and the depth of the water. In addition, the relationship
between the detectability of water and the test parameters such as the microwave excitation
frequency and power, water volume and depth, structure properties, and the heating time
was established.

61
REFERENCES
[1] L. Rocha, “Combined experimental/numerical investigation of directional moisture diffusion in glass/epoxy composites,” Composites Science and Technology, vol. 151, pp. 16-24, Oct. 2017.
[2] P. Wang, Y. Pei, and L. Zhou, Near-field microwave identification and quantitative evaluation of liquid ingress in honeycomb sandwich structures,” NDT&E International, vol. 83, pp. 23-37, Oct. 2016.
[3] P. Malinowski et al, “Moisture detection in composites by terahertz spectroscopy,” J. Phys.: Conf. Ser., vol. 628, iss. 1, pp. 012100, 2015.
[4] E. Barjasteh, and S. R. Nutt, “Moisture absorption of unidirectional hybrid composites,” Composites: Part A, vol. 43, Iss. 1, pp. 158-164, Jan. 2012.
[5] N. P. Avdelidis, A. Moropoulou, and P. Theoulakis, “Detection of water deposits and movement in porous materials by infrared imaging,” Infrared Physics & Technology, vol. 44, Iss. 3, pp. 183-190, Jun. 2003.
[6] G. Sala, “Composite degradation due to fluid absorption,” Composites: Part B, vol. 31, no. 5, pp. 357-373, Jul. 2000.
[7] D. Ayala-Cabrera et al., “GPR-Based Water Leak Models in Water Distribution Systems,” Sensors, vol. 13, no. 12, pp. 15912-15936, Nov. 2013.
[8] Z. Liu, Y. Kleiner, “State of the art review of inspection technologies for condition assessment of water pipes,” Measurement, vol.46, no. 1, pp. 1-15, Jan. 2013.
[9] A. Cataldo, G. Cannazza, E. De Benedetto, and N. Giaquinto, “A new method for detecting leaks in underground water pipelines,” IEEE Sensors J., vol. 12, no. 6, pp. 1660-1667, Jun. 2012.
[10] S. Demirci et al, “Ground penetrating radar imaging of water le aks from buried pipes based on back-projection method,” NDT&E International, vol. 47, pp. 35-42, Apr. 2012.
[11] T. Hao et al., “Condition assessment of the buried utility service infrastructure,” Tunneling Underground Space Technol., vol. 28, no. 1, pp. 331-334, Mar. 2012.
[12] E. Grinzato et al, “Infrared Thermography for Moisture Detection: A Laboratory Study and In-situ Test,” Materials Evaluation, vol. 69, Iss. 1, pp. 97-104, Jan. 2011.
62
[13] M. Fahmy, and O. Moselhi, “Automated detection and location o f leaks in water mains using infrared thermography,” J. Perform. Constructed Facilities, vol. 24, no. 3, pp. 242-248, Jun. 2010.
[14] M. Bimpas, A. Amditis, and N. Uzunoglu, “Detection of water leaks in supply pipes using continuous wave sensor operating at 2.45 GHz,” Journal of Applied Geophysics, vol. 70, Iss. 3, pp. 226-236, Mar. 2010.
[15] A Mirala, A. Foudazi, M. T. Ghasr, and K. M. Donnell, “Detection of Flat-Bottom Holes in Conductive Composites Using Active Microwave Thermography,” ASME J Nondestructive Evaluation, vol. 1, Iss. 4, pp. 041005-1-041005-7, Nov. 2018.
[16] A. Foudazi, A. Mirala, M. T. Ghasr, and K. M. Donnell, “Active Microwave Thermography for Nondestructive Evaluation of Surface Cracks in Metal Structures,” IEEE Trans. Instrum. Meas., vol. 68, no. 2, pp. 576-585, Feb. 2019.
[17] A Mirala, X. Zou, M. T. Ghasr, L. Sneed, and K. M. Donnell, “Active Microwave Thermography: A Real-Time Monitoring Tool for CFRP-Concrete Bond Testing,” in Proc. IEEE Int. Instrum. Meas. Technol. Conf. (I2MTC), May 2019, pp. 1-6.
[18] A Mirala, M. T. Ghasr, and K. M. Donnell, “Nondestructive assessment of microwave absorbing structures via active microwave thermography,” in Proc. IEEE Int. Instrum. Meas. Technol. Conf. (I2MTC), May 2018, pp. 1-6.
[19] A. Foudazi, I. Mehdipour, K. M. Donnell, and K. H. Khayat, “Evaluation of steel fiber distribution in cement-based mortars using active microwave thermography,” Mater. Struct., vol. 49, no. 12, pp. 5051-5065, Dec. 2016.
[20] A. Foudazi, C. A. Edwards, M. T. Ghasr, and K. M. Donnell, “Active Microwave Thermography for Defect Detection of CFRP-Strengthened Cement-Based Materials,” IEEE Trans. Instrum. Meas., vol. 65, no. 11, pp. 2612-2620, Nov. 2016.
[21] A. Foudazi, M. T. Ghasr, and K. M. Donnell, “Characterization of corroded reinforced steel bars by active microwave thermography,” IEEE Trans. Instrum. Meas., vol. 64, no. 9, pp. 2583-2585, Sep. 2015.
[22] A. Foudazi, M. T. Ghasr, and K. M. Donnell, “Application of active microwave thermography to inspection of carbon fiber reinforced composites,” in Proc. IEEE AUTOTESTCON, Sep. 2014, pp. 318-322.
[23] A. Foudazi, K. M. Donnell, and M. T. Ghasr, “Application of active microwave thermography to delamination detection,” in Proc. IEEE Int. Instrum. Meas. Technol. Conf. (I2MTC), May 2014, pp. 1567-1571.
63
[24] S. Keo, D. Defer, F. Breaban, and F. Brachelet, “Comparison between microwave infrared thermography and CO2 Laser infrared thermography in defect detection in applications with CFRP,” Mater. Sci. Appl., vol. 4, no. 10, pp. 600-605, 2013.
[25] U. Kaatze, “Complex permittivity of water as a function of frequency and temperature,” J. Chem. Eng. Data, vol. 34, no. 4, pp. 371-374, Oct. 1989.
[26] X. Maldague, “Introduction to NDT by active infrared thermography,” Mater. Eval., vol. 60, pp. 1060-1073, 2002.
[27] J. H. Lienhard IV, and J. H. Lienhard V, A Heat Transfer Textbook, 4th ed., Cambridge, Massachusetts, USA: Philogiston, 2017.
[28] K. Cole, A. Haji-Sheikh, J. Beck, and B. Litkouhi, Heat Conduction Using Green's Functions, New York, NY, USA:CRC Press, 2011.
[29] J. D. Jackson, Classical Electrodynamics, 3rd ed. New York: John Wiley & Sons, Inc, 1999.
[30] H. Hugli, J. Gonzalez, "Drop volume measurement by vision", SPIE Electronic Imaging Conference, vol. 3966, no. 11, pp. 60-66, 2000.
[31] W. M. Haynes, Ed., CRC Handbook of Chemistry and Physics. Boca Raton, FL, USA: CRC Press, 2016.
[32] E. M. Ortt et al, “A Device for Evaluating the Multiaxial Finite Strain Thermomechanical Behavior of Elastomers and Soft Tissues,” Journal of Applied Mechanics, vol. 67, pp. 465-471, Sep. 2000.
[33] B. Milovanovic and I. Banjad Pecur, “Review of Active IR Thermography for Detection and Characterization of Defects in Reinforced Concrete,” Journal of Imaging, vol. 2, no. 2, pp. 11, 2016.
[34] R. Ross, “Inception and Propagation Mechanisms of Water Treeing,” IEEE Trans. Dielectr. Electr. Insul., vol. 5, pp. 660-680, 1998.
[35] M. Reid and P. Kilcullen, “Exploring Terahertz Waves for Submarine Cladding NDE: Tile Sealant Transmission Characterization, Instrument Field Housing Design/Prototype Option B: proof-of-concept concealed interface imaging,” University of Northern BC, Prince George, BC, Canada, Mar. 2017. [Online]. Available: https://cradpdf.drdc-rddc.gc.ca/PDFS/unc335/p809810_A1b.pdf.
[36] B. B. Lahiri, S. Bagavathiappan, P. R. Reshmi, J. Philip, T. Jayakumar, B. Raj, “Quantification of defects in composites and rubber materials using active thermography,” Infr. Phys. Technol, vol. 55, pp. 191-199, Mar. 2012.

64
[37] F. Xu et al, “Nondestructive Evaluation of Rubber Composites Using Terahertz Time Domain Spectroscopy,” in FIBRES & TEXTILES in Eastern Europe, 2018, iss. 1, no. 127, pp. 67-72.
[38] Z. Li, A. Haigh, C. Soutis, A. Gibson, and P. Wang, “A review of microwave testing of glass fibre-reinforced polymer composites,” Nondestruct. Test. Eva., vol. 34, no. 4, pp. 429-458, 2019.
[39] H. Deng, J. Ramos, and P. Yang, “Thermal Properties of a Glass Fiber Filled Epoxy (Sumitomo E264H),” The Rio Grande Symposium on Advanced Materials, 2015.
[40] HRH-10 Nomex Aramid Fiber / Phenolic Resin Product Data Sheet, HEXCEL®,2017. [Online]. Available:https://www.hexcel .com/Resources/DataSheets/Honeycomb.
[41] A. Foudazi, I. Mehdipour, K. M. Donnell, and K. H. Khayat, “Evaluation of steel fiber distribution in cement-based mortars using active microwave thermography,” Mater. Struct., vol. 49, no. 12, pp. 5051-5065, Dec. 2016.

65
III. EFFICIENT HEALTH MONITORING OF RAM-COATED STRUCTURES BY ACTIVE MICROWAVE THERMOGRAPHY
ABSTRACT
In this paper, the application of active microwave thermography (AMT) is
investigated as an efficient nondestructive (NDT) technique for health monitoring of
structures coated with radio-frequency absorbing materials (RAM). The uniqueness of
AMT for this particular application is the use of the microwave excitation which acts as a
highly efficient thermal source due to the inherent absorptive electromagnetic properties
of RAM-coated structures. In addition, the microwave induced heating takes place
subsurface within the absorbing material of a RAM-coated structure, as opposed to the sole
surface heating of conventional thermography. Specifically, this work focuses on detection
of delamination, which is a common defect in carbon fiber reinforced polymer (CFRP)
structures, via AMT. To this end, a comprehensive formulation and analysis method based
on electromagnetic/thermal modeling is presented that enables estimating the output of an
AMT inspection of a RAM-coated CFRP structure suffering from delamination. The effect
the structure’s constitutive properties, microwave excitation parameters, and the
delamination size and depth on the defect detectability are investigated. In addition, several
simulated and experimental results are provided that verify the accuracy of the proposed
approach and show the high efficiency of AMT for detection of delamination in such
structures.

66
1. INTRODUCTION
Radio-frequency (RF) absorbing materials (RAM) are widely used to reduce
electromagnetic interference and scattering from reflective surfaces such as those utilized
in aerospace and military applications. In particular for aerospace and military applications,
structures of interest are often constructed of metals or several layers of carbon fiber
reinforced polymer (CFRP) laminates. CFRP-based structures consist of carbon fibers
embedded within a binding polymer matrix (usually an epoxy resin), effectively creating a
CFRP laminate. These structures can sustain impact damage causing delamination in the
CFRP that may not be readily visible through the RAM coating. Thus, it is important to
nondestructively assess such structures for their structural health (i.e., defect detection).
Nondestructive testing (NDT) techniques for health monitoring of aerospace and
military structures include microwave [1],[2], ultrasound [3], X-ray [4], and thermography
[5]-[9]. Thermography in particular is a conventional NDT technique with a wide range of
applications and many advantages including non-contact, fast inspection of relatively large
areas, and easy-to-interpret results, amongst others. This technique can be applied in a
passive or active manner, depending on the thermal excitation. In active thermography,
heat (thermal energy) is induced into the structure under test by an active source, such as
optical, electromagnetic, or acoustic [8]. More recently, active microwave thermography
(AMT), a relatively new thermographic NDT approach that uses microwave radiation to
create the thermal excitation, has been introduced into the NDT regime with promising
results [10]-[20]. As it relates to structures with an RF/microwave absorbing surface (i.e.,
a RAM coating), when the structure is illuminated with microwave energy, a significant

67
portion of this energy is absorbed and converted into thermal energy. Therefore, the RAM
can serve as an efficient thermographic heat source to the underlying structure. The
resulting surface thermal profile of the structure under inspection is measured with a
thermal camera. In this way, subsurface defects present in the structure may affect the heat
diffusion and present as indications in the resulting thermal image. AMT is an especially
good candidate for inspection of such structures due to the inherent electromagnetic
properties of the RAM itself. In other words, these materials are designed to reduce
(through energy absorption) the amount of electromagnetic energy that is scattered (or
reflected) from (subsurface) conductive materials. Thus, from an AMT perspective, the
RAM, when under microwave illumination, absorbs the energy and subsequently
undergoes a temperature increase; an essential component in thermographic techniques. In
addition, unlike conventional thermography in which heat is generated mostly at the
surface, the microwave heating takes place throughout the RAM volume (as well as its
surface). In this way, the thermal source is located flush against the substructure rather than
at the surface of the coating and hence the detection capability may be improved.
The utility of AMT for this application has been demonstrated in [14], where a thin
RAM was placed on the surface of a CFRP laminate containing flat-bottom holes (FBH)
as standardized defects. It has been shown that defects were easily detected when the RAM
was present. This work extends this proof-of-concept work through a comprehensive
electromagnetic/thermal formulation and analysis. Based on this and through simulated
and experimental results, the potential for AMT to inspect for the presence of damage,
specifically delamination, in RAM-coated CFRP structures, and the effect of parameters
including the electromagnetic properties of the RAM, microwave excitation parameters

68
(power, frequency, incidence angle, and polarization), and delamination size and depth are
investigated.
2. MODELING AND FORMULATION
In AMT, the structure of interest is exposed to microwave radiation, often of medium
power (on the order of tens of watts), which is directed by an antenna toward the structure
under test. A portion of this energy is absorbed and subsequently converted into thermal
energy and the rest is reflected back, as shown in Figure 1. The generated heat subsequently
diffuses into the entire structure and causes a temperature distribution which is measured
by a thermal (infrared) camera and subsequently processed in order to evaluate the structure
for potential defects. In Figure 1, the structure (located in air) consists of a RAM layer with
thickness, l, and a substrate material with thickness, h, beneath that contains a defect. In
order to obtain the heat source distribution within the RAM, the interaction of the incident
electromagnetic wave and the structure is considered in the following subsection.
Figure 1. Schematic of a RAM-coated structure containing a defect under an AMTinspection

69
2.1. ELECTROMAGNETIC FORMULATION
The model of Figure 2 is used to formulate the heat source distribution induced by
the microwave excitation. The formulation in this section is based on [21] and [22]. Figure
2 shows the incident, reflected, and penetrated electromagnetic fields over and inside the
structure. To this end, the incident microwave energy is decomposed into perpendicular
and parallel polarizations denoted by 1 and II, respectively. Also, the superscripts i and r
are used for the waves incident upon and reflected by the structure, and + and - represent
the forward and reverse traveling waves inside the RAM. The RAM is taken as a dielectric
with permittivity of e and permeability of p; both of which are complex and denoted as:
(£ = £Q£r = E' - j £" (1)= p 0p r = p ' - j p "
with er and pr being the permittivity and permeability expressed relative to that of freespace,
i.e., e0 and p 0 . The real parts of the complex permittivity and permeability, e' and p',
determine the ability of the dielectric to store electromagnetic energy, while the imaginary
parts, e" and p" (called electric and magnetic loss factors, respectively), identify the
material’s ability to absorb electric and magnetic energy. In other words, an
electrically/magnetically lossy dielectric has a considerable electric/magnetic loss
factor(s). In addition, for a nonzero electrical conductivity, o, an additional loss
mechanism, Joule heating, also takes place. In this case, o can take effect by replacing e"
with e" + o/rn where rn is the microwave angular frequency. Lastly and since this work
focuses on CFRP-based substrates, the substrate in this formulation is assumed to be a good
conductor (o ~ ro), and therefore is reflective to incident microwave energy (as illustrated
in Figure 2).

70
For non-scattering surfaces, incident and reflected microwave energy approaches
and leaves a surface at the same angle relative to the surface normal direction. In air, this
angle is denoted as 9 in Figure 2. This angle is zero when the microwave antenna directs
the radiation normal to the structure (which typically happens), however, can be nonzero
for curved surfaces or corner inspections, or when the antenna is deployed off-normal due
to space limitations or to allow a normal view for the thermal camera. The angle of
refraction into the RAM is denoted as 9', and from Snell’s law, these two angles can be
determined from the properties of the two mediums. In particular, the relationship is
expressed as ksin(Q') = k os in (0 ) where k = and k 0 = are the RAM and
the freespace wavenumbers, respectively.
Figure 2. Interaction of electromagnetic fields with a RAM-coated conductive structure
71
The electric and magnetic fields inside the RAM can be determined by applying the
boundary conditions at each medium interface. In particular, the continuity of tangential
electric fields of the perpendicular and parallel polarizations at the air-RAM interface is:
( E [ + E i = E t + E l
|c o s (0 )(£ j -£{■) = cos(0 ')(£ + £ f )z = 0
(2)
Also at this boundary, the tangential magnetic fields are continuous, and therefore:
r
v
c o s ( Q ) c o s ( Q ' )(E [ - E r± ) =
Vo V1 1
- ( £ i + £ i ) = ^ W + £ f )Vo
( E + - E f )
z = 0
(3)
where ^ = -^ju/s and ij0 = are the intrinsic impedances of the RAM and
freespace, respectively. Finally, at the interface of the RAM and the substrate, the
tangential electric fields should be zero (as the substrate is a good conductor), then:
( E + + E~f = 0W - E f = 0z = l
(4)
Utilizing the boundary conditions of (2)-(4), the electric field components inside the RAM
can be determined as:

72
E ± = ±^ c o s ( 0 ) e ±]'kz Qe-z)
^ Qc o s ( 0 ' ) c o s ( k z l ) + j - q c o s ( 0 ) s i n ( k z l )E \
(5)
E ±11
^ c o s ( 0 ) e ± J k z ( l z)
^ o c o s ( 0 ) c o s ( k z l ) + j - q c o s ( 0 ' ) s i n ( k z l )p ih \\
(6)
where k z = k c o s ( 0 ' ) . The absolute values of the electromagnetic fields in (5) and (6) can
be found from:
E i = j 2 V o P [ E l = J 2 V o P l(7)
In these equations, P]_ and represent the power density of the perpendicular and parallel
incident waves. Then, by having the components of the incident electric fields, the total
electric and magnetic fields inside the RAM can be obtained from the model of Figure 2
as:
E = c o s ( 0 ' ) ( E + - E - ) x + ( E + + E - ) y
—s i n ( 0 ' ) ( E + + E - ) z
(8)
V H = - c o s ( 0 ' ) ( E + - E - ) x + ( E + + E - ) y
+ s i n ( 0 ' ) ( E + + E - ) z
(9)

73
Equations (8) and (9) can be used to determine the heat generated by the microwave
excitation as:
Q = Qe + Qm = n f ( e " \ E \ 2 + v " \H\2 ) (10)
where Qe and Qm are the electric and magnetic heat densities, respectively (expressed in
watts per cubic meter). The distribution of heat density, Q, inside the structure is used in
the heat equation to obtain the temperature distribution inside and over the surface of the
structure.
An active thermography test can be successful only if the excitation causes a
significant temperature rise (relative to the measurable temperature limit), as the
temperature variations are used to detect and evaluate defects. As the temperature rise is
directly related to the induced heat, the total absorbed power (or equivalently induced heat)
relative to the total incident power of the microwave excitation can be used to evaluate the
efficiency of an AMT test. This ratio can be calculated as:
p° ( i - i r j i ) p | + ( i - l r i2l)PiiP l P | + P i
cos(0)(11)
where r± and r are the reflection coefficients of the perpendicular and parallel
polarizations, respectively, and can be calculated from (2)-(6) as:

74
rE ri y c o s ( 9 ) s i n ( k z l ) + j y 0 c o s ( 9 ' ) c o s ( k z l ) (12)
iE l± ^ c o s ( 9 ) s i n ( k z l ) — j - q 0 c o s ( 9 ' ) c o s ( k z l )
rE l y c o s ( 9 ' ) s i n ( k z l ) + j y 0 c o s ( 9 ) c o s ( k z l ) (13)
II - —E\\ ^ c o s ( 9 ' ) s i n ( k z l ) — j - q 0 c o s ( 9 ) c o s ( k z l )
The normalized absorbed power, T, in (11) is a function of the electromagnetic
properties of the RAM, the layer thickness, and the parameters of the microwave excitation
including frequency, incident angle, and polarization. This quantity will be used to study
the effect of microwave excitation parameters on absorbed power.
2.2. THERMAL FORMULATION
To characterize defects using AMT, the correlation between a measured surface
thermal profile and a potential defect must be established. To this end, the model of Figure
3 will be considered for the thermal model formulation. Here, the defect in question is
assumed to be a delamination located between two CFRP layers in the structure, and is
defined as a disk of diameter, D, located a depth, d, from the CFRP-RAM interface as
shown in Figure 3. Thermally, the delamination is treated as a vacuum, meaning it is a void
that has an infinite thermal resistance that fully obstructs the flow of heat normal to its
surface. This property causes a higher temperature over the delamination because it blocks
heat from flowing deeper into the CFRP. With thermal imaging, this hotspot will stand out
relative to the adjacent surface area without any subsurface defects.

75
Sound areaAir Defective area V
h
a;1111
vl RAM '
r
' z
CFRP d ‘;-----------------------
i! 'i______________________________________ i—
r
! D *— ►
iiiiiivAir
Figure 3. Geormetry of a RAM-coated CFRP structure containing a delamination
For calculation of the temperature distribution, the heat equation presented in [23]
p c dT/ dt = V ^ ( k ^ T ) + Q (14)
should be solved where p, c, and k denote the density, specific heat capacity, and thermal
conductivity tensor, respectively. It should be noted that in this paper, the temperature
variable, T, is the temperature increase from the initial (at t = 0) temperature and caused
by microwave heating and does not reflect the initial temperature distribution inside the
structure. For the experimental results to hold this assumption, the initial temperature
values are subtracted from the measured temperature for all time. As the geometry of the
defect in Figure 3 has a cylindrical symmetry, the heat equation of (14) can be written in
cylindrical coordinates as:

76
dT 1 d ( dT\ d ( dT\3 T \r d r \ T^ r dr
d ( dT\+ dz \ z dz,
(15)
where the anisotropy of the CFRP (as the existence of carbon fibers along the in-plane
directions causes a higher in-plane thermal conductivity than the transverse) is considered
by assigning kr and kz for the in-plane and transverse components, respectively, of the
thermal conductivity.
This equation should be solved numerically due to the complexity of the model. To
this end, the space and time coordinates are discretized as r = iAr, z = jAz, and t = kAt where
ij,k = 0,1,2,... and Ar, Az, and At are space and times steps. Using a forward-time centered-
space (FCTS) scheme, finite difference approximations to each term in (15) can be written
as [24]:
dTpC
T k+1( i , j ) - T k (i , j )At
(16)
- — { r k d T ) ~ ( i + 1 / 2 ) k r ( l + l / 2 , j ) T k ( i + l , j ) - T k ( i , j ) r d r \ r d r / i A r A r
( i - 1 / 2 ) k r ( i - 1 / 2 , j ) T k ( i , j ) - T k ( i - 1 , j )
i A r A r
(17)
dT\ ^ k z (i , j + 1 /2) T k ( i , j + 1 ) - T k (i , j ) (18)d z \ z d z ) Az Az
kz (i , j - 1/ 2) T k ( i , j ) - T k ( i , j - T)Az Az
Q = Qk(Uj) (19)

77
Also, to ensure stability of the FTCS scheme, the following condition should be met:
A t < m i n__________ P £ __________2 k ( 1 / A r 2 + 1 / A z 2)
(20)
In AMT, the microwave excitation is typically applied as a rectangular pulse
consisting of a heating period, denoted by t, in which the radiation is applied and a cooling
period when the microwave excitation is removed and hence Q = 0 for t > t.
Obtaining the solution to equations (16)-(19) requires thermal boundary conditions
to be applied. To simplify the problem while maintaining accuracy, adiabatic boundary
conditions are assumed on all boundaries, including the top and bottom surfaces and
normal to the delamination. Mathematically speaking, d T / d n = 0 where n denotes the
normal to the boundaries.
Using this numerical technique is advantageous over commercial
electromagnetic/thermal simulation software packages since it utilizes an analytical
electromagnetic solution instead of a time-consuming full-wave numerical solution.
Furthermore, the spatial two-dimensional heat transfer equation given in (14),has two
spatial coordinates, r and z, rather than the typical three-dimensional simulation.
Therefore, the simulations may run remarkably faster while providing accurate results. The
simulation time becomes particularly important when a range of a particular parameter
must be studied. In such a case, the model is repeatedly solved in order to find the
relationship between thermal response and those parameters, and the overall solution time
can become quite lengthy.

78
Finally, the thermal contrast (TC) is defined as the contrast between the temperature
rise distributions caused by applying excitation centered over a defective area (Td) versus
a structurally sound area (TS), or mathematically:
TC = Td - Ts (21)
A TC profile, according to this definition, has its maximum value near the center
of delamination and reduces asymptotically from the center.
3. SIMULATIONS
To verify the proposed formulation and investigate the effect of different
parameters on AMT outcomes, a number of simulations were conducted. This was
accomplished through numerical evaluation of the above formulation in MATLAB and
coupled electromagnetic/thermal models in CST Microwave Studio® and Multiphysics
Studio®.
First, the effect of the RAM’s e and p is considered. Generally, a RAM is
categorized as either magnetic, or electric. Magnetic RAM includes magnetic particles,
often ferrites, that interact with the magnetic field and their lossy behavior can be
characterized by their complex permeability [25]. On the other hand, electric RAM
contains electrically lossy fibers, often carbon fibers, thereby having a complex
permittivity with a significant loss factor [25]. To study the effect of RAM type on heat

79
generation, a magnetic RAM with £r = 1, ^r = 5 - j 10 and an electric RAM with £r = 5 -
j 10, p.r = 1 were considered. A thickness of 2 mm was used for both types. Figure 4 shows
the absorbed power density distribution along the depth of the two RAMs when they are
exposed to a 50 W, 2.4 GHz normally incident wave. These results are obtained through
the evaluation of analytical expressions (Ana) and CST simulations (CST), and as can be
seen, significant agreement is observed.
Figure 4. Absorbed power density (in dB) along the depth of the magnetic and electric RAMs obtained through analytical expressions and CST simulations
According to Figure 4, microwave radiation is more efficiently converted into heat
with a magnetic RAM. The reason for this is that the conductive substrate eliminates the
tangential electric field at the RAM-substrate boundary, leaving a very low absorbed power
for any purely electric RAM. As seen in Figure 4, the loss density decreases along the depth
of the electric RAM while it is uniform in the magnetic RAM. This behavior, however, is
not necessarily true for other frequencies. To show the effect of frequency on the
microwave absorption, the normalized absorbed power density, P, is calculated from (11)
and by CST and is shown versus frequency in Figure 5. At very low frequencies (<< 0.5

80
GHz), both magnetic and electric RAMs yield a small T since the RAM thickness is small
relative to the wavelength (i.e., the RAM is electrically small) and so the incident wave
reflects back from the substrate without effective interaction with the RAM (the wave
doesn’t “see” the RAM). At very high frequencies (> 35 GHz, in the present case), on the
other hand, both types show the same behavior. In fact, in the high frequency limit f ̂ <»)
with normal incidence (9 = 0), (11) yields the same absorption for the two types. In this
limit, the skin depth becomes infinitesimal and the incident wave is absorbed only at the
surface of the RAM and does not interact with the substrate. It can be noted that as the
energy is only absorbed by the surface of the structure in this limit, AMT is similar to
conventional thermography with a continuous optical lamp (where heat is incident upon
the surface only, because of the high frequency of the electromagnetic radiation generated
by the optical/laser source). However, for lower frequencies, the absorption occurs through
at least a portion of the volume of the RAM (and hence closer to potential defects in the
substrate). As a result, AMT in such cases may present a better detection efficacy,
especially when the RAM is considerably thick or has a low thermal conductivity (and
hence acts as a thermal insulator concealing the substrate defect within).
As can also be seen in Figure 5, the maximum absorbed power density occurs for
the magnetic and electric substrates at 2.2 and 13.8 GHz, respectively. To this end, (11)
can be used to select the optimal operating frequency for an AMT inspection if the RAM
properties are known or can be estimated. However, frequency selection may be limited in
practice by the test equipment and government regulations.

81
Figure 5. Normalized absorbed power density versus frequency for the two RAM types
Incident angle is also an important parameter that effects AMT outcome. As such,
Figure 6(a) and (b) show T for magnetic and electric RAMs, respectively, as a function of
incident angle at frequencies of 0.5, 2.2, and 5 GHz for perpendicular and parallel
polarizations. According to Figure 6(a), T decreases with increasing incidence angle for
all cases, but does so differently for the two polarizations. Specifically, at 0.5 GHz, a
parallel polarization results in a higher absorption, while the two polarizations cause the
same absorption at 2.2 GHz, and the absorption is lower for the parallel polarization than
for the perpendicular polarization at 5.5 GHz. As a result, the selection of polarization is
also important, and depends on the frequency for an optimized heat generation. In addition,
the same quantity is represented for the electric RAM in Figure 6(b). In this case, the
absorption is greater for the parallel polarization at all frequencies and angles. Also, the
absorption increases with increasing incidence angle in some frequency ranges for the
parallel polarization case. This is due to the fact that for the parallel (unlike perpendicular)
polarization, the electric field component normal to the substrate boundary, which doesn’t
vanish at this boundary, is larger in magnitude for greater angles. Therefore, when
82
illuminating a sample with an angle other than normal, use of the parallel polarization
yields a better heat generation in an electric RAM. In addition, when the sample surface is
not completely flat, such as a cylindrical surface, the polarization can be adjusted to obtain
the least angle-dependent heating, while in the conventional (optical) thermography, the
illumination (incident excitation intensity) suffers from the rapid degradation of cos(0)
[26].
(a)
(b)
Figure 6. Normalized power density versus incidence angle for different frequencies and perpendicular and parallel polarizations for the (a) magnetic and (b) electric RAMs

83
Next, thermal simulation of AMT is considered. To this end, a RAM-coated CFRP
structure with the RAM and CFRP thicknesses of 2 and 6 mm and the thermal properties
given in Table 1, is considered. The thickness and thermal properties used for simulations
were chosen to be consistent with the literature and the real materials considered in the next
section. These results will be validated against the measurements presented in Section IV.
In all following simulations, the microwave excitation is assumed to be 50 W of power at
2.4 GHz, and is applied for 180 sec. Further, the RAM is magnetic with frr = 2 - j0.2.
Table 1. Thermal Properties of the RAM and CFRP [12],[26],[27]
Material k (W/m K) p (kg/m3) c (J/kgK)RAM 0.85 3150 1300
CFRP 10 in-plane 1 transverse 1680 1200
The TC at the center of a delamination of a fixed depth, 0.8 mm, and varying
diameters (2, 4, 6, 8, and 10 cm) is depicted in Figure 7(a). As expected, the TC has a
higher value at any time for larger defects. However, the difference is small at the
beginning of the heating period. This is because in the early instances of times, the TC at
the center of the delamination is primarily affected by the middle area of the delamination
as they are closer to each other, while it takes some time for the farther points of
delamination (closer to its edges) to influence the TC at the center. Also, as can be seen in
the figure, the TC does not grow linearly with the defect diameter. In fact, the difference
between TC curves becomes less for larger defects, and as proven for the conventional
thermography [28], TC asymptotically approaches its higher bound. Further, the rate of
change of the TC versus time decays earlier for smaller diameters (see the 2 cm case, for

84
example). This is because the lateral heat diffusion, which acts against the accumulation of
thermal energy on the surface above of the defect, is stronger when defect has a smaller
cross section. In other words, a larger cross section better maintains the accumulation of
thermal energy, thereby resulting in a longer time of increasing temperature. This will be
verified in the next section through measurement. Finally, it should be noted that the
maximum of TC occurs with a delay from t = 180 sec (when the cooling period is removed).
This is due to the nonzero depth of the RAM on top of the delamination which causes a
delay for thermal energy to reach the surface.
Figure 7(b), shows the TC for a fixed diameter of 4 cm and depths of 0.8 - 4 mm.
It can be seen in the figure that the depth of delamination has a significant effect on the
TC. However, the shape of the curves remain consistent, and appear to be scaled versions
of the same curve. As a rule of thumb, the TC is inversely proportional to the depth for an
adiabatic (e.g., a void delamination) defect [28]. For the cases of Figure 7(b), the maximum
of each curve is 0.51, 0.29, 0.17, 0.10, and 0.06, respectively, and rule of thumb appears to
hold true. It is also important to note that the TC shown in Figure 7 is high relative to the
typical thermal cameras’ sensitivity, which is 0.03°C for the thermal camera used for
measurements herein. This result demonstrates the efficacy of AMT for detection of
delamination in RAM-coated CFRP structures. Lastly, these results will be validated by
measurement in the next section.
85
(a)
(b)
Figure 7. TC obtained through numerical analysis and CST simulations for differentdiameters (a) and depths (b)
4. MEASUREMENT RESULTS
A number of AMT measurements were conducted to show the applicability in
detecting delamination in RAM-coated CFRP structures. To this end, the experimental
setup shown in Figure 8 was used. The setup consists of a microwave source and 50 W
amplifier operating at a frequency of 2.4 GHz for this work. This frequency is often used

86
in AMT inspections because it is in the industrial, scientific, and medical (ISM) radio band.
A thermal camera (FLIR T430sc) is used to measure the surface thermal profiles. The
thermal camera, microwave source, and amplifier are controlled by a data acquisition
(DAQ) and control unit. A horn antenna with aperture size of 23 x 17 cm2 is used to direct
the microwave radiation on the inspection surface. The antenna is placed at the lift-off
distance from the structure in order to provide a sufficient microwave incident power and
thermal camera field-of-view. For this work, the lift-off distance is 40 cm for all tests. In
order to avoid thermal energy losses from the bottom of the structure (equivalent to the
adiabatic boundary condition assumed in formulation and simulations), the structure was
placed on polystyrene foam.
H o r nA n te n n a
D A Q &C o n t r o l U n i t
M ic ro w a v eS o u rc e ccA m p l i f i e r
S t r u c tu r e
T h e r m a lC a m e r a
Figure 8. The experimental setup for AMT measurements

87
Two samples were constructed by stacking up a layer of RAM and seven layers of
CFRP laminates, as shown in Figure 9(a). These layers were packed tightly to minimize
formation of an air gap between the layers. Figure 9(b) shows the RAM used in this work;
a Cuming Microwave C-RAM FF-2 magnetic-type absorber with a thickness of 2 mm.
This absorber is a ferrite filled, silicone rubber sheet which has a high magnetic loss at
microwave frequencies, and its density and thermal conductivity are 3150 kg/m3 and
0.85 W /m K , respectively [29]. Each substrate CFRP laminate is 0.8 mm thick, and the
total thickness of the CFRP substrate is 6 mm. The density of each layer is measured
1680 kg/m3. A delamination was introduced by machining a hole at the center of one of
the CFRP layers, as shown in Figure 9(c). The measurements were done with three
delaminations with D = 4 cm / d = 0.8 mm, D = 2 cm / d = 0.8 mm, and D = 4 cm / d = 1.6
mm, which will be called Case 1, Case 2, and Case 3, respectively. The heating and cooling
times are 180 sec each for all measurements.
(a) (b) (c)
Figure 9. The RAM-coated CFRP structure: (a) stack-up, (b) top surface, and (c) a machined hole serving a as a delamination
Figure 10 shows the temperature rise (with respect to the initial temperature)
distribution in AMT tests at t = 180 sec and measured for the three cases along with the

88
case with no delamination. More specifically, the temperature rise is depicted as a function
of radial distance from the center of the delamination. The measurement without any
delamination provides a visual contrast as to how a delamination introduces local hotspots
during an AMT inspection. As seen in the figure, with the presence of a delamination, the
temperature peaks at the center of the delamination and asymptotically approaches that of
the case without a delamination. A comparison between the curves of Figure 10 shows that,
as expected, a larger diameter and/or smaller depth yields a higher temperature rise on top
of the delamination. In addition, as seen in the figure, for the deeper delamination case (d
= 1.6 mm), T is flatter at the center, with respect to the d = 0.8 mm cases. In fact, the
thermal energy diffuses with less constraint over a deeper defect, causing a flatter
temperature profile. As a result, the thermal image over a deeper defect is fader and less
representing the cross-sectional extension of the beneath the surface. This will be further
shown in the thermal images (Figure 12).
Figure 10. Temperature increase after 180 sec of microwave excitation versus radial distance from the delamination for different delamination diamater and depth and the
case of no delamination

89
To better observe the temperature distribution shaped by the radiation pattern of the
horn antenna and the existence of a delamination, Td, Ts, and TC profiles, as defined in
(21), are illustrated at t = 180 sec in Figure 11. The dashed circle shows the physical cross
section of the delamination inside the structure. As is apparent in the TC profile, the
presence of the delamination maximally affects the temperature within the cross-sectional
boundaries of the delamination. However, due to the heat diffusion, it also affects the
temperature beyond this boundary. Also, it can be noted from the Ts profile that the
antenna’s heating pattern is focused in an area of approximately 20 x 20 cm2. This indicates
the maximum efficient inspection area in a single test. In the case a larger area is required
for inspection, an antenna (or an array of antennas) with a wider radiation pattern should
be employed, or a raster scanning can be performed.
Figure 11. Td, Ts, and TC profiles at t = 180 sec for Case 1
An additional illustration of the spatial and temporal variations of an AMT
measurement is shown in Figure 12, where TC’s for the three cases at times of 60, 120,
180, and 300 seconds are shown (heating time of 180 sec). As seen in the figure, the defects
are observable after 60 sec of microwave heating, and they become highly apparent at

90
180 sec. More specifically, the TC profiles show a hot area on the structure surface in the
area above the defect cross section as outlined by the dotted circles. For the deepest
delamination (d = 1.6 mm), the temperature spreads more to the outside of the
delamination. This is because the thermal energy spreads more extensively before reaching
the surface for a deeper defect. As a result, the spatial temperature distribution is better
confined to the corresponding physical distribution when the defect is closer to the surface
and therefore is a better indication of the cross-sectional extension of the defect. Also, it
can be noted that unlike the D = 4 cm cases, the D = 2 cm case has an insignificant change
from t = 120 sec to 180 sec. This is consistent with simulation results presented in Section
III, Figure 7(a), where the temperature rise and rate of change is less for a smaller defect.
To verify the proposed mathematical modeling and analysis presented above, the
TC at the center of the delamination is demonstrated versus time in Figure 13 and compared
to those calculated numerically and given in Figure 7. It can be seen that there is excellent
agreement between the experimental and mathematical results that validates the
electromagnetic/thermal model and formulation. More specifically, the TC values reach
the 0.03 °C threshold (shown with the dashed line in the figure) at t = 23, 24, and 30 sec
for Cases 1, 2 and 3, respectively. These heating times can be theoretically considered the
minimum required heating times for a successful defect detection. Further, after one minute
of microwave heating, all three cases yield a TC of >> 0.03 °C, making the defects readily
observed as was demonstrated in Figure 12.
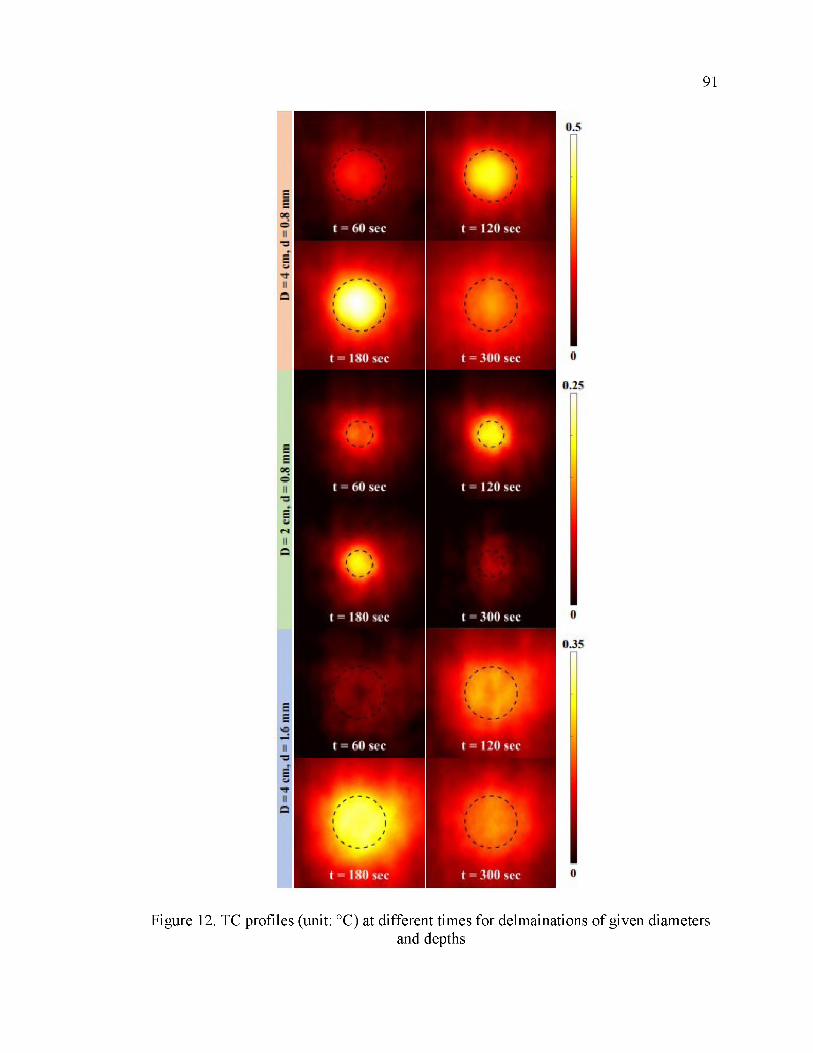
91
Figure 12. TC profiles (unit: °C) at different times for delmainations of given diametersand depths

92
Figure 13. TC over time obtained experimentally and numerically
5. CONCLUSION
Active microwave thermography (AMT) was considered as a nondestructive
testing tool for inspection of RAM-coated electromagnetically reflective (such as CFRP)
structures that are extensively used in military and aerospace applications. Detection of a
delamination with different diameters and depths was considered. A mathematical model
was proposed that relates the thermal contrast (TC) to the defect, microwave excitation,
and the structure properties. The effect of delamination size and depth was studied through
simulation and measurement results. AMT measurements support the proposed modeling
and formulation as well as show the applicability and efficacy of this approach for detection
of a delamination in RAM-coated CFRP structures. More specifically, it was shown that
delaminations with a diameter as small as 1 cm concealed under a 2-mm thick layer of
RAM can be reliably detected by applying 1 minute of microwave excitation. Overall, due

93
to the interaction of microwave energy and RAM coatings (i.e. inherent absorbing
properties of RAM), this new proposed technique may be advantageous as compared to
other thermographic techniques for inspection of RAM-coated structures.
REFERENCES
[1] R. Zoughi, Microwave non-destructive testing and evaluation principles, vol. 4, Dordrecht, The Netherlands: Kluwer, 2000.
[2] A. Mirala, and R. Sarraf Shirazi, “Detection of surface cracks in metals using time - domain microwave non-destructive testing technique,” IET Microw. Antennas Propag., vol. 11, Iss. 4, pp. 564-569, Mar. 2017.
[3] M. Ricci, L. Senni, and P. Burrascano, “Exploiting pseudorandom sequences to enhance noise immunity for air-coupled ultrasonic nondestructive testing,” IEEE Trans. Instrum. Meas., vol. 61, no. 11, pp. 2905-2915, Nov. 2012.
[4] S. C. de Wolski, J. E. Bolander, and E. N. Landis, “An in-situ X-ray microtomography study of split cylinder fracture in cement-based materials,” Experimental Mechanics, vol. 54, no. 7, pp. 1227-1235, May 2014.
[5] K. Srinivas, A. O. Siddiqui, and J. Lahiri, “Thermographic inspection of composite materials,” in Proc. Nat. Seminar Non-Destruct. Eval., vol. 12, pp. 7-9, 2006.
[6] C. Ibarra-Castanedo, and X. Maldague, “Infrared thermography,” in Handbook of Technical Diagnostics, Springer-Verlag Berlin Heidelberg, 2013, pp. 175-220.
[7] A. Poudel, K. R. Mitchell, T. P. Chu, S. Neidigk, and C. Jacques, “Non-destructive evaluation of composite repairs by using infrared thermography,” Journal of Composite Materials, vol. 50, no. 3, pp. 351-363, Feb. 2016.
[8] R. Yang, and Y He, “Optically and Non-optically Excited Thermography for Composites: A Review,” Infrared Physics & Technology, vol. 75, pp. 26-50, Mar. 2016.
[9] H. Zhang, R. Yang, Y. He, A. Foudazi, L. Cheng, and G. Tian, “A Review of Microwave Thermography Nondestructive Testing and Evaluation,” Sensors, vol. 17, no. 5, 2017.

94
[10] A Mirala, A. Foudazi, M. T. Ghasr, and K. M. Donnell, “Detection of Flat-Bottom Holes in Conductive Composites Using Active Microwave Thermography,” ASME J Nondestrcutve Evaluation, vol. 1, Iss. 4, pp. 041005-1-041005-7, Nov. 2018.
[11] A. Foudazi, A. Mirala, M. T. Ghasr, and K. M. Donnell, “Active Microwave Thermography for Nondestructive Evaluation of Surface Cracks in Metal Structures,” IEEE Trans. Instrum. Meas., vol. 68, no. 2, pp. 576-585, Feb. 2019.
[12] A Mirala and K. M. Donnell, “Active Microwave Thermographic Measurement of In-Plane Thermal Diffusivity,” to be publisehd in Proc. IEEE Int. Instrum. Meas. Technol. Conf. (I2MTC), May 2020.
[13] A Mirala, X. Zou, M. T. Ghasr, L. Sneed, and K. M. Donnell, “Active Microwave Thermography: A Real-Time Monitoring Tool for CFRP-Concrete Bond Testing,” in Proc. IEEE Int. Instrum. Meas. Technol. Conf. (I2MTC), May 2019, pp. 1-6.
[14] A Mirala, M. T. Ghasr, and K. M. Donnell, “Nondestructive assessment of microwave absorbing structures via active microwave thermography,” in Proc. IEEE Int. Instrum. Meas. Technol. Conf. (I2MTC), May 2018, pp. 1-6.
[15] A. Foudazi, I. Mehdipour, K. M. Donnell, and K. H. Khayat, “Evaluation of steel fiber distribution in cement-based mortars using active microwave thermography,” Mater. Struct., vol. 49, no. 12, pp. 5051-5065, Dec. 2016.
[16] A. Foudazi, C. A. Edwards, M. T. Ghasr, and K. M. Donnell, “Active Microwave Thermography for Defect Detection of CFRP-Strengthened Cement-Based Materials,” IEEE Trans. Instrum. Meas., vol. 65, no. 11, pp. 2612-2620, Nov. 2016.
[17] A. Foudazi, M. T. Ghasr, and K. M. Donnell, “Characterization of corroded reinforced steel bars by active microwave thermography,” IEEE Trans. Instrum. Meas., vol. 64, no. 9, pp. 2583-2585, Sep. 2015.
[18] A. Foudazi, M. T. Ghasr, and K. M. Donnell, “Application of active microwave thermography to inspection of carbon fiber reinforced composites,” in Proc. IEEE AUTOTESTCON, Sep. 2014, pp. 318-322.
[19] A. Foudazi, K. M. Donnell, and M. T. Ghasr, “Application of active microwave thermography to delamination detection,” in Proc. IEEE Int. Instrum. Meas. Technol. Conf. (I2MTC), May 2014, pp. 1567-1571.
[20] S. Keo, D. Defer, F. Breaban, and F. Brachelet, “Comparison between microwave infrared thermography and CO2 Laser infrared thermography in defect detection in applications with CFRP,” Mater. Sci. Appl., vol. 4, no. 10, pp. 600-605, 2013.
[21] D. M. Pozar, Microwave Engineering, 4th ed. Hoboken, NJ, USA: Wiley, 2012.

95
[22] C. A. Balanis, Advanced Engineering Electromagnetics, Hoboken, NJ, USA:Wiley, 2012.
[23] J. H. Lienhard IV, and J. H. Lienhard V, A Heat Transfer Textbook, 4th ed., Cambridge, Massachusetts, USA: Philogiston, 2017.
[24] R. H. Pletcher, J. C. Tannehill, and D. A. Anderson, Computational Fluid Mechanics and Heat Transfer, 3rd ed., Boca Raton, FL, USA: CRC Press, 2012.
[25] G. Shen, M. Xu, and Z. Xu, “Double-layer microwave absorber based onferrite and short carbon fiber composites,” Materials Chemistry and Physics, vol. 105, pp. 268272, 2007.
[26] G. Mayr, B. Dietermayr, G. Hendorfer, and J. Sekelja, “Characterization of Defects in Curved CFRP Samples using Pulsed Thermography and 3D Finite Element Simulation,” in Proc. 9th International Conference on Quantitative InfraRed Thermography, July 2008, Krakow, Poland.
[27] T. Tian and K. D. Cole, ’’Anisotropic thermal conductivity measurement of carbon- fiber/epoxy composite materials,” International Journal of Heat and Mass Transfer, vol. 55, Iss. 23-24, pp. 6530-6537, 2012.
[28] M. F. Beemer, and S. M. Shepard, “Aspect ratio considerations for flat bottom hole defects in active thermography,” Quantitative InfraRed Thermography Journal, 2017.
[29] Cuming Microwave, C-RAM FF-2 Technical Bulletin, [Online]. Available: https://www.cumingmicrowave.com/pdf/310-Rubber%20Sheets/310-7%20C- RAM%20FF-2.pdf.

96
2. CONCLUSIONS AND FUTURE WORK
2.1. CONCLUSIONS
Active microwave thermography (AMT) has a wide range of applications in
aerospace and infrastructure industries. The overarching objective of this work is to advance
AMT as a reliable nondestructive testing (NDT) tool for detection of several types of defects
(void, water ingress, delamination, etc.) in various structures. In this dissertation, three special
applications of AMT were considered as follows.
In PAPER I, AMT was considered for detection of void-type defects, commonly
standardized as flat-bottom holes (FBH), in conductive composites, specifically carbon
fiber reinforced polymer (CFRP). More specifically, the effect of FBH radius and depth (or
combined as the radius-to-depth ratio) on the detection likelihood was studied through
simulation and measurement. By considering the thermal contrast (i.e., difference between
the temperature increase of a defective area and that of a sound/healthy area), it was shown
that detection likelihood can be improved by increasing the operating frequency or power
level of the microwave excitation. Furthermore, AMT measurements were conducted for a
number of FBHs machined in a multidirectional CFRP sheet, and the signal-to-noise ratio
(SNR) in thermal images over time was monitored, which showed that a high level of defect
information relative to background noise (>20 dB) is achievable after approximately 60 s
SECTION
of microwave excitation.

97
In PAPER II, AMT was used for detection and evaluation of water ingress in
different materials, in particular rubber. Simulation and experimental results indicate that
AMT has a strong potential to detect and locate small volumes of water ingress after a few
minutes of microwave excitation. Specifically, 0.5 mL of water was clearly detected
(experimentally) after 120 seconds of microwave excitation within a rubber sample. More
importantly, the depth of water was estimated using experimental data and a mathematical
formulation, with an average quantification error of ~5%. This was accomplished by
relating the temporal behavior of the thermal response of the structure containing water
ingress to 300 seconds of constant microwave excitation. In addition, the relationship
between the detectability of water and test parameters including the microwave excitation
frequency and power, water volume and depth, structure constitutive properties, and
heating time was established.
PAPER III was dedicated to a comprehensive study of AMT for inspection of
electromagnetically reflective (such as CFRP) structures coated with radio-frequency
absorbing materials (RAM), that are extensively used in military and aerospace applications.
Due to the interaction of microwaves with RAMs, the new proposed technique may be
uniquely advantageous to other thermographic techniques for inspection of RAM-coated
structures. As such, detection of delaminations with different diameters and depths within
a substrate (specifically, CFRP laminates) that is covered by RAM was considered. To this
end, a mathematical model was developed that related the thermal contrast to the
delamination, microwave excitation, and the structure properties. It was shown that AMT
measurements support the proposed modeling and formulation as well as show the
applicability and efficacy of this approach. More specifically, it was shown that

98
delaminations with a diameter as small as 1 cm concealed under a 2-mm thick layer of
RAM can be reliably detected by applying 1 minute of microwave excitation.
2.2. FUTURE WORK
As has been shown, AMT has shown promise in various applications and is has
been advanced both theoretically and practically. To further advance the method, future
work is proposed as follows:
1- The applicability and potential of AMT for inspection of other structures such as
honeycomb structures and glass fiber composites can be investigated. In particular, AMT
may be a good candidate for evaluation of water ingress or moisture content in glass fiber
reinforced polymers (GFRP), since GFRP has a very low electromagnetic loss, and
microwave energy can readily penetrate into its depth and interact with water. This enables
AMT to detect and evaluate water in deeper parts of a GFRP structure. This research can
be very important since water absorption by GFRP structures degrades their mechanical
performance [25]. Similar to this, estimation of moisture content of cement-based materials
can be considered as another potential application for AMT.
2- The work of PAPER II can be extended to include inspection of the RAM itself
(related to RAM-coated structures). More specifically, defects within the RAM including
non-uniform thickness, existence of voids within the RAM, debonding between the RAM
and substrate, etc. may be detected and/or evaluated via AMT.
3- Advanced theoretical and experimental investigation can be carried out to show
the applicability of image processing methods to evaluate the cross-sectional extension of
defects. These methods may be based on the gradient of the temperature profiles.

99
Preliminary results show that applying simple gradient or more advanced filters such as
Sobel and Canny have a good potential for this application.
4- A complex microwave phased array radiating subsystem may be developed to
provide an adjustable heating pattern; in particular to yield uniform heating. Specifically,
a double-element phased array is already designed and tested that has an improved uniform
heating pattern along one direction. This technique can be extended to two dimensions.

100
BIBLIOGRAPHY
1. R. Zoughi, Microwave non-destructive testing and evaluation principles, vol. 4, Dordrecht, The Netherlands: Kluwer, 2000.
2. A. Ebrahimkhanlou, A. Farhidzadeh, and S. Salamone, “Multifractal analysis of crack patterns in reinforced concrete shear walls,” Struct. Health Monitor., vol. 15, no. 1, pp. 81-92, 2016.
3. A. Mirala, and R. Sarraf Shirazi, “Detection of surface cracks in metals using time - domain microwave non-destructive testing technique,” IET Microw. Antennas Propag., vol. 11, Iss. 4, pp. 564-569, Mar. 2017.
4. M. Ricci, L. Senni, and P. Burrascano, “Exploiting pseudorandom sequences to enhance noise immunity for air-coupled ultrasonic nondestructive testing,” IEEE Trans. Instrum. Meas., vol. 61, no. 11, pp. 2905-2915, Nov. 2012.
5. S. C. de Wolski, J. E. Bolander, and E. N. Landis, “An in-situ X-ray microtomography study of split cylinder fracture in cement-based materials,” Experim. Mech., vol. 54, no. 7, pp. 1227-1235, Sep. 2014.
6. R. Yang and Y. He, “Optically and non-optically excited thermography for composites: A review,” Infr. Phys. Technol., vol. 75, pp. 26-50, Mar. 2016.
7. C. Ibarra-Castanedo and X. P. V. Maldague, “Infrared thermography,” in Handbook of Technical Diagnostics. Berlin, Germany: Springer, 2013, pp. 175220.
8. K. Srinivas, A. O. Siddiqui, and J. Lahiri, “Thermographic inspection of composite materials,” in Proc. Nat. Seminar Non-Destruct. Eval., vol. 12. 2006, pp. 7-9.
9. J. G. Thompson and C. T. Uyehara, “Ultrasonic thermography inspection method and apparatus,” U.S. Patent 7 075 084, Jul. 11, 2006.
10. J. Saniie, M. Luukkala, A. Lehto, and R. Rajala, “Thermal wave imaging through radio frequency induction heating,” Electron. Lett., vol. 18, no. 15, pp. 651-653, Jul. 1982.
11. H. Zhang, R. Yang, Y. He, A. Foudazi, L. Cheng, and G. Tian, “A Review of Microwave Thermography Nondestructive Testing and Evaluation,” Sensors, vol. 17, no. 5, 2017.

101
12. A Mirala, A. Foudazi, M. T. Ghasr, and K. M. Donnell, “Detection of Flat-Bottom Holes in Conductive Composites Using Active Microwave Thermography,” ASME J Nondestrcutve Evaluation, vol. 1, Iss. 4, pp. 041005-1041005-7, Nov. 2018.
13. A. Foudazi, M. T. Ghasr, and K. M. Donnell, “Application of active microwave thermography to inspection of carbon fiber reinforced composites,” in Proc. IEEE AUTOTESTCON, Sep. 2014, pp. 318-322.
14. A Mirala, M. T. Ghasr, and K. M. Donnell, “Nondestructive assessment of microwave absorbing structures via active microwave thermography,” in Proc. IEEE Int. Instrum. Meas. Technol. Conf. (I2MTC), May 2018. pp. 1-6.
15. A. Foudazi, A. Mirala, M. T. Ghasr, and K. M. Donnell, “Active Microwave Thermography for Nondestructive Evaluation of Surface Cracks in Metal Structures,” in IEEE Trans. Instrum. Meas., Jun. 2018.
16. A. Foudazi, M. T. Ghasr, and K. M. Donnell, “Characterization o f corroded reinforced steel bars by active microwave thermography,” IEEE Trans. Instrum. Meas., vol. 64, no. 9, pp. 2583-2585, Sep. 2015.
17. A. Foudazi, I. Mehdipour, K. M. Donnell, and K. H. Khayat, “Evaluation of steel fiber distribution in cement-based mortars using active microwave thermography,” Mater. Struct., vol. 49, no. 12, pp. 5051-5065, Dec. 2016.
18. A. Foudazi, C. A. Edwards, M. T. Ghasr, and K. M. Donnell, “Active Microwave Thermography for Defect Detection of CFRP-Strengthened Cement-Based Materials,” IEEE Trans. Instrum. Meas., vol. 65, no. 11, pp. 2612-2620, Nov. 2016.
19. A. Foudazi, K. M. Donnell, and M. T. Ghasr, “Application of active microwave thermography to delamination detection,” in Proc. IEEE Int. Instrum. Meas. Technol. Conf. (I2MTC), May 2014, pp. 1567-1571.
20. D. Balageas and P. Levesque, “Mines detection using the EMIR method,” in Proc. QIRT, 2002, pp. 71-78.
21. D. M. Pozar, Microwave Engineering, 4th ed. Hoboken, NJ, USA: Wiley, 2012.
22. C. A. Balanis, Advanced Engineering Electromagnetics, Hoboken, NJ, USA:Wiley, 2012.
23. X. Maldague, “Introduction to NDT by active infrared thermography,” Mater. Eval., vol. 60, pp. 1060-1073, 2002.
24. K. Cole, A. Haji-Sheikh, J. Beck, and B. Litkouhi, Heat Conduction Using Green’s Functions, New York, NY, USA:CRC Press, 2011.

102
25. L. Rocha, “Combined experimental/numerical investigation ofdirectional moisture diffusion in glass/epoxy composites,” Composites Science and Technology, vol. 151, pp. 16-24, Oct. 2017.
103
VITA
Ali Mirala received his B.Sc. degree in Electrical Engineering from Iran University
of Science and Technology, Tehran, Iran in 2011 and M.Sc. degree from Amirkabir
University of Technology (Tehran Polytechnic), Tehran, Iran, in 2014. He joined the
Microwave Sensing (wSense) Laboratory at the Missouri University of Science and
Technology (Missouri S&T) in Spring 2017 as a Ph.D. student. In May 2020, he received
the Missouri S&T Dean’s Ph.D. Scholar Award for his Ph.D. work. Ali received his Ph.D.
in Electrical Engineering from Missouri University of Science and Technology in August
2020. His research interests included theoretical electromagnetics, microwave non
destructive testing (NDT) technique, multi-physical modeling and numerical analysis, and
electromagnetic compatibility (EMC).