Embed Size (px)
Citation preview
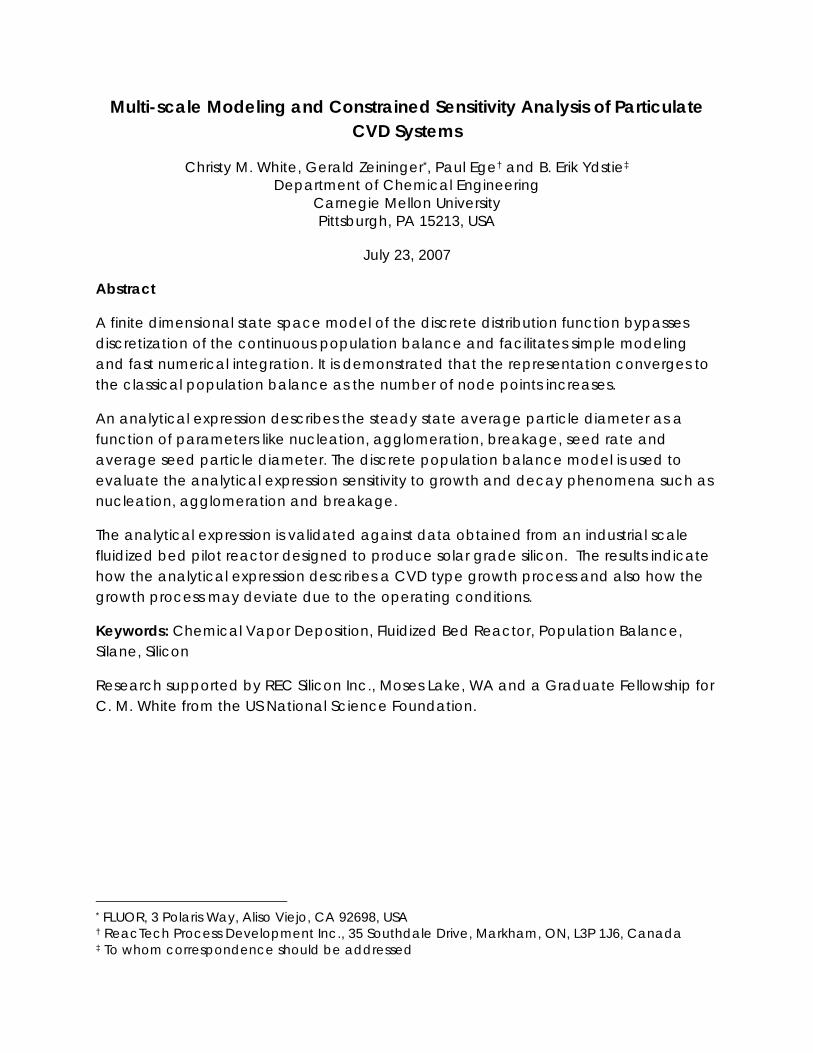
Multi-scale Modeling and Constrained Sensitivity Analysis of Particulate CVD Systems
Christy M. White, Gerald Zeininger*, Paul Ege† and B. Erik Ydstie‡ Department of Chemical Engineering
Carnegie Mellon University Pittsburgh, PA 15213, USA
July 23, 2007
Abstract
A finite dimensional state space model of the discrete distribution function bypasses discretization of the continuous population balance and facilitates simple modeling and fast numerical integration. It is demonstrated that the representation converges to the classical population balance as the number of node points increases.
An analytical expression describes the steady state average particle diameter as a function of parameters like nucleation, agglomeration, breakage, seed rate and average seed particle diameter. The discrete population balance model is used to evaluate the analytical expression sensitivity to growth and decay phenomena such as nucleation, agglomeration and breakage.
The analytical expression is validated against data obtained from an industrial scale fluidized bed pilot reactor designed to produce solar grade silicon. The results indicate how the analytical expression describes a CVD type growth process and also how the growth process may deviate due to the operating conditions.
Keywords: Chemical Vapor Deposition, Fluidized Bed Reactor, Population Balance, Silane, Silicon
Research supported by REC Silicon Inc., Moses Lake, WA and a Graduate Fellowship for C. M. White from the US National Science Foundation.
* FLUOR, 3 Polaris Way, Aliso Viejo, CA 92698, USA † ReacTech Process Development Inc., 35 Southdale Drive, Markham, ON, L3P 1J6, Canada ‡ To whom correspondence should be addressed

1. Introduction
A common application of chemical vapor deposition (CVD) is the deposition of thin films on particulate material in fluidized beds. In these processes the particles provide the substrate surface while the fluidizing gas contains the precursors. Typical applications have been deposition of protective coating on nuclear particles, synthetic diamond growth, and metal-organic deposition techniques on e.g. catalysts and carbon nanotube growth.[1-4] An application with recent interest has been the use of fluidized bed CVD of silicon onto silicon granules as an alternative production method of large quantities of affordable homogeneous silicon for feedstock to the photovoltaic industry.[5-8]
A fluid bed CVD particle growth process is similar to traditional fluid bed granulation. The main objective is to grow small seed particles to larger, product-size particles by adding fresh growth layers to the initial particles. In granulation the growth is from layers of a liquid solution or melt sprayed onto the particles. As the layers solidify another layer can be added causing a steady growth. In CVD the growth layers are the product of the reaction between a gaseous component (reactant) and the particle (substrate) surface.
A major control challenge in particle growth processes is to keep a steady state average particle size since it affects both operating conditions and product size distribution. Typically the growth processes are modeled with continuous population balance models which need to be discretized for use in process flow models. Henson et al.[9], Immanuel & Doyle III[10] and Piña et al. [6] provide a few examples of this and demonstrate that care must be taken to ensure conservation principles hold. In this paper, a finite dimensional state space, discrete population balance model is used to understand and predict the size distribution achieved during production. Details of model development are presented in White et al. [8], and a brief summary is presented in Section 2. The model simplifies the calculation time by requiring only a small set of loosely coupled ordinary differential equations for accurate prediction. The model can easily be coupled with traditional reactor models such as plug flow or CSTR for a comprehensive reactor modeling of conversion, and the associated closure relations are also described. As well, the model is easily linked to a variety of control schemes to ensure size control as demonstrated in Section 3.
Even the discrete population balance model still requires computation power and poses challenges for use in model-based feedback control. It would be highly beneficial if the growth process could be determined with a simple operation curve whereby the average product size could be easily predicted from input variables such as feed rate and seed addition. Section 3 shows the use of the mass and population
balance equations to derive a simple analytical expression for the average particle size as a function of seed rate, seed size, and production rate. The expression holds for steady state operation of continuous CVD processes. It includes terms for processes that affect growth such as agglomeration (of one or more particles), nucleation (creation of new particles) and break down (attrition). The expression is evaluated with the discrete population balance model to determine the effect of the other growth processes.
Finally, an operation curve derived from the expression for a given set of conditions is validated against actual operating data from an industrial size fluid bed reactor for production of polycrystalline silicon particles. Section 4 demonstrates how, at given steady state conditions, the average product size can be explained with this simple relation.
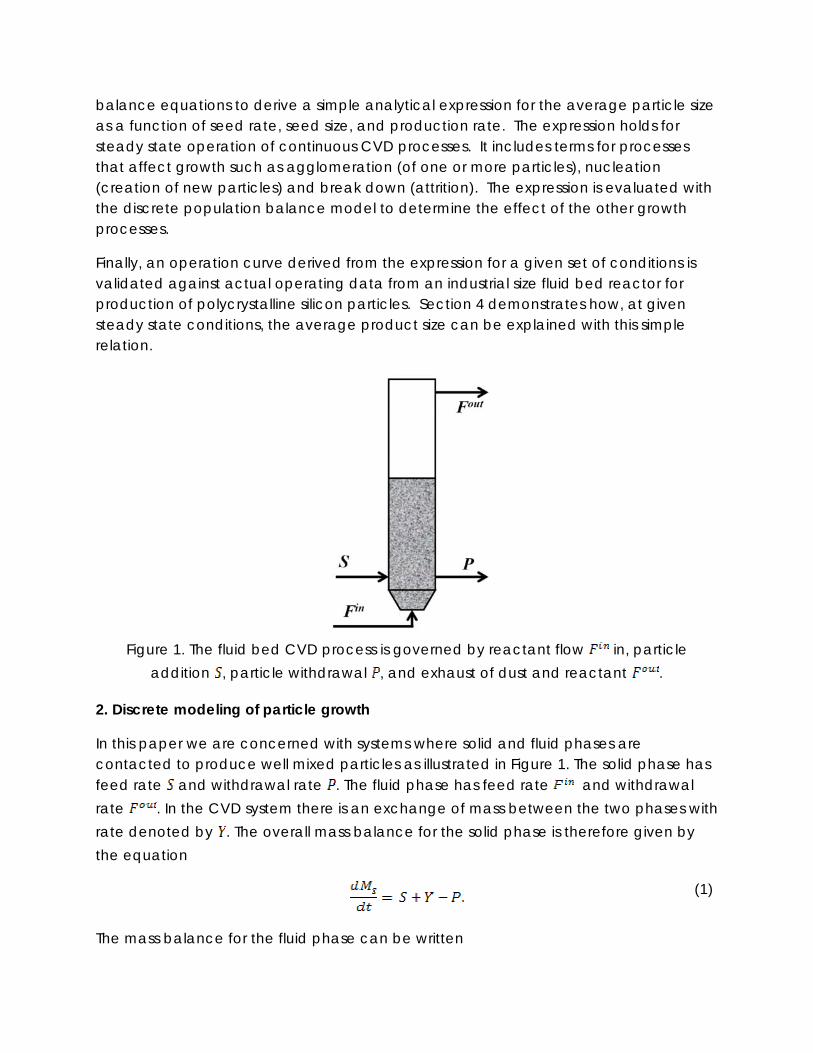
Figure 1. The fluid bed CVD process is governed by reactant flow in, particle
addition , particle withdrawal , and exhaust of dust and reactant .
2. Discrete modeling of particle growth
In this paper we are concerned with systems where solid and fluid phases are contacted to produce well mixed particles as illustrated in Figure 1. The solid phase has feed rate and withdrawal rate . The fluid phase has feed rate and withdrawal rate . In the CVD system there is an exchange of mass between the two phases with rate denoted by . The overall mass balance for the solid phase is therefore given by the equation
(1)
The mass balance for the fluid phase can be written

(2)
The rate of mass exchange between the phases ( ) is called the granular yield. It is determined by a number of factors including surface reactions at the solid fluid interface, local temperature, concentration, pressure and more generally, how fluids and solids flow and mix in the system.
Many very different time scales are present in particulate growth systems such as the fluid bed CVD. Chemical reactions may take place in fractions of a second, flow and mixing effects are typically in the range of seconds and temperature changes occur within several minutes. In contrast, particle size distribution changes are in the order of hours or days since the particles grow very slowly.
The significant variation in time scales makes the fluid bed CVD process ideal for modeling in a multi-scale system. The idea, which is illustrated in Figure 2, relies on breaking the modeling problem into distinct computational modules, each of which may be computationally demanding, then develop procedures which allow information exchange between the modules. As illustrated, detailed fluid dynamics can be modeled with computational fluid dynamics (CFD), which provides a basis for a simplified reactor flow model. Since the particle size distribution changes slowly, we assume that only one or two CFD simulations are required to obtain a good representation of the fluidization regime for a given set of conditions. The reactor model is coupled with reaction kinetics to determine intrinsic yields and depositions rates. These in turn are input to the population balance model which models the dynamic variation in particle size distribution based on feed and seed rates.
Slow subsystem: Particles well-mixed
Integrate over time for particle size distribution
Fluid flowmodule
CVDmodule
Size distributionmodule
Temperature distribution TBed density ρ
Granular yield Y
Average particle size Dap
Fast subsystem:Fluidization regime
Integrate (3D steady state) to obtain
temperature and density
Fast subsystem:Gas and powder plug flow
Integrate (1D steady state) over height for yield
Solid phase Fluid phase Viscosity,..
Solid and Fluidphase
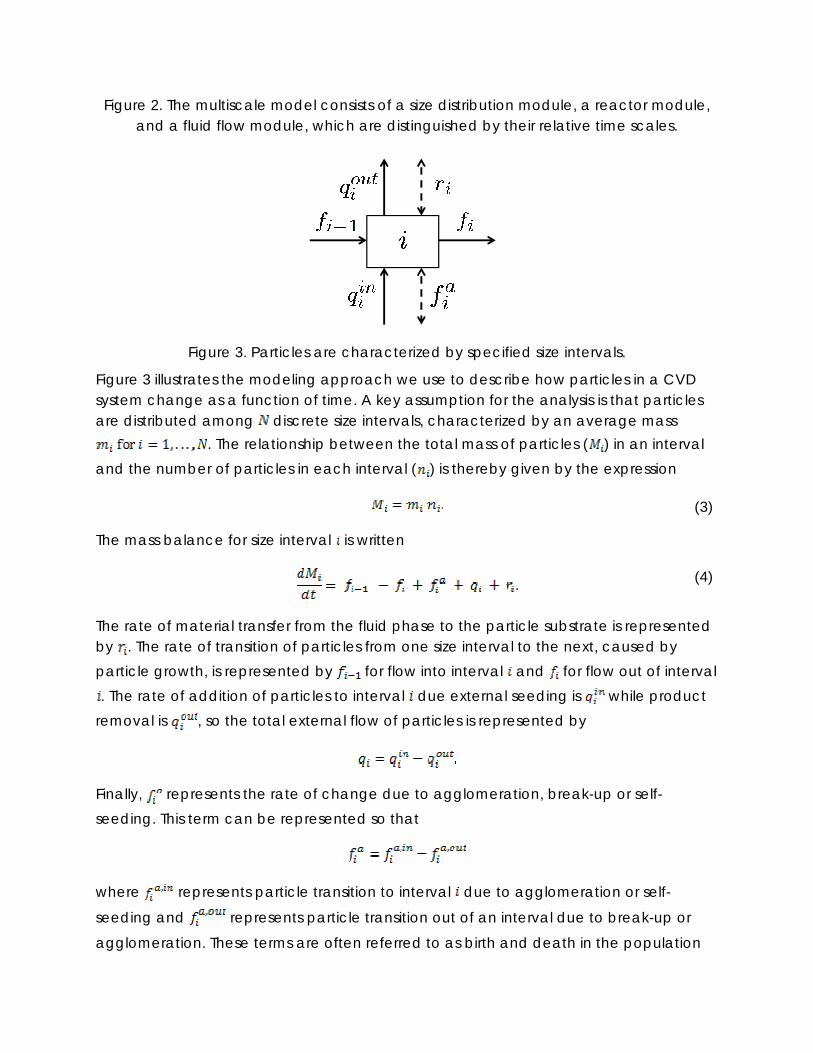
Figure 2. The multiscale model consists of a size distribution module, a reactor module, and a fluid flow module, which are distinguished by their relative time scales.
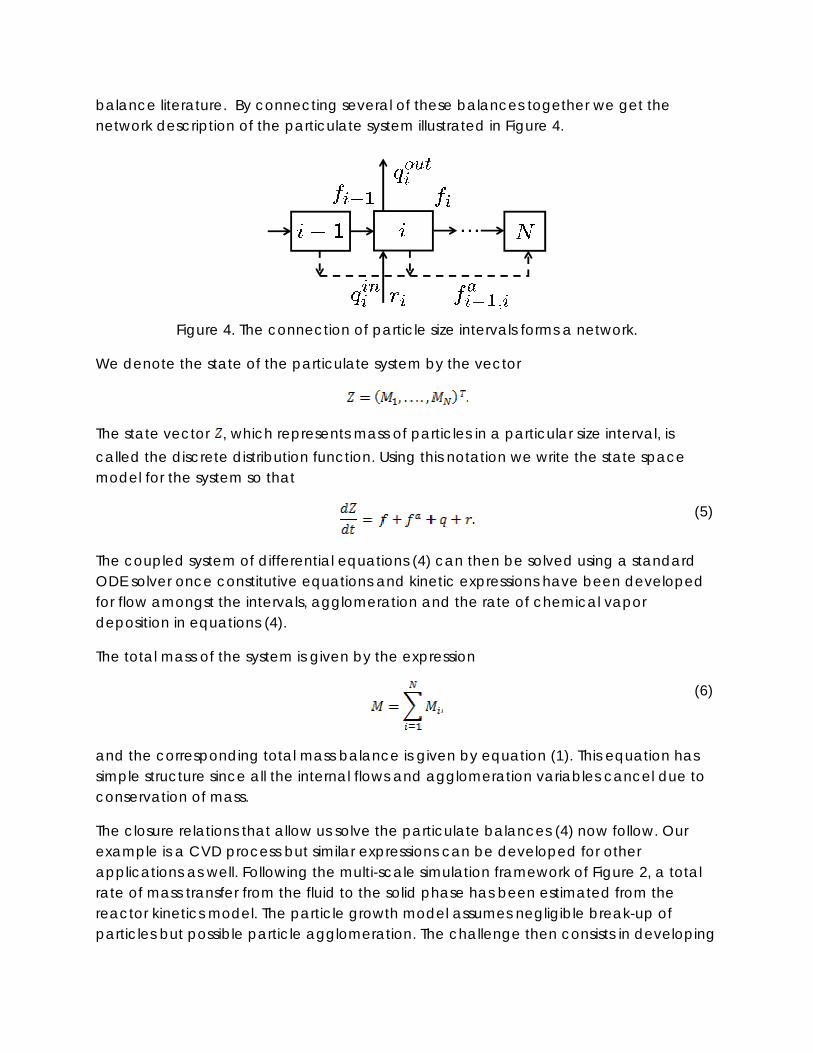
Figure 3. Particles are characterized by specified size intervals.
Figure 3 illustrates the modeling approach we use to describe how particles in a CVD system change as a function of time. A key assumption for the analysis is that particles are distributed among discrete size intervals, characterized by an average mass
. The relationship between the total mass of particles ( ) in an interval and the number of particles in each interval ( ) is thereby given by the expression
(3)
The mass balance for size interval is written
(4)
The rate of material transfer from the fluid phase to the particle substrate is represented by . The rate of transition of particles from one size interval to the next, caused by particle growth, is represented by for flow into interval and for flow out of interval . The rate of addition of particles to interval due external seeding is while product
removal is , so the total external flow of particles is represented by
Finally, represents the rate of change due to agglomeration, break-up or self-seeding. This term can be represented so that
where represents particle transition to interval due to agglomeration or self-
seeding and represents particle transition out of an interval due to break-up or
agglomeration. These terms are often referred to as birth and death in the population
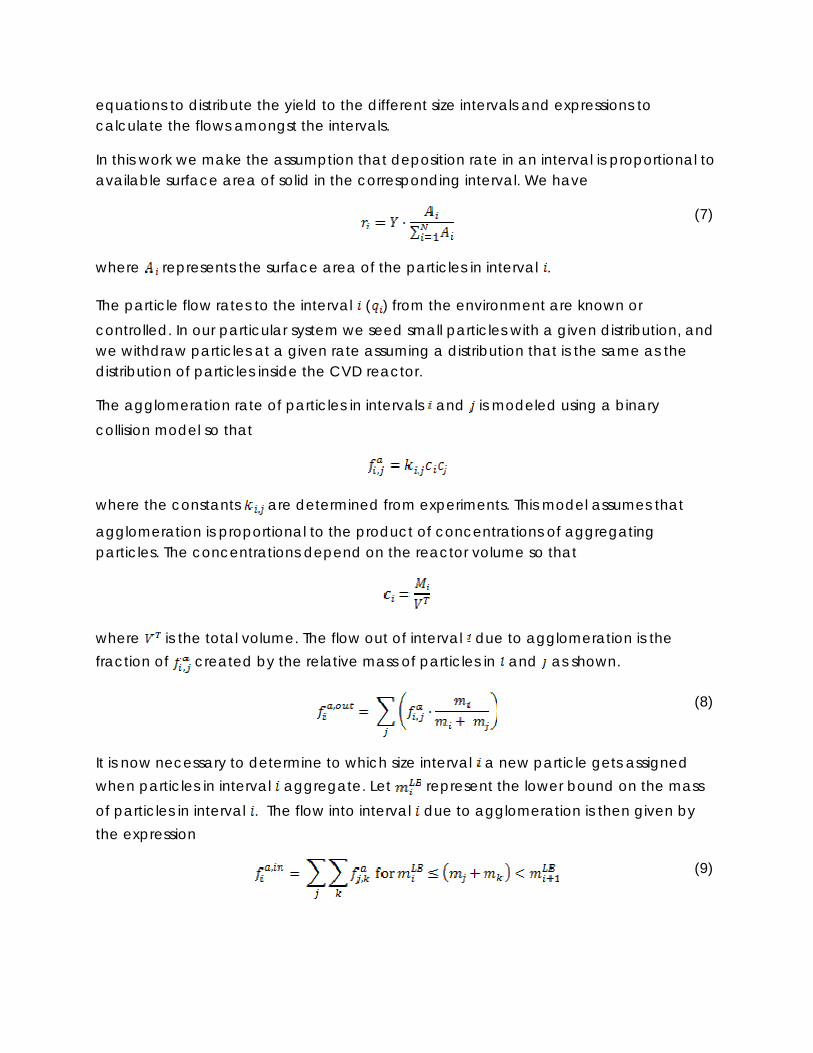
balance literature. By connecting several of these balances together we get the network description of the particulate system illustrated in Figure 4.
…
Figure 4. The connection of particle size intervals forms a network.
We denote the state of the particulate system by the vector
The state vector , which represents mass of particles in a particular size interval, is called the discrete distribution function. Using this notation we write the state space model for the system so that
(5)
The coupled system of differential equations (4) can then be solved using a standard ODE solver once constitutive equations and kinetic expressions have been developed for flow amongst the intervals, agglomeration and the rate of chemical vapor deposition in equations (4).
The total mass of the system is given by the expression
(6)
and the corresponding total mass balance is given by equation (1). This equation has simple structure since all the internal flows and agglomeration variables cancel due to conservation of mass.
The closure relations that allow us solve the particulate balances (4) now follow. Our example is a CVD process but similar expressions can be developed for other applications as well. Following the multi-scale simulation framework of Figure 2, a total rate of mass transfer from the fluid to the solid phase has been estimated from the reactor kinetics model. The particle growth model assumes negligible break-up of particles but possible particle agglomeration. The challenge then consists in developing
equations to distribute the yield to the different size intervals and expressions to calculate the flows amongst the intervals.
In this work we make the assumption that deposition rate in an interval is proportional to available surface area of solid in the corresponding interval. We have
(7)
where represents the surface area of the particles in interval .
The particle flow rates to the interval ( ) from the environment are known or controlled. In our particular system we seed small particles with a given distribution, and we withdraw particles at a given rate assuming a distribution that is the same as the distribution of particles inside the CVD reactor.
The agglomeration rate of particles in intervals and is modeled using a binary collision model so that
where the constants are determined from experiments. This model assumes that
agglomeration is proportional to the product of concentrations of aggregating particles. The concentrations depend on the reactor volume so that
where is the total volume. The flow out of interval due to agglomeration is the fraction of created by the relative mass of particles in and as shown.
(8)
It is now necessary to determine to which size interval a new particle gets assigned when particles in interval aggregate. Let represent the lower bound on the mass of particles in interval . The flow into interval due to agglomeration is then given by the expression
(9)
Finally, we use the number balance and Equation (3) to derive an expression for the flow between size intervals, .[8] The average particle size in an interval ( ) is constant. It follows that the flow between size intervals is given by the expression
(10)
Because both the mass and the number balances are used in the derivation of the discrete population balance model, conservation principles are maintained. Equations (7-10) are now combined with the balance equations (5) to form a complete model of the particulate CVD system. We modeled the system using MATLAB and used the stiff integrator ODE15s to solve the resulting equations.
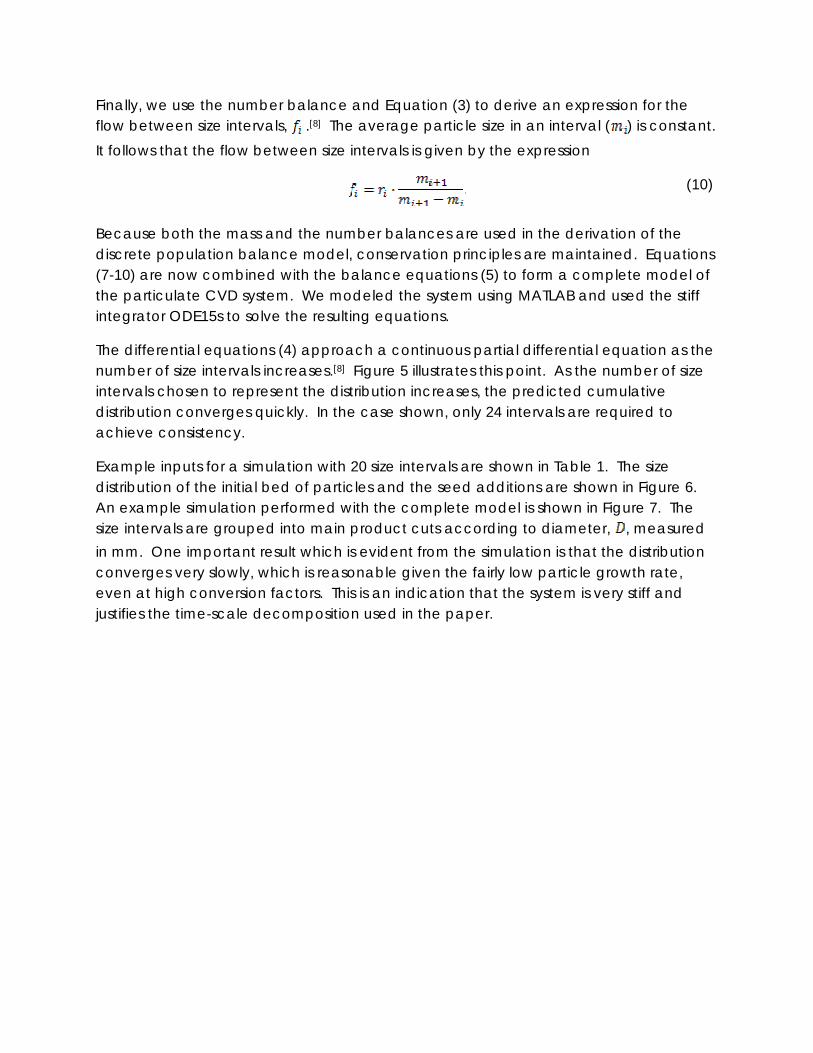
The differential equations (4) approach a continuous partial differential equation as the number of size intervals increases.[8] Figure 5 illustrates this point. As the number of size intervals chosen to represent the distribution increases, the predicted cumulative distribution converges quickly. In the case shown, only 24 intervals are required to achieve consistency.
Example inputs for a simulation with 20 size intervals are shown in Table 1. The size distribution of the initial bed of particles and the seed additions are shown in Figure 6. An example simulation performed with the complete model is shown in Figure 7. The size intervals are grouped into main product cuts according to diameter, , measured in mm. One important result which is evident from the simulation is that the distribution converges very slowly, which is reasonable given the fairly low particle growth rate, even at high conversion factors. This is an indication that the system is very stiff and justifies the time-scale decomposition used in the paper.
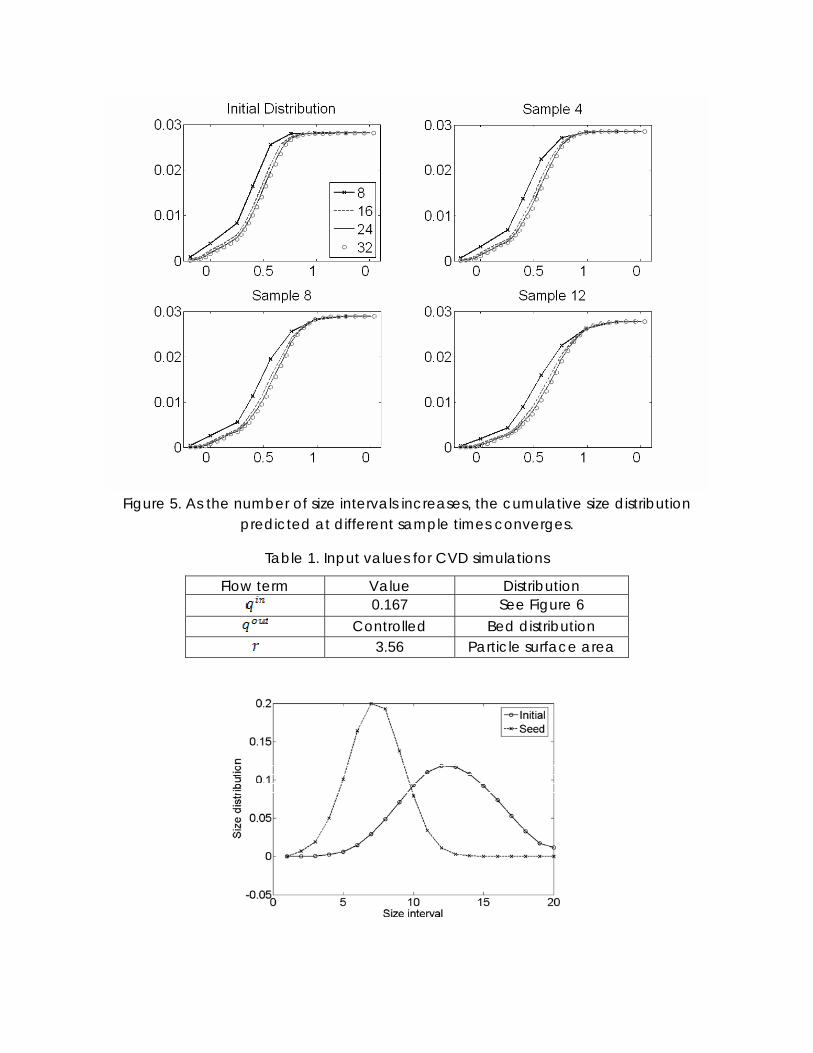
Figure 5. As the number of size intervals increases, the cumulative size distribution
predicted at different sample times converges.
Table 1. Input values for CVD simulations
Flow term Value Distribution 0.167 See Figure 6
Controlled Bed distribution
3.56 Particle surface area
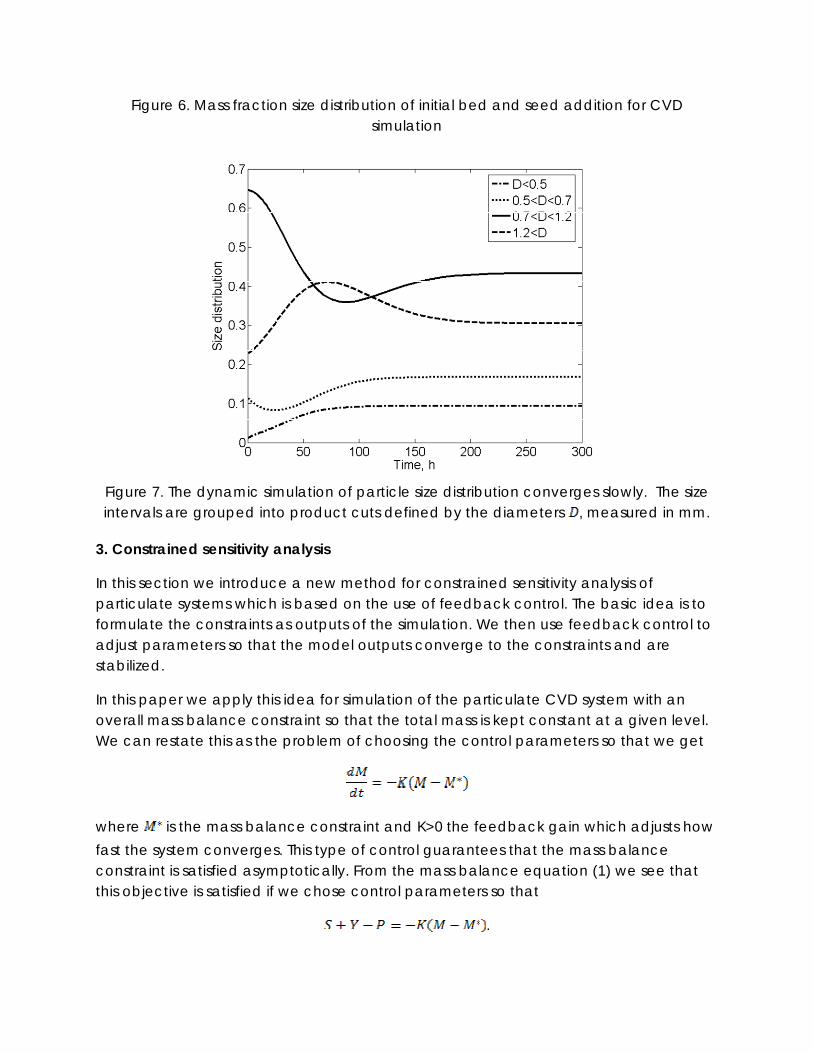
Figure 6. Mass fraction size distribution of initial bed and seed addition for CVD simulation
Figure 7. The dynamic simulation of particle size distribution converges slowly. The size intervals are grouped into product cuts defined by the diameters , measured in mm.
3. Constrained sensitivity analysis
In this section we introduce a new method for constrained sensitivity analysis of particulate systems which is based on the use of feedback control. The basic idea is to formulate the constraints as outputs of the simulation. We then use feedback control to adjust parameters so that the model outputs converge to the constraints and are stabilized.
In this paper we apply this idea for simulation of the particulate CVD system with an overall mass balance constraint so that the total mass is kept constant at a given level. We can restate this as the problem of choosing the control parameters so that we get
where is the mass balance constraint and K>0 the feedback gain which adjusts how fast the system converges. This type of control guarantees that the mass balance constraint is satisfied asymptotically. From the mass balance equation (1) we see that this objective is satisfied if we chose control parameters so that
.
The multi-scale simulation is set up so that the seed rate and yield are calculated externally. We therefore use the product withdrawal rate to adjust the mass balance constraint. In this case we obtain
(11)
This equation is included in the MATLAB code.
At steady state, the difference between the product withdrawal and seed addition rates is simply the growth rate achieved through deposition from the vapor phase. From Equation (13) with we get
(12)
which implies
(13)
The volume of a spherical particle with diameter is
.
So the average volume of particles characterized by discrete size intervals, as described in Section 2, is
where represents the number of particles in size interval . The average volume is also expressed as
(14)
which means that the diameter of the average volume of particles in a system is then
(15)
The seed and product flow rates of (13) can be written in terms of the particle volume, number and density as shown.
The ratio of the product to seed flow rate is then
(16)
Using (13) and(16) produces
which can be written as
(17)
For the case of no agglomeration we get an expression for the average particle size which is needed to solve the CFD simulation so that
where is calculated by the reaction module shown in Figure2.
The relationship between the average particle sizes and flow rates (17) is valuable for understanding and operation of continuous particulate CVD systems. If process data indicate that , then we have , which means that
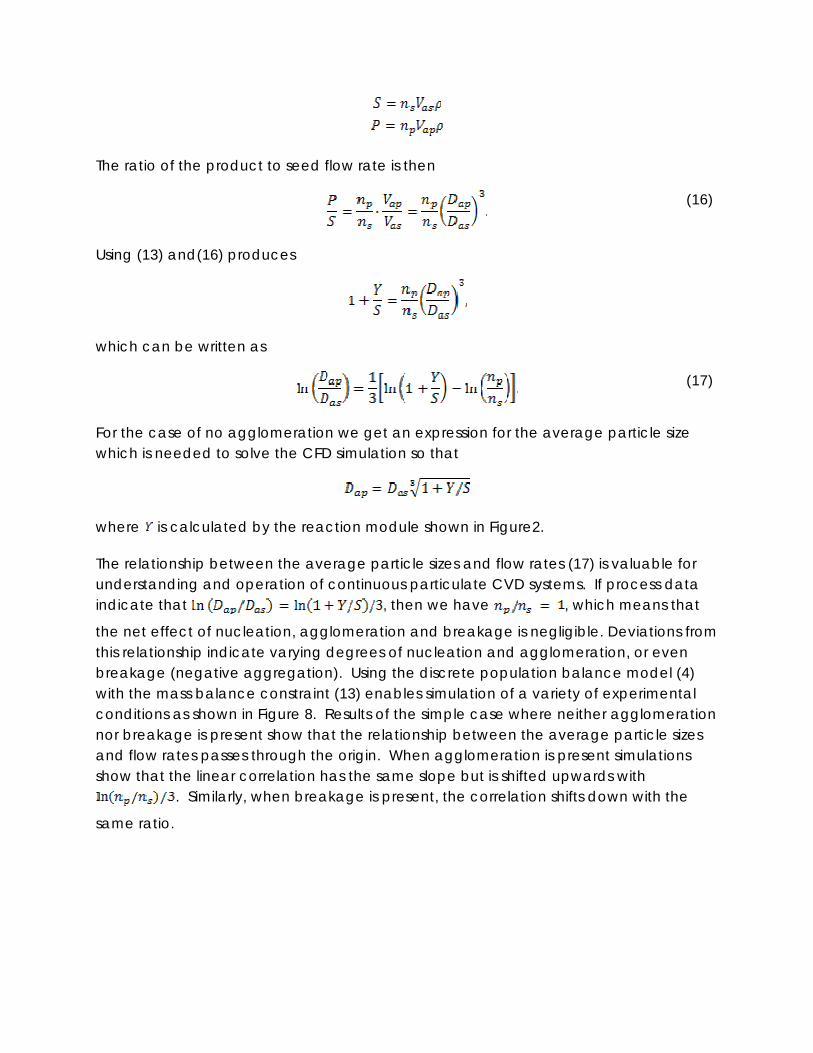
the net effect of nucleation, agglomeration and breakage is negligible. Deviations from this relationship indicate varying degrees of nucleation and agglomeration, or even breakage (negative aggregation). Using the discrete population balance model (4) with the mass balance constraint (13) enables simulation of a variety of experimental conditions as shown in Figure 8. Results of the simple case where neither agglomeration nor breakage is present show that the relationship between the average particle sizes and flow rates passes through the origin. When agglomeration is present simulations show that the linear correlation has the same slope but is shifted upwards with
. Similarly, when breakage is present, the correlation shifts down with the
same ratio.
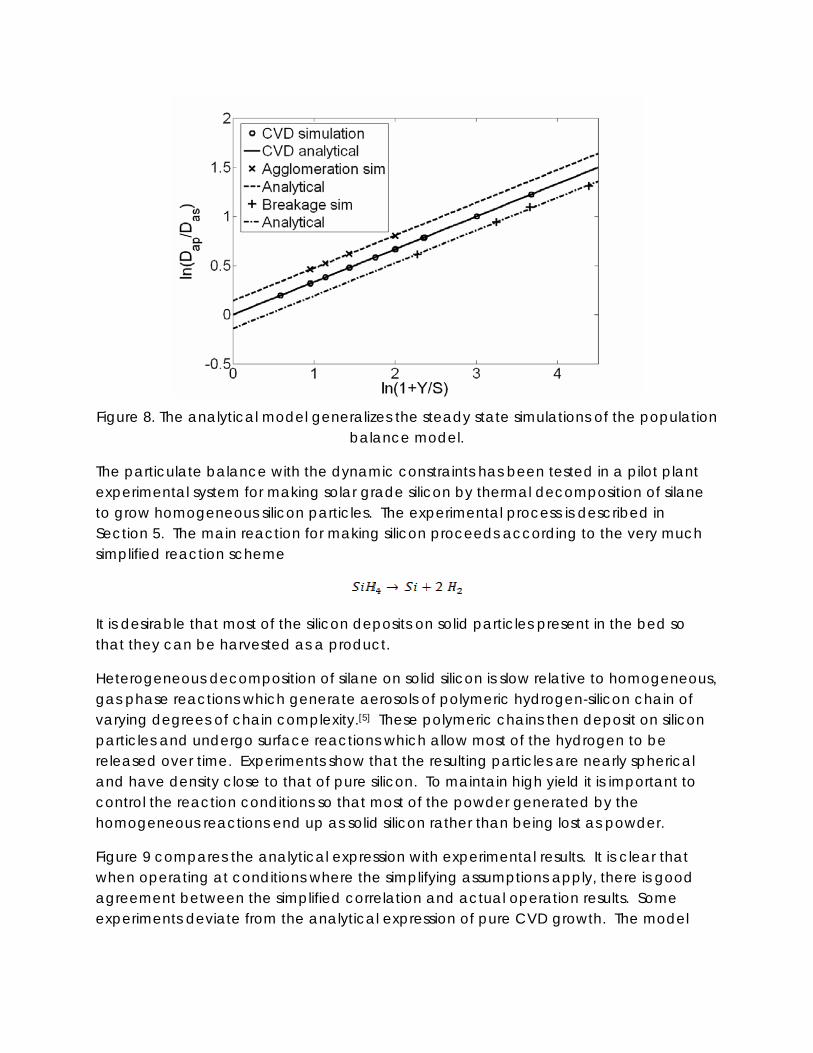
Figure 8. The analytical model generalizes the steady state simulations of the population
balance model.
The particulate balance with the dynamic constraints has been tested in a pilot plant experimental system for making solar grade silicon by thermal decomposition of silane to grow homogeneous silicon particles. The experimental process is described in Section 5. The main reaction for making silicon proceeds according to the very much simplified reaction scheme
It is desirable that most of the silicon deposits on solid particles present in the bed so that they can be harvested as a product.
Heterogeneous decomposition of silane on solid silicon is slow relative to homogeneous, gas phase reactions which generate aerosols of polymeric hydrogen-silicon chain of varying degrees of chain complexity.[5] These polymeric chains then deposit on silicon particles and undergo surface reactions which allow most of the hydrogen to be released over time. Experiments show that the resulting particles are nearly spherical and have density close to that of pure silicon. To maintain high yield it is important to control the reaction conditions so that most of the powder generated by the homogeneous reactions end up as solid silicon rather than being lost as powder.
Figure 9 compares the analytical expression with experimental results. It is clear that when operating at conditions where the simplifying assumptions apply, there is good agreement between the simplified correlation and actual operation results. Some experiments deviate from the analytical expression of pure CVD growth. The model
can be altered to achieve the same deviations by including non-CVD growth or decay mechanisms.
Figure 9. The pilot reactor results correspond well with the analytical model.
4. Conclusions
This work demonstrates the use of a multi-scale modeling approach for CVD in a fluidized bed reactor. We developed a robust working discrete population balance model within the context of a multi-scale modeling scheme to simulate particle growth systems. We also showed the analytical derivation of the relationship between the ratio of product and seed average size to that of their steady state flow rates, which can be used to determine whether or not agglomeration, nucleation, or breakage phenomena are present in particulate CVD systems. Finally we verified the modeling efforts with a constrained sensitivity analysis and with process data from a pilot scale fluidized bed reactor. Consequently, the discrete population balance model and the analytical relationship between particle size and flow rates serve as tools that can be used to investigate the performance, control, and design of particulate CVD processes.
5. Experiments
Experimental studies were conducted in a pilot plant reactor to assist the modeling work and verify the validity of the model and range of conditions for the simplified analytical expression. The inside diameter of the reactor is about 10 inches, and the height is about 20 feet. The reactor is operated as shown in Figure 1. A bed of silicon particles is charged, fluidized in H2 gas, and heated to reaction temperature. After
reaching appropriate conditions, SiH4 gas is introduced and thermally decomposes to solid silicon. Throughout the experimental run, product particles are withdrawn from the system to ensure a constant hold-up, and seed particles are added to control the size distribution. The size distribution of samples taken from the product stream as well as the top of the bed is measured periodically throughout the run with mechanical sieves or an electronic analyzer. These measurements indicate no segregation according to size.
List of symbols
surface area of average particle of size interval , m2 concentration of silicon of size interval , mol/m3 particle diameter, m precursor flow to or from reactor, mol/s particle transition between size intervals, mol/s particle transition due to agglomeration, mol/s
particle growth due to CVD, mol/s agglomeration proportionality constant, m6/(mol s)
total mass of silicon in size interval , mol characteristic mass of particle in size interval , mol
index of size interval containing largest particles number of particles per size interval product withdrawal rate, mol/s external particle flow, mol/s silicon production in size interval , mol/s silicon production rate, mol/s seed addition rate, mol/s particle volume, m3 particle density, mol/m3
References
[1] H.O. Pierson, Handbook of chemical vapor deposition (CVD): Principles, Technology, and Applications, William Andrew Inc. 1999.
[2] C. Vahlas, F. Juarez, R. Feurer, P. Serp, B. Caussat, Chemical Vapor Deposition 2002, 8, 127.
[3] B.J. Wood, A. Sanjurjo, G.T. Tong, S.E. Swider, Surface and Coatings Technology 1991, 49, 228.
[4] C.B. Xu, J. Zhu, Nanotechnology 2004, 15, 1671.
[5] B. Caussat, M. Hemati, J.P. Couderc, Chemical Engineering Science 1995, 50, 3615.
[6] J. Piña, V. Bucalá, N. Schbib, P. Ege, H.I. de Lasa, International Journal of Chemical Reactor Engineering 2006, 4, A9.
[7] M.P. Tejero-Ezpeleta, S. Buchholz, L. Mleczko, Canadian Journal of Chemical Engineering 2004, 82, 520.
[8] C.M. White, P. Ege, B.E. Ydstie, Powder Technology 2006, 163, 51.
[9] C.D. Immanuel, F.J. Doyle III, Chemical Engineering Science 2003, 58, 3681.
[10] M. A. Henson, D. Müller, M. Reuss, Biochemical Journal 2002, 368, 433.