Embed Size (px)
Citation preview

U. of Iowa 97-2
Multi-Species Test of
Ion Cyclotron Resonance Heating
at High Altitudes
by
A. M. Persoon', W. K. Peterson 2, M. Andr_ 3, T. Chang 4,
D. A. Gumett _, J. M. Retterer 5, and G. B. Crew 4
July 1997
Dept. of Physics and Astronomy, University of Iowa, Iowa City, IA 52242
2 Lockheed Space Science Lab., 3251 Hanover, Palo Alto, CA 94304
3 Swedish Inst. of Space Physics, Umea, Sweden
4 Center for Space Physics, Massachusetts Inst. of Technology, Cambridge, MA 02139
5 Phillips Laboratory, PL/GPSM, 29 Randolph Road, Hanscom AFB, MA 01731
https://ntrs.nasa.gov/search.jsp?R=19970034667 2018-06-06T20:51:48+00:00Z

ABSTRACT
Observations of ion distributions and plasma waves obtained by the Dynamics
Explorer 1 satellite in the high-altitude, nightside auroral zone are used to study ion
energization for three ion species. A number of theoretical models have been proposed to
account for the transverse heating of these ion populations. One of these, the ion cyclotron
resonance heating (ICRH) mechanism, explains ion conic formation through ion cyclotron
resonance with broadband electromagnetic wave turbulence in the vicinity of the
characteristic ion cyclotron frequency. The cyclotron resonant heating of the ions by low-
frequency electromagnetic waves is an important energy source for the transport of ions from
the ionosphere to the magnetosphere.
In this paper we test the applicability of the ICRH mechanism to three simultaneously
heated and accelerated ion species by modelling the ion conic formation in terms of a
resonant wave-particle interaction in which the ions extract energy from the portion of the
broadband electromagnetic wave spectrum which includes the ion cyclotron frequency.
Using a Monte Carlo technique we evaluate the ion heating produced by the electromagnetic
turbulence at low frequencies and find that the wave amplitudes near the ion cyclotron
frequencies are sufficient to explain the observed ion energies.
I. INTRODUCTION
Observations of ion conics have been reported in the literature for more than twenty
years (extensive review of transverse auroral ion acceleration in Klumpar [1986]; review of
ion conic distributions in Dynamics Explorer data in Burch [1988]). The characteristic
signature of an ion conic on a high-resolution, energy-time spectrogram is that of a
cone-shaped distribution centered on the magnetic field direction. The cone-shaped
distribution is attributable to a combination of transverse acceleration and adiabatic motion of
the ions along inhomogeneous geomagnetic field lines.
A great number of theoretical models have been proposed to account for the
transverse heating of these ion populations. Reviews of these theories can be found in Lysak
[1986], Chang et al. [1988] and Andr6 and Chang [1993]. The problem with identifying the
process of ion conic formation has not been the lack of theoretical models, but the lack of
simultaneous wave and particle data on appropriate time scales. Because the postulated
wave-particle interactions that create ion conics are mass-dependent, knowledge of the conic
ion mass is essential.
Wave-particle interaction mechanisms have been advanced which have sought to
explain the conic formation by means of wave-particle interactions involving lower hybrid
waves and electromagnetic and electrostatic ion cyclotron waves, as well as other low
frequency waves (see references in Crew et al. [1990], Retterer et al. [1989], Klumpar et al.
[1986], and Peterson et al. [1988]). However, certain observations of ion conic distributions
did not fit the previous wave-particle interaction models, due to the absence of the necessary
wave modes and to the absence of any means to generate these waves [Winningham and
Burch, 1984; Klumpar et al., 1984]. In addition to the lack of necessary wave modes to

generate conics, the two conic distributions in the Klumpar study were puzzling because the
conic signature suggested a two-stage acceleration process acting on the ions in which the
ions experience a low-altitude acceleration transverse to the geomagnetic field, followed byacceleration along the field line at higher altitudes in the magnetosphere. The two-stage
acceleration process was invoked to explain the characteristic signature of these bimodalconics in which the ions are field-aligned at lowest energies but become conical at increasing
energy with the flux and cone angle increasing with increasing energy [Klumpar et al.,1984]. Temerin [1986] found that any transverse bulk heating mechanism operating over a
wide range of altitudes could, acting in concert with the mirror force, produce the
characteristic combination of parallel acceleration and perpendicular heating.Chang et al. [1986] and Retterer et al. [1987] studied the 81318 event of Winningham
and Butch [1984] and proposed that the O÷ ions had been transversely energized through a
cyclotron resonant interaction with low frequency broadband electromagnetic turbulence. Inthis theory, the necessary waves would be generated by some remote magnetospheric orionospheric process and would propagate to altitudes where the waves would relinquish someof their energy to the ions, resulting in the observed transverse acceleration. The lowfrequency electromagnetic turbulence, a potential source of energy for such a resonantinteraction, is a frequent occurrence at low altitudes over the auroral zones [Gumett et al.,
1984]. Johnson et al. [1989] identified a plausible source of this turbulence in equatorially
generated low frequency ion cyclotron waves. These waves propagate into the ion-heatingregion where the left-hand circularly polarized component of the waves resonates with the
thermal oxygen ions [Home and Thorne, 1990 and R6nnmark and Andr6, 1991].
Retterer et al. [1987] employed a Monte Carlo technique to model the quasi-lineardiffusion of the heated ions and included the effect of the magnetic mirror force whichcontinually converts perpendicular energy to parallel energy even as the ions are experiencingadditional transverse acceleration [Temerin, 1986]. Thus the ion cyclotron heating (ICRH)mechanism could account for both the parallel and perpendicular acceleration components ofthe bi-modal distributions observed by Klumpar et al. [1984]. Retterer et al. [1987]successfully modeled O+ conics along auroral field lines mapping into the central plasma
sheet, via cyclotron resonance with the observed electromagnetic turbulence. Norqvist et al.[1996] used a Monte Carlo simulation similar to that used by Retterer et al. [1987] to studyion heating in the dayside high-latitude magnetosphere. After testing several heatingmechanisms, including particle interactions with waves over a range of frequencies frombelow the ion cyclotron frequency to above the lower hybrid frequency, Norqvist et al.[1996] found that the cyclotron resonant mechanism is the dominant ion heating mechanism,a result consistent with other studies in the dayside, high-latitude magnetosphere by the
Dynamics Explorer 1 and Viking satellites [Andr6 et al., 1988, 1990].Crew et al. [1990] developed an intensive theoretical treatment of energetic oxygen
ion conic formation through ion cyclotron resonance with electromagnetic plasma turbulence.Crew and co-authors developed a two-parameter representation of an ion conic distribution in
which the heating process is characterized by the velocity scale and a pitch angle scalingparameter of three well-defined O + conic events. The conic form predicted by their
algorithm and the ICRH theory was found to be in excellent agreement with the three conic

4
formations of energetic O ÷ conics previously discussed in Winningham and Burch [1984] and
Klumpar et al. [1984].
In addition to O ÷ ion conic distributions, conic distributions of He ÷ ions are
frequently observed in the earth's magnetosphere. So far, the ICRH theory has been
successfully applied to a limited number of energetic O ÷ ion conic events. The success of
the ICRH theory for these limited cases immediately raises questions concerning the general
applicability of this mechanism to other ion species. This paper will address this issue by
testing the general applicability of the ICRH mechanism to hydrogen, helium and oxygen
conic distributions, observed simultaneously along low-latitude auroral and subauroral field
lines in the nightside magnetosphere.
We will use the analytic technique employed first by Chang et al. [1986] and Retterer
et al. [1987] and later by Andr6 et al. [1990] and Norqvist et al. [1996] to study the effects
of resonant ion heating by broadband low-frequency waves. Previously, much of the work
on the cyclotron resonance heating of ions has focused on the auroral and cusp/cleft regions
where the more energetic and intense ion conics are frequently observed. However,
magnetometer data also reveals the presence of field-aligned currents and strong E × B drifts
which complicate the ion orbits and the estimates of the ion heating. To investigate the
applicability of the ICRH mechanism to lighter ion species, we have chosen examples of ion
conic distributions from lower auroral and subauroral latitudes where field-aligned currentsare weak or absent.
This study utilizes ion data from the Energetic Ion Composition Spectrometer (EICS)
and wave data from the Plasma Wave Instrument (PWI) on the Dynamics Explorer 1
spacecraft. Dynamics Explorer 1 was launched in August of 1981 into an eccentric polar
orbit with perigee and apogee geocentric radial distances of 1.09 RE and 4.66 RE,
respectively. Data from the f'trst three years of the Dynamics Explorer mission were
screened to identify examples of helium conic distributions with simultaneous heating of
hydrogen and oxygen ions. The study will focus on applying the ICRH mechanism to the
heating of helium ions and will compare the modeling of the He ÷ ions with the models of the
hydrogen and oxygen ion distributions, all using the analytic techniques of Chang et al.
[1986], Retterer et al. [1987] and Andr_ et al. [1990] to show that the low-frequency wave
spectra can effectively produce the observed ion conic distributions.
Observations from the Energetic Ion Composition Spectrometer (EICS) have been
used to identify three events with helium conic distributions from high-latitude regions in the
nightside magnetosphere where field-aligned currents are weak or absent. EICS is a
high-resolution ion mass spectrometer, designed to measure the energy and pitch angle
distributions of ions in a mass range of less than 1 amu/e to 150 amu/e in 64 mass channels.
The energy range of the ions spans 0 eV (spacecraft potential) to 17 keV/e in 32 energy
steps. The field of view of the instrument is perpendicular to the spacecraft spin axis and
provides complete pitch angle coverage every spacecraft rotation (6 seconds). The
instrument is described in detail by Shelley et al. [1981] and Andr6 et al. [1990].
Electric field spectrum measurements from the Plasma Wave Instrument (PWI) have
been used to derive the power of the plasma waves in the vicinity of the ion cyclotron
frequency. The PWI on Dynamics Explorer 1 has been described in detail in Shawhan et al.
[1981]. The low frequency (below 8 Hz) electric field spectral density measurements are

obtainedfrom the Fourier analysis of the time series dc electric field measurements. The dc
electric field data have a frequency resolution of 0.33 Hz and a time resolution of 3 seconds.
The instrument samples all orientations with respect to the local magnetic field [Andr6 et al.,
1990]. The dc electric field measurements are obtained from the 200-m (tip-to-tip) electric
antenna, oriented perpendicular to the spin axis. Signals from this same long-wire antenna
are also processed by a pair of step-frequency receivers which sweep a frequency range of
1.78 Hz to 410 kI-Iz once every 32 seconds. The resulting electric field amplitude
measurements are displayed in frequency-time color spectrograms (with the wave amplitude
encoded in the color bar) and in amplitude-frequency electric field spectral density plots.
II. OBSERVATIONS AND ANALYSIS
Three examples of helium, oxygen and hydrogen conics have been selected for an
analysis of the ion cyclotron resonance heating (ICRH) mechanism. The events were
identified using the conic-finding technique described in Peterson et al. [1992].
Our objective is to show that the waves at the local ion cyclotron frequency possess
sufficient energy to produce the observed ion heating for multiple ion species by comparing
the ion energy inferred from the observed ion distribution to the theoretical ion energy
derived from the wave power spectral density at the local ion cyclotron frequency. There are
two established analytical methods for making this comparison. Andr6 et al. [1990] took
advantage of the unique geophysical structure of the dayside cusp region where, under
normal conditions, cold plasma drifts into a region characterized by intense wave power at
the relevant ion cyclotron frequencies.
We have chosen to focus our attention on the nightside auroral field lines and adapt
the technique developed by Crew et al. [1990]. This technique assumes that bulk ion motion
is in a direction such that the ions are exposed to an essentially constant flux of plasma wave
power at the relevant ion cyclotron frequencies. The ICRH method also assumes that the
plasma wave power spectrum in the relevant frequency range has a slope and magnitude
independent of altitude below the point of observation. The end product of the Crew et al.
[1990] ICRH technique is a two-parameter representation of the ion distribution and the wave
power.
Our initial approach to the comparison of the observed ion conic energies and those
predicted by the ICRH theory was to use the full theoretical treatment discussed in the Crew
et al. [1990] paper. The advantage of the full formulation of the ICRH theory is that it
provides an analytical way to calculate the two characteristic ICRH parameters from
moments of the measured ion distribution function and from characteristics of the plasma
wave spectrum. The ICRH theory predicts that the two characteristic ICRH parameters
calculated from the measured distribution functions should equal those calculated from the
plasma wave spectrum. However, using the Crew et al. [1990] method to analyze He + ion
distributions proved to be unfeasible because the signal levels in the observed helium
distributions were lower than anticipated, resulting in large uncertainties in the calculated
parameters. The Crew et al. [1990] method could not be used to show that the predictions of
the ICRH theory are consistent with observed plasma waves and ion distribution functions.

6
Ratherthan obtain characteristics of the ion distribution function from moments
calculations, we estimated a single characteristic energy as outlined below. We compared
this characteristic energy inferred from the ion distribution with the characteristic energy
derived from the plasma wave power spectrum, using the analysis technique developed by
Retterer et al. [1987]. Retterer et al. [1987] related two characteristics of the wave power
spectral density, the magnitude and the slope of the wave spectral density at the local ion
cyclotron frequency, to the predicted characteristic energy of an ion conic. We present and
discuss the limitations of the method we used to calculate the characteristic energies from the
measured ion distribution in parallel with the presentation of the data from the first of the
three auroral zone crossings.
March 5, 1983
The first ion conic event to be identified is taken from a nightside crossing of the
auroral zone in the southern hemisphere on March 5, 1983. Plate 1 summarizes our
observations of the ion distributions for this crossing and the associated plasma wave activity.
The top three color panels display nine successive angle-energy flux distributions from the
Energetic Ion Mass Spectrometer (EICS) for the 14-minute interval beginning at 23:42 UT
on March 5. H +, He + and O + ion fluxes for the nine successive ion distributions are
presented in an angle-energy postage stamp format. Ion fluxes for each 96-second interval
are presented with ion pitch angles from 0 to 180 degrees as the ordinate (vertical axis) and
energy from 10 eV/e to 17 keV/e as the abscissa (horizontal axis). Ion fluxes in units of
(cm2-s-sr-keV) 1 at each energy-pitch angle position are encoded, using the color bar on the
right side of the ion panels. The ions, flowing up magnetic field lines in the southern
hemisphere, have pitch angles of 0 degrees in this plot format. It should also be noted that
the EICS instrument mode, used in all of the intervals presented in this paper, obtained data
for only one energy setting per spin (every 6 seconds). The order in which ion energies
were sampled was not monotonic and 16 spins (96 seconds) were required to obtain a
complete ion energy-angle distribution. The striped nature of the data for all three ions in
the seventh interval at approximately 23:53 UT are the result of a significant change in the
intensity and angular distribution of the ion populations during this sampling interval. We
refer to this effect as time aliasing of the data.
Helium conic distributions at low energies appear near the equatorward edge of the
nightside auroral zone at 23:47 UT (in the fourth interval) and at 23:50 UT (in the sixth
interval) in the low energy bins. Simultaneously, well-defined O + and H + conics are
observed at 23:47 UT (fourth interval). A second interval, showing a weaker O + conic
distribution and a simultaneous intense H + conic distribution, occurs in the eighth interval at23:53 UT.
Also presented in Plate 1 are spectrograms of simultaneously acquired plasma wave
data. The bottom two color panels present plasma wave data from the electric field antennas
of the Plasma Wave Instrument (PWI) on Dynamics Explorer 1. The fourth color panel
presents the power spectral density obtained from the Fourier analysis of the time series dc
electric field measurements made by the PWI instrument. The power spectra were obtained

7
from time series electric field measurements made in the satellite spin plane which samples
all orientations with respect to the local magnetic field [Andr6 et al., 1990]. This panelpresents the electric field power spectral density (in units of V/me/Hz, encoded on the color
bar to the right of the panel) over the frequency range from 0 to 8 Hz. The frequency axison this panel is linear.
The electric field measurements in the fourth panel indicate an intense increase in the
wave power at low frequencies corresponding to the occurrence of the weak helium conics.
The spectrogram illustrates the onset of intense low-frequency wave activity beginning at23:50 UT and continuing until 23:52 UT. The oxygen and helium cyclotron frequencies (1.6Hz and 5 Hz, respectively) are embedded within this intense wave activity. This interval ofintense low-frequency wave activity correlates with the less intense He + conic distribution at
23:50 UT in the low energy bins. Wave activity in the fourth interval is intermittent and nothighly correlated with the occurrence of the ion conic distributions.
The bottom color panel presents the electric field measurements for the frequencyrange from 1 Hz to 410 kHz obtained from the Low Frequency Correlator (LFC) and the
Sweep Frequency Receiver (SFR) of the PWI instrument. The plasma wave spectral densityis given in units of V2/m_/Hz encoded on the color bar to the right of the panel. The strongemissions above 100 kHz observed throughout this interval are auroral kilometric radiation(AKR). The black intervals at either end of the spectrogram are artifacts of the data display.The 32-second instrumental cycle time of the SFR is readily apparent from the striped natureof the spectrum at low frequencies. This striped appearance is indicative of substantialchanges in the in situ plasma wave spectrum on time scales short compared to the 32-secondSFR cycle time.
The ion conics in the top three panels occur during a period of intense wave activitybelow 100 Hz which extends throughout much of this interval. The intense wave activityends abruptly in the seventh interval just prior to the intensification in the H + distribution at23:53 UT. The hydrogen cyclotron frequency (approximately 23 Hz) is embedded within
this intense low frequency wave activity. This type of broadband low-frequency turbulenceis commonly observed along nightside auroral field lines [Gurnett et al., 1984].
Our goal is to compare characteristic ion energies perpendicular to the local magneticfield predicted by the ICRH theory with those inferred from direct measurement by the EICSinstrument. The bottom two panels of Plate 1 display the characteristic ion energyperpendicular to the magnetic field line inferred from the measured He +, O + and H +
distribution functions and the predicted perpendicular energy calculated from the
characteristics of the plasma wave spectral density spectrum [Retterer et al., 1987]. Before
entering into a detailed comparison of the measured and predicted perpendicular energies, weneed to examine more closely how they were determined.
In order to reduce the effects of time aliasing caused by significant variations in boththe ion and plasma wave power distributions on time scales short compared to the 96-secondEICS measurement interval, we have chosen to calculate characteristic energies for 48
seconds rather than 96-second intervals. The order in which the EICS energy steps areacquired is such that a majority of the EICS low energy steps (those with energies below 1
keV) were acquired in alternate 48-second intervals. It is the characteristic perpendicular

energyfrom these48-second intervals, not the full 96-second EICS instrumental cycle time,that is presented in the bottom two panels of Plate 1.
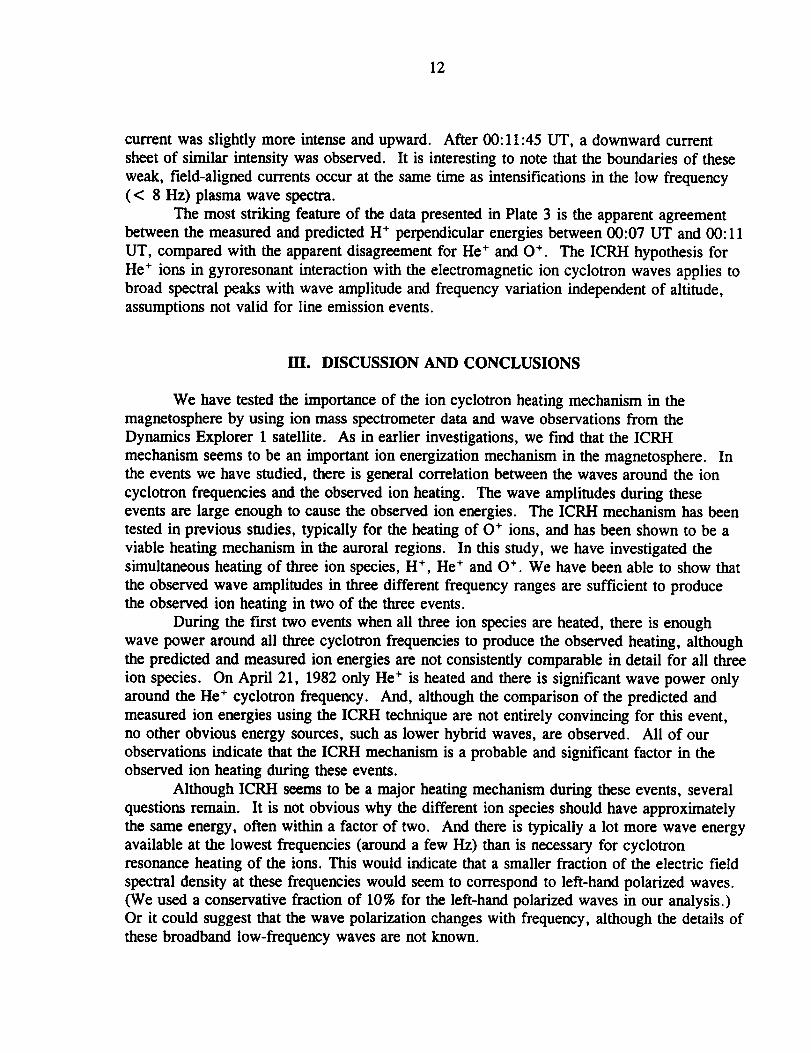
Figure 1 presents representative plasma wave spectra and He + distribution functions
for the three specific 48-second intervals centered on the times indicated during the nightsideauroral zone crossing on March 5, 1983. We focus first on the plasma wave data in the
upper left panel. Data are presented for the three intervals indicated. The O ÷ and He +cyclotron frequencies are indicated by arrows (1.5 and 6 Hz, respectively). The H ÷cyclotron frequency was approximately 23 Hz during the auroral zone crossing. Retterer etal. [1987] relate the magnitude and slope of the wave power spectral density at the ioncyclotron frequency to a characteristic energy of the ion distribution function. For the threetimes indicated, ICRH theory predicts characteristic energies of 25, 38, and 55 eV,
respectively (assuming that 10% of the full wave spectrum is left-hand polarized). Thepredicted characteristic energies for He + and O ÷ determined in this way are presented in the
bottom panel of Plate 1. Even though we do not expect H ÷ ions to be energized primarilyby the ICRH mechanism, we have interpolated the SFR power spectral density in frequencyand time to obtain estimates of a characteristic H÷ energy as if the only process acting on the
dominant H ÷ ions were ion cyclotron resonance heating. These data are also presented in thebottom panel of Plate 1.
Contour plots of the measured He ÷ velocity space distributions for the same threetime intervals are presented in the remaining three panels of Figure 1. The circles of smalldots centered on the origin indicate the velocities parallel and perpendicular to the localmagnetic field at which He ÷ ions were sampled. Because the EICS instrument mode requires96 seconds to cycle through the 15 energies and a background measurement, determination ofa characteristic energy is complicated by changes in the overall flux level during the full
instrument cycle. To minimize this distortion we have used data from 8 of the energy stepsacquired within 48 seconds. The 4 innermost circles of dots in the contour plots wereobtained when EICS was sampling He ÷ with energies of 60, 230, 870 and 1120 eV,respectively. The outermost circle of dots is an artifact of the contouring routine which alsohad inputs of He ÷ fluxes at 3.7, 5.0, 12.7 and 17.0 keV, corresponding to He ÷ velocitiesgreater than 300 km/s. Presented in the panels labeled 1-3 are contours of the maximum of
the EICS one count per interval response and the measured value of the He + velocity space
density. Contours are give in units of the log (base 10) of the distribution function in unitsof km6/sec 3. In this representation, data below the one count per measurement interval level
appear as circular contours centered on zero velocity. The He ÷ conic angular distributions
are such that they appear to have a non-zero velocity parallel to the magnetic field line at themaximum of the distribution function--that is, the He ÷ angular distributions appear to be the
type that are created by ion cyclotron resonance heating as described by Chang et al [1986].
Note that the contouring routine smoothly interpolates over the rather wide velocity gapbetween the 230 and 870 eV measurements.
The characteristic He + energies perpendicular to the local magnetic field line for the
three intervals in Figure 1 are 18, 104, and 21 eV, respectively. Operationally they were
determined graphically from the contour plots. A quasi-hyperbolic shaped line of maximumvelocity space density (called a conic path) was hand-drawn on each contour. Lines were
then drawn parallel to the V I = 0 axis between intersections of the conic path and the

9
contours. The half length of the lines connecting the two branches of the conic path,
expressed as a velocity f, was used, along with the value of the velocity space density
corresponding to that contour level, as inputs to a routine to fit the function
f = f.exp{-mv 2/2.rT}
There are very obvious limitations to this method of determining a characteristic
perpendicular energy from the EICS data. The He + data in the three intervals presented in
Figure 1 correspond to an time when the characteristic flux, energy, and angular distribution
of the ions changed from a cool ion conic of indeterminate angular width (interval 1) to a
mid-energy conic with a wide angular width (interval 2) to a slightly less energetic conic
with a relatively narrow angular width. Similar patterns in the O ÷ and H ÷ ion distributions
can been seen in the color spectrogram postage stamp angle-energy data for these intervals in
Plate 1. As noted above, we have not included He + fluxes at 430 and 650 eV, which were
sampled in the time between interval 1 and 2. Omission of these data from the contour
algorithm, coupled with the few counts detected in the 870 eV He + fluxes that were
included, results in contours that are apparently biased to higher velocities. Inclusion of the
430 and 650 eV He + data in the contour algorithm produces contours that do not have the
regular quasi-hyperbolic shape apparent in the data for intervals 2 and 3. Examination of the
color spectrograms shows that interval 2 data were obtained on or near a boundary in the
background H ÷ ion distribution. Prior to interval 2 the hot, quasi-isotropic component of the
H ÷ plasma is relatively more intense than it was after interval 2.
Some additional information about the plasma environment is available from the
Dynamics Explorer 1 magnetometer. A weak (approximately 0.5 #A/m 2) downward-directed
field-aligned current was detected by the Dynamics Explorer 1 magnetometer at 23:46:25 UT
at or near the boundary in the background H ÷ ion distribution. The region with a relatively
less intense hot, quasi-isotropic H ÷ distribution extends to about 23:51 UT where a weaker
(approximately 0.25 #A/m 2) pair of field-aligned currents are detected. Between 23:46:45
UT and 23:51:45 UT the magnetometer shows an increase of 37 nT in the E-W magnetic
field corresponding to a very weak, large-scale, downward field-aligned current less than 0.1
#A/m 2. Prior to 23:46 UT no significant change in the E-W magnetic field was detected.
After 23:52 UT the magnetometer detected a weak, upward, large-scale, field-aligned current
of comparable magnitude to the weak, downward current noted above.
The most striking feature of Plate 1 is the agreement of the measured and predicted
He ÷ characteristic perpendicular energies between 23:48 UT and 23:52 UT and the
disagreement of the predicted and measured H ÷ and O ÷ characteristic energies. We defer
discussion of the comparison of measured and predicted characteristic perpendicular energy
until after presentation of data obtained in two other crossings of the auroral zone.

10
February 16, 1982
The second interval on February 16, 1982 was selected by the EICS conic-finding
code as the most intense example of a helium conic distribution. Since helium conics are
typically weak distributions, this example is a particularly compelling one to analyze. Plate
2 presents ion and plasma wave data and inferred characteristic energies in the same format
as Plate 1. The data presented in Plate 2 were obtained near midnight in magnetic local time
but at slightly higher altitudes and invariant latitudes than those presented in Plate 1. The six
successive angle-energy flux distributions for H + show a distribution characterized by a cool
(i.e., low energy) upflowing population that increases in intensity and then decreases. These
spectra were obtained in the northern hemisphere, so upflowing ions have pitch angles in the
90-180 degree range. The H + distribution also has a hot quasi-isotropic component that
gradually gets less energetic during the interval, as evidenced by the black color for the
highest energy steps in the final H ÷ postage stamp display. The black color indicates that the
observed fluxes are at or below the instrumental threshold of 103 ions/(cm2-ss-keV). Both
the He + and O ÷ postage stamps display well-defined conic distributions for the interval near
18:50 UT. Following the method described above, we determined characteristic
perpendicular energies of 108 eV and 184 eV for the He + and O + distributions respectively.
The angular width of the He ÷ conic is narrower in the following interval, resulting in a
lower characteristic perpendicular energy (63 eV). The O ÷ distribution in the next interval
retains most of the angular width, but the decline in the flux with energy is stronger. This
also results in a lower characteristic perpendicular energy (113 eV). The limitation in our
method to determine a characteristic perpendicular energy for He + shows up again in the last
interval (18:55 UT) where a few signal counts in the 870 eV channel bias the energy to an
unrealistically high value.
The plasma wave data presented in Plate 2 are characterized by auroral kilometric
radiation above 100 kHz, an intensification of the low frequency (less than 1 kHz) wave
power shortly after 18:48 UT, fairly constant wave power in the 0-1 Hz range and rapidly
(compared to ion measurement times) fluctuating wave power spectra before 18:48 UT. The
He + cyclotron frequency for this interval was near 2.6 Hz and the O + cyclotron frequency
for this interval was at approximately 0.7 I-Iz. An examination of the very low frequency
wave electric field data in the fourth panel of Plate 2 shows intense wave activity at the
oxygen cyclotron frequency throughout the first three intervals where the intense oxygen
conic distributions are seen. However, although the wave power at the O + cyclotron
frequency was relatively constant in magnitude throughout this interval, there are rapid
variations in the wave power with time and frequency for all frequencies above 1 Hz. Both
the wave power and the changes in the wave power with increasing frequency at the He + and
H + ion cyclotron frequencies fluctuate rapidly on the time scales required for the ion
measurements, so the comparison between the measured and predicted perpendicular energies
from the ICRH theory is not expected to be a good test of the ICRH mechanism, compared
to the data presented in Plate 1.
The Dynamics Explorer 1 magnetometer data provide some additional information
about the plasma environment on February 16. A pair of weak (approximately 0.5/zA/m2),
oppositely directed, field-aligned currents was detected at 18:48 UT, corresponding to the

11
onsetof fluctuations in the plasma wave power above 1 Hz. From 18:48 UT to 18:54 UT,
small-scale, field-aligned currents of both polarities were observed with magnitudes in the
range 0.3 to 0.9/zAYm 2.
The most striking feature of the data presented in Plate 2 are the high energies of the
both measured and predicted characteristic perpendicular energies for all of the ion species.
There is good agreement between the measured and predicted perpendicular energies for both
the He + (1850 UT) and the O ÷ (1848 UT) ion distributions.
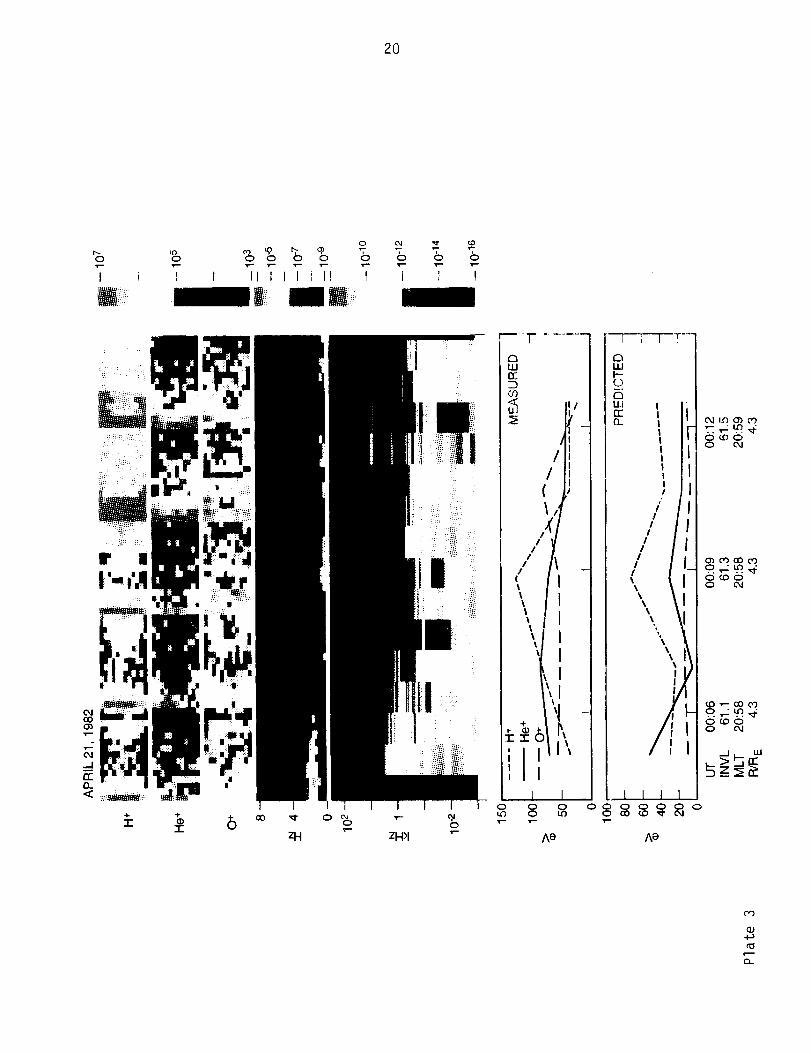
April 21, 1982
This event on April 21, 1982 has been included to show an example of localized ionheating. Plate 3 presents ion and plasma wave data in the same format as Plates 1 and 2.
The plasma wave data in this interval (panels 4 and 5) are less intense than they were in the
two previous examples. The main difference in the plasma wave spectra, however, is the
emission feature near 2 Hz (panel 4), slightly above the He ÷ cyclotron frequency (1 Hz).
The plasma wave emission feature was observed prior to 00:04 UT, but the EICS instrument
was not turned on until 00:04 UT on this day. Emission features in the few Hz range havebeen presented and discussed by Anderson and Fuselier [1994].
A distinct upflowing He + conic distribution can be seen in the postage stamp display
near 00:06 UT in the second color panel of Plate 3. The helium conic correlates well with
the intense line emission in the plasma wave spectrogram near the helium cyclotron
frequency (panel 4) through 00:09 UT. Anderson and Fuselier [1994] have shown that, in
the presence of electromagnetic ion cyclotron waves where the wave frequency approaches
the helium cyclotron frequency, helium ions are strongly heated in a gyroresonant interaction
with the waves. These ions have a characteristic distribution with maximum fluxes occurring
at intermediate pitch angles between the field-aligned and the perpendicular direction. The
April 21 line emission just above the helium cyclotron frequency and the simultaneous
heating of the helium ions at intermediate pitch angles is in good agreement with the results
of the Anderson and Fuselier study.
Here we focus on the relationship between the observed ion energy perpendicular to
the magnetic field to see if the observed energies are consistent with those predicted by the
ICRH theory. Detailed examination of contour plots from the five intervals for which
48-second EICS accumulations were obtained shows that superimposed on the warm (greater
than 1 keV) quasi-isotropic H +, O ÷ and He ÷ distributions are well-defined, low energy (< 1
keV) ion conic distributions. The characteristic perpendicular energies obtained from these
contours are presented in panel 6 of Plate 3.
The interval presented in Plate 3 is at a slightly lower latitude and earlier local time
than the previous two examples. The ion distributions displayed in the top three panels are
more characteristic of those found in the plasmapause region than the auroral region, as
evidenced by the lack of a distinct signature of low energy (just above the 10 eV EICS
energy threshold) ions flowing up magnetic field lines. The Dynamics Explorer
magnetometer data for this interval show a large-scale, downward, field-aligned current from
00:03:30 UT to approximately 00:09:30 UT. From 00:09:30 UT to 00:11:45 UT, the
12
current was slightly more intense and upward. After 00:11:45 UT, a downward current
sheet of similar intensity was observed. It is interesting to note that the boundaries of these
weak, field-aligned currents occur at the same time as intensifications in the low frequency
(< 8 Hz) plasma wave spectra.
The most striking feature of the data presented in Plate 3 is the apparent agreement
between the measured and predicted H + perpendicular energies between 00:07 UT and 00:11
UT, compared with the apparent disagreement for He + and O +. The ICRH hypothesis for
He + ions in gyroresonant interaction with the electromagnetic ion cyclotron waves applies to
broad spectral peaks with wave amplitude and frequency variation independent of altitude,
assumptions not valid for line emission events.
HI. DISCUSSION AND CONCLUSIONS
We have tested the importance of the ion cyclotron heating mechanism in the
magnetosphere by using ion mass spectrometer data and wave observations from the
Dynamics Explorer 1 satellite. As in earlier investigations, we find that the ICRH
mechanism seems to be an important ion energization mechanism in the magnetosphere. In
the events we have studied, there is general correlation between the waves around the ion
cyclotron frequencies and the observed ion heating. The wave amplitudes during these
events are large enough to cause the observed ion energies. The ICRI-I mechanism has been
tested in previous studies, typically for the heating of O + ions, and has been shown to be a
viable heating mechanism in the auroral regions. In this study, we have investigated the
simultaneous heating of three ion species, H +, He + and O +. We have been able to show that
the observed wave amplitudes in three different frequency ranges are sufficient to produce
the observed ion heating in two of the three events.
During the fu'st two events when all three ion species are heated, there is enough
wave power around all three cyclotron frequencies to produce the observed heating, although
the predicted and measured ion energies are not consistently comparable in detail for all three
ion species. On April 21, 1982 only He + is heated and there is significant wave power only
around the He + cyclotron frequency. And, although the comparison of the predicted and
measured ion energies using the ICRH technique are not entirely convincing for this event,
no other obvious energy sources, such as lower hybrid waves, are observed. All of our
observations indicate that the ICRH mechanism is a probable and significant factor in the
observed ion heating during these events.
Although ICRH seems to be a major heating mechanism during these events, several
questions remain. It is not obvious why the different ion species should have approximately
the same energy, often within a factor of two. And there is typically a lot more wave energy
available at the lowest frequencies (around a few Hz) than is necessary for cyclotron
resonance heating of the ions. This would indicate that a smaller fraction of the electric field
spectral density at these frequencies would seem to correspond to left-hand polarized waves.
(We used a conservative fraction of 10% for the left-hand polarized waves in our analysis.)
Or it could suggest that the wave polarization changes with frequency, although the details of
these broadband low-frequency waves are not known.

13
Thereare otherpotentialenergy sources for the observed ion heating and acceleration
in the auroral regions (see references in Crew et al. [1990]). Some frequently observed
sources include particle beams and sharp gradients. However, no obvious local sources are
observed during these three events.
One potential energy source which can complicate efforts to assess the relative
importance of the ion cyclotron heating mechanism are field-aligned currents (FACs). FACs
can generate electrostatic ion cyclotron waves which, in turn, are capable of heating the ions.
Magnetometer data from Dynamics Explorer 1 [Farthing et al., 1981] was examined to locate
and evaluate the strength of the field-aligned current activity during these three events and to
indirectly determine the importance of the ion heating via electrostatic ion cyclotron waves.
Typically the observed ion heating and the low frequency wave amplitudes correlated with
the conic distributions along boundaries between relatively weak, oppositely-directed,
large-scale FACs. The most intense ion heating in the first event, for example, occurs near
a boundary between oppositely-directed, weak (less than 0.5 #A/mE), large-scale FACs.
Relatively intense (greater than 0.5 #A/m E) currents are observed in these same regions but
they are not symmetrically located with respect to the observed wave energy or the ion
transverse energy. This would suggest that the weak currents and the possible presence of
electrostatic ion cyclotron waves would not contribute significantly to the observed ion
heating in the March 23 event.
During the second event, the broad peaks in the characteristic energies of all three ion
species again occur at the boundary between two relatively weak (approximately 0.5 #A/m2),
oppositely-directed, large-scale, field-aligned current systems. Although the currents are not
strong, the boundary between the oppositely-directed currents does correspond to rapid
variations in the wave power in time and frequency for all frequencies greater than 1 Hz.
Only in the oxygen cyclotron frequency range does the wave power remain constant in
magnitude. Since these wave variations occur on short time scales comparable to the time
scales in the EICS ion measurements, the analysis of the observed ion heating in this event
did not provide a definitive test of the ICRH mechanism.
In the third event, neither the large- or small-scale currents identified in the
magnetometer data have features centered on the region of the most intense He +
energization. As discussed previously, this event is an example of localized ion heating by a
plasma wave line emission just above the helium cyclotron frequency. However, the ICRH
technique fails to deliver a solid correlation between the predicted and measured ion energies
because the technique requires broad wave spectral peaks and an assumption that the wave
amplitude and frequency variations are independent of altitude. Since these assumptions are
not valid for line emissions, this event was not a good candidate for the validation of the
ICRH technique, even though ion heating via resonance with the ion cyclotron waves was
certainly indicated by the plasma wave spectrum in the vicinity of the helium cyclotron
frequency.
Many ion energization mechanisms are, in principle, viable mechanisms for producing
the observed ion heating and more than one mechanism is probably operating in the
terrestrial magnetosphere. For example, in addition to the ICRH mechanism, there are
reports of ion energization by wave-particle interactions with lower hybrid waves [Retterer et

14
al., 1986; 1994; Eliasson et al., 1994]. Furthermore, a combination of ICRH and lower
hybrid heating can be important [Andr¢_ et al., 1994].
Since other mechanisms contribute to ion heating in the magnetosphere, it does not
seem to be meaningful to try to identify a single exclusive ion energization mechanism. The
correlation between the observed ion heating in these three examples and the wave energy at
the characteristic ion cyclotron frequency available to cause the ion heating clearly indicates
that the ICRH mechanism is a significant ion heating mechanism in the magnetosphere.
ACKNOWLEDGEMENTS
We wish to thank J. A. Slavin for providing the analysis and interpretation of the
Dynamics Explorer magnetometer data. We also thank J. H. Dowell and Wei Feng for their
work in software development that has been so essential in this study. This research has
been funded by NASA Grant NAGW-3576.
REFERENCES
Anderson, B. J., and S. A. Fuselier, Response of thermal ions to electromagnetic ion
cyclotron waves, J. Geophys. Res., 99. 19,413, 1994.
Andr6, M., H. Koskinen, L. Matson, and R. Erlandson, Local transverse ion energization in
and near the polar cusp, Geophys. Res. Lett., 15, 107, 1988.
Andr6, Mats, G. B. Crew, W. K. Peterson, A. M. Persoon, C. J. Pollock, and M. J.
Engebretson, Ion heating by broadband low-frequency waves in the cusp/cleft, J.
Geophys. Res., 95, 20,809, 1990.
Andr6, M., and T. Chang, Ion heating perpendicular to the magnetic field, in Physics of
Space Plasmas, Vol. 12, Scientific Publishers Inc., Cambridge, MA, 35, 1993.
Andre, Mats, Patrik Norqvist, Andris Vaivads, Lars Eliasson, Olle Norberg, Anders I.
Eriksson and Bengt Holback, Transverse ion energization and wave emissions
observed by the Freja satellite, Geophys. Res. Lett., 21, 1915, 1994.
Burch,. L., Energetic particles and currents: Results from Dynamics Explorer, Rev. Geophys.,
26, 215, 1988.
Chang, T., G. B. Crew, N. Hershkowitz, J. R. Jasperse, J. M. Retterer, and J. D.
Winningham, Transverse acceleration of oxygen ions by electromagnetic ion cyclotron
resonance with broad band left-hand polarized waves, Geophys. Res. Lett., 13, 636,1986.
15
Chang, T., G. B. Crew, and J. M. Retterer, Electromagnetic tornadoes in space: Ion conics
along auroral field lines generated by lower hybrid waves and electromagnetic turbulence
in the ion cyclotron range of frequencies, Computer Physics Communications, 49, 61,1988.
Crew, G. B., Tom Chang, J. M. Retterer, W. K. Peterson, D. A. Gumett, and R. L. Huff, Ion
cyclotron resoname heated conics: Theory and observations, J. Geophys. Res., 95, 3959,1990.
Eliasson, L., M. Andr6, A. Eriksson, P. Norqvist, O. Norberg, R. Lundin, B. Holback, H.
Koskinen, H. Borg, and M. Boehm, Freja observations of heating and precipitation of
positive ions, Geophys. Res. Leg., 21, 1911, 1994.
Farthing, W. H., M. Sugiura, B. G. Ledley, and L. J. Cahill, Jr., Magnetic field observations
on DE-A and DE-B, Space Sci. lnstrum., 5, 551, 1981.
Gurnett, D. A., R. L. Huff, J. D. Menietti, J. L. Burch, J. D. Winningham, and S. D.
Shawhan, Correlated low-frequency electric and magnetic noise along the auroral field
lines, J. Geophys. Res., 89, 8971, 1984.
Horne, R. B., and R. M. Thorne, Ion cyclotron absorption at the second harmonic of the
oxygen gyrofrequency, Geophys. Res. Leg., 17, 2225, 1990.
Johnson, J. R., Tom Chang, G. B. Crew, and Mats Andr6, Equatorially generated ULF waves
as a source for the turbulence associated with ion conics, Geophys. Res. Lett., 16, 1469,1989.
Klumpar, D. M., W. K. Peterson, and E. G. Shelley, Direct evidence for two-stage (bimodal)
acceleration of ionospheric ions, J. Geophys. Res., 89, 19,779, 1984.
Klumpar, D. M., A digest and comprehensive bibliography on transverse auroral ion
acceleration, in Ion Acceleration in the Magnetosphere and Ionosphere, Geophysical
Monograph Series, Vol. 38, ed. by Tom Chang, M. K. Hudson, J. R. Jasperse, R. G.
Johnson, P. M. Kintner, M. Schulz, and G. B. Crew, pp. 389, American Geophysical
Union, Washington, DC, 1986.
Lysak, R. L., Ion Acceleration by wave-particle interaction, in Ion Acceleration in the
Magnetosphere and Ionosphere, Geophysical Monograph Series, Vol. 38, ed. by Tom
Chang, M. K. Hudson, J. R. Jasperse, R. G. Johnson, P. M. Kintner, M. Schulz, and
G. B. Crew, pp. 261, American Geophysical Union, Washington, DC, 1986.
Norqvist, Patrik, Mats Andr6, Lars Eliasson, Anders I. Eriksson, Lars Blomberg, Hermann
Luhr, and James H. Clemmons, Ion cyclotron heating in the dayside magnetosphere, J.
Geophys. Res., Vol. 101, 13,179, 1996.

16
Peterson,W. K., E. G. Shelley, S. A. Boardsen, D. A. Gumett, B. G. Ledley, M Suguira, T.
E. Moore, and J. H. Waite, Transverse ion energization and low-frequency plasma
waves in the mid-altitude auroral zone: A case study, J. Geophys. Res., 93, 11,405,1988.
Peterson, W. K., H. L. Collin, M. F. Doherty, and C. M. Bjorklund, O + and He + restricted
and extended (bi-modal) ion conic distributions, Geophys. Res. Lett., 19, 1439, 1992.
Retterer, J. M., T. Chang, and J. R. Jasperse, Ion acceleration by lower hybrid waves in the
suprauroral region, J. Geophys. Res., 91, 1609, 1986.
Retterer, J. M., T. Chang, G. B. Crew, J. R. Jasperse, and J. D. Winningham, Monte Carlo
modeling of ionospheric oxygen acceleration by cyclotron resonance with broad-band
electromagnetic turbulence, Phys. Rev. Lett., 59, 148, 1987.
Retterer, J. M., T. Chang, and J. R. Jasperse, Particle acceleration by intense auroral VLF
turbulence, in Physics of Space Plasmas, edited by Tom Chang, G. B. Crew and J. R.
Jasperse, Scientific Publishers Inc., Cambridge, MA, 119, 1989.
Retterer, J. M., Tom Chang, and J. R. Jasperse, Transversely accelerated ions in the topside
ionosphere, J. Geophys. Res., 99, 13,189, 1994.
R6nnmark, K., and M. Andr6, Convection of ion cyclotron waves to ion heating regions, J.
Geophys. Res., 96, 17,573, 1991.
Shawhan, S. D., D. A. Gumett, D. L. Odem, R. A. Helliwell, and C. G. Park, The plasma
wave and quasi-static electric field instrument (PWI) for Dynamics Explorer-A, Space
Sci. Instrum., 5, 535, 1981.
Shelley, E. G., D. A. Simpson, T. C. Sanders, E. Hertzberg, H. Balsiger, and A. Ghielmetti,
The energetic ion composition spectrometer (EICS) for the Dynamics Explorer-A, Space
Sci. Instrum., 5, 443, 1981.
Temerin, M., Evidence for a large bulk ion heating region, Geophys. Res. Lett., 13, 1059,1986.
Winningham, J. D. and J. L. Butch, Observation of large scale ion conic generation with DE-1,
in Physics of Space Plasmas (1982-4), SPI Conference Proceedings and Reprint Series,
No. 5, edited by J. Belcher, H. Bridge, T. Chang, B. Coppi, and J. R. Jasperse, pp.
137-158, Scientific Publishers, Inc., Cambridge, MA, 1984.

17
Plate and Figure Captions
Plate 1. Plate 1 summarizes the observed ion distributions and associated plasma wave
activity for the nightside auroral zone crossing in the southern hemisphere on
March 5, 1983. Each of the top three panels displays nine successive, 96-second,
angle-energy flux distributions in a postage stamp format. Ion fluxes are
presented with pitch angles from 0 to 180 degrees and energy from 10 eV/e to
17 keV/e. The fourth color panel presents the wave power spectral density from
0 to 8 Hz obtained from the Fourier analysis of the time series dc electric field
measurements. The fifth color panel presents the PWI electric field
measurements from 1 Hz to 410 kHz with the plasma wave spectral density
encoded in the color bar. The bottom two panels display the characteristic ion
energy perpendicular to the magnetic field inferred from the measured ion
distribution function (sixth panel) and the predicted perpendicular energy
calculated from characteristics of the plasma wave power spectrum (bottom
panel). The data indicate a good correlation between the measured and predicted
He + characteristic perpendicular energies between 23:48 UT and 23:52 UT.
Plate 2. Plate 2 presents the ion and plasma wave data and the inferred characteristic ion
energies in the same format as Plate 1 for an auroral zone crossing near local
midnight in the northern hemisphere on February 16, 1982. The data indicate
high characteristic perpendicular energies for all three ion species and a good
correlation between the measured and predicted perpendicular energies for bothHe + at 1850 UT and O ÷ at 1848 UT.
Plate 3. Plate 3 presents the ion and plasma wave data and the inferred characteristic ion
energies in the same format as Plate 1 for a nightside auroral zone crossing in the
northern hemisphere on April 21, 1982. The data indicate a good correlation
between the measured and predicted H + perpendicular energies from 00:07 UT
until 00:11 LIT, but poor correlations for the He + and O + measured and predicted
perpendicular energies.
Figure 1. Figure 1 presents representative plasma wave spectra and He+ distribution
functions for three specific 48-second intervals centered on 23:45:24 UT,
23:47:00 UT and 23:48:36 UT for the nightside auroral zone crossing on March5, 1983.


18
H +
He+
MARCH 5, 1983
r | % ,...L. = %"._'11_ ",4i : _.' ' _ •
4 _._:_ i:,-_r _:_ I_41......P._J=L_..... ....-_ .
0 +
102
10-2
120 1 H+
He+
80 O+
o I ..... T"
m
10.10
_ 10-12
_ 10-14
_ 10-16
_ MEASURED t
I
I _,.s "_- "% 1
120 ......-" ",, .,......... .....,...,PREDICTED
-" ".---._ _ "1""-" _ I' -q -- -" "" "\'''40
0 I 1
UT 23:42 23:45 23:48 23:51 23:54INVL 64.3 63.2 62.1 60.8 59.5MLT 23:58 23:00 23:03 23:05 23:08
R/R E 3.1 3.0 2.9 2.8 2.7
Plate 1
6015/11:-5


19
o
I
O
O O Oo _o _' _' '_
i I II I I I I II I
_ |!! I
o o _b
i I I
ZH_l0
I I I
aLUn"
) I,, I] I
II
/
I
I
I
I
_ V
I
I',II
o0CXl
Ii
I!
!IIII/
'\6\1,I \\II 1
O
O
A_
1 I I I I
aI.UI--
ILl In-
jf/
I
I/
I/
]t
i
, // /,,(
,, \
_ ,
Oo O O O
O O O
A_
t_o
_O_
W

2O
o.,i--
I
o o o
I I q_ i
O
I=- 'I--
I I i II IT--
i
7"OI-=,
,,..-
I...-
I
I' III-l'A |
iili
o oo
#
/!IIIIIII
I
i
/I I I Ioo_
AO
0
o_oo
o_oo
o_oo
co
(1}4-}
C_.


21
10 A
10 _
N
o !03n
10 .7
10 _0.1
MARCH 5, 1983
o He_(_)"'"2-'-72Z--__.__
1_ 23:45:24........ _/ -'('_\ "-"'_v_'"""
__ Q 23:47:00 \_12
Q 23:48:36 1
I I I I I I I I] I I I I I I I I
1.0 10.0
FREQUENCY (Hz)
3OO
_o
Q.
>
-30O-300
_""-. i_. "'"_ ..
°°"°°M oO°-°-'°'_°
3000
VpERP (Km/s)
300
o
>
-300
Q
-300 0 300
VpERP (Kin/s)
3OO
_orr<Q.
>
-3OO-300 0 300
VpERP (Km/s)
Figure 1
6015/F-1