Embed Size (px)
Citation preview

Multi-spectral mapping of in-vivo skin hemoglobin and melanin
Dainis Jakovels, Janis Spigulis, and Inga Saknite Bio-optics and Fiber Optics Laboratory, Institute of Atomic Physics and Spectroscopy,
University of Latvia, Raina Blvd 19, LV – 1586, Latvia
ABSTRACT The multi-spectral imaging technique has been used for distant mapping of in-vivo skin chromophores by analyzing spectral data at each reflected image pixel and constructing 2-D maps of the relative concentrations of oxy-/deoxy-hemoglobin and melanin. Instead of using a broad visible-NIR spectral range, this study focuses on narrowed spectral band 500–700 nm, so speeding-up the signal processing procedure. Regression analysis confirmed that superposition of three Gaussians is optimal analytic approximation for the oxy-hemoglobin absorption tabular spectrum in this spectral band, while superposition of two Gaussians fits well for deoxy-hemoglobin absorption and exponential function - for melanin absorption. The proposed approach was clinically tested for three types of in-vivo skin provocations – ultraviolet irradiance, chemical reaction with vinegar essence and finger arterial occlusion. Spectral range 500–700 nm provided better sensitivity to oxy-hemoglobin changes and higher response stability to melanin than two reduced ranges 500–600 nm and 530–620 nm.
Keywords: multi-spectral imaging, hemoglobin, melanin, skin chromophore mapping
1. INTRODUCTION The mapping of in-vivo skin chromophores is based on multi-spectral imaging that combines spectral analysis of diffusely reflected light and image analysis, resulting in 2-D maps of the relative concentrations of chromophores, e.g. oxy-/deoxy-hemoglobin and melanin [1, 2]. Such mapping ensures reliable non-invasive evaluation of skin condition [3, 4, 5]. The least-squares regression analysis of a broad visible-NIR spectral range was successfully used to estimate the chromophore content in skin [2, 6]. A drawback of this technique is time-consuming (proportional to the quantity of spectral information) data acquisition and processing; narrowing of the working spectral range can speed-up the procedure. However, there is a risk to loose specificity and sensitivity to the main skin chromophores, therefore optimal spectral range for skin chromophore mapping should be found [7]. For instance, potential of the reduced spectral range 525–645 nm for imaging of skin hemoglobin oxygen saturation has been demonstrated recently [8]. The third main skin chromophore – melanin – could not be mapped since the measurements were taken for palm skin.
The present study continues examination [9] of specific spectral intervals from the point of applicability for simultaneous distant mapping of three main in-vivo skin chromophores - oxy-hemoglobin, deoxy-hemoglobin and melanin.
2. EXPERIMENTAL 2.1. Data acquisition
The multi-spectral imaging system Nuance 2.4 (Cambridge Research & Instrumentation, Inc., USA) in connection with PC was used for spectral imaging of in-vivo skin (Figure 1a). 24 white warm LED ring source was created to achieve uniform illumination at optimal working distance 15…20 cm. Linear polarizer was placed in front of the light source and orientated orthogonally to the built-in polarizer of Nuance, so reducing the specular reflectance of skin [10].
Skin area under the study was 50x35 mm. 4x4 pixel binning was used to increase detector matrix sensitivity that speeded up image cube acquisition process but reduced spatial resolution to 0.15x0.15 mm (the pixel size). As the least-squares regression analysis applied in imaging is a time consuming process, the appropriate spatial resolution for data processing was found to be 0.75x0.75 mm.
Due to spectrally different illumination intensity and system sensitivity, various exposure times (3…50 ms) were used for each image acquisition. The total 21 image cube (spectral range 500 – 700 nm, step 10 nm) acquisition process took less then 10 s, with spectral resolution 10 nm (bandwidth of the Nuance liquid crystal tunable filter).
Biophotonics: Photonic Solutions for Better Health Care II, edited by Jürgen Popp,Wolfgang Drexler, Valery V. Tuchin, Dennis L. Matthews, Proc. of SPIE Vol. 7715, 77152Z
© 2010 SPIE · CCC code: 1605-7422/10/$18 · doi: 10.1117/12.853928
Proc. of SPIE Vol. 7715 77152Z-1
Downloaded from SPIE Digital Library on 01 Feb 2011 to 85.254.232.20. Terms of Use: http://spiedl.org/terms
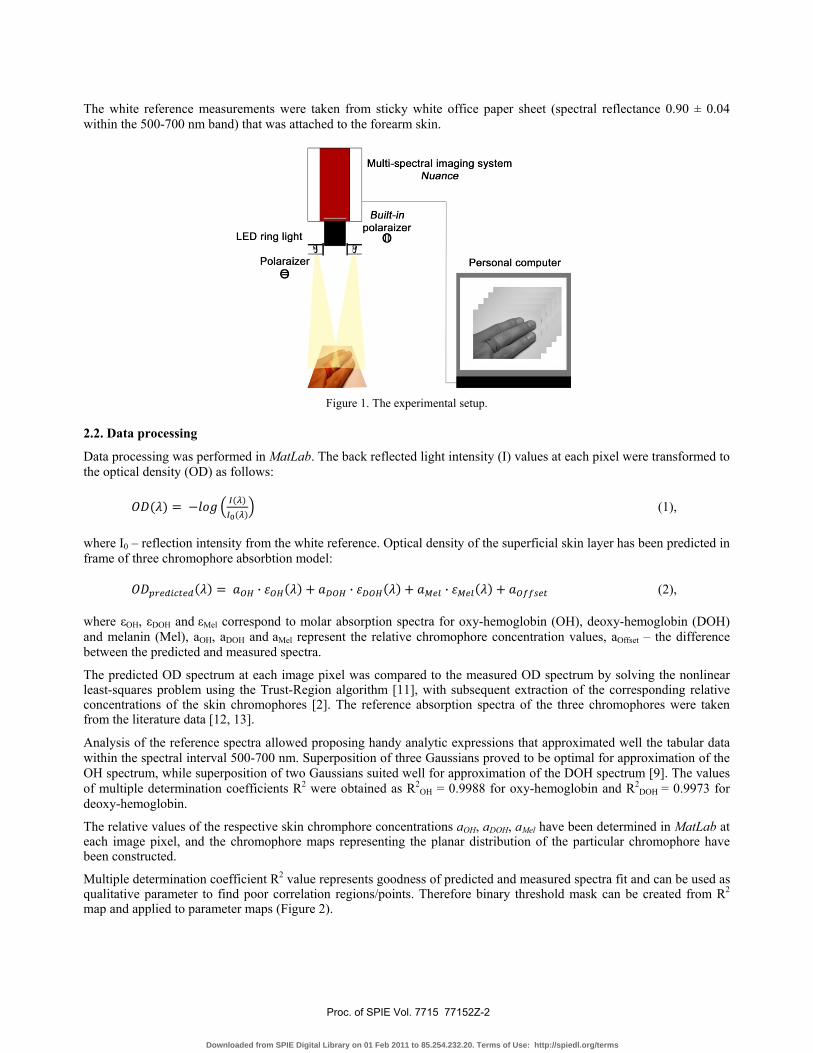
The white reference measurements were taken from sticky white office paper sheet (spectral reflectance 0.90 ± 0.04 within the 500-700 nm band) that was attached to the forearm skin.
Figure 1. The experimental setup.
2.2. Data processing
Data processing was performed in MatLab. The back reflected light intensity (I) values at each pixel were transformed to the optical density (OD) as follows: (1), where I0 – reflection intensity from the white reference. Optical density of the superficial skin layer has been predicted in frame of three chromophore absorbtion model: · · · (2), where εOH, εDOH and εMel correspond to molar absorption spectra for oxy-hemoglobin (OH), deoxy-hemoglobin (DOH) and melanin (Mel), aOH, aDOH and aMel represent the relative chromophore concentration values, aOffset – the difference between the predicted and measured spectra.
The predicted OD spectrum at each image pixel was compared to the measured OD spectrum by solving the nonlinear least-squares problem using the Trust-Region algorithm [11], with subsequent extraction of the corresponding relative concentrations of the skin chromophores [2]. The reference absorption spectra of the three chromophores were taken from the literature data [12, 13].
Analysis of the reference spectra allowed proposing handy analytic expressions that approximated well the tabular data within the spectral interval 500-700 nm. Superposition of three Gaussians proved to be optimal for approximation of the OH spectrum, while superposition of two Gaussians suited well for approximation of the DOH spectrum [9]. The values of multiple determination coefficients R2 were obtained as R2
OH = 0.9988 for oxy-hemoglobin and R2DOH = 0.9973 for
deoxy-hemoglobin.
The relative values of the respective skin chromphore concentrations aOH, aDOH, aMel have been determined in MatLab at each image pixel, and the chromophore maps representing the planar distribution of the particular chromophore have been constructed.
Multiple determination coefficient R2 value represents goodness of predicted and measured spectra fit and can be used as qualitative parameter to find poor correlation regions/points. Therefore binary threshold mask can be created from R2 map and applied to parameter maps (Figure 2).
Proc. of SPIE Vol. 7715 77152Z-2
Downloaded from SPIE Digital Library on 01 Feb 2011 to 85.254.232.20. Terms of Use: http://spiedl.org/terms
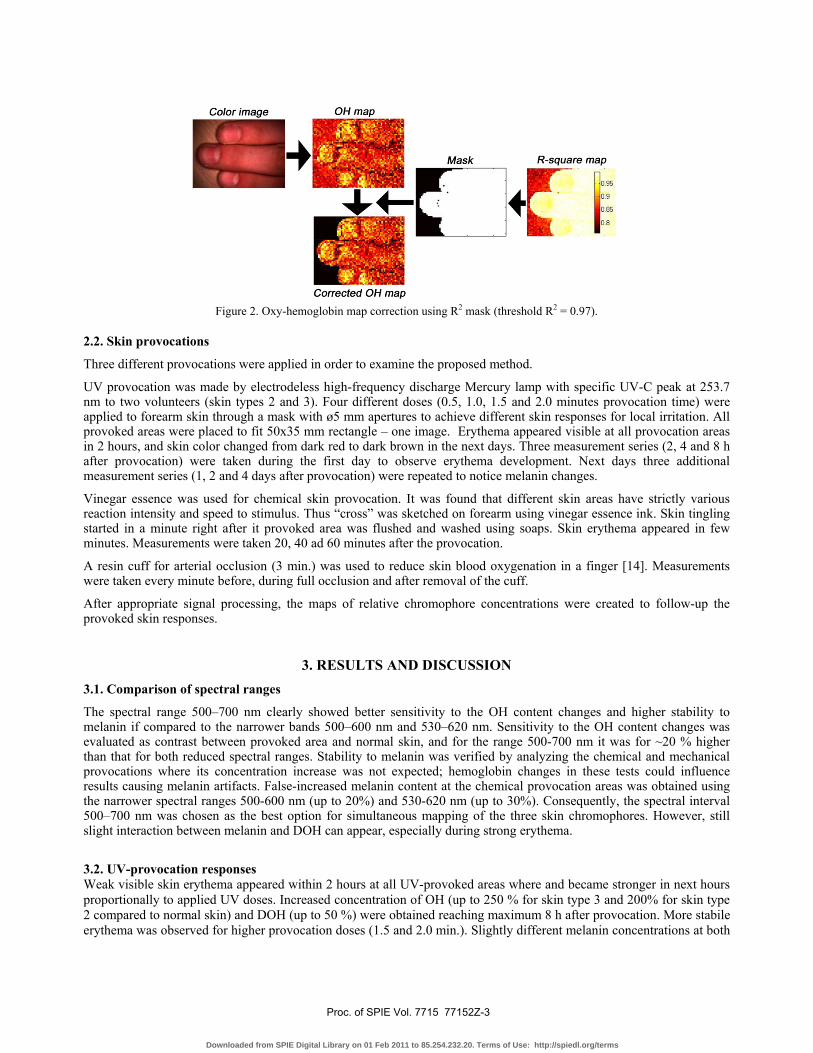
Figure 2. Oxy-hemoglobin map correction using R2 mask (threshold R2 = 0.97).
2.2. Skin provocations
Three different provocations were applied in order to examine the proposed method.
UV provocation was made by electrodeless high-frequency discharge Mercury lamp with specific UV-C peak at 253.7 nm to two volunteers (skin types 2 and 3). Four different doses (0.5, 1.0, 1.5 and 2.0 minutes provocation time) were applied to forearm skin through a mask with ø5 mm apertures to achieve different skin responses for local irritation. All provoked areas were placed to fit 50x35 mm rectangle – one image. Erythema appeared visible at all provocation areas in 2 hours, and skin color changed from dark red to dark brown in the next days. Three measurement series (2, 4 and 8 h after provocation) were taken during the first day to observe erythema development. Next days three additional measurement series (1, 2 and 4 days after provocation) were repeated to notice melanin changes.
Vinegar essence was used for chemical skin provocation. It was found that different skin areas have strictly various reaction intensity and speed to stimulus. Thus “cross” was sketched on forearm using vinegar essence ink. Skin tingling started in a minute right after it provoked area was flushed and washed using soaps. Skin erythema appeared in few minutes. Measurements were taken 20, 40 ad 60 minutes after the provocation.
A resin cuff for arterial occlusion (3 min.) was used to reduce skin blood oxygenation in a finger [14]. Measurements were taken every minute before, during full occlusion and after removal of the cuff.
After appropriate signal processing, the maps of relative chromophore concentrations were created to follow-up the provoked skin responses.
3. RESULTS AND DISCUSSION 3.1. Comparison of spectral ranges
The spectral range 500–700 nm clearly showed better sensitivity to the OH content changes and higher stability to melanin if compared to the narrower bands 500–600 nm and 530–620 nm. Sensitivity to the OH content changes was evaluated as contrast between provoked area and normal skin, and for the range 500-700 nm it was for ~20 % higher than that for both reduced spectral ranges. Stability to melanin was verified by analyzing the chemical and mechanical provocations where its concentration increase was not expected; hemoglobin changes in these tests could influence results causing melanin artifacts. False-increased melanin content at the chemical provocation areas was obtained using the narrower spectral ranges 500-600 nm (up to 20%) and 530-620 nm (up to 30%). Consequently, the spectral interval 500–700 nm was chosen as the best option for simultaneous mapping of the three skin chromophores. However, still slight interaction between melanin and DOH can appear, especially during strong erythema.
3.2. UV-provocation responses Weak visible skin erythema appeared within 2 hours at all UV-provoked areas where and became stronger in next hours proportionally to applied UV doses. Increased concentration of OH (up to 250 % for skin type 3 and 200% for skin type 2 compared to normal skin) and DOH (up to 50 %) were obtained reaching maximum 8 h after provocation. More stabile erythema was observed for higher provocation doses (1.5 and 2.0 min.). Slightly different melanin concentrations at both
Proc. of SPIE Vol. 7715 77152Z-3
Downloaded from SPIE Digital Library on 01 Feb 2011 to 85.254.232.20. Terms of Use: http://spiedl.org/terms
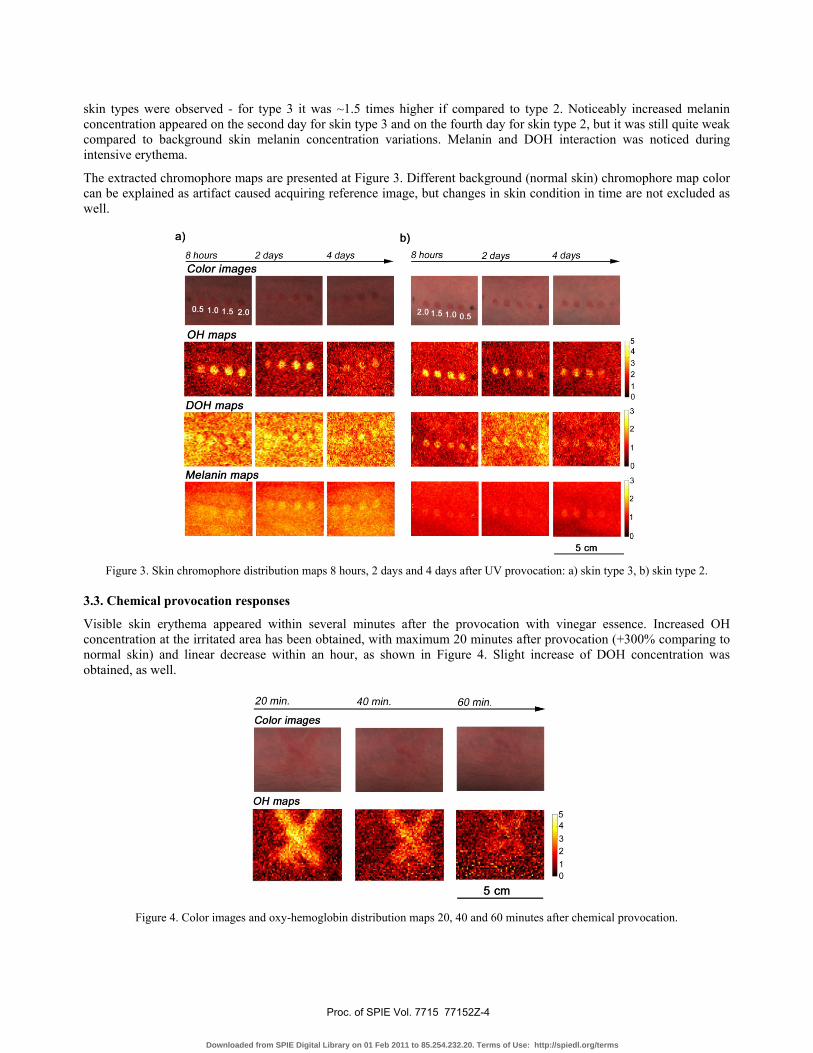
skin types were observed - for type 3 it was ~1.5 times higher if compared to type 2. Noticeably increased melanin concentration appeared on the second day for skin type 3 and on the fourth day for skin type 2, but it was still quite weak compared to background skin melanin concentration variations. Melanin and DOH interaction was noticed during intensive erythema.
The extracted chromophore maps are presented at Figure 3. Different background (normal skin) chromophore map color can be explained as artifact caused acquiring reference image, but changes in skin condition in time are not excluded as well.
Figure 3. Skin chromophore distribution maps 8 hours, 2 days and 4 days after UV provocation: a) skin type 3, b) skin type 2.
3.3. Chemical provocation responses
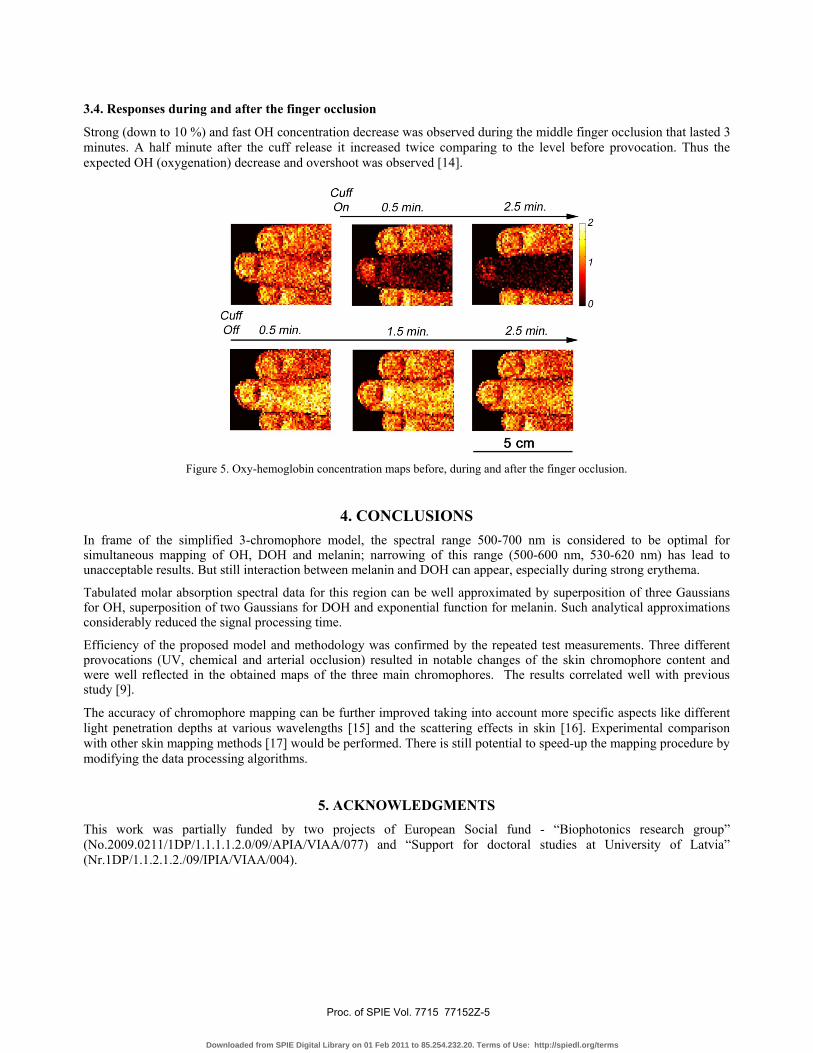
Visible skin erythema appeared within several minutes after the provocation with vinegar essence. Increased OH concentration at the irritated area has been obtained, with maximum 20 minutes after provocation (+300% comparing to normal skin) and linear decrease within an hour, as shown in Figure 4. Slight increase of DOH concentration was obtained, as well.
Figure 4. Color images and oxy-hemoglobin distribution maps 20, 40 and 60 minutes after chemical provocation.
Proc. of SPIE Vol. 7715 77152Z-4
Downloaded from SPIE Digital Library on 01 Feb 2011 to 85.254.232.20. Terms of Use: http://spiedl.org/terms
3.4. Responses during and after the finger occlusion
Strong (down to 10 %) and fast OH concentration decrease was observed during the middle finger occlusion that lasted 3 minutes. A half minute after the cuff release it increased twice comparing to the level before provocation. Thus the expected OH (oxygenation) decrease and overshoot was observed [14].
Figure 5. Oxy-hemoglobin concentration maps before, during and after the finger occlusion.
4. CONCLUSIONS In frame of the simplified 3-chromophore model, the spectral range 500-700 nm is considered to be optimal for simultaneous mapping of OH, DOH and melanin; narrowing of this range (500-600 nm, 530-620 nm) has lead to unacceptable results. But still interaction between melanin and DOH can appear, especially during strong erythema.
Tabulated molar absorption spectral data for this region can be well approximated by superposition of three Gaussians for OH, superposition of two Gaussians for DOH and exponential function for melanin. Such analytical approximations considerably reduced the signal processing time.
Efficiency of the proposed model and methodology was confirmed by the repeated test measurements. Three different provocations (UV, chemical and arterial occlusion) resulted in notable changes of the skin chromophore content and were well reflected in the obtained maps of the three main chromophores. The results correlated well with previous study [9].
The accuracy of chromophore mapping can be further improved taking into account more specific aspects like different light penetration depths at various wavelengths [15] and the scattering effects in skin [16]. Experimental comparison with other skin mapping methods [17] would be performed. There is still potential to speed-up the mapping procedure by modifying the data processing algorithms.
5. ACKNOWLEDGMENTS This work was partially funded by two projects of European Social fund - “Biophotonics research group” (No.2009.0211/1DP/1.1.1.1.2.0/09/APIA/VIAA/077) and “Support for doctoral studies at University of Latvia” (Nr.1DP/1.1.2.1.2./09/IPIA/VIAA/004).
Proc. of SPIE Vol. 7715 77152Z-5
Downloaded from SPIE Digital Library on 01 Feb 2011 to 85.254.232.20. Terms of Use: http://spiedl.org/terms
REFERENCES [1] Stamatas, G. N., Kollias, N., “In vivo documentation of cutaneous inflammation using spectral imaging,” J
Biomed Opt 12(5), 051603 (2007).
[2] Ilias, M. A., Haggblad, E., Anderson, C., “Visible, hyperspectral imaging evaluating the cutaneous response to ultraviolet radiation,” Proc. SPIE 6441, 644103 (2007).
[3] Randeberg, L. L., Winnem, A. M., Langlois, N. E., “Skin changes following minor trauma,” Laser Surg Med, 39(5), 403-413 (2007).
[4] Balas, C., Themelis, G., Papadakis, A., “A Novel-Spectral Imaging System: Application on in-vivo Detection and Grading of Cervical Precancers and of Pigmented Skin Lesions,” In Proc. of "Computer Vision Beyond the Visible Spectrum" CVBVS'01 Workshop, Hawaii, USA, Dec. (2001).
[5] Vogel, A., Chernomordik, V. V., Demos, S. G., “Using noninvasive multispectral imaging to quantitatively assess tissue vasculature,” J Biomed Opt 12(5), 051604 (2007).
[6] Zonios, G., Bykowski, J., Kollias, N., “Skin, melanin, haemoglobin, and light scattering properties can be quantitatively assessed in vivo using diffuse reflectance spectroscopy,” J Invest Dermatol 117(6), p. 1452-7 (2001).
[7] Eames, M. E., Wang, J., Pogue, B. W., “Wavelength band optimization in spectral near-infrared optical tomography improves accuracy while reducing data acquisition and computational burden,” J Biomed Opt 13(5), 054037 (2008).
[8] Zuzak, K. J., Gladwin, M. T., Cannon III, R. O., “Imaging haemoglobin oxygen saturation in sickle cell disease patients using noninvasive visible reflectance hyperspectral techniques: effects of nitric oxide,” Am J Physiol Heart Circ Physiol 285, H1183-1189, (2003).
[9] Jakovels, D., Spigulis, J., “2-D mapping of skin chromophores in the spectral range 500-700 nm,” J Biophoton 3, 125-129 (2010).
[10] Demos, S. G. and Alfano, R. R., “Optical polarization imaging”, App Opt 36(1), 150-155 (1997). [11] Byrd, R. H., Schnabel, R. B., Schultz, G. A., “A trust region algorithm for nonlinearly constrained
optimization,” SIAM J. Numer. Anal. 24, 1152-1170 (1987).
[12] Prahl, S., “Tabulated Molar Extinction Coefficient for Hemoglobin in Water,” http://omlc.ogi.edu/spectra/hemoglobin/summary.html, Last access: March, 2010.
[13] Jacques, S. L., “Extinction coefficient of melanin,” http://omlc.ogi.edu/spectra/melanin/eumelanin.html, Last access: March, 2010.
[14] Clark, D. J., Essex, T. J. H., Cater, B., “Skin oxygen saturation imager,” Adv Exp Med Biol 428, 573-577 (1997).
[15] Arridge, S. R., Hiroaka, M. and Schweiger, M., “Statistical basis for the determination of optical pathlength in tissue,” Phys Med Biol 40(9), 1539-1558 (1995).
[16] Kiseleva, I. A., Sinichkin, Y. P., “The apparent optical density of the scattering medium: influence of scattering,” Proc. SPIE 4707, 223-227 (2002).
[17] Dolotov, L. E., Kiseleva, I. A., Sinichkin, Y. P., “Digital imaging of human skin,” Proc. SPIE 5067, 139-147 (2003).
Proc. of SPIE Vol. 7715 77152Z-6
Downloaded from SPIE Digital Library on 01 Feb 2011 to 85.254.232.20. Terms of Use: http://spiedl.org/terms