Embed Size (px)
Citation preview
© NYC Teaching Fellows 2014
Multi-Subject CST Mathematics
PreparationCompetency 0003.2- Data, Statistics, and Probability
Feb 2017
/ 2
Agenda
Introduction to Competency
Content Review and Sample Problems
Additional Practice
/ 3
Performance Expectations
The New York State Grade 7–Grade 12 Multi-Subject teacher
• Demonstrates knowledge of fundamental statistical concepts and their
applications, works with and interprets data, uses measures of center and
variability, and draws inferences from data distributions
• Demonstrates knowledge of concepts associated with random sampling and
random processes and methods for drawing valid conclusions.
• Calculates probabilities and understands how probability and statistics can be
used to make decisions.
Introduction to Competency 0002- STATISTICS
New York State Education Department
/ 4
3.2 Data, Statistics, and Probability
• Summarizes, represents, and interprets data on a single count or measurement variable (e.g., uses number lines, dot plots, histograms, and box plots; analyzes data plots in terms of mean, median, interquartile range, standard deviation, and outliers)
• Summarizes, represents, and interprets data on two categorical and quantitative variables (e.g., using two-way frequency tables and scatter plots, analyzing trends, fitting functions to data, plotting and analyzing residuals)
• Interprets linear models, including the slope and intercepts; interprets the correlation coefficient of a linear fit; and distinguishes between correlation and causation
• Understands and evaluates random processes underlying statistical experiments (e.g., making inferences about population parameters from a single sample, using and analyzing data-generating processes such as simulations)
• Makes inferences and justifies conclusions from sample surveys, experiments, and observation studies
• Understands independence and conditional probability and uses them to interpret data
• Uses the rules of probability to compute probabilities of compound events in a uniform probability model (e.g., conditional probability, addition rule)
• Uses probability to make decisions (e.g., calculating expected values and using them to solve problems, using probability to evaluate outcomes of problems)
Introduction to Competency 0003.2- Data, Statistics, and Probability
New York State Education Department
/ 5
Agenda
Introduction to Competency
Content Review and Sample Problems
Additional Practice
/ 6
Representing data
• What is data?
o Data is a collection of facts, such as numbers, words, measurements,
observations or even just descriptions of things.
It can be QUALITATIVE (descriptive) or QUANTIFTATIVE (numerical)
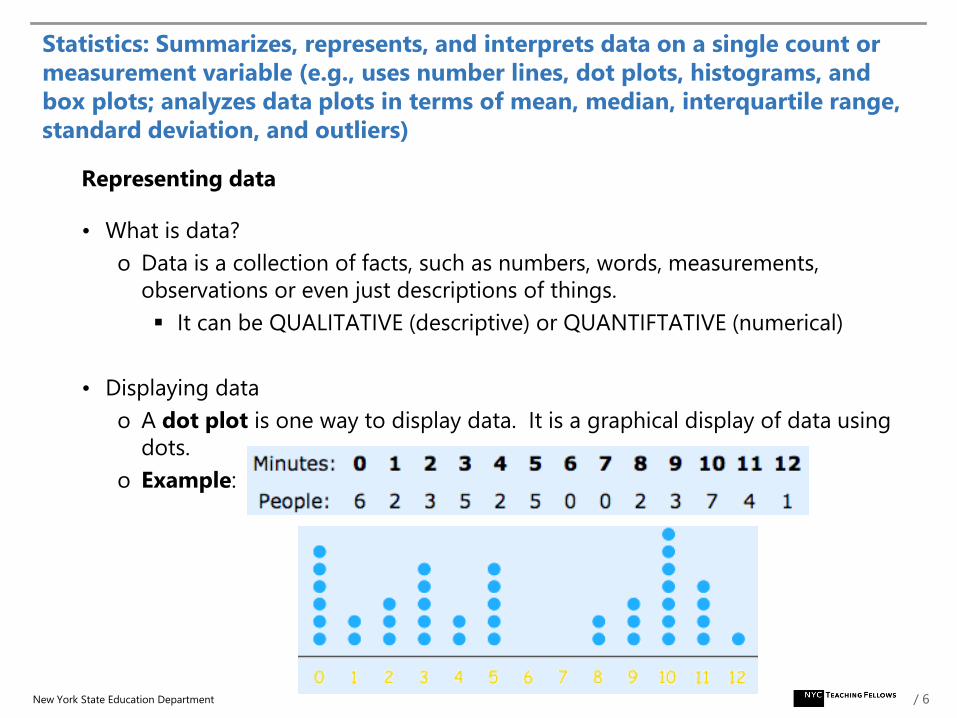
• Displaying data
o A dot plot is one way to display data. It is a graphical display of data using
dots.
o Example:
Statistics: Summarizes, represents, and interprets data on a single count or
measurement variable (e.g., uses number lines, dot plots, histograms, and
box plots; analyzes data plots in terms of mean, median, interquartile range,
standard deviation, and outliers)
New York State Education Department
/ 7
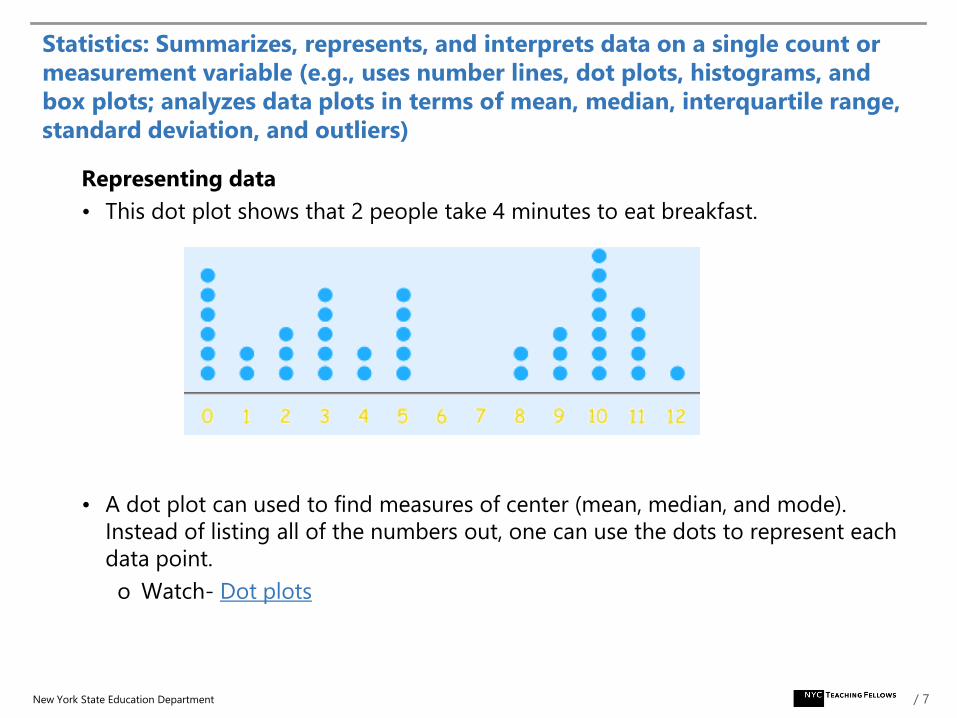
Representing data
• This dot plot shows that 2 people take 4 minutes to eat breakfast.
• A dot plot can used to find measures of center (mean, median, and mode).
Instead of listing all of the numbers out, one can use the dots to represent each
data point.
o Watch- Dot plots
Statistics: Summarizes, represents, and interprets data on a single count or
measurement variable (e.g., uses number lines, dot plots, histograms, and
box plots; analyzes data plots in terms of mean, median, interquartile range,
standard deviation, and outliers)
New York State Education Department
/ 8
Representing data
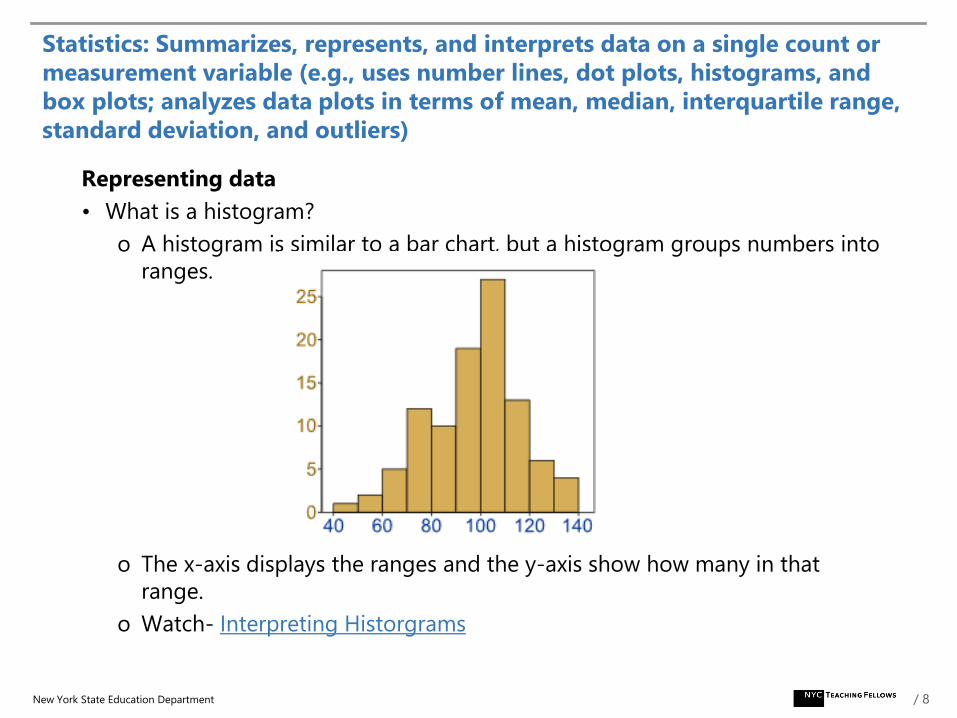
• What is a histogram?
o A histogram is similar to a bar chart, but a histogram groups numbers into
ranges.
o The x-axis displays the ranges and the y-axis show how many in that
range.
o Watch- Interpreting Historgrams
Statistics: Summarizes, represents, and interprets data on a single count or
measurement variable (e.g., uses number lines, dot plots, histograms, and
box plots; analyzes data plots in terms of mean, median, interquartile range,
standard deviation, and outliers)
New York State Education Department
/ 9
Organizing Data
o Measure of Central Tendency are numerical values that describes a data set by providing a “central” or “typical” value of the data set. There are three measures of central tendency that you need to know about…
Mean (average) – sum of the data values divided by the number of data values in the set.
Median – literally, the middle values, or average of the two middle value (of even-numbered sets)
Mode – the value(s) that occur most frequently in a set.
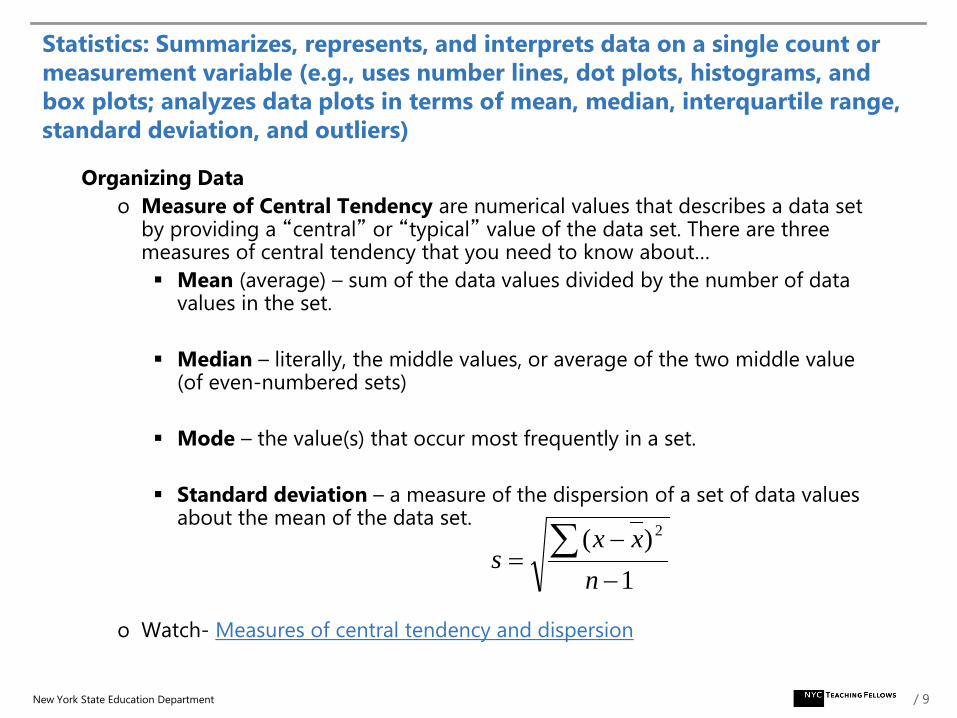
Standard deviation – a measure of the dispersion of a set of data values about the mean of the data set.
o Watch- Measures of central tendency and dispersion
Statistics: Summarizes, represents, and interprets data on a single count or
measurement variable (e.g., uses number lines, dot plots, histograms, and
box plots; analyzes data plots in terms of mean, median, interquartile range,
standard deviation, and outliers)
New York State Education Department
1
)( 2
n
xxs
/ 10
Representing data
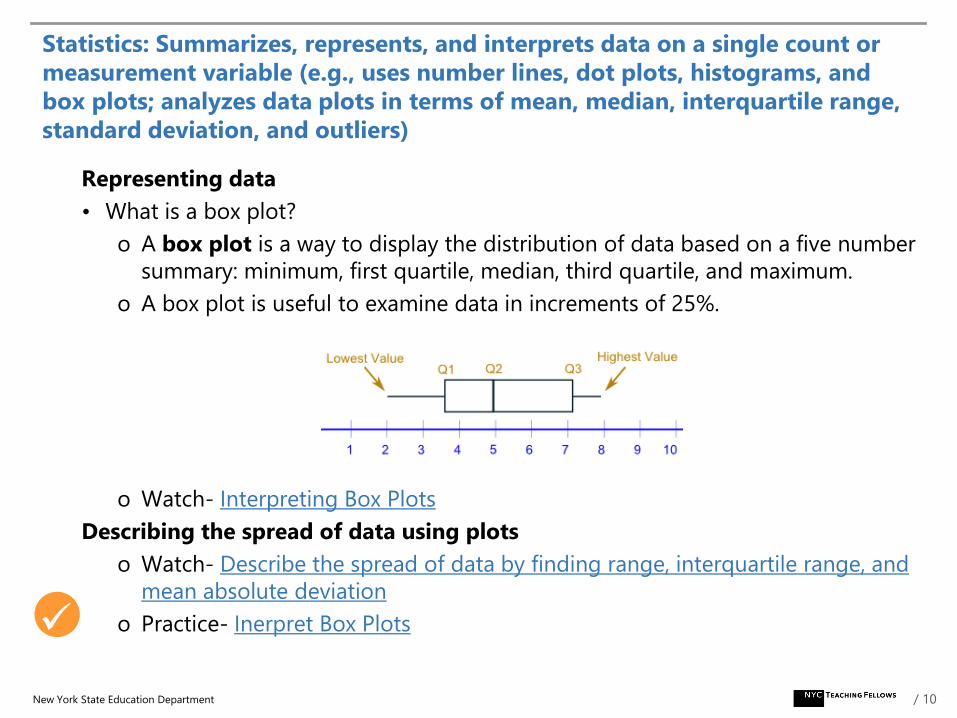
• What is a box plot?
o A box plot is a way to display the distribution of data based on a five number
summary: minimum, first quartile, median, third quartile, and maximum.
o A box plot is useful to examine data in increments of 25%.
o Watch- Interpreting Box Plots
Describing the spread of data using plots
o Watch- Describe the spread of data by finding range, interquartile range, and
mean absolute deviation
o Practice- Inerpret Box Plots
Statistics: Summarizes, represents, and interprets data on a single count or
measurement variable (e.g., uses number lines, dot plots, histograms, and
box plots; analyzes data plots in terms of mean, median, interquartile range,
standard deviation, and outliers)
New York State Education Department
/ 11
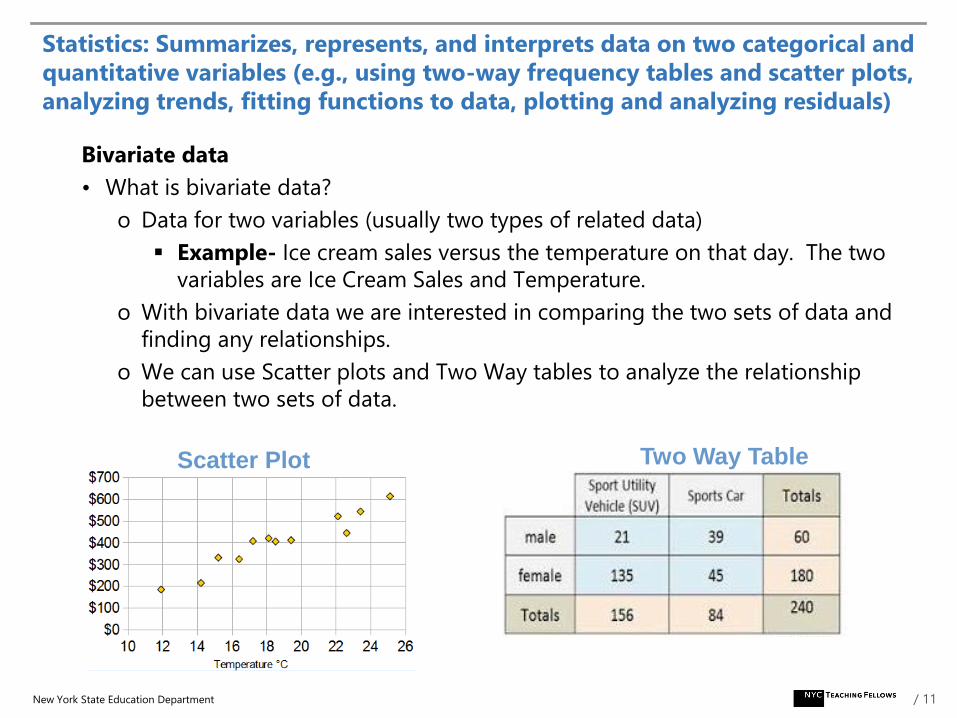
Bivariate data
• What is bivariate data?
o Data for two variables (usually two types of related data)
Example- Ice cream sales versus the temperature on that day. The two
variables are Ice Cream Sales and Temperature.
o With bivariate data we are interested in comparing the two sets of data and
finding any relationships.
o We can use Scatter plots and Two Way tables to analyze the relationship
between two sets of data.
Statistics: Summarizes, represents, and interprets data on two categorical and
quantitative variables (e.g., using two-way frequency tables and scatter plots,
analyzing trends, fitting functions to data, plotting and analyzing residuals)
New York State Education Department
Scatter Plot Two Way Table
/ 12
Bivariate data
Statistics: Summarizes, represents, and interprets data on two categorical and
quantitative variables (e.g., using two-way frequency tables and scatter plots,
analyzing trends, fitting functions to data, plotting and analyzing residuals)
New York State Education Department
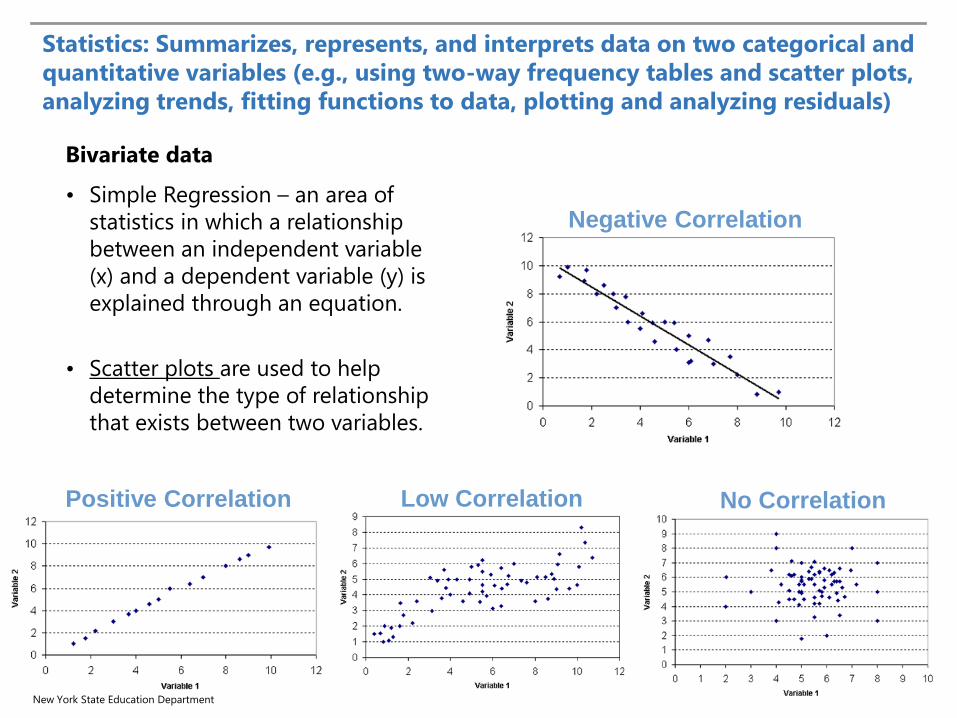
• Simple Regression – an area of
statistics in which a relationship
between an independent variable
(x) and a dependent variable (y) is
explained through an equation.
• Scatter plots are used to help
determine the type of relationship
that exists between two variables.
Positive Correlation
Negative Correlation
Low Correlation No Correlation
/ 13
Bivariate data
• Line of best fit – the line that fits the data best and is given by the equation: y = ax + b, where a and b are the regression coefficients.
• Correlation Coefficient, r – a numerical measure that describes the strength of the linear relationship between the two variables under consideration.
o Your Correlation Coefficient ranges between the values -1 and 1
If r = –1, then we have a perfect negative correlation
If r = 1, then we have a perfect positive correlation
If r = 0, then there is no correlation
• Can use your graphing calculator to compute your linear regression equation and correlation coefficient
Statistics: Summarizes, represents, and interprets data on two categorical and
quantitative variables (e.g., using two-way frequency tables and scatter plots,
analyzing trends, fitting functions to data, plotting and analyzing residuals)
New York State Education Department
/ 14
Statistical Experiments
• There are three types of studies you need to be familiar with:
o Survey
o Experimental
o Observational
• Characteristics of well designed studies:
o Random sample – the sample of population is chosen at random.
o Representative sample – the randomly chosen sample mirrors the characteristics of the population
o Sample size – there are enough entities for data to be statistically significant.
o Bias – the study accounts for “types of systematic error” that favors a particular result.
o Watch- Inferences about population by analyzing samples
Statistics: Understands and evaluates random processes underlying statistical
experiments (e.g., making inferences about population parameters from a
single sample, using and analyzing data-generating processes such as
simulations)
New York State Education Department
/ 15
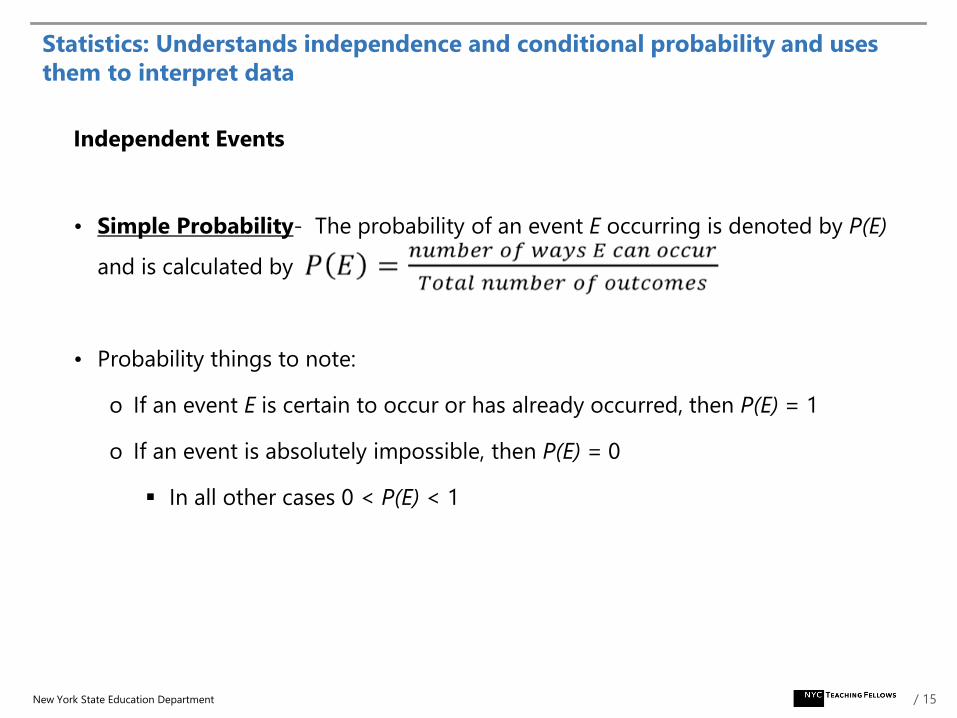
Independent Events
• Simple Probability- The probability of an event E occurring is denoted by P(E)
and is calculated by
• Probability things to note:
o If an event E is certain to occur or has already occurred, then P(E) = 1
o If an event is absolutely impossible, then P(E) = 0
In all other cases 0 < P(E) < 1
Statistics: Understands independence and conditional probability and uses
them to interpret data
New York State Education Department
/ 16
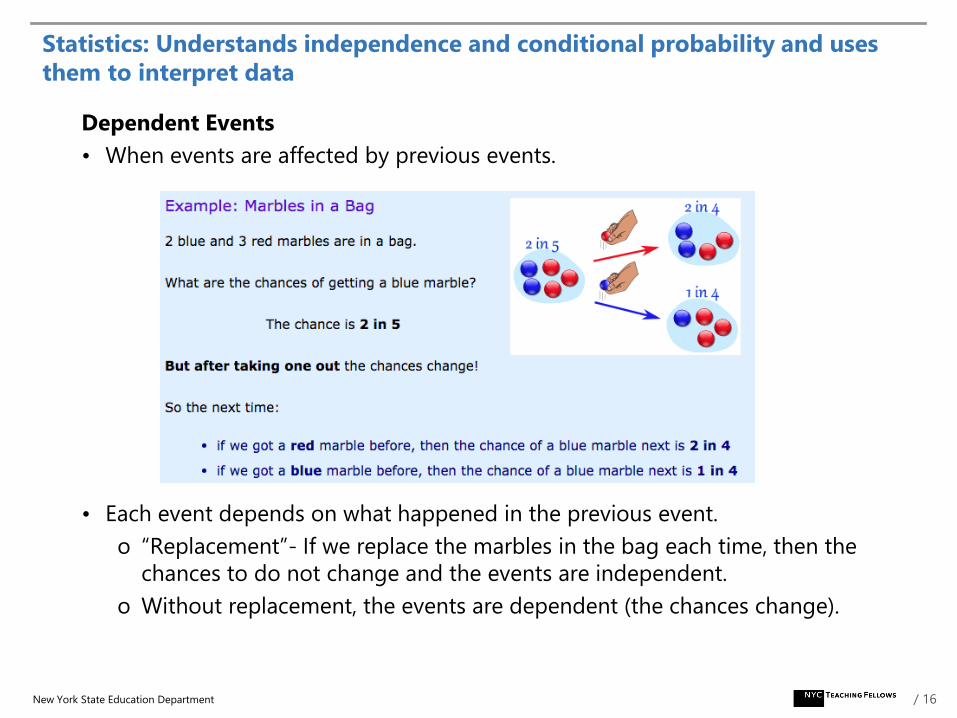
Dependent Events
• When events are affected by previous events.
• Each event depends on what happened in the previous event.
o “Replacement”- If we replace the marbles in the bag each time, then the
chances to do not change and the events are independent.
o Without replacement, the events are dependent (the chances change).
Statistics: Understands independence and conditional probability and uses
them to interpret data
New York State Education Department
/ 17
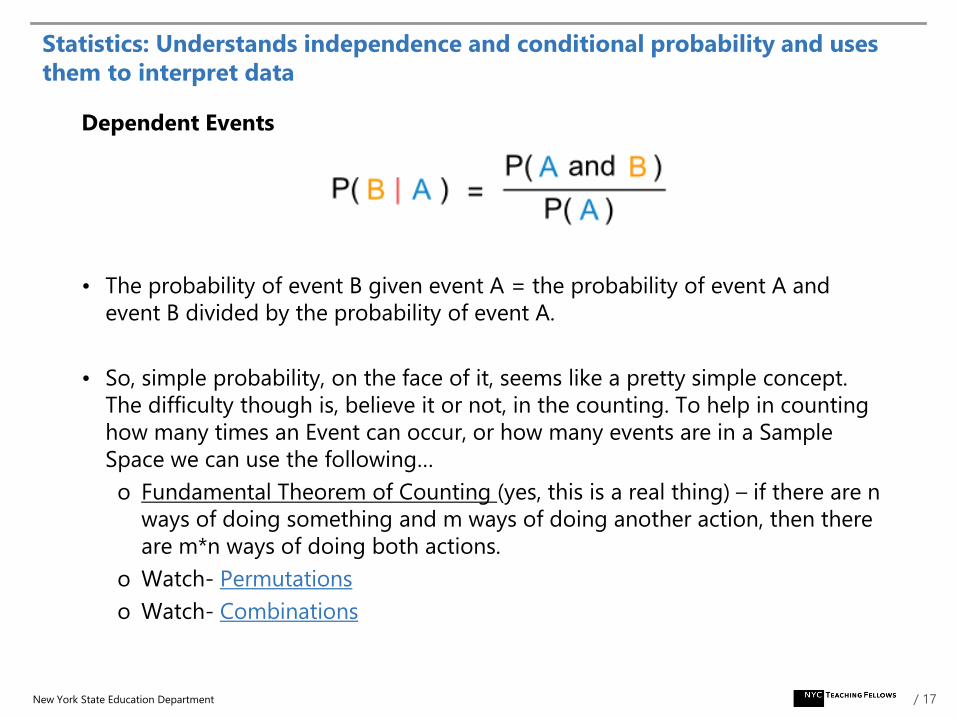
Dependent Events
• The probability of event B given event A = the probability of event A and
event B divided by the probability of event A.
• So, simple probability, on the face of it, seems like a pretty simple concept.
The difficulty though is, believe it or not, in the counting. To help in counting
how many times an Event can occur, or how many events are in a Sample
Space we can use the following…
o Fundamental Theorem of Counting (yes, this is a real thing) – if there are n
ways of doing something and m ways of doing another action, then there
are m*n ways of doing both actions.
o Watch- Permutations
o Watch- Combinations
Statistics: Understands independence and conditional probability and uses
them to interpret data
New York State Education Department
/ 18
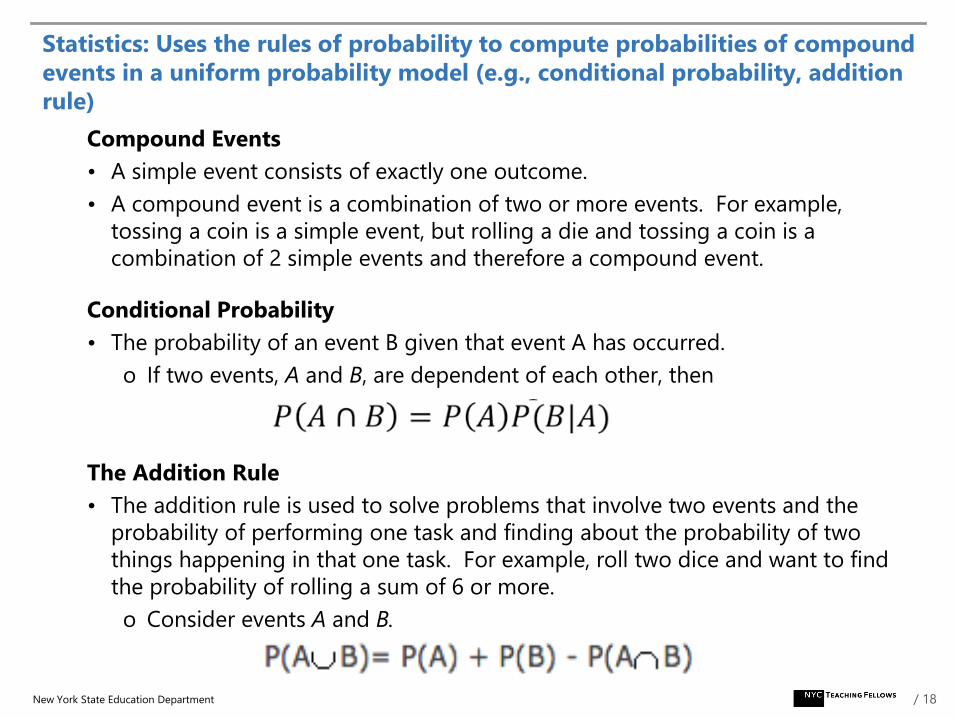
Compound Events
• A simple event consists of exactly one outcome.
• A compound event is a combination of two or more events. For example,
tossing a coin is a simple event, but rolling a die and tossing a coin is a
combination of 2 simple events and therefore a compound event.
Conditional Probability
• The probability of an event B given that event A has occurred.
o If two events, A and B, are dependent of each other, then
The Addition Rule
• The addition rule is used to solve problems that involve two events and the
probability of performing one task and finding about the probability of two
things happening in that one task. For example, roll two dice and want to find
the probability of rolling a sum of 6 or more.
o Consider events A and B.
Statistics: Uses the rules of probability to compute probabilities of compound
events in a uniform probability model (e.g., conditional probability, addition
rule)
New York State Education Department
/ 19
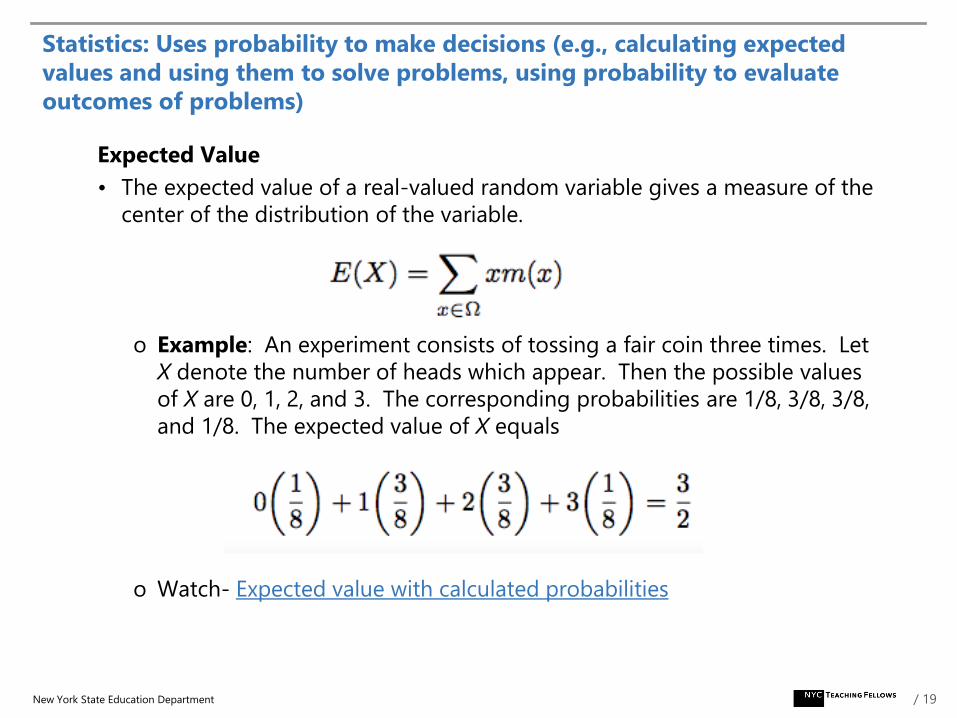
Expected Value
• The expected value of a real-valued random variable gives a measure of the
center of the distribution of the variable.
o Example: An experiment consists of tossing a fair coin three times. Let
X denote the number of heads which appear. Then the possible values
of X are 0, 1, 2, and 3. The corresponding probabilities are 1/8, 3/8, 3/8,
and 1/8. The expected value of X equals
o Watch- Expected value with calculated probabilities
Statistics: Uses probability to make decisions (e.g., calculating expected
values and using them to solve problems, using probability to evaluate
outcomes of problems)
New York State Education Department
/ 20
Agenda
Introduction to Competency
Content Review and Sample Problems
Additional Practice
/ 21
Additional Practice Problems Probability
New York State Education Department
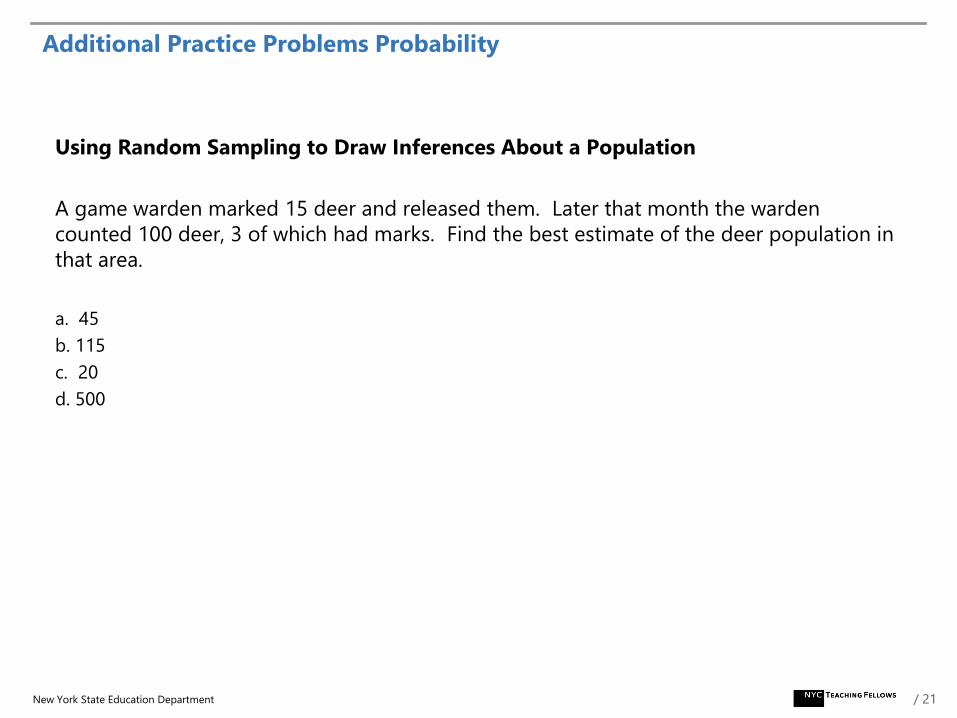
Using Random Sampling to Draw Inferences About a Population
A game warden marked 15 deer and released them. Later that month the warden
counted 100 deer, 3 of which had marks. Find the best estimate of the deer population in
that area.
a. 45
b. 115
c. 20
d. 500
/ 22
Additional Practice Problems Probability
New York State Education Department
Using Random Sampling to Draw Inferences About a Population: Solution D
Initially, the game warden tagged 15 deer. Later when he selected a random sample of
100 deer, 3 out of the 100 deer had a tag so we can set up the proportion 15
𝑥=
3
100. We
can then cross multiply and solve for x and we will find out that x = 500.
/ 23
Additional Practice Problems Probability
New York State Education Department
Probability
The New York State Education Department selects a number of schools to evaluate the
education level of different areas of the state. Suppose that school A has a 8% chance to
be selected and school B has a 6% chance to be selected. What is the probability that
school A or school B will be selected, if the chance of both schools being chosen is 2%?
A. 0.1
B. 0.12
C. 0.14
D. 0.16
/ 24
Additional Practice Problems Probability
New York State Education Department
Probability: Solution B
According to the Addition Rule, P(school A or school B selected) = P(school A selected) +
P(school B selected) - P(school A and school B selected).
P(school A selected) = 0.08
P(school B selected) = 0.06
P(school A and school B selected) = 0.02
P(school A or school B selected) = 0.08 + 0.06 - 0.02 = 0.12.
/ 25
Additional Practice Problems Probability
New York State Education Department
Probability (Continued)
A box contains 5 blue marbles, 4 red marbles and 6 green marbles. How many
additional blue marbles must be added in the box so that the probability of
randomly drawing a blue marble is 1/2?
A. 1
B. 3
C. 5
D. 6
E. 7
/ 26
Additional Practice Problems Probability
New York State Education Department
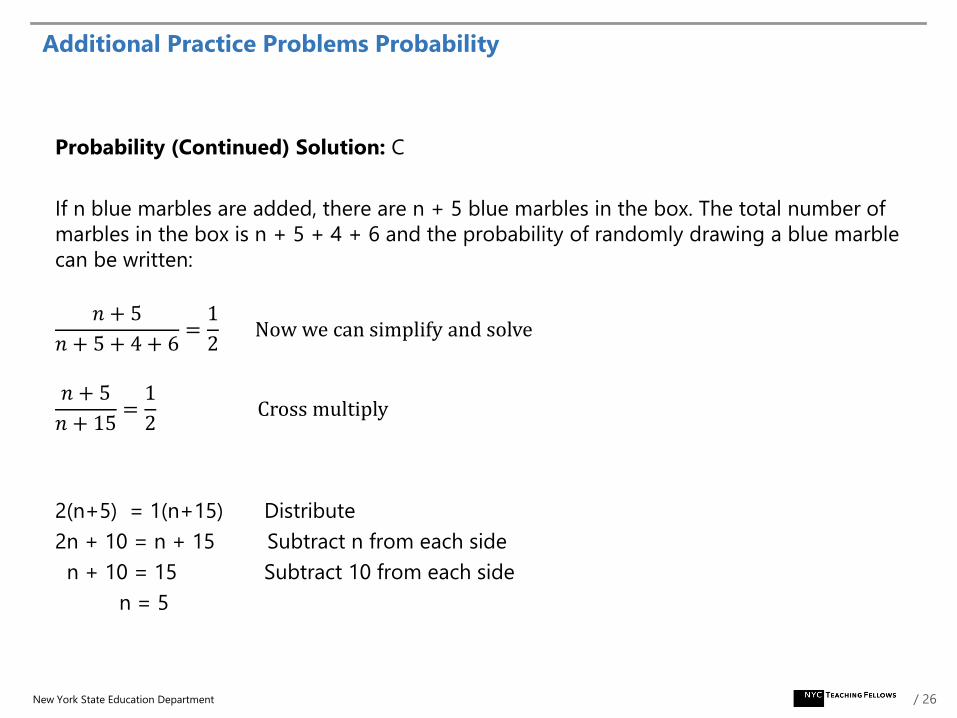
Probability (Continued) Solution: C
If n blue marbles are added, there are n + 5 blue marbles in the box. The total number of
marbles in the box is n + 5 + 4 + 6 and the probability of randomly drawing a blue marble
can be written:
𝑛 + 5
𝑛 + 5 + 4 + 6=1
2Now we can simplify and solve
𝑛 + 5
𝑛 + 15=1
2Cross multiply
2(n+5) = 1(n+15) Distribute
2n + 10 = n + 15 Subtract n from each side
n + 10 = 15 Subtract 10 from each side
n = 5
/ 27
Additional Practice Problems Probability
New York State Education Department
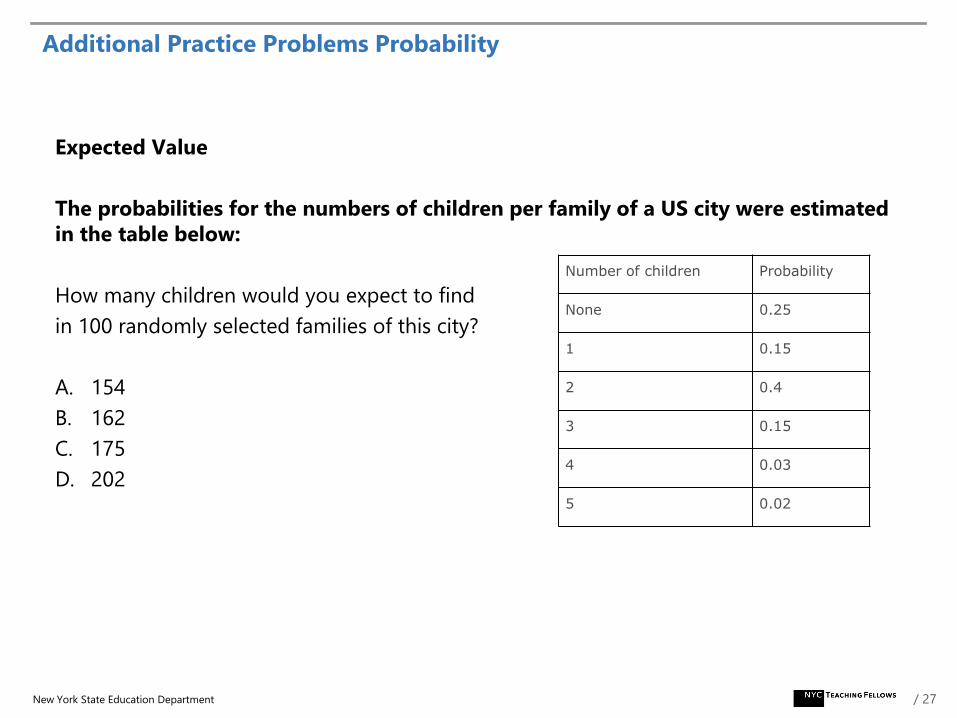
Expected Value
The probabilities for the numbers of children per family of a US city were estimated
in the table below:
How many children would you expect to find
in 100 randomly selected families of this city?
A. 154
B. 162
C. 175
D. 202
Number of children Probability
None 0.25
1 0.15
2 0.4
3 0.15
4 0.03
5 0.02
/ 28
Additional Practice Problems Probability
New York State Education Department
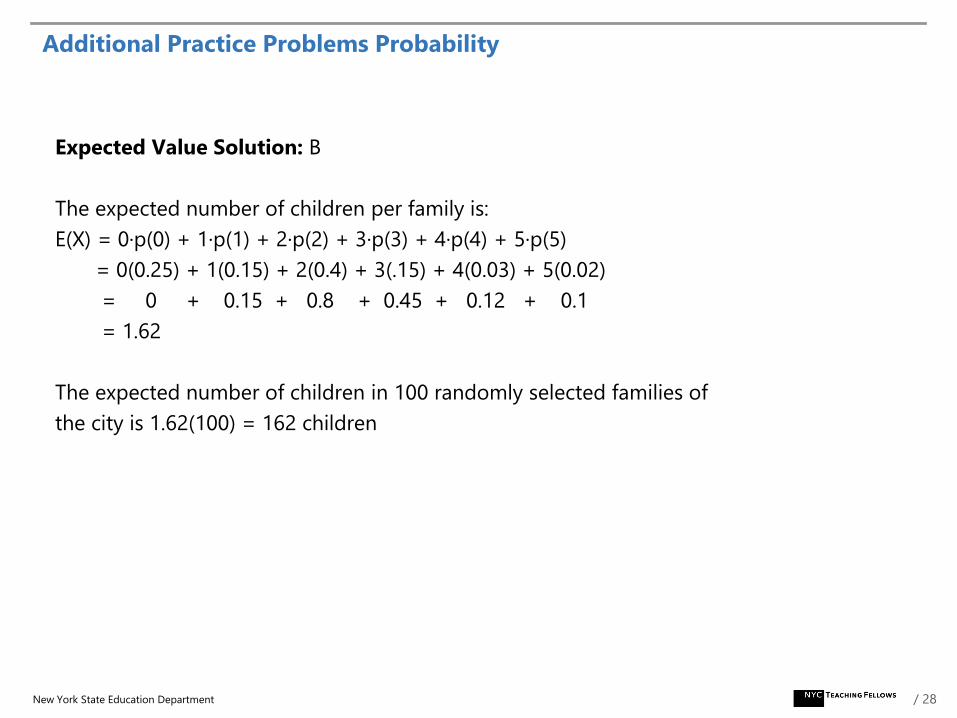
Expected Value Solution: B
The expected number of children per family is:
E(X) = 0·p(0) + 1·p(1) + 2·p(2) + 3·p(3) + 4·p(4) + 5·p(5)
= 0(0.25) + 1(0.15) + 2(0.4) + 3(.15) + 4(0.03) + 5(0.02)
= 0 + 0.15 + 0.8 + 0.45 + 0.12 + 0.1
= 1.62
The expected number of children in 100 randomly selected families of
the city is 1.62(100) = 162 children