Embed Size (px)
Citation preview
ournal of Automatic Chemistry, Vol. 15, No. 6 (November-December 1993), pp. 189-208
Multicentre evaluation of the BoehringerMannheim/Hitachi 911 Analysis System
Z. Zaman, N. Blanckaert, Ch. CobbaertClinical Chemistry Laboratory, University Hospitals Leuven, Capucynenvoer 33-35,B 3000 Leuven, Belgium
P. GilleryLaboratoire Central de Biochimie, Hdpital Robert Debrg CHR Reims, Rue AlexisCarrel, F 51092 Reims Cedex, France
P. HagemannZentrallaboratorium, Kantonsspital Miinsterlingen, CH 8596 Miinsterlingen,Switzerland
H. LutheAbt. Klinische Chemie, Zentrum Innere .Medizin, Georg-August-UniversitiitG6ttingen, Robert-Koch-Str. 40, D 37075 Ggttingen, Germany
R. Motta, D. Patrono, M.-A. Jionsu6Laboratorio Centralizzato, Ospedale S. Orsola, USL 28-B0 Nord, ViaMassarenti No. 9, 1 40138 Bologna, Italy
A. Torralba, M. J. Castifieiras, X. Fuentes-ArderiuServei de Bioquimica Clinica, Hospital Princeps d’Espanya, L’Hospitalet deLlobregat, E 08907 Barcelona, Spain
W. Bablok, I. Domke and W. StockmannBoehringer Mannheim GmbH, Sandhofer Str. 116, D 68298 Mannheim 31,Germany
The analytical performance and practicability of the BoehringerMannheim (BM)/mtaci 91 analysis system have been assessedin a multicentre evaluation, which involved six laboratories fromEuropean countries. Analytes commonly used in classical clinicalchemistry were tested in a core programme, which mainlyfollowedlhe ECCLS guidelines. In addition, a satellite programme coveredother analytes, such as proteins, drugs and urine analytes. In total,the study comprised more than 100 000 data items collected over athree-month period. The evaluation was supported with ’ComputerAided Evaluation’ (CAEv) and telecommunications.
Acceptance criteria for the results were established at thebeginning ofthe study. Nearly all ofthe analytes met the imprecisionlimits." within-run imprecision (as CVs) was 2l/ofor enzyme andsubstrate assays, l%for ISE methods and 5l/o for immunoassays;between-day imprecision was 3l/ofor enzyme and substrate assays,2o//o for ISE methods and 10% for immunoassays.No relevant drift effects (systematic deviation >_ 3O//o) were
observed over eight hours. The methods were linear over a widerange. Sample-related and reagent-dependent carry-over can bereduced to a negligible amount by integration of a software-controlled wash-step.
Endogenous interferences were found for creatininemethod) and uric acid assays (caused by bilirubin), for creatinekinase, creatine kinase MB isoform and 7-glutamyltransferase(caused by haemoglobin), and for immunoglobulin A (caused bylipaemia)
Accuracy was checked by an interlaboratory survey, recoverystudies in control materials and method comparison studies. Thesurvey showed that, with the exception of cholesterol and iron intwo laboratories, the recovery of analytes did not deviate by more
Correspondence about this paper should be addressed to Dr Z. aman at theUniversity Hospitals, Leuven.
than 5%. Sixty-six of the 77 method comparisons performed metthe acceptance criteria. The deviations of the remaining 11 resultscould be explained by differences in either calibration, applicationor by the use of different methods.
Practicability was assessed using a questionnaire which coveredall of the important aspects of an analysis system in the clinicallaboratory. Twelve groups ofattributes out of 14 were rater higherfor the BM/Hitachi 911 than for the present situation in thelaboratories concerned. Especially high scores were given for theversatility group.
The acceptance criteria for the analytical performance of theBM/Hitachi 911 analysis system were fulfilled in all laboratorysegments with few exceptions. The practicability exceeded therequirements in most of the attributes. The results of the studyconfirmed the usefulness of the system as a consolidated workstationin small- to medium-sized clinical laboratories and in STA Tlaboratories, or as an instrument for special analytes like proteinsand drugs, or for urinalysis in large laboratories.
Introduction
The Boehringer Mannheim (BM)/Hitachi 911 analysissystem is the most recent medium-sized analysis systemto be introduced to the market by Boehringer MannheimGmbH. In addition to the well-accepted analyticalperformance and reliability of previous BM/Hitachianalysis systems, the new instrument has features makingit attractive to different sections of clinical laboratories.These are in routine and emergency analysis (STAT),homogeneous immunoassays for the determination ofproteins and drugs and urinalysis. Therefore the BM/Hitachi911 has to be extremely flexible. This is achieved byincorporation of features such as automatic recognitionof four different barcodes for sample identification, use ofup to four reagents per test, variable reaction time,random analysis of serum and urine specimens using thesame calibration curve, fully automated predilution ofspecimens and automatic calibration.
The versatility of the new instrument required the designof a comprehensive evaluation. Six European laboratoriesparticipated in the multicentre evaluation. Analytes ofclassical clinical chemistry were tested in a core pro-gramme, which mainly tbllowed the ECCLS guidelines[1]. In addition, the behaviour of the system in differentlaboratory sections was tested in a satellite programme.The evaluators ran a much less extensive satelliteevaluation in order to maintain an acceptable cost/benefitratio. In total, the study included more than 100 000 data.Processing and analysis of the large data volumes was
managed with a program system called ’Computer AidedEvaluation’ (CAEv) and telecommunications.
CAEv integrates the definition of study protocols,performance of experiments in the laboratory, online/
0142-0453/93 $i0.00 @) 1993 Taylor & F is Ltd.189
Z. Zaman et al. Multicentre evaluation of the Boehringer Mannheim/Hitachi 911 Analysis System
offiine data transmission and the immediate assessmentand evaluation of the results [2]. The program runs ona standard PC under MS-DOS. It had previously beensuccessfully applied to the multicentre evaluation of theBM/Hitachi 747 analysis system [3].Telecommunications were used for the first time in aninternational multicentre evaluation. Installation of thenecessary facilities in the participating laboratoriesallowed rapid and simple transfer of data to the centre
coordinating the study.
The assessment of practicability was a further goal of theevaluation of the BM/Hitachi 911. The evaluatorsanswered 200 questions each about the system. All resultsof the multicentre evaluation are presented in this paper.
Description of the instrument
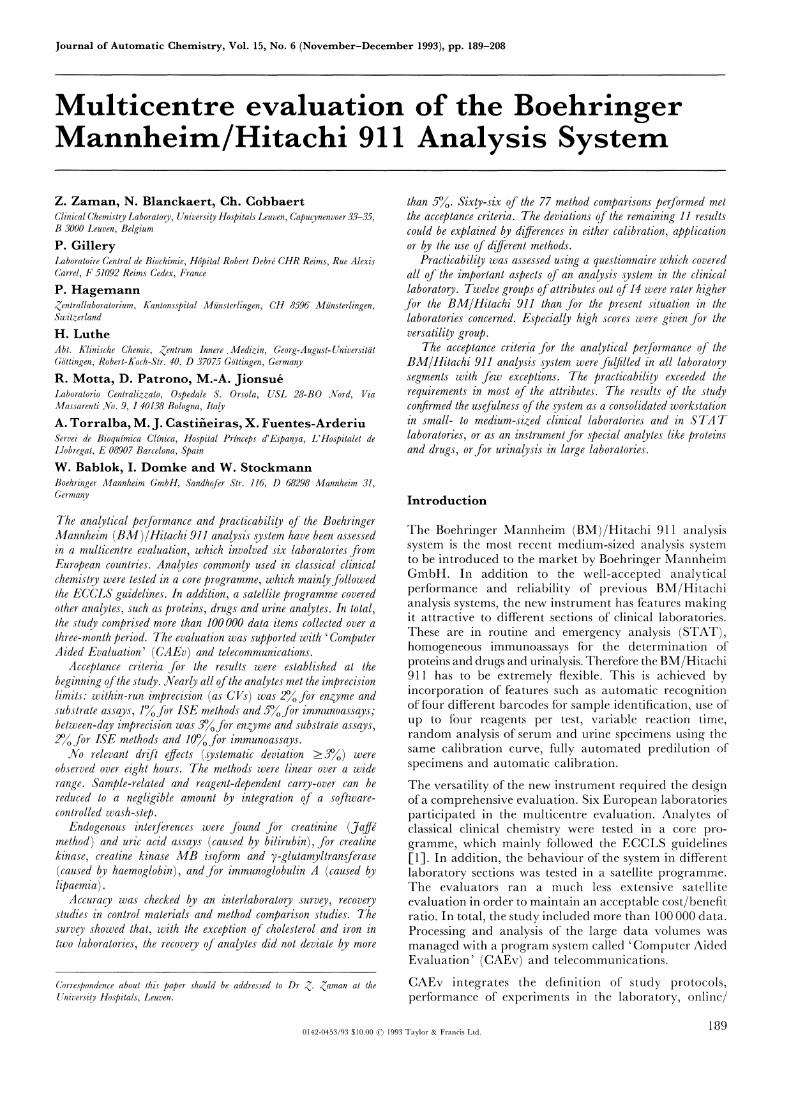
The BM/Hitachi 911 is a medium-sized selective accessanalyser with a capacity for 35 different tests, includingthree ion selective electrode (ISE) methods for sodium,potassium and chloride. The instrument specifications arelisted in table 1. The throughput is 360 photometrictests/h; this is reduced by automatic sample predilutionor additional wash steps which may be needed to eliminate
reagent carry-over. The pipetting cycle for photometrictests, for the automatic predilution and for the wash steps,is 10 and for the ISE methods 20 s.
Various measurements and calibration procedures thatcan be applied are:
(1) Endpoint measurements with/without sample blankwithin 16 min.
(2) Kinetic determinations with sample or substrate start
(49 measuring points within 16 min).
(3) ’Fixed-time’ measurements (two-point kinetic).
(4) Combination of kinetic and endpoint measurementswith ’twin tests’.
(5) Potentiometric measurements with the ISE unitswithin 20 at 37C.
(6) Serum indices for the characterization of haemolytic,icteric and lipaemic sera.
(7) Prozone check (detection of antigen excess).
(8) Linear and four nonlinear modes of calibration, thefrequency of which is controlled by the instrument(auto-calibration).
Table 1. BM/Hitachi 911 instrument specifications.
Type of instrument
2 Test channels
3 Test procedures
4 Throughput5 Sampling system
6 Sample pipettor
7 Reagent cooling8 Reagent bottles
9 Reagent dispenser10 Mixing procedure11 Reaction rotor
12 Reaction cuvettes
13 Reaction cycle
14 Temperature control
190
Discrete selective multianalyser.
32, with ISE-module 35.
Endpoint, endpoint with sample blank, kinetic with serum or substrate start, fixed-time kinetic,combination of two endpoint tests, endpoint and kinetic tests, two kinetics tests performingtwo tests in one cuvette, two prozone check procedures, measurement with ISE, linearcalibration and four nonlinear modes of calibration, autocalibration, two-point recalibration,isoenzyme calibration, serum indices indicating haemolytic, icteric and lipaemic specimens.Maximum 360 photometric tests/h, with ISE-module 720 tests/h.Turntable with 115 positions in total, arranged in three concentric rings:--50 positions in the outer ring for routine samples--40 positions in the middle ring
3 for wash solutions--20 for STAT samples--17 for standards/calibrators--25 cooled positions in the inner ring for 17 standard and 8 control samples.Primary tubes from 13 to 16 mm diameter and 75 to 100 mm length, secondary sample cupswith 2 ml and microcups with 0"5 ml maximum volume. Barcode identification of primarytubes. Codes: code bar NW 7, code 32, 2 out of 5 interleaved, code 128. Different codes anddifferent tube sizes can be used within one sample disk.
3 to 50 gl (in steps of gl), imprecision < 1; for ISE same pipettor 15 gl for the threedeterminations of Na, K, C1.
Cold water circuit, refrigerator temperature 5 to 15C.
20, 50 and 100 ml sizes, 2 reagent disks with 33 bottle positions, one position reserved forcuvettes rinsing solution. Disk for reagent and 4, disk 2 for reagent 2 and 3.
2 reagent pipettors for dispensing reagents to 4, 50 to 350gl (in steps of lgl).2 stirrers mix the reaction solution independently after addition of each reagent.
Turntable with 120 cuvettes; half rotation (60 cuvettes + 1) in 10s one working cycle.
Special plastic cuvettes, semidisposable.Volume required: minimum 250 lal, maximum 500Optical path length: 6 mm.
3, 4, 5, 10 and 16 minutes reaction time corresponding to 10, 13, 15, 31 and 49 measuringpoints. Average time between two measuring points: 20 s.
Water-bath, 37 0"IC.
Z. Zaman et al. Multicentre evaluation of the Boehringer Mannheim/Hitachi 911 Analysis System
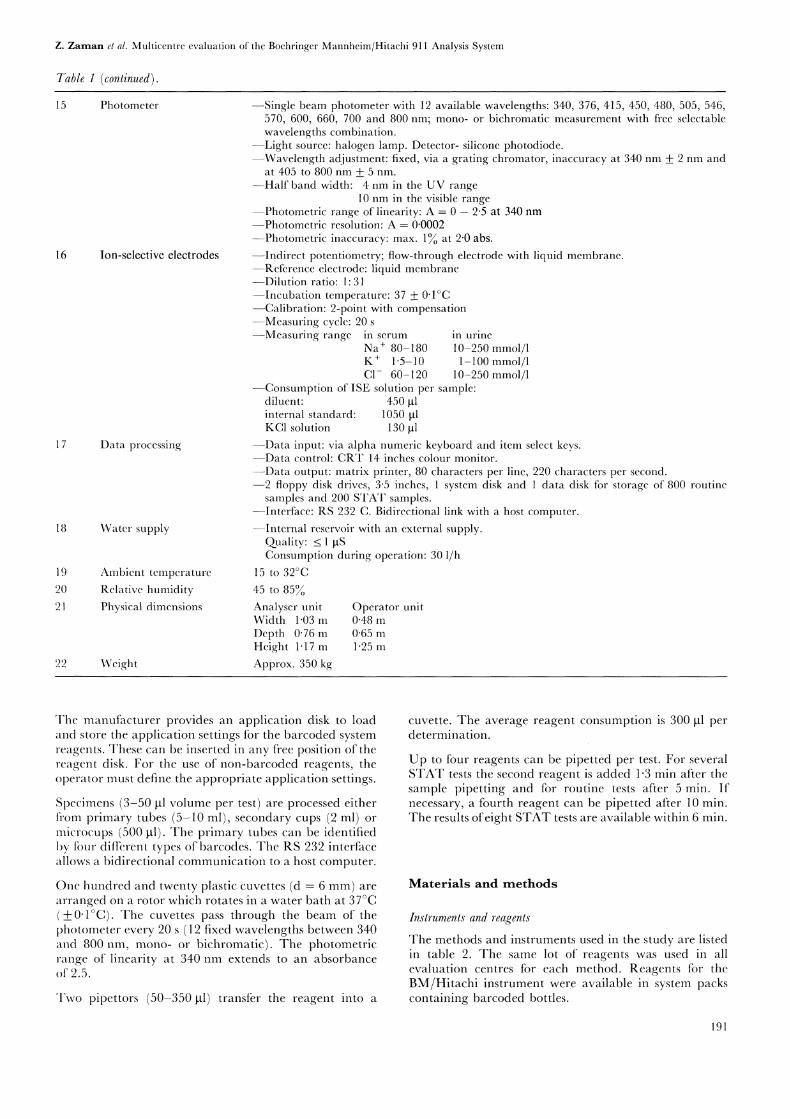
Table 1 (continued).
15 Photometer
16
17 Data processing
18 Water supply
Ion-selective electrodes
19 Ambient temperature
20 Relative humidity21 Physical dimensions
22 Weight
--Single beam photometer with 12 available wavelengths: 340, 376, 415, 450, 480, 505, 546,570, 600, 660, 700 and 800 nm; mono- or bichromatic measurement with free selectablewavelengths combination.
--Light source: halogen lamp. Detector- silicone photodiode.--Wavelength adjustment: fixed, via a grating chromator, inaccuracy at 340 nm 2 nm and
at 405 to 800 nm + 5 nm.--Half band width: 4 nm in the UV range
10 nm in the visible range--.Photometric range of linearity: A -0- 2"5 at 340 nm--Photometric resolution: A--0"0002--.Photometric inaccuracy: max. 1 at 2"0 abs.
--Indirect potentiometry; flow-through electrode with liquid membrane.--.Reference electrode" liquid membrane---Dilution ratio" 1" 31--Incubation temperature: 37 0"IC--Calibration: 2-point with compensation
Measuring cycle: 20--.Measuring range in serum in urine
Na / 80-180 10-250 mmol/1K / 1"5-10 1-100 mmol/1C1- 60-120 10-250 mmol/1
--Consumption of ISE solution per sample:diluent" 450 Itlinternal standard: 1050 ItlKC1 solution 130 Itl
--.Data input: via alpha numeric keyboard and item select keys.---Data control: CRT 14 inches colour monitor.
-Data output: matrix printer, 80 characters per line, 220 characters per second.-2 floppy disk drives, 3"5 inches, system disk and data disk for storage of 800 routinesamples and 200 STAT samples.
--Interface" RS 232 C. Bidirectional link with a host computer.
--Internal reservoir with an external supply.Quality" _< ItSConsumption during operation: 30 1/h
15 to 32C45 to 85Analyscr unit Operator unitWidth 1"03 m 0"48 mDepth 0"76 m 0"65 mHeight 1-17 m 1"25 m
Approx. 350 kg
The manufacturer provides an application disk to loadand store the application settings for the barcoded systemreagents. These can be inserted in any free position of thereagent disk. For the use of non-barcoded reagents, theoperator must define the appropriate application settings.
Specimens (3-50 lal volume per test) are processed eitherfrom primary tubes (5-10 ml), secondary cups (2 ml) or
microcups (500 lal). The primary tubes can be identifiedby tbur different types of barcodes. The RS 232 interfaceallows a bidirectional communication to a host computer.
One hundred and twenty plastic cuvettes (d 6 mm) are
arranged on a rotor which rotates in a water bath at 37C(__0"IC). The cuvettes pass through the beam of thephotometer every 20 (12 fixed wavelengths between 340and 800 nm, mono- or bichromatic). The photometricrange of linearity at 340 nm extends to an absorbanceof 2.5.
Two pipettors (50-350 gl) transtir the reagent into a
cuvette. The average reagent consumption is 300 lal perdetermination.
Up to four reagents can be pipetted per test. For severalSTAT tests the second reagent is added 1"3 min after thesample pipetting and for routine tests after 5 min. Ifnecessary, a fourth reagent can be pipetted after 10 min.The results ofeight STAT tests are available within 6 min.
Materials and methods
Inslrumenls and reagenls
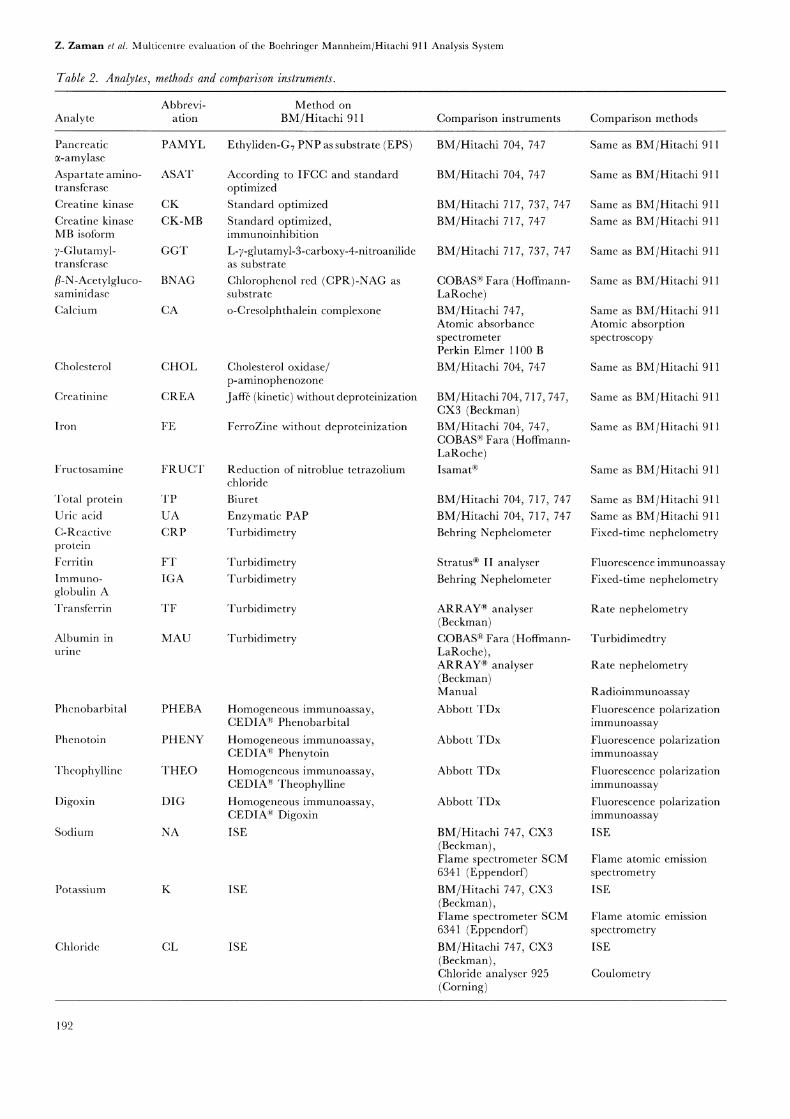
The methods and instruments used in the study are listedin table 2. The same lot of reagents was used in allevaluation centres for each method. Reagents ti0r theBM/Hitachi instrument were available in system packscontaining barcoded bottles.
191
Z. Zaman et al. Multicentre evaluation of the Boehringer Mannheim/Hitachi 911 Analysis System
Table 2. Analytes, methods and comparison instruments.
Abbrevi- Method onAnalyte ation BM/Hitachi 911 Comparison instruments Comparison methods
Pancreatic PAMYLa-amylaseAspartate amino- ASATtransferasc
Creatine kinase CKCreatine kinase CK-MBMB isoform
7-Glutamyl- GGTtransfcrase
fl-N-Acetylgluco- BNAGsaminidase
Calcium CA
Cholesterol CHOL
Crcatininc CREA
Iron FE
Fructosamine FRUCrI"
Total protein TPUric acid UAC-Reactive CRPproteinFcrritin FTImmuno- IGAglobulin ATransferrin TF
Albumin in MAUurine
Phenobarbital PHEBA
Phenotoin PHENY
Thcophyllinc THEO
Digoxin DIG
Ethyliden-G7 PNP as substrate (EPS)
According to IFCC and standardoptimizedStandard optimizedStandard optimized,immunoinhibition
L-7-glutamyl-3-carboxy-4-nitroanilideas substrate
Chlorophenol red (CPR)-NAG assubstrate
o-Cresolphthalein complexone
Cholesterol oxidase/p-aminophenozone
Jaff6 (kinetic) without deproteinization
FerroZine without deproteinization
Reduction of nitroblue tetrazoliumchloride
Biuret
Enzymatic PAPTurbidimetry
TurbidimetryTurbidimetry
Turbidimetry
Turbidimetry
Homogeneous immunoassay,CEDIA(R) Phenobarbital
Homogeneous immunoassay,CEDIA Phenytoin
Homogeneous immunoassay,CEDIA’- TheophyllineHomogeneous immunoassay,CEDIA(R) Digoxin
Sodium NA ISE
Potassium K ISE
Chloride CL ISE
BM/Hitachi 704, 747
BM/Hitachi 704, 747
BM/Hitachi 717, 737, 747
BM/Hitachi 717, 747
BM/Hitachi 717, 737, 747
COBAS(R) Fara (Hoffmann-LaRoche)BM/Hitachi 747,Atomic absorbancespectrometerPerkin Elmer 1100 BBM/Hitachi 704, 747
BM/Hitachi 704, 717,747,CX3 (Beckman)BM/Hitachi 704, 747,COBAS(R) Fara (Hoffmann-LaRoche)Isamat(R)
BM/Hitachi 704, 717, 747
BM/Hitachi 704, 717, 747
Behring Nephelometer
Stratus(R) II analyserBehring Nephelometer
ARRAY(R) analyser(Beckman)COBAS(R) Fara (Hoffmann-LaRoche),ARRAY(R) analyser(Beckman)Manual
Abbott TDx
Abbott TDx
Abbott TDx
Abbott TDx
BM/Hitachi 747, CX3(Beckman),Flame spectrometer SCM6341 (Eppendorf)BM/Hitachi 747, CX3(Beckman),Flame spectrometer SCM6341 (Eppendorf)BM/Hitachi 747, CX3(Beckman),Chloride analyser 925(Corning)
Same as BM/Hitachi 911
Same as BM/Hitachi 911
Same as BM Hitachi 911
Same as BM Hitachi 911
Same as BM Hitachi 911
Same as BM/Hitachi 911
Same as BM/Hitachi 911Atomic absorptionspectroscopy
Same as BM/Hitachi 911
Same as BM/Hitachi 911
Same as BM/Hitachi 911
Same as BM/Hitachi 911
Same as BM/Hitachi 911
Same as BM/Hitachi 911
Fixed-time nephelometry
Fluorescence immunoassayFixed-time nephelometry
Rate nephelometry
Turbidimedtry
Rate nephelometry
RadioimmunoassayFluorescence polarizationimmunoassayFluorescence polarizationimmunoassayFluorescence polarizationimmunoassayFluorescence polarizationimmunoassayISE
Flame atomic emissionspectrometry
ISE
Flame atomic emissionspectrometry
ISE
Coulometry
192
Z. Zarnan el al. Multicentre evaluation of the Boehringer Mannheim/Hitachi 911 Analysis System
Control materials
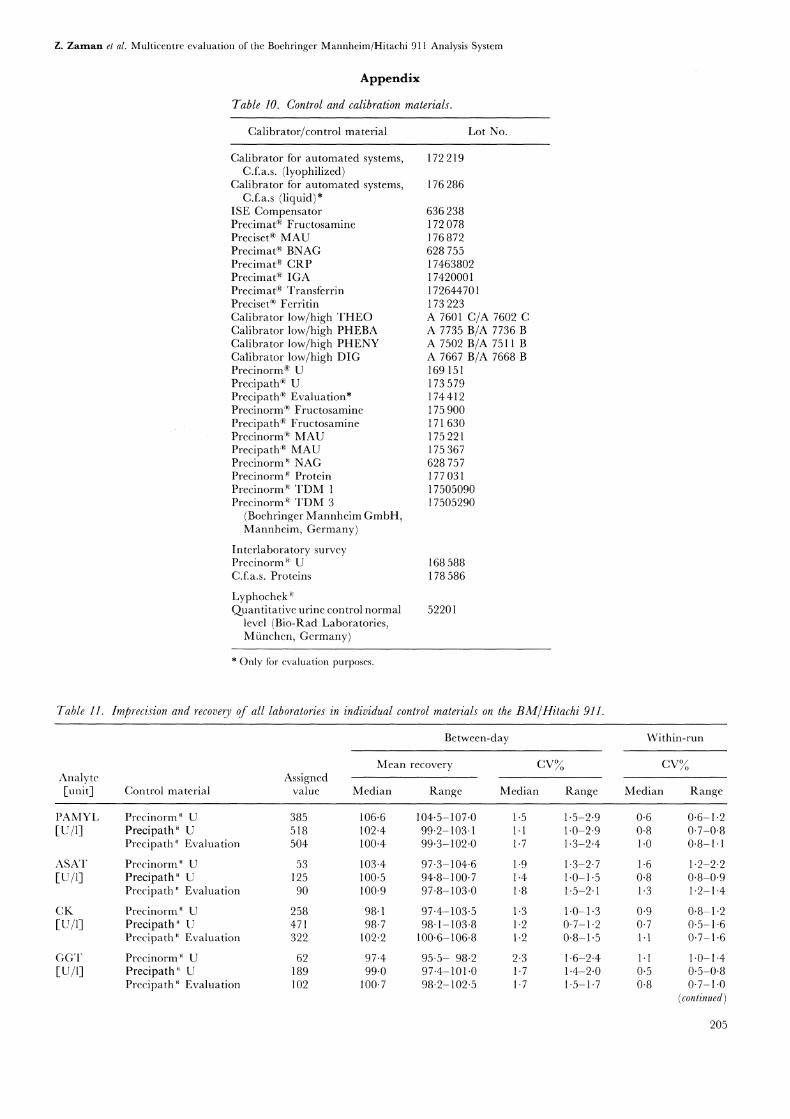
Imprecision and quality control studies were performedwith lyophilized control sera (Boehringer MannheimGmbH) and control urines (Boehringer MannheimGmbH, Bio-Rad). Detailed information is shown in theappendix (table 10).
Calibration
During the familiarization period, a fixed-factor wasdetermined for the enzyme tests in three independentcalibration runs per day on three consecutive days.The same lot of the calibrator for automated systems(Boehringer Mannheim GmbH) was used for this purpose.The mean of the nine calibration runs was then taken asthe factor, provided that the range of all results did notexceed 3 of the mean.
During experiments for the between-day imprecision andmethod comparison (21 working days) autocalibration ofthe analytical system was tested. The autocalibration istriggered by an analyte-dependent calibration interval.In order to avoid any additional effects on the results, a’start-up’ calibration was activated before the remainingexperiments. Detailed information about the calibratorsemployed is shown in the appendix (table 10).
Evaluation protocol
The versatility of the BM/Hitachi 911 analysis system wastested in a core programme and a satellite programme.The core program had been used for evaluations ofthe BM/Hitachi 704, 717 and 747 analysis systems[-5].
The 13 analytes tested in the core programme were
pancreatic 0c-amylase, aspartate aminotransferase, creatinekinase, 7-glutamyltransferase, calcium, cholesterol, crea-tinine, iron, total protein, uric acid, sodium, potassium,and chloride. This programme included a familiarizationperiod, an initial trial and a main trial. The protocol ofthe main trial is shown in table 3. The main trial was
split between two groups, each consisting of threelaboratories, which tested the same set of analytes. Forthe studies of linearity, drift and sample-related carry-over, the different methods were divided between the sixevaluators.
The satellite programme covered other analytes such as
proteins (C-reactive protein, ferritin, immunoglobulin A,transferrin), drugs (phenobarbital, phenytoin, theophyl-line, digoxin) and urinalysis (albumin, /-N-a.cetyl-glucosaminidase, creatinine, sodium, potassium, chloride).In addition, creatinine kinase MB isoform and fruc-
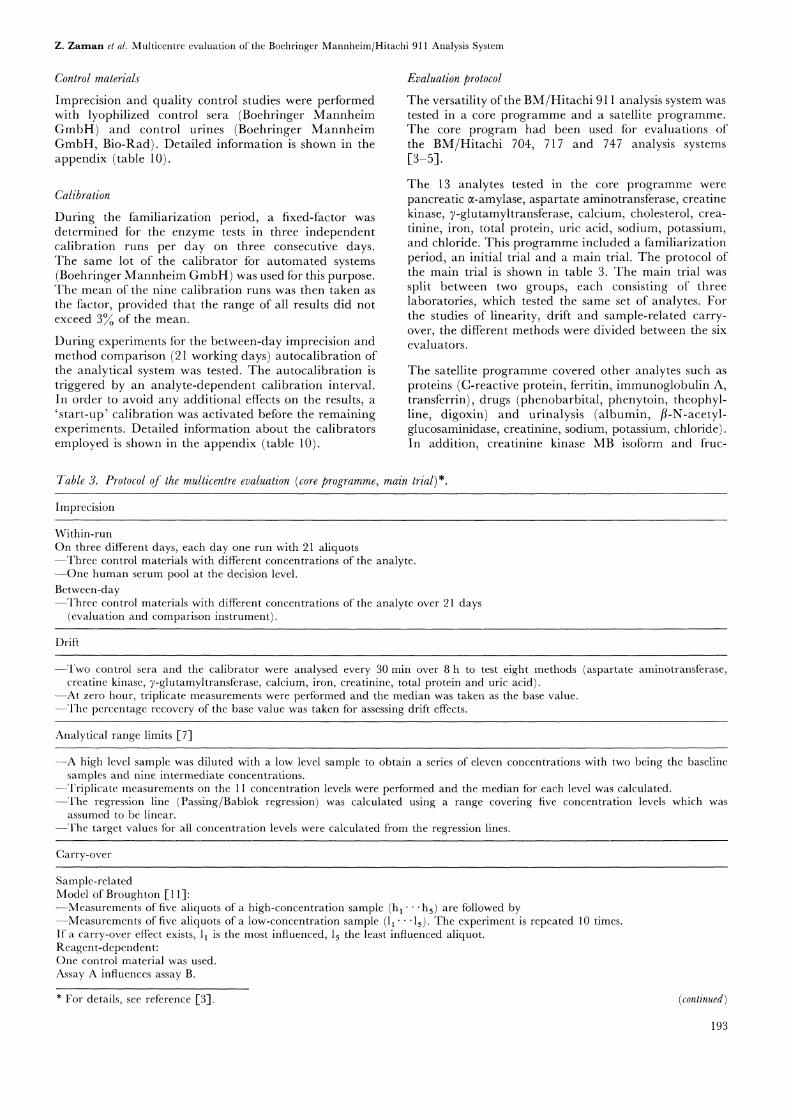
Table 3. Protocol of the multicentre evaluation (core programme, main trial)*.
Imprecision
Within-runOn three different days, each day one run with 21 aliquots--:Fhree control materials with different concentrations of the analyte.--.One human serum pool at the decision level.Between-day
Three control materials with different concent’rations of the analyte over 21 days(evaluation and comparison instrument).
Drift
Two control sera and the calibrator were analysed every 30 min over 8 h to test eight methods (aspartate aminotransferase,creatine kinase, 7-glutamyltransferase, calcium, iron, creatinine, total protein and uric acid).-At zero hour, triplicate measurements were performed and the median was taken as the base value.The percentage recovery of the base value was taken for assessing drift effects.
Analytical range limits [7]
--A high level sample was diluted with a low level sample to obtain a series of eleven concentrations with two being the baselinesamples and nine intermediate concentrations.
--Triplicate measurements on the 11 concentration levels were performed and the median for each level was calculated.--The regression line (Passing/Bablok regression) was calculated using a range covering five concentration levels which was
assumed to be linear.--The target values for all concentration levels were calculated from the regression lines.
Carry-over
Sample-relatedModel of Broughton [ 11]:---Measurements of five aliquots of a high-concentration sample (hi"" "hs) are followed by--Measurements of five aliquots of a low-concentration sample (11" "15). The experiment is repeated 10 times.If a carry-over effect exists, 11 is the most influenced, 15 the least influenced aliquot.Reagent-dependent:One control material was used.Assay A influences assay B.
* For details, see reference [3]. (continued)
193
Z. Zaman et al. Multicentre evaluation of the Boehringer Mannheim/Hitachi 911 Analysis System
Table 3 (continued).
--.Carry-over caused by the cuvettesIn a first step, reagents for assay A were requested 21 times. Just after the dispensing of the reagents for the 21st aliquot, theanalyser was stopped. In a second step, reagents for assay B were requested 42 times. The first 21 determinations were performedin the cuvettes which previously had contained the reagents for assay A. These determinations would show carry-over effectswhereas the last 21 determinations would be uninfluenced. The difference of the medians of both series was the carry-over.
--.Carry-over caused by reagent probes and stirrersAssay B was carried out 21 times. In the second step test A and B were alternately performed 21 times. The carry-over was thedifference between the medians of both series.
Interference
Protocol of Glick [8]A specimen with concentrations at the decision level was spiked with the interfering substance and 10 serial dilutions were preparedwith the same baseline specimen. The different analytes were measured in triplicate. The percentage recovery of the baseline valuefor each concentration level was calculated.
Accuracy
CalibrationThe calibrators of BM/Hitachi 911 and of the comparison instrument were both run on each instrument.
Quality control in three control materials--Median, calculated from the second of duplicate measurements over 21 days.
Interlaboratory survey--One control material with concentrations not known to the evaluators.--Median, calculated from the second of duplicate measurements over 10 days.
Method comparison in fresh human specimens--10 to 15 specimens were analysed each day for 10 days on the BM/Hitachi 911 and on the comparison instruments. The totalnumber of specimens covered the entire analytical range.
--Comparison of the methods by calculation of the Passing/Bablok regression line [10-].
In the satellite programme within-run imprecision was determined using one or two control materials and one human pool. Between-dayimprecision was studied over 10 days with one or two control materials.Drift, linearity, carry-over and interference studies were carried out only for selected analytes.
tosamine assays were run in this part of the evaluationstudy. The results of these analytes are presented togetherwith those of the core programme.
The protocol included quality specifications which wereagreed at the evaorators’ first meeting: these are describedlater in this paper.
Assessmenl of praclicabilily
Practicability was assessed with the aid of a recentlypublished questionnaire [6] comprising about 200 ques-tions which covered all important aspects of an analysissystem in the clinical laboratory. The questions weresummarized into 14 groups, as shown in table 4. Theywere related to the installation of the analyser, organiza-tion of work, quality assurance and miscellaneouscharacteristics. A first version of the questionnaire hadalready been used for the assessment of practicability ofBM/Hitachi 747 [3].
Grading was in comparison with the evaluators’ presentlaboratory situation. The assessment was based on a scalefrom 0 to 10: a score of 0 meant unimportant, useless or
poor, and a score of 10 absolutely necessary or excellent.A score of 5 could be interpreted as being acceptable orcomparable with the present laboratory situation. Thegrading was divided into three classes. Scores of up to 3"3meant ’did not meet the requirements’, scores from 3"4
to 6"7 ’meets the requirements’, and scores from 6"8 to l0’exceeded the requirements’.
Results
Imprecision
Acceptance criteria for imprecision were based onstatistical error propagation [3]. For within-run impre-cision in participating laboratories the median of the CVsshould not exceed 2 for classical clinical chemistryanalytes (enzymes and substrates) in serum (only in thetables is a differentiation made between serum andplasma) and urine at all concentrations tested. Theaccepted CV was reduced to 1 for the determination ofelectrolytes by ISE. Taking into consideration theproblems associated with immunoassays, such as nonlinearcalibration or analytical sensitivity, it was agreed thatCVs of less than 5 would be acceptable for these assays.
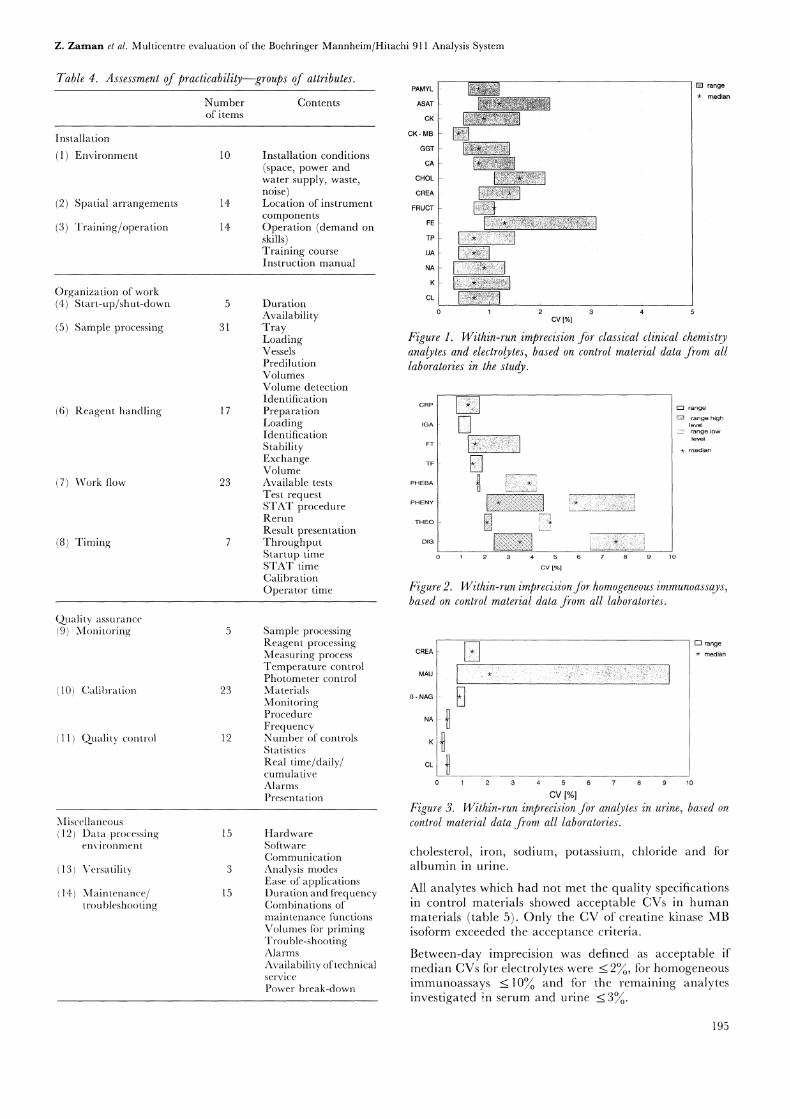
Within-run imprecision data based on results from all thecontrol sera from all laboratories are shown in figures 1-3,and data for individual control sera are given in theappendix (table 11). The medians of all analytes met theacceptance criteria, except for phenytoin and digoxin inthe low level control. In individual control sera, resultsexceeding the acceptance limits were obtained for
194
Z. Zaman et al. Multicentre evaluation of the Boehringer Mannheim/Hitachi 911 Analysis System
Table 4. Assessment of practicability--groups of attributes.
Numberof items
PAMYL
Contents ASAT
CK
CK MB
GGTInstallation conditions(space, power and cA
water supply, waste, CHOL
noise) CREA
Location of instrument FRUCTcomponentsOperation (demand on
E
skills) T
Training course uA
Instruction manual
DurationCk
AvailabilityTrayLoadingVesselsPredilutionVolumesVolume detectionIdentificationPreparationLoadingIdentificationStabilityExchangeVolumeAvailable testsTest requestSTAT procedureRerunResult presentationThroughputStartup timeSTAT timeCalibrationOperator time
Installation
(1) Environment 10
(2) Spatial arrangements 14
(3) Training/operation 14
Organization of work(4) Start-up/shut-down 5
(5) Sample processing 31
(6) Reagent handling 17
(7) Work flow 23
(8) Timing 7
Quality assurance
9) Monitoring
10) Calibration 23
11) Quality control 12
Miscellaneous(12) Data processing
environment
(13) Versatility
(14) Maintenance/troubleshooting
15
15
rangemedian
cv [%1
Figure 1. Within-run imprecision for classical clinical chemistryanalytes and electrolytes, based on control material data from alllaboratories in the study.
[%1
high
Figure 2. Within-run imprecisionfor homogeneous immunoassays,based on control material data from all laboratories.
Sample processingReagent processing
CREAMeasuring processTemperature controlPhotometer control MAU
MaterialsMonitoring - NAG
Procedure NAFrequencyNumber of controls KStatisticsReal time/daily/ CL
cumulativeAlarmsPresentation
HardwareSoftwareCommunicationAnalysis modesEase of applicationsDuration and frequencyCombinations ofmaintenance functionsVolumes tbr primingTrouble-shootingAlarmsAvailability of technicalservicePower break-down
cv [%1
rangemedian
Figure 3. Within-run imprecision for analytes in urine, based on
control material data from all laboratories.
cholesterol, iron, sodium, potassium, chloride and foralbumin in urine.
All analytes which had not met the quality specificationsin control materials showed acceptable CVs in humanmaterials (table 5). Only the CV of creatine kinase MBisotbrm exceeded the acceptance criteria.
Between-day imprecision was defined as acceptable ifmedian CVs for electrolytes were _< 2, for homogeneousimmunoassays _< 10 and for the remaining analytesinvestigated in serum and urine _< 3.
195
Z. Zaman et al. Multicentre evaluation of the Boehringer Mannheim/Hitachi 911 Analysis System
Table 5. Within-run imprecision in a normal human serum,plasma or urine pool (N 21). The results of the pools withconcenlrations close to the decision level are shown.
Analyte Unit Mean CV
Pancreatic a-amylase U/1 71 1.7Aspartate aminotransferase U/1 30 1.3Creatine kinase U/1 149 0.8Creatine kinase, MB isoform U/1 10 3.17-Glutamyltransferase U/1 46 0.9Calcium mmol/1 2"2 0.9Cholesterol mmol/1 5.1 1.7Creatinine gnol/1 99 1.6Fructosamine gmol/1 250 1.4Iron gmol/1 13 1.8Total protein g/1 70 0.4Uric acid gmol/1 350 1.0Sodium mmol/1 141 0.5Potassium mmol/1 4.0 0.6Chloride mmol/1 101 0.6C-Reactive protein mg/1 14 3"2Immunoglobulin A g/1 1.8 2"5Ferritin gg/1 239 2"2Transfcrrin g/1 2"6 2"0Phenobarbital gg/ml 16 2"8Phenytoin gg/ml 8"6 2"9Theophylline gg/ml 12 3.0Digoxin ng/ml 1.9 4.0fi-N-Acctylglucosaminidase* U/1 10 0.6Creatinine* mmol/1 1.0 1.0Albumin* mg/1 33 1.4Sodium* mmol/1 110 0.4Potassium* mmol/1 35 0.5Chloride* mmol/1 96 0.5
*Analytes in urine.
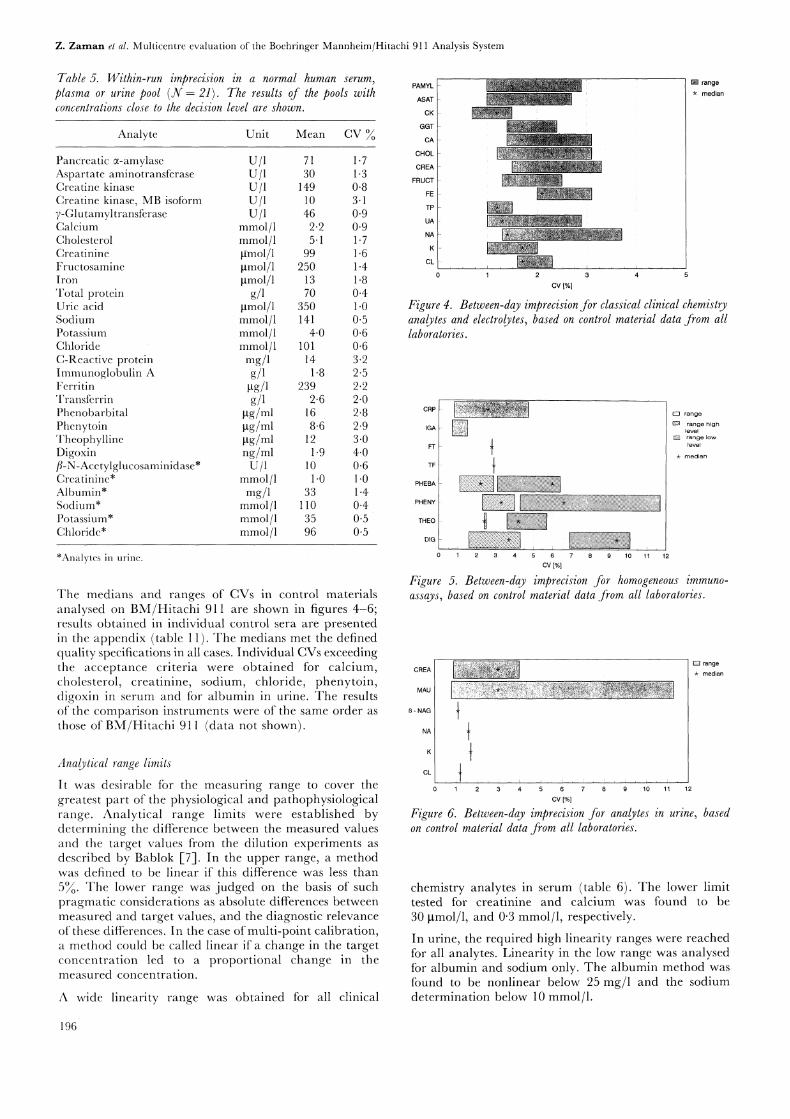
The medians and ranges of CVs in control materialsanalysed on BM/Hitachi 911 are shown in figures 4-6;results obtained in individual control sera are presentedin the appendix (table 11). The medians met the definedquality specifications in all cases. Individual CVs exceedingthe acceptance criteria were obtained for calcium,cholesterol, creatinine, sodium, chloride, phenytoin,digoxin in serum and tbr albumin in urine. The resultsof the comparison instruments were of the same order asthose of BM/Hitachi 91 (data not shown).
Analytical range limits
It was desirable for the measuring range to cover thegreatest part of the physiological and pathophysiologicalrange. Analytical range limits were established bydetermining the difference between the measured valuesand the target values from the dilution experiments asdescribed by Bablok [7]. In the upper range, a methodwas defined to be linear if this difference was less than5. The lower range was judged on the basis of suchpragmatic considerations as absolute differences betweenmeasured and target values, and the diagnostic relevanceof these differences. In the case of multi-point calibration,a method could be called linear if a change in the targetconcentration led to a proportional change in themeasured concentration.
A wide linearity range was obtained for all clinical
PAMYL
ASAT
CK
GGT
CA-
CHOL
CREA
FRUCT
FE
TP
UA-
NA--
K
cv [/4
range
median
Figure 4. Between-@ imprecision for classical clinical chemistryanalytes and electrolytes, based on control material data from alllaboratories.
IGA high
FT
T
THEO t "10 11 12
cv [%]
Figure 5. Between-day imprecision for homogeneous immuno-assays, based on control material data ,from all laboratories.
CREA
MAU
NAG
12
cv [%1
range
median
Figure 6. Between-day imprecision for analytes in urine, basedon control material data from all laboratories.
chemistry analytes in serum (table 6). The lower limittested for creatinine and calcium was found to be30 gmol/1, and 0"3 mmol/1, respectively.
In urine, the required high linearity ranges were reachedfor all analytes. Linearity in the low range was analysedfor albumin and sodium only. The albumin method was
found to be nonlinear below 25 mg/1 and the sodiumdetermination below 10 mmol/1.
196
Z. Zaman et al. Multicentre evaluation of the Boehringer Mannheim/Hitachi 911 Analysis System
Table 6. Analytical ranges on the BM/Hitachi 911.
SampleAnalyte material Unit
Range
Tested between Found between
Aspartate aminotransferase serum(IFCC method)Creatine kinase serum7-Glutamyltransferase serumPancreatic a-amylase serumCalcium serumCholesterol plasmaCreatinine serumIron serum
Total proteinUric acidC-Reactive protein*Immunoglobulin A]3-N-AcetylglucosaminidaseCreatinineAlbuminSodiumPotassiumChloride
plasmaplasmaserumserumurine
urine
urine
urine
urine
urine
U/1 14 870 14 870
u/u/1u/1
mmol/1mmol/1gmol/1gmol/1
g/1gmol/1mg/1g/1U/1
mmol/1mg/1
mmol/1mmol/1mmol/1
l0 -1520 l0 -1520l0 -1250 l0 -125016 -2400 16 -24000 6 0.3- 62"9- 21.5 2"9- 21.50 -2000 30 -20000.9- 20 0.9- 2010 215 10 2158 175 8 1750 -1200 0 -12000 25O 0 25O
6.3 6.00 78 0 781.5- 23 1-5- 230 5O0 2O 5OO0 2OO 10 2OO0 115 0 1150 215 30 215
*Multi-point calibration, see discussion in text.
Drift effects were not accepted if a systematic deviationfrom the initial value exceeded 3. Over an eight-hour-period, no drift effects were observed in any of the 10methods tested.
Calibration stability
Calibration stability based on individual calibrationfrequency claims was observed over a period of21 workingdays. No deviations in recovery exceeding 3 were found.
Carry-over
Carry-over effects were assessed on the basis of theobserved change in recovery of an analyte. Instead ofadapting an individual deviation for each analyte it wasdecided to use the within-run imprecision system perform-ance. This was defined as a change of less than twice thestandard deviation being acceptable.
Sample-related carry-over was only tested for analyteswith a large physiological range and between urine andserum specimens. For the potassium assay, a slightcarry-over effect (0"17 mmol/1) was observed from urineto serum with a concentration ratio of77:1 (table 7). Thiswas rated as being of no clinical relevance.
Previous experience with BM/Hitachi systems had revealedreagent dependent carry-over caused by the cuvettes forthe combination triglycerides/lipase. This effect wasavoided by activating a special wash solution step withinthe normal cleaning procedure for the cuvettes onBM/Hitachi 91 1.
Carry-over caused by the reagent probes and the stirrerswas tested for the combinations triglycerides/lipase andaspartate aminotransferase/lactate dehydrogenase. This
resulted in an elevation of lipase activities by about400 U/1 and of lactate dehydrogenase activities by about30 U/1. Activation of a software-controlled wash-step forthese combinations reduced the carry-over effects to a
negligible amount < 10 U/1).
InterferencesAccording to Glick et al. [8], a method is resistant tointerferences if the deviation between the baseline valueand the measured value is less than 10. Only methodsnot fulfilling this acceptance criterion are shown in theinterferograms ofbilirubinaemia, lipaemia and haemolysis(figures 7-9).
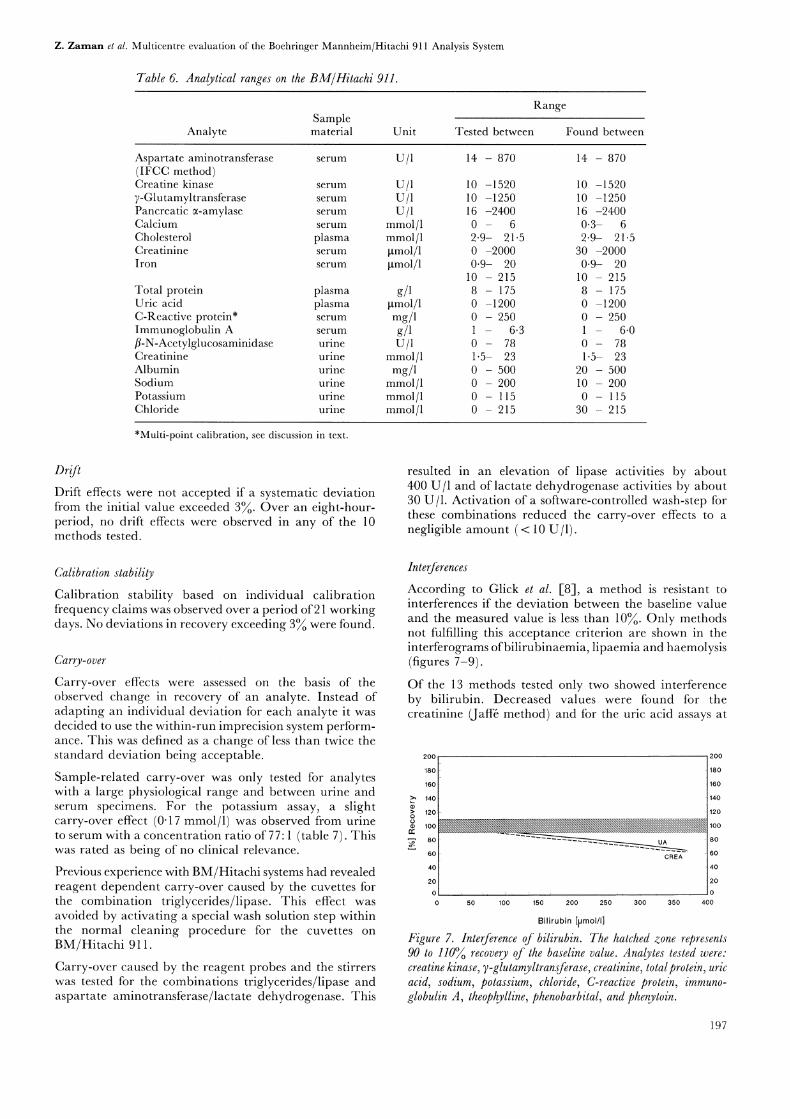
Of the 13 methods tested only two showed interferenceby bilirubin. Decreased values were found for thecreatinine (Jaffa method) and for the uric acid assays at
200 200
180
160
140
120
80
60 CREA
180
160
140
120
100
80
60
40
20
50 100 150 200 250 300 350 400
Bilirubin [[Jmol/I]Figure 7. Interference of bilirubin. The hatched zone represents90 to 110% recovery of the baseline value. Analytes tested were:creatine kinase, 7-glutamyltransferase, creatinine, totalprotein, uricacid, sodium, potassium, chloride, C-reactive protein, immuno-globulin A, theophylline, phenobarbital, and phenytoin.
197
Z. Zaman et al. Multicentre evaluation of the Boehringer Mannheim/Hitachi 911 Analysis System
Table 7. Sample-related carry-over.
Analy e Median Median(sample of high of low
materials) Unit concentration concentration
StandardRatio Median of deviationh" 11 -15 13, 1,, 15
Creatine kinase U/1 6 282 12.0(serum/serum)
Ferritin gg/1 5 480 196(serum/serum)
Creatinine gmol/1 35 100 58.1(urine/plasma)
Albumin mg/1 54 300 16.5(serum/urine)
Albumin mg/1 39 400 21.3(plasma/urine)
Potassium mmol/1 224 2.9(urine/serum)
Potassium mmol/1 161 4.0(urine/plasma)
524 0.30 0.42
28 0.80 12.8
604 0.40 1.25
3 290 0-60 0.28
850 -0.05 0.21
77 0.17 0.02
4O O.O4 O.O2
h, specimen of high, low concentration.
11 specimen of low concentration, influenced by h.13, 14, ls specimen of low concentration, uninfluenced.
200
180
160
140
120
100
60
40
20
0
GGT
200
180
160
140
120
100
80
60
40
20
Haemoglobin [g/I]
Figure 8. Interference of haemolysis. The hatched zone represents90 to 110//o recovery of the baseline value. Analytes tested were:creatine kinase, crealine kinase MB isoform, 7-glulamyltransferase,crealinine, total protein, uric acid, and fruclosamine.
bilirubin concentrations above 120 gmol/1 and 140 gmol/1,respectively (figure 7). Similar effects have been observedon other BM/Hitachi instruments [3].
Haemolysis caused interference with four of the methodstested (figure 8). Activities ofcreatine kinase and creatinekinase MB isoform were increased while that of 7-glutamyltransferase decreased. The protein assay gavepositive bias with haemolysis at high haemoglobinconcentrations > 4 g/l).
Two of the 16 methods evaluated were susceptible tointerference by lipaemia (figure 9). While immuno-globulin A concentration was increased, an opposite effectwas observed on the activities of aspartate aminotrans-ferase. A slight increase was also observed in concen-trations of C-reactive protein (+ 12) at high concen-trations of triglycerides > 1500 mmol/1).
200 200
180
160
1400i100
80
60
40
20
CRP
180
160
140
120
100
80
60
40
20
2.3 4.6 6.8 9.1 11.4 13.7 16.0 18.3
Triglycerides [mmol/I]
Figure 9. Interference of lipaemia. The hatched zone represents90 to 110% recovery of the baseline value. Analytes tested."pancreatic amylase, aspartate aminotransferase, calcium, cholesterol,iron, sodium, potassium, chloride, C-reactive protein, immuno-globulin A, transferrin, ferritin, phenobarbital, phenytoin,lheophylline, and digoxin.
Accuracy
Interlaboratory survey and quality control
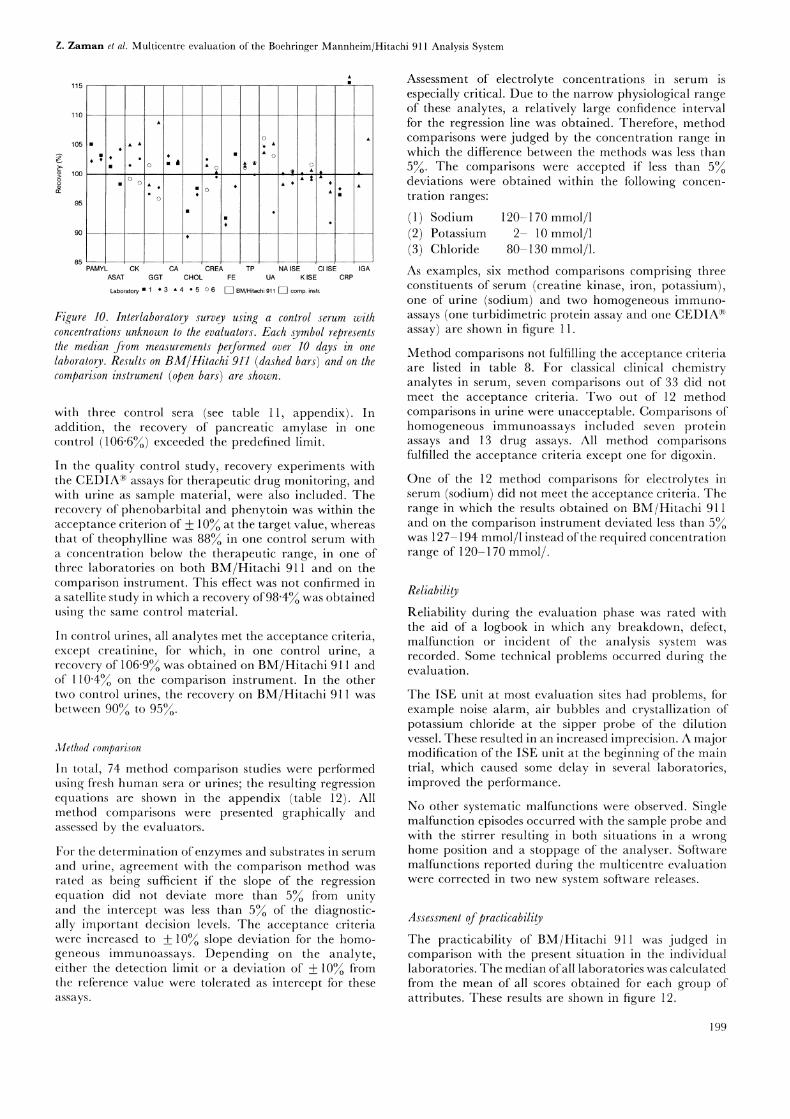
Five of the six laboratories participated in an inter-laboratory survey in which the concentrations of 15analytes were determined on BM/Hitachi 911 and on thecomparison instruments using one control serum (see table10, appendix). Results were defined as being acceptableif their deviations from the target values did not exceedby more than
___5 for classical analytes and __+ 10 for
the homogeneous immunoassays.
As shown in figure 10, all values measured on BM/Hitachi911 fulfilled the acceptance criteria except cholesterol,iron and uric acid. Decreased values were found forcholesterol and iron in two laboratories on BM/Hitachi911, whereas acceptable results were obtained on thecomparison instruments. Slightly increased uric acidvalues + 6) were measured in one of three laboratorieson BM/Hitachi 91 1.
Similar results were obtained in the quality control study
198
Z. Zaman el al. Multicentre evaluation of the Boehringer Mannheim/Hitachi 911 Analysis System
115
110
105
100
PAMYL CK CA CREA TP NA ISE CI ISEASAT GGT CHOL FE UA K ISE
Laboratory 50 [] BM/Hitachi [] comp. instr.
CRPIGA
Figure 10. Inlerlaboralory survey using a control serum withconcentrations unknown to the evaluators. Each symbol representslhe median from measurements performed over 10 days in onelaboratory. Results on BM/Hitachi 91"1 (dashed bars) and on thecomparison instrument (open bars) are shown.
with three control sera (see table 11, appendix). Inaddition, the recovery of pancreatic amylase in onecontrol (106"6%) exceeded the predefined limit.
In the quality control study, recovery experiments withthe CEDIA> assays tbr therapeutic drug monitoring, andwith urine as sample material, were also included. Therecovery of phenobarbital and phenytoin was within theacceptance criterion of 10 at the target value, whereasthat of theophylline was 88 in one control serum witha concentration below the therapeutic range, in one ofthree laboratories on both BM/Hitachi 911 and on thecomparison instrument. This effect was not confirmed ina satellite study in which a recovery of98"4 was obtainedusing the same control material.
In control urines, all analytes met the acceptance criteria,except creatinine, for which, in one control urine, a
recovery of 106"9o was obtained on BM/Hitachi 911 andot" 110"4 on the comparison instrument. In the othertwo control urines, the recovery on BM/Hitachi 911 wasbetween 90 to 95.
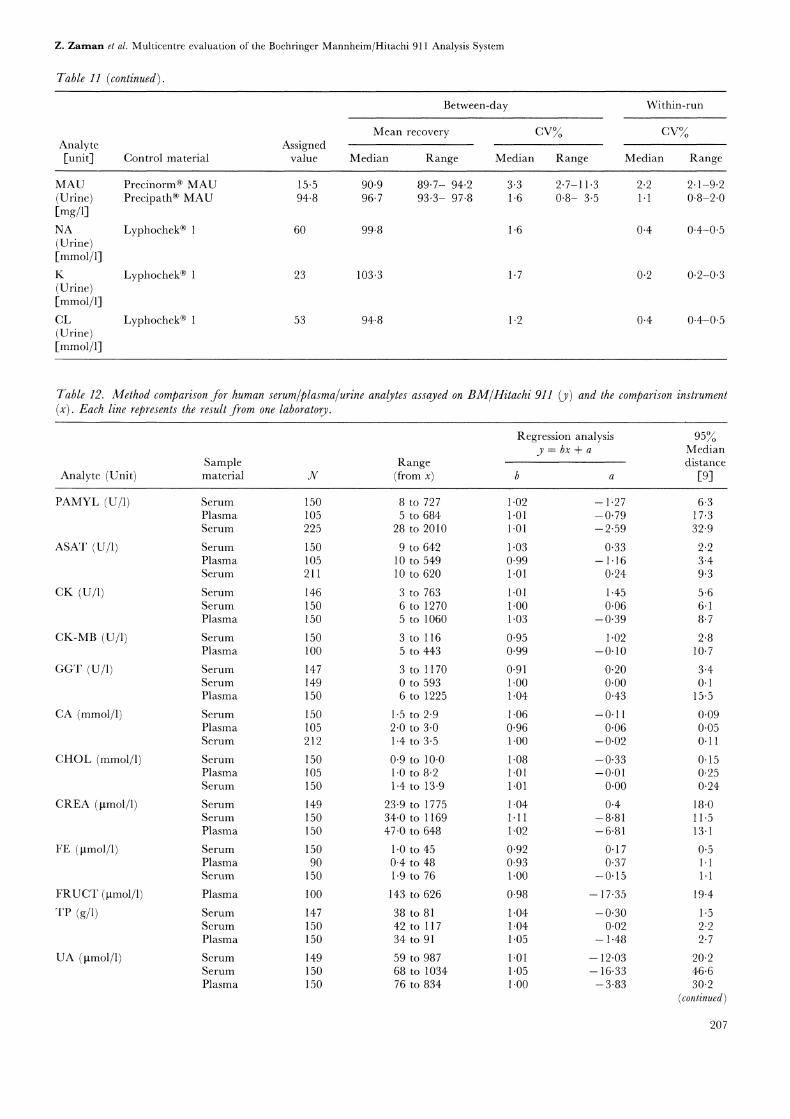
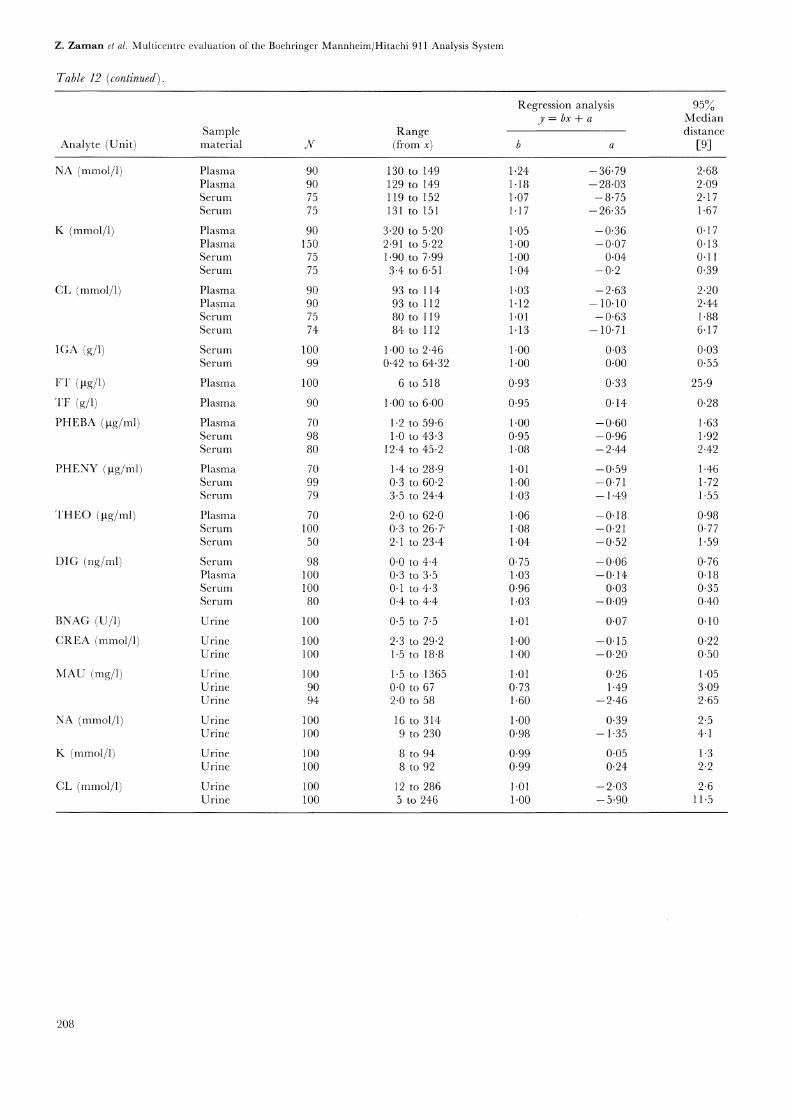
Method comparison
In total, 74 method comparison studies were performedusing fresh human sera or urines; the resulting regressionequations are shown in the appendix (table 12). Allmethod comparisons were presented graphically andassessed by the evaluators.
For the determination of enzymes and substrates in serumand urine, agreement with the comparison method wasrated as being sufficient if the slope of the regressionequation did not deviate more than 53/o from unityand the intercept was less than 5 of the diagnostic-ally important decision levels. The acceptance criteriawere increased to -+-10 slope deviation tbr the homo-geneous immunoassays. Depending on the analyte,either the detection limit or a deviation of 10 fromthe relrence value were tolerated as intercept for theseassays.
Assessment of electrolyte concentrations in serum isespecially critical. Due to the narrow physiological rangeof these analytes, a relatively large confidence intervalfor the regression line was obtained. Therefore, methodcomparisons were judged by the concentration range inwhich the difference between the methods was less than5%. The comparisons were accepted if less than 5%deviations were obtained within the following concen-tration ranges:
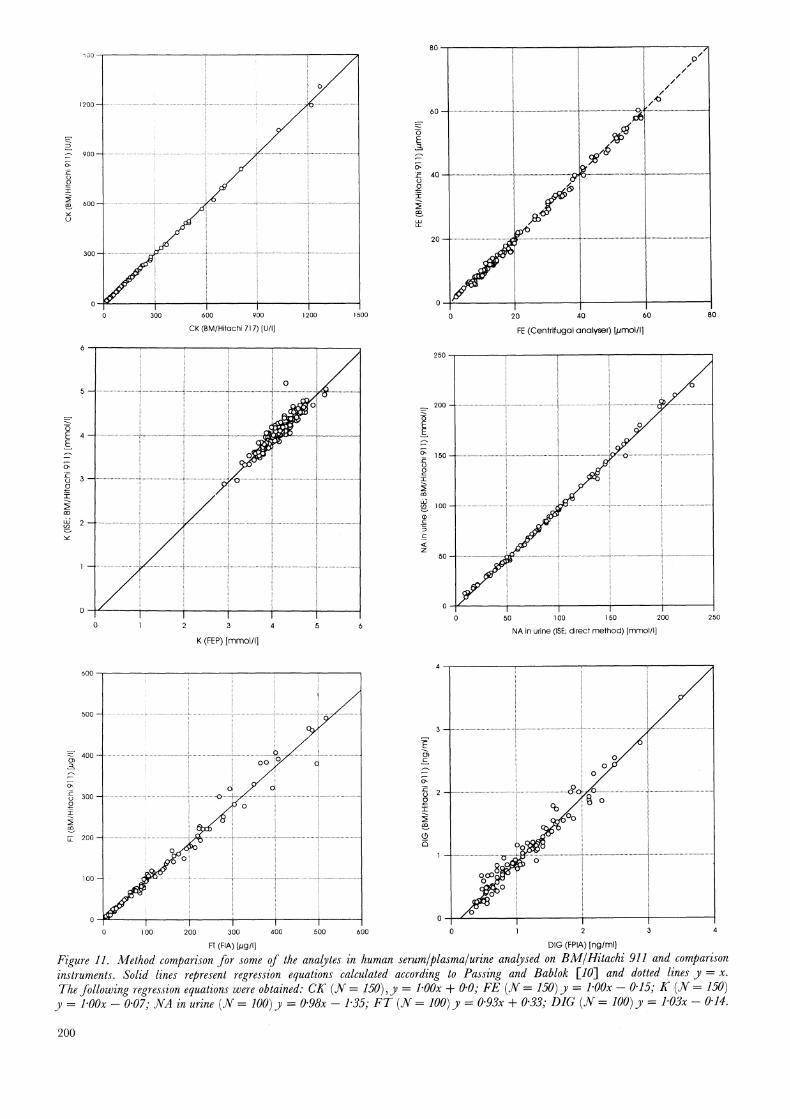
(1) Sodium 120-170 mmol/1(2) Potassium 2- 10 mmol/1(3) Chloride 80-130 mmol/1.As examples, six method comparisons comprising threeconstituents of serum (creatine kinase, iron, potassium),one of urine (sodium) and two homogeneous immuno-assays (one turbidimetric protein assay and one CEDIA"assay) are shown in figure 11.
Method comparisons not fialfilling the acceptance criteriaare listed in table 8. For classical clinical chemistryanalytes in serum, seven comparisons out of 33 did notmeet the acceptance criteria. Two out of 12 methodcomparisons in urine were unacceptable. Comparisons ofhomogeneous immunoassays included seven proteinassays and 13 drug assays. All method comparisonsfulfilled the acceptance criteria except one tbr digoxin.
One of the 12 method comparisons for electrolytes inserum (sodium) did not meet the acceptance criteria. Therange in which the results obtained on BM/Hitachi 911and on the comparison instrument deviated less than 5was 127-194 mmol/1 instead ofthe required concentrationrange of 120-170 retool/.
Reliability
Reliability during the evaluation phase was rated withthe aid of a logbook in which any breakdown, deiict,malfunction or incident of the analysis system wasrecorded. Some technical problems occurred during theevaluation.
The ISE unit at most evaluation sites had problems, ti0rexample noise alarm, air bubbles and crystallization ofpotassium chloride at the sipper probe of the dilutionvessel. These resulted in an increased imprecision. A majormodification of the ISE unit at the beginning of the maintrial, which caused some delay in several laboratories,improved the performance.
No other systematic malfunctions were observed. Singlemalfunction episodes occurred with the sample probe andwith the stirrer resulting in both situations in a wronghome position and a stoppage of the analyser. Softwaremalfunctions reported during the multicentre evaluationwere corrected in two new system software releases.
Assessment ofpracticabilityThe practicability of BM/Hitachi 911 was judged incomparison with the present situation in the individuallaboratories. The median ofall laboratories was calculatedfrom the mean of all scores obtained for each group ofattributes. These results are shown in figure 12.
199
oo
200
oo
,300- 600 900 1200
CK (BM/Hitachi 717) [U/l]
1500
o ...: o
0
K (FEP)[mmol/I]
FE (Centrifugal analyser) [pmol/I]
250
200
o o
5O
50 00 150 200 250
NA in urine (ISE; direct method) [retool/I]
600
500
400
300
200
1oo
100 200 300 400 500
FT (FIA) [/Jg/I]
6OO
- o}’_’"
DIG (FPIA) [ngiml]
Figure 11. Method comparison for some of the analytes in human serum/plasma/urine analysed on BM/Hitachi 91/ and comparisoninstruments. Solid lines represent regression equations calculated according to Passing and Bablok [10] and dotted lines y x.
The following regression equations were obtained: CK (N 150), y l’OOx + 0"0; FE (N 150)y l’OOx O’l& K (N 150)y l’OOx 0"07; NA in urine (N 100)y 0"98x 1"35; Fr (v oo)y 0"93x + 0"33; .DIG (N 100)y 1.03x 0.14.
2oo
Z. Zaman et al. Multicentre evaluation of the Boehringer Mannheim/Hitachi 911 Analysis System
Table 8. Individual method comparison results exceeding the acceptance limits.
Regression anlysis
Analyte Unit Slope IntercepComparison
method/instrument
7-Glutamyltransferase U/1 0.91 0"20Calcium mmol/1 1.06 0.11Cholesterol mmol/1 1.08 0.33Creatinine gmol/1 1.11 -8.81Iron tmol/1 0"92 0.17Iron gmol/1 0.93 0.37Fructosamine gmol/1 0.98 17.35
Albumin in urine mg/1 1.60 2.46Albumin in urine mg/1 0.73 1.50Digoxin ng/ml 0.75 0.06
BM/Hitachi 737Atomic absorption spectroscopyBM/Hitachi 704BM/Hitachi 717BM/Hitachi 704BM/Hitachi 747Reduction of nitrobluetetrazolium chloride; longerincubation timeRate nephelometryRadioimmunoassayFluorescence polarizationimmunoassay
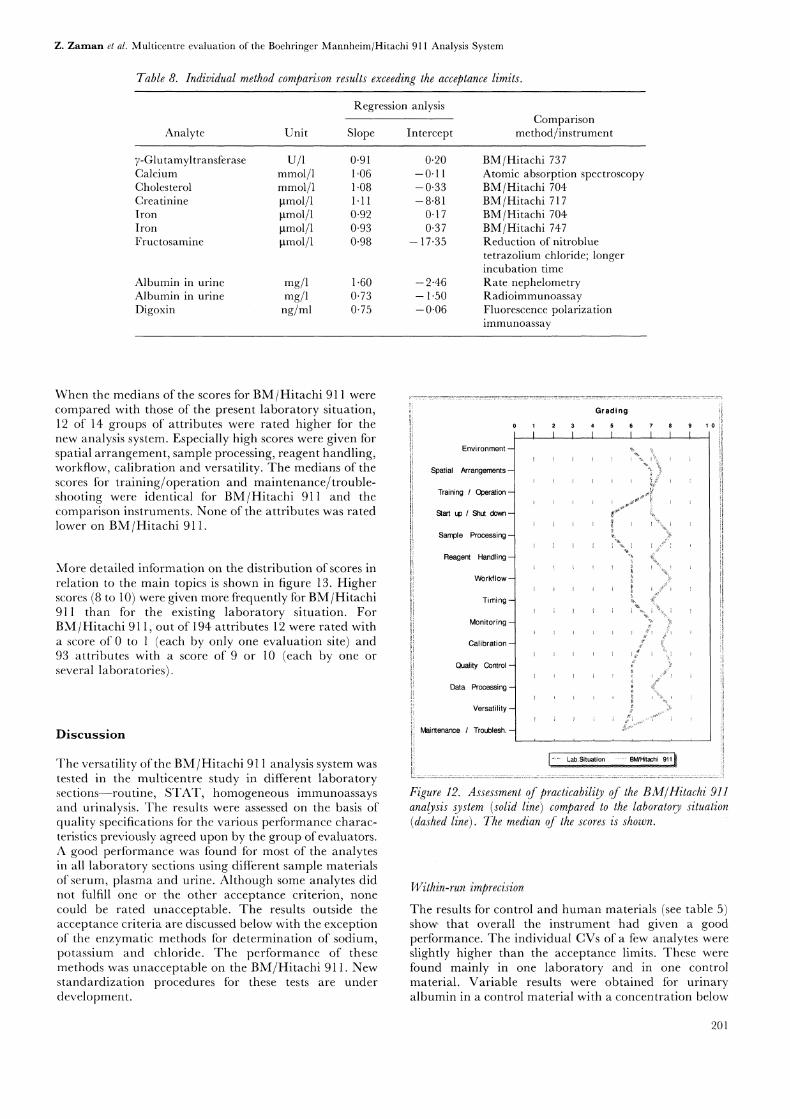
When the medians of the scores for BM/Hitachi 911 werecompared with those of the present laboratory situation,12 of 14 groups of attributes were rated higher for thenew analysis system. Especially high.scores were given forspatial arrangement, sample processing, reagent handling,workflow, calibration and versatility. The medians of thescores for training/operation and maintenance/trouble-shooting were identical for BM/Hitachi 911 and thecomparison instruments. None of the attributes was ratedlower on BM/Hitachi 911.
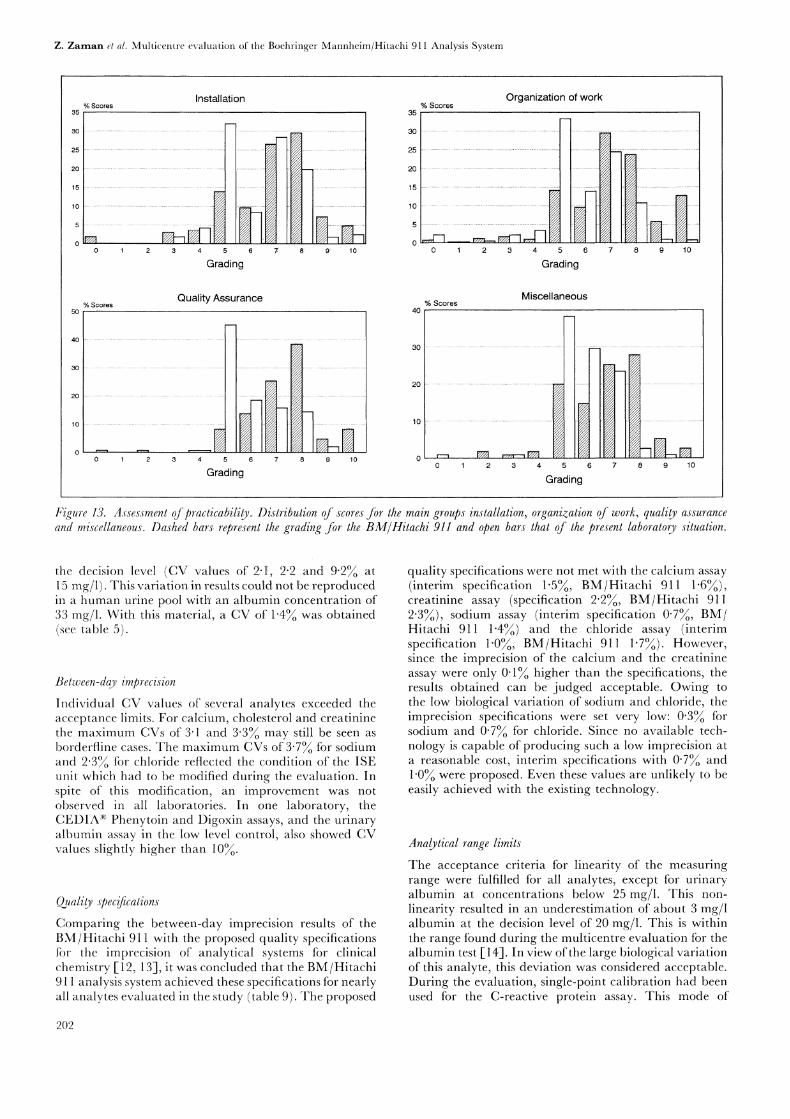
More detailed information on the distribution of scores inrelation to the main topics is shown in figure 13. Higherscores (8 to 10) were given more frequently for BM/Hitachi911 than for the existing laboratory situation. ForBM/Hitachi 911, out of 194 attributes 12 were rated witha score of 0 to (each by only one evaluation site) and93 attributes with a score of 9 or 10 (each by one orseveral laboratories).
Discussion
The versatility of the BM/Hitachi 911 analysis system wastested in the multicentre study in different laboratorysections--routine, STAT, homogeneous immunoassaysand urinalysis. The results were assessed on the basis ofquality specifications tbr the various performance charac-teristics previously agreed upon by the group of evaluators.A good pertbrmance was found for most of the analytesin all laboratory sections using different sample materialsof serum, plasma and urine. Although some analytes didnot fulfill one or the other acceptance criterion, nonecould be rated unacceptable. The results outside theacceptance criteria are discussed below with the exceptionof the enzymatic methods for determination of sodium,potassium and chloride. The performance of thesemethods was unacceptable on the BM/Hitachi 911. Newstandardization procedures for these tests are underdevelopment.
Environment
Spatial Arrangements
Training Operation-
Sample Processing-
Reagent Handling--
Workflow
Ti mi ng
Monitoring
Calibration
Quality Control--
Data Processing--
Versatility
Maintenance Troublesh.-
Grading
Figure 12. Assessment of practicability of the BM/Hitachi 911analysis system (solid line) compared to the laboratory situation(dashed line). The median of the scores is shown.
Within-run imprecision
The results for control and human materials (see table 5)show. that overall the instrument had given a goodperformance. The individual CVs of a few analytes wereslightly higher than the acceptance limits. These werefound mainly in one laboratory and in one controlmaterial. Variable results were obtained for urinaryalbumin in a control material with a concentration below
201
Z. Zaman el al. M-ulticentre evaluation of the Boehringer Mannheim/Hitachi 911 Analysis System
Installation% Scores
35
15
Grading
Quality Assurance% Scores
50
4.0
30
2o ,__., d4 >’//
10 i
10
Grading
35% Scores
Organization of work
0 3 4 5
Grading
Miscellaneous% Scores
40-.
0 3 5 7 8 9 10
Grading
Figure 13. Assessment ofpracticabili.. Distribution of scores for the main groups installation, organization of work, quality assuranceand miscellaneous. Dashed bars, represenl the grading for the BM/Hitachi 911 and open bars that of the present laboratory situation.
the decision level (CV vMues of 2"1I, 2"2: and 9"2% at15 mg/1). This variation in results could not be reproducedin a human urine pool with’ an albumir concentration of33 rag/1. With this material:,, a CV of 1"4 was obtained(see table 5).
Belween-day imprecision
Individual CV values of several analytes exceeded theacceptance limits. For calcium, cholesterol and creatininethe maximum CVs ot" 3"1 and 3"3 may still be seen asborderfline cases. The maximum CVs of 3"73/0 for sodiumand 2"3 for chloride reflected the condition of the ISEunit which had to be modified during the evaluation. Inspite of this modification, an improvement was not
observed in all laboratories. In one laboratory, theCEDIA:"> Phenytoin and Digoxin assays, and the urinaryalbumin assay in the low level control, also showed CVvalues slightly higher than 10.
Quality speccalions
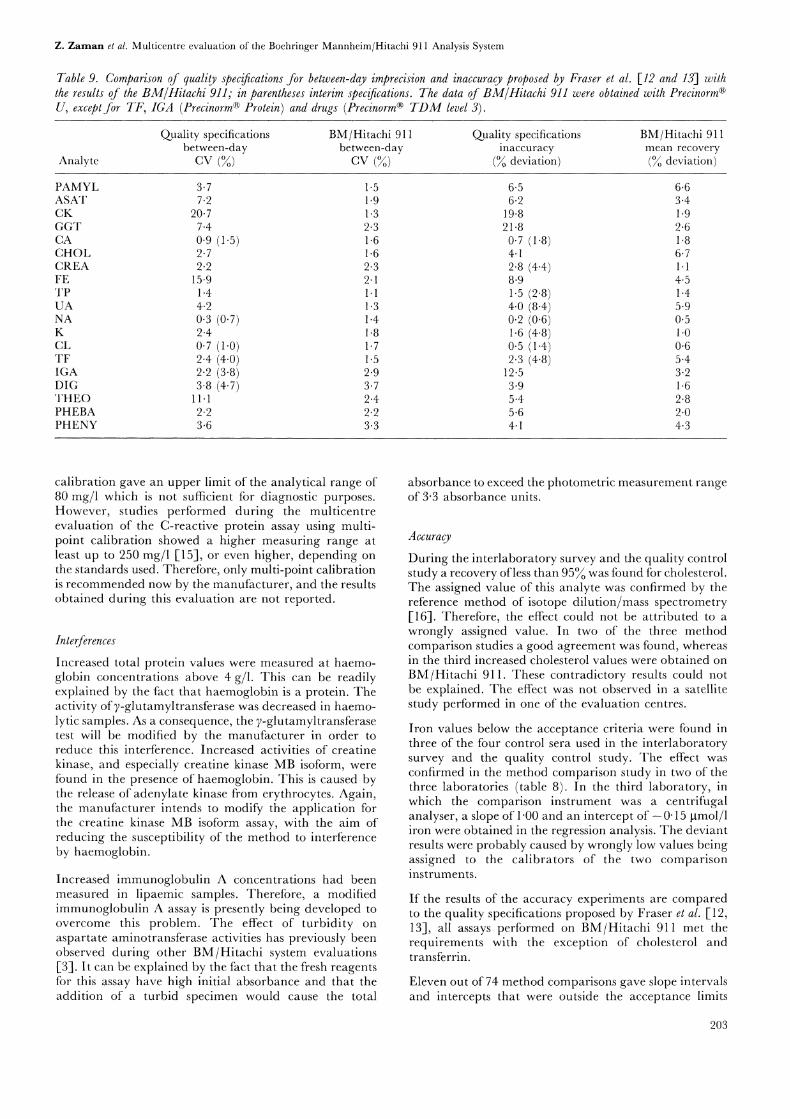
Comparing the between-day imprecision results of theBM/Hitachi 911 with the proposed quality specificationstbr the imprecision of analytical systems tbr clinicalchemistry [12, 13], it was concluded that the BM/Hitachi911 analysis system achieved these specifications for nearlyall analytes evaluated in the study (table 9). The proposed
quality specifications were not met with the calcium assay(interim specification 1"5, BM/Uitachi 911 1"6%),creatinine assay (specification 2"2, BM/Hitachi 9112"3%), sodium assay (interim specification 0"7%, BM/Hitachi 911 1"4%) and the chloride assay (interimspecification 1"0%, BM/Hitachi 911 1"7%). However,since the imprecision of the calcium and the creatinineassay were only 0"1 higher than the specifications, theresults obtained can be judged acceptable. Owing to
the low biological variation of sodium and chloride, theimprecision specifications were set very low: 0"3 forsodium and 0"7% for chloride. Since no available tech-nology is capable of producing such a low imprecision ata reasonable cost, interim specifications with 0"7 and1"0 were proposed. Even these values are unlikely to beeasily achieved with the existing technology.
Analylical range limits
The acceptance criteria tbr linearity of the measuringrange were fulfilled for all analytes, except for urinaryalbumin at concentrations below 25 mg/1. This non-
linearity resulted in an underestimation of about 3 mg/1albumin at the decision level of 20 mg/1. This is withinthe range found during the multicentre evaluation tbr thealbumin test [14]. In view of the large biological variationof this analyte, this deviation was considered acceptable.During the evaluation, single-point calibration had beenused for the C-reactive protein assay. This mode of
202
Z. Zaman et al. Multicentre evaluation of the Boehringer Mannheim/Hitachi 911 Analysis System
Table 9. Comparison of quality specifications for between-day imprecision and inaccuracy proposed by Fraser et al. [12 and 13] withthe results of the BM/Hitachi 911; in parentheses interim specifications. The data of BM/Hitachi 911 were obtained with Precinorm(R)
U, except for TF, IGA (Precinor,m(R) Protein) and drugs (Precinorm(R) TDM level 3).
Analyte
Quality specifications BM/Hitachi 911 Quality specifications BM/Hitachi 911between-day between-day inaccuracy mean recoveryCV () CV () ( deviation) (% deviation)
PAMYL 3.7 1.5 6.5 6.6ASAT 7.2 1.9 6"2 3.4CK 20.7 1.3 19.8 1.9GGT 7.4 2"3 21.8 2.6CA 0.9 (1.5) 1.6 0.7 (1.a) 1.8CHOL 2.7 1.6 4.1 6.7CREA 2.2 2.3 2.8 (4.4) 1.1FE 15.9 2.1 8.9 4.5TP 1.4 1.1 1.5 (2.8) 1.4UA 4-2 1.3 4.0 (8.4) 5.9NA 0.3 (0-7) 1.4 0.2 (0.6) 0.5K 2.4 1.8 1.6 (4.8) 1.0CL 0.7 (1.0) 1.7 0.5 (1.4) 0-6TF 2.4 (4.0) 1.5 2.3 (4.8) 5.4IGA 2.2 (3.8) 9.9 12.5 3.2DIG 3.8 (4.7) 3.7 3.9 1.6THEO 11.1 2.4 5.4 2.8PHEBA 2.2 2.2 5.6 2.0PHENY 3.6 3.3 4.1 4.3
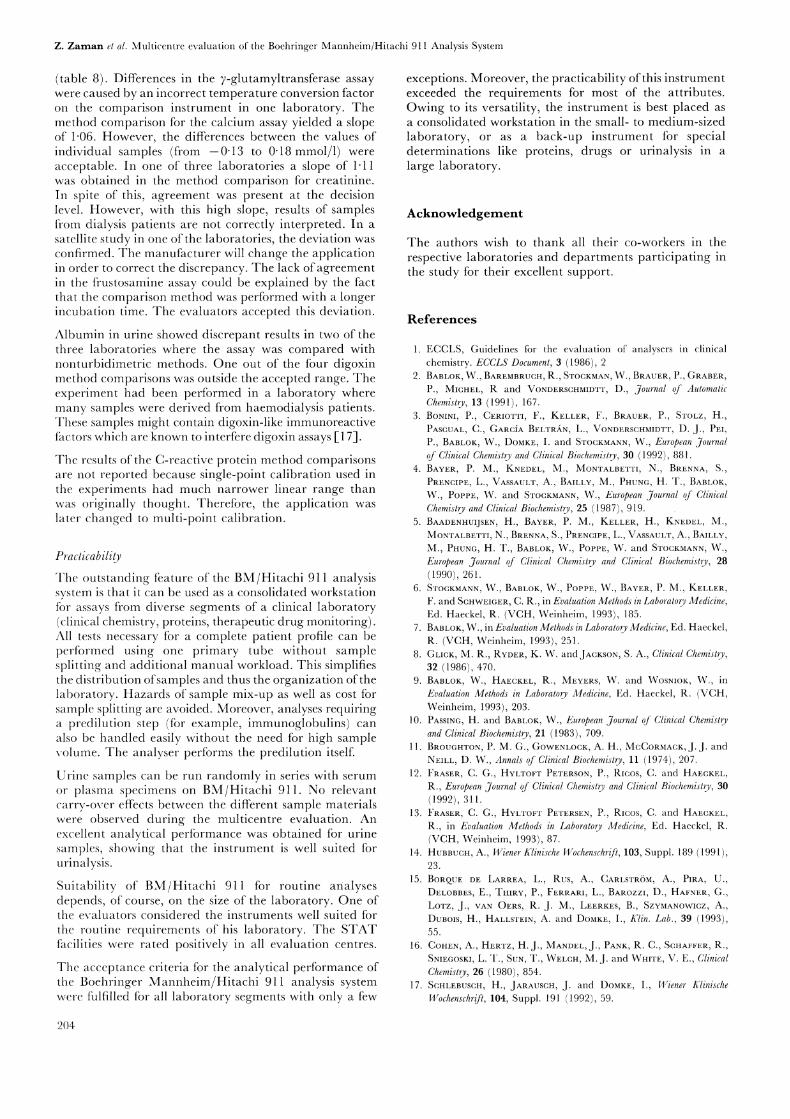
calibration gave an upper limit of the analytical range of80 mg/1 which is not sufficient for diagnostic purposes.However, studies performed during the multicentreevaluation of the C-reactive protein assay using multi-point calibration showed a higher measuring range atleast up to 250 mg/1 [15-1, or even higher, depending onthe standards used. Therefore, only multi-point calibrationis recommended now by the manufacturer, and the resultsobtained during this evaluation are not reported.
lnlerferencesIncreased total protein values were measured at haemo-globin concentrations above 4 g/1. This can be readilyexplained by the ttct that haemoglobin is a protein. Theactivity of/-glutamyltransferase was decreased in haemo-lytic samples. As a consequence, the 7-glutamyltransferasetest will be modified by the manufacturer in order toreduce this interference. Increased activities of creatinekinase, and especially creatine kinase MB isoform, werefound in the presence of haemoglobin. This is caused bythe release of adenylate kinase from erythrocytes. Again,the manufacturer intends to modify the application forthe creatine kinase MB isoform assay, with the aim ofreducing the susceptibility of the method to interferenceby haemoglobin.
Increased immunoglobulin A concentrations had beenmeasured in lipaemic samples. Theretbre, a modifiedimmunoglobulin A assay is presently being developed toovercome this problem. The effect of turbidity onaspartate aminotransferase activities has previously beenobserved during other BM/Hitachi system evaluationsI-3-1. It can be explained by the fact that the fresh reagentstbr this assay have high initial absorbance and that theaddition of a turbid specimen would cause the total
absorbance to exceed the photometric measurement rangeof 3"3 absorbance units.
Avcuracy
During the interlaboratory survey and the quality controlstudy a recovery ofless than 95 was found for cholesterol.The assigned value of this analyte was confirmed by thereference method of isotope dilution/mass spectrometry[16]. Therefore, the effect could not be attributed to awrongly assigned value. In two of the three methodcomparison studies a good agreement was found, whereasin the third increased cholesterol values were obtained on
BM/Hitachi 911. These contradictory results could notbe explained. The effect was not observed in a satellitestudy performed in one of the evaluation centres.
Iron values below the acceptance criteria were found inthree of the four control sera used in the interlaboratorysurvey and the quality control study. The effect wasconfirmed in the method comparison study in two of thethree laboratories (table 8). In the third laboratory, inwhich the comparison instrument was a centrifugalanalyser, a slope of 1-00 and an intercept of-0"15 gmol/1iron were obtained in the regression analysis. The deviantresults were probably caused by wrongly low values beingassigned to the calibrators of the two comparisoninstruments.
If the results of the accuracy experiments are comparedto the quality specifications proposed by Fraser el al. [12,13], all assays performed on BM/Hitachi 911 met therequirements with the exception of cholesterol andtransferrin.
Eleven out of 74 method comparisons gave slope intervalsand intercepts that were outside the acceptance limits
2O3
Z. Zaman el al. Multicentre evaluation of the Boehringer Mannheim/Hitachi 911 Analysis System
(table 8). Differences in the 7-glutamyltransferase assaywere caused by an incorrect temperature conversion factoron the comparison instrument in one laboratory. Themethod comparison tbr the calcium assay yielded a slopeof 1"06. However, the differences between the values ofindividual samples (from -0"13 to 0"18 mmol/1) were
acceptable. In one of three laboratories a slope of 1"11was obtained in the method comparison for creatinine.In spite of this, agreement was present at the decisionlevel. However, with this high slope, results of samplestiom dialysis patients are not correctly interpreted. In asatellite study in one of the laboratories, the deviation wasconfirmed. The manufacturer will change the applicationin order to correct the discrepancy. The lack of agreementin the tiustosamine assay could be explained by the factthat the comparison method was performed with a longerincubation time. The evaluators accepted this deviation.
Albumin in urine showed discrepant results in two of thethree laboratories where the assay was compared withnonturbidimetric methods. One out of the four digoxinmethod comparisons was outside the accepted range. Theexperiment had been pertbrmed in a laboratory wheremany samples were derived from haemodialysis patients.These samples might contain digoxin-like immunoreactivethctors which are known to interfere digoxin assays [ 17].
The results ot’the C-reactive protein method comparisonsare not reported because single-point calibration used inthe experiments had much narrower linear range thanwas originally thought. ThereIbre, the application waslater changed to multi-point calibration.
Praclicabiliy
The outstanding tiature of the BM/Hitachi 911 analysissystem is that it can be used as a consolidated workstationtbr assays from diverse segments of a clinical laboratory(clinical chemistry, proteins, therapeutic drug monitoring).All tests necessary tbr a complete patient profile can bepertbrmed using one primary tube without samplesplitting and additional manual workload. This simplifiesthe distribution ofsamples and thus the organization ofthelaboratory. Hazards ot’sample mix-up as well as cost forsample splitting are avoided. Moreover, analyses requiringa predilution step (tbr example, immunoglobulins) canalso be handled easily without the need for high samplevolume. The analyser pertbrms the predilution itself.
Urine samples can be run randomly in series with serumor plasma specimens on BM/Hitachi 911. No relevantcarry-over effects between the different sample materialswere observed during the multicentre evaluation. Anexcellent analytical pertbrmance was obtained for urinesamples, showing that the instrument is well suited forurinalysis.
Suitability of BM/Hitachi 911 for routine analysesdepends, of course, on the size of the laboratory. One ofthe evaluators considered the instruments well suitedthe routine requirements of his laboratory. The STATfacilities were rated positively in all evaluation centres.
The acceptance criteria tbr the analytical pertbrmance ofthe Boehringer Mannheim/Hitachi 911 analysis systemwere thlfilled tbr all laboratory segments with only a few
exceptions. Moreover, the practicability of this instrumentexceeded the requirements for most of the attributes.Owing to its versatility, the instrument is best placed asa consolidated workstation in the. small- to medium-sizedlaboratory, or as a back-up instrument for specialdeterminations like proteins, drugs or urinalysis in a
large laboratory.
Acknowledgement
The authors wish to thank all their co-workers in therespective laboratories and departments participating inthe study for their excellent support.
References
1. ECCLS, Guidelines for the evaluation of analysers in clinical
chemistry. ECCLS Document, 3 (1986), 22. BABLOK, W., BAREMBRUCH, R., STOCKMAN, W., BRAVER, P., GRABER,
P., MICHEL, R and VONDERSCHMIDTa’, D., Journal of Automatic
Chemistry, 13 1991 ), 167.3. BONINI, P., CERIOTTI, f., KELLER, F., BRAVER, P., STOLZ, H.,
PASCUAL, C., GARCfA BEI:rRAN, L., VONDERSCHMIDTT, D. J., PEI,P., BABLOK, W., DOMKE, I. and STOCKMANN, W., European Journalof Clinical Chemistry and Clinical Biochemistry, 30 (1992), 881.
4. BAYER, P. M., KNEDEL, M., MONTALBETTI, N., BRENNA, S.,PRENCIPE, L., VASSAULT, A., BAILEY, M., PHUNG, H. T., BABLOK,W., POPPE, W. and STOCKMANN, W., European Journal of Clinical
Chemistry and Clinical Biochemistry, 25 (1987), 919.5. BAADENHUIJSEN, H., BAYER, P. M., KELLER, H., KNEDEL, M.,
MONTALBETTI, N., BRENNA, S., PRENCIPE, L., VASSAULT, A., BAILEY,M., PHUNG, H. T., BABLOK, W., POPPE, W. and STOCKMANN, W.,European Journal of Clinical Chemistry and Clinical Biochemistry, 28
(1990), 261.6. STOCKMANN, W., BABLOK, W., POPPE, W., BAYER, P. M., KELLER,
F. and SCI-tWEmER, C. R., in Evaluation Methods in Laboratory Medicine,Ed. Haeckel, R. (VCH, Weinheim, 1993), 185.
7. BABLOK, W., in Evaluation Methods in Laboratory Medicine, Ed. Haeckel,R. (VCH, Weinheim, 1993), 251.
8. GLICK, M. R., RYDER, K. W. and JACKSON, S. A., Clinical Chemistry,32 (1986), 470.
9. BABLOK, W., HAECKEL, R., MEYERS, W. and WosrqOK, W., inEvaluation Methods in Laboratory Medicine, Ed. Haeckel, R. (VCH,Weinheim, 1993), 203.
10. PASSiNg, H. and BABLOK, W., European Journal of Clinical Chemistryand Clinical Biochemistry, 21 (1983), 709.
11. BROV(ma’ON, P. M. G., GOWENIOCK, A. H., McCORMACK, J. J. andNEILL, D. W., Annals of Clinical Biochemistry, 11 (1974), 207.
12. FRASER, C. G., HYLTOFT PETERSON, P., RICOS, C. and HAECKEL,R., European Journal of Clinical Chemistry and Clinical Biochemistry, 30
(1992), 311.13. FRASER, C. G., HYLTOFT PETERSEN, P., RICOS, C. and HAECKEL,
R., in Evaluation Methods in Laboratory Medicine, Ed. Haeckel, R.(VCH, Weinheim, 1993), 87.
14. HuvcI-I, A., Wiener Klinische Wochenschrifi, 103, Suppl. 189 (1991),23.
15. BORQUE DE LARREA, L., Rus, A., CARLSTR6M, A., PIRA, U.,DELOBBES, E., THIRY, P., FERRARI, L., BAROZZI, D., HAFNER, G.,LOTZ, J., VAN OERS, e. J. M., LEERKES, g., SZYMANOWICZ, A.,DUBOIS, H., HALLSTEIN, A. and DOKE, I., Klin. Lab., 39 (1993),55.
16. COIEN, A., HERTZ, H.J., MANDEL, J., PANK, e. C., SCHAFFER, R.,SNIEOSKI, L. T., SVN, T., WEICH, M.J. and WroTE, V. E., Clinical
Chemistry, 26 (1980), 854.17. ScI-IIEVSCn, H., JARAUSCH, J. and DOMKE, I., Wiener Klinische
Wochenschrift, 104, Suppl. 191 (1992), 59.
204
Z. Zaman et al. Multicentre evaluation of the Boehringer Mannheim/Hitachi 911 Analysis System
Appendix
Table 10. Control and calibration materials.
Calibrator/control material Lot No.
Calibrator for automated systems,C.f.a.s. (lyophilized)
Calibrator for automated systems,C.f.a.s (liquid)*
ISE CompensatorPrecimat(R) FructosaminePreciset(R) MAUPrecimat(R) BNAGPrecimat’ CRPPrecimat(R) IGAPrecimat TransferrinPreciset(R) FerritinCalibrator low/high THEOCalibrator low/high PHEBACalibrator low/high PHENYCalibrator low/high DIGPrecinorm(R) UPrecipathe UPrecipath(R) Evaluation*Precinorm FructosaminePrecipath FructosaminePrecinorm’ MAUPrecipath MAUPrecinorm:- NAGPrecinorm-’ ProteinPrecinorm TDMPrecinorm: TDM 3
(Boehringer Mannheim GmbH,Mannheim, Germany)
Interlaboratory surveyPrecinorm.-,’ UC.f.a.s. Proteins
Lyphochek,!’
Quantitative urine control normallevel (Bio-Rad Laboratories,M/inchen, Germany)
172219
176 286
636238172O78176872628 7551746380217420001172644701173223A 7601 C/A 7602 CA 7735 B/A 7736 BA 7502 B/A 7511 BA 7667 B/A 7668 B169 151173579174412175 900171 630175221175 367628 7571770311750509017505290
168 588178 586
52201
* Only for evaluation purposes.
Table 11. Imprecision and recovery of all laboratories in individual control materials on the BM/Hilachi 911.
Between-day Within-run
Mean recovery CV CVAnalytc Assigned[unit] Control material value Median Range Median Range Median Range
PAMYL Precinorm" U 385 106.6 104.5-107-0 1.5 1.5-2.9[U/1] Precipath" U 518 102.4 99.2-103.1 1.1 1.0-2-9
Precipath" Evaluation 504 100.4 99.3-102.0 1.7 1.3-2.4
ASNI" Precinorm’" U 53 103.4 97.3-104.6 1.9 1.3-2.7[U/1] Precipath" U 125 100.5 94.8-100.7 1.4 1-0-1.5
Precipath" Evaluation 90 100.9 97.8-103.0 1.8 1.5-2.1
CK Precinorm" U 258 98.1 97.4-103-5 1.3 1.0-1.3[U/1] Precipath" U 471 98.7 98.1-103.8 1.2 0.7-1.2
Precipath" Evaluation 322 102.2 100.6-106.8 1-2 0.8-1.5
GC;I" Precinorm" U 62 97.4 95.5- 9.8.2 2"3 1.6-2.4[U/1] Precipath" U 189 99.0 97.4-101.0 1.7 1.4-2.0
Precipath" Evaluation 102 100.7 98.2-102.5 1.7 1.5-1.7
0.6 0.6-1.20.8 0.7-0.81.0 0.8-1.1
1.6 1.2-2.20.8 0.8-0.91.3 1.2-1.4
0.9 0.8-1.20.7 0.5-1.61.1 0.7--1.6
1.1 1.0-1.4O.5 O.5-0.80.8 0.7-1.0
(continued)
2O5
Z. Zaman et al. Multicentre evaluation of the Boehringer Mannheim/Hitachi 911 Analysis System
Table 11 (continued).
Between-day Within-run
Mean recovery CV CVAnalytc Assigned[unit] Control material value Median Range Median Range Median Range
CA[mmol/1]
CHOL[mmol/1]
CREA[gmol/1]
FRUCT[lamol/1]
FE[gmol/1]
TP[g/1]
UA[-tmol/1-]
NA[mmol/1]
K[mmol/1]
CL[mmol/1]
CRP[mg/1]
IGA[g/1]
F’I’[gg/1]
TF[-g/l]
PHEBA[gg/ml]
PHENY[gg/ml-]
THEO[gg/ml]
DIG[ng/ml]
[u/q
CREA(.Urine)[mmol/1-]
206
Precinorm UPrecipath’ UPrccipath(R) Evaluation
PrecinormR UPrecipath UPrecipath Evaluation
Precinorm(R) UPrecipath(R) UPrecipath(R) Evaluation
Precinorm’ FructosaminePrecipath(R) Fructosamine
Prccinorm(R) UPrecipath’ UPrecipath(R) Evaluation
Precinorm UPrecipath- UPrccipath(R) Evaluauon
Precinorm(R) UPrecipath(R) UPrecipath Evaluation
Precinorm UPrecipath UPrecipatht Evaluation
Precinorm UPrecipath UPrecipath(R) Evaluation
Precinormc-’ UPrecipath UPrecipath Evaluauon
Prccinorm Protein
Precinorm(R) UPrecinorm’-" Protein
Precinorm(R) Protein
Precinorm(R) UPrecinorm(R) Protein
Prccinorm(R) TDMPrecinorm(R) TDM 3
Precinorm TDMPrecinorm(R) TDM 3
Prccinorm’-e TDMPrecinorma’ TDM 3
Precinorm: TDMPrecinorm(R) TDM 3
Prccinorm’:e BNAG
Lyphochck*Precinorm’-" MAUPrecipath MAU
2.3 101.8 100.4-103.5 1-6 1-4- 2.73.5 100.0 99.7-102.1 2-0 1.4- 2.52.4 101.3 101.3-101.3 1.7 1.4- 3.1
2.9 93.3 87.7- 95.5 1.6 1.2- 2.63.2 89.3 80.3- 91.8 2-6 2.3- 3.14.0 96-1 92.9- 98.5 2.1 1.5- 2.4
190 101.1 100.1-101.4 2.3 1.5- 2.5344 98.3 97.1-100.2 2-7 1-7- 3.1163 94.8 94.4- 96.0 2.9 1.7- 3.3
287 96-8 3.1552 101.1 2.O
19.5 85.5 84.7- 86.2 2.1 1-4- 2.224.6 94.6 92.8- 95.9 2-2 2.0- 2.332.7 97.1 96.5- 98.2 1.9 1.3- 2.5
51 101.4 100.6-102.4 1.1 1.0- 1.142 105-0 103.8-106-0 1.4 1.1- 1.552 104-1 102.9-104.5 1.4 1.2- 1.5
289 105.9 105.6-108.3 1-3 1.2- 2.6589 102.5 102.4-104.6 1-3 1.0- 1.7247 103.8 103.2-106-9 1.5 1.3- 2.9
129 99.5 98.2-101.3 1-4 1.4- 1.4135 100-1 100.1-101.7 1.4 1.3- 1.984 101.7 96-4-101.7 2.6 2.3- 3.7
4.9 99.0 98.5-101.0 1.8 1-0- 2.06.6 100.8 100.1-102.4 1.7 1.5- 1.94.6 101.1 100.5-101.5 1.6 1.3- 2.0
85105101
49
1.83.6
95
2.34.5
6.149.2
4.425.4
5.025.3
0.953.2
7.716.14.3
100.6 98.0-101.2 1.7 1-6- 2.3103.5 100.5-104.6 1.7 1.6- 2.396.4 95.0- 97.3 1-8 1.6- 2.3
102.7 100.7-104.6 2.6 0.8- 4.7
1.4 0.7-1.50.8 0.7-0-80-8 0.8-1.5
1.6 1.2-1.91.6 1.1-1-82-0 1-5-2.1
1.6 0.9-1.61.0 0.8-1.51.4 1.4-1.5
1.0 0.7-1.10.9 0.8-1-0
1.8 1.3-3.11.3 0.9-1-50.9 0.9-1.5
0.5 0.4-1.50.8 0.4-1.10.7 0.5-1.4
0.6 0.4-0.70-5 0.5-0.81-0 0.9-1.0
0-7 0.4-1.00.4 0.3-1.01-0 0-5-1-3
0.8 0.3-1.10.6 0.4-1.40.7 0.5-1.3
1.1 0.5-1.20.5 0.4-0.70.7 0.6-0.8
1.3 0.8-1.8
96.9- 97.8 1.3- 2.3 1-9-2.096.8- 96.8 0.7- 1.5 0-9-1.4
102.0 2.8
98.0 6.994.6 2.9
103.3 96.7-103.3 6.0 3.1- 6.497.8 95-6-102.0 2.2 1. l- 2-9
106.8 95.5-106.8 6.6 4.6-11.795.7 94-9- 96-1 3.3 2-3- 4.0
94.0 88-0- 96.0 4.2 3.6- 5.797.2 93-7- 98.4 2.4 2.4- 2.5
101.1 91.6-110.5 9.4 6.9-10.298.4 95.0-104.5 3.7 1.6- 4.3
1.1
1.6 1.3-3.5
3.0 2.0-3.01.5 1.4-1-9
3.9 2.9-4.21.7 1-7-1.8
5.9 5.6-8.42.6 2.1-4.5
4.8 4.3-4.82.1 2.0-2.3
7.6 6.5-8.83.5 2.4-4.0
0.9 0.8-1.1
101.4-106.9 1.6- 3,7 1.3-1.790.7- 92.8 0.9- 3.3 1.1-1.293.5- 94.9 2-7- 4.0 1.3-1.4
Z. Zaman et al. Multicentre evaluation of the Boehringer Mannheim/Hitachi 911 Analysis System
Table 11 (continued).
Between-day Within-run
Mean recovery CV CVAnalyte Assigned[unit] Control material value Median Range Median Range Median Range
MAU Precinorm(R) MAU 15.5 90.9(Urine) Precipath(R) MAU 94.8 96.7[mg/1]NA Lyphochek(R) 60 99.8(Urine)[mmol/1]K Lyphochek(R) 23 103.3(Urine)[mmol/1]CL Lyphochek(R) 53 94.8(Urine)[mmol/1]
89.7- 94.2 3.3 2.7-11.3 2"2 2.1-9.293.3- 97.8 1.6 0.8- 3.5 1.1 0.8-2.0
1.6 0.4 0.4-0.5
1.7 0.2 0.2-0.3
"2 0.4 0.4-0.5
Table 12. Method comparison for human serum/plasma/urine analytes assayed on BM/Hitachi 911 ) ,and,the comparison instrument(x). Each line represents the result from one laboratory.
Regression analysisy=bx+a
Sample RangeAnalyte (Unit) material N (from x) b
95,?/oMediandistance
[9]
PAMYL (U/l) Serum 150 8 to 727 1.02Plasma 105 5 to 684 1.01Serum 225 28 to 2010 1-01
ASAT (U/l) Serum 150 9 to 642 1-03Plasma 105 10 to 549 0.99Serum 211 10 to 620 1.01
CK (U/l) Serum 146 3 to 763 1.01Serum 150 6 to 1270 1.00Plasma 150 5 to 1060 1.03
CK-MB (U/l) Serum 150 3 to 116 0.95Plasma 100 5 to 443 0.99
GGT (U/l) Serum 147 3 to 1170 0.91Serum 149 0 to 593 1.00Plasma 150 6 to 1225 1.04
CA (mmol/1) Serum 150 1.5 to 2.9 1.06Plasma 105 2"0 to 3.0 0"96Serum 212 1.4 to 3.5 1.00
CHOL (mmol/1) Serum 150 0.9 to 10.0 1.08Plasma 105 1.0 to 8.2 1.01Serum 150 1.4 to 13.9 1.01
CREA (lamol/1) Serum 149 23.9 to 1775 1.04Serum 150 34.0 to 1169 1.11Plasma 150 47,0 to 648 i.02
FE (gmol/1) Serum 150 1.0 to 45 0.92Plasma 90 0.4 to 48 0.93Serum 150 1.9 to 76 1,00
FRUCT (gmol/1) Plasma 100 143 to 626 0.98
TP (g/l) Serum 147 38 to 81 1-04Serum 150 42 to 117 1.04Plasma 150 34 to 91 1.05
UA (gmol/1) Serum 149 59 to 987 1.01Serum 150 68 to 1034 1.05Plasma 150 76 to 834 1.00
-1.27-0.79-2.59
0.33-1.160.24
1.450.06
-0.39
1.02-0.10
O.2O0-000.43
-0.110.06
-,O-O2
-0.33-0.01
0.00
0.4-8.81-6.81
0.170.37
-0.15
-17.35
-0.300-021.48
12.03-16.33-3.83
6.317.332.9
2"23.49.3
5.66.18.7
2’810.7
3.40.115"5
0.090.050.11
0.15O-250.24
18.011.513.1
0.51.11.1
19.4
1.52"22.7
2O’246.630’2
(continued)
207
Z. Zarnan et al. Multicentre evaluation of the Boehringer Mannheim/Hitachi 911 Analysis System
Table 12 (continued).
Sample RangeAnalyte (Unit) material 3/ (from x)
Regression analysisy=bx+a
b a
95?/0Mediandistance
fg]
NA (mmol/1) Plasma 90 130 to 149Plasma 90 129 to 149Serum 75 119 to 152Serum 75 131 to 151
K (mmol/1) Plasma 90 3.20 to 5"20Plasma 150 2.91 to 5-22Serum 75 1.90 to 7.99Serum 75 3.4 to 6.51
CL (mmol/1) Plasma 90 93 to 114Plasma 90 93 to 112Serum 75 80 to 119Serum 74 84 to 112
IGA (g/l) Serum 100 1.00 to 2.46Serum 99 0.42 to 64.32
FT (gg/1) Plasma 100 6 to 518
TF (g/l) Plasma 90 1.00 to 6.00
PHEBA (gg/ml) Plasma 70 1"2 to 59.6Serum 98 1.0 to 43.3Serum 80 12.4 to 45.2
PHENY (gg/ml) Plasma 70 1.4 to 28.9Serum 99 0.3 to 60.2Serum 79 3.5 to 24.4
THEO (gg/ml) Plasma 70 2"0 to 62"0Serum 100 0.3 to 26" 7"Serum 50 2"1 to 23.4
DIG (ng/ml) Serum 98 0"0 to 4.4Plasma 100 0.3 to 3.5Serum 100 0.1 to 4.3Serum 80 0.4 to 4.4
BNAG (U/l) Urine 100 0.5 to 7.5
CREA (mmol/1) Urine 100 2"3 to 29"2Urine 100 1.5 to 18.8
MAU (mg/1) Urine 100 1.5 to 1365Urine 90 0.0 to 67Urine 94 2"0 to 58
NA (mmol/1) Urine 100 16 to 314Urine 100 9 to 230
K (mmol/1) Urine 100 8 to 94Urine 100 8 to 92
CL (mmol/1) Urine 100 12 to 286Urine 100 5 to 246
1.24 -36"791.18 -28.031.07 -8"751.17 -26.35
1.05 -0.36.1.00 -0-071.00 0.041.04 -0"2
1.03 -2"631.12 10.101.01 -0.631.13 -10.71
"00 0.03"00 0.00
0.93 0.33
0.95 0.14
1.00 -0.600.95 -0.961.08 2.44
1.01 -0.591.00 0" 711.03 1.49
1.06 -0.181.08 -0.211.04 -0"52
0.75 -0.061.03 -0.14O.96 O’O31.03 -0.09
1.01 0.07
1.00 -0.151.00 -0"20
1.01 0.260"73 1.491.60 -2.46
1.00 0.390.98 1.35
0.99 0.05O’99 O.24
1.01 -2"03"00 5"90
2.682"O92.171.67
0.170-130.110.39
2"2O2.441.886.17
0.030.55
25"9
O’28
1.631.922"42
1.461’721.55
0"980.771.59
0"760.180.350.40
0.10
O’22O.50
1.053.092"65
2"54.1
1.32"2
2"611.5
208

Submit your manuscripts athttp://www.hindawi.com
Hindawi Publishing Corporationhttp://www.hindawi.com Volume 2014
Inorganic ChemistryInternational Journal of
Hindawi Publishing Corporation http://www.hindawi.com Volume 2014
International Journal ofPhotoenergy
Hindawi Publishing Corporationhttp://www.hindawi.com Volume 2014
Carbohydrate Chemistry
International Journal of
Hindawi Publishing Corporationhttp://www.hindawi.com Volume 2014
Journal of
Chemistry
Hindawi Publishing Corporationhttp://www.hindawi.com Volume 2014
Advances in
Physical Chemistry
Hindawi Publishing Corporationhttp://www.hindawi.com
Analytical Methods in Chemistry
Journal of
Volume 2014
Bioinorganic Chemistry and ApplicationsHindawi Publishing Corporationhttp://www.hindawi.com Volume 2014
SpectroscopyInternational Journal of
Hindawi Publishing Corporationhttp://www.hindawi.com Volume 2014
The Scientific World JournalHindawi Publishing Corporation http://www.hindawi.com Volume 2014
Medicinal ChemistryInternational Journal of
Hindawi Publishing Corporationhttp://www.hindawi.com Volume 2014
Chromatography Research International
Hindawi Publishing Corporationhttp://www.hindawi.com Volume 2014
Applied ChemistryJournal of
Hindawi Publishing Corporationhttp://www.hindawi.com Volume 2014
Hindawi Publishing Corporationhttp://www.hindawi.com Volume 2014
Theoretical ChemistryJournal of
Hindawi Publishing Corporationhttp://www.hindawi.com Volume 2014
Journal of
Spectroscopy
Analytical ChemistryInternational Journal of
Hindawi Publishing Corporationhttp://www.hindawi.com Volume 2014
Journal of
Hindawi Publishing Corporationhttp://www.hindawi.com Volume 2014
Quantum Chemistry
Hindawi Publishing Corporationhttp://www.hindawi.com Volume 2014
Organic Chemistry International
ElectrochemistryInternational Journal of
Hindawi Publishing Corporation http://www.hindawi.com Volume 2014
Hindawi Publishing Corporationhttp://www.hindawi.com Volume 2014
CatalystsJournal of


![GENETIC VARIANTS OF HUMAN BUTYRYLCHOLINESTERASE …fication reaction) was digested in buf-fer L (10 mM Tris-HCl pH 7.5, 10 mM MgCl2, 1 mM dithioerythritol [DTE]; Boehringer-Mannheim)](https://img.pdfslide.net/doc/110x75/5e5d295665e63e31925c8aa8/genetic-variants-of-human-butyrylcholinesterase-fication-reaction-was-digested.jpg)