Embed Size (px)
Citation preview

Multichannel film dosimetry with nonuniformity correction
Andre Micke,a) David F. Lewis, and Xiang YuInternational Specialty Products, 1361 Alps Road, Wayne, New Jersey 07470
(Received 13 August 2010; revised 24 February 2011; accepted for publication 22 March 2011;
published 2 May 2011)
Purpose: A new method to evaluate radiochromic film dosimetry data scanned in multiple color
channels is presented. This work was undertaken to demonstrate that the multichannel method is
fundamentally superior to the traditional single channel method. The multichannel method allows
for the separation and removal of the nondose-dependent portions of a film image leaving a residual
image that is dependent only on absorbed dose.
Methods: Radiochromic films were exposed to 10� 10 cm radiation fields (Co-60 and 6 MV) at
doses up to about 300 cGy. The films were scanned in red–blue–green (RGB) format on a flatbed
color scanner and measured to build calibration tables relating the absorbed dose to the response of
the film in each of the color channels. Film images were converted to dose maps using two meth-
ods. The first method used the response from a single color channel and the second method used
the response from all three color channels. The multichannel method allows for the separation of
the scanned signal into one part that is dose-dependent and another part that is dose-independent
and enables the correction of a variety of disturbances in the digitized image including nonuniform-
ities in the active coating on the radiochromic film as well as scanner related artifacts. The funda-
mental mathematics of the two methods is described and the dose maps calculated from film
images using the two methods are compared and analyzed.
Results: The multichannel dosimetry method was shown to be an effective way to separate out non-
dose-dependent abnormalities from radiochromic dosimetry film images. The process was shown to
remove disturbances in the scanned images caused by nonhomogeneity of the radiochromic film
and artifacts caused by the scanner and to improve the integrity of the dose information. Multichan-
nel dosimetry also reduces random noise in the dose images and mitigates scanner-related artifacts
such as lateral position dependence. In providing an ability to calculate dose maps from data in all
the color channels the multichannel method provides the ability to examine the agreement between
the color channels. Furthermore, when using calibration data to convert RGB film images to dose
using the new method, poor correspondence between the dose calculations for the three color chan-
nels provides an important indication that the this new technique enables easy indication in case the
dose and calibration films are curve mismatched. The method permit compensation for thickness
nonuniformities in the film, increases the signal to noise level, mitigates the lateral dose-depend-
ency of flatbed scanners effect of the calculated dose map and extends the evaluable dose range to
10 cGy-100 Gy.
Conclusions: Multichannel dosimetry with radiochromic film like GafchromicVR EBT2 is shown to
have significant advantages over single channel dosimetry. It is recommended that the dosimetry
protocols described be implemented when using this radiochromic film to ensure the best data in-
tegrity and dosimetric accuracy. VC 2011 American Association of Physicists in Medicine.
[DOI: 10.1118/1.3576105]
Key words: multichannel, dosimetry, GafchromicVR EBT2, thickness compensation
I. INTRODUCTION
Advanced techniques in radiotherapy, like intensity modu-
lated radiotherapy (IMRT) offer dose delivery targeted for
specific lesions. While such advances have provided great
success in reducing dose to healthy tissue and shortened treat-
ment time, they have constantly increased the complexity of
treatment planning and delivery and increased the demand for
quality assurance. Film dosimetry using radiochromic film
like GafchromicVR EBT is a common tool to verify the dose
distribution of intensity-modulated radiation treatment plans
and for general quality assurance of treatment planning sys-
tems and linear accelerators. Due to its high spatial resolution,
weak energy dependence1–3 and near-tissue equivalence4
radiochromic film has a suitable characteristics for complex
treatment dose verification.5,10 Since GafchromicVR radiochro-
mic films produce colored images when exposed to radiation,
it has long been known that multichannel flatbed scanners
offer better usability than white-light scanners. A multichan-
nel scanner provides a choice of colors for scanning and this
has been useful in offering the selection of the red color chan-
nel for greater sensitivity at lower doses, yet being able to
extend the dynamic range of the film to much higher doses
using the green of blue channels.6–9,13
2523 Med. Phys. 38 (5), May 2011 0094-2405/2011/38(5)/2523/12/$30.00 VC 2011 Am. Assoc. Phys. Med. 2523

However, a number of investigators11,12,14,15,21 have
pointed to challenges in radiochromic film dosimetry, partic-
ularly those related to the scanning of the radiochromic film.
To date, radiochromic film dosimetry has relied on the use
of information from a single color channel of an red–blue–
green (RGB) scanner. The signal thus provided is relatively
weaker at equal dose to that obtained when using a conven-
tional silver film. Also, when RGB color scanners are used
to digitize radiochromic film, the images may suffer from an
artifact that causes film density values to increase as the lat-
eral distance from the scan axis increases.16,19 While the
effect is relatively minor at low doses (<100 cGy) and posi-
tions within about 5–7 cm of the scan axis, it can create signif-
icant overestimate of higher doses, particularly as film
position approaches the lateral edges of the scan area. Other
investigators have questioned the suitability of EBT2 film for
dosimetry application owing to errors from multiple sources
including thickness artifacts in the radiochromic film coat-
ing,17 but their dosimetry method utilizes only the data from a
single color channel. The work presented in this paper
describes a superior approach using data from all the color
channels to separate the nondose-dependent artifacts due to
film and scanner from the dosimetric result.
This paper describes a novel approach to film dosimetry
using a colored radiochromic film and an RGB flatbed color
scanner. Since the radiochromic film provides a different
response in each of the three color channels, and particularly
because the slopes of the color response vs dose response
curves are different in each color channel, this new multi-
channel approach to dosimetry enables scanned film images
to be separated into two parts—one part that is dose-depend-
ent and one part that is independent of dose. The dose-inde-
pendent part of the image contains information related to
thickness, or other response differences in the film coating as
well as to scanner artifacts, including noise, and to some
effects caused by dust particles on the scanner. Having sepa-
rated the dose-independent part of the scan information, the
remaining dose-dependent information constituting the dose
map has higher fidelity and becomes more useful to the user
for the purposes of the dosimetry.
II. MATERIALS AND METHODS
II.A. Radiochromic film and irradiation procedure
The film used in this study was GafchromicVR EBT2 with
sheet dimensions of 20.3� 25.4 cm2. The film was handled
according to the procedures described in the (AAPM) task
group 55 report. Exposure to light was minimized by keep-
ing the films in black envelopes when they were not being
handled for exposure or scanning. Several different sources
were employed to irradiate the sets of films used for this
work. This included irradiation with a Co-60 source in an
AECL Theratron T-780 as well as irradiation with 6 MV
photons on Varian linear accelerators. For exposures the film
was placed in a phantom composed of 30� 30 cm sheets of
solid water or polystyrene with 5 cm of the build-up material
above and below the film. The source-to-surface distance
was 100 cm. Exposure of film for dose calibration was
performed with 10� 10 cm fields, and the film perpendicular
to the axis of the beam. Depending on the source, sets of cal-
ibration films were generated using between eight and ten
discrete exposures to doses ranging from about 20 cGy to
about 250 or 300 cGy. One film was used for each dose
level. Measurement and analysis of film sets exposed with
the two radiation sources were kept separate.
Similar solid water or polystyrene phantoms were used
for the exposure of films to IMRT treatment fields. Patient
IMRT films were placed at a depth of 5 cm in the phantom
and exposed in clinical mode to the full dose by all fields of
the treatment plans. Films were scribed with pen-marks prior
to irradiation to indicate the positions of the cross-hairs of
the Linac at 0� gantry angle. Depending on the treatment
plan the maximum doses delivered to the film were in the
range from about 200 cGy to about 250 cGy.
II.B. Scanners and scanning
The films were scanned and digitized with an Epson
expression 10000XL or an Epson V700 flatbed color scan-
ner. It is well known that radiochromic films like the EBT2
film undergo postexposure changes. Data sets obtained with
the two scanners were kept separate for the subsequent anal-
ysis. That is to say the films continue to darken after expo-
sure, although the rate diminishes rapidly with time. To
account for the postexposure changes all films within a set of
calibration films were scanned within a time window of less
than 10 min and at least 24 h after exposure. Under these cir-
cumstances errors due to time-after-exposure differences can
be neglected. When IMRT images were obtained for analysis
the images were obtained within 10 min of the calibration
film images and at least 24 h after exposure data was col-
lected from change in the films. The scanners were fitted
with transparency adapters and the images were acquired in
transmission mode. RGB positive images were collected at a
depth of 16 bits per color channel and a spatial resolution of
72 dpi. Scanning was conducted through the Epson scan
driver for each model of scanner. Software settings were
chosen to disable all color correction options and thereby
deliver the raw scanner data without any photographic
enhancements. This choice is critical because it prevents the
scan data from being altered to present an image optimized
for display by adjusting the color balance and exposure.
It is well known that the scan response of EBT2 radiochro-
mic is sensitive to the orientation of the film on the scanner.19
Therefore the orientation of the film in each image was
recorded. In the subsequent measurement and analysis of the
calibration film and IMRT film images care was taken not to
mix film images acquired in different orientations. It has also
been established that the scanner response of radiochromic
films like the EBT2 film is sensitive to the position of the film
on the scanner relative to the scan axis. That is the lateral
position on the scanner in the direction perpendicular to the
scan direction and relative to the center of the scanner. This
so called lateral artifact is position dependent and dose-de-
pendent. At doses less than about 200 cGy and positions
within about 5 cm of the scan axis the lateral artifact is less
2524 Micke, Lewis, and Yu: Multichannel film dosimetry with nonuniformity correction 2524
Medical Physics, Vol. 38, No. 5, May 2011

than about 2%, but is increasingly important at higher doses
and further away from the central axis of the scanner parallel
to the scan direction. To minimize the effect of the lateral arti-
fact films were positioned along the central axis for scanning.
One advantage of the triple-channel dosimetry method
described in Subsections II C–II F is that it substantially cor-
rects the lateral artifact. To provide data illustrating this
behavior some scans were made by deliberately positioning
the film to one side of the scan window away from the scan
axis and close to the edge of the window.
II.C. Image measurement and analysis
Scanned images were measured using Film QA Pro soft-
ware. Calibration films exposed with 10� 10 cm fields were
measured by defining an area of interest approximately
6� 6 cm in size at the center of the field. Data was obtained
for the red, green, and blue color channels at a resolution of
16 bits per channel. The images are defined as positive
images where black (no observed signal)—white (maximum
signal) range is mapped to [0, 65 535].
Data and image analysis such as conversion of images
from scanner space to dose space and measurement of film
profiles and was also performed with the Film QA Pro soft-
ware. This application has a utility for calculating dose
images using single, dual, or triple-channel dosimetry as
described in the following Subsections II D–II F. It also pro-
vides the ability to separate film images into portions that
are either dose-dependent or dose-independent. This is also
described in the following Subsections II E–II F.
Calibration data correlating film response to dose for each
of the three color channels was fit to analytical functions
described as rational functions. In terms of optical density dX
at dose D and wavelength X, these functions take the form
dx ¼ � logððaX þ bXDÞ=ðcX þ DÞÞ therein aX, bX, and cX are
the constants to be fitted. Rational functions have already the
correct steady state limit case behavior for very high dose
values D.
II.D. Single channel film dosimetry method
Radiochromic films, such as GafchromicVR EBT2 develop
a colored image upon exposure to radiation. The inherent
color of the image indicates that the optical absorption of the
exposed film varies by wavelength.18 The process of dosime-
try with such a film involves a number of steps including:
exposing the film to radiation; scanning the film to determine
the optical density dX over one or more spectral color bands
of different wavelength X and using the dose-optical density
response information for each color channel to convert the
scanned image into its dose equivalent (dose mapping).
One of the ways to determine the optical density dX is
through the use of a color flatbed scanner. This is an image
digitization device that measures film response over wave-
length bands corresponding to the red (R), green (G), and
blue (B) bands of the visible spectrum. The scanned optical
density is defined as
dX ¼ � logðXÞ; (1)
therein Xe [0,1] stands for the normalized color channel
stipulated by the output of the scanner. The color channel
value X depends on scanner coordinates (i,j), i.e., X ¼ Xij
reflects the optical density of the film at coordinates ðxi; yjÞ.The dose mapping process is recognized as a nonlinear
process and its conversion parameters are determined in a
calibration process using areas of film (calibration patches)
exposed to known doses of radiation. A sufficient number of
homogeneously exposed calibration patches are scanned to
generate a calibration table fDi; dXðDiÞg, l¼ 1(1)L, where Lis the number of scanned calibration patches.
In accordance with the Beer–Lambert Law, the scanned
optical density value dXðDÞ at any point is inversely propor-
tional to some dimensionless measure s of the thickness of
the active layer coated on the film
dXðDÞ ¼ dDX ðDÞs (2)
where the quantity dDX ðDÞ is independent of relative thick-
ness s and varies only with the exposure D. It is easy to
directly verify that the model Eq. (2) fulfills the limit cases
lims!0
XðDÞ ¼ 1 (3)
i.e., film is fully transparent for zero thickness and
lims!1
XðDÞ ¼ 0 (4)
i.e., film is fully opaque for infinite thickness.
When averaging density values dXðDÞ across the homoge-
neously exposed film region one finds that
dXðDÞ ¼1
N
Xi;j
dDX ðDÞs ¼ dD
X ðDÞ�s; (5)
where �s stands for the average film thickness with
�s ¼ 1
N
Xi;j
s: (6)
and N is the number of pixels used in the averaging process.
The commonly used method to determine a dose value Dfrom a density value scanned on a film utilizes a single color
channel X only. The dose is determined as
D ¼ �d�1
X dXs�s
� �: (7)
Assuming that s=s � 1 , i.e., active layer is perfectly uni-
form, Eq. (7) becomes
D ¼ �d�1
X ðdXÞ: (8)
The calibration function �dX is determined by correlating a
calibration table fDi; �dXðDÞig, l¼ 1(1)L. Members of one
class of functions used to correlate values in the calibration
table are known as rational functions. In terms of optical
density such functions take the form
�dXðDÞ ¼ � logaþ bD
cþ D
� �; (9)
2525 Micke, Lewis, and Yu: Multichannel film dosimetry with nonuniformity correction 2525
Medical Physics, Vol. 38, No. 5, May 2011

where a, b, and c are the equation parameters to be fitted.
Figure 1 shows an example of a calibration curve for
GafchromicVR EBT2 film as determined from the red color
channel image from an Epson 10000XL scanner. The calibra-
tion table and correlated function parameters are given in
Table I. In this example the density values are derived from
the 16-bit scanner response values, the pixel values PVxðDÞ ,
with x¼R, G, B, and the channel values X in Eq. (1) become
XðDÞ ¼ PVxðDÞ65535
� �: (10)
The single channel approach is robust in the sense that for
any scanned optical density dX a corresponding dose value
D can be calculated. However, if the density value is dis-
turbed by the dimensionless amount DdX (e.g., because of
variation of the thickness s of the film coating or because of
a scanner nonlinearity like the lateral distortion) one
obtains a corresponding disturbance DD of the dose value
with
Dð1þ DDÞ ¼ �d�1
X ðdXð1þ DdXÞÞ; (11)
This appears directly as error of the dose value D and pro-
vides no indication of the discrepancy.
II.E. Dual channel film dosimetry method
From Eq. (7) it is clear-cut that picking two scanning
wave lengths, i.e., two color channels X1 and X2, results in a
system of two equations and two variables: dose D and rela-
tive thickness s=s s�s .
D ¼ �d�1
X1dX1
s�s
� �
D ¼ �d�1
X2dX2
s�s
� � (12)
and requires the calibration functions �dX1and �dX2
of the
selected color channels. This equation system can be sepa-
rated to obtain
D ¼ �d�1
X1
dX1
dX�1
�dX2ðDÞ
� �(13)
FIG. 1. Single channel calibration curve and data flow of dose mapping using Eq. (8).
TABLE I. EBT2 @ Epson 10000XL calibration table and correlated function
parameters for R, G, and B.
D=cGy dR dG dB
250 0.31776 0.26153 0.56340
225 0.30324 0.25026 0.55564
200 0.28148 0.23533 0.54572
175 0.26510 0.22176 0.53753
150 0.24328 0.20905 0.53208
125 0.22144 0.19456 0.52267
100 0.19799 0.17914 0.51279
75 0.17431 0.16398 0.50556
50 0.14685 0.14811 0.49630
25 0.11521 0.13128 0.48812
0 0.08137 0.11710 0.47790
aX 2.22726 5.22144 3.01197
bX 0.10730 �0.05009 0.06079
cX 2.68937 6.81595 9.04245
2526 Micke, Lewis, and Yu: Multichannel film dosimetry with nonuniformity correction 2526
Medical Physics, Vol. 38, No. 5, May 2011

and
s�s¼
�dðDÞX1=2
dX1=2
(14)
which requires only the solution of a single nonlinear equa-
tion and evaluation of the explicit Eq. (14) for one of the
color channels employed.
This method works optimally for low exposures of EBT2
film by selecting X1 ¼ R and X2 ¼ B and using the blue
channel to evaluate Eq. (14). If the exposure is low enough
the density recorded in the blue channel becomes insensitive
to dose, i.e., �dBðDÞ � �d0
B ¼ �dBð0Þ, and Eq. (13) becomes
D ¼ �d�1
R�d
0
B
dR
dB
� �¼ �d
�1
R=B
dR
dB
� �(15)
which calculates the dose D as a function of the ratio of the
responses in the red and blue color channels. The foregoing
is equivalent to calibrating dose D vs color channel ratio
dR=dB ¼ 1 dR=dB as proposed in Ref. 8 p.10, as reference
channel method.
Note that if the dose value D is known (using any proce-
dure), it is still possible to use Eq. (14) to calculate the rela-
tive layer thickness s=s using the calibration function of an
additional channel. However, the limiting single channel
dosimetry case results in s=s ¼ 1, and it is not possible
to separate the dose map into its dose-dependent and dose-
independent parts.
The dual channel dose mapping can account for signal
disturbances caused by thickness variations and the like, but
the results may depend on the exposure range used. Equation
(13) is not symmetric with respect to the chosen color chan-
nels. The method will work best for low exposures of EBT2
film less than about 10 Gy when X1 ¼ R and X2 ¼ B, and for
high exposures greater than about 30 Gy when X1 ¼ B and
X2 ¼ R. In the latter case the film response in the red channel
approaches saturation and the term �dR is dominated by the
value of the relative layer thickness s=s in the same way as
the blue channel response is dominated at low exposures due
to the presence of the yellow marker dye. The dual channel
method uses explicitly the Beer–Lambert Law in form of Eq.
(2) to describe the disturbance Dd, i.e., this method is not
able to remove disturbances that are caused by effects other
than thickness variation of the active film layer. However,
the use of Eq. (2) allows to separate the equation system and
reduces the calculation of the dose D to a simple inversion
of the single nonlinear Eq. (13).
Since the dual channel method is a special case of the
multichannel method described in the following Subsections
II F, specific examples are not presented.
II.F. Triple-channel film dosimetry method
The dual channel method addresses only disturbances
caused by thickness variations of the active film layer. The
more general target is to separate numerically the dose-de-
pendent part of a scanned optical density signal from any
disturbance Dd that might be present in the system consist-
ing of radiation source, radiochromic film, and film scanner
unit. To model this case, Eq. (2) is modified to
dXðDÞ ¼ dDX ðDÞDd (16)
which includes the previous case for Dd ¼s=s. Note that
when calibration films are used to determine �dX, it is impor-
tant that the averaging regions, i.e., the exposed measure-
ment areas, must be sufficiently large to ensure that the
calibration condition for the average disturbance
D�d ¼ 1 (17)
is fulfilled. This is equivalent to requesting that the measure-
ment area should be large enough to reflect average response
of the system, otherwise �dX will develop a systematic bias.
The disturbance Dd is dose-independent since all dose-de-
pendent parts are presented by the calibration function �dX.
A dose value can be calculated for each color channel Xusing (Fig. 2)
DX ¼ �d�1
X ðdXDdÞ: (18)
Since the dose cannot depend on the color channel Xselected for evaluation of Eq. (18). one can consider a
sequence of multiple channels fXkgKk�1 and minimize the dif-
ferences in the dose results from the individual color chan-
nels, i.e.,
XðDdÞ ¼Xi 6¼j
ðDXi� Dxj
Þ2 ! minDd
: (19)
The solution to this least square equation can be found by
solving the single nonlinear equation
d
dDdX ¼ 0: (20)
This minimization is equivalent to finding the “nearest”
color to the color path f�dRðDÞ; �dG; �dB�ðDÞg. The distance of a
point from this color path represents the disturbance value,
Dd, and the value of the path parameter is the “best” dose
value. This method works as long as the slopes of the cali-
bration functions �dx for the individual color channels are suf-
ficiently different. The more color channels involved, the
more deterministic the system becomes, and the better will
this method separate the dose-dependent part of the signal
from the dose-independent part.
In case of two color channels (K¼ 2) Eq. (20) becomes
DX1¼ DX2
¼ 0 and with D ¼ DX1¼ DX2
and s=s ¼ Dd one
recovers Eq. (12) of the dual channel method.
III. RESULTS
III.A. Single channel film dosimetry
Figure 3 shows the scanned image of an EBT2 film
exposed to a dose of 225 cGy using a 10� 10 cm2 flat field
exposure and the corresponding dose map based on Eq. (8)
for X¼R, G, B.
Nonuniformities in the form of vertical stripes are
obvious by visual inspection of both the film image and the
dose map. A horizontal profile across the dose map in Fig. 4
reveals the oscillations especially in the flat part of the
2527 Micke, Lewis, and Yu: Multichannel film dosimetry with nonuniformity correction 2527
Medical Physics, Vol. 38, No. 5, May 2011
exposure field, which must stem from dose disturbances DDdescribed in Eq. (11).
Figure 4 shows the dose profiles across the flat field as
calculated separately for the R, G, and B color channels. The
EBT2 film includes a yellow marker dye in the active coat-
ing8 that significantly increases the dependence of the signal
in the blue color channel with respect to disturbances in the
thickness of the active layer. The profile of the blue channel
in Fig. 4 suggests that the disturbances DD are dominated by
the variations of the term s=s, i.e., the nonuniformity of the
active layer in the film causes this type of oscillation and
when using a single channel based dose mapping method,
results in dose error.
In the following Subsections III B–III D dose mapping
methods are presented that account for thickness variations
of the active film layer, separate these variations from the
dose-dependent portion of the image and remove their effect
from calculated dose maps.
III.B. Triple-channel film dosimetry
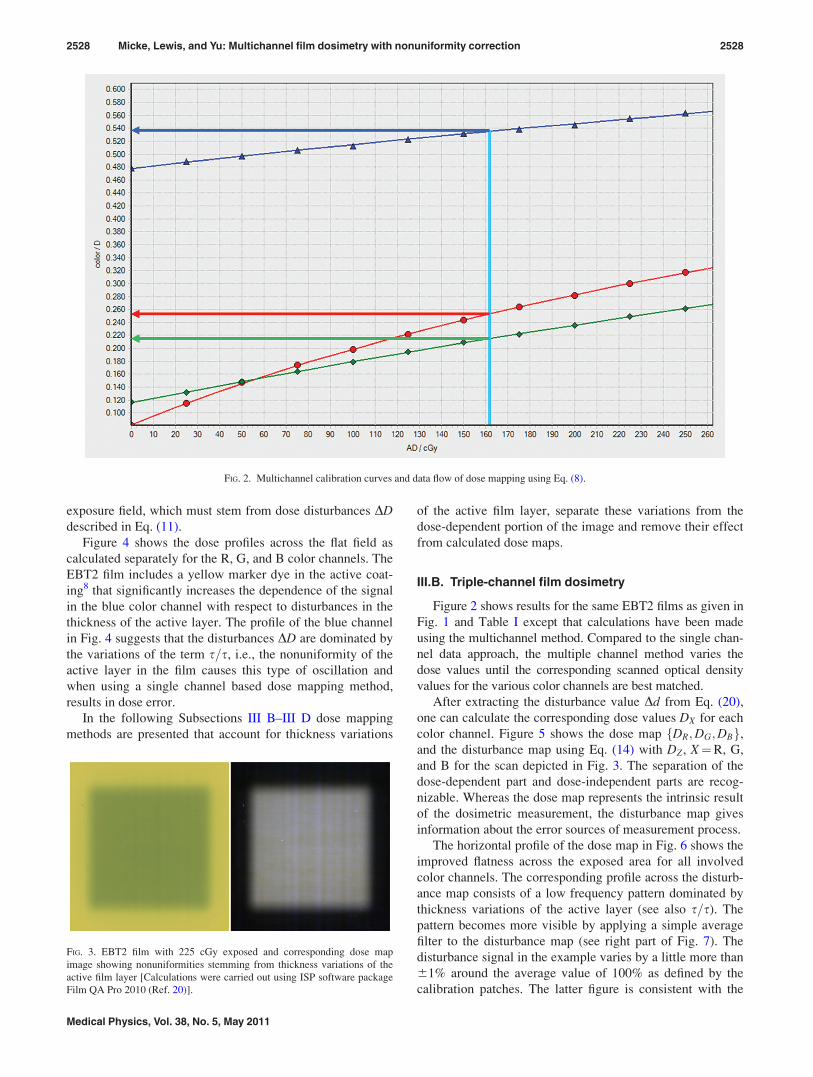
Figure 2 shows results for the same EBT2 films as given in
Fig. 1 and Table I except that calculations have been made
using the multichannel method. Compared to the single chan-
nel data approach, the multiple channel method varies the
dose values until the corresponding scanned optical density
values for the various color channels are best matched.
After extracting the disturbance value Dd from Eq. (20),
one can calculate the corresponding dose values DX for each
color channel. Figure 5 shows the dose map fDR;DG;DBg,and the disturbance map using Eq. (14) with DZ, X¼R, G,
and B for the scan depicted in Fig. 3. The separation of the
dose-dependent part and dose-independent parts are recog-
nizable. Whereas the dose map represents the intrinsic result
of the dosimetric measurement, the disturbance map gives
information about the error sources of measurement process.
The horizontal profile of the dose map in Fig. 6 shows the
improved flatness across the exposed area for all involved
color channels. The corresponding profile across the disturb-
ance map consists of a low frequency pattern dominated by
thickness variations of the active layer (see also s=s). The
pattern becomes more visible by applying a simple average
filter to the disturbance map (see right part of Fig. 7). The
disturbance signal in the example varies by a little more than
61% around the average value of 100% as defined by the
calibration patches. The latter figure is consistent with the
FIG. 3. EBT2 film with 225 cGy exposed and corresponding dose map
image showing nonuniformities stemming from thickness variations of the
active film layer [Calculations were carried out using ISP software package
Film QA Pro 2010 (Ref. 20)].
FIG. 2. Multichannel calibration curves and data flow of dose mapping using Eq. (8).
2528 Micke, Lewis, and Yu: Multichannel film dosimetry with nonuniformity correction 2528
Medical Physics, Vol. 38, No. 5, May 2011

aim of having the size of the calibration patches large
enough to represent the average system response including
the film and the average thickness of the active layer.
Since nonuniformities are broadly distributed in the active
layer of the film, it is good practice to expose and measure
large calibration patches. This makes it more probable that
each of the measurements will capture the average response
of the film. If small pieces of film are used for the calibration,
it is more likely that they will have a response significantly
above or below the average. As a practical matter, it is pre-
ferred to use the calibration patches sized at least 5� 5 cm2
and even more desirably, 10� 10 cm2. Because larger calibra-
tion patches better represent average film behavior, a smaller
number are necessary to construct the response curve. Experi-
ence shows that a calibration for a dose range from 0 to
300 cGy is better served by using six to eight 10� 10 cm
patches rather than two to three times that number of smaller
patches. Whereas the single channel dosimetry method is
indiscriminate and converts any thickness variations directly
into erroneous dose values (see Ref. 8), the multichannel
method described accounts for such disturbances, resolves
them from the dose information and places them into a sepa-
rate map displaying the relative thickness deviations.
III.C. Comparing dosimetry methods using IMRT dosedistributions
Figure 8 displays the dose plan image in the coronal plane
of an IMRT treatment composed of seven beams and the cor-
responding dose image recorded on EBT2 radiochromic film.
The radiochromic IMRT film and eight calibration films
exposed to 6MV x-ray doses between zero and 281 cGy were
digitized in transmission mode on an Epson 10000XL scan-
ner. The dose response is shown in Fig. 9 where the calibra-
tion data for each color channel have been fit to a function of
the type X(D)¼ (aþ b D)=(cþD), where the scanner
response at dose D is X(D) and a, b, and c are constants.
Using this calibration data dose images were calculated
from the IMRT measurement film image using the single, red
channel dosimetry method, and the triple-channel method
using the red, green, and blue response data. Isodose maps are
presented in Fig. 10 showing the agreement between dose
contours in the treatment plan and the measured dose contours
in the single-channel triple-channel dose maps. Contour lines
are shown for doses at 90, 70, 50, and 30% of the maximum
value in the plan map. Inspection of the iso-contour maps
shows that the contours in the triple-channel map have a
closer conformance to the plan than those in the single chan-
nel map. Quantitative assessment of the accordance between
measurements and plan was made using the gamma function
distribution using factors of 3% dose agreement within 2 mm.
The results are shown in Fig. 11 in the form of a gamma func-
tion histogram. While there is measured agreement of 91%
between the single channel dose map and the plan the triple-
channel dose map has a 99% agreement, a much closer con-
cordance with the plan. The measurements and comparisons
were repeated for exposures of four other EBT2 films to the
same IMRT treatment plan. Dose maps were calculated using
FIG. 4. Horizontal profile across the dose map for 25 and 225 cGy (see Fig. 3) exposure showing red, green, and blue channel results.
FIG. 5. Dose map and disturbance map for EBT2 film with 225 cGy expo-
sure shown in Fig 3.
2529 Micke, Lewis, and Yu: Multichannel film dosimetry with nonuniformity correction 2529
Medical Physics, Vol. 38, No. 5, May 2011
the single (red) channel and triple-channel methods. The
agreements with plan using the single channel dosimetry pro-
tocol were 90.4, 86.0, 98.1, and 83.3 (average 89.5) for the
four measurement films. For maps calculated using the triple-
channel method the agreements were 99.6, 99.2, 99.8, and
98.4 (average 99.2). Radiochromic film dosimetry with EBT2
film consistently provided better concordance with the treat-
ment plan when the triple-channel protocol dosimetry was
used rather than the single channel method.
III.D. Mitigation of lateral displacement effect
Because EBT2 film partially polarizes transmitted light,22
the doses calculated using images from a CCD scanner may
show substantial lateral distortions.16,20,21,23 The multichan-
nel technique is able to mitigate this lateral dependence. To
demonstrate this, one of the EBT2 films exposed to a
10 m� 10 cm field and used to generate the calibration curve
shown in Table I was scanned in the center of an Epson
10000XL scanner and then moved to a new position dis-
placed “4” laterally from the center of the scanner and
rescanned a position close to the left edge of the scan win-
dow. The calibration fitting functions were used to convert
the images to dose maps using the single channel and triple-
channel mapping. Profiles in the lateral direction across the
exposed areas of the film scanned close to the edge of the
scan window are shown in Fig. 12. The left side of each pro-
file is furthest from the scan axis. The single channel profile
shows a large increase in the dose on the left side of the field,
i.e., the side of the field farthest from the center of the scan-
ner. Qualitatively this behavior is characteristic of the
response of CCD scanners16,18 including those made by
FIG. 6. Horizontal profile across the dose map for 25 and 225 cGy exposure (see Fig. 5) showing the red, green, and blue channel results.
FIG. 7. Horizontal profile across the dose map from Fig. 5 for red, green, and blue channel.
2530 Micke, Lewis, and Yu: Multichannel film dosimetry with nonuniformity correction 2530
Medical Physics, Vol. 38, No. 5, May 2011

Epson, Microtek, and Vidar. The indicated optical density
tends to be greater approaching the lateral edges of the
scanner’s field of view. Not only is this effect sensitive to
position on the scanner, but it is also dose-dependent, being
smaller at low doses, but becoming more substantial at
higher doses. The triple-channel method will compensate
for the dose-independent part of the lateral effect (e.g., at
zero exposure). However, the dose-dependent part will
remain.
By comparison, the profile of the same area of the triple-
channel map shows that the apparent increase in dose closer
to the edge of the scanner can be mitigated by using all three
color channels to perform the dosimetry as depicted in
Fig. 12. This is further demonstrated by showing the profile
across the triple-channel map of the laterally displaced film
together with the profile across the same area of the same
film scanned at the center of the scanner. These profiles are
demonstrating how the triple-channel dosimetry method is
FIG. 8. Dose images calculated for IMRT plan (right) and measured with EBT2 film.
FIG. 9. Dose calibration curves for EBT2 film in three color channels.
2531 Micke, Lewis, and Yu: Multichannel film dosimetry with nonuniformity correction 2531
Medical Physics, Vol. 38, No. 5, May 2011

mitigating the lateral scanner effect and delivers results
superior to the single channel method.
The dose values calculated for the different color chan-
nels with the multichannel method should be in close agree-
ment. Offsets indicate that the dose-dependent properties of
the scanned film do not match sufficiently with those of the
calibration films or the calibration condition (17) is not
fulfilled. Comparison of the dose values from the color chan-
nels makes it possible to pinpoint local defects and errors of
the scanned radiochromic film and the scanning protocol.
The example given in Fig. 13 is based on the scan of the
200 cGy calibration patch used in Table I, but in this case the
film was rotated by 90� before scanning. It is well known that
the response of EBT2 film is dependent on its orientation on
FIG. 10. Iso-dose maps– measurement (thin lines) vs IMRT plan (thick lines): Red channel dosimetry to left; triple-channel dosimetry to right.
FIG. 11. Gamma distribution and histogram maps: Red channel dosimetry, 91.0% agreement, to left; triple-channel dosimetry, 99.0% agreement, to right.
2532 Micke, Lewis, and Yu: Multichannel film dosimetry with nonuniformity correction 2532
Medical Physics, Vol. 38, No. 5, May 2011

the scanner and the calibration Table I obtained for one orien-
tation will not match the film behavior in another orientation.
When dosimetry is performed using the single channel
method, there is no indication in the dose result to signify that
a film was misaligned when scanned. However, such an indi-
cation is inherent when using multichannel dosimetry because
the doses from the color channels should be in close agree-
ment. In the example, there is an offset of about 10 cGy
FIG. 12. Comparison single and triple channel method using dose map from film positioned at left side of the scanner where lateral effect reaches maximum
and single and triple channel dose map of film at the center of the scanner.
FIG. 13. Horizontal profile across the dose maps of 200 cGy film patch scanned rotated by 90� compared to calibration scans (left) and the scan with original
orientation (right) for R, G, B channels.
2533 Micke, Lewis, and Yu: Multichannel film dosimetry with nonuniformity correction 2533
Medical Physics, Vol. 38, No. 5, May 2011

(approximately 5%) between the color channels, providing a
clear indication of a mismatch between the scanned film and
calibration data used to calculate the dose map.
The multichannel method is symmetric with respect to all
color channels used in the measurement. It characteristically
balances the color channel with the highest sensitivity because
the component with the highest derivative value is the domi-
nant factor in Eq. (18). The use of multiple wavelengths to
scan the absorption spectrum of the film makes it possible to
use the entire sensitivity range of the film covered by the spec-
tral response of the scanner. This range could even be
extended by using additional wave lengths or a larger number
of color bands, although this would require the utilization of a
specialized scanner. In the case of using EBT2 film and Epson
flatbed color scanners (e.g., models 10000XL, V700, V750,
1680, and 4900) the RGB channels cover a dose measurement
range from below 10 cGy to above 100 Gy, i.e., more than 3
orders of magnitude (see Ref. 8).
IV. CONCLUSIONS
The fundamentals of a new method using multiple color
channels to convert scanned images of radiochromic film
into dose maps have been presented. This method allows the
separation of the dose-dependent and dose-independent parts
of a scanned signal and compensates for a variety of anoma-
lies, artifacts, and other disturbances, such as variations of
the thickness of the active layer, scanner nonlinearity and
process noise and enables the use of the entire available sen-
sitivity range of the film in the same procedure. The substan-
tial gain in accuracy is illustrated by improved flatness and
symmetry of the tested flat field exposures.
NOMENCLATURE
Symbol(SI unit) Explanation
D (Gy) ¼ absorbed dose
X ¼ normalized color channel value, Xe [0, 1],
typical color channels are R, G, B
R, G, B ¼ normalized of red, green, blue color
channel, Xe [0, 1]
dX ¼ optical density of color channel X,
dX ¼ � logðXÞdD
X ¼ dose-dependent part of the optical den-
sity dX�dot ¼ script to mark average value of a quantity
s ¼ relative thickness of the active film layer
Dd ¼ disturbance factor of optical density value
x, y (m) ¼ absolute locations x and y coordinates
i, j ¼ discretized locations in x (i) and y (j)direction of pixelated coordinate system
ACKNOWLEDGMENTS
The authors are employees of International Specialty Prod-
ucts the manufacturer of GafchromicVR dosimetry film and
owner of the FilmQA Pro software (www.FilmQA Pro.com).
a)Author to whom correspondence should be addressed. Electronic mail:
[email protected]. J. Butson, T. Cheung, and P. K. Yu, “Weak energy dependence of EBT
Gafchromic film dose response in the 50 kVp–10 MVp x-ray range,”
Appl. Radiat. Isot. 64, 60–62 (2006).2S. T. Chiu-Tsao, Y. Ho, R. Schankar, L. Wang, and L. B. Harrison,
“Energy dependence of response of new high sensitivity radiochromic
films for megavoltage and kilovoltage radiation energies,” Med. Phys. 32,
3350–3354 (2005).3P. Lindsay, A. Rink, M. Ruschin, and D. Jaffray, “Investigation of energy
dependence of EBT and EBT-2 Gafchromic film,” Med. Phys. 37(2), 571–
576 (2010).4A. Niroomand-Rad, C. R. Blackwell, B. M. Coursey, K. P. Gall, J. M.
Galvin, W. L. McLaughlin, A. S Meigooni, R. Nath, J. E. Rodger, and
C. G. Soares, “Radiochromic film dosimetry: Recommendations of AAPM
radiation therapy committee task group 55, Med. Phys. 25, 2093–2115
(1998).5AAPM Report No. 63, Radiochromic film dosimetry, 1998.6S. Devic, J. Seuntjens, G. Hegyi, E. Podgorsak, C. Soares, A. Kirov, I. Ali,
J. Williamson, and A. Elizondo, “Dosimetric properties of improved Gaf-
chromic films for seven different digitizers,” Med. Phys. 31(9), 2391–
2398 (2004).7S. Devic, N. Tomic, C. Soares, and E. Podgorsak, “Optimizing the
dynamic range extension of a radiochromic film dosimetry system,” Med.
Phys. 36(2), 429–437(2009).8GafchromicVR EBT2 Self-Developing Film for Radiotherapy Dosimetry,
ISP White Paper, October, 2010.9E. Willcox, G. Daskalov, and L. Nedialkova, “Comparison of the Epson
expression 1680 flatbed and the VXR-16 dosimetry PRO film scanners for
use in IMRT dosimetry using Gafchromic and radiographic film,” Med.
Phys. 34(1), 41–48 (2007).10M. Fuss, E. Sturtewagen, C. De Wagter, and D. Georg, “Dosimetric char-
acterization of GafChromic EBT film and its implication on film dosime-
try quality assurance”, Phys. Med. Biol. 52(14), 4211–4225 (2007).11S. Devic, J. Seuntjens, and E. Sham, “Precise radiochromic film dosi-
metry using a flat-bed document scanner,” Med. Phys. 32(7), 2245–2253
(2005).12B. D. Lynch, J. Kozelka, and M. K. Ranade, “Important considerations for
radiochromic film dosimetry with flatbed CCD scanners and EBT Gaf-
chromic Film,” Med. Phys. 27(10), 2462–2475 (2006).13ISP presentation: www.FilmQA Pro.com/Micke_Lewis_Yu_Triple_Channel_
Technique_201001.pdf.14L. Paelinck, W. de Neve, and C. De Wagter, “Precautions and strategies in
using a commercial flatbed scanner for radiochromic film dosimetry,”
Phys. Med. Biol. 52(1), 231–242 (2007).15L. J. Van Battum, D. Hoffmans, D. Piersma, and S. Heukelom, “Accurate
dosimetry with Gafchromic EBT film of a 6 MV photon beam in water:
What level is achievable?,” Med. Phys. 35(2), 704–716 (2008).16J. Menegotti, A. Delana, and A. Martignano, “Radiochromic film dosime-
try with flatbed scanners: A fast and accurate method for dose calibration
and uniformity correction with single film exposure,” Med. Phys. 35(7),
3078–3085 (2008).17B. Hartmann, M. Martisikova, and O. Jakel, “Homogeneity of Gafchromic
EBT2 Film,” Med. Phys. 37(4), 1753–1756 (2010).18S. Devic, S. Aldelaijan, H. Mohammed, N. Tomic, L. H. Laing, F.
DeBlois, and J. Seuntjens, “Absorption spectra time evolution of EBT-2
model Gafchromic film,” Med. Phys. 37(5), 2207–2214 (2010).19L. Paelinck, A. Ebongue, W. De Neve, and C. De Wagter, “Radiochromic
EBT film dosimetry: Effect of film orientation and batch on the lateral cor-
rection of the scanner,” Radiother. Oncol. 84, 194–195 (2007).20FilmQA Pro 2010 software: www. FilmQA Pro.com.21L. J. Van Battum, D. Hoffmans, S. Kwa, and S. Heukelom, Accuracy of
GafChromic EBT Film as dose meter in radiotherapy QA, Proc. IFMBE,
25, 105–108 (2009).22M. J. Butson, T. Chueng, and P. K. Yu, “Evaluation of the magnitude of
EBT Gafchromic film polarization effects,” Australas. Phys. Eng. Sci.
Med. 32(1), 21–25 (2009).23S. Saur and J. Frengen, “GafChromic EBT film dosimetry with flatbed
CCD scanner: A novel background correction method and full dose uncer-
tainty analysis,” Med. Phys. 35(7), 3094–3101 (2008).
2534 Micke, Lewis, and Yu: Multichannel film dosimetry with nonuniformity correction 2534
Medical Physics, Vol. 38, No. 5, May 2011