Embed Size (px)
Citation preview

Multidimensional Analytical Approach for the Characterization
of Complex Ethylene-Propylene Copolymers
By
Mohau Justice Phiri
Dissertation presented in partial fulfilment of the requirements for the degree
Doctor of Philosophy (PhD) in Polymer Science
in the Faculty of Science at Stellenbosch University
Promoter: Prof. Harald Pasch March 2016
Page i
Declaration for the Dissertation
By submitting this thesis electronically, I declare that the entirety of the work contained therein
is my own, original work, that I am the authorship owner thereof (unless to the extent explicitly
otherwise stated) and that I have not previously in its entirety or in part submitted it for obtaining
any qualification.
Mohau Justice Phiri December 2015
Copyright © 2016 Stellenbosch University
All rights reserved
Stellenbosch University https://scholar.sun.ac.za

Page ii
Declaration for the Publications
With regard to the three manuscripts in the dissertation, the nature and scope of my contribution
were as follows:
Nature of Contribution Extent of contribution (%)
Experimental work, Data Analysis, Discussion of Results, Write-up
the manuscripts, Addressing the Comments of the Reviewers.
85
The following co-authors have contributed to the three manuscripts in the dissertation.
Name e-mail address Nature of contribution Extent of
contribution (%)
Sadiqali Cheruthazhekatt [email protected] Analytical instruments training 3
Anita Dimeska [email protected] Synthesis of the copolymers 2
Harald Pasch [email protected] Supervision and mentoring,
revision and correction of the
manuscript
10
Signature of candidate:………………………
Date:………………..
Declaration by co-authors:
1. the declaration above accurately reflects the nature and extent of the contributions of the
candidate and co-authors to three manuscripts in the dissertation,
2. no other authors contributed to three manuscripts in the dissertation besides those specified
above, and
3. potential conflicts of interest have been revealed to all interested parties and that the
necessary arrangements have been made to use the material in the three manuscripts in the
dissertation.
Signature Institutional affiliation Date
Declaration with signature in possession of
candidate and supervisor
MES KVM College 30 Nov 2015
Declaration with signature in possession of
candidate and supervisor
Novel Technology Company 30 Nov 2015
Declaration with signature in possession of
candidate and supervisor
Stellenbosch University 30 Nov 2015
Stellenbosch University https://scholar.sun.ac.za

Page iii
Abstract
Impact polypropylene copolymers (IPC) are complex multiphase materials having ethylene-
propylene rubber particles incorporated in a semi-crystalline isotactic polypropylene (iPP)
matrix. The ethylene-propylene rubber (EPR) particles form the most critical part of IPC. They
are continuously dispersed in the iPP matrix and are supposed to prevent crack propagation
under mechanical stress. The EPR phase decreases the crystal size of the crystalline iPP phase,
and as a result an improvement in the impact strength of IPC is usually observed. IPC materials
have much improved impact resistance as compared to conventional iPP and, thus, they can be
used in a wide temperature range.
IPCs usually have low melt flow rates (MFR) that limit their application in a number of
moulding applications. One way to increase the MFR is the vis-breaking process that decreases
the molar mass of the polymer. Details regarding the molecular structures of the vis-broken IPC
and the molecular background of the vis-breaking process are not completely available up to
date. Therefore, it was the main aim of the present study to investigate the compositional
heterogeneities of EPR and vis-broken IPC materials using multidimensional analytical
approaches.
A set of EPR copolymers prepared by Ziegler-Natta and metallocene catalyst systems were
used in the present study as model systems to mimic the rubber phase in IPC. The EPR samples
had high comonomer contents in the range of 30 – 70 mol %. For another part of the work, a
set of vis-broken IPC samples with different MFR values were prepared by degradation with
an organic peroxide. Bulk samples from the two sets of samples were analysed by SEC, DSC,
FT-IR, 13C NMR, CRYSTAF and HT-HPLC. The bulk samples were fractionated by
preparative TREF procedures to obtain fractions at different TREF elution temperatures which
could be further analysed to obtain comprehensive information on the molecular compositions
of the samples.
For the EPR copolymer samples, HT-SEC showed that the bulk samples and their TREF
fractions have broader MMDs as compared to similar metallocene-based samples. The bulk
sample analyses showed that the EPR samples consist mainly of random EP copolymers making
about 65 % of the bulk samples. DSC and CRYSTAF were able to analyse only the semi- and
highly crystalline TREF fractions. Both techniques did not fully characterise the 30 °C TREF
fractions since these fractions contained random EP copolymers which were completely
Stellenbosch University https://scholar.sun.ac.za
Page iv
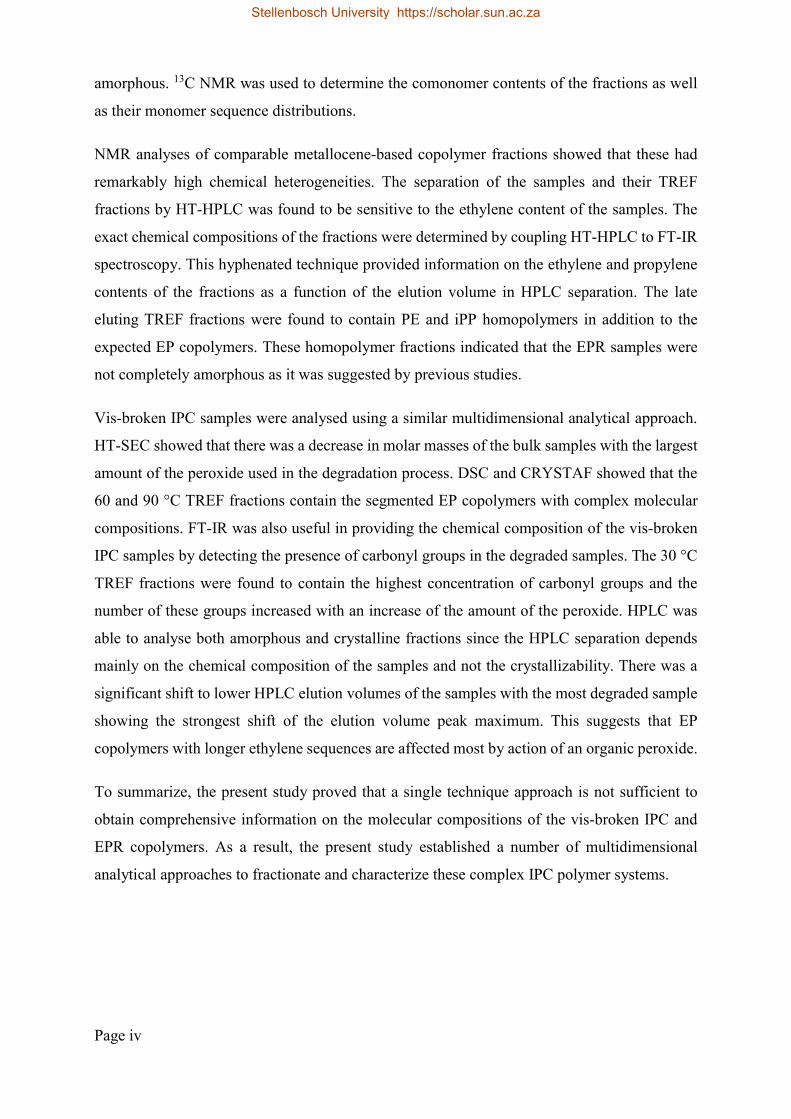
amorphous. 13C NMR was used to determine the comonomer contents of the fractions as well
as their monomer sequence distributions.
NMR analyses of comparable metallocene-based copolymer fractions showed that these had
remarkably high chemical heterogeneities. The separation of the samples and their TREF
fractions by HT-HPLC was found to be sensitive to the ethylene content of the samples. The
exact chemical compositions of the fractions were determined by coupling HT-HPLC to FT-IR
spectroscopy. This hyphenated technique provided information on the ethylene and propylene
contents of the fractions as a function of the elution volume in HPLC separation. The late
eluting TREF fractions were found to contain PE and iPP homopolymers in addition to the
expected EP copolymers. These homopolymer fractions indicated that the EPR samples were
not completely amorphous as it was suggested by previous studies.
Vis-broken IPC samples were analysed using a similar multidimensional analytical approach.
HT-SEC showed that there was a decrease in molar masses of the bulk samples with the largest
amount of the peroxide used in the degradation process. DSC and CRYSTAF showed that the
60 and 90 °C TREF fractions contain the segmented EP copolymers with complex molecular
compositions. FT-IR was also useful in providing the chemical composition of the vis-broken
IPC samples by detecting the presence of carbonyl groups in the degraded samples. The 30 °C
TREF fractions were found to contain the highest concentration of carbonyl groups and the
number of these groups increased with an increase of the amount of the peroxide. HPLC was
able to analyse both amorphous and crystalline fractions since the HPLC separation depends
mainly on the chemical composition of the samples and not the crystallizability. There was a
significant shift to lower HPLC elution volumes of the samples with the most degraded sample
showing the strongest shift of the elution volume peak maximum. This suggests that EP
copolymers with longer ethylene sequences are affected most by action of an organic peroxide.
To summarize, the present study proved that a single technique approach is not sufficient to
obtain comprehensive information on the molecular compositions of the vis-broken IPC and
EPR copolymers. As a result, the present study established a number of multidimensional
analytical approaches to fractionate and characterize these complex IPC polymer systems.
Stellenbosch University https://scholar.sun.ac.za

Page v
Opsomming
Impak polipropileen ko-polimere (IPC) is komplekse multifase materiale met etileen-propileen
rubber partikels, bevat in 'n semi-kristallyne isotaktiese polipropileen (iPP) matriks. Die etileen-
propileen rubber (EPR) partikels vorm die mees kritieke deel van IPC. Hulle is dwarsdeur die
IPP matriks versprei en is veronderstel om kraak verspreiding onder meganiese spanning te
voorkom. Die EPR fase verminder die kristal grootte van die kristallyne IPP fase en as gevolg
word 'n verbetering in die impak sterkte van IPC gewoonlik waargeneem. IPC materiale het
baie beter impak weerstand in vergelyking met konvensionele IPP en dus kan hulle gebruik
word oor 'n wye temperatuur reeks.
IPCs het gewoonlik ‘n lae smelt vloeitempo (MFR) wat hul toepassing in 'n aantal
giettoepassings beperk. Een manier om die MFR te verhoog is die vis-breking proses wat die
molêre massa van die polimeer verlaag. Inligting oor die molekulêre strukture van die vis-
gebreekte IPC en die molekulêre agtergrond van die vis-breking proses is tot op hede nog nie
heeltemal beskikbaar nie. Daarom was dit die hoofdoel van die huidige studie om die
komposisionele heterogeniteit van EPR en vis-gebreekte IPC materiale met behulp van
multidimensionele analitiese benaderings te ondersoek.
'n Stel EPR ko-polimere, voorberei deur Ziegler-Natta en metalloseen katalisator sisteme, was
gebruik in die huidige studie as model stelsels om die rubber fase in IPC na te boots. Die EPR
monsters het hoë ko-monomeer inhoud in die reeks van 30-70 mol%. Vir 'n ander deel van die
werk, was 'n stel vis-gebreekte IPC monsters met verskillende MFR waardes voorberei deur
degradasie met 'n organiese peroksied. Ongefraksioneerde monsters van die twee stelle was
ontleed deur SEC, DSC, FT-IR, 13C KMR, CRYSTAF en HT-HPLC. Die monsters was
gefraksioneer deur preparatiewe TREF prosedure om fraksies by verskillende TREF eluering
temperature te verkry wat verder ontleed kon word om omvattende inligting oor die molekulêre
samestelling van die monsters te bekom.
Vir die EPR ko-polimeer monsters, het HT-SEC getoon dat die ongefraksioneerde monsters en
hul TREF fraksies breër MMDs in vergelyking met soortgelyke metalloseen-gebaseerde
monsters het. Die ongefraksioneerde monster ontledings het getoon dat die EPR monsters
hoofsaaklik uit ewekansige EP ko-polimere bestaan wat ongeveer 65% van die
ongefraksioneerde monster opmaak. DSC en CRYSTAF was in staat om net die semi- en hoogs
kristallyne TREF fraksies te ontleed. Beide tegnieke kon nie ten volle die 30 °C TREF fraksie
karakteriseer nie aangesien hierdie fraksies ewekansige EP ko-polimere bevat wat heeltemal
Stellenbosch University https://scholar.sun.ac.za
Page vi
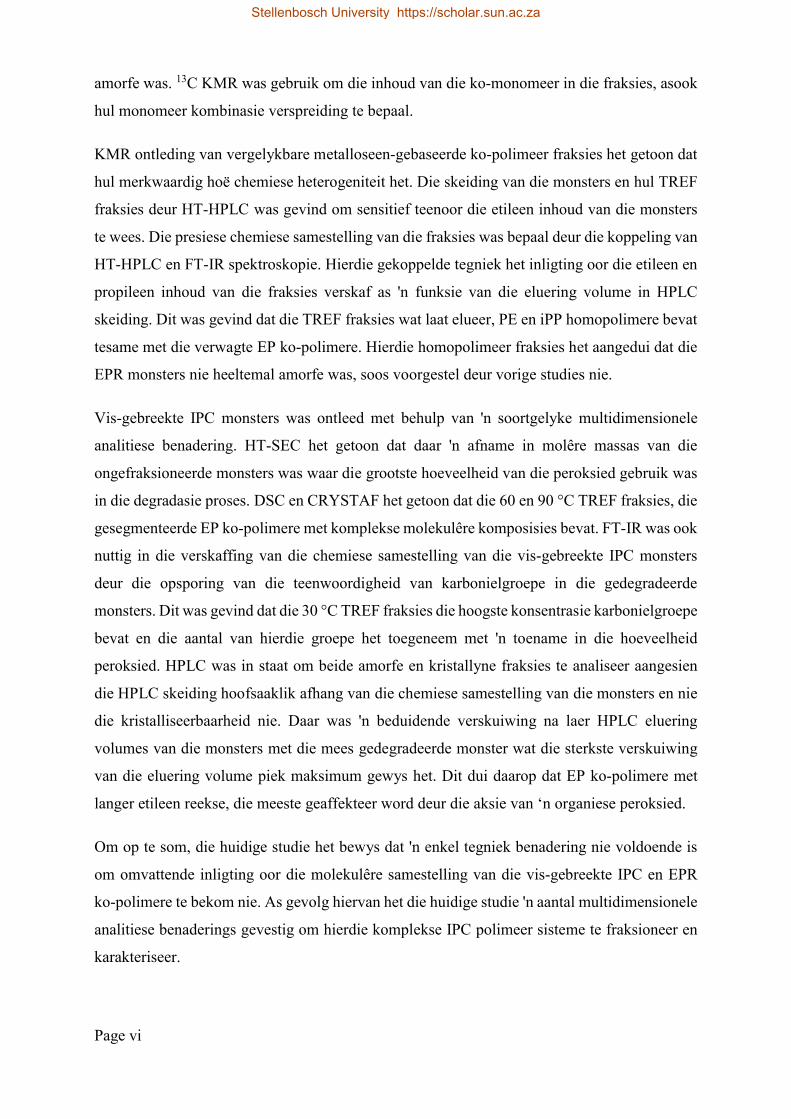
amorfe was. 13C KMR was gebruik om die inhoud van die ko-monomeer in die fraksies, asook
hul monomeer kombinasie verspreiding te bepaal.
KMR ontleding van vergelykbare metalloseen-gebaseerde ko-polimeer fraksies het getoon dat
hul merkwaardig hoë chemiese heterogeniteit het. Die skeiding van die monsters en hul TREF
fraksies deur HT-HPLC was gevind om sensitief teenoor die etileen inhoud van die monsters
te wees. Die presiese chemiese samestelling van die fraksies was bepaal deur die koppeling van
HT-HPLC en FT-IR spektroskopie. Hierdie gekoppelde tegniek het inligting oor die etileen en
propileen inhoud van die fraksies verskaf as 'n funksie van die eluering volume in HPLC
skeiding. Dit was gevind dat die TREF fraksies wat laat elueer, PE en iPP homopolimere bevat
tesame met die verwagte EP ko-polimere. Hierdie homopolimeer fraksies het aangedui dat die
EPR monsters nie heeltemal amorfe was, soos voorgestel deur vorige studies nie.
Vis-gebreekte IPC monsters was ontleed met behulp van 'n soortgelyke multidimensionele
analitiese benadering. HT-SEC het getoon dat daar 'n afname in molêre massas van die
ongefraksioneerde monsters was waar die grootste hoeveelheid van die peroksied gebruik was
in die degradasie proses. DSC en CRYSTAF het getoon dat die 60 en 90 °C TREF fraksies, die
gesegmenteerde EP ko-polimere met komplekse molekulêre komposisies bevat. FT-IR was ook
nuttig in die verskaffing van die chemiese samestelling van die vis-gebreekte IPC monsters
deur die opsporing van die teenwoordigheid van karbonielgroepe in die gedegradeerde
monsters. Dit was gevind dat die 30 °C TREF fraksies die hoogste konsentrasie karbonielgroepe
bevat en die aantal van hierdie groepe het toegeneem met 'n toename in die hoeveelheid
peroksied. HPLC was in staat om beide amorfe en kristallyne fraksies te analiseer aangesien
die HPLC skeiding hoofsaaklik afhang van die chemiese samestelling van die monsters en nie
die kristalliseerbaarheid nie. Daar was 'n beduidende verskuiwing na laer HPLC eluering
volumes van die monsters met die mees gedegradeerde monster wat die sterkste verskuiwing
van die eluering volume piek maksimum gewys het. Dit dui daarop dat EP ko-polimere met
langer etileen reekse, die meeste geaffekteer word deur die aksie van ‘n organiese peroksied.
Om op te som, die huidige studie het bewys dat 'n enkel tegniek benadering nie voldoende is
om omvattende inligting oor die molekulêre samestelling van die vis-gebreekte IPC en EPR
ko-polimere te bekom nie. As gevolg hiervan het die huidige studie 'n aantal multidimensionele
analitiese benaderings gevestig om hierdie komplekse IPC polimeer sisteme te fraksioneer en
karakteriseer.
Stellenbosch University https://scholar.sun.ac.za
Page vii
Acknowledgements
I will like to thank the following people and institutions for their support in the completion of
the present research study.
Prof. Harald Pasch, for the opportunity to allow me to work in his excellent research group.
Most importantly, his outstanding supervision and financial support are highly appreciated.
Dr. Sadiqali Cheruthazhakatt, for his mentoring capacity for a part of the study. His training
sessions on the analytical instruments and polyolefin characterization in general I will
always remember.
Novolen Technology and SASOL companies, for the financial support to complete the
present study. The samples provided by Novolen Technology company are gratefully
acknowledged.
Dr. Anita Dimeska, for the valuable discussion on the 13C NMR analyses of the samples
and for giving more insight about the synthesis part of the samples used in the study. Dr.
Jaco Brand and Mrs Elsa Malherbe for the assistance in running the 13C NMR experiments.
Mpho Phiri, for the unconditional love and emotional support during the course of the study.
Her ability to act as both wife and mentor has been influential to push myself beyond the
limits to complete the present study.
Family, my sisters and brother, for the encouragement and support they have given me. My
son, Poloko Phiri, for being my great motivation towards successful completion of the
current study.
Friends and colleagues, for their ongoing support which aided to the completion of the
study. The extended support from Dr. Lebohang Hlalele, Thato Ralebakeng and Anthony
Ndiripo is much appreciated.
Members of Prof. Pasch’s research group, for the discussions and great moments we shared
together. Their suggestions and comments during the course of the study were very
welcome.
Stellenbosch University https://scholar.sun.ac.za
Page viii
Prof. Albert van Reenen and members of his research group, for the warm welcome in their
lab. The assistance and support on the DSC and CRYSTAF instruments provided by Dr.
Divaan Robertson and Dr. Maggie Brand.
Mr. Deon Koen, Mrs. Erinda Cooper, Mrs. Aneli Fourie, Mr. Jim Motsweni and Mr. Calvin
Maart, for the technical and administrative support provided during my study; ensuring that
the chemicals and equipments were always available for use.
I give the greatest gratitude to Almighty God, Jesus Christ, for the strength and wisdom to face
all the challenges encountered during my PhD work. His guidance along the present research
work will be forever appreciated.
Stellenbosch University https://scholar.sun.ac.za

Page ix
Dedication
To my wife, Mpho Phiri; my son, Poloko Phiri and my daughter, Phomolo Phiri
Stellenbosch University https://scholar.sun.ac.za
Page x
Research outputs
Journal Articles
1. Phiri, M.J.; Cheruthazhekatt, S.; Dimeska, A.; Pasch, H., Molecular Heterogeneity of
Ethylene-Propylene Rubbers: New Insights through Advanced Crystallization-based and
Chromatographic Techniques. Journal of Polymer Science Part A: Polymer Chemistry 53
(2015) 863-874, DOI: 10.1002/pola.27512.
2. Phiri, M.J.; Dimeska, A.; Pasch, H., On the Homogeneity of Metallocene Ethylene-
Propylene Copolymers as Investigated by Multiple Fractionation Techniques,
Macromolecular Chemistry and Physics 216 (2015) 1619-1628, DOI: 10.1002/macp
.201500135.
3. Phiri, M.J.; Pasch, H., Exploring the Compositional Heterogeneity of Vis-broken Impact
Polypropylene Copolymers by Advanced Fractionation Methods, submitted to
Macromolecular Chemistry and Physics on 3 Nov 2015.
Presentations
1. Phiri, M, Cheruthazhekatt, S and Pasch, H.: Studies on compositional heterogeneity in
ethylene-propylene copolymers; Student Symposium in Analytical Sciences, Stellenbosch, 27
March 2014. (Poster Presentation)
2. Phiri, M, Cheruthazhekatt, S and Pasch, H.: Studies on Compositional Heterogeneity in
Ethylene-Propylene copolymers using Fractionation Methods: Polychar 22: World Forum
on Advanced Materials, Stellenbosch, 8 – 11 April 2014. (Oral Presentation)
3. Phiri, M, Cheruthazhekatt, S and Pasch, H.: Characterization of Ethylene-Propylene
Rubbers using DSC, CRYSTAF and HT-HPLC;5thInternational Conference on Polyolefin
Characterization (ICPC), Valencia, Spain, 19-22 September 2014 (Poster Presentation)
4. Phiri, M and Pasch, H: Thermal and Molecular Properties of the Vis-broken Impact
Polypropylene Copolymers; SACI Young Chemists’ Symposium, University of Western Cape,
Bellville, 10 November 2015. (Oral Presentation).
Stellenbosch University https://scholar.sun.ac.za

Page xi
CONTENTS
Declaration for the Dissertation .................................................................................................. i
Declaration for the Publications ................................................................................................. ii
Abstract ..................................................................................................................................... iii
Opsomming ................................................................................................................................ v
Acknowledgements .................................................................................................................. vii
Dedication ................................................................................................................................. ix
Research outputs ........................................................................................................................ x
Journal Articles ...................................................................................................................... x
Presentations ........................................................................................................................... x
List of Figures ......................................................................................................................... xiv
List of Scheme .......................................................................................................................... xv
List of Abbreviations ............................................................................................................... xvi
1 INTRODUCTION .............................................................................................................. 1
1.1 Polyolefins: Background ............................................................................................. 1
1.2 Motivation of the Research .......................................................................................... 3
1.3 Objectives of the Research .......................................................................................... 3
1.4 Hypothesis and Research Questions ............................................................................ 4
1.5 Significance of the Research ....................................................................................... 4
1.6 Scope of the Research .................................................................................................. 4
1.7 Layout of the Research ................................................................................................ 5
1.8 References ................................................................................................................... 6
2 LITERATURE REVIEW ................................................................................................... 8
2.1 Overview on Ethylene-Propylene Copolymers ........................................................... 8
2.2 Separation and Characterisation Techniques ............................................................... 9
2.2.1 Molar Mass Analysis Techniques ........................................................................ 9
2.2.2 Average Chemical Composition Analysis Techniques ...................................... 11
Stellenbosch University https://scholar.sun.ac.za

Page xii
2.2.3 Crystallization-Based Techniques ...................................................................... 12
2.2.4 Interactive Chromatographic Techniques .......................................................... 17
2.3 References ................................................................................................................. 19
3 Experimental Procedures: Analytical Techniques ........................................................... 24
3.1 Temperature Rising Elution Fractionation (TREF) ................................................... 24
3.2 Differential Scanning Calorimetry (DSC) ................................................................. 24
3.3 Crystallization Analysis Fractionation (CRYSTAF) ................................................. 24
3.4 High Temperature Size Exclusion Chromatography (HT-SEC) ............................... 25
3.5 High Temperature High Performance Liquid Chromatography (HT-HPLC) ........... 25
3.5.1 Collection of HPLC fractions by the LC Transform Interface ........................... 26
3.5.2 FTIR analyses of the deposited fractions ........................................................... 27
3.6 Fourier Transform Infrared Spectroscopy (FTIR) ..................................................... 27
3.7 High Temperature 13C NMR Spectroscopy ............................................................... 27
3.8 References ................................................................................................................. 27
4 Molecular Heterogeneity of Ethylene-Propylene Rubbers: New Insights through
Advanced Crystallisation-based and Chromatographic Techniques ........................................ 29
4.1 Summary of the Research Study ............................................................................... 29
4.2 References ................................................................................................................. 33
5 On the Homogeneity of Metallocene Ethylene-Propylene Copolymers as Investigated by
Multiple Fractionation Techniques .......................................................................................... 46
5.1 Summary of the Research Study ............................................................................... 46
5.2 References ................................................................................................................. 50
6 Exploring the Compositional Heterogeneity of Vis-broken Impact Polypropylene
Copolymers using Advanced Fractionation Methods .............................................................. 61
6.1 Summary of the Research Study ............................................................................... 61
6.2 References ................................................................................................................. 65
7 CONCLUSIONS AND RECOMMENDATIONS........................................................... 74
Stellenbosch University https://scholar.sun.ac.za

Page xiii
7.1 Conclusions ............................................................................................................... 74
7.2 Future work................................................................................................................ 76
Stellenbosch University https://scholar.sun.ac.za
Page xiv
List of Figures
Figure 1.1: Schematic diagram illustrating the production of IPC materials using two-stage
polymerisation processes. ........................................................................................................... 2
Figure 2.1: Schematic diagram of the preparative TREF set-up used for fractionation of the vis-
broken IPC and EPR copolymers. ............................................................................................ 15
Figure 3.1: Linear gradient profile for the mobile composition in HPLC separations. ........... 26
Figure 4.1: prep-TREF fractionation results of EPR copolymers (A) and analyses of the 90 oC
TREF fraction using SEC (B), HT-HPLC (C), DSC (D) and CRYSTAF (E). ........................ 31
Figure 5.1: HT-HPLC chromatograms for the bulk EPR samples (A), and the 30 (B) and 130
°C (C) TREF fractions, solvent gradient elution (1-decanol to TCB) after an initial isocratic
step. .......................................................................................................................................... 48
Figure 6.1: prep-TREF fractionation (A) results of vis-broken IPC samples and analyses of the
TREF fractions using DSC (B), FT-IR (C) and HT-HPLC (D). .............................................. 63
Stellenbosch University https://scholar.sun.ac.za

Page xv
List of Scheme
Scheme 1: Vis-breaking of polypropylene sequence by an organic peroxide........................62
Stellenbosch University https://scholar.sun.ac.za
Page xvi
List of Abbreviations
13C NMR Carbon-13 nuclear magnetic resonance
CCD Chemical composition distribution
CEF Crystallization elution fractionation
CRYSTAF Crystallization analysis fractionation
DSC Differential scanning calorimetry
EP Ethylene-propylene
EPC Ethylene-propylene copolymer
EPR Ethylene-propylene rubber
FT-IR Fourier transform infrared
HPLC High performance liquid chromatography
HT-HPLC High temperature high performance liquid chromatography
HT-SEC High temperature size exclusion chromatography
IPC Impact polypropylene copolymer
iPP isotactic polypropylene
MMD Molar mass distribution
NMR Nuclear magnetic resonance
PE Polyethylene
PP Polypropylene
Prep TREF preparative temperature rising elution fractionation
SEC Size exclusion chromatography
TCB 1,2,4-trichlorobenzene
Stellenbosch University https://scholar.sun.ac.za

Page xvii
TREF Temperature rising elution fractionation
Stellenbosch University https://scholar.sun.ac.za

Page 1
CHAPTER1: INTRODUCTION
1 INTRODUCTION
This chapter gives a brief outline of two different types of ethylene-propylene copolymers,
namely EPR and vis-broken IPC materials. It details properties, applications and the
production process of these complex materials, highlighting differences between them. From
the gap identified in literature, motivation, aims and objectives of the research work are
formulated. The importance of this study is pointed out together with the scope to be covered.
Finally, the layout of the whole dissertation is presented to give the reader an overview what
to expect throughout the whole document.
1.1 Polyolefins: Background
Polyolefins are the largest group of thermoplastics in the global plastics market. They are found
in numerous applications ranging from packaging films, bottles, artificial turf to car body parts1-
3. These synthetic polymer commodities include polyethylene (PE), polypropylene (PP) and
copolymers of both ethylene and propylene. The increased use of polyolefins in daily life
resulted from the simple production process which requires only cheap and readily available
monomers. The annual production of polyolefins exceeds 100 million metric tons per year and
continues to grow exponentially4,5. The most common class of polyolefins is PP due to its
widespread application in reusable plastic containers, automotive parts and electrical industries.
In addition, PP materials exhibit high performance in terms of heat resistance and tensile
strength, however, PP has a low impact resistance hence it cannot be used at low
temperatures1,6-10.
In order to improve the impact properties of PP, several approaches including the nucleation
process11, blending with elastomers12-14 and copolymerization with α-olefins15-17, have been
used in both academia and industry. Among these approaches, copolymerization of propylene
with ethylene using two-stage, two-reactor polymerisation processes have been found to be the
most effective to obtaining high impact resistant PP2,18. A schematic diagram of the process is
shown in Figure 1. This process produces microphase-separated materials with a continuous
iPP phase and a dispersed EP rubber phase. The random rubber plays a major role as a
component for toughness improvement in the PP matrix. During the polymerisation process,
the amount of ethylene added determines the percentage of rubber in the final copolymers.
Impact polypropylene copolymers (IPC) are formed with ethylene contents up to ~20 mol %.
Stellenbosch University https://scholar.sun.ac.za

Page 2
IPC materials consist of iPP homopolymer as the major crystalline phase with a small amount
of rubber phase and segmented ethylene-propylene (EP) copolymers. Vis-broken IPC is the
treated IPC material with peroxide to decrease its molar mass19,20. As such the melt flow index
of vis-broken IPC material is increased to improve the processability of the polymer21.
However, there is also an increase in the chemical composition complexity due to carbonyl
products that are formed upon the degradation with peroxide20. EPR materials consist mainly
of an amorphous or rubbery phase and small amounts of segmented EP copolymers, PP and PE
homopolymers.
Figure 1.1: Schematic diagram illustrating the production of IPC materials using two-stage
polymerisation processes.
According to Figure 1.1, the final IPC material has a very complex composition. In addition to
the chemical composition distribution (CCD), the molar mass distribution (MMD) also
contributes to the complex nature of the IPC. The complexity in this type of IPC materials is
also brought about by the nature of the catalyst system being used. For instance, Ziegler-Natta
catalyst systems result in broad compositional distributions due to their multiple active sites to
produce different chain structures22,23. On the other hand, metallocene catalysts with their single
active sites produce polymer materials with narrow compositional distributions5,22,24,25. For a
polymer chemist, the need to relate the molecular composition of the polymer to its final
applicability is always a major challenge since the compositional heterogeneity and sequence
distribution of comonomer units along the polymer chains influence the microstructure of the
final copolymer. As such a comprehensive analytical approach must be developed to achieve
proper understanding of the complex polymer distributions.
EthyleneIPC
EPC, EPR PP, PE
PP
Catalyst
Propylene
Additives
Stellenbosch University https://scholar.sun.ac.za
Page 3
1.2 Motivation of the Research
EPRs with high comonomer contents and vis-broken IPC samples have complex distributions
in terms of molar mass and chemical composition as depicted in Figure 1.1. The rubber phase
plays a critical role for the impact resistance of IPC materials and its molecular structure has
not been largely investigated in previous work since it is regarded as completely amorphous
material26. In addition, the molecular structure of vis-broken IPC materials have not been
studied extensively in previous work21,27. The determination of the relationship between
molecular structures of bulk samples and the individual components of the EPR copolymers
and vis-broken IPC is a major challenge for polymer analysis. As such a single analytical
technique approach cannot be used to fully characterise these types of complex polymer
materials since minor components might not be detected and analysed due to their low
concentrations. Hence, a comprehensive approach which combines various advanced analytical
techniques must be developed to fully separate and characterise all components of these
complex materials. This approach will be used in the present research project.
1.3 Objectives of the Research
From the literature review done, it can be deduced that vis-broken IPC and EPR copolymers
are complex materials in terms of microstructural properties. Hence, the main aim of this study
is to modify known analytical methods, to combine these methods and to develop a
multidimensional analytical approach to obtain comprehensive information regarding the molar
mass distribution (MMD) and chemical composition distribution (CCD) present in these
complex polymeric systems.
The specific objectives for this research work include the following:
1. To determine MMD and CCD for bulk samples of both EPR and vis-broken IPC using
various analytical techniques including SEC, DSC, CRYSTAF, FT-IR, 13C NMR, HT-
HPLC and HPLC-FT-IR.
2. To perform fractionations on bulk samples of both EPR and vis-broken IPC using the
preparative TREF technique.
3. To determine the molecular heterogeneities of all TREF fractions using the previously
mentioned analytical techniques for bulk sample analyses.
Stellenbosch University https://scholar.sun.ac.za

Page 4
1.4 Hypothesis and Research Questions
The aims and objectives of this study will answer the following key questions to fully
understand the complexity of these two polymer systems by looking at the following three
hypotheses:
In the first part of the study, the EPR copolymers prepared by Ziegler-Natta catalyst are studied
using various analytical techniques. The aim in the current study is to test the hypothesis if EPR
samples with high comonomer contents are completely amorphous or if the samples contain
semi-crystalline components.
The second part of the study deals with the molecular characterization of the EPR copolymers
synthesized by the metallocene catalyst. The present study will determine if the metallocene-
based EPR samples are homogeneous regarding their chemical composition.
The last part of the study deals with the effect of an organic peroxide on the molecular structures
of the IPC materials. From the present study, the key question to be answered is which
components of IPC material are largely affected by thermo-oxidative degradation which is part
of the vis-breaking process.
1.5 Significance of the Research
Through a detailed literature survey it was found that there is little known in terms of the
microstructures in EPR with high comonomer contents and vis-broken IPC samples. Thus, for
the first time and based on knowledge of the current research, detailed and comprehensive
microstructural analyses of EPR copolymers and vis-broken IPC materials will be done to
achieve the following goals. Firstly, the characterization and separation of the individual
components in the bulk samples will be achieved through various fractionation techniques.
Secondly, the changes in both chemical composition and molar mass of the IPC as a result of
vis-breaking will be monitored. Lastly, a better understanding of these two complex polymer
systems will be attained after completion of this study.
1.6 Scope of the Research
This study will focus only on two types of EP copolymers namely EPR and vis-broken IPC
samples. The scope of this research work was based on the following observations or gaps seen
in previous work. Firstly, separation and characterization was only done on bulk samples of
EPR with high comonomer contents, where these copolymers were considered to be
Stellenbosch University https://scholar.sun.ac.za

Page 5
amorphous26. The present study will extend the analyses to preparative fractionation procedures
using TREF. The analyses of the TREF fractions will provide the detailed molecular
heterogeneities of the EPR samples. Another part of this study will focus on degraded IPC
materials. The previous work done on vis-broken IPC material had only covered the thermal
and average chemical composition analyses19,21. The current study will deal with the
comprehensive microstructural analyses of the vis-broken IPC using advanced fractionation
techniques.
The non-degraded IPC materials have been dealt with extensively in the literature. Several
authors21,26,28,29 reported some research work on the physical, chemical and mechanical
properties of the bulk samples of IPC. Cheruthazhekatt et al.30 separated and characterized the
IPC bulk samples using advanced analytical techniques. In their work, they did analyses on
TREF fractions to explore the microstructure of these complex polymeric materials. Therefore,
comprehensive work on the non-degraded IPC materials will not be part of the current work.
The mechanical and morphological properties of both EPR and vis-broken IPC materials will
also not be covered in the present study.
1.7 Layout of the Research
The work of this research is presented in four different chapters as outlined below.
Chapter 1 gives the reader some historical background on both EPR and vis-broken IPC
materials highlighting major findings in their separation and characterization. The
motivation, aims and objectives of the study are given based on the gaps observed in
previous work. Finally, the significance and scope of the study are illustrated to guide
the reader for what to expect in this current research work.
Chapter 2 gives the reader some insight into properties and applications of EPR and vis-
broken IPC materials. Based on the complex nature of these materials, various analytical
techniques are needed and thus extensive literature review is done to cover most of the
separation and characterization techniques. Through the literature, attention is given to
recent developments in polyolefin analysis so that the strengths and limitations of the
techniques can be identified.
Stellenbosch University https://scholar.sun.ac.za
Page 6
In Chapters 3, 4 and 5, the results and discussions of three different studies done under
this research work are summarized. The major findings are highlighted and presented
in these chapters. For detailed information, the reader is referred to peer-reviewed
articles attached to this dissertation.
Chapter 6 gives conclusions on the results of the three studies that were conducted. Once
more the reader is referred to full articles at the appendix since only major points are
presented in this chapter. Recommendations for future work are also given here so that
additional information about these complex materials can be obtained.
1.8 References
1. M. Gahleitner, C. Tranninger, P. Doshev. Journal of Applied Polymer Science 2013, 130, 3028-3037.
2. C. Kock, N. Aust, C. Grein, M. Gahleitner. Journal of Applied Polymer Science 2013, 130, 287-296.
3. S. Cheruthazhekatt, H. Pasch. Analytical and Bioanalytical Chemistry 2013, 405, 8607-8614.
4. T. Macko, R. Brüll, Y. Zhu, Y. Wang. Journal of Separation Science 2010, 33, 3446-3454.
5. W. Kaminsky. Macromolecular Chemistry and Physics 2008, 209, 459-466.
6. V. Agarwal, T. B. Van Erp, L. Balzano, M. Gahleitner, M. Parkinson, L. E. Govaert, V. Litvinov, A. P. M. Kentgens. Polymer 2014, 55, 896-905.
7. C. Grein, M. Gahleitner, K. Bernreitner. Express Polymer Letters 2012, 6, 688-696.
8. F. M. Mirabella Jr. Polymer 1993, 34, 1729-1735.
9. R. Zacur, G. Goizueta, N. Capiati. Polymer Engineering and Science 2000, 40, 1921-1930.
10. R. Zacur, G. Goizueta, N. Capiati. Polymer Engineering and Science 1999, 39, 921-929.
11. M. Sun, D. Gao, H. Zhang, H. Zou, M. Xu, S. Zhang, J. Li, J. Liu. Journal of Applied Polymer Science 2014, 131, 8705-8713.
12. Z. Q. Fan, Y. Q. Zhang, J. T. Xu, H. T. Wang, L. X. Feng. Polymer 2001, 42, 5559-5566.
13. Z. Fu, J. Xu, Y. Zhang, Z. Fan. Journal of Applied Polymer Science 2005, 97, 640-647.
14. M. H. Ha, B. K. Kim. Polymer Engineering and Science 2004, 44, 1858-1865.
15. L. Botha, P. Sinha, S. Joubert, H. Duveskog, A. J. van Reenen. European Polymer Journal 2014, 59, 94-104.
16. L. Botha, A. J. van Reenen. European Polymer Journal 2013, 49, 2202-2213.
17. S. Mncwabe, N. Luruli, E. Marantos, P. Nhlapo, L. Botha. Macromolecular Symposia 2012, 313-314, 33-42.
Stellenbosch University https://scholar.sun.ac.za
Page 7
18. C. Kock, M. Gahleitner, A. Schausberger, E. Ingolic. Journal of Applied Polymer Science 2012, 128, 1484-1496.
19. E. de Goede, P. E. Mallon, K. Rode, H. Pasch. Macromolecular Materials and Engineering 2011, 296, 1018-1027.
20. H. Pasch, E. de Goede, P. Mallon. Macromolecular Symposia 2012, 312, 174-190.
21. M. Swart, A. J. van Reenen. Journal of Applied Polymer Science 2015, 132, 41783.
22. A. Shamiri, M. H. Chakrabarti, S. Jahan, M. A. Hussain, W. Kaminsky, P. V. Aravind, W. A. Yehye. Materials 2014, 7, 5069-5108.
23. E. de Goede, P. Mallon, H. Pasch. Macromolecular Materials and Engineering 2010, 295, 366-373.
24. C. Piel, F. G. Karssenberg, W. Kaminsky, V. B. F. Mathot. Macromolecules 2005, 38, 6789-6795.
25. K. Jeon, Y. L. Chiari, R. G. Alamo. Macromolecules 2008, 41, 95-108.
26. T. Macko, A. Ginzburg, K. Remerie, R. Brüll. Macromolecular Chemistry and Physics 2012, 213, 937-944.
27. E. de Goede, P. E. Mallon, H. Pasch. Macromolecular Materials and Engineering 2012, 297, 26-38.
28. J. Tocháček, J. Jančář, J. Kalfus, P. Zbořilová, Z. Buráň. Polymer Degradation and Stability 2008, 93, 770-775.
29. S. Cheruthazhekatt, H. Pasch. Macromolecular Symposia 2014, 337, 51-57.
30. S. Cheruthazhekatt, G. W. Harding, H. Pasch. Journal of Chromatography A 2013, 1286, 69-82.
Stellenbosch University https://scholar.sun.ac.za
Page 8
CHAPTER2: LITERATUREREVIEW
2 LITERATURE REVIEW
In this chapter, an overview of ethylene – propylene copolymers (EPC) is given, illustrating the
properties and final applicability of these materials. Also, on the basis of the polymerization
conditions, the compositional complexities for two types of EPC materials namely vis-broken
IPC and EPR copolymers are highlighted. A comprehensive survey on various analytical
techniques used for separation and characterisation of EPC materials is also presented. The
strengths and weaknesses of each technique are pointed out.
2.1 Overview on Ethylene-Propylene Copolymers
Isotactic polypropylene (iPP) has a number of valuable properties such as excellent heat
resistance and high tensile strength, however, it exhibits poor low-temperature impact
resistance1-4. The incorporation of a rubber material as a toughening agent has been proven to
be an effective way to improve the low impact resistance of iPP5. Materials with high impact
resistance have found widespread applications in automotive, packaging and industrial sewage
pipelines6-8. Several approaches to improve the impact resistance of iPP have been reported in
literature, for example reducing crystal size of iPP by influencing the nucleation process4,
blending with elastomers6,9-14 and copolymerization with ethylene species6-8,15-18. The binary
and ternary blends prepared by mechanical blending have been used extensively to determine
the influence of various components in the matrix of the iPP homopolymer12,19. The materials
produced by copolymerization have been proved to be superior both in mechanical and
chemical properties9,15-17,20.
Several types of ethylene-propylene copolymers (EPC) including impact polypropylene
copolymers have been produced on industrial scale. The production process is carried out as a
two-stage polymerization reaction. In the first reactor, the iPP matrix is produced and
transferred to the second reactor where ethylene is introduced together with propylene to
produce different types of EPC materials. The percentage of ethylene in the second reactor
determines the final product composition since higher percentage values between 20 – 80 mol
%, have resulted in the formation of ethylene-propylene rubber (EPR) copolymers with high
comonomer contents21. The inclusion of the rubbery material in the iPP matrix results in impact
polypropylene copolymers (IPC)22. In addition, other segmented copolymers with different
ethylene or propylene sequences are produced to form semi-crystalline structures23.
Stellenbosch University https://scholar.sun.ac.za
Page 9
The addition of organic peroxides to IPC produces vis-broken or degraded IPC materials.
Several authors have shown that the process of vis-breaking can be done by adding the organic
peroxide as additive either during copolymerization24-26 or during the post-modification process
using extruders7. A decrease in molar mass is always observed after the vis-breaking process
indicating that the complex nature of vis-broken IPC materials is much increased as compared
to non-degraded materials. The determination of the relationship between bulk molecular
structures and the individual components of the vis-broken IPC and EPR copolymers is a
challenge for polymer analysis. Complex analytical approaches to separate and characterize all
components in these copolymer systems are needed to obtain comprehensive information on
the EPC materials.
2.2 Separation and Characterisation Techniques
The complex nature of the EPC materials requires comprehensive analysis in terms of molar
mass distribution (MMD) and chemical composition distribution (CCD), therefore, full
separation and characterisation of all fractions of the materials must be achieved. As typical
semi-crystalline polyolefins, both IPC and EPR copolymers cannot be fractionated at room
temperature since they are soluble only above their crystallization temperatures which are above
120 °C. There are numerous techniques available for analysis of EPC materials. However, the
techniques to be presented here will focus mainly on those used to carry out the current research
work. Other analytical techniques not relevant to the study will only be highlighted where
necessary.
2.2.1 Molar Mass Analysis Techniques
Molar mass averages, molar mass distributions (MMD) and dispersity (Ð) values of EPC
materials are typically determined by high temperature size exclusion chromatography (HT-
SEC)2,27-35. The dispersity values are a unique characteristic which can be used to differentiate
EPR copolymers prepared by different catalyst systems. Metallocene-catalysed EPR
copolymers have lower values of Ð36,37 due to the homogenous nature of the active sites of the
catalyst while Ziegler-Natta-catalysed copolymers have higher values15,16 which are the result
of the high heterogeneity of the catalyst. Botha et al16 studied EPR copolymers with different
ethylene contents and they found that copolymers with the highest ethylene contents have
higher molar masses. In the same study, when they coupled SEC to FT-IR spectroscopy, they
observed that the ethylene content increased with increasing molar mass whereas the propylene
Stellenbosch University https://scholar.sun.ac.za

Page 10
content decreased. Several studies26,38-41 have shown that vis-broken IPC materials have
decreased molar masses since the peroxide breaks long ethylene or propylene sequences to
shorter chain sequences. Swart and van Reenen24 showed that the amount of peroxide had a
significant influence in lowering the molar masses of EP copolymers having similar ethylene
contents. Pasch et al.26,39,40 showed that the low molar mass region of degraded IPC copolymers
contain more carbonyl products and this was an indication of increased chain scission upon
degradation.
HT-SEC analyses of EP copolymer fractions from temperature rising elution fractionation
(TREF) have been largely explored by Cheruthazhekatt and co-workers35,42,43. In their work,
they have shown that bulk samples and their TREF fractions have different MMDs. The
fractions show clear multimodality in MMD which indicates compositional heterogeneity
especially for the mid-elution TREF fractions (elution temperatures between 60 and 100 oC).
This observation was further supported by other studies in which it was reported that fractions
collected at 60 – 100 °C show multiple MMDs since semi-crystalline parts of the copolymer
and PP homopolymer co-elute due to the isotacticity and molar mass distribution found in PP44.
However, higher eluting TREF fractions were observed to exhibit monomodal MMDs. Pasch
and co-workers26,39,44 have extensively studied the TREF fractions obtained from vis-broken
IPC materials and they have observed that early and late eluting fractions have a definite shift
towards lower molar masses upon degradation. Swart and van Reenen24 further indicated that
the organic peroxide had a significant effect on the 30 °C TREF fraction which is composed of
soluble EP rubber. Furthermore, both studies have confirmed that the mid-elution TREF
fractions show more complicated changes in MMD since lower and higher molar masses are
affected differently by the degradation.
High temperature SEC has been applied successfully for the analyses of EP copolymers,
however, the analysis of MMD was not sufficient to fully characterise these copolymer
materials. In most applications, SEC was coupled to other detection techniques like FT-IR44-47
and DSC42,43,48 to enrich the information obtained from this technique. In general, this review
on SEC techniques shows that SEC analyses alone cannot provide comprehensive separation
and characterisation of these complex polyolefin materials, hence chemical composition
techniques are always needed to enhance the information to be gathered during the analysis.
The next section will deal with chemical composition analysis techniques which are both
relevant to the present research project and have been previously used in the analyses of EPC
materials.
Stellenbosch University https://scholar.sun.ac.za
Page 11
2.2.2 Average Chemical Composition Analysis Techniques
In most studies dealing with the determination of the average chemical composition of EPC
materials, Fourier transform-infrared (FT-IR)49 and carbon-13 nuclear magnetic resonance (13C
NMR)49-51 spectroscopy have been employed to determine the comonomer content of such
materials. In most industrial and academic research applications, FT-IR is used not only to
identify the functional groups (i.e. -CH2- and -CH3) in EPC materials but also to determine the
crystallinity of the materials. Cheruthazhekatt et al.43,48,51 studied two IPC bulk samples with
different ethylene contents, (10.4 and 11.8 mol %) and they could not differentiate between the
two samples using the FT-IR spectroscopy technique alone. However, after TREF fractionation
of the samples, the individual fractions were able to be differentiated using the ethylene
crystallinity which is characterised by FT-IR absorption bands at 720 – 730 cm-1. The split of
the peaks was found to increase with increasing TREF elution temperature, but the 130 °C
fraction showed no split in the same spectral range due to the presence of predominantly long
propylene units.
In a different study49, two EPR copolymers with higher ethylene contents, 71 and 80 mol %,
were characterised and differentiated using the FT-IR technique on the basis of the relative
intensities of the doublet at 720 – 730 cm-1. The appearance of this doublet indicated that some
of the ethylene units were long enough to form crystalline lamellae. Propylene units were also
observed to be present based on specific IR bands of these copolymers. The presence of
carbonyl-containing degradation products was observed in vis-broken IPC materials based on
the study done by de Goede et al.39. In their study, they used wavenumbers in the range of 1600
– 1750 cm-1 to quantify the carbonyl-containing species and they showed that IPC materials
with higher ethylene contents degrade at a slower rate due to their lower tertiary carbon
contents. In other studies, the FT-IR spectroscopy technique has been applied as a very useful
supplementary tool when it was coupled to other techniques such as SEC44 and HPLC45,52 since
the propylene and ethylene contents of the copolymers could be determined as a function of
elution volume.
High temperature 13C NMR spectroscopy has been applied successfully to differentiate IPC and
EPR copolymers based on their comonomer contents. The technique can be further utilised to
determine the monomer composition and sequence distributions in EPC materials53-55. The
research works done by both Randall56 and Ray et al.57 form the basis for microstructural
Stellenbosch University https://scholar.sun.ac.za

Page 12
analysis of monomer sequences in polyolefin materials since they have developed relationships
for quantifying dyads and triads in EPC materials. Ray et al.57 further showed that EPR
copolymers have complicated NMR spectra because of additional peaks which result from
different tactic units of propylene. The complex nature of the NMR spectra for EPR copolymers
was also confirmed by Tynys et al.58. In their work, they studied EPC materials prepared with
metallocene catalyst systems and they were able to deduce mechanisms of chain initiation and
termination for the polymerization reaction.
Fu et al.49 fractionated two EPR copolymers using a thermal-gradient extraction fractionation
technique and analysed the resulting fractions using 13C NMR spectroscopy. The NMR spectra
obtained for soluble fractions were found to be quite complex due to presence of random
ethylene-propylene rubber components. The mid-elution fractions were observed to have
different ethylene and propylene segments ranging from shorter to longer sequences15,24. In
addition, these fractions indicated the presence of EP junctions in the polymer chain. The late
eluting fractions at 120 and ˃120 °C had NMR characteristics similar to those of PE and iPP
homopolymers, respectively. However, trace amounts of PE-b-PP block copolymers were also
observed in these fractions further proving the complex nature of the EPR copolymers49. Swart
and van Reenen24 also used 13C NMR spectroscopy to track the changes in both dyad and triad
sequences along the TREF fractions. They showed that vis-breaking affects the segmented
ethylene-propylene copolymers with long ethylene sequences. NMR spectroscopy can be
further coupled to HPLC32,59-61 to provide additional information on the chemical composition
of the copolymers. Therefore, it remains a critical tool for microstructural analysis in polyolefin
characterisation irrespective of the complex nature of the NMR spectra of EPC materials.
FT-IR and NMR can only give average chemical composition information about the EPC
copolymer being analysed. This means that these techniques are not sufficient to determine the
compositional heterogeneity of the EPC materials. In order to obtain comprehensive
information on the chemical composition for the EPC materials, various fractionation
techniques are available to separate polyolefins according to their chain structure. These
techniques are either based on crystallization or interaction chromatographic principles.
2.2.3 Crystallization-Based Techniques
Thermal analysis is an effective way to obtain a wealth of information regarding the chemical
composition of polyolefin materials. Differential scanning calorimetry (DSC) has been used
Stellenbosch University https://scholar.sun.ac.za

Page 13
extensively in both industrial and academic applications to determine the crystallization and
melting behaviour of EPC materials5,20,35,62-68. The technique is fast and reliable for routine
analysis since there is little or no sample preparation required. Bulk IPC materials were
analysed with DSC and single distinct peak maxima for melting were detected at ~ 155 °C. This
peak was related to the melting behaviour of the iPP matrix37,42,43. The melting and
crystallization temperatures of other minor IPC components (random EPR, segmented EPC and
PE homopolymer) were not detected, they were assumed to be masked by the major component
of the material. Stephens et al.69 used the DSC technique to study the thermal behaviour of
metallocene-catalysed copolymers with varying ethylene contents. They found that increasing
comonomer contents resulted in a decrease of the peak melting temperature. In another study26,
the IPC material was studied through stages of degradation using DSC and it was observed that
the melt endotherm broadens and splits into two peaks with increasing degradation time. The
second peak was assumed to be caused by carbonyl-containing species formed in the
degradation process.
DSC analysis of TREF fractions has been done successively on both IPC and EPR copolymers.
Pires et al.9 fractionated reactor blends of different compositions containing segmented EP
copolymers which were prepared by a Ziegler-Natta catalyst system. The TREF fractions
collected at the same temperature, 50 °C, showed different melting endotherms indicating
different chemical compositions among the copolymers. Several studies have shown that 30 °C
TREF fractions show no observable melting and crystallization since these fractions contain
amorphous random EP rubbers. On the other hand, the late eluting TREF fractions have melting
and crystallization characteristics similar to those of PE and iPP homopolymers. de Goede et
al.44 further showed that the mid-eluting TREF fractions at 60 – 100 °C exhibit multiple melt
endotherms which indicate the presence of various crystallisable components. The same
observation was also made by Liberman et al.70 where it was demonstrated that the mid-eluting
fractions have compositional heterogeneities due to different crystalline structures. Moreover,
their DSC results were consistent with their 13C NMR analyses.
Despite the successful application of DSC for the analysis of EPC materials, the technique has
a major drawback of co-crystallization experienced during the analysis of materials having
different crystallisable components20,71-73. This effect in DSC analysis is caused by the fact that
macromolecules containing propylene sequences have reduced mobility during the
crystallization step and as such they form crystals at lower temperatures74,75. Another limiting
factor in DSC analysis is that the quantitative determination of the crystallizing material is
Stellenbosch University https://scholar.sun.ac.za

Page 14
depended on the thermal history and also the crystallization behaviour of the components are
strongly influenced by their molecular environment71.
Solution crystallization-based fractionation techniques have been developed to overcome the
difficulties encountered in DSC analysis. These techniques have the advantage that
crystallization takes place in a thermodynamically good solvent, hence the effects of co-
crystallization are minimised. There are numerous methods that exist for fractionation of
polyolefins in solution, but the focus of this discussion will be only on two techniques namely,
temperature rising elution fractionation (TREF) and crystallization analysis fractionation
(CRYSTAF).
The TREF technique has been widely applied for polyolefin analysis after its development done
by Wild76,77. The technique has been used for the determination of chemical composition
distributions of EPC and other polyolefins as either analytical70,78-81 or preparative
TREF17,35,48,73. Aust et al.82 performed a comprehensive study to optimise the experimental run
parameters of TREF using heterophasic EPC materials. In their work, they used factorial design
experiments to improve the resolution of TREF curves for EP copolymers and they found that
increasing the start temperature of crystallization has a significant impact on the separation of
the copolymer components. Monrabal and del Hiero81 used analytical TREF to fractionate and
characterise blends of PE, iPP and EPC and found that the technique provides poor resolution
for combinations of PE and EPC materials but better separation was obtained for blends of
highly regular iPP and PE homopolymers.
Stellenbosch University https://scholar.sun.ac.za

Page 15
Figure 2.1: Schematic diagram of the preparative TREF set-up used for fractionation of the vis-broken IPC and EPR copolymers.
Figure 2.1 shows the schematic diagram of the preparative set-up used for the fractionation
experiments in the present study. Polyolefin material is usually dissolved in the xylene at 130
°C. The reactor with polyolefin solution is filled with purified sand which acts as the
crystallization support. The controlled crystallization of the mixture is achieved by the oil bath
which is cooled at a controlled rate of 1 °C/hour. The polyolefin together with the support
material (purified sand) are heated in the oven at a specified heat rate as shown in Fig.2.1. At
the same time, xylene solvent is passed through the mixture of the polyolefin to collect different
fractions of the bulk material at the predetermined temperature intervals. de Goede et al.44 did
preparative TREF experiments of the IPC materials and they showed that the early eluting
fractions at 30 °C consist mainly of random EP copolymers which are completely amorphous.
Several authors17,48,52,83 found that the mid-elution fractions collected in the temperature range
of 60 – 100 °C consist of segmented EP copolymers. Cheruthazhekatt et al.42,43 suggested that
the mid-elution fractions form the interphase between the rubber and homopolymer phases
since they have broad molecular compositions in terms of the MMD and CCD. PE and iPP
homopolymers are usually found in the late eluting fractions above temperatures of 120 °C.
Despite the fact that preparative TREF is a very tedious and time consuming technique, it is
considered as suitable method for the separation, isolation and analysis of the individual
components in the copolymer matrix. Most importantly, it has been used as the concentrating
step for minor components in the bulk copolymers. Pasch et al.26 emphasised the need for
preparative TREF when characterising degraded IPC materials since there was significant
Stellenbosch University https://scholar.sun.ac.za

Page 16
heterogeneity in chemical composition due to the degradation process. In most studies, the
collected individual fractions are analysed using different offline techniques like SEC, FT-IR
and DSC. Kock et al.1,8 used both analytical and preparative TREF techniques separately to
fractionate IPC materials which have different PE modifiers. The combination of the two
techniques has allowed for the fractionation and characterisation of both the amorphous and
crystalline components of the copolymers. However, they found that the separation of random
EPC and high density PE was quite difficult to achieve and this was also supported by the work
done by Monrabal et al.71,80,81.
Monrabal and co-workers84-87 developed CRYSTAF as an alternative technique to overcome
the limitations of TREF for the separation and characterisation of EPC and other polyolefins.
Since its introduction into polyolefin analysis, CRYSTAF has been established as an
indispensable tool due to its short analysis time80,87-92. Macko et al.37 used CRYSTAF to study
EPR copolymers having different ethylene contents ranging from 14 – 56 mol %. The
copolymers were found to be completely amorphous and could not be separated according to
their chemical composition. However, for lower comonomer contents of 2 – 9 mol %, Chitta et
al.28 showed that separation is possible with the CRYSTAF technique since all peak maximum
crystallization temperatures can be resolved and identified. The degradation process of IPC
bulk materials was examined by the CRYSTAF technique and a decrease in the peak maximum
of the crystallization curves was observed for layers close to the surface of the material26,40.
Similar to TREF results presented elsewhere24, a significant increase in the soluble fraction was
also noticed.
Bulk IPC materials have been studied extensively using the CRYSTAF technique to determine
their CCDs. Several authors37,51,93 have shown that bulk IPC samples have peak maximum
crystallization temperatures similar to those of the iPP homopolymer. However, IPC materials
show much higher soluble material than iPP due the amount of ethylene units incorporated into
the copolymer. From CRYSTAF analysis, the early eluting TREF fractions have been shown
to have no observable amount of crystallisable material, rendering them to be completely
amorphous. Cheruthazhekatt et al.93 analysed mid-eluting fractions using the CRYSTAF
technique. In their research work, they reported broad CCDs for the fractions and they assumed
that these fractions are the important components of the IPC material. Numerous studies have
shown that it is difficult to separate PE and iPP homopolymers using the CRYSTAF technique
since their peak maxima crystallization temperatures are close to each other71,81. The
Stellenbosch University https://scholar.sun.ac.za

Page 17
crystallization temperature of the iPP homopolymer appears below that of PE due to the super-
cooling effects experienced by iPP when in solution.
Regardless of the success in the applications of both TREF and CRYSTAF techniques for
polyolefin analyses, these two techniques suffer from co-crystallization effects for components
with different CCDs but having similar crystallization temperatures. Furthermore, these
techniques are less useful in the analyses of amorphous materials, making them only applicable
to semi- or highly crystalline materials. Lastly, the large amounts of solvent being used are a
major concern for their application in the polyolefin industry.
2.2.4 Interactive Chromatographic Techniques
A comprehensive solvent-gradient chromatographic technique which allows the separation and
characterization to occur above the melting and crystallization temperatures of EPC materials
has been used to avoid the problems of co-crystallization effects that take place in DSC, TREF
and CRYSTAF2,30,32,38,94-99. High temperature high performance liquid chromatography (HT-
HPLC) permits the analysis of both amorphous and crystalline materials since the separation of
the macromolecules depends on their interaction with the stationary phase (according chemical
composition) in the presence of a binary mobile phase2,100-102.
Macko et al.98,99 have selectively separated PE and PP from their blends using two types of
zeolite materials as the stationary phases. They showed that PE or PP macromolecules are either
fully eluted or retained depending on the zeolite type and solvents. They further observed that
the retained material is quite difficult or sometimes impossible to desorb from the stationary
phase. The limitation of the zeolite materials was overcome by the use silica gel as stationary
phase and several authors38,103,104 have reported that EP copolymers are effectively separated
and eluted from the column with use of binary mobile phases. However, poor resolution and
selectivity towards certain polyolefin systems like vinyl acetate was observed with silica gel
materials as stationary phase38,103,105. A major breakthrough in interactive chromatographic
analysis came from the work done by Macko and Pasch97 where a HT-HPLC method that
utilises a porous carbon-based material as stationary phase was developed. Their method has
shown superior capabilities by separating polypropylene according to its three different
tacticities (isotactic, atactic and syndiotactic) as well as from other polyolefins.
Stellenbosch University https://scholar.sun.ac.za
Page 18
The same chromatographic system has been improved in recent years to separate different
polyolefin materials according to their chemical composition104,106-109. In HPLC analysis of
EPC materials, the elution volumes increase with the ethylene contents of the copolymers28,36.
This behaviour results from a stronger adsorption of PE on the planar surface of graphite as
compared to other species of PP or segmented EP macromolecules. Chitta et al.36,106 studied
metallocene-catalysed EPR copolymers with high comonomer contents of between 18 – 80 mol
% using HT-HPLC. They found that the molar mass had no effect on the separation behaviour
of the EPR copolymers but the ethylene content had an influence on separation using the
Hypercarb column. Pasch and co-workers32,35,42,43,51,52 also used the Hypercarb HPLC system
and showed that the analysis of the bulk IPC materials does not reveal the peaks corresponding
to minor components like random EPR, segmented EPC and PE homopolymer.
Several authors28,29,31,51,93 have reported that HT-HPLC has superior separation capabilities
over crystallization-based techniques like TREF, CRYSTAF and CEF, since it can also provide
CCD of amorphous polyolefins. Macko and co-workers31,37,110 carried out comparative studies
between HT-HPLC and CRYSTAF for the analysis of blends of EPR and IPC materials. In
their studies they indicated that HT-HPLC can detect minor differences in ethylene contents
and they separated copolymers according to their microstructural properties. The CRYSTAF
technique showed characterisation results similar to HT-HPLC only for IPC materials due to a
high percentage of crystalline components i.e. iPP. They further demonstrated that the extent
of adsorption of iPP in the Hypercarb column increases with increasing molar mass.
Mekap et al.111 used the HT-HPLC system with porous graphite (Hypercarb) as the stationary
phase to determine the critical conditions for PE materials. Four combinations of strong/weak
solvent pairs were identified and their critical mobile phase compositions were successfully
determined at a temperature of 160 °C. Several studies have shown that the HT-HPLC system
can be hyphenated with other techniques like SEC, FT-IR and NMR to enrich the information
obtained on the CCD of different classes of polyolefin materials. Pasch and co-workers35,45,52,71
have done extensive work using a HT-HPLC system coupled to FT-IR spectroscopy through a
LC-transform interface. From their work, FT-IR data have confirmed that IPC and EPR
copolymers can be separated according to the ethylene content of the eluting fractions. The
recent work done by Cheruthazhekatt and Pasch112 on EPR copolymers with high comonomer
contents has proved that the HT-HPLC system can be modified for improved separation in
polyolefin analyses. In their work, they developed a chromatographic method named high
temperature size exclusion-liquid adsorption chromatography (SEC-LAC). The new SEC-LAC
Stellenbosch University https://scholar.sun.ac.za
Page 19
method was coupled to FT-IR to quantify small amounts of iPP homopolymer in EPR
copolymers.
2.3 References
1. C. Kock, M. Gahleitner, A. Schausberger, E. Ingolic. Journal of Applied Polymer Science 2012, 128, 1484-1496.
2. H. Pasch, M. I. Malik, T. Macko. Advances in Polymer Science 2013, 251, 77-140.
3. R. A. García, B. Coto, M. T. Expósito, I. Suarez, A. Fernández-Fernández, S. Caveda. Macromolecular Research 2011, 19, 778-788.
4. M. Sun, D. Gao, H. Zhang, H. Zou, M. Xu, S. Zhang, J. Li, J. Liu. Journal of Applied Polymer Science 2014, 131, 8705-8713.
5. J. K. Lee, J. H. Lee, K. H. Lee, B. S. Jin. Journal of Applied Polymer Science 2001, 81, 695-700.
6. V. Agarwal, T. B. Van Erp, L. Balzano, M. Gahleitner, M. Parkinson, L. E. Govaert, V. Litvinov, A. P. M. Kentgens. Polymer 2014, 55, 896-905.
7. M. Gahleitner, C. Tranninger, P. Doshev. Journal of Applied Polymer Science 2013, 130, 3028-3037.
8. C. Kock, N. Aust, C. Grein, M. Gahleitner. Journal of Applied Polymer Science 2013, 130, 287-296.
9. M. Pires, R. S. Mauler, S. A. Liberman. Journal of Applied Polymer Science 2004, 92, 2155-2162.
10. Y. Shang-Guan, F. Chen, Q. Zheng. Science China Chemistry 2012, 55, 698-712.
11. Y. Yokoyama, T. Ricco. Journal of Applied Polymer Science 1997, 66, 1007-1014.
12. R. Zacur, G. Goizueta, N. Capiati. Polymer Engineering and Science 2000, 40, 1921-1930.
13. R. Zacur, G. Goizueta, N. Capiati. Polymer Engineering and Science 1999, 39, 921-929.
14. Z. S. Petrović, J. Budinski-Simendić, V. Divjaković, Ž. Škrbić. Journal of Applied Polymer Science 1996, 59, 301-310.
15. L. Botha, P. Sinha, S. Joubert, H. Duveskog, A. J. van Reenen. European Polymer Journal 2014, 59, 94-104.
16. L. Botha, A. J. van Reenen. European Polymer Journal 2013, 49, 2202-2213.
17. S. Mncwabe, N. Luruli, E. Marantos, P. Nhlapo, L. Botha. Macromolecular Symposia 2012, 313-314, 33-42.
18. C. Grein, M. Gahleitner, K. Bernreitner. Express Polymer Letters 2012, 6, 688-696.
19. F. M. Mirabella Jr. Polymer 1993, 34, 1729-1735.
20. Z. Q. Fan, Y. Q. Zhang, J. T. Xu, H. T. Wang, L. X. Feng. Polymer 2001, 42, 5559-5566.
21. S. Thanyaprueksanon, S. Thongyai, P. Praserthdam. Journal of Applied Polymer Science 2007, 103, 3609-3616.
22. A. J. van Reenen, N. C. Basson. Express Polymer Letters 2012, 6, 427-436.
Stellenbosch University https://scholar.sun.ac.za
Page 20
23. W. Rungswang, P. Saendee, B. Thitisuk, T. Pathaweeisariyakul, W. Cheevasrirungruang. Journal of Applied Polymer Science 2013, 128, 3131-3140.
24. M. Swart, A. J. van Reenen. Journal of Applied Polymer Science 2015, 132, 41783.
25. N. Manabe, Y. Yokota, H. Nakatani, S. Suzuki, B. Liu, M. Terano. Journal of Applied Polymer Science 2006, 100, 1831-1835.
26. H. Pasch, E. de Goede, P. Mallon. Macromolecular Symposia 2012, 312, 174-190.
27. S. Podzimek. Journal of Applied Polymer Science 2014, 131, 40111.
28. R. Chitta, T. Macko, R. Brüll, C. Boisson, E. Cossoul, O. Boyron. Macromolecular Chemistry and Physics 2015, 216, 721-732.
29. R. Chitta, T. Macko, R. Brüll, G. van Doremaele, L. C. Heinz. Journal of Polymer Science, Part A: Polymer Chemistry 2011, 49, 1840-1846.
30. T. Macko, R. Brüll, R. G. Alamo, F. J. Stadler, S. Losio. Analytical and Bioanalytical Chemistry 2011, 399, 1547-1556.
31. T. Macko, R. Brüll, Y. Wang, B. Coto, I. Suarez. Journal of Applied Polymer Science 2011, 122, 3211-3217.
32. H. Pasch, A. Albrecht, R. Brüll, T. Macko, W. Hiller. Macromolecular Symposia 2009, 282, 71-80.
33. S. Cheruthazhekatt, H. Pasch. Polymer 2014, 55, 5358-5369.
34. S. Cheruthazhekatt, H. Pasch. Analytical and Bioanalytical Chemistry 2014, 406, 2999-3007.
35. S. Cheruthazhekatt, T. F. J. Pijpers, V. B. F. Mathot, H. Pasch. Analytical and Bioanalytical Chemistry 2013, 405, 8995-9007.
36. R. Chitta, A. Ginzburg, T. Macko, R. Brüll, G. van Doremaele. LC-GC Europe 2012, 25, 352-358.
37. T. Macko, A. Ginzburg, K. Remerie, R. Brüll. Macromolecular Chemistry and Physics 2012, 213, 937-944.
38. A. Albrecht, R. Brüll, T. Macko, P. Sinha, H. Pasch. Macromolecular Chemistry and Physics 2008, 209, 1909-1919.
39. E. de Goede, P. E. Mallon, H. Pasch. Macromolecular Materials and Engineering 2012, 297, 26-38.
40. E. de Goede, P. E. Mallon, K. Rode, H. Pasch. Macromolecular Materials and Engineering 2011, 296, 1018-1027.
41. S. de Goede, R. Brüll, H. Pasch, N. Marshall. E-Polymers 2004, 1-9.
42. S. Cheruthazhekatt, T. F. J. Pijpers, G. W. Harding, V. B. F. Mathot, H. Pasch. Macromolecules 2012, 45, 5866-5880.
43. S. Cheruthazhekatt, T. F. J. Pijpers, G. W. Harding, V. B. F. Mathot, H. Pasch. Macromolecules 2012, 45, 2025-2034.
44. E. de Goede, P. Mallon, H. Pasch. Macromolecular Materials and Engineering 2010, 295, 366-373.
45. A. Albrecht, L. C. Heinz, D. Lilge, H. Pasch. Macromolecular Symposia 2007, 257, 46-55.
Stellenbosch University https://scholar.sun.ac.za
Page 21
46. T. Macko, U. Schulze, R. Brüll, A. Albrecht, H. Pasch, T. Fónagy, L. Häussler, B. Iván. Macromolecular Chemistry and Physics 2008, 209, 404-409.
47. C. Piel, A. Albrecht, C. Neubauer, C. W. Klampfl, J. Reussner. Analytical and Bioanalytical Chemistry 2013, 400, 2607-2613.
48. S. Cheruthazhekatt, T. F. J. Pijpers, V. B. F. Mathot, H. Pasch. Macromolecular Symposia 2013, 330, 22-29.
49. Z. Fu, J. Xu, Y. Zhang, Z. Fan. Journal of Applied Polymer Science 2005, 97, 640-647.
50. K. Jeon, Y. L. Chiari, R. G. Alamo. Macromolecules 2008, 41, 95-108.
51. S. Cheruthazhekatt, H. Pasch. Analytical and Bioanalytical Chemistry 2013, 405, 8607-8614.
52. S. Cheruthazhekatt, G. W. Harding, H. Pasch. Journal of Chromatography A 2013, 1286, 69-82.
53. G. Liu, X. Zhang, Y. Liu, X. Li, H. Chen, K. Walton, G. Marchand, D. Wang. Polymer 2013, 54, 1440-1447.
54. Y. Liu, S. Bo, Y. Zhu, W. Zhang. Journal of Applied Polymer Science 2005, 97, 232-239.
55. Y. D. Zhang, C. J. Wu, S. N. Zhu. Polymer Journal 2002, 34, 700-708.
56. J. C. Randall. Macromolecules 1978, 11, 33-36.
57. G. J. Ray, P. E. Johnson, J. R. Knox. Macromolecules 1977, 10, 773-778.
58. A. Tynys, I. Fonseca, M. Parkinson, L. Resconi. Macromolecules 2012, 45, 7704-7710.
59. M. Hehn, K. Maiko, H. Pasch, W. Hiller. Macromolecules 2013, 46, 7678-7686.
60. W. Hiller, P. Sinha, M. Hehn, H. Pasch. Progress in Polymer Science 2014, 39, 979-1016.
61. H. Pasch, L. C. Heinz, T. Macko, W. Hiller. Pure and Applied Chemistry 2008, 80, 1747-1762.
62. E. B. Berda, T. W. Baughman, K. B. Wagener. Journal of Polymer Science, Part A: Polymer Chemistry 2006, 44, 4981-4989.
63. V. B. F. Mathot, M. F. J. Pijpers. Thermochimica Acta 1989, 151, 241-259.
64. V. B. F. Mathot, R. L. Scherrenberg, T. F. J. Pijpers. Polymer 1998, 39, 4541-4559.
65. G. vanden Poel, V. B. F. Mathot. Thermochimica Acta 2007, 461, 107-121.
66. S. Cheruthazhekatt, D. D. Robertson, M. Brand, A. van Reenen, H. Pasch. Analytical Chemistry 2013, 85, 7019-7023.
67. M. H. Ha, B. K. Kim. Polymer Engineering and Science 2004, 44, 1858-1865.
68. X. Y. Lu, J. J. Yi, S. T. Chen, F. H. Zu, R. B. Li. Chinese Journal of Polymer Science 2012, 30, 122-129.
69. C. H. Stephens, B. C. Poon, P. Ansems, S. P. Chum, A. Hiltner, E. Baer. Journal of Applied Polymer Science 2006, 100, 1651-1658.
70. S. Liberman, A. P. De Azeredo, F. P. Dos Santos, M. A. Da Silva, B. Monrabal, N. Mayo. Macromolecular Symposia 2013, 330, 30-41.
71. H. Pasch, R. Brüll, U. Wahner, B. Monrabal. Macromolecular Materials and Engineering 2000, 279, 46-51.
Stellenbosch University https://scholar.sun.ac.za
Page 22
72. L. Lu, H. Fan, B. G. Li, S. Zhu. Industrial and Engineering Chemistry Research 2009, 48, 8349-8355.
73. Y. Xue, Y. Fan, S. Bo, X. Ji. European Polymer Journal 2011, 47, 1646-1653.
74. G. Shen, H. Shen, B. Xie, W. Yang, M. Yang. Journal of Applied Polymer Science 2013, 129, 2103-2111.
75. D. G. Papageorgiou, G. Z. Papageorgiou, D. N. Bikiaris, K. Chrissafis. European Polymer Journal 2013, 49, 1577-1590.
76. L. Wild, R. Ranganath, A. Barlow. Journal of Applied Polymer Science 1977, 21, 3331-3343.
77. L. Wild, T. Ryle. American Chemical Society, Polymer Preprints, Division of Polymer Chemistry 1977, 18, 182-187.
78. B. Monrabal. Advances in Polymer Science 2013, 257, 203-252.
79. B. Monrabal, J. Sancho-Tello, N. Mayo, L. Romero. Macromolecular Symposia 2007, 257, 71-79.
80. J. Nieto, T. Oswald, F. Blanco, J. B. P. Soares, B. Monrabal. Journal of Polymer Science, Part B: Polymer Physics 2001, 39, 1616-1628.
81. B. Monrabal, P. Del Hierro. Analytical and Bioanalytical Chemistry 2011, 399, 1557-1561.
82. N. Aust, M. Gahleitner, K. Reichelt, B. Raninger. Polymer Testing 2006, 25, 896-903.
83. S. Cheruthazhekatt, H. Pasch. Macromolecular Symposia 2014, 337, 51-57.
84. S. Anantawaraskul, J. B. P. Soares, P. M. Wood-Adams, B. Monrabal. Polymer 2003, 44, 2393-2401.
85. B. Monrabal. Macromolecular Symposia 1996, 110, 81-86.
86. B. Monrabal. Journal of Applied Polymer Science 1994, 52, 491-499.
87. B. Monrabal, J. Blanco, J. Nieto, J. B. P. Soares. Journal of Polymer Science, Part A: Polymer Chemistry 1999, 37, 89-93.
88. S. Anantawaraskul, J. B. P. Soares, P. Jirachaithorn, J. Limtrakul. Journal of Polymer Science, Part B: Polymer Physics 2006, 44, 2749-2759.
89. S. Anantawaraskul, J. B. P. Soares, P. M. Wood-Adams. Advances in Polymer Science 2005, 182, 1-54.
90. S. Anantawaraskul, P. Somnukguande, J. B. P. Soares. Macromolecular Symposia 2009, 282, 205-215.
91. J. B. P. Soares. Macromolecular Symposia 2007, 257, 1-12.
92. J. B. P. Soares, S. Anantawaraskul. Journal of Polymer Science, Part B: Polymer Physics 2005, 43, 1557-1570.
93. S. Cheruthazhekatt, N. Mayo, B. Monrabal, H. Pasch. Macromolecular Chemistry and Physics 2013, 214, 2165-2171.
94. H. Pasch. Polymers for Advanced Technologies 2015, 26, 771-784.
95. T. Macko, R. Brüll, R. G. Alamo, Y. Thomann, V. Grumel. Polymer 2009, 50, 5443-5448.
96. T. Macko, F. Cutillo, V. Busico, R. Brüll. Macromolecular Symposia 2010, 298, 182-190.
97. T. Macko, H. Pasch. Macromolecules 2009, 42, 6063-6067.
Stellenbosch University https://scholar.sun.ac.za

Page 23
98. T. Macko, H. Pasch, R. Brüll. Journal of Chromatography A 2006, 1115, 81-87.
99. T. Macko, H. Pasch, Y. Wang. Macromolecular Symposia 2009, 282, 93-100.
100. H. Pasch, B. Trathnigg. HPLC of Polymers; Springer: New York, 1998.
101. A. Roy, M. D. Miller, D. M. Meunier, A. Willem Degroot, W. L. Winniford, F. A. van Damme, R. J. Pell, J. W. Lyons. Macromolecules 2010, 43, 3710-3720.
102. H. Pasch, M. I. Malik. Advanced Separation Techniques for Polyolefins; Springer: New York, 2014.
103. R. Chitta, R. Brüll, T. Macko, V. Monteil, C. Boisson, E. Grau, A. Leblanc. Macromolecular Symposia 2010, 298, 191-199.
104. A. Ginzburg, T. Macko, V. Dolle, R. Brüll. Journal of Chromatography A 2010, 1217, 6867-6874.
105. E. Uliyanchenko, S. van der Wal, P. J. Schoenmakers. Polymer Chemistry 2012, 3, 2313-2335.
106. R. Chitta, A. Ginzburg, G. van Doremaele, T. Macko, R. Brüll. Polymer 2011, 52, 5953-5960.
107. A. Ginzburg, T. Macko, V. Dolle, R. Brüll. European Polymer Journal 2011, 47, 319-329.
108. A. Ginzburg, T. Macko, F. Malz, M. Schroers, I. Troetsch-Schaller, J. Strittmatter, R. Brüll. Journal of Chromatography A 2013, 1285, 40-47.
109. V. Dolle, A. Albrecht, R. Brüll, T. Macko. Macromolecular Chemistry and Physics 2011, 212, 959-970.
110. T. Macko, R. Brüll, Y. Zhu, Y. Wang. Journal of Separation Science 2010, 33, 3446-3454.
111. D. Mekap, T. Macko, R. Brüll, R. Cong, A. W. deGroot, A. Parrott, P. J. C. H. Cools, W. Yau. Polymer 2013, 54, 5518-5524.
112. S. Cheruthazhekatt, H. Pasch. Polymer 2015, 64, 1-7.
Stellenbosch University https://scholar.sun.ac.za
Page 24
Chapter3:ExperimentalWork
3 Experimental Procedures: Analytical Techniques
This chapter discusses and explains the analytical experimental procedures used to separate
and characterize both ethylene-propylene rubbers (EPR) and vis-broken impact polypropylene
copolymers (IPC) materials. Different combinations of the various analytical techniques were
used in each part of the study to obtain comprehensive information on the materials.
3.1 Temperature Rising Elution Fractionation (TREF)
Preparative TREF was carried out using an instrument developed and built in-house.
Approximately 3.0 g of polymer and 2.0 wt% Irganox 1010 (Ciba Specialty Chemicals,
Switzerland) were dissolved in 300 mL of xylene at 130 °C in a glass reactor. The dissolution
time was between 3 – 4 hrs. The reactor was then transferred to a temperature-controlled oil
bath and filled with sand (white quartz, Sigma-Aldrich, South Africa), used as a crystallization
support. The oil bath and support were both preheated to 130 °C. The oil bath was then cooled
to temperature of 20 °C at a controlled rate of 1 °C/h in order to facilitate the controlled
crystallization of the polymer1,2. The crystallized mixture was then packed into a stainless steel
column which was inserted into a modified gas chromatography oven for the elution step.
Xylene (preheated) was used as eluent in order to collect the fractions at predetermined intervals
(30, 60, 90 and 130 °C) as the temperature of the oven was raised. The fractions were isolated
by precipitation in acetone, followed by drying to a constant weight for an overnight period.
3.2 Differential Scanning Calorimetry (DSC)
Melting and crystallization behaviours of the samples were measured on a TA Instruments
Q100 DSC system, calibrated with indium metal according to standard procedures. A sample
mass of ~5.0 mg was used for the analysis. A scanning rate of 10 °C/min was applied across
the temperature range of -70 – 200 °C. .The samples were subjected to three cycles with the
first cycle (first heating) used to erase the thermal history of the samples3. Data obtained during
the second (cooling) and third (heating) cycles were used for all thermal analysis calculations.
Measurements were conducted in a nitrogen atmosphere at a purge gas flow rate of 50 mL/min.
3.3 Crystallization Analysis Fractionation (CRYSTAF)
CRYSTAF experiments were carried out using a commercial CRYSTAF apparatus Model 200
(Polymer Char, Valencia, Spain). For each sample, approximately 20 mg was dissolved in 35
Stellenbosch University https://scholar.sun.ac.za

Page 25
mL of 1,2,4-trichlorobenzene (TCB) at 160 °C. Dissolution was carried out for 120 – 180
minutes depending on the ethylene content of the sample. Dissolution and crystallization was
carried out under agitation in stainless steel reactors, equipped with automatic stirring and
filtration devices. After dissolution, the temperature was decreased from 100 °C to
approximately 30 °C at a rate of 0.1 °C/min. Fractions were taken automatically and the
concentration of the solution was determined by an infrared detector as function of temperature,
using 3.5 μm as the chosen wavelength.
3.4 High Temperature Size Exclusion Chromatography (HT-SEC)
Molar mass measurements for all samples were performed at 150 °C using a PL GPC 220 high
temperature chromatograph (Polymer Laboratories, Church Stretton, UK) equipped with a
differential refractive index (RI) detector. The column set used consisted of three 300×7.5 mm
i.d. PLgel Olexis columns together with a 50×7.5 mm PLgel Olexis guard column (Polymer
Laboratories, Church Stretton, UK). The eluent used was TCB at a flow rate of 1.0 mL/min
with 0.0125 wt% 2,6-ditertbutyl-4-methylphenol (BHT) added as a stabilizer. Samples with
mass of ~2 mg were dissolved at 160 °C in TCB at a concentration of 1 mg/mL for 2 – 3 hr
(depending on the ethylene content of the sample) and 200 μL of each sample was injected.
Narrowly distributed polystyrene standards (Polymer Laboratories, Church Stretton, UK) were
used for calibration.
3.5 High Temperature High Performance Liquid Chromatography (HT-HPLC)
The separations were conducted on a high temperature solvent gradient interaction
chromatograph (SGIC) constructed by Polymer Char (Valencia, Spain), comprising of an
autosampler, two separate ovens, switching valves and two pumps equipped with vacuum
degassers (Agilent, Waldbronn, Germany). One oven was used for the HPLC column, while
the second oven is the location of the injector and a switching valve. The autosampler is a
separate unit connected to the injector through a heated transfer line. A high-pressure binary
gradient pump was used for HPLC in the first dimension.
An evaporative light scattering detector (ELSD, model PL-ELS 1000, Polymer Laboratories,
Church Stretton, England) was used with the following parameters: a gas flow rate of 1.5 L/min,
a nebuliser temperature of 160 °C, and an evaporator temperature of 270 °C. HT-HPLC was
carried out using a Hypercarb column (Hypercarb®, Thermo Scientific, Dreieich, Germany)
with the following parameters: 100×4.6 mm id., packed with porous graphite particles with a
particle diameter of 5μm, a surface area of 120 m2/g, and a pore size of 250 Å. The flow rate of
Stellenbosch University https://scholar.sun.ac.za
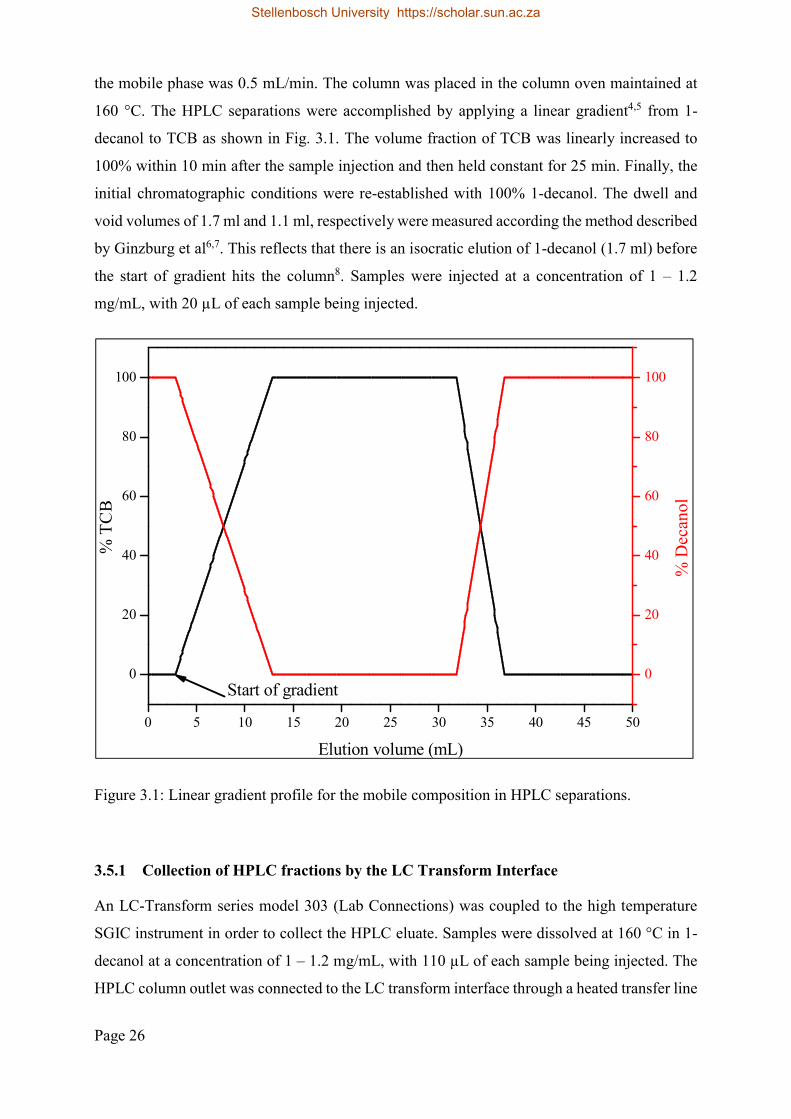
Page 26
the mobile phase was 0.5 mL/min. The column was placed in the column oven maintained at
160 °C. The HPLC separations were accomplished by applying a linear gradient4,5 from 1-
decanol to TCB as shown in Fig. 3.1. The volume fraction of TCB was linearly increased to
100% within 10 min after the sample injection and then held constant for 25 min. Finally, the
initial chromatographic conditions were re-established with 100% 1-decanol. The dwell and
void volumes of 1.7 ml and 1.1 ml, respectively were measured according the method described
by Ginzburg et al6,7. This reflects that there is an isocratic elution of 1-decanol (1.7 ml) before
the start of gradient hits the column8. Samples were injected at a concentration of 1 – 1.2
mg/mL, with 20 µL of each sample being injected.
Figure 3.1: Linear gradient profile for the mobile composition in HPLC separations.
3.5.1 Collection of HPLC fractions by the LC Transform Interface
An LC-Transform series model 303 (Lab Connections) was coupled to the high temperature
SGIC instrument in order to collect the HPLC eluate. Samples were dissolved at 160 °C in 1-
decanol at a concentration of 1 – 1.2 mg/mL, with 110 µL of each sample being injected. The
HPLC column outlet was connected to the LC transform interface through a heated transfer line
0 5 10 15 20 25 30 35 40 45 50
0
20
40
60
80
100
Elution volume (mL)
% T
CB
Start of gradient0
20
40
60
80
100
% D
ecan
ol
Stellenbosch University https://scholar.sun.ac.za
Page 27
set at 160 °C. The fractions were deposited by rotating a Germanium disc (sample target in the
LC-Transform) at a speed of 10 °/min. The disc stage and nozzle temperatures of the LC-
Transform were set to 160 °C. The pressure was set at ~10 atm to obtain uniform deposition of
the sample on the disc.
3.5.2 FTIR analyses of the deposited fractions
FTIR analyses of the deposited HPLC fractions were performed on a Thermo Nicolet iS10
Spectrometer (Thermo Scientific, Waltham, MA), equipped with the LC-Transform FTIR
interface connected to a standard transmission base plate. Spectra were recorded in the
absorbance format at a resolution of 8 cm-1 with 16 scans being recorded for each spectrum.
Thermo Scientific OMNIC software (version 8.1) was used for data collection and processing.
3.6 Fourier Transform Infrared Spectroscopy (FTIR)
FTIR analyses of the samples were performed on a Thermo Nicolet iS10 Spectrometer (Thermo
Scientific, Waltham, MA). Spectra were recorded in the absorbance format at a resolution of 8
cm-1 with 16 scans being recorded for each spectrum. Thermo Scientific OMNIC software
(version 8.1) was used for data collection and processing.
3.7 High Temperature 13C NMR Spectroscopy
13C NMR spectra were measured on a 400-MHz Varian Unity Inova NMR spectrometer, at a
resonance frequency of 150 MHz for carbon. Deuterated 1,1,2,2-tetrachloroethane-d2 (95.5+
atom% D, Sigma-Aldrich) at δ 74.3 ppm as internal reference, was used as a solvent for the
sample preparation (at a concentration of 6 wt%). The dissolution time was between 3 – 4 hr,
depending on the ethylene content of the sample. Analyses were carried out at 120 °C in
nitrogen atmosphere, with an acquisition time of 0.79 s and pre-acquisition delay time of 15 s
with more than 2500 scans. This had led to total analysis time of 6 to 10 hr per sample.
3.8 References
1. S. Cheruthazhekatt, H. Pasch. Macromolecular Symposia 2014, 337, 51-57.
2. M. Swart, A. J. van Reenen. Journal of Applied Polymer Science 2015, 132, 41783.
3. H. Pasch, R. Brüll, U. Wahner, B. Monrabal. Macromolecular Materials and Engineering 2000, 279, 46-51.
Stellenbosch University https://scholar.sun.ac.za
Page 28
4. T. Macko, H. Pasch. Macromolecules 2009, 42, 6063-6067.
5. S. Cheruthazhekatt, H. Pasch. Analytical and Bioanalytical Chemistry 2013, 405, 8607-8614.
6. A. Ginzburg, T. Macko, V. Dolle, R. Brüll. European Polymer Journal 2011, 47, 319-329.
7. A. Ginzburg, T. Macko, F. Malz, M. Schroers, I. Troetsch-Schaller, J. Strittmatter, R. Brüll. Journal of Chromatography A 2013, 1285, 40-47.
8. S. Cheruthazhekatt, G. W. Harding, H. Pasch. Journal of Chromatography A 2013, 1286, 69-82.
Stellenbosch University https://scholar.sun.ac.za
Page 29
Chapter4:MolecularHeterogeneityofEPRCopolymers
4 Molecular Heterogeneity of Ethylene-Propylene Rubbers: New Insights
through Advanced Crystallisation-based and Chromatographic
Techniques
This chapter outlines the work done on the separation and characterization of ethylene-
propylene rubber (EPR) copolymers using advanced fractionation methods. The importance of
the TREF procedure for both isolating and concentrating minor components of the bulk samples
is highlighted in the present work. In general, the combination of the various analytical
techniques proved that EPR copolymers with high ethylene contents have complex molecular
compositions and are not completely amorphous. This work has been published as the following
research article: Phiri, M.J.; Cheruthazhekatt, S.; Dimeska, A.; Pasch, H., Molecular
Heterogeneity of Ethylene-Propylene Rubbers: New Insights through Advanced
Crystallization-based and Chromatographic Techniques. Journal of Polymer Science Part A:
Polymer Chemistry 2015, 53, 863-874.
4.1 Summary of the Research Study
Ethylene-propylene rubber (EPR) forms the most critical phase of impact polypropylene
copolymers (IPC) since it contributes significantly to the impact resistance of the IPC. EPR
copolymers with high ethylene contents have been assumed to be completely amorphous
random copolymers based on their bulk sample analyses using crystallisation-based techniques
such as CRYSTAF1-3. As such, the comprehensive analysis of the microstructure of EPR
copolymers has not been extensively explored in previous work. The main aim of the present
study was to explore advanced fractionation techniques namely SEC, TREF, CRYSTAF, DSC,
HPLC and HPLC-FTIR for the elucidation of the molecular structure of a set of EPR samples.
In the current study, five EPR samples prepared by a Ziegler-Natta catalyst system were
separated and characterised by both crystallisation-based and chromatographic techniques. The
EPR samples had different ethylene contents, which were in the range of 25 – 66 mol % as
determined by 13CNMR spectroscopy.
The CRYSTAF analyses revealed that there is little or no detectable amount of crystallizing
material in the bulk samples in the temperature range between 30 – 100 °C and the samples
could be regarded to be completely amorphous. This observation was made from the remaining
soluble material collected below 30 °C, which indicates the end of the crystallization process.
Stellenbosch University https://scholar.sun.ac.za
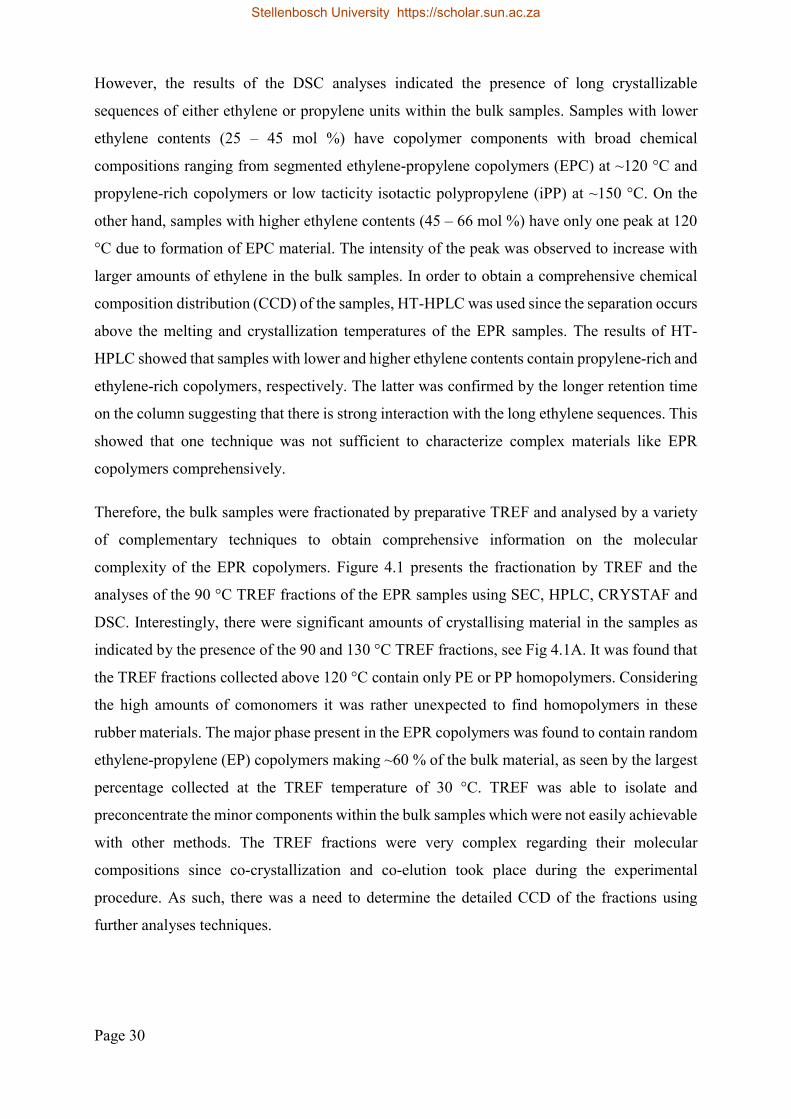
Page 30
However, the results of the DSC analyses indicated the presence of long crystallizable
sequences of either ethylene or propylene units within the bulk samples. Samples with lower
ethylene contents (25 – 45 mol %) have copolymer components with broad chemical
compositions ranging from segmented ethylene-propylene copolymers (EPC) at ~120 °C and
propylene-rich copolymers or low tacticity isotactic polypropylene (iPP) at ~150 °C. On the
other hand, samples with higher ethylene contents (45 – 66 mol %) have only one peak at 120
°C due to formation of EPC material. The intensity of the peak was observed to increase with
larger amounts of ethylene in the bulk samples. In order to obtain a comprehensive chemical
composition distribution (CCD) of the samples, HT-HPLC was used since the separation occurs
above the melting and crystallization temperatures of the EPR samples. The results of HT-
HPLC showed that samples with lower and higher ethylene contents contain propylene-rich and
ethylene-rich copolymers, respectively. The latter was confirmed by the longer retention time
on the column suggesting that there is strong interaction with the long ethylene sequences. This
showed that one technique was not sufficient to characterize complex materials like EPR
copolymers comprehensively.
Therefore, the bulk samples were fractionated by preparative TREF and analysed by a variety
of complementary techniques to obtain comprehensive information on the molecular
complexity of the EPR copolymers. Figure 4.1 presents the fractionation by TREF and the
analyses of the 90 °C TREF fractions of the EPR samples using SEC, HPLC, CRYSTAF and
DSC. Interestingly, there were significant amounts of crystallising material in the samples as
indicated by the presence of the 90 and 130 °C TREF fractions, see Fig 4.1A. It was found that
the TREF fractions collected above 120 °C contain only PE or PP homopolymers. Considering
the high amounts of comonomers it was rather unexpected to find homopolymers in these
rubber materials. The major phase present in the EPR copolymers was found to contain random
ethylene-propylene (EP) copolymers making ~60 % of the bulk material, as seen by the largest
percentage collected at the TREF temperature of 30 °C. TREF was able to isolate and
preconcentrate the minor components within the bulk samples which were not easily achievable
with other methods. The TREF fractions were very complex regarding their molecular
compositions since co-crystallization and co-elution took place during the experimental
procedure. As such, there was a need to determine the detailed CCD of the fractions using
further analyses techniques.
Stellenbosch University https://scholar.sun.ac.za

Page 31
Figure 4.1: prep-TREF fractionation results of EPR copolymers (A) and analyses of the 90 oC TREF fraction using SEC (B), HT-HPLC (C), DSC (D) and CRYSTAF (E).
For all TREF fractions, unimodal molar mass distributions (MMD) were obtained using HT-
SEC. The broadness of the MMD curves was found to decrease with increasing TREF
temperature indicating a lower heterogeneity in the late eluting fractions. The 30 °C TREF
fractions were confirmed by HT-HPLC to contain random EP copolymers and the elution
volumes of the fractions were found to depend on the ethylene contents of their respective bulk
samples. All samples eluted after start of the gradient. However, due to the amorphous nature
of the 30 °C TREF fractions, DSC and CRYSTAF were not able to characterize these fractions.
The mid-elution TREF fractions at 60 °C showed the existence of EP components with large
crystallisable sequences when using the DSC4 with multiple melting and crystallization peaks.
The crystallization temperatures (Tc) for the fractions occurred at ~70 °C which was about a
difference of 30 °C from their melting temperatures (Tm). This difference further proved that
these TREF fractions are composed of random units of propylene and ethylene with different
sequence lengths; they consequently take a long time to crystallize.
The CRYSTAF curves for the 90 °C TREF fractions showed multi-modal distribution
behaviors for the crystallization temperature range between 40 – 80 °C. There were three
distinct peaks that were observed for these TREF fractions. The first set of peaks which
appeared at ~45 °C was attributed to presence of random EPC copolymers. It was assumed to
B A
D E
C
Stellenbosch University https://scholar.sun.ac.za

Page 32
be caused by high amounts of terminal methyl groups from the low molar mass copolymers
that have small contents of propylene units. In a previous study by Nieto et al5., it was found
that terminal methyl groups reduce the overall crystallinity of polymer materials in a similar
manner as short-chain branches from comonomer incorporation. The second set of peaks at ~60
°C was probably due to propylene-rich copolymers. The last set of peaks which appeared at
around 75 °C was due to ethylene-rich EP copolymers and their intensities increased with the
ethylene content of the bulk samples. The 90 °C TREF fractions are the most important fractions
in these EPR samples, since they form the interphase between the amorphous part (EP rubber)
and highly crystalline materials (iPP and PE).
The 130 °C TREF fractions contained both crystalline EPC and iPP homopolymer as
determined by DSC, with two melting peaks at 120 and 160 °C, respectively. However, there
was a single peak for Tc reflecting that there was co-crystallization taking place within the
eluting TREF fractions. The HPLC chromatograms obtained for the 130 °C TREF fractions
showed three distinct set of peaks at different elution volume regions. All the samples showed
the presence of low molar mass iPP which elutes in 100 % 1-decanol before the start of gradient.
The second set of elution peaks appeared immediately after the start of the gradient and they
were due to high molar mass of iPP. The last set of peaks which results from the presence of
PE homopolymer appears at an elution volume of ~ 6.0 mL. The results of HT-HPLC showed
a comprehensive separation and characterization for both amorphous and crystalline TREF
fractions.
In order to obtain additional microstructural information on the separated fractions, HT-HPLC
was coupled to FT-IR spectroscopy using the LC transform interface. The FT-IR data confirmed
that the TREF fractions were separated according to the ethylene content of the eluted samples6.
From HPLC of the 130 °C TREF fractions, the early eluting samples were observed to contain
the low molar mass iPP reflected by the presence of methyl (CH3) stretches with absorption
bands at 2956 and 2871 cm-1. The late eluting component from HPLC showed more intense
peaks for the methylene (CH2) stretches with absorption bands at 2920 and 2850 cm-1.
Moreover, the CH2 split peaks at 720 – 730 cm-1 reflected the presence of crystalline ethylene
sequences from the PE homopolymer. The result proved that material that elutes after the start
of the TCB gradient is composed of ethylene segments which increase with HPLC elution
volume. The overall results illustrate the capability of HT-HPLC coupled to FTIR spectroscopy
to separate and characterize the EPR samples according to the comprehensive microstructure
properties.
Stellenbosch University https://scholar.sun.ac.za
Page 33
From the HPLC results, it was confirmed that the lengths of propylene and ethylene sequences
in the chain influence their interaction with the Hypercarb stationary phase, thus making
ethylene-rich copolymers and PE homopolymer to elute at later elution volumes. In overall, the
combination of preparative TREF and various advanced analytical techniques proved that EPR
copolymers are not completely amorphous through a comprehensive analyses done in the
present study.
4.2 References
1. T. Macko, R. Brüll, Y. Wang, B. Coto, I. Suarez. Journal of Applied Polymer Science 2011, 122, 3211-3217.
2. T. Macko, A. Ginzburg, K. Remerie, R. Brüll. Macromolecular Chemistry and Physics 2012, 213, 937-944.
3. S. Cheruthazhekatt, N. Mayo, B. Monrabal, H. Pasch. Macromolecular Chemistry and Physics 2013, 214, 2165-2171.
4. E. de Goede, P. Mallon, H. Pasch. Macromolecular Materials and Engineering 2010, 295, 366-373.
5. J. Nieto, T. Oswald, F. Blanco, J. B. P. Soares, B. Monrabal. Journal of Polymer Science, Part B: Polymer Physics 2001, 39, 1616-1628.
6. S. Cheruthazhekatt, G. W. Harding, H. Pasch. Journal of Chromatography A 2013, 1286, 69-82.
Stellenbosch University https://scholar.sun.ac.za

Molecular Heterogeneity of Ethylene-Propylene Rubbers:
New Insights Through Advanced Crystallization-Based
and Chromatographic Techniques
Mohau Justice Phiri,1 Sadiqali Cheruthazhekatt,1 Anita Dimeska,2 Harald Pasch1
1Department of Chemistry and Polymer Science, Stellenbosch University, 7602 Matieland, South Africa2Lummus Novolen Technology GmbH, Carl-Bosch_Str. 38, 67056 Ludwigshafen, Germany
Correspondence to: H. Pasch (E-mail: [email protected])
Received 21 October 2014; accepted 8 December 2014; published online 13 January 2015
DOI: 10.1002/pola.27512
ABSTRACT: For a long time ethylene-propylene rubber (EPR)
copolymers with high comonomer contents were believed to
be amorphous materials with a random copolymer composi-
tion. This is not completely correct as has been shown by tem-
perature rising elution fractionation (TREF) combined with
differential scanning calorimetry (DSC), crystallization analysis
fractionation (CRYSTAF), and high temperature–high-
performance liquid chromatography (HT-HPLC). When using
only conventional crystallization-based fractionation methods,
the comprehensive compositional analysis of EPR copolymers
was impossible due to the fact that large fractions of these
copolymers do not crystallize under CRYSTAF conditions. In
the present work, HT-HPLC was used for the separation of the
EPR copolymers according to their ethylene and propylene dis-
tributions along the polymer chains. These investigations
showed the existence of long ethylene sequences in the bulk
samples which was further confirmed by DSC. The results on
the bulk samples prompted us to conduct preparative fractio-
nations of EPR copolymers having varying ethylene contents
using TREF. Surprisingly, significant amounts of crystallizing
materials were obtained that were analyzed using a multistep
protocol. CRYSTAF and DSC analyses of the TREF fractions
revealed the presence of components with large crystallizable
sequences that had not been detected by the bulk samples
analyses. HT-HPLC provided a comprehensive separation and
characterization of both the amorphous and the crystalline
TREF fractions. The TREF fractions eluting at higher tempera-
tures showed the presence of ethylene-rich copolymers and PE
homopolymer. In order to obtain additional structural informa-
tion on the separated fractions, HT-HPLC was coupled to Fou-
rier transform-infrared (FT-IR) spectroscopy. The FT-IR data
confirmed that the TREF fractions were separated according to
the ethylene contents of the eluted samples. Preparative TREF
analysis together with a combination of various analytical
methods proved to be useful tools in understanding the com-
plex molecular composition of these rubber samples. VC 2015
Wiley Periodicals, Inc. J. Polym. Sci., Part A: Polym. Chem.
2015, 53, 863–874
KEYWORDS: differential scanning calorimetry; ethylene-propyl-
ene rubber; fractionation of polymers; FT-IR spectroscopy; high
temperature–high performance liquid chromatography; micro-
structure; polyolefins; preparative temperature rising elution
fractionation
INTRODUCTION Ethylene-propylene rubbers (EPR) arewidely used as the stress concentrators or absorbers thatprevent crack propagation in the continuous matrix of isotac-tic polypropylene (iPP) homopolymer.1 The specific composi-tion of the dispersed rubber particles leads to an improvedinterphase bonding in the matrix of the material.1,2 Otherstudies have suggested that the rubber particles cause adecrease in domain size of the crystalline polymer thusincreasing the overall impact strength.3–5 These improvedmaterials, frequently named “impact polypropylene copoly-mers (IPC)” exhibit enhanced toughness properties in a widetemperature range and they are used in applications such asautomobile parts, appliances and other industrial uses.2,4–7
The EPR copolymers used in this study were prepared usinga Ziegler-Natta catalyst system that is typically used in thedual-reactor IPC process. Due to multiple active sites of thecatalyst, copolymers with very broad molar mass distribu-tion (MMD) and chemical composition distribution (CCD) areproduced. Furthermore, the EPR copolymers have comono-mer (ethylene) contents between 25 and 66%. Studies haveshown that in this percentage range, the samples areregarded to be noncrystallizing and amorphous.6,8,9 It wasalso found that the crystallization temperatures as measuredfrom crystallization fractionation analysis (CRYSTAF) werebelow 35 �C, further suggesting amorphous behavior ofEPR.8 However, due to the high reactivity of ethylene, one
VC 2015 Wiley Periodicals, Inc.
WWW.MATERIALSVIEWS.COM JOURNAL OF POLYMER SCIENCE, PART A: POLYMER CHEMISTRY 2015, 53, 863–874 863
JOURNAL OFPOLYMER SCIENCE WWW.POLYMERCHEMISTRY.ORG ARTICLE
Page 34
Stellenbosch University https://scholar.sun.ac.za

has to consider small quantities of various materials includ-ing highly branched to linear polyethylene homopolymer andethylene-propylene segmented copolymers to be present inEPR.5–7,10–12 Due to this complexity, the investigation of themolecular composition of EPR copolymers is in the focus ofthis study.
The importance of the compositional analysis arises from thefact that MMD and CCD play major roles in the microstruc-ture and phase separation behavior of EPR copolymers. Hightemperature size exclusion chromatography (HT-SEC) hasbeen used extensively for the determination of MMD of theEPR copolymers and other polyolefins.8–11,13–15 In terms ofCCD analysis, there are various analytical techniques thathave been used effectively for characterization of high como-nomer content EPR copolymers.4,6,8–11 Nuclear magnetic res-onance (13C-NMR) and Fourier transform-infrared (FT-IR)spectroscopy have been used for characterization of the EPRcopolymers and average comonomer contents are mostlyestimated by these techniques.2,6,8,16–18 Another approach tochemical composition analysis is the use of differential scan-ning calorimetry (DSC) for analyzing the melting and crystal-lization behaviors of EPR copolymers2,10,13 and theobservation of glass transition temperatures which decreasewith increasing ethylene content.16,18 DSC is a simple andwidely used method, however, the crystallization behavior isstrongly influenced by the thermal history of the sam-ple.15,19–23 Solution crystallization-based techniques, such astemperature rising elution fractionation (TREF)10,24–27 andcrystallization analysis fractionation (CRYSTAF),15,28–31 havebeen utilized to analyze CCD of EPR copolymers with highethylene contents. It has been indicated by both techniquesthat these copolymers are completely amorphous or containonly very small amounts of crystallizing material. As a resultEPRs with high comonomer contents cannot be fully sepa-rated and characterized through these techniques. The mainlimitation of these techniques is the fact that they can frac-tionate and analyze only the crystallizable part of thematerial.6,32,33
A comprehensive solvent-gradient chromatographic techniquewhich permits separation and characterization to occur abovethe melting and crystallization temperatures of polyolefins hasbeen used to avoid the problems of co-crystallization effectsthat take place in DSC, TREF, and CRYSTAF.6,11,34–37 Therecently developed high temperature–high performance liquidchromatography (HT-HPLC) allows the analysis of both theamorphous and the crystalline fractions since the separationdepends on the interaction or adsorption of the macromole-cules with the stationary phase.14,27,38–44 For EPR copolymersit had been reported that on a graphitic stationary phase theseparation depends mainly on the ethylene content of the sam-ple.11,26,35,40–42 The HPLC chromatograms of EPR copolymerswith high ethylene contents had shown multimodal elutionprofiles that indicate the complexity of these samples.8 Thusthe need to find a comprehensive method to fully characterizethe EPR copolymers is of great importance in both academiaand industry.
In this study we demonstrate the capabilities of the combi-nation of DSC, CRYSTAF, and HT-HPLC with FT-IR spectros-copy for the separation and characterization of EPRcopolymers produced by a Ziegler-Natta catalyst system. Forthe first time it will be shown that the combination of prepa-rative TREF and a range of advanced analytical techniquescan provide detailed information on EPR copolymers withhigh comonomer contents in terms of thermal, crystalliza-tion, and microstructural properties.
EXPERIMENTAL
MaterialsXylene (>99% purity) and 1-decanol (>99% purity) werepurchased from Chemical & Laboratory suppliers andAldrich, respectively, and used as received. HPLC grade 1,2,4-trichlorobenzene (TCB) was purchased from Sigma Aldrichand filtered through a 0.2 mm membrane filter before use.Five model ethylene-propylene rubber (EPR) samples wereobtained from Lummus Novolen Technology GmbH (Ger-many) and they were designated as EPR-1, EPR-2, EPR-3,EPR-4, and EPR-5. These EPR samples were prepared in alab scale polymerization reactor using a Ziegler-Natta cata-lyst system. The gas phase copolymerizations were carriedout for 60 min at a temperature of 60 �C and a pressure of13.8 bar. Their bulk ethylene contents and molar masses aregiven in Table 1.
Temperature Rising Elution FractionationPreparative TREF was carried out using an instrument devel-oped and built in-house. Approximately 3.0 g of polymer and2.0 wt % Irganox 1010 (Ciba Specialty Chemicals, Switzer-land) were dissolved in 300 mL of xylene at 130 �C in aglass reactor. The reactor was then transferred to atemperature-controlled oil bath and filled with sand (whitequartz, Sigma-Aldrich, South Africa), used as a crystallizationsupport. The oil bath and support were both preheated to130 �C. The oil bath was then cooled at a controlled rate of1 �C/h in order to facilitate the controlled crystallization ofthe polymer. The crystallized mixture was then packed into astainless steel column which was inserted into a modifiedgas chromatography oven for the elution step. Xylene (pre-heated) was used as eluent in order to collect the fractions
TABLE 1 Details on the Composition of the Bulk EPR Samples
Sample ID
Ethylene
Content
(C2) by
NMR (wt %)
Mwa by
SEC
(kg/mol) Mw/Mn
EPR 1 25.6 851 8.6
EPR 2 37.7 497 16.3
EPR 3 45.2 1946 24.4
EPR 4 57.7 857 13.2
EPR 5 65.9 1001 13.5
a Molar masses are polystyrene equivalents.
ARTICLE WWW.POLYMERCHEMISTRY.ORGJOURNAL OF
POLYMER SCIENCE
864 JOURNAL OF POLYMER SCIENCE, PART A: POLYMER CHEMISTRY 2015, 53, 863–874
Page 35
Stellenbosch University https://scholar.sun.ac.za
at predetermined intervals as the temperature of the ovenwas raised. The fractions were isolated by precipitation inacetone, followed by drying to a constant weight. The TREFfractionations were repeated once a good reproducibilitywas obtained.
Differential Scanning CalorimetryMelting and crystallization behaviors of the samples weremeasured on a TA Instruments Q100 DSC system, calibratedwith indium metal according to standard procedures. A scan-ning rate of 10 �C/min was applied across the temperaturerange of 0 to 200 �C. Data obtained during the second heat-ing cycle were used for all thermal analysis calculations.Measurements were conducted in a nitrogen atmosphere ata purge gas flow rate of 50 mL/min.
Crystallization Analysis FractionationCRYSTAF experiments were carried out using a commercialCRYSTAF apparatus Model 200 (Polymer Char, Valencia,Spain). For each sample, approximately 20 mg was dissolvedin 35 mL of 1,2,4-trichlorobenzene (TCB). Crystallization wascarried out under agitation in stainless steel reactors,equipped with automatic stirring and filtration devices. Afterdissolution, the temperature was decreased from 100 �C toapproximately 30 �C at a rate of 0.1 �C/min. Fractions weretaken automatically and the concentration of the solutionwas determined by an infrared detector, using 3.5 lm as thechosen wavelength.
High Temperature Size Exclusion ChromatographyMolar mass measurements for all samples were performedat 150 �C using a PL GPC 220 high temperature chro-matograph (Polymer Laboratories, Church Stretton, UK)equipped with a differential refractive index (RI) detector.The column set used consisted of three 300 3 7.5 mm i.d.PLgel Olexis columns together with a 50 3 7.5 mm PLgelOlexis guard column (Polymer Laboratories, Church Stret-ton, UK). The eluent used was TCB at a flow rate of1.0 mL/min with 0.0125 wt % 2,6-ditertbutyl-4-methylphe-nol (BHT) added as a stabilizer. Samples were dissolved at160 �C in TCB at a concentration of 1 mg/mL for 1 to 2 h(depending on the sample type) and 200 lL of each samplewas injected. Narrowly distributed polystyrene standards(Polymer Laboratories, Church Stretton, UK) were used forcalibration. The accuracy of the molar mass determinationswas 65%.
Chromatographic SystemAll chromatographic experiments were performed using anew chromatographic system for high-temperature two-dimensional liquid chromatography constructed by PolymerChar (Valencia, Spain), comprising of an autosampler, twoseparate ovens, switching valves, and two pumps equippedwith vacuum degassers (Agilent, Waldbronn, Germany). Oneoven was used for the HPLC column, while the second ovenis the location of the injector and a switching valve. Theautosampler is a separate unit connected to the injectorthrough a heated transfer line. A high-pressure binary gradi-ent pump was used for HPLC in the first dimension.
High Temperature HPLCThe separations were conducted on a high temperature sol-vent gradient interaction chromatograph (SGIC) constructedby Polymer Char (Valencia, Spain). An evaporative light scat-tering detector (ELSD, model PL-ELS 1000, Polymer Labora-tories, Church Stretton, England) was used with thefollowing parameters: A gas flow rate of 1.5 L/min, a nebu-liser temperature of 160 �C, and an evaporator temperatureof 270 �C. HT-HPLC was carried out using a Hypercarb col-umn (HypercarbVR , Thermo Scientific, Dreieich, Germany)with the following parameters: 100 3 4.6 mm id., packedwith porous graphite particles with a particle diameter of 5lm, a surface area of 120 m2/g, and a pore size of 250 Å.The flow rate of the mobile phase was 0.5 mL/min. The col-umn was placed in the column oven maintained at 160 �C.The HPLC separations were accomplished by applying a lin-ear gradient from 1-decanol to TCB. The volume fraction ofTCB was linearly increased to 100% within 10 min after thesample injection and then held constant for 25 min. Finally,the initial chromatographic conditions were re-establishedwith 100% 1-decanol. Samples were injected at a concentra-tion of 1 to 1.2 mg/mL, with 20 lL of each sample beinginjected.
Collection of HPLC Fractions by the LC TransformInterfaceAn LC-Transform series model 303 (Lab Connections) wascoupled to the SGIC instrument in order to collect the HPLCeluate. Samples were dissolved at 160 �C in 1-decanol at aconcentration of 1 to 1.2 mg/mL, with 110 lL of each sam-ple being injected. The HPLC column outlet was connectedto the LC transform interface through a heated transfer lineset at 160 �C. The fractions were deposited by rotating aGermanium disc (sample target in the LC-Transform) at aspeed of 10�/min. The disc stage and nozzle temperatures ofthe LC-Transform were set to 160 �C.
FT-IR Analyses of the Deposited FractionsFT-IR analyses of the deposited HPLC fractions were per-formed on a Thermo Nicolet iS10 Spectrometer (Thermo Sci-entific, Waltham, MA), equipped with the LC-Transform FT-IRinterface connected to a standard transmission base plate.Spectra were recorded at a resolution of 8 cm21 with 16scans being recorded for each spectrum. Thermo ScientificOMNIC software (version 8.1) was used for data collectionand processing.
RESULTS AND DISCUSSION
The molecular compositions of the EPR copolymers werestudied using different analytical techniques as will be pre-sented here. Firstly, CRYSTAF was used to study the crystalli-zation behavior of the samples in solution, employing TCB asthe solvent. Secondly, in order to examine the crystallizationand melting characteristics of these EPR, standard DSC wasutilized. These techniques were used to find out if the sam-ples were amorphous rubbers. Lastly, the chemical composi-tion distributions of the samples were studied usingadsorption chromatography which operates above any
JOURNAL OFPOLYMER SCIENCE WWW.POLYMERCHEMISTRY.ORG ARTICLE
WWW.MATERIALSVIEWS.COM JOURNAL OF POLYMER SCIENCE, PART A: POLYMER CHEMISTRY 2015, 53, 863–874 865
Page 36
Stellenbosch University https://scholar.sun.ac.za
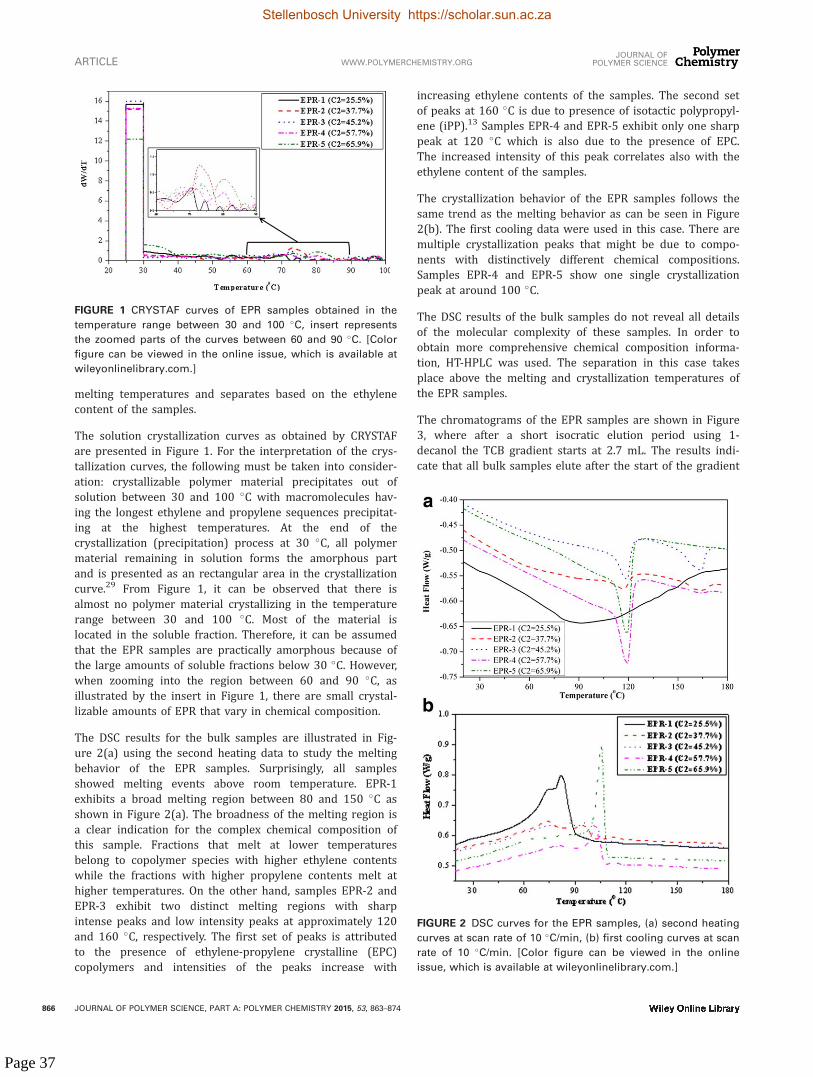
melting temperatures and separates based on the ethylenecontent of the samples.
The solution crystallization curves as obtained by CRYSTAFare presented in Figure 1. For the interpretation of the crys-tallization curves, the following must be taken into consider-ation: crystallizable polymer material precipitates out ofsolution between 30 and 100 �C with macromolecules hav-ing the longest ethylene and propylene sequences precipitat-ing at the highest temperatures. At the end of thecrystallization (precipitation) process at 30 �C, all polymermaterial remaining in solution forms the amorphous partand is presented as an rectangular area in the crystallizationcurve.29 From Figure 1, it can be observed that there isalmost no polymer material crystallizing in the temperaturerange between 30 and 100 �C. Most of the material islocated in the soluble fraction. Therefore, it can be assumedthat the EPR samples are practically amorphous because ofthe large amounts of soluble fractions below 30 �C. However,when zooming into the region between 60 and 90 �C, asillustrated by the insert in Figure 1, there are small crystal-lizable amounts of EPR that vary in chemical composition.
The DSC results for the bulk samples are illustrated in Fig-ure 2(a) using the second heating data to study the meltingbehavior of the EPR samples. Surprisingly, all samplesshowed melting events above room temperature. EPR-1exhibits a broad melting region between 80 and 150 �C asshown in Figure 2(a). The broadness of the melting region isa clear indication for the complex chemical composition ofthis sample. Fractions that melt at lower temperaturesbelong to copolymer species with higher ethylene contentswhile the fractions with higher propylene contents melt athigher temperatures. On the other hand, samples EPR-2 andEPR-3 exhibit two distinct melting regions with sharpintense peaks and low intensity peaks at approximately 120and 160 �C, respectively. The first set of peaks is attributedto the presence of ethylene-propylene crystalline (EPC)copolymers and intensities of the peaks increase with
increasing ethylene contents of the samples. The second setof peaks at 160 �C is due to presence of isotactic polypropyl-ene (iPP).13 Samples EPR-4 and EPR-5 exhibit only one sharppeak at 120 �C which is also due to the presence of EPC.The increased intensity of this peak correlates also with theethylene content of the samples.
The crystallization behavior of the EPR samples follows thesame trend as the melting behavior as can be seen in Figure2(b). The first cooling data were used in this case. There aremultiple crystallization peaks that might be due to compo-nents with distinctively different chemical compositions.Samples EPR-4 and EPR-5 show one single crystallizationpeak at around 100 �C.
The DSC results of the bulk samples do not reveal all detailsof the molecular complexity of these samples. In order toobtain more comprehensive chemical composition informa-tion, HT-HPLC was used. The separation in this case takesplace above the melting and crystallization temperatures ofthe EPR samples.
The chromatograms of the EPR samples are shown in Figure3, where after a short isocratic elution period using 1-decanol the TCB gradient starts at 2.7 mL. The results indi-cate that all bulk samples elute after the start of the gradient
FIGURE 1 CRYSTAF curves of EPR samples obtained in the
temperature range between 30 and 100 �C, insert represents
the zoomed parts of the curves between 60 and 90 �C. [Color
figure can be viewed in the online issue, which is available at
wileyonlinelibrary.com.]
FIGURE 2 DSC curves for the EPR samples, (a) second heating
curves at scan rate of 10 �C/min, (b) first cooling curves at scan
rate of 10 �C/min. [Color figure can be viewed in the online
issue, which is available at wileyonlinelibrary.com.]
ARTICLE WWW.POLYMERCHEMISTRY.ORGJOURNAL OF
POLYMER SCIENCE
866 JOURNAL OF POLYMER SCIENCE, PART A: POLYMER CHEMISTRY 2015, 53, 863–874
Page 37
Stellenbosch University https://scholar.sun.ac.za

elution and there is no noticeable material that elutes in100% 1-decanol. This indicates clearly, that the samples donot contain any low molar mass amorphous PP. EPR-1 andEPR-2 having lower C2 contents are assumed to consistmainly of propylene-rich material. This is confirmed by theappearance of sharp elution peaks between elution volumesof 3 and 4 mL. EPR-2 shows a small peak at an elution vol-ume of about 5 mL which indicates components with higherethylene contents. Sample EPR-3 shows the presence of highmolar iPP as indicated by the small peak eluting at the startof the gradient. Moreover, there is also evidence of the exis-tence of longer ethylene sequences in samples EPR-3 toEPR-5 at higher elution volumes. The present elution behav-ior is characteristic for EP copolymers with complex ethyleneand propylene unit distributions.11 Samples EPR-4 and EPR-5 are most strongly retained on the column as seen from theelution volumes at 4 to 7 mL. The chromatograms of thesebulk samples do not reveal the presence of PE homopolymer.It can be assumed, however, that the small fraction elutingclose to 6 mL is due to PE or copolymer fractions with veryhigh ethylene contents.
The inconclusive results that were obtained on the bulk sam-ples prompted a preparative TREF to be carried out so thatamorphous and crystalline components can be analyzedseparately.
Figure 4 shows preparative TREF results of the five EPRbulk samples, representing the weight percentage of eachfraction as function of elution temperature. There are quanti-fiable amounts for all the TREF fractions collected at differ-ent temperatures that can be subjected to furtherinvestigations. The TREF results prove that the bulk samplesare not completely amorphous as has been suggested by theCRYSTAF analyses. According to the TREF results, the sam-ples contain only 55 to 65 wt % of true amorphous material,see TREF fractions at 30 �C. The fractions that are eluting athigher temperatures did crystallize in the first TREF stepand are, therefore, not amorphous. The fact that these crys-tallizable fractions have not been seen in CRYSTAF has two
reasons: (1) in TREF xylene is used as the solvent while inCRYSTAF TCB is used and (2) co-crystallization effects mani-fest themselves differently in TREF and CRYSTAF. As hasbeen shown in previous investigations, TREF does not frac-tionate purely based on chemical composition.13,44 Co-crystallization takes place and the resulting TREF fractionsare still very complex regarding their molecular structures.Still, due to the simple experimental setup and the fact thatpreparative fractionations can be conducted easily, TREF isthe preferred first step in the analysis of complex polyolefinssuch as the present EPRs. Another advantage of TREF is thatminor components can be isolated and preconcentratedwhich is not easily possible by other methods.
After the TREF experiments, there is the need to determinethe detailed compositional and microstructural characteris-tics of the collected fractions. Thus, further analyses usingvarious analytical techniques are done and discussed in thefollowing sections. As a first step, the molar masses of allfractions were determined by HT-SEC, Figure 5 presentingthe corresponding molar mass distributions.
As can be seen in Figure 5 and Table 2, there are no major dif-ferences between the samples in terms of molar masses. Allfractions exhibit unimodal MMDs; the molar mass dispersitiesvary between 5 and 18. There is no clear trend or correlationbetween molar mass and TREF elution temperature. As themolar masses are quite high it can be assumed that the molarmass has only a minor influence on the TREF elution behavior.
In order to prove that the TREF fractions exhibit different crys-tallizabilities, they were subjected to CRYSTAF investigations.As can be seen in Figure 6, CRYSTAF confirms the assumptionthat the 30 �C TREF fractions are completely amorphous. Incontrast to the analysis of the bulk samples (see Fig. 1), themeasurement of the TREF fractions shows that the samplescontain significant amounts of highly crystalline materials as issignified by the 130 �C TREF fractions that are crystallizingbetween 70 and 85 �C. These TREF fractions can be assigned toPE and/or PP homopolymers as well as copolymers with veryhigh comonomer (ethylene or propylene) contents.
FIGURE 3 HT-HPLC chromatograms obtained after isocratic
and gradient elution (1-decanol to TCB) for the EPR bulk sam-
ples. [Color figure can be viewed in the online issue, which is
available at wileyonlinelibrary.com.]
FIGURE 4 TREF results for five EPR bulk samples, indicating
the overall weight percentages as a function of elution temper-
ature. [Color figure can be viewed in the online issue, which is
available at wileyonlinelibrary.com.]
JOURNAL OFPOLYMER SCIENCE WWW.POLYMERCHEMISTRY.ORG ARTICLE
WWW.MATERIALSVIEWS.COM JOURNAL OF POLYMER SCIENCE, PART A: POLYMER CHEMISTRY 2015, 53, 863–874 867
Page 38
Stellenbosch University https://scholar.sun.ac.za
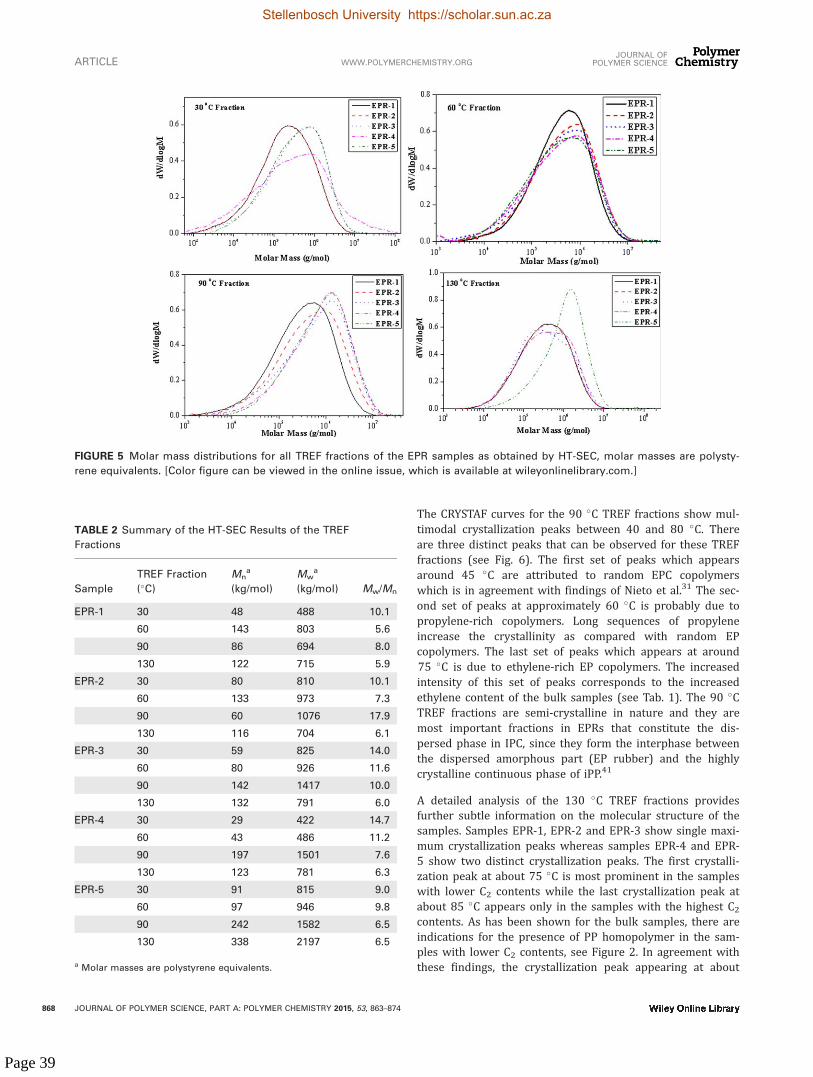
The CRYSTAF curves for the 90 �C TREF fractions show mul-timodal crystallization peaks between 40 and 80 �C. Thereare three distinct peaks that can be observed for these TREFfractions (see Fig. 6). The first set of peaks which appearsaround 45 �C are attributed to random EPC copolymerswhich is in agreement with findings of Nieto et al.31 The sec-ond set of peaks at approximately 60 �C is probably due topropylene-rich copolymers. Long sequences of propyleneincrease the crystallinity as compared with random EPcopolymers. The last set of peaks which appears at around75 �C is due to ethylene-rich EP copolymers. The increasedintensity of this set of peaks corresponds to the increasedethylene content of the bulk samples (see Tab. 1). The 90 �CTREF fractions are semi-crystalline in nature and they aremost important fractions in EPRs that constitute the dis-persed phase in IPC, since they form the interphase betweenthe dispersed amorphous part (EP rubber) and the highlycrystalline continuous phase of iPP.41
A detailed analysis of the 130 �C TREF fractions providesfurther subtle information on the molecular structure of thesamples. Samples EPR-1, EPR-2 and EPR-3 show single maxi-mum crystallization peaks whereas samples EPR-4 and EPR-5 show two distinct crystallization peaks. The first crystalli-zation peak at about 75 �C is most prominent in the sampleswith lower C2 contents while the last crystallization peak atabout 85 �C appears only in the samples with the highest C2contents. As has been shown for the bulk samples, there areindications for the presence of PP homopolymer in the sam-ples with lower C2 contents, see Figure 2. In agreement withthese findings, the crystallization peak appearing at about
FIGURE 5 Molar mass distributions for all TREF fractions of the EPR samples as obtained by HT-SEC, molar masses are polysty-
rene equivalents. [Color figure can be viewed in the online issue, which is available at wileyonlinelibrary.com.]
TABLE 2 Summary of the HT-SEC Results of the TREF
Fractions
Sample
TREF Fraction
(�C)
Mna
(kg/mol)
Mwa
(kg/mol) Mw/Mn
EPR-1 30 48 488 10.1
60 143 803 5.6
90 86 694 8.0
130 122 715 5.9
EPR-2 30 80 810 10.1
60 133 973 7.3
90 60 1076 17.9
130 116 704 6.1
EPR-3 30 59 825 14.0
60 80 926 11.6
90 142 1417 10.0
130 132 791 6.0
EPR-4 30 29 422 14.7
60 43 486 11.2
90 197 1501 7.6
130 123 781 6.3
EPR-5 30 91 815 9.0
60 97 946 9.8
90 242 1582 6.5
130 338 2197 6.5
a Molar masses are polystyrene equivalents.
ARTICLE WWW.POLYMERCHEMISTRY.ORGJOURNAL OF
POLYMER SCIENCE
868 JOURNAL OF POLYMER SCIENCE, PART A: POLYMER CHEMISTRY 2015, 53, 863–874
Page 39
Stellenbosch University https://scholar.sun.ac.za

75 �C is assigned to PP. PE homopolymer could not bedirectly identified from the DSC curves of the bulk samples.However, the crystallization temperature of PE in CRYSTAF isbetween 80 and 85 �C and, therefore, the last crystallizationpeak at about 85 �C is tentatively assigned to PE. Thisassignment is in agreement with the HPLC results for thebulk samples where a small late eluting peak for PE is foundfor sample EPR-5, see Figure 3. The bimodal peak patternfor sample EPR-4 indicates the presence of both PP and EPin the 130 �C TREF fraction.
Further complementary information on the composition ofthe TREF fractions is obtained by DSC. The DSC melting andcrystallization curves of all TREF fractions with scan rates of10 �C/min are displayed in Figure 7. There are no meltingor crystallization peaks that can be observed for the 30 �CTREF fractions. This behavior was expected, since these frac-tions did neither crystallize nor melt in the TREF fractiona-tion and the CRYSTAF analysis. Therefore, the DSC resultsconfirm that the 30 �C TREF fractions contain entirely amor-phous random ethylene-propylene copolymer molecules.
The 60 �C TREF fractions exhibit multiple melting and crystal-lization peaks that indicate complex copolymer compositions.These correspond to segmented copolymer structures thathave longer propylene sequences (e.g. sample EPR-1) or longerethylene sequences (e.g. EPR-5). The “PP-like” nature of the 60�C TREF fraction of EPR-1 is indicated by transition tempera-tures of Tm �100 �C and Tc �60 �C, while the ‘PE-like” natureof the 60 �C TREF fraction of EPR-5 is indicated by transitiontemperatures of Tm �90 �C and Tc �75 �C.44 This behavior iseven more pronounced in the 90 �C TREF fractions as can beseen from the corresponding melting curves.
The DSC results for the 130 �C TREF fractions provide a sig-nificantly more conclusive idea on the molecular compositionas compared with the CRYSTAF findings. All fractions exhibittwo distinct melt endotherms, one at about 125 �C and theother one between 150 and 165 �C. In excellent agreementwith the all previous analyses these can be assigned to PEand PP homopolymers, respectively. As would one expect,the PE peak is most prominent in the samples that have thehighest C2 contents, i.e. samples EPR-4 and EPR-5. It has tobe pointed out, however, that even these samples seem tocontain small amounts of PP homopolymer which is indi-cated by small melting peaks around 160 �C. In contrast, thesamples with the lowest C2 contents, i.e. samples EPR-1 andEPR-2, show the most intense peaks for PP. Unexpectedly,even these samples seem to contain some PE homopolymeras is indicated by the peak at 125 �C.
The analytical methods that have been used so far are basedon the observation of melting or crystallization events. Ashas been shown for the bulk samples, HT-HPLC provides dis-tinctively different structural information since separation inthis case is entirely based on differences in chemical compo-sition. The separations are conducted at temperatures abovethe melting or crystallization points and, hence, sample crys-tallinity does not influence the method.
The HT-HPLC chromatograms for all TREF fractions areshown in Figure 8.
The chromatograms obtained for the 130 �C TREF fractionsprovide very clear confirmation of the CRYSTAF and DSCfindings. Three distinct sets of peaks at different elution vol-umes can be identified. All fractions show the presence of
FIGURE 6 CRYSTAF curves for the TREF fractions of the EPR samples obtained at crystallization temperatures between 30 and 100�C. [Color figure can be viewed in the online issue, which is available at wileyonlinelibrary.com.]
JOURNAL OFPOLYMER SCIENCE WWW.POLYMERCHEMISTRY.ORG ARTICLE
WWW.MATERIALSVIEWS.COM JOURNAL OF POLYMER SCIENCE, PART A: POLYMER CHEMISTRY 2015, 53, 863–874 869
Page 40
Stellenbosch University https://scholar.sun.ac.za

low molar mass iPP which elutes in 100% 1-decanol beforethe start of the solvent gradient. The second set of elutionpeaks appears immediately after the start of the gradientand can be assigned to high molar mass iPP. The relativeintensity of these peaks decreases with increasing C2 con-tents of the bulk samples. This peak is practically notobserved for sample EPR-5 having the highest C2 content.
The latest eluting peaks which are due to PE homopolymerappear at elution volumes of around 5.8 mL.38,41 Thesepeaks are only obtained for samples EPR-4 and EPR-5 andthe peak intensity increases with increasing C2 contents ofthe bulk samples. In contrast to the CRYSTAF results of the130 �C TREF fractions, HT-HPLC allows for the effective andbaseline separation of iPP and PE irrespective of crystallinity.
FIGURE 7 Second heating (a) and first cooling curves (b) for all TREF fractions of the EPR samples as obtained from DSC at a
scan rate of 10 �C/min. [Color figure can be viewed in the online issue, which is available at wileyonlinelibrary.com.]
ARTICLE WWW.POLYMERCHEMISTRY.ORGJOURNAL OF
POLYMER SCIENCE
870 JOURNAL OF POLYMER SCIENCE, PART A: POLYMER CHEMISTRY 2015, 53, 863–874
Page 41
Stellenbosch University https://scholar.sun.ac.za

The HT-HPLC chromatograms of the 30 �C TREF fractionsshow that all components elute after the start of the solventgradient confirming that material is retained on the station-ary phase. Very small elution peaks at about 1.4 mL indicatethat the fractions might contain minute amounts of lowmolar mass (amorphous) PP. The elution volumes for allfractions are between 3 and 5 mL and show multimodal elu-tion patterns indicating their complex chemical composition.As has been suggested by the CRYSTAF and DSC investiga-tions, the components are amorphous random EP copoly-mers with different ethylene contents. As has been foundpreviously, separation occurs according to increasing ethyl-ene contents in the copolymers.6,11,14 This is confirmed bythe present investigations. The 30 �C TREF fraction of sam-ple EPR-1 having the lowest C2 content elutes mainlybetween 3 and 4 mL which is due to the fact that this frac-tion contains mainly propylene-rich macromolecules. In con-trast, the 30 �C TREF fraction of sample EPR-5 having thehighest C2 content elutes mainly between 4 and 5 mL. Thisis clear proof for the assumption that this fraction containsmainly ethylene-rich macromolecules.
The 60 �C and 90 �C TREF fractions apparently contain sig-nificant amounts of co-crystallizing (high molar mass, lowcrystallinity) PP or propylene-rich copolymer fractions elut-ing close to 3 mL in addition to copolymer fractions thatelute later. The amount of the early eluting fractions corre-lates with the C2 contents of the samples meaning that thesecomponents appear mainly in samples EPR-1 and EPR-2 butare not seen in samples EPR-4 and EPR-5. The amounts oflate eluting (segmented) EP copolymer fractions increasewith increasing C2 contents from EPR-1 to EPR-5.
The preceding results provided only qualitative informationon the composition of the TREF fractions. Quantitative infor-mation on the defined compositional distribution within theindividual components of the separated fractions is not pro-vided by the currently used evaporative light scatteringdetector since this detector only monitors the relative con-centration of the eluting species. For a strict quantification itwould be necessary to calibrate the ELSD specifically for PEand PP and estimate the detector response for the copoly-mer fractions.
For a more quantitative estimate, HT-HPLC was coupled withFT-IR spectroscopy as an effective and affordable method todetermine the exact chemical composition of the separatedfractions from HPLC. The procedure for the exact composi-tional analysis (distribution of ethylene and propylene) wasaccomplished as explained in our previous work.34,41,44 Theresults of the HT-HPLC-FT-IR analysis for a number ofselected TREF fractions are shown in Figures 9 and 10.
There is small shift in HPLC elution volume axis for theGram-Schmidt (GS) concentration profile as compared withthe ELSD profile which is caused by a larger volume of thetransfer capillary used to connect the LC transform interfaceto the HT-HPLC instrument. The start of the solvent gradientcorresponds to about 3.5 mL. For the 30 �C TREF fraction ofEPR-3, see Figure 9(a), a decrease in the propylene contentacross the GS concentration profile is observed whereasthere is an increase of the ethylene content towards lateeluting fractions. This is also observed for the 60 and 90 �CTREF fractions but not for the 130 �C TREF fraction whichonly consists of PP. The TREF fraction of EPR-5 collected at
FIGURE 8 HT-HPLC chromatograms for the TREF fractions of the EPR samples, solvent gradient elution (1-decanol to TCB) after
an initial isocratic step. [Color figure can be viewed in the online issue, which is available at wileyonlinelibrary.com.]
JOURNAL OFPOLYMER SCIENCE WWW.POLYMERCHEMISTRY.ORG ARTICLE
WWW.MATERIALSVIEWS.COM JOURNAL OF POLYMER SCIENCE, PART A: POLYMER CHEMISTRY 2015, 53, 863–874 871
Page 42
Stellenbosch University https://scholar.sun.ac.za
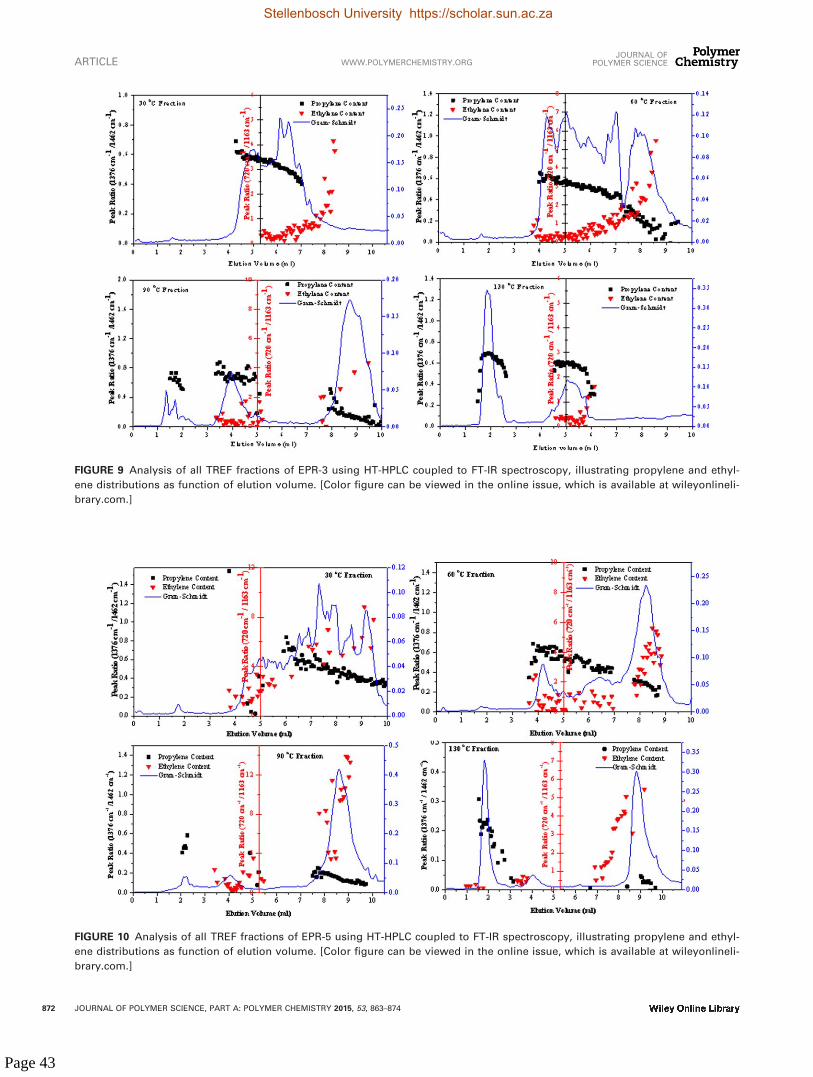
FIGURE 9 Analysis of all TREF fractions of EPR-3 using HT-HPLC coupled to FT-IR spectroscopy, illustrating propylene and ethyl-
ene distributions as function of elution volume. [Color figure can be viewed in the online issue, which is available at wileyonlineli-
brary.com.]
FIGURE 10 Analysis of all TREF fractions of EPR-5 using HT-HPLC coupled to FT-IR spectroscopy, illustrating propylene and ethyl-
ene distributions as function of elution volume. [Color figure can be viewed in the online issue, which is available at wileyonlineli-
brary.com.]
ARTICLE WWW.POLYMERCHEMISTRY.ORGJOURNAL OF
POLYMER SCIENCE
872 JOURNAL OF POLYMER SCIENCE, PART A: POLYMER CHEMISTRY 2015, 53, 863–874
Page 43
Stellenbosch University https://scholar.sun.ac.za
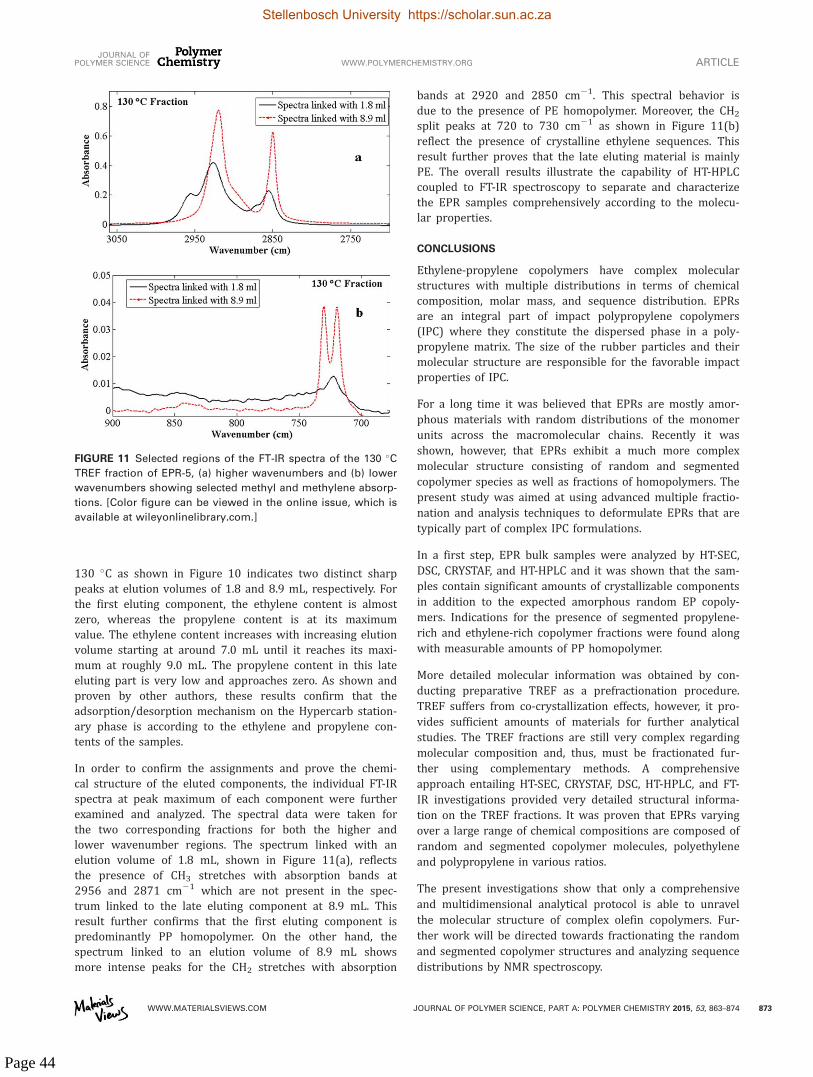
130 �C as shown in Figure 10 indicates two distinct sharppeaks at elution volumes of 1.8 and 8.9 mL, respectively. Forthe first eluting component, the ethylene content is almostzero, whereas the propylene content is at its maximumvalue. The ethylene content increases with increasing elutionvolume starting at around 7.0 mL until it reaches its maxi-mum at roughly 9.0 mL. The propylene content in this lateeluting part is very low and approaches zero. As shown andproven by other authors, these results confirm that theadsorption/desorption mechanism on the Hypercarb station-ary phase is according to the ethylene and propylene con-tents of the samples.
In order to confirm the assignments and prove the chemi-cal structure of the eluted components, the individual FT-IRspectra at peak maximum of each component were furtherexamined and analyzed. The spectral data were taken forthe two corresponding fractions for both the higher andlower wavenumber regions. The spectrum linked with anelution volume of 1.8 mL, shown in Figure 11(a), reflectsthe presence of CH3 stretches with absorption bands at2956 and 2871 cm21 which are not present in the spec-trum linked to the late eluting component at 8.9 mL. Thisresult further confirms that the first eluting component ispredominantly PP homopolymer. On the other hand, thespectrum linked to an elution volume of 8.9 mL showsmore intense peaks for the CH2 stretches with absorption
bands at 2920 and 2850 cm21. This spectral behavior isdue to the presence of PE homopolymer. Moreover, the CH2
split peaks at 720 to 730 cm21 as shown in Figure 11(b)reflect the presence of crystalline ethylene sequences. Thisresult further proves that the late eluting material is mainlyPE. The overall results illustrate the capability of HT-HPLCcoupled to FT-IR spectroscopy to separate and characterizethe EPR samples comprehensively according to the molecu-lar properties.
CONCLUSIONS
Ethylene-propylene copolymers have complex molecularstructures with multiple distributions in terms of chemicalcomposition, molar mass, and sequence distribution. EPRsare an integral part of impact polypropylene copolymers(IPC) where they constitute the dispersed phase in a poly-propylene matrix. The size of the rubber particles and theirmolecular structure are responsible for the favorable impactproperties of IPC.
For a long time it was believed that EPRs are mostly amor-phous materials with random distributions of the monomerunits across the macromolecular chains. Recently it wasshown, however, that EPRs exhibit a much more complexmolecular structure consisting of random and segmentedcopolymer species as well as fractions of homopolymers. Thepresent study was aimed at using advanced multiple fractio-nation and analysis techniques to deformulate EPRs that aretypically part of complex IPC formulations.
In a first step, EPR bulk samples were analyzed by HT-SEC,DSC, CRYSTAF, and HT-HPLC and it was shown that the sam-ples contain significant amounts of crystallizable componentsin addition to the expected amorphous random EP copoly-mers. Indications for the presence of segmented propylene-rich and ethylene-rich copolymer fractions were found alongwith measurable amounts of PP homopolymer.
More detailed molecular information was obtained by con-ducting preparative TREF as a prefractionation procedure.TREF suffers from co-crystallization effects, however, it pro-vides sufficient amounts of materials for further analyticalstudies. The TREF fractions are still very complex regardingmolecular composition and, thus, must be fractionated fur-ther using complementary methods. A comprehensiveapproach entailing HT-SEC, CRYSTAF, DSC, HT-HPLC, and FT-IR investigations provided very detailed structural informa-tion on the TREF fractions. It was proven that EPRs varyingover a large range of chemical compositions are composed ofrandom and segmented copolymer molecules, polyethyleneand polypropylene in various ratios.
The present investigations show that only a comprehensiveand multidimensional analytical protocol is able to unravelthe molecular structure of complex olefin copolymers. Fur-ther work will be directed towards fractionating the randomand segmented copolymer structures and analyzing sequencedistributions by NMR spectroscopy.
FIGURE 11 Selected regions of the FT-IR spectra of the 130 �C
TREF fraction of EPR-5, (a) higher wavenumbers and (b) lower
wavenumbers showing selected methyl and methylene absorp-
tions. [Color figure can be viewed in the online issue, which is
available at wileyonlinelibrary.com.]
JOURNAL OFPOLYMER SCIENCE WWW.POLYMERCHEMISTRY.ORG ARTICLE
WWW.MATERIALSVIEWS.COM JOURNAL OF POLYMER SCIENCE, PART A: POLYMER CHEMISTRY 2015, 53, 863–874 873
Page 44
Stellenbosch University https://scholar.sun.ac.za

ACKNOWLEDGMENTS
The authors thank SASOL, South Africa, and Lummus NovolenTechnology GmbH, Germany, for the financial support of thiswork. The EPR samples provided by Lummus Novolen Technol-ogy GmbH are also gratefully acknowledged.
REFERENCES AND NOTES
1 Z. S. Petrovic, J. Budinski-Simendic, V. Divjakovic, �Z. �Skrbic,
J. Appl. Polym. Sci. 1996, 59, 301–310.
2 M. Pires, R. S. Mauler, S. A. Liberman, J. Appl. Polym. Sci.
2004, 92, 2155–2162.
3 J. K. Lee, J. H. Lee, K. H. Lee, B. S. Jin, J. Appl. Polym. Sci.
2001, 81, 695–700.
4 L. Botha, A. J. van Reenen, Eur. Polym. J. 2013, 49, 2202–
2213.
5 C. Kock, M. Gahleitner, A. Schausberger, E. Ingolic, J. Appl.
Polym. Sci. 2012, 128, 1484–1496.
6 S. Cheruthazhekatt, H. Pasch, Anal. Bioanal. Chem. 2013, 405,
8607–8614.
7 C. Kock, N. Aust, C. Grein, M. Gahleitner, J. Appl. Polym. Sci.
2013, 130, 287–296.
8 T. Macko, A. Ginzburg, K. Remerie, R. Br€ull, Macromol.
Chem. Phys. 2012, 213, 937–944.
9 T. Macko, R. Br€ull, Y. Wang, B. Coto, I. Suarez, J. Appl.
Polym. Sci. 2011, 122, 3211–3217.
10 E. De Goede, P. Mallon, H. Pasch, Macromol. Mater. Eng.
2010, 295, 366–373.
11 S. Cheruthazhekatt, G. W. Harding, H. Pasch, J. Chromatogr.
A 2013, 1286, 69–82.
12 S. Thanyaprueksanon, S. Thongyai, P. Praserthdam, J. Appl.
Polym. Sci. 2007, 103, 3609–3616.
13 S. Cheruthazhekatt, T. F. J. Pijpers, G. W. Harding, V. B. F.
Mathot, H. Pasch, Macromolecules 2012, 45, 5866–5880.
14 H. Pasch, A. Albrecht, R. Br€ull, T. Macko, W. Hiller, Macro-
mol. Symp. 2009, 282, 71–80.
15 H. Pasch, R. Br€ull, U. Wahner, B. Monrabal, Macromol.
Mater. Eng. 2000, 279, 46–51.
16 Z. Fu, J. Xu, Y. Zhang, Z. Fan, J. Appl. Polym. Sci. 2005, 97,
640–647.
17 G. H. Zohuri, M. M. Mortazavi, R. Jamjah, S. Ahmadjo, J.
Appl. Polym. Sci. 2004, 93, 2597–2605.
18 S. D. Kim, Y. Choi, W. Choi, C. Choi, Y. S. Chun, Macromol.
Symp. 2012, 312, 27–33.
19 V. B. F. Mathot, M. F. J. Pijpers, Thermochim. Acta 1989,
151, 241–259.
20 M. H. Ha, B. K. Kim, Polym. Eng. Sci. 2004, 44, 1858–1865.
21 E. B. Berda, T. W. Baughman, K. B. Wagener, J. Polym. Sci.,
Part A: Polym. Chem. 2006, 44, 4981–4989.
22 G. Vanden Poel, V. B. F. Mathot, Thermochim. Acta 2007,
461, 107–121.
23 V. B. F. Mathot, R. L. Scherrenberg, T. F. J. Pijpers, Polymer
1998, 39, 4541–4559.
24 S. Mncwabe, N. Luruli, E. Marantos, P. Nhlapo, L. Botha,
Macromol. Symp. 2012, 2313314, 33–42.
25 N. Aust, M. Gahleitner, K. Reichelt, B. Raninger, Polym.
Test. 2006, 25, 896–903.
26 S. Cheruthazhekatt, T. F. J. Pijpers, V. B. F. Mathot, H.
Pasch, Macromol. Symp. 2013, 330, 22–29.
27 S. Cheruthazhekatt, H. Pasch, Macromol. Symp. 2014, 337,
51–57.
28 S. Anantawaraskul, P. Somnukguandee, J. B. P. Soares, J.
Limtrakul, J. Polym. Sci., Part B: Polym. Phys. 2009, 47, 866–
876.
29 J. B. P. Soares, S. Anantawaraskul, J. Polym. Sci., Part B:
Polym. Phys. 2005, 43, 1557–1570.
30 B. Monrabal, Adv. Polym. Sci. 2013, 257, 203–252.
31 J. Nieto, T. Oswald, F. Blanco, J. B. P. Soares, B. Monrabal,
J. Polym. Sci., Part B: Polym. Phys. 2001, 39, 1616–1628.
32 B. Monrabal, P. Del Hierro, Anal. Bioanal. Chem. 2011, 399,
1557–1561.
33 A. Albrecht, L. C. Heinz, D. Lilge, H. Pasch, Macromol.
Symp. 2007, 257, 46–55.
34 H. Pasch, M. I. Malik, T. Macko, Adv. Polym. Sci. 2013, 251,
77–140.
35 T. Macko, H. Pasch, Macromolecules 2009, 42, 6063–6067.
36 L.-C. Heinz, H. Pasch, Polymer 2005, 46, 12040–12045.
37 T. Macko, H. Pasch, R. Br€ull, J. Chromatogr. A 2006, 1115,
81–87.
38 T. Macko, R. Br€ull, R. G. Alamo, Y. Thomann, V. Grumel,
Polymer 2009, 50, 5443–5448.
39 A. Ginzburg, T. Macko, V. Dolle, R. Br€ull, Eur. Polym. J.
2011, 47, 319–329.
40 R. Chitta, A. Ginzburg, T. Macko, R. Br€ull, G. Van
Doremaele, LC-GC Eur. 2012, 25, 352–358.
41 S. Cheruthazhekatt, N. Mayo, B. Monrabal, H. Pasch, Macro-
mol. Chem. Phys. 2013, 214, 2165–2171.
42 T. Macko, R. Br€ull, Y. Zhu, Y. Wang. J. Sep. Sci. 2010, 33,
3446–3454.
43 A. Albrecht, R. Br€ull, T. Macko, P. Sinha, H. Pasch, Macro-
mol. Chem. Phys. 2008, 209, 1909–1919.
44 S. Cheruthazhekatt, T. F. J. Pijpers, G. W. Harding, V. B. F.
Mathot, H. Pasch, Macromolecules 2012, 45, 2025–2034.
ARTICLE WWW.POLYMERCHEMISTRY.ORGJOURNAL OF
POLYMER SCIENCE
874 JOURNAL OF POLYMER SCIENCE, PART A: POLYMER CHEMISTRY 2015, 53, 863–874
Page 45
Stellenbosch University https://scholar.sun.ac.za
Page 46
Chapter5:HomogeneityofMetalloceneEPRCopolymers
5 On the Homogeneity of Metallocene Ethylene-Propylene Copolymers as
Investigated by Multiple Fractionation Techniques
In this chapter, three metallocene-based ethylene-propylene rubber (EPR) copolymers are
fractionated and characterized by multiple fractionation methods to determine their
homogeneity. Upon the fractionation of the samples by preparative TREF, the analyses of the
individual fractions reveal a remarkably high chemical heterogeneity within the bulk samples.
The present study shows that the combination of various analytical techniques is the essential
tool to understand the complex nature of the molecular composition of metallocene-based
EPR copolymers. This work has been published as the following research article: Phiri, M.J.;
Dimeska, A.; Pasch, H., On the Homogeneity of Metallocene Ethylene-Propylene
Copolymers as Investigated by Multiple Fractionation Techniques. Macromolecular
Chemistry and Physics, 2015, 216, 1619-1628.
5.1 Summary of the Research Study
It has been proven by numerous techniques that ethylene-propylene copolymers synthesised
by metallocene catalysts exhibit narrow molar mass (MMD)1-3and chemical composition
distributions (CCD)1 when analysed as bulk samples. Hence, there (apparently) has never
been a need to fractionate such homogeneous materials into individual fractions. However,
based on our previous work done on the Ziegler-Natta EPR copolymers with high comonomer
contents, there were unexpected PE and PP homopolymers detected from the bulk samples
upon fractionation procedures such as TREF. This observation prompted us to carry out
comprehensive analyses to reveal the chemical composition heterogeneity of metallocene
EPR with high ethylene contents. A number of advanced techniques namely SEC, TREF,
CRYSTAF, DSC, HPLC and 13C NMR were used for the analyses of the EPR samples having
different amounts of ethylene contents in the range of 30 – 50 mol %.
In the first step of characterization, the bulk samples were analysed by various analytical
techniques to determine their bulk chemical composition and molar mass homogeneities.
SEC, DSC and HPLC showed that the EPR samples exhibit both narrow MMDs and CCDs.
The three samples showed similar melting temperatures (Tm) with values of ~154 °C and this
was characteristic of EP copolymers having long sequences of propylene units. HPLC
chromatograms showed no observable or quantifiable material that eluted in 100 % of 1-
Stellenbosch University https://scholar.sun.ac.za

Page 47
decanol, however after the start of the gradient with TCB, all the material that was adsorbed
on the column eluted in the volume range of 3.5 – 4.5 mL. It was comprehended that the peak
elution volumes for the samples increase with their ethylene content. The amorphous phase
was the major part present in these EPR samples as determined by the CRYSTAF technique.
In addition, there was a small amount of crystallizing material in the crystallization
temperature range of 30 – 90 °C suggesting the complexity in the chemical compositions of
the EPR copolymers
The overall results of the bulk sample analyses revealed that these EPR samples have
different chemical compositions among them. Furthermore, based on our previous work in
Chapter 4, it was determined that EPR samples with high comonomer contents have minor
components that cannot be detected from the bulk sample analysis, as such preparative TREF
was found to be essential. Subsequently, the bulk samples were fractionated by preparative
TREF so that further analyses could be performed on the fractions. TREF showed similar
results to those obtained by CRYSTAF with the amorphous phase constituting the largest
percentage of the material. The TREF fractions collected at 30 °C consisted of ~ 80 % of the
overall bulk samples material and this percentage is found to increase with the ethylene
content of the bulk samples. Interestingly, highly crystalline material was collected at a TREF
temperature of 130 °C. It was unexpected for metallocene-based EPR copolymers with such
high ethylene contents to indicate the presence of iPP homopolymer. On the other hand, the
percentages of segmented ethylene-propylene (EP) copolymers as contained in the 90 °C
fractions were the lowest among all TREF fractions hence some of the analyses were not
performed due to very low quantities.
All the TREF fractions showed unimodal MMDs and the molar masses of the fractions
increased with higher TREF temperatures. However, the TREF fractions collected at 60 and
90 °C had slightly higher dispersity values as compared to other fractions due to large number
of molecules which had resulted from the co-crystallization and co-elution that took place
during the TREF experiments. DSC and CRYSTAF showed that the 30 and 60 °C TREF
fractions contained random EP copolymers which were completely amorphous according to
the fact that there were no observable crystallization peaks detected in both DSC and
CRYSTAF. The 90 °C TREF fractions contained either propylene-rich copolymer or low
molar mass iPP with low tacticity due the melting peak around 150 °C that was seen in DSC.
The 90 °C fractions exhibit melt enthalpies of about 18 J/g indicating EP copolymers.
Furthermore, the 130 °C TREF fractions showed melting peaks at around 160 °C suggesting
Stellenbosch University https://scholar.sun.ac.za
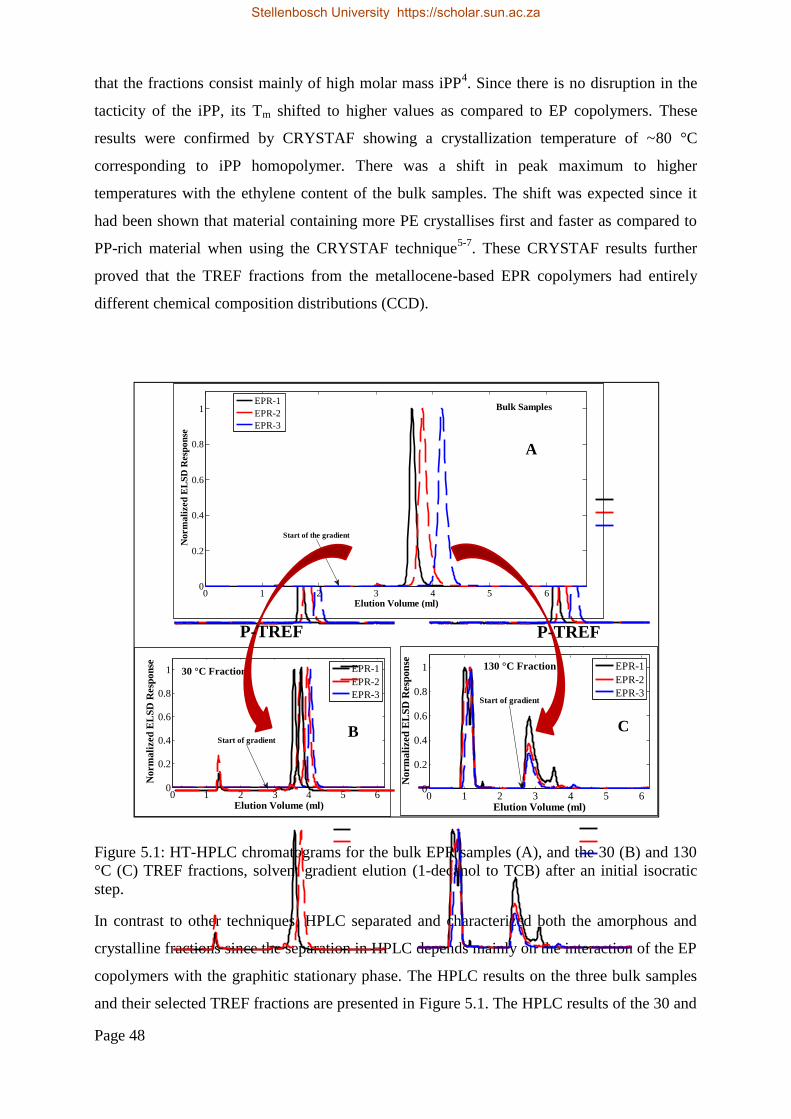
Page 48
that the fractions consist mainly of high molar mass iPP4. Since there is no disruption in the
tacticity of the iPP, its Tm shifted to higher values as compared to EP copolymers. These
results were confirmed by CRYSTAF showing a crystallization temperature of ~80 °C
corresponding to iPP homopolymer. There was a shift in peak maximum to higher
temperatures with the ethylene content of the bulk samples. The shift was expected since it
had been shown that material containing more PE crystallises first and faster as compared to
PP-rich material when using the CRYSTAF technique5-7. These CRYSTAF results further
proved that the TREF fractions from the metallocene-based EPR copolymers had entirely
different chemical composition distributions (CCD).
Figure 5.1: HT-HPLC chromatograms for the bulk EPR samples (A), and the 30 (B) and 130°C (C) TREF fractions, solvent gradient elution (1-decanol to TCB) after an initial isocraticstep.
In contrast to other techniques, HPLC separated and characterized both the amorphous and
crystalline fractions since the separation in HPLC depends mainly on the interaction of the EP
copolymers with the graphitic stationary phase. The HPLC results on the three bulk samples
and their selected TREF fractions are presented in Figure 5.1. The HPLC results of the 30 and
0 1 2 3 4 5 60
0.2
0.4
0.6
0.8
1
Elution Volume (ml)
Nor
mal
ized
EL
SD R
espo
nse
30 °C Fraction EPR-1EPR-2EPR-3
0 1 2 3 4 5 60
0.2
0.4
0.6
0.8
1 60 °C Fraction
Elution Volume (ml)
Nor
mal
ized
EL
SD R
espo
nse
EPR-1EPR-2EPR-3
0 1 2 3 4 5 60
0.2
0.4
0.6
0.8
1
Elution Volume (ml)
Nor
mal
ized
EL
SD R
espo
nse
90 °C Fraction EPR-1EPR-2
0 1 2 3 4 5 60
0.2
0.4
0.6
0.8
1
Elution Volume (ml)
Nor
mal
ized
EL
SD R
espo
nse
130 °C Fraction EPR-1EPR-2EPR-3
Start of gradient
Start of gradient
Start of gradient
Start of gradient
0 1 2 3 4 5 60
0.2
0.4
0.6
0.8
1
Elution Volume (ml)
Nor
mal
ized
EL
SD R
espo
nse
EPR-1EPR-2EPR-3
Start of the gradient
Bulk Samples
P-TREF P-TREF
C
A
B
Stellenbosch University https://scholar.sun.ac.za

Page 49
60 °C TREF fractions showed similar chemical compositions as their corresponding bulk
samples. These TREF fractions were assumed to consist of EP copolymers with random
propylene and ethylene sequences along the macromolecules. On the other hand, the late
eluting TREF fractions (90 and 130 °C) showed entirely different chemical compositions
compared to the bulk samples and this behaviour was unexpected from samples prepared by a
metallocene catalyst system. For the 90 °C TREF fractions, the materials that eluted in 100 %
of 1-decanol were mainly due to low molar mass of iPP. After the start of the gradient with
TCB, the material that eluted at 3.5 – 4.5 mL had similar compositions as the bulk samples.
The components that eluted immediately (~2.7 mL) after the start of the gradient from the 130
°C TREF fractions were due to high mass of iPP. As depicted in the Fig. 5.1, HPLC revealed
the heterogeneity of the metallocene-catalysed EPR copolymers.
The 13C NMR results confirmed the heterogeneity observed by the HPLC analyses. In
addition, the comonomer contents and the monomer sequence distributions of all TREF
fractions were calculated and it was found that the 30 and 60 °C fractions contain similar EP
sequences. However, minor differences in the sequence distributions were observed with
minute amounts of EP junctions such as PEP, EPE, PPE and EEP. It was assumed that these
junctions play a major role in the crystallinity of these fractions as observed from TREF
experiments. However, the 130 °C TREF fractions were found to have three peaks
corresponding to carbon atoms of the propylene repeating units. The 13C NMR spectra
showed three major signals due to CH2 (~47 ppm), CH (~30 ppm) and CH3 (~23 ppm) which
were entirely different from the spectra obtained for the lower TREF fractions. This suggests
that the 130 °C TREF fractions contained iPP homopolymer as it has been seen from DSC,
CRYSTAF and HPLC analyses.
In summary, the present work showed that a remarkably high chemical heterogeneity is
present in the metallocene-based EPR samples as evidenced by prep-TREF fractionation and
the further analysis of the fractions by advanced analytical methods including HT-HPLC as
well as 13C NMR. The combination of various analytical techniques proved to be a useful tool
in understanding the molecular structures of these complex EPR copolymers.
Stellenbosch University https://scholar.sun.ac.za

Page 50
5.2 References
1. R. Chitta, A. Ginzburg, T. Macko, R. Brüll, G. van Doremaele. LC-GC Europe 2012, 25,352-358.
2. T. Macko, A. Ginzburg, K. Remerie, R. Brüll. Macromolecular Chemistry and Physics2012, 213, 937-944.
3. S. Podzimek. Journal of Applied Polymer Science 2014, 131, 40111.
4. S. Cheruthazhekatt, T. F. J. Pijpers, G. W. Harding, V. B. F. Mathot, H. Pasch.Macromolecules 2012, 45, 2025-2034.
5. B. Monrabal. Macromolecular Symposia 1996, 110, 81-86.
6. B. Monrabal, P. Del Hierro. Analytical and Bioanalytical Chemistry 2011, 399, 1557-1561.
7. H. Pasch, R. Brüll, U. Wahner, B. Monrabal. Macromolecular Materials and Engineering2000, 279, 46-51.
Stellenbosch University https://scholar.sun.ac.za

1619
Full PaperMacromolecularChemistry and Physics
wileyonlinelibrary.com© 2015 WILEY-VCH Verlag GmbH & Co. KGaA, Weinheim DOI: 10.1002/macp.201500135
On the Homogeneity of Metallocene Ethylene–Propylene Copolymers as Investigated by Multiple Fractionation Techniques
Mohau Justice Phiri , Anita Dimeska , Harald Pasch *
The chemical heterogeneity of ethylene–propylene copolymers by multiple fractionation tech-niques is addressed. Three metallocene copolymer samples with different ethylene contents, ranging from 30 to 50 mol% are analyzed using bulk methods to confi rm their molecular heterogeneity. In a second step, the samples are fractionated by temperature rising elution fractionation (TREF) to obtain fractions at 30, 60, 90, and 130 °C. These fractions are subse-quently analyzed regarding their thermal and molecular properties. Differential scanning calorimetry, crystallization analysis fractionation, and high-temperature high performance liquid chromatography (HT-HPLC) results reveal that the TREF fractions collected at 130 °C are mainly due to polypropylene homopolymer, which is rather unexpected considering the high ethylene contents of the bulk samples. Most impor-tantly, HT-HPLC reveals a remarkably high chemical hetero-geneity of the fractions and thus the bulk samples. Solution 13 C NMR provides the comonomer contents and sequence dis-tributions of the fractions. These indicate that the same TREF fractions from different samples have distinctively different chemical compositions.
M. J. Phiri, Prof. H. Pasch Department of Chemistry and Polymer Science Stellenbosch University 7602 Matieland , South Africa E-mail: [email protected] Dr. A. Dimeska Lummus Novolen Technology GmbH Carl-Bosch-Str. 38, 67056 Ludwigshafen , Germany
have found lots of attention in research as it is interesting to study structure-property relations as compared to samples prepared by Ziegler–Natta catalysts. [ 1,3,5–7 ] Recent developments in both reactor and catalyst technologies have allowed to synthesize EP copolymers with very broad chemical compositions. [ 5,8,9 ] These have complex structures and elastomeric properties for samples with high ethylene contents. [ 5,8,10 ]
In order to obtain comprehensive compositional information about such complex EP copolymers, both MMD and chemical composition distribution (CCD) must be determined simultaneously. The MMD of such copolymers is typically determined using high temper-ature size exclusion chromatography (HT-SEC). [ 5,11–15 ] There are numerous analytical techniques available for the determination of the chemical composition of EP copolymers including Fourier transform infrared
1. Introduction
Ethylene–propylene (EP) copolymers produced by metal-locene catalysts system have been proven to have narrow molar mass distributions (MMD) and low chemical het-erogeneities. [ 1,2 ] Metallocene catalysts are unique in that they have single active sites for polymerizations to take place. [ 2–4 ] As such metallocene-catalyzed EP copolymers
Macromol. Chem. Phys. 2015, 216, 1619−1628
Page 51
Stellenbosch University https://scholar.sun.ac.za
Stellenbosch University https://scholar.sun.ac.za
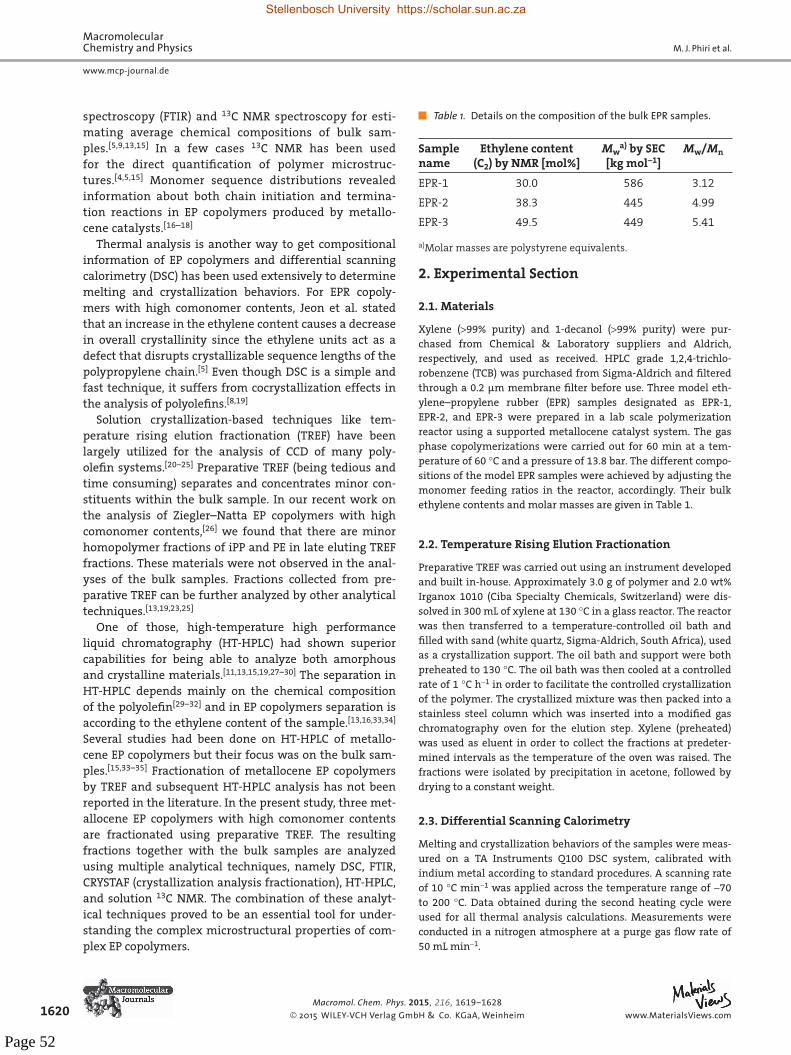
1620
M. J. Phiri et al.
www.mcp-journal.de
MacromolecularChemistry and Physics
www.MaterialsViews.com© 2015 WILEY-VCH Verlag GmbH & Co. KGaA, Weinheim
spectroscopy (FTIR) and 13 C NMR spectroscopy for esti-mating average chemical compositions of bulk sam-ples. [ 5,9,13,15 ] In a few cases 13 C NMR has been used for the direct quantifi cation of polymer microstruc-tures. [ 4,5,15 ] Monomer sequence distributions revealed information about both chain initiation and termina-tion reactions in EP copolymers produced by metallo-cene catalysts. [ 16–18 ]
Thermal analysis is another way to get compositional information of EP copolymers and differential scanning calorimetry (DSC) has been used extensively to determine melting and crystallization behaviors. For EPR copoly-mers with high comonomer contents, Jeon et al. stated that an increase in the ethylene content causes a decrease in overall crystallinity since the ethylene units act as a defect that disrupts crystallizable sequence lengths of the polypropylene chain. [ 5 ] Even though DSC is a simple and fast technique, it suffers from cocrystallization effects in the analysis of polyolefi ns. [ 8,19 ]
Solution crystallization-based techniques like tem-perature rising elution fractionation (TREF) have been largely utilized for the analysis of CCD of many poly-olefi n systems. [ 20–25 ] Preparative TREF (being tedious and time consuming) separates and concentrates minor con-stituents within the bulk sample. In our recent work on the analysis of Ziegler–Natta EP copolymers with high comonomer contents, [ 26 ] we found that there are minor homopolymer fractions of iPP and PE in late eluting TREF fractions. These materials were not observed in the anal-yses of the bulk samples. Fractions collected from pre-parative TREF can be further analyzed by other analytical techniques. [ 13,19,23,25 ]
One of those, high-temperature high performance liquid chromatography (HT-HPLC) had shown superior capabilities for being able to analyze both amorphous and crystalline materials. [ 11,13,15,19,27–30 ] The separation in HT-HPLC depends mainly on the chemical composition of the polyolefi n [ 29–32 ] and in EP copolymers separation is according to the ethylene content of the sample. [ 13,16,33,34 ] Several studies had been done on HT-HPLC of metallo-cene EP copolymers but their focus was on the bulk sam-ples. [ 15,33–35 ] Fractionation of metallocene EP copolymers by TREF and subsequent HT-HPLC analysis has not been reported in the literature. In the present study, three met-allocene EP copolymers with high comonomer contents are fractionated using preparative TREF. The resulting fractions together with the bulk samples are analyzed using multiple analytical techniques, namely DSC, FTIR, CRYSTAF (crystallization analysis fractionation), HT-HPLC, and solution 13 C NMR. The combination of these analyt-ical techniques proved to be an essential tool for under-standing the complex microstructural properties of com-plex EP copolymers.
2. Experimental Section
2.1. Materials
Xylene (>99% purity) and 1-decanol (>99% purity) were pur-chased from Chemical & Laboratory suppliers and Aldrich, respectively, and used as received. HPLC grade 1,2,4-trichlo-robenzene (TCB) was purchased from Sigma-Aldrich and fi ltered through a 0.2 μm membrane fi lter before use. Three model eth-ylene–propylene rubber (EPR) samples designated as EPR-1, EPR-2, and EPR-3 were prepared in a lab scale polymerization reactor using a supported metallocene catalyst system. The gas phase copolymerizations were carried out for 60 min at a tem-perature of 60 °C and a pressure of 13.8 bar. The different compo-sitions of the model EPR samples were achieved by adjusting the monomer feeding ratios in the reactor, accordingly. Their bulk ethylene contents and molar masses are given in Table 1 .
2.2. Temperature Rising Elution Fractionation
Preparative TREF was carried out using an instrument developed and built in-house. Approximately 3.0 g of polymer and 2.0 wt% Irganox 1010 (Ciba Specialty Chemicals, Switzerland) were dis-solved in 300 mL of xylene at 130 °C in a glass reactor. The reactor was then transferred to a temperature-controlled oil bath and fi lled with sand (white quartz, Sigma-Aldrich, South Africa), used as a crystallization support. The oil bath and support were both preheated to 130 °C. The oil bath was then cooled at a controlled rate of 1 °C h −1 in order to facilitate the controlled crystallization of the polymer. The crystallized mixture was then packed into a stainless steel column which was inserted into a modifi ed gas chromatography oven for the elution step. Xylene (preheated) was used as eluent in order to collect the fractions at predeter-mined intervals as the temperature of the oven was raised. The fractions were isolated by precipitation in acetone, followed by drying to a constant weight.
2.3. Differential Scanning Calorimetry
Melting and crystallization behaviors of the samples were meas-ured on a TA Instruments Q100 DSC system, calibrated with indium metal according to standard procedures. A scanning rate of 10 °C min −1 was applied across the temperature range of −70 to 200 °C. Data obtained during the second heating cycle were used for all thermal analysis calculations. Measurements were conducted in a nitrogen atmosphere at a purge gas fl ow rate of 50 mL min −1 .
Macromol. Chem. Phys. 2015, 216, 1619−1628
Table 1. Details on the composition of the bulk EPR samples.
Sample name
Ethylene content (C 2 ) by NMR [mol%]
M w a) by SEC [kg mol −1 ]
M w / M n
EPR-1 30.0 586 3.12
EPR-2 38.3 445 4.99
EPR-3 49.5 449 5.41
a) Molar masses are polystyrene equivalents.
Page 52
Stellenbosch University https://scholar.sun.ac.za
Stellenbosch University https://scholar.sun.ac.za

1621
On the Homogeneity of Metallocene Ethylene–Propylene Copolymers as Investigated by Multiple Fractionation Techniques
www.mcp-journal.de
MacromolecularChemistry and Physics
www.MaterialsViews.com © 2015 WILEY-VCH Verlag GmbH & Co. KGaA, Weinheim
2.4. Crystallization Analysis Fractionation
CRYSTAF experiments were carried out using a commercial CRYSTAF apparatus Model 200 (Polymer Char, Valencia, Spain). For each sample, approximately 20 mg was dissolved in 35 mL of TCB. Crystallization was carried out under agitation in stainless steel reactors, equipped with automatic stirring and fi ltration devices. After dissolution, the temperature was decreased from 100 °C to approximately 30 °C at a rate of 0.1 °C min −1 . Fractions were taken automatically and the concentration of the solution was determined by an infrared detector, using 3.5 μm as the chosen wavelength.
2.5. High-Temperature Size Exclusion Chromatography
Molar mass measurements for all samples were performed at 150 °C using a PL GPC 220 high temperature chromatograph (Polymer Laboratories, Church Stretton, UK) equipped with a dif-ferential refractive index (RI) detector. The column set used con-sisted of three 300 × 7.5 mm i.d. PLgel Olexis columns together with a 50 × 7.5 mm PLgel Olexis guard column (Polymer Labora-tories, Church Stretton, UK). The eluent used was TCB at a fl ow rate of 1.0 mL min −1 with 0.0125 wt% 2,6-ditertbutyl-4-methyl-phenol (BHT) added as a stabilizer. Samples were dissolved at 160 °C in TCB at a concentration of 1 mg mL −1 for 1–2 h (depending on the sample type) and 200 μL of each sample was injected. Narrowly distributed polystyrene standards (Polymer Laboratories, Church Stretton, UK) were used for calibration.
2.6. High-Temperature High Performance Liquid Chromatography
The separations were conducted on a high temperature sol-vent gradient interaction chromatograph (SGIC) constructed by Polymer Char (Valencia, Spain), comprising of an autosampler, two separate ovens, switching valves, and two pumps equipped with vacuum degassers (Agilent, Waldbronn, Germany). One oven was used for the HPLC column, while the second oven is the location of the injector and a switching valve. The autosam-pler is a separate unit connected to the injector through a heated transfer line. A high-pressure binary gradient pump was used for HPLC in the fi rst dimension.
An evaporative light scattering detector (ELSD, model PL-ELS 1000, Polymer Laboratories, Church Stretton, England) was used with the following parameters: a gas fl ow rate of 1.5 L min −1 , a nebuliser temperature of 160 °C, and an evaporator temperature of 270 °C. HT-HPLC was carried out using a Hypercarb column (Hypercarb, Thermo Scientifi c, Dreieich, Germany) with the following parameters: 100 × 4.6 mm id., packed with porous graphite particles with a particle diameter of 5 μm, a surface area of 120 m 2 g −1 , and a pore size of 250 Å. The fl ow rate of the mobile phase was 0.5 mL min −1 . The column was placed in the column oven maintained at 160 °C. The HPLC separations were accomplished by applying a linear gradient from 1-decanol to TCB. The volume fraction of TCB was linearly increased to 100% within 10 min after the sample injection and then held constant for 25 min. Finally, the initial chromatographic conditions were re-established with 100% 1-decanol. The dwell and void volumes
of 1.7 and 1.1 mL, respectively, were measured according the method described by Ginzburg et al. [ 28 ] This refl ects that there is an isocratic elution of 1-decanol (1.7 mL) before the start of gra-dient hits the column. [ 13 ] Samples were injected at a concentra-tion of 1–1.2 mg mL −1 , with 20 μL of each sample being injected.
2.7. Fourier Transform Infrared Spectroscopy
FTIR analyses of the samples were performed on a Thermo Nicolet iS10 Spectrometer (Thermo Scientifi c, Waltham, MA). Spectra were recorded at a resolution of 8 cm −1 with 16 scans being recorded for each spectrum. Thermo Scientifi c OMNIC soft-ware (version 8.1) was used for data collection and processing.
2.8. High Temperature 13 C NMR Spectroscopy
13 C NMR spectra were measured on a 400 MHz Varian Unity Inova NMR spectrometer, at a resonance frequency of 150 MHz for carbon. Deuterated 1,1,2,2-tetrachloroethane-d2 (95.5+ atom% D, Sigma-Aldrich) at δ 74.3 ppm as internal reference, was used as a solvent for the sample preparation (at a concentration of 6 wt%). Analyses were carried out at 120 °C in nitrogen atmosphere, with an acquisition time of 0.79 s and preacquisition delay time of 15 s. This had led to total analysis time of 6 to 10 h per sample.
3. Results and Discussion
Evaluating the “homogeneity” of a polyolefi n sample means analyzing its molar mass and chemical hetero-geneity as well as its melting and crystallization behaviors. This is typically done by SEC (molar mass), HPLC (chemical composition), and DSC (melting and crystallization). If these methods provide narrow and unimodal distribu-tion curves then these fi ndings suggest that the sample is rather homogeneous or has a low molecular dispersity.
Figure 1 presents the SEC, HPLC, and DSC results for the bulk samples. As can be seen in Figure 1 a, the sam-ples exhibit unimodal narrow molar mass distributions. The peak maximum molar masses are very similar indi-cating that the ethylene–propylene ratio did not signifi -cantly infl uence the molar mass, see also Table 1 . This is in agreement with previous fi ndings that showed that metallocene catalysts produce polymers with narrow and unimodal molar mass distributions. [ 5,15,34 ]
HPLC separates the samples according the ethylene–propylene ratio and provides an idea on the chemical composition distribution. Similar to SEC, very narrow elution profi les are obtained. The elution order is EPR-3 > EPR-2 > EPR-1 which is in agreement with the increasing ethylene content of the samples, see Figure 1 b.
The EPR samples were further analyzed by DSC with a scan rate of 10 °C min −1 to determine the thermal
Macromol. Chem. Phys. 2015, 216, 1619−1628
Page 53
Stellenbosch University https://scholar.sun.ac.za
Stellenbosch University https://scholar.sun.ac.za

1622
M. J. Phiri et al.
www.mcp-journal.de
MacromolecularChemistry and Physics
www.MaterialsViews.com© 2015 WILEY-VCH Verlag GmbH & Co. KGaA, Weinheim
properties, see Figure 1 c and Table 2 . As can be seen, the three samples have similar melting temperatures ( T m ) with values of ≈153 °C which are characteristic of pro-pylene-rich EP copolymers having long sequences of pro-pylene units. The crystallization temperatures ( T c ) are at approximately 111 °C and they are identical for all sam-ples. The average crystallinities of the samples were esti-mated based on the melt enthalpies as shown in Table 2 . With increasing ethylene contents the melting peak areas decrease refl ecting the lower crystallinity for samples with higher ethylene contents. As is known, the inclusion
of ethylene units in the polypropylene chains causes a reduction in crystallizable sequence lengths of iPP. [ 1,5 ]
The observed glass transition temperatures ( T g ) in Table 2 show noticeable differences and T g is found to decrease with increasing ethylene content. This is in agreement with the lower crystallinity at higher ethylene contents. Several studies have proved that EP copolymers with lower T g values have higher impact resistance. It is important to notice that despite similar T m and T c of these samples, they do have signifi cantly different T g that would affect their impact resistance properties.
The analyses of the bulk samples by SEC, HPLC, and DSC suggest that they have narrow molecular heterogeneities. In the present comonomer range the molar masses and the melting/crystallization temperatures are not signifi -cantly affected by the chemical composition. In contrast, the HPLC elution behavior and the glass transition tem-peratures are infl uenced by the chemical composition. Most importantly, CRYSTAF results show that the samples consist of a very high percentage of noncrystallizable material. The soluble fractions increase with increasing ethylene contents of the copolymers, see Figure 2 , and these results are consistent with the lower melt enthal-pies obtained by DSC as shown in Table 2 .
A more detailed investigation of the samples was con-ducted with preparative TREF fractionations as the fi rst step followed by the separation and characterization of individual components. The prep TREF profi les for the
Macromol. Chem. Phys. 2015, 216, 1619−1628
30 60 90 120 150 180
-0.6
-0.4
0.4
0.6
Hea
t F
low
(W
/g)
Temperature (0C)
EPR-1 (C2=30.0%)
EPR-2 (C2=38.3%)
EPR-3 (C2=49.5%)
c
103
104
105
106
107
0
0.1
0.2
0.3
0.4
0.5
0.6
0.7
0.8
0.9
Molar mass (g/mol)
dW
/dlo
gM
EPR-1 (C2=30.0%)
EPR-2 (C2=38.3%)
EPR-3 (C2=49.5%)
a
0 1 2 3 4 5 60
0.2
0.4
0.6
0.8
1
Elution Volume (ml)
esn
ops
eR
DS
LE
de
zila
mr
oN
EPR-1 (C2=30.0%)
EPR-2 (C2=38.3%)
EPR-3 (C2=49.5%)
Start of the gradient
b
Figure 1. Bulk analysis of samples EPR-1, EPR-2, and EPR-3 by a) SEC, b) HPLC, and c) DSC.
Table 2. Thermal properties of the EPR samples as obtained from fi rst cooling and second heating measurements of DSC with a scan rate of 10 °C min −1 .
Sample name
T m [°C]
T c [°C]
T g [°C]
Δ H [J g −1 ]
EPR-1 152.71 111.96 –39.63 2.87
EPR-2 152.64 111.79 –43.44 1.76
EPR-3 153.24 111.08 –50.80 0.89
20 30 40 50 60 70 80 90 1000
5
10
15
20
Temperature (°C)
dW
/dT
EPR-1 (C2=30.0%)
EPR-2 (C2=38.3%)
EPR-3 (C2=49.5%)
Figure 2. CRYSTAF curves for the bulk EPR samples obtained at crystallization temperatures of 30–100 °C.
Page 54
Stellenbosch University https://scholar.sun.ac.za
Stellenbosch University https://scholar.sun.ac.za

1623
On the Homogeneity of Metallocene Ethylene–Propylene Copolymers as Investigated by Multiple Fractionation Techniques
www.mcp-journal.de
MacromolecularChemistry and Physics
www.MaterialsViews.com © 2015 WILEY-VCH Verlag GmbH & Co. KGaA, Weinheim
three samples are presented in Figure 3 . This fi gure pre-sents a very interesting insight into the complexity of the samples. In agreement with the CRYSTAF results it is seen that noncrystallizable (amorphous) material makes about 80 wt% of the total samples. 11–14 wt% are segmented copolymers while 2–6 wt% are highly crystalline mate-rial, probably iPP or propylene-rich copolymer fractions. The percentage of non-crystallizable material is found to increase with the ethylene content of the bulk samples. These results are consistent with the T g measurements of the bulk samples. In our previous work on EPR samples with high ethylene contents, [ 26 ] we had seen that TREF
material collected at 130 °C contained mostly iPP homopolymer.
The results of the molar mass anal-yses of the TREF fractions are summa-rized in Table 3 . Similar to the results for the bulk samples, all the TREF frac-tions showed unimodal MMDs. The molar masses of the fractions increase with higher TREF temperature sug-gesting that either there is a molar mass infl uence on the TREF fractiona-tions or the chemical composition infl u-ences the molar masses. At higher TREF temperatures the propylene content of the copolymer fractions is higher.
The thermal analysis was done on all the TREF fractions and no distinct melting and crystallization events were observed for the fractions collected at 30 and 60 °C. This behavior indicates that these TREF fractions are completely
amorphous or have a low crystallinity. The DSC results of the 90 and 130 °C TREF fractions are shown in Figure 4 . The 90 °C TREF fraction of the EPR-3 was not analysed by DSC due the low quantity that was obtained by TREF. The observed T m for these fractions is seen at 150 and 160 °C, respectively. It was concluded that the 90 °C TREF frac-tions consist of EP copolymer species with long propylene sequences while the 130 °C TREF fractions are due to iPP. The melt enthalpies that were determined for the 90 and 130 °C fractions are shown in Table 4 . In agreement with the previous statements, the 130 °C fractions exhibit a melt enthalpy of roughly 70 J g −1 which is in agreement
Macromol. Chem. Phys. 2015, 216, 1619−1628
79.8
8
13.8
2
0.38 5.
92
81.2
9
12.5
5
0.59 5.
56
86.3
3
11.6
3
0.01 2.03
30 60 90 1300
20
40
60
80
)%( e
gatnecre
P th
gieW
TREF Temperature (°C)
EPR-1 (C2=30.0%)
EPR-2 (C2=38.3%)
EPR-3 (C2=49.5%)
Figure 3. Preparative TREF results for EPR-1, EPR-2 and EPR-3, indicating the overall weight percentages of each fraction as a function of elution temperature.
Table 3. Molar masses of the TREF fractions for the three EPR samples as measured by HT-SEC.
Sample name TREF fraction [°C]
M w a) [kg mol −1 ]
M n a) [kg mol −1 ]
M w / M n
EPR-1 30 399 159 2.51
60 405 128 3.15
90 405 114 3.54
130 718 271 2.65
EPR-2 30 385 150 2.56
60 343 83 4.12
90 396 64 6.22
130 576 99 5.84
EPR-3 30 359 111 3.24
60 360 96 3.75
90 NA NA NA
130 498 112 4.43
a) Molar masses are polystyrene equivalents. NA: not analyzed due to low quantity of sample.
Page 55
Stellenbosch University https://scholar.sun.ac.za
Stellenbosch University https://scholar.sun.ac.za

1624
M. J. Phiri et al.
www.mcp-journal.de
MacromolecularChemistry and Physics
www.MaterialsViews.com© 2015 WILEY-VCH Verlag GmbH & Co. KGaA, Weinheim
with the melt enthalpy of iPP (70.8 J g −1 for 100% iPP). The 90 °C fractions exhibit melt enthalpies of about 18 J g −1 indicating EP copolymers.
In the next step, the DSC results which were obtained from the solid phase were contrasted to crystallization results obtained from solution using CRYSTAF. The nor-malized CRYSTAF results of the fractions are presented in Figure 5 showing crystallization temperatures between 30 and 100 °C. The TREF fractions collected at both 30 and 60 °C show no observable or quantifi able peaks in the crystallization region. According to CRYSTAF, these fractions are mostly amorphous with almost all material appearing in the soluble fractions at 30 °C. These results are consistent with the DSC analyses that indicate the 30 and 60 °C fractions to be completely amorphous. The 130 °C fractions show unimodal crystallization peaks between 65 and 85 °C for all EPR samples with a very small portion of amorphous material observed at 30 °C. The lowest amount of solubles and the highest crystal-lization temperature are obtained for sample EPR-3. This fi nding is in agreement with the DSC results that show the highest T m and T c for sample EPR-3. At the same time the highest melt enthalpy is obtained for this sample.
The results from DSC and CRYSTAF showed that there are some differences between TREF fractions collected at the same temperatures. Both techniques suffer from cocrystallization effects and, therefore, these results are not completely conclusive.
A chromatographic technique, HT-HPLC, which sepa-rates and characterizes EP copolymers based on their ethylene contents was employed for a more conclusive microstructure analysis. This technique operates above the crystallization temperature of the samples and, there-fore, avoids the shortcomings of both DSC and CRYSTAF. Figure 6 shows the normalized results of the HT-HPLC experiments obtained with solvent gradient elution using a 1-decanol/TCB mobile phase. For the 30 and 60 °C TREF fractions all materials elute after the start of the solvent gradient. This indicates that the fractions contain only EP copolymer molecules and no iPP homopolymer.
The HPLC chromatograms of the 30 and 60 °C TREF fractions show that the peak maximum elution volume increases with increasing C 2 content of the bulk sample. Based on the present separation mechanism, increasing elution volumes mean increasing C 2 contents. This in turn means that TREF fractions from different samples that are collected at similar temperatures have different chemical compositions. This is very unusual at least for the 60 °C TREF fractions because for a long time it was believed that TREF fractions collected at similar temperatures have the same chemical compositions. A similar situation is observed for the 90 °C TREF fractions. The copolymer frac-tions eluting between 3 and 4 mL again appear in the order of increasing C 2 bulk content. Different from the 60 °C TREF fractions, these fractions contain small amounts of lower molar mass iPP that elute before the start of the gradient.
As is known from previous work, [ 26 ] the 130 °C TREF fractions consist mainly of lower and higher molar mass iPP. This can be seen by the characteristic elution pattern
Macromol. Chem. Phys. 2015, 216, 1619−1628
30 60 90 120 150
-0.6
-0.4
-0.2
0
0.2
0.4
0.6
0.8
Temperature (°C)
Heat
flow
(W
/g)
90 °C Fraction EPR-1
EPR-2
30 60 90 120 150
-1
0
1
2
Temperature (°C)
Heat
flow
(W
/g)
130 °C Fraction EPR-1
EPR-2
EPR-3
Figure 4. DSC curves for the TREF fractions of EPR samples showing fi rst cooling and second heating measurements at a scan rate of 10 °C min −1 , 90 °C fraction of EPR-3 was not analyzed due its low quantity.
Table 4. Thermal properties for TREF fractions of the EPR samples as obtained from fi rst cooling and second heating measurements of DSC with scan rate of 10 °C min −1 .
Sample name
TREF fraction
T m [°C]
T c [°C]
Δ H [J g −1 ]
EPR-1 90 153.17 102.98 17.11
130 154.36 110.60 68.25
EPR-2 90 153.55 102.13 18.02
130 154.95 110.98 69.04
EPR-3 130 158.99 114.80 74.75
Page 56
Stellenbosch University https://scholar.sun.ac.za
Stellenbosch University https://scholar.sun.ac.za
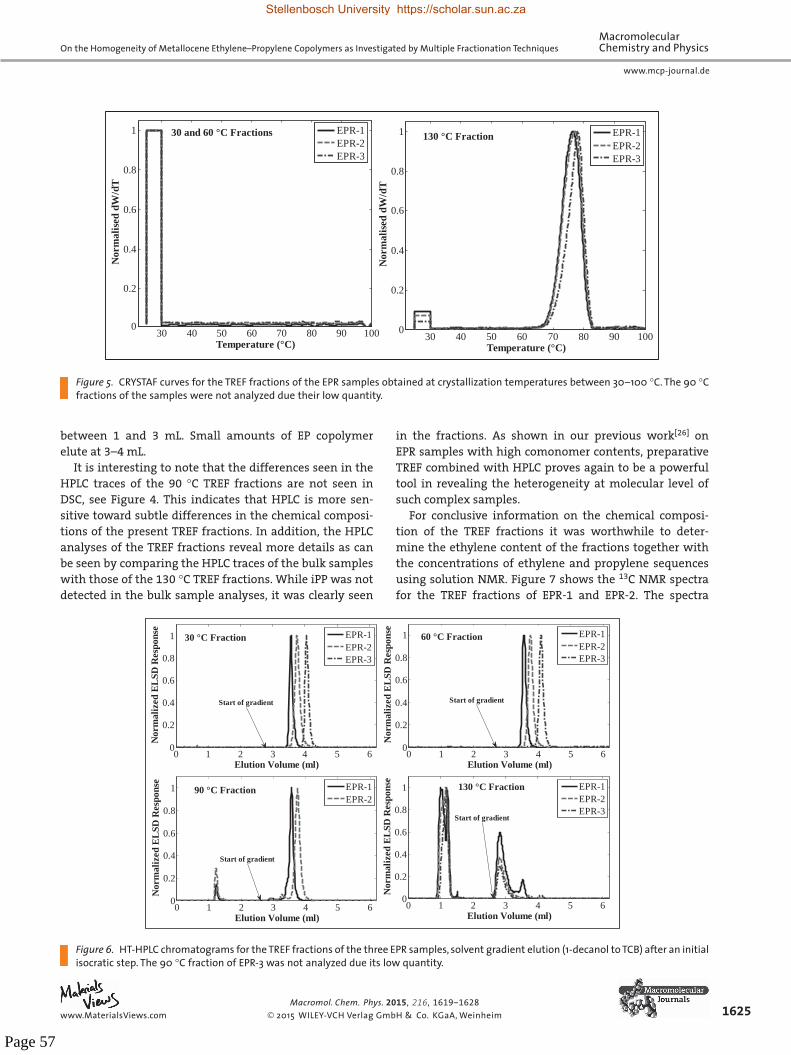
1625
On the Homogeneity of Metallocene Ethylene–Propylene Copolymers as Investigated by Multiple Fractionation Techniques
www.mcp-journal.de
MacromolecularChemistry and Physics
www.MaterialsViews.com © 2015 WILEY-VCH Verlag GmbH & Co. KGaA, Weinheim
between 1 and 3 mL. Small amounts of EP copolymer elute at 3–4 mL.
It is interesting to note that the differences seen in the HPLC traces of the 90 °C TREF fractions are not seen in DSC, see Figure 4 . This indicates that HPLC is more sen-sitive toward subtle differences in the chemical composi-tions of the present TREF fractions. In addition, the HPLC analyses of the TREF fractions reveal more details as can be seen by comparing the HPLC traces of the bulk samples with those of the 130 °C TREF fractions. While iPP was not detected in the bulk sample analyses, it was clearly seen
in the fractions. As shown in our previous work [ 26 ] on EPR samples with high comonomer contents, preparative TREF combined with HPLC proves again to be a powerful tool in revealing the heterogeneity at molecular level of such complex samples.
For conclusive information on the chemical composi-tion of the TREF fractions it was worthwhile to deter-mine the ethylene content of the fractions together with the concentrations of ethylene and propylene sequences using solution NMR. Figure 7 shows the 13 C NMR spectra for the TREF fractions of EPR-1 and EPR-2. The spectra
Macromol. Chem. Phys. 2015, 216, 1619−1628
30 40 50 60 70 80 90 1000
0.2
0.4
0.6
0.8
1
Temperature (°C)
No
rm
ali
sed
dW
/dT
30 and 60 °C Fractions EPR-1
EPR-2
EPR-3
30 40 50 60 70 80 90 1000
0.2
0.4
0.6
0.8
1
130 °C Fraction
Temperature (°C)
No
rm
ali
sed
dW
/dT
EPR-1
EPR-2
EPR-3
Figure 5. CRYSTAF curves for the TREF fractions of the EPR samples obtained at crystallization temperatures between 30–100 °C. The 90 °C fractions of the samples were not analyzed due their low quantity.
0 1 2 3 4 5 60
0.2
0.4
0.6
0.8
1
Elution Volume (ml)
esn
ops
eR
DS
LE
de
zila
mr
oN
30 °C Fraction EPR-1
EPR-2
EPR-3
0 1 2 3 4 5 60
0.2
0.4
0.6
0.8
1
60 °C Fraction
Elution Volume (ml)
No
rm
ali
zed
EL
SD
Resp
on
se EPR-1
EPR-2
EPR-3
0 1 2 3 4 5 60
0.2
0.4
0.6
0.8
1
Elution Volume (ml)
esn
ops
eR
DS
LE
de
zila
mr
oN
90 °C Fraction EPR-1
EPR-2
0 1 2 3 4 5 60
0.2
0.4
0.6
0.8
1
Elution Volume (ml)
No
rm
ali
zed
EL
SD
Resp
on
se
130 °C Fraction EPR-1
EPR-2
EPR-3
Start of gradient
Start of gradient
Start of gradient
Start of gradient
Figure 6. HT-HPLC chromatograms for the TREF fractions of the three EPR samples, solvent gradient elution (1-decanol to TCB) after an initial isocratic step. The 90 °C fraction of EPR-3 was not analyzed due its low quantity.
Page 57
Stellenbosch University https://scholar.sun.ac.za
Stellenbosch University https://scholar.sun.ac.za

1626
M. J. Phiri et al.
www.mcp-journal.de
MacromolecularChemistry and Physics
www.MaterialsViews.com© 2015 WILEY-VCH Verlag GmbH & Co. KGaA, Weinheim
were obtained at a temperature of 120 °C with acquisition times of 0.79 s. The TREF fractions collected at 130 °C show spectra with three major signals due to CH 2 (≈47 ppm), CH (≈29 ppm), and CH 3 (≈22 ppm). These spectra are entirely different from the spectra obtained for the lower TREF fractions. The assignment of the peaks, the comonomer content and the monomer sequences distributions were estimated based on the relationships established by both Ray et al. [ 36 ] and Randall. [ 37 ] The three distinct signals observed for the 130 °C TREF fractions correspond to the carbon atoms of the propylene repeating unit and, there-fore, these fractions can be assigned to iPP. These results are in good agreement with the HPLC results of 130 °C TREF fractions.
The numerous peaks observed for the 30 and 60 °C TREF fractions indicate that a variety of longer ethylene and propylene sequences are present in these fractions. The quantitative analysis of these segments is summa-rized in Table 5 .
More detailed information on the microstructure of the TREF fractions is obtained from the sequence analysis by 13 C NMR. The analysis of the 130 °C TREF fractions proves that these fractions are almost pure PP. The 30 and 60 °C TREF fractions contain a variety of ethylene–propylene sequences including longer PPP sequences. It is interesting to observe that there are no distinct differences between the 30 and the 60 °C TREF fraction in each sample. Com-paring the sequence distributions of different samples, a
Macromol. Chem. Phys. 2015, 216, 1619−1628
50 45 40 35 30 25 20
130 oC Fraction
60 oC Fraction
13C Chemical Shifts (ppm)
EPR-1
30 oC Fraction
50 45 40 35 30 25 20
130 oC Fraction
60 oC Fraction
30 oC Fraction
13C Chemical Shifts (ppm)
EPR-2
Figure 7. 13 C NMR spectra for the TREF fractions of the EPR-1 and EPR-2 obtained at high temperature (120 °C), the 90 °C fractions of the samples were not analyzed due their low quantity.
Table 5. 13 C NMR monomer and sequences distribution for the TREF fractions of three EPR samples.
Sample ID EPR-1 EPR-2 EPR-3
TREF fraction [°C] 30 60 130 30 60 130 30 60
P (%) 66.3 67.0 98.5 61.1 59.6 98.4 48.6 51.0
E (%) 33.7 33.0 1.5 38.9 40.4 1.6 51.4 49.0
PP (%) 45.5 46.7 98.5 36.7 37.6 98.4 23.9 25.2
PE + EP (%) 41.0 38.8 0.0 45.5 43.5 0.0 44.9 46.0
EE (%) 13.5 14.5 1.5 17.9 18.9 1.6 31.3 28.8
PPP (%) 30.2 32.7 98.5 20.1 22.3 98.4 11.7 12.0
PPE (%) 30.8 29.2 0.0 33.8 31.0 0.0 27.7 27.7
EPE (%) 5.3 5.1 0.0 7.2 6.3 0.0 9.1 11.3
EEE (%) 6.2 6.9 1.5 10.0 9.9 1.6 19.7 18.3
PEE (%) 16.9 16.6 0.0 18.2 19.3 0.0 21.7 20.6
PEP (%) 10.5 9.5 0.0 10.7 11.2 0.0 10.1 10.1
Page 58
Stellenbosch University https://scholar.sun.ac.za
Stellenbosch University https://scholar.sun.ac.za

1627
On the Homogeneity of Metallocene Ethylene–Propylene Copolymers as Investigated by Multiple Fractionation Techniques
www.mcp-journal.de
MacromolecularChemistry and Physics
www.MaterialsViews.com © 2015 WILEY-VCH Verlag GmbH & Co. KGaA, WeinheimMacromol. Chem. Phys. 2015, 216, 1619−1628
clear trend to ethylene-rich sequences (EEE, PEE) can be seen from sample EPR-1 to EPR-3 which correlates with the increasing ethylene content of the bulk samples.
In agreement with the HPLC results the NMR analyses show that TREF fractions from different samples taken at the same TREF temperature do not have the same composi-tion. With increasing ethylene contents of the bulk samples the corresponding TREF fractions also exhibit increasing ethylene contents. This is a clear proof of the previous state-ment that TREF is not an absolute fractionation method but depends on the composition of the sample.
4. Conclusions
Metallocene-catalyzed ethylene–propylene copolymers are assumed to exhibit single and narrow distributions in terms of molar mass, chemical composition, and sequence distributions. This statement was mainly based on the investigation of bulk samples.
The current study was aimed at examining how homogenous metallocene-catalyzed EP copolymers are based on multiple fractionation and analysis techniques. It was found that the present copolymers exhibit quite complex molecular compositions. The structural informa-tion that was obtained by advanced analytical methods goes far beyond the details that are obtained by bulk methods.
In a fi rst step, the EPR bulk samples were analyzed using various analytical techniques, namely, HT-SEC, DSC, FTIR, and HT-HPLC and rather narrow distributions in terms of molar mass and chemical composition were found for the samples. HT-HPLC was found to be very sen-sitive regarding the ethylene content of the samples.
Preparative TREF was conducted to obtain in depth knowledge about the molecular structure of the EPR samples. The resulting TREF fractions were analyzed by HT-SEC, DSC, CRYSTAF, HT-HPLC, and solution 13 C-NMR. The fractions showed homogenous distributions only in terms of molar mass, however, a signifi cant heterogeneity in chemical composition was found. In addition to a large variety of copolymer structures, signifi cant amounts of iPP were detected. HT-HPLC and 13 C-NMR proved to be the most useful techniques since they are able to analyze both amorphous and crystalline fractions.
The present fi ndings show that TREF is not an absolute technique that, for a given copolymer system, fraction-ates independently of the bulk sample composition. The combination of various analytical techniques proved to be a necessary tool in understanding the molecular struc-ture of these complex EPR copolymers.
Acknowledgements: The authors thank SASOL, South Africa, and Lummus Novolen Technology GmbH, Germany, for the
fi nancial support of this work. The high temperature 13 C NMR measurements done by Dr. J. Brand and E. Malherbe are gratefully acknowledged.
Received: April 10, 2015 ; Revised: May 27, 2015 ; Published online: June 18, 2015 ; DOI: 10.1002/macp.201500135
Keywords: differential scanning calorimetry ; ethylene–propylene copolymers ; high-temperature HPLC ; metallocene catalyst ; NMR ; temperature rising elution fractionation
[1] C. H. Stephens , B. C. Poon , P. Ansems , S. P. Chum , A. Hiltner , E. Baer , J. Appl. Polym. Sci. 2006 , 100 , 1651 .
[2] C. Piel , F. G. Karssenberg , W. Kaminsky , V. B. F. Mathot , Macromolecules 2005 , 38 , 6789 .
[3] A. Shamiri , M. H. Chakrabarti , S. Jahan , M. A. Hussain , W. Kaminsky , P. V. Aravind , W. A. Yehye , Materials 2014 , 7 , 5069 .
[4] C. Gabriel , E. Kokko , B. Löfgren , J. Seppälä , H. Münstedt , Polymer 2002 , 43 , 6383 .
[5] K. Jeon , Y. L. Chiari , R. G. Alamo , Macromolecules 2008 , 41 , 95 .
[6] C. Kock , N. Aust , C. Grein , M. Gahleitner , J. Appl. Polym. Sci. 2013 , 130 , 287 .
[7] C. Kock , M. Gahleitner , A. Schausberger , E. Ingolic , J. Appl. Polym. Sci. 2012 , 128 , 1484 .
[8] M. Pires , R. S. Mauler , S. A. Liberman , J. Appl. Polym. Sci. 2004 , 92 , 2155 .
[9] Z. Fu , J. Xu , Y. Zhang , Z. Fan , J. Appl. Polym. Sci. 2005 , 97 , 640 . [10] G. Liu , X. Zhang , Y. Liu , X. Li , H. Chen , K. Walton ,
G. Marchand , D. Wang , Polymer 2013 , 54 , 1440 . [11] T. Macko , H. Pasch , Macromolecules 2009 , 42 , 6063 . [12] H. Pasch , R. Brüll , U. Wahner , B. Monrabal , Macromol. Mater.
Eng. 2000 , 279 , 46 . [13] S. Cheruthazhekatt , G. W. Harding , H. Pasch , J. Chromatogr.
A 2013 , 1286 , 69 . [14] P. Stepan , J. Appl. Polym. Sci. 2013 , 131 , 40111 . [15] T. MacKo , A. Ginzburg , K. Remerie , R. Brüll , Macromol. Chem.
Phys. 2012 , 213 , 937 . [16] S. Cheruthazhekatt , H. Pasch , Anal. Bioanal. Chem. 2013 ,
405 , 8607 . [17] A. Tynys , I. Fonseca , M. Parkinson , L. Resconi , Macromol-
ecules 2012 , 45 , 7704 . [18] V. Agarwal , T. B. Van Erp , L. Balzano , M. Gahleitner ,
M. Parkinson , L. E. Govaert , V. Litvinov , A. P. M. Kentgens , Polymer 2014 , 55 , 896 .
[19] S. Cheruthazhekatt , T. F. J. Pijpers , G. W. Harding , V. B. F. Mathot , H. Pasch , Macromolecules 2012 , 45 , 2025 .
[20] J. B. P. Soares , S. Anantawaraskul , J. Polym. Sci., Part B: Polym. Phys. 2005 , 43 , 1557 .
[21] B. Monrabal , L. Romero , Macromol. Chem. Phys. 2014 , 215 , 1818 .
[22] B. Monrabal , P. Del Hierro , Anal. Bioanal. Chem. 2011 , 399 , 1557 .
[23] Y. Xue , Y. Fan , S. Bo , X. Ji , Eur. Poly. J. 2011 , 47 , 1646 . [24] N. Aust , M. Gahleitner , K. Reichelt , B. Raninger , Polym. Test.
2006 , 25 , 896 . [25] E. De Goede , P. Mallon , H. Pasch , Macromol. Mater. Eng.
2010 , 295 , 366 . [26] M. J. Phiri , S. Cheruthazhekatt , A. Dimeska , H. Pasch ,
J. Polym. Sci., Part A: Polym. Chem. 2015 , 53 , 863 .
Page 59
Stellenbosch University https://scholar.sun.ac.za
Stellenbosch University https://scholar.sun.ac.za

1628
M. J. Phiri et al.
www.mcp-journal.de
MacromolecularChemistry and Physics
www.MaterialsViews.com© 2015 WILEY-VCH Verlag GmbH & Co. KGaA, WeinheimMacromol. Chem. Phys. 2015, 216, 1619−1628
[27] A. Albrecht , L. C. Heinz , D. Lilge , H. Pasch , Macromol. Symp. 2007 , 257 , 46 .
[28] A. Ginzburg , T. MacKo , V. Dolle , R. Brüll , Eur. Polym. J. 2011 , 47 , 319 .
[29] H. Pasch , M. I. Malik , T. Macko , Adv. Polym. Sci. 2013 , 251 , 77 .
[30] S. Cheruthazhekatt , N. Mayo , B. Monrabal , H. Pasch , Macromol. Chem. Phys. 2013 , 214 , 2165 .
[31] T. MacKo , R. Brüll , Y. Zhu , Y. Wang , J. Sep. Sci. 2010 , 33 , 3446 .
[32] D. Mekap , T. MacKo , R. Brüll , R. Cong , A. W. deGroot , A. Parrott , P. J. C. H. Cools , W. Yau , Polymer 2013 , 54 , 5518 .
[33] R. Chitta , A. Ginzburg , T. MacKo , R. Brüll , G. Van Doremaele , LC·GC Eur. 2012 , 25 , 352 .
[34] R. Chitta , T. MacKo , R. Brüll , G. Van Doremaele , L. C. Heinz , J. Polym. Sci., Part A: Polym. Chem. 2011 , 49 , 1840 .
[35] T. MacKo , R. Brüll , Y. Wang , B. Coto , I. Suarez , J. Appl. Polym. Sci. 2011 , 122 , 3211 .
[36] G. J. Ray , P. E. Johnson , J. R. Knox , Macromolecules 1977 , 10 , 773 . [37] J. C. Randall , Macromolecules 1978 , 11 , 33 .
Page 60
Stellenbosch University https://scholar.sun.ac.za
Stellenbosch University https://scholar.sun.ac.za

Page 61
Chapter6:CompositionalHeterogeneityofVis-brokenIPC
6 Exploring the Compositional Heterogeneity of Vis-broken Impact
Polypropylene Copolymers using Advanced Fractionation Methods
This chapter presents the research work done on the fractionation and characterization of vis-
broken impact polypropylene copolymers (IPC) using various analytical techniques. Four vis-
broken IPC samples were used to study the effect of an organic peroxide on the molecular
properties of the IPC materials. In conclusion, an effective multidimensional analytical
approach was established in the present study to explore compositional heterogeneities in the
vis-broken IPC materials. This work is prepared for publication and the manuscript is attached.
6.1 Summary of the Research Study
Vis-broken impact polypropylene copolymers (IPC) are known to have decreased molar masses
and melt viscosities due to the action of organic peroxides during the vis-breaking process1-3. An
increase in the melt flow rates of the vis-broken IPC is related to their high solubility properties4
due to changes in chemical composition. There is limited previous work done to evaluate the
effect of the peroxide on the microstructural properties of the vis-broken IPC materials.
Therefore, the aim of the present study was to explore the molecular composition of vis-broken
IPC using multiple fractionation techniques. Scheme 1 presents the general mechanism for the
degradation of ethylene-propylene (EP) copolymers under the influence of a peroxide5,6. For
illustration purposes, the scheme is based on the attack at the propylene units. The final products
from the degradation depend mainly on the type of polymer, type and concentration of peroxide
and presence of other additives5.
Thermal decomposition of the peroxide to form radicals
Formation of the new polymer radicals via peroxide attack
R O O R R O R O+
CH3 CH CH3
CH3 CH3 CH3 + R OCH3 C CH3
CH3 CH3 CH3
+ R OH
Stellenbosch University https://scholar.sun.ac.za
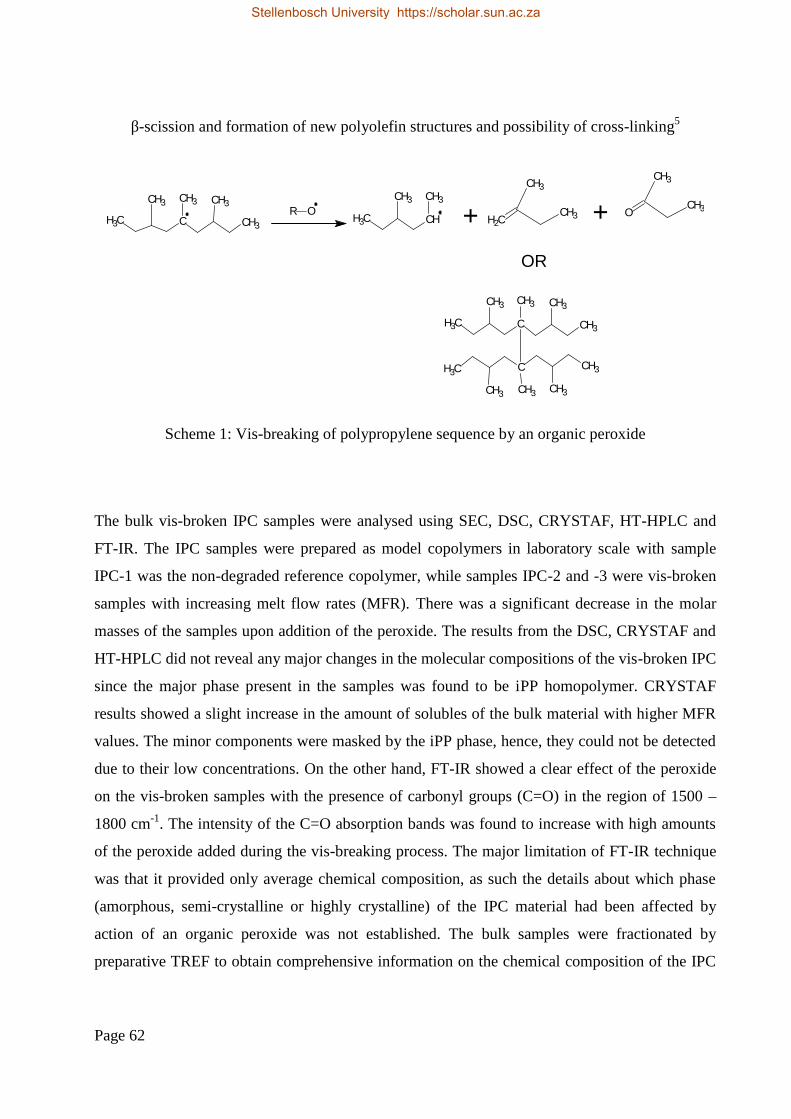
Page 62
β-scission and formation of new polyolefin structures and possibility of cross-linking5
Scheme 1: Vis-breaking of polypropylene sequence by an organic peroxide
The bulk vis-broken IPC samples were analysed using SEC, DSC, CRYSTAF, HT-HPLC and
FT-IR. The IPC samples were prepared as model copolymers in laboratory scale with sample
IPC-1 was the non-degraded reference copolymer, while samples IPC-2 and -3 were vis-broken
samples with increasing melt flow rates (MFR). There was a significant decrease in the molar
masses of the samples upon addition of the peroxide. The results from the DSC, CRYSTAF and
HT-HPLC did not reveal any major changes in the molecular compositions of the vis-broken IPC
since the major phase present in the samples was found to be iPP homopolymer. CRYSTAF
results showed a slight increase in the amount of solubles of the bulk material with higher MFR
values. The minor components were masked by the iPP phase, hence, they could not be detected
due to their low concentrations. On the other hand, FT-IR showed a clear effect of the peroxide
on the vis-broken samples with the presence of carbonyl groups (C=O) in the region of 1500 –
1800 cm-1. The intensity of the C=O absorption bands was found to increase with high amounts
of the peroxide added during the vis-breaking process. The major limitation of FT-IR technique
was that it provided only average chemical composition, as such the details about which phase
(amorphous, semi-crystalline or highly crystalline) of the IPC material had been affected by
action of an organic peroxide was not established. The bulk samples were fractionated by
preparative TREF to obtain comprehensive information on the chemical composition of the IPC
CH3 C CH3
CH3 CH3 CH3
CH3 CH
CH3 CH3
+ CH2CH3
CH3
CH3 C CH3
CH3 CH3 CH3
CH3CCH3
CH3CH3CH3
OR
+ OCH3
CH3
R O
Stellenbosch University https://scholar.sun.ac.za
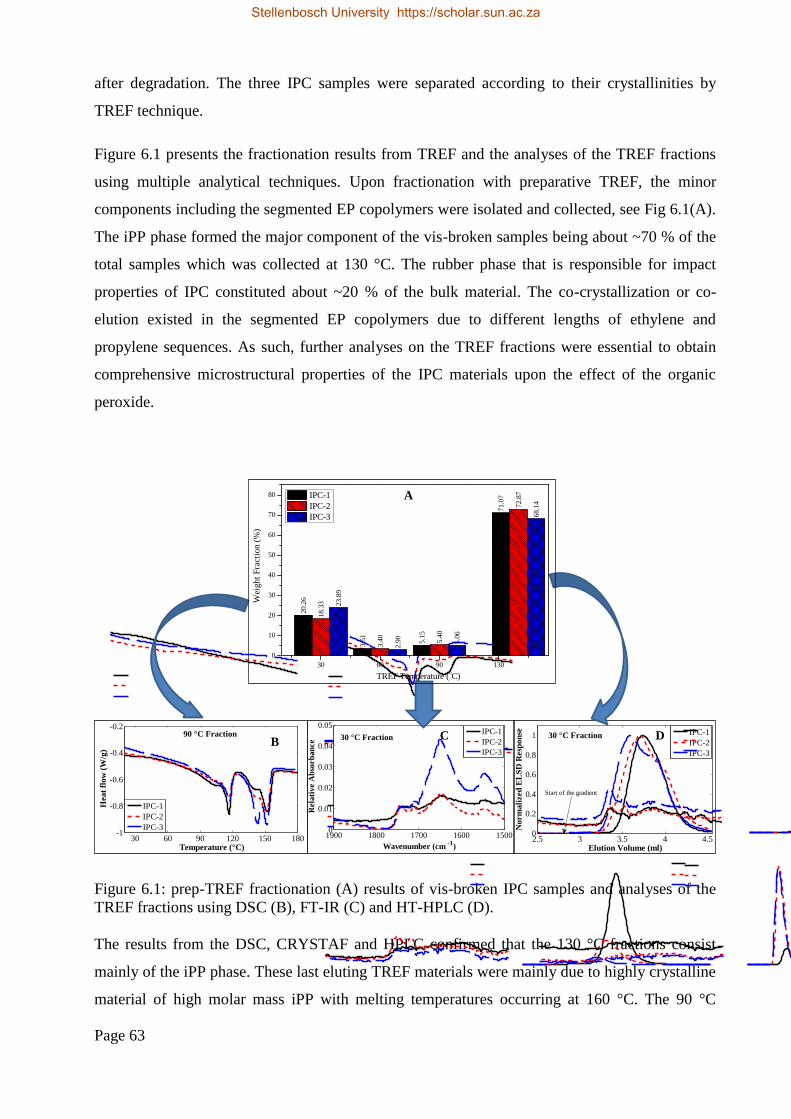
Page 63
after degradation. The three IPC samples were separated according to their crystallinities by
TREF technique.
Figure 6.1 presents the fractionation results from TREF and the analyses of the TREF fractions
using multiple analytical techniques. Upon fractionation with preparative TREF, the minor
components including the segmented EP copolymers were isolated and collected, see Fig 6.1(A).
The iPP phase formed the major component of the vis-broken samples being about ~70 % of the
total samples which was collected at 130 °C. The rubber phase that is responsible for impact
properties of IPC constituted about ~20 % of the bulk material. The co-crystallization or co-
elution existed in the segmented EP copolymers due to different lengths of ethylene and
propylene sequences. As such, further analyses on the TREF fractions were essential to obtain
comprehensive microstructural properties of the IPC materials upon the effect of the organic
peroxide.
Figure 6.1: prep-TREF fractionation (A) results of vis-broken IPC samples and analyses of theTREF fractions using DSC (B), FT-IR (C) and HT-HPLC (D).
The results from the DSC, CRYSTAF and HPLC confirmed that the 130 °C fractions consist
mainly of the iPP phase. These last eluting TREF materials were mainly due to highly crystalline
material of high molar mass iPP with melting temperatures occurring at 160 °C. The 90 °C
2.5 3 3.5 4 4.50
0.2
0.4
0.6
0.8
1
Elution Volume (ml)
Nor
mal
ized
EL
SD R
espo
nse
30 °C Fraction IPC-1IPC-2IPC-3
2.5 3 3.5 4 4.50
0.2
0.4
0.6
0.8
1
Elution Volume (ml)
Nor
mal
ized
EL
SD R
espo
nse
60 °C Fraction IPC-1IPC-2IPC-3
2.5 3 3.5 4 4.50
0.1
0.2
0.3
0.4
Elution Volume (ml)
Nor
mal
ized
EL
SD R
espo
nse
90 °C Fraction IPC-1IPC-2IPC-3
2.5 3 3.5 4 4.50
0.2
0.4
0.6
0.8
1
Elution Volume (ml)
Nor
mal
ized
EL
SD R
espo
nse
130 °C Fraction IPC-1IPC-2IPC-3
Start of the gradient
Start of the gradient
Start of the gradientStart of the gradient
30 60 90 120 150 180-0.8
-0.6
-0.4
-0.2
Temperature (°C)
Hea
t fl
ow (
W/g
)
30 °C Fraction
IPC-1IPC-2IPC-3
30 60 90 120 150 180-0.8
-0.6
-0.4
-0.2
Temperature (°C)
Hea
t fl
ow (
W/g
)
60 °C Fraction
IPC-1IPC-2IPC-3
30 60 90 120 150 180-1
-0.8
-0.6
-0.4
-0.2
Temperature (°C)
Hea
t fl
ow (
W/g
)
90 °C Fraction
IPC-1IPC-2IPC-3
30 60 90 120 150 180-2.5
-2
-1.5
-1
-0.5
0
Temperature (°C)
Hea
t fl
ow (
W/g
)
130 °C Fraction
IPC-1IPC-2IPC-3
150016001700180019000
0.01
0.02
0.03
0.04
0.05
Wavenumber (cm -1)
Rel
ativ
e A
bsor
banc
e 30 °C FractionIPC-1IPC-2IPC-3
150016001700180019000
0.01
0.02
0.03
0.04
0.05
Wavenumber (cm -1)
Rel
ativ
e A
bsor
banc
e
60 °C Fraction IPC-1IPC-2IPC-3
150016001700180019000
0.01
0.02
0.03
0.04
0.05
Wavenumber (cm -1)
Rel
ativ
e A
bsor
banc
e 90 °C FractionIPC-1IPC-2IPC-3
150016001700180019000
0.01
0.02
0.03
0.04
0.05
Wavenumber (cm -1)
Rel
ativ
e A
bsor
banc
e
130 °C Fraction IPC-1IPC-2IPC-3
20.2
6
3.51 5.15
71.0
7
18.3
3
3.40 5.
40
72.8
7
23.8
9
2.90 5.
06
68.1
4
30 60 90 1300
10
20
30
40
50
60
70
80
Wei
ght F
ract
ion
(%)
TREF Temperature (oC)
IPC-1IPC-2IPC-3
A
DCB
Stellenbosch University https://scholar.sun.ac.za
Page 64
TREF fractions were found to contain segmented EP copolymers having complex molecular
compositions as indicated by multiple melting peaks from the DSC analyses, see Fig. 6.1(B).
The DSC peaks were assigned to ethylene-rich copolymers at ~120 °C, propylene-rich
copolymers at ~140 °C and low molar mass iPP with low isotacticity at ~150 °C. The melting
peaks at 140 – 150 °C were more pronounced with an increase in amount of peroxide during the
degradation process. FT-IR analyses revealed that the 30 °C TREF fractions contain the highest
amount of products of the degradation process as indicated by the carbonyl spectral region.
Figure 6.1(C) shows that the number of the carbonyl products increases with the amount of the
peroxide added to the IPC samples. Absorption peaks at 1750 cm-1 and 1650 cm-1 were due to
the presence of C=O stretches from the conjugated aldehydes and ketones, respectively, whereas
peaks at 1550 cm-1 had resulted from C=C stretching. The concentration of the carbonyl products
decreases with increase in TREF elution temperature. The 130 °C TREF fractions had no
detectable amounts of carbonyl products.
HT-HPLC gave more insight into the effect of the peroxide on the chemical composition
changes of the IPC samples since detailed information on the molecular structures of the samples
can be obtained from the technique. The 30 °C TREF fractions contained only the random EP
copolymer since all the samples eluted after the start of the gradient with TCB. It was found that
the elution volumes of the samples on the graphitic stationary phase shift to lower values as
depicted in Fig. 6.1(D). The HPLC chromatograms indicated that these fractions do not contain
any PP components as these would appear at elution volumes of 3 mL or lower, compare to
elution patterns of the 60, 90 and 130 °C TREF fractions. The 60 and 90 °C TREF fractions have
three distinct chemical compositions namely low molar mass iPP at 1.3 mL, segmented EP
copolymers between 3 – 4.5 mL and ethylene-rich copolymer between 5 – 6.5 mL. The results
are similar to DSC analyses since they showed that these two set of fractions have complex
molecular compositions. In comparison to the DSC and CRYSTAF techniques, HT-HPLC was
able to characterize both amorphous and crystalline fractions of the vis-broken IPC samples.
In conclusion, upon vis-breaking the amount of the 30 °C TREF fractions increases indicating
that additional soluble material is produced through chain scission. The present study has proved
that an effective multidimensional analytical approach is necessary to explore the compositional
heterogeneities of the vis-broken IPC materials. A better understanding of the vis-breaking
process was attained through the current study.
Stellenbosch University https://scholar.sun.ac.za

Page 65
6.2 References
1. M. Swart, A. J. van Reenen. Journal of Applied Polymer Science 2015, 132, 41783.
2. E. de Goede, P. E. Mallon, K. Rode, H. Pasch. Macromolecular Materials and Engineering2011, 296, 1018-1027.
3. H. Pasch, E. de Goede, P. Mallon. Macromolecular Symposia 2012, 312, 174-190.
4. E. de Goede, P. E. Mallon, H. Pasch. Macromolecular Materials and Engineering 2012, 297,26-38.
5. P. R. Dluzneski. Rubber Chemistry and Technology 2001, 74, 451.
6. G. Moad, I. J. Dagley, J. Habsuda, C. J. Garvey, G. Li, L. Nichols, G. P. Simon, M. R. Nobile.Polymer Degradation and Stability 2015, 117, 97-108.
Stellenbosch University https://scholar.sun.ac.za

Page 66
Exploring the Compositional Heterogeneity of Vis-broken Impact Polypropylene Copolymers byAdvanced Fractionation Methods
Mohau Justice Phiri1, Harald Pasch1*
1 Stellenbosch University, Department of Chemistry and Polymer Science, 7602 Matieland, South Africa* Corresponding author: [email protected]
Abstract
Vis-breaking or rheology control is an important technical process to improve the processability of impact polypropylenecopolymers (IPC). In the vis-breaking process the molar mass and its dispersity are reduced, the crystallinity changes andpolar carbonyl functionalities are introduced due to the reaction of the polymer with peroxide. Although the fundamentalprinciples of vis-breaking are well understood, not much research has been devoted to the investigation of the molecularchanges brought about by the vis-breaking process. In the present study, the effect of vis-breaking on the molecularproperties of IPC is elucidated using advanced fractionation methods. After the analysis of the bulk sample properties, thesamples are fractionated using preparative TREF and the fractions are analysed by FTIR, DSC, CRYSTAF and HT-HPLCtechniques. For the first time, an effective multidimensional analytical approach is established to study compositionalheterogeneities in vis-broken IPC materials.
Keywords: Impact polypropylene copolymers, vis-breaking process, preparative TREF, FTIR, high-temperature HPLC
1. Introduction
Impact polypropylene copolymers (IPC) have been usedextensively for many applications in the automotive andelectrical appliances industries [1-4] since these materials havesuperior properties over traditional polypropylene (PP)materials due their multiphase morphology where ethylene-propylene rubber particles are incorporated in an isotacticpolypropylene (i-PP) matrix [1, 5-10]. As such, IPC materialshave increased impact strengths and tensile-fractureproperties as compared to i-PP. Hence, they can be used alsofor low temperature applications [11, 12]. One very feasibleapproach for increasing the melt flow rate of IPC is the socalled ’vis-breaking’ or controlled rheology process.Numerous studies have shown that the vis-breaking processcan be applied to IPC to decrease the average molar mass andto reduce the molar mass dispersity. Longer polymer chainsare broken down to shorter chains with the help of peroxides[13-16]. The vis-broken IPC materials have higher melt flowrates, hence e.g. filling of the narrow cavity molds ininjection molding applications is facilitated [13].
The complex molecular characteristics of IPC have beeninvestigated in many studies [17-20]. However, the effect of theperoxide in the vis-breaking process makes these materialseven more complex in terms of molar mass distribution(MMD) and chemical composition distribution (CCD) [11, 16].The need to understand how the peroxide affects themicrostructure of these complex copolymers is critical in
determining the final applicability and properties of the vis-broken materials. Several studies have been conducted usinghigh temperature size exclusion chromatography (HT-SEC)to prove that the vis-broken IPCs exhibit reduced molarmasses and MMDs [11, 13, 14, 16, 21]. Swart and van Reenen [11]
studied vis-broken IPC bulk materials and their TREFfractions using 13C NMR and SEC coupled to FTIRspectroscopy. Based on the 13C NMR analysis of the TREFfractions they showed that the vis-breaking process affectsmainly copolymers with long ethylene sequences. DSCanalyses have revealed multiple endotherms due to presenceof carbonyl-containing products that formed during thedegradation process [16]. Similar results were observed withCRYSTAF analysis of vis-broken IPCs [13, 16]. However, asshown in our previous work [22], crystallisation-basedtechniques are not sufficient to provide comprehensive CCDinformation on these complex materials since thesetechniques cannot address the compositional heterogeneity ofthe amorphous part. Recently, comprehensive solvent-gradient high temperature HPLC which can analyse both thecrystalline and amorphous materials has been used toseparate and characterise complex IPCs [19, 23-30].
As has been pointed out by different authors, the effect ofvis-breaking on the molecular characteristics and themicrostructure of IPC is still largely unexplored [11, 31]. Inparticular, advanced fractionation techniques such as HT-HPLC have never been used to characterise the vis-breakingprocess. In this study, IPC materials were vis-broken to
Stellenbosch University https://scholar.sun.ac.za
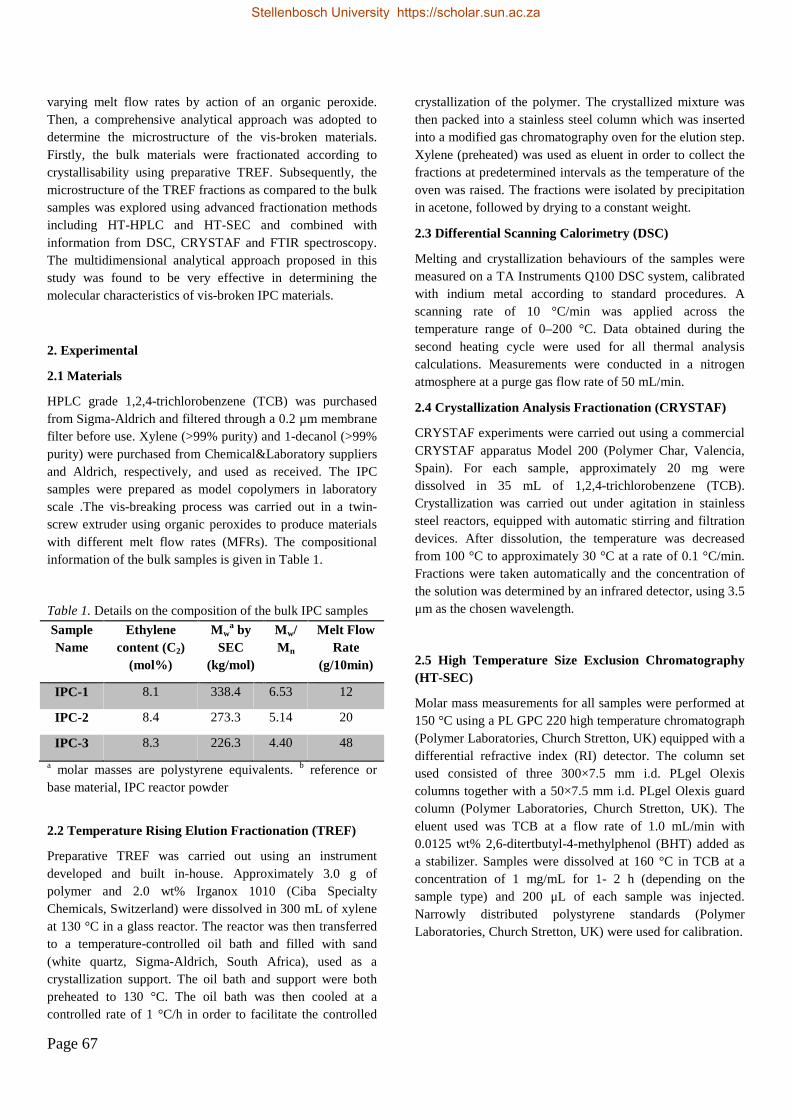
Page 67
varying melt flow rates by action of an organic peroxide.Then, a comprehensive analytical approach was adopted todetermine the microstructure of the vis-broken materials.Firstly, the bulk materials were fractionated according tocrystallisability using preparative TREF. Subsequently, themicrostructure of the TREF fractions as compared to the bulksamples was explored using advanced fractionation methodsincluding HT-HPLC and HT-SEC and combined withinformation from DSC, CRYSTAF and FTIR spectroscopy.The multidimensional analytical approach proposed in thisstudy was found to be very effective in determining themolecular characteristics of vis-broken IPC materials.
2. Experimental
2.1 Materials
HPLC grade 1,2,4-trichlorobenzene (TCB) was purchasedfrom Sigma-Aldrich and filtered through a 0.2 µm membranefilter before use. Xylene (>99% purity) and 1-decanol (>99%purity) were purchased from Chemical&Laboratory suppliersand Aldrich, respectively, and used as received. The IPCsamples were prepared as model copolymers in laboratoryscale .The vis-breaking process was carried out in a twin-screw extruder using organic peroxides to produce materialswith different melt flow rates (MFRs). The compositionalinformation of the bulk samples is given in Table 1.
Table 1. Details on the composition of the bulk IPC samples
SampleName
Ethylenecontent (C2)
(mol%)
Mwa by
SEC(kg/mol)
Mw/Mn
Melt FlowRate
(g/10min)
IPC-1 8.1 338.4 6.53 12
IPC-2 8.4 273.3 5.14 20
IPC-3 8.3 226.3 4.40 48
a molar masses are polystyrene equivalents. b reference orbase material, IPC reactor powder
2.2 Temperature Rising Elution Fractionation (TREF)
Preparative TREF was carried out using an instrumentdeveloped and built in-house. Approximately 3.0 g ofpolymer and 2.0 wt% Irganox 1010 (Ciba SpecialtyChemicals, Switzerland) were dissolved in 300 mL of xyleneat 130 °C in a glass reactor. The reactor was then transferredto a temperature-controlled oil bath and filled with sand(white quartz, Sigma-Aldrich, South Africa), used as acrystallization support. The oil bath and support were bothpreheated to 130 °C. The oil bath was then cooled at acontrolled rate of 1 °C/h in order to facilitate the controlled
crystallization of the polymer. The crystallized mixture wasthen packed into a stainless steel column which was insertedinto a modified gas chromatography oven for the elution step.Xylene (preheated) was used as eluent in order to collect thefractions at predetermined intervals as the temperature of theoven was raised. The fractions were isolated by precipitationin acetone, followed by drying to a constant weight.
2.3 Differential Scanning Calorimetry (DSC)
Melting and crystallization behaviours of the samples weremeasured on a TA Instruments Q100 DSC system, calibratedwith indium metal according to standard procedures. Ascanning rate of 10 °C/min was applied across thetemperature range of 0–200 °C. Data obtained during thesecond heating cycle were used for all thermal analysiscalculations. Measurements were conducted in a nitrogenatmosphere at a purge gas flow rate of 50 mL/min.
2.4 Crystallization Analysis Fractionation (CRYSTAF)
CRYSTAF experiments were carried out using a commercialCRYSTAF apparatus Model 200 (Polymer Char, Valencia,Spain). For each sample, approximately 20 mg weredissolved in 35 mL of 1,2,4-trichlorobenzene (TCB).Crystallization was carried out under agitation in stainlesssteel reactors, equipped with automatic stirring and filtrationdevices. After dissolution, the temperature was decreasedfrom 100 °C to approximately 30 °C at a rate of 0.1 °C/min.Fractions were taken automatically and the concentration ofthe solution was determined by an infrared detector, using 3.5μm as the chosen wavelength.
2.5 High Temperature Size Exclusion Chromatography(HT-SEC)
Molar mass measurements for all samples were performed at150 °C using a PL GPC 220 high temperature chromatograph(Polymer Laboratories, Church Stretton, UK) equipped with adifferential refractive index (RI) detector. The column setused consisted of three 300×7.5 mm i.d. PLgel Olexiscolumns together with a 50×7.5 mm i.d. PLgel Olexis guardcolumn (Polymer Laboratories, Church Stretton, UK). Theeluent used was TCB at a flow rate of 1.0 mL/min with0.0125 wt% 2,6-ditertbutyl-4-methylphenol (BHT) added asa stabilizer. Samples were dissolved at 160 °C in TCB at aconcentration of 1 mg/mL for 1- 2 h (depending on thesample type) and 200 μL of each sample was injected.Narrowly distributed polystyrene standards (PolymerLaboratories, Church Stretton, UK) were used for calibration.
Stellenbosch University https://scholar.sun.ac.za

Page 68
2.6 High Temperature High Performance LiquidChromatography (HT-HPLC)
The separations were conducted on a high temperaturesolvent gradient interaction chromatograph (SGIC)constructed by Polymer Char (Valencia, Spain), comprisingof an autosampler, two separate ovens, switching valves andtwo pumps equipped with vacuum degassers (Agilent,Waldbronn, Germany). One oven was used for the HPLCcolumn, while the second oven is the location of the injectorand a switching valve. The autosampler was a separate unitconnected to the injector through a heated transfer line. Ahigh-pressure binary gradient pump was used for HPLC inthe first dimension.
An evaporative light scattering detector (ELSD, model PL-ELS 1000, Polymer Laboratories, Church Stretton, England)was used with the following parameters: a gas flow rate of1.5 L/min, a nebuliser temperature of 160 °C, and anevaporator temperature of 270 °C. HT-HPLC was carried outusing a Hypercarb column (Hypercarb®, Thermo Scientific,Dreieich, Germany) with the following parameters: 100×4.6mm i.d., packed with porous graphite particles with a particlediameter of 5μm, a surface area of 120 m2/g, and a pore sizeof 250 Å. The flow rate of the mobile phase was 0.5 mL/min.The column was placed in the column oven maintained at160 °C. The HPLC separations were accomplished byapplying a linear gradient from 1-decanol to TCB. Thevolume fraction of TCB was linearly increased to 100%within 10 min after the sample injection and then heldconstant for 25 min. Finally, the initial chromatographicconditions were re-established with 100% 1-decanol. Thedwell and void volumes of 1.7 mL and 1.1 mL, respectively,were measured according to the method described byGinzburg et al. [32]. This reflects that there is an isocraticelution of 1-decanol (1.7 mL) before the gradient hits thecolumn [17, 33]. Samples were injected at a concentration of 1-1.2 mg/mL, with 20 µL of each sample being injected.
2.7 Fourier Transform Infrared Spectroscopy (FTIR)
FTIR analyses of the samples were performed on a ThermoNicolet iS10 Spectrometer (Thermo Scientific, Waltham,MA). Spectra were recorded at a resolution of 8 cm-1 with 16scans being recorded for each spectrum. Thermo ScientificOMNIC software (version 8.1) was used for data collectionand processing.
3. Results and Discussion
The present study demonstrates the usefulness of variousadvanced analytical techniques to investigate the correlationbetween molecular properties and the effect of the organicperoxide in the vis-breaking process. Vis-breaking is
considered to be a very complex process that, upon the actionof a peroxide, reduces the molar mass of the sample andintroduces oxygen functionalities into the polymer structure.It can schematically be presented as shown in Scheme 1 [34,
35].
Thermal decomposition of the peroxide to form radicals
R O O R R O R O
Formation of the new polymer radicals via peroxide attack
CH3 CH CH3
CH3 CH3 CH3 + R OCH3 C CH3
CH3 CH3 CH3
+ R OH
Formation of the new polyolefin materials [36]
CH3 C CH3
CH3 CH3 CH3
CH3 CH
CH3 CH3
+ CH2CH3
CH3
CH3 C CH3
CH3 CH3 CH3
CH3CCH3
CH3CH3CH3
+ OCH3
CH3
R O
CH3 CH
CH3 CH3R OCH3 C CH3
CH3 CH3 CH3
CH3 C CH3
CH3 CH3 CH3
CH3 C CH3
CH3 CH3 CH3
+
R OH
R OH
+
+
Scheme 1: Vis-breaking of an ethylene-propylene copolymerby an organic peroxide
Although vis-breaking is considered to be a mature technicalprocess for impact polypropylene copolymers (IPC), thechanges in the molecular structure of the IPC have not beeninvestigated in detail. Most of the investigations so far havebeen conducted on bulk samples and only standard analyticaltechniques have been used.
In the present analytical protocol, only the first step is theanalysis of the bulk samples (see Table 1) which is thenfollowed by TREF fractionation and the detailed analysis ofthe TREF fractions. The newly developed high-temperatureHPLC technique will provide new insight into the structure ofthe vis-broken materials being able to provide information onboth the amorphous and the crystalline fractions. SampleIPC-1 is the non-degraded reference copolymer, whilesamples IPC-2, and -3 are vis-broken samples with increasingmelt flow rates.
The molar masses of the reference and the vis-brokensamples shown in Table 1 are consistent with what has beenreported by other authors in that vis-breaking decreases molarmass and molar mass dispersity [11, 13, 16]. From an originalvalue of 326 kg/mol the molar mass decreases to 226 kg/molfor a sample with a MFR of 48. As can be seen in Table 1,the molar mass dispersity decreases with MFR indicating thatpolymer chain scission occurs statistically. The fact that themolar mass decreases by only 30% indicates that chain
Stellenbosch University https://scholar.sun.ac.za

Page 69
scission takes places not for all polymer chain and themolecular structure will change only gradually. This isconfirmed by the DSC and CRYSTAF traces shown in Fig. 1.
Figure 1. Bulk analysis of the samples by DSC (A) andCRYSTAF (B), DSC curves represent first crystallization.
The DSC and CRYSTAF crystallization curves give a firstindication on compositional changes as a result of thevisbreaking process. The DSC crystallization curve for thenon-degraded IPC-1 shows a relatively broad crystallizationrange that stretches from about 30 to 130 oC. Slightlynarrower crystallization ranges are obtained for the degradedsamples IPC-2 and -3, however, there is not much differenceseen between the non-degraded and the degraded samples.The CRYSTAF curves in Fig. 1B show that most of the semi-crystalline material crystallizes at a temperature around 80oC. This material can be assigned to the isotacticpolypropylene (iPP) matrix. The rubber phase that iscomposed of a variety of random ethylene-propylenecopolymers does not crystallize but appears at 30 oC as thesoluble fraction. While there only a slight shift seen in thepeak crystallization temperatures for the crystallizingfractions, the weight percentage of the soluble fractionincreases from IPC-1 to IPC-3. IPC-3 is the most degradedsample having the highest MFR and the lowest molar mass. Itcontains the polymer molecules that underwent chain scissionand (probably) functionalization. This is in agreement withthe slight shift of the peak crystallization temperatures tolower values from sample IPC-1 to IPC-3.
It is known from previous investigations that the iPP matrixis most susceptible to thermo-oxidative degradation ascompared to the EP rubber phase[12-14]. It is, therefore, likelythat the increase of the soluble fraction as seen in CRYSTAFis due to chain scission of iPP resulting in short(functionalized) polypropylene chains that do not crystallizein CRYSTAF at temperatures above 30 oC. The fact that DSCindicates the gradual decrease of the fractions crystallizing at30-110 oC (see Fig. 1A for IPC-1) might indicate that notonly iPP but also EP copolymer fractions with long propylenesequences are degraded. This assumption, however, must beconfirmed by more detailed studies.
As has been shown previously, more molecular informationcan be obtained by FTIR spectroscopy and HT-HPLC. ForIPC bulk analysis, however, HT-HPLC has been shown notto provide much information. This is due to the fact that themajority phase iPP dominates the HPLC behavior. Theelution peaks at 1.3 mL are due to low molar mass iPP whilethe peaks at ~3.0 mL after the start of the solvent gradient aredue to high molar mass iPP, see Fig. 2B. More valuableinformation can be obtained for TREF fractions as will beshown later. In contrast, FTIR shows very clearly that uponvis-breaking the samples are functionalized, see Fig. 2A. Theabsorptions at ~1630-1770 cm-1 indicate the presence ofcarbonyl containing functional groups and the peakintensities increase with higher values of MFR. The carbonylproducts are assumed to be formed during the vis-breakingprocess.
Figure 2. Bulk analysis of the samples by FTIR (A) and HT-HPLC (B).
The major limitation of the FTIR technique is that it providesonly average chemical composition and as such the detailsabout which phase (amorphous, semi-crystalline or highlycrystalline) of the IPC materials is affected by the action ofthe peroxide cannot be established. Hence, the fractionationof the bulk samples is very important to obtaincomprehensive information on the molecular properties of thereference and the vis-broken IPCs and to elucidate the effectof the peroxide on the different IPC phases.
The IPC samples were fractionated according to theircrystallizabilities using preparative TREF. The TREFfractionation results are depicted in Fig. 3 indicating theweight percentage of the collected material as a function ofthe TREF elution temperature. As has been shown inprevious work and confirmed by the CRYSTAF results, themajority phase (iPP) elutes at high temperature (130 oC)reflecting the highly crystallinity of this fraction. The rubberphase that is responsible for the impact properties of IPCconstitutes about ~20 wt% of the bulk material. Due to itslow crystallinity it elutes at a temperature of 30 oC. Inaddition to these components, segmented EP copolymerfractions elute between 60 – 90 °C. These components,however, make only about 10 wt% of the total samples. Onehas to keep in mind that co-crystallization and co-elution of
30 60 90 120 150 1800
0.2
0.4
0.6
0.8
1
Temperature (°C)
Nor
mal
ized
Hea
t fl
ow
IPC Bulk Samples
IPC-1IPC-2IPC-3
20 30 40 50 60 70 80 90 100
0.2
0.4
0.6
0.8
1
Temperature (°C)
Nor
mal
ized
dW
/dT
IPC Bulk Samples
IPC-1IPC-2IPC-3
BA
0 1 2 3 4 5 6 70
0.02
0.04
0.06
0.08
0.1
0.12
0.14
Elution Volume (ml)
EL
SD R
espo
nse
(mV
)
IPC-1IPC-2IPC-3
1600165017001750180018501900
2
4
6
8
10
12
14
16
x 10-3
Wavenumber (cm-1)
Rel
ativ
e A
bsor
banc
e
IPC-1IPC-2IPC-3
A B
Start of the gradient
Stellenbosch University https://scholar.sun.ac.za
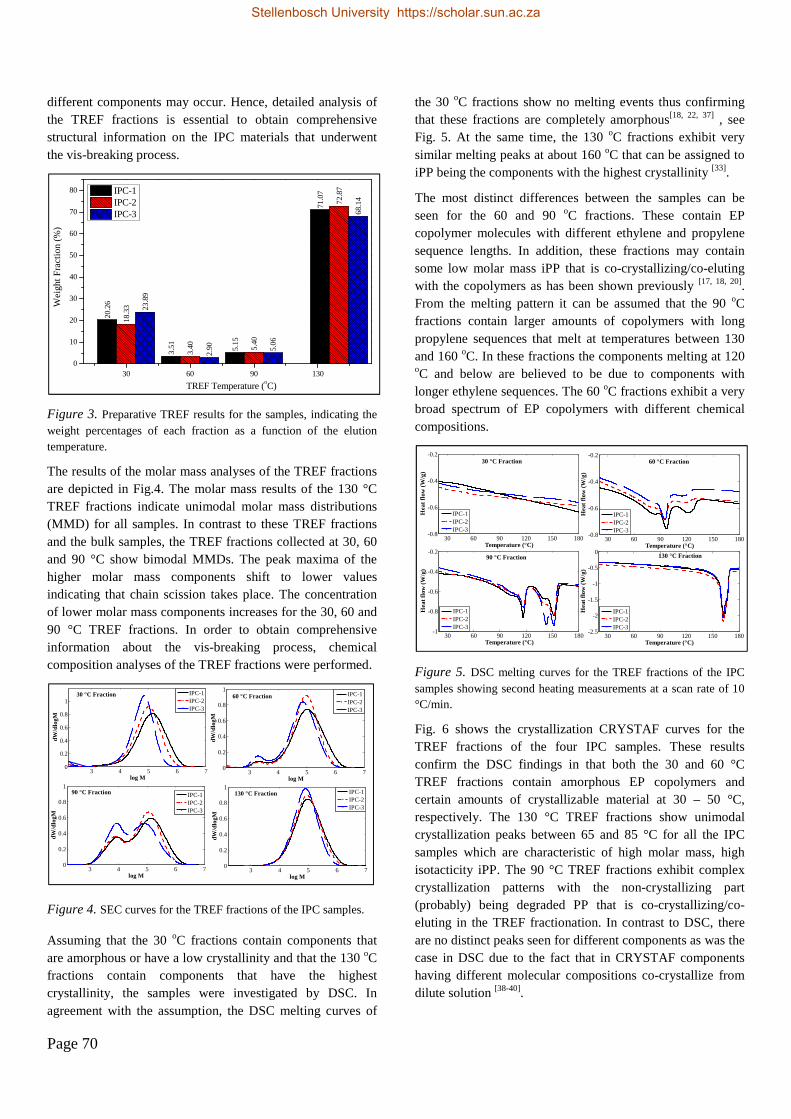
Page 70
different components may occur. Hence, detailed analysis ofthe TREF fractions is essential to obtain comprehensivestructural information on the IPC materials that underwentthe vis-breaking process.
Figure 3. Preparative TREF results for the samples, indicating theweight percentages of each fraction as a function of the elutiontemperature.
The results of the molar mass analyses of the TREF fractionsare depicted in Fig.4. The molar mass results of the 130 °CTREF fractions indicate unimodal molar mass distributions(MMD) for all samples. In contrast to these TREF fractionsand the bulk samples, the TREF fractions collected at 30, 60and 90 °C show bimodal MMDs. The peak maxima of thehigher molar mass components shift to lower valuesindicating that chain scission takes place. The concentrationof lower molar mass components increases for the 30, 60 and90 °C TREF fractions. In order to obtain comprehensiveinformation about the vis-breaking process, chemicalcomposition analyses of the TREF fractions were performed.
Figure 4. SEC curves for the TREF fractions of the IPC samples.
Assuming that the 30 oC fractions contain components thatare amorphous or have a low crystallinity and that the 130 oCfractions contain components that have the highestcrystallinity, the samples were investigated by DSC. Inagreement with the assumption, the DSC melting curves of
the 30 oC fractions show no melting events thus confirmingthat these fractions are completely amorphous[18, 22, 37] , seeFig. 5. At the same time, the 130 oC fractions exhibit verysimilar melting peaks at about 160 oC that can be assigned toiPP being the components with the highest crystallinity [33].
The most distinct differences between the samples can beseen for the 60 and 90 oC fractions. These contain EPcopolymer molecules with different ethylene and propylenesequence lengths. In addition, these fractions may containsome low molar mass iPP that is co-crystallizing/co-elutingwith the copolymers as has been shown previously [17, 18, 20].From the melting pattern it can be assumed that the 90 oCfractions contain larger amounts of copolymers with longpropylene sequences that melt at temperatures between 130and 160 oC. In these fractions the components melting at 120oC and below are believed to be due to components withlonger ethylene sequences. The 60 oC fractions exhibit a verybroad spectrum of EP copolymers with different chemicalcompositions.
Figure 5. DSC melting curves for the TREF fractions of the IPCsamples showing second heating measurements at a scan rate of 10°C/min.
Fig. 6 shows the crystallization CRYSTAF curves for theTREF fractions of the four IPC samples. These resultsconfirm the DSC findings in that both the 30 and 60 °CTREF fractions contain amorphous EP copolymers andcertain amounts of crystallizable material at 30 – 50 °C,respectively. The 130 °C TREF fractions show unimodalcrystallization peaks between 65 and 85 °C for all the IPCsamples which are characteristic of high molar mass, highisotacticity iPP. The 90 °C TREF fractions exhibit complexcrystallization patterns with the non-crystallizing part(probably) being degraded PP that is co-crystallizing/co-eluting in the TREF fractionation. In contrast to DSC, thereare no distinct peaks seen for different components as was thecase in DSC due to the fact that in CRYSTAF componentshaving different molecular compositions co-crystallize fromdilute solution [38-40].
20.2
6
3.51 5.15
71.0
7
18.3
3
3.40 5.
40
72.8
7
23.8
9
2.90 5.
06
68.1
4
30 60 90 1300
10
20
30
40
50
60
70
80
Wei
ght F
ract
ion
(%)
TREF Temperature (oC)
IPC-1IPC-2IPC-3
3 4 5 6 70
0.2
0.4
0.6
0.8
1
log M
dW
/dlo
gM
30 °C Fraction IPC-1IPC-2IPC-3
3 4 5 6 70
0.2
0.4
0.6
0.8
1
log M
dW
/dlo
gM
60 °C Fraction IPC-1IPC-2IPC-3
3 4 5 6 70
0.2
0.4
0.6
0.8
1
log M
dW
/dlo
gM
90 °C Fraction IPC-1IPC-2IPC-3
3 4 5 6 70
0.2
0.4
0.6
0.8
1
log M
dW
/dlo
gM
130 °C Fraction IPC-1IPC-2IPC-3
30 60 90 120 150 180-0.8
-0.6
-0.4
-0.2
Temperature (°C)
Hea
t fl
ow (
W/g
)
30 °C Fraction
IPC-1IPC-2IPC-3
30 60 90 120 150 180-0.8
-0.6
-0.4
-0.2
Temperature (°C)
Hea
t fl
ow (
W/g
)
60 °C Fraction
IPC-1IPC-2IPC-3
30 60 90 120 150 180-1
-0.8
-0.6
-0.4
-0.2
Temperature (°C)
Hea
t fl
ow (
W/g
)
90 °C Fraction
IPC-1IPC-2IPC-3
30 60 90 120 150 180-2.5
-2
-1.5
-1
-0.5
0
Temperature (°C)
Hea
t fl
ow (
W/g
)
130 °C Fraction
IPC-1IPC-2IPC-3
Stellenbosch University https://scholar.sun.ac.za
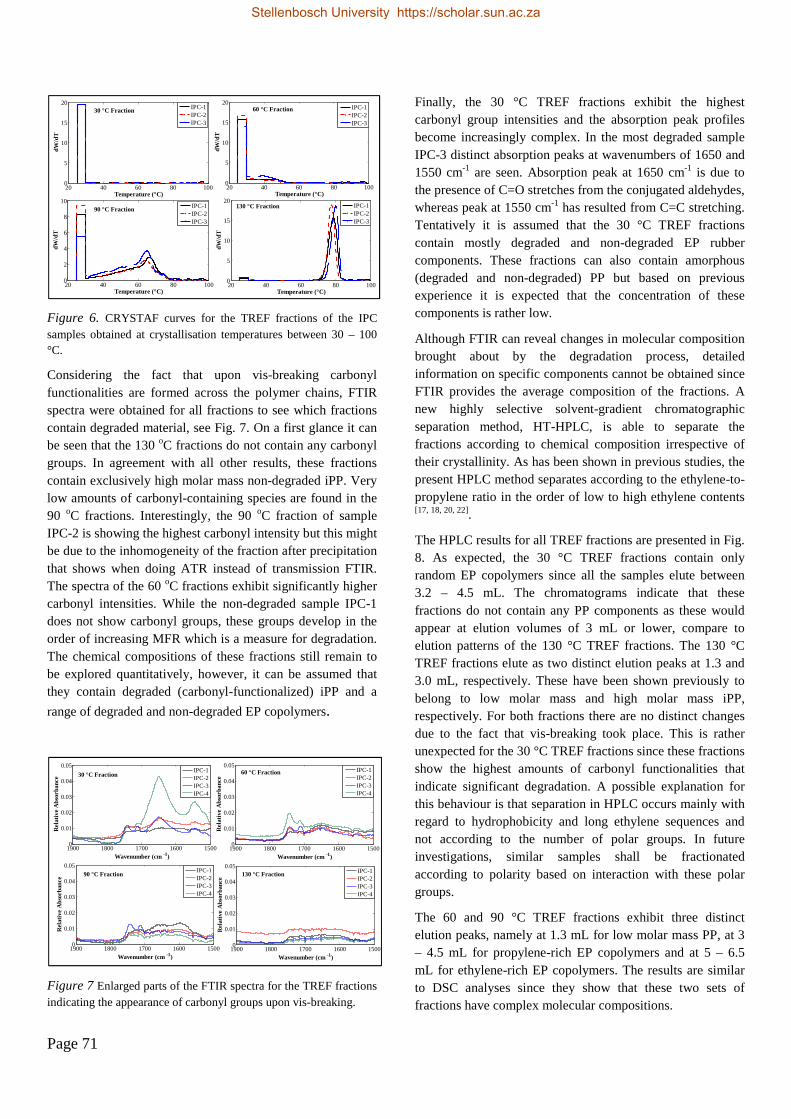
Page 71
Figure 6. CRYSTAF curves for the TREF fractions of the IPCsamples obtained at crystallisation temperatures between 30 – 100°C.
Considering the fact that upon vis-breaking carbonylfunctionalities are formed across the polymer chains, FTIRspectra were obtained for all fractions to see which fractionscontain degraded material, see Fig. 7. On a first glance it canbe seen that the 130 oC fractions do not contain any carbonylgroups. In agreement with all other results, these fractionscontain exclusively high molar mass non-degraded iPP. Verylow amounts of carbonyl-containing species are found in the90 oC fractions. Interestingly, the 90 oC fraction of sampleIPC-2 is showing the highest carbonyl intensity but this mightbe due to the inhomogeneity of the fraction after precipitationthat shows when doing ATR instead of transmission FTIR.The spectra of the 60 oC fractions exhibit significantly highercarbonyl intensities. While the non-degraded sample IPC-1does not show carbonyl groups, these groups develop in theorder of increasing MFR which is a measure for degradation.The chemical compositions of these fractions still remain tobe explored quantitatively, however, it can be assumed thatthey contain degraded (carbonyl-functionalized) iPP and a
range of degraded and non-degraded EP copolymers.
Figure 7 Enlarged parts of the FTIR spectra for the TREF fractionsindicating the appearance of carbonyl groups upon vis-breaking.
Finally, the 30 °C TREF fractions exhibit the highestcarbonyl group intensities and the absorption peak profilesbecome increasingly complex. In the most degraded sampleIPC-3 distinct absorption peaks at wavenumbers of 1650 and1550 cm-1 are seen. Absorption peak at 1650 cm-1 is due tothe presence of C=O stretches from the conjugated aldehydes,whereas peak at 1550 cm-1 has resulted from C=C stretching.Tentatively it is assumed that the 30 °C TREF fractionscontain mostly degraded and non-degraded EP rubbercomponents. These fractions can also contain amorphous(degraded and non-degraded) PP but based on previousexperience it is expected that the concentration of thesecomponents is rather low.
Although FTIR can reveal changes in molecular compositionbrought about by the degradation process, detailedinformation on specific components cannot be obtained sinceFTIR provides the average composition of the fractions. Anew highly selective solvent-gradient chromatographicseparation method, HT-HPLC, is able to separate thefractions according to chemical composition irrespective oftheir crystallinity. As has been shown in previous studies, thepresent HPLC method separates according to the ethylene-to-propylene ratio in the order of low to high ethylene contents[17, 18, 20, 22].
The HPLC results for all TREF fractions are presented in Fig.8. As expected, the 30 °C TREF fractions contain onlyrandom EP copolymers since all the samples elute between3.2 – 4.5 mL. The chromatograms indicate that thesefractions do not contain any PP components as these wouldappear at elution volumes of 3 mL or lower, compare toelution patterns of the 130 °C TREF fractions. The 130 °CTREF fractions elute as two distinct elution peaks at 1.3 and3.0 mL, respectively. These have been shown previously tobelong to low molar mass and high molar mass iPP,respectively. For both fractions there are no distinct changesdue to the fact that vis-breaking took place. This is ratherunexpected for the 30 °C TREF fractions since these fractionsshow the highest amounts of carbonyl functionalities thatindicate significant degradation. A possible explanation forthis behaviour is that separation in HPLC occurs mainly withregard to hydrophobicity and long ethylene sequences andnot according to the number of polar groups. In futureinvestigations, similar samples shall be fractionatedaccording to polarity based on interaction with these polargroups.
The 60 and 90 °C TREF fractions exhibit three distinctelution peaks, namely at 1.3 mL for low molar mass PP, at 3– 4.5 mL for propylene-rich EP copolymers and at 5 – 6.5mL for ethylene-rich EP copolymers. The results are similarto DSC analyses since they show that these two sets offractions have complex molecular compositions.
20 40 60 80 1000
5
10
15
20
Temperature (°C)
dW
/dT
30 °C Fraction IPC-1IPC-2IPC-3
20 40 60 80 1000
5
10
15
20
Temperature (°C)
dW
/dT
60 °C Fraction IPC-1IPC-2IPC-3
20 40 60 80 1000
2
4
6
8
10
Temperature (°C)
dW
/dT
90 °C Fraction IPC-1IPC-2IPC-3
20 40 60 80 1000
5
10
15
20
Temperature (°C)
dW
/dT
130 °C Fraction IPC-1IPC-2IPC-3
150016001700180019000
0.01
0.02
0.03
0.04
0.05
Wavenumber (cm -1)
Rel
ativ
e A
bsor
banc
e 30 °C FractionIPC-1IPC-2IPC-3IPC-4
150016001700180019000
0.01
0.02
0.03
0.04
0.05
Wavenumber (cm -1)
Rel
ativ
e A
bsor
banc
e
60 °C Fraction IPC-1IPC-2IPC-3IPC-4
150016001700180019000
0.01
0.02
0.03
0.04
0.05
Wavenumber (cm -1)
Rel
ativ
e A
bsor
banc
e 90 °C FractionIPC-1IPC-2IPC-3IPC-4
150016001700180019000
0.01
0.02
0.03
0.04
0.05
Wavenumber (cm -1)
Rel
ativ
e A
bsor
banc
e
130 °C Fraction IPC-1IPC-2IPC-3IPC-4
Stellenbosch University https://scholar.sun.ac.za

Page 72
Figure 8. HT-HPLC chromatograms for the TREF fractionsof the IPC samples, solvent gradient elution (1-decanol toTCB) after an initial isocratic step.
The effect of peroxide on the molecular composition of theTREF fractions can be seen even more clearly whencomparing the enlarged parts of the chromatograms asillustrated in Fig 8. The results for all TREF fractions indicatethat the maxima of the elution peaks shift to lower elutionvolumes with increasing degrees of degradation (increasingMFR values). Most pronounced are these effects for the 30and 60 oC fractions.
Figure 9. Enlarged parts of the HT-HPLC chromatograms(see Fig. 8) of the TREF fractions.
There are a number of explanations for these observations.First of all, the molar masses of the samples decrease uponvis-breaking. In addition to reducing the total molar masses,the numbers and the lengths of (crystallisable) ethylenesequences will be reduced and, accordingly, elution in HPLCshifts to lower volumes. Secondly, carbonyl groups areintroduced in the polymer structure that will increase thepolarity of the polymer chains. Although HPLC separation ismainly driven by the number and length of the ethylenesequences an extra effect of the carbonyl groups may beencountered that causes a shift to lower elution volumes (less
interaction). Finally, the presence of carbonyl groups changesthe molecular conformation and longer ethylene sequencescannot properly align to the surface of the stationary phase.Again, interactions with the stationary phase will be weakerand elution volume will decrease.
4. Conclusions
The present investigations have shown that the vis-breakingprocess does not only decrease the molar mass by chainscission resulting in lower viscosity and better processability.The vis-breaking process brings about significant changes inthe molecular composition of the material. These changes,however, do only affect a certain fraction of the material. TheTREF results indicate that upon vis-breaking the percentageof semi-crystalline iPP decreases only gradually from about72 to 68 wt%. This proves that most of the iPP matrixremains intact.
Upon vis-breaking the amount of soluble material (30 oCTREF fractions) increases which indicates that additionalsoluble material is produced through chain scission. Thismaterial is amorphous and has a distinctively differentmolecular composition compared to the original solublematerial. As can be seen from the FTIR spectra of thefractions, the 30 oC TREF fractions contain the highestconcentration of carbonyl and vinyl functionalities. The shiftof the HPLC elution peaks towards lower elution volumescould indicate that the degraded material has a higherpropylene content compared to the non-degraded material.This would prove that degradation does not take placeuniformly over all polymer chains but preferentially for iPPmolecules. It is interesting to note that the 60 and 90 oCTREF fractions even after the vis-breaking process do notshow significant intensities of the carbonyl peaks. Thisindicates that the segmented EP copolymer fractions are lesssusceptible to degradation.
In conclusion, the combination of preparative TREF withvarious advanced analysis and fractionation methods hasproved to be an effective approach to understand the vis-breaking process better and to shed light on the molecular
composition of the vis-broken IPC materials.
Acknowledgements: The authors thank SASOL, SouthAfrica, and Lummus Novolen Technology GmbH, Germany,for the financial support of this work. The IPC samplesprovided by Novolen Technology GmbH are gratefullyacknowledged.
0 1 2 3 4 5 6 70
0.2
0.4
0.6
0.8
1
Elution Volume (ml)
Nor
mal
ized
EL
SD R
espo
nse 30 °C Fraction IPC-1
IPC-2IPC-3
0 1 2 3 4 5 6 70
0.2
0.4
0.6
0.8
1
Elution Volume (ml) N
orm
aliz
ed E
LSD
Res
pons
e 60 °C Fraction IPC-1IPC-2IPC-3
0 1 2 3 4 5 6 70
0.2
0.4
0.6
0.8
1
Elution Volume (ml)
Nor
mal
ized
EL
SD R
espo
nse 90 °C Fraction IPC-1
IPC-2IPC-3
0 1 2 3 4 5 6 70
0.2
0.4
0.6
0.8
1
Elution Volume (ml)
Nor
mal
ized
EL
SD R
espo
nse 130 °C Fraction IPC-1
IPC-2IPC-3
Start of the gradientStart of the gradient
Start of the gradient
Start of the gradient
2.5 3 3.5 4 4.50
0.2
0.4
0.6
0.8
1
Elution Volume (ml)
Nor
mal
ized
EL
SD R
espo
nse
30 °C Fraction IPC-1IPC-2IPC-3
2.5 3 3.5 4 4.50
0.2
0.4
0.6
0.8
1
Elution Volume (ml)
Nor
mal
ized
EL
SD R
espo
nse
60 °C Fraction IPC-1IPC-2IPC-3
2.5 3 3.5 4 4.50
0.1
0.2
0.3
0.4
Elution Volume (ml)
Nor
mal
ized
EL
SD R
espo
nse
90 °C Fraction IPC-1IPC-2IPC-3
2.5 3 3.5 4 4.50
0.2
0.4
0.6
0.8
1
Elution Volume (ml)
Nor
mal
ized
EL
SD R
espo
nse
130 °C Fraction IPC-1IPC-2IPC-3
Start of the gradient
Start of the gradient
Start of the gradientStart of the gradient
Stellenbosch University https://scholar.sun.ac.za

Page 73
[1] C. Kock, M. Gahleitner, A. Schausberger, E. Ingolic, J.Appl. Polym. Sci. 2012, 128, 1484.
[2] H. Pasch, M. I. Malik, T. Macko, Adv. Polym. Sci. 2013,251, 77.[3] R. A. García, B. Coto, M. T. Expósito, I. Suarez, A.
Fernández-Fernández, S. Caveda, Macromol. Res. 2011,19, 778.
[4] M. Gahleitner, C. Tranninger, P. Doshev, J. Appl. Polym.Sci. 2013, 130, 3028.[5] V. Agarwal, T. B. Van Erp, L. Balzano, M. Gahleitner,
M. Parkinson, L. E. Govaert, V. Litvinov, A. P. M.Kentgens, Polymer 2014, 55, 896.
[6] C. Grein, M. Gahleitner, K. Bernreitner, Express Polym.Lett. 2012, 6, 688.[7] F. M. Mirabella Jr, Polymer 1993, 34, 1729.[8] R. Zacur, G. Goizueta, N. Capiati, Polym. Eng. Sci. 2000,40, 1921.[9] R. Zacur, G. Goizueta, N. Capiati, Polym. Eng. Sci. 1999,39, 921.[10] C. Kock, N. Aust, C. Grein, M. Gahleitner, J. Appl.Polym. Sci. 2013, 130, 287.[11] M. Swart, A. J. van Reenen, J. Appl. Polym. Sci. 2015,132, 41783.[12] E. de Goede, P. Mallon, H. Pasch, Macromol. Mater.Eng. 2010, 295, 366.[13] E. de Goede, P. E. Mallon, H. Pasch, Macromol. Mater.Eng. 2012, 297, 26.[14] E. de Goede, P. E. Mallon, K. Rode, H. Pasch,Macromol. Mater. Eng. 2011, 296, 1018.[15] S. de Goede, R. Brüll, H. Pasch, N. Marshall, E-Polymers 2004, 1.[16] H. Pasch, E. de Goede, P. Mallon, Macromol. Symp.2012, 312, 174.[17] S. Cheruthazhekatt, G. W. Harding, H. Pasch, J.Chromatogr. A 2013, 1286, 69.[18] S. Cheruthazhekatt, T. F. J. Pijpers, G. W. Harding, V.
B. F. Mathot, H. Pasch, Macromolecules 2012, 45,5866.
[19] T. Macko, A. Ginzburg, K. Remerie, R. Brüll,Macromol. Chem. Phys. 2012, 213, 937.[20] S. Cheruthazhekatt, T. F. J. Pijpers, G. W. Harding, V.
B. F. Mathot, H. Pasch, Macromolecules 2012, 45,2025.
[21] M. Ahmadi, M. Nekoomanesh, H. Arabi, Macromol.Theor. Simul. 2009, 18, 195.[22] M. J. Phiri, S. Cheruthazhekatt, A. Dimeska, H. Pasch, J.
Polym. Sci. Part A: Polym. Chem. 2015, 53, 863.[23] R. Chitta, T. Macko, R. Brüll, C. Boisson, E. Cossoul,
O. Boyron, Macromol. Chem. Phys. 2015, 216, 721.[24] T. Macko, R. Brüll, R. G. Alamo, F. J. Stadler, S. Losio,
Anal. Bioanal. Chem. 2011, 399, 1547.[25] T. Macko, R. Brüll, Y. Wang, B. Coto, I. Suarez, J.Appl. Polym. Sci. 2011, 122, 3211.[26] H. Pasch, A. Albrecht, R. Brüll, T. Macko, W. Hiller,Macromol. Symp. 2009, 282, 71.[27] A. Albrecht, L. C. Heinz, D. Lilge, H. Pasch, Macromol.Symp. 2007, 257, 46.[28] S. Cheruthazhekatt, H. Pasch, Polymer 2015, 64, 1.[29] H. Pasch, Polym. Adv. Technol. 2015, 26, 771.
[30] H. Pasch, M. I. Malik, "Advanced SeparationTechniques for Polyolefins", Springer, New York, 2014.[31] C. Silvestre, S. Cimmino, R. Triolo, J. Polym. Sci. PartB: Polym. Phys. 2003, 41, 493.[32] A. Ginzburg, T. Macko, V. Dolle, R. Brüll, Eur. Polym.J. 2011, 47, 319.[33] M. J. Phiri, A. Dimeska, H. Pasch, Macromol. Chem.Phys. 2015, 216, 1619.[34] M. J. Scorah, S. Zhu, A. Psarreas, N. T. McManus, R.
Dhib, C. Tzoganakis, A. Penlidis, Polym. Eng. Sci.2009, 49, 1760.
[35] G. Moad, I. J. Dagley, J. Habsuda, C. J. Garvey, G. Li,L. Nichols, G. P. Simon, M. R. Nobile, Polym. Degrad.Stabil. 2015, 117, 97.[36] P. R. Dluzneski, Rubber Chem. Technol. 2001, 74, 451.[37] S. Cheruthazhekatt, T. F. J. Pijpers, V. B. F. Mathot, H.
Pasch, Anal. Bioanal. Chem. 2013, 405, 8995.[38] H. Pasch, R. Brüll, U. Wahner, B. Monrabal, Macromol.Mater. Eng. 2000, 279, 46.[39] B. Monrabal, Adv. Polym. Sci. 2013, 257, 203.[40] B. Monrabal, J. Appl. Polym. Sci. 1994, 52, 491.
Stellenbosch University https://scholar.sun.ac.za
Page 74
Chapter7:ConclusionsandRecommendations
7 CONCLUSIONS AND RECOMMENDATIONS
This chapter outlines the conclusions of the three different parts of the present study. Only the
main points are highlighted and presented in the present dissertation. A general conclusion for
the overall study is also given. Recommendations for future work are proposed so that additional
information can be obtained.
7.1 Conclusions
Ethylene-propylene rubber (EPR) forms an integral part of complex impact polypropylene
copolymer (IPC) formulations. The molecular composition of the EPR affects the impact
properties of the IPC materials. In the first part of the current study, investigations on the
molecular structures of EPR copolymers synthesized by a Ziegler-Natta catalysts system were
carried out. This was followed by exploring the molecular compositions of the metallocene-
based EPR copolymers to evaluate the effect of the catalyst type. Finally, the effect of an organic
peroxide on the molecular structures of the IPC materials was evaluated. To enhance the
processing properties, IPCs are frequently treated with peroxides to increase their melt flow
rates. These vis-broken IPC materials have very complex compositions due to the effect of the
peroxide used during the degradation process. The understanding of the microstructural
properties for both vis-broken IPC and EPR copolymers is essential for the correlation of the
molecular structure of IPC with the final application of these materials. The present thesis was
dedicated to the fractionation and characterization of vis-broken IPCs and EPR copolymers. The
findings of this research can be summarized as follows.
In the first part of the study, bulk analyses of the EPR copolymers prepared with a Ziegler-Natta
catalyst system revealed that the major components present in these copolymers are random
ethylene-propylene (EP) copolymers. The fractionation experiments using TREF showed that the
EPRs contain minor components, one of them being highly crystalline material that was
collected at a TREF elution temperature of 130 °C. The results from DSC analyses confirmed the
130 °C TREF fractions to be highly crystalline components of both PE and iPP homopolymers
as indicated by the two melting peaks at ~120 °C and ~160 °C, respectively. The 30 °C TREF
fractions could not be characterized by CRYSTAF and DSC since these fractions contain
random EP copolymers which are completely amorphous. In contrast to the crystallization-based
techniques, HT-HPLC was able to analyse both the amorphous and crystalline fractions of the
Stellenbosch University https://scholar.sun.ac.za
Page 75
materials and separations were found to depend on the ethylene contents of the samples. The 60
and 90 °C TREF fractions were determined to contain segmented EP copolymers having
different ethylene and propylene sequences. HT-HPLC further confirmed that the 130 °C TREF
fractions contain both PE and iPP materials as observed by the elution peaks at ~6 mL for PE
homopolymer. HT-HPLC was coupled to FT-IR spectroscopy to obtain the exact chemical
compositions of the separated components. The FT-IR spectra linked to the latest eluting HPLC
fractions confirmed the presence of crystalline ethylene sequences. These results proved that the
late eluting material in HPLC is mainly PE homopolymer.
The second part of the present study dealt with the analyses of metallocene-based EPR
copolymers with high comonomer contents. The bulk analyses as performed by SEC, DSC and
HPLC showed that the copolymers have narrow molar mass and chemical composition
distributions as expected for samples prepared by a metallocene catalyst system. However, using
preparative TREF it was found that there was a significant amount of crystallizing material that
eluted at 130 °C. As confirmed by DSC, CRYSTAF and HT-HPLC analyses, the 130 °C TREF
fractions were found to contain mainly iPP homopolymer. It was rather unexpected for EPR
copolymers with such high ethylene contents to have traces of iPP material. The 30 and 60 °C
TREF fractions were found to contain random EP copolymers. Crystallization-based techniques
such as DSC and CRYSTAF were not able to fractionate and characterize these amorphous
fractions. In contrast, HT-HPLC showed that the 30, 60 and 90 °C fractions contain mainly
random EP copolymers while the 130 °C fractions contain iPP homopolymer. These results
suggested that even metallocene-based EPRs exhibit significant chemical composition
heterogeneities. Conclusive information on the heterogeneity in chemical composition of the
TREF fractions was obtained by the 13C NMR analyses. The comonomer contents and monomer
sequence distributions were determined for all TREF fractions. The 130 °C TREF fractions
showed mainly three distinct NMR peaks due to carbon atoms of the propylene repeating units
confirming iPP but the 30 and 60 °C TREF fractions indicated a variety of EP sequences. The
NMR analyses further proved that there is a remarkably high chemical heterogeneity among the
TREF fractions and thus the bulk EPR samples.
In the last part of the study, vis-broken IPC materials were analysed by various analytical
techniques to determine the effect of the peroxide on the molecular compositions of the IPC
samples. HT-SEC analyses for the bulk samples showed that there is a decrease in the molar
masses of the IPC samples upon addition of the peroxide during the degradation process. FT-IR
analyses showed the presence of degradation products, indicated by carbonyl groups, in the
Stellenbosch University https://scholar.sun.ac.za
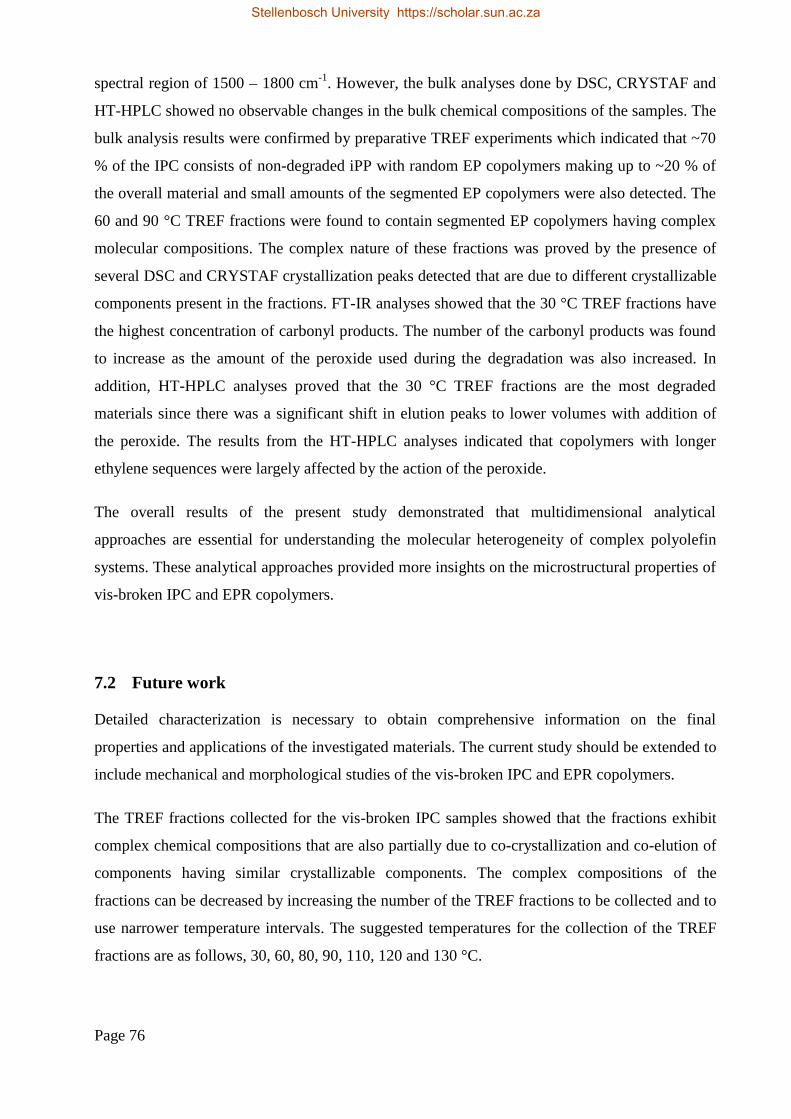
Page 76
spectral region of 1500 – 1800 cm-1. However, the bulk analyses done by DSC, CRYSTAF and
HT-HPLC showed no observable changes in the bulk chemical compositions of the samples. The
bulk analysis results were confirmed by preparative TREF experiments which indicated that ~70
% of the IPC consists of non-degraded iPP with random EP copolymers making up to ~20 % of
the overall material and small amounts of the segmented EP copolymers were also detected. The
60 and 90 °C TREF fractions were found to contain segmented EP copolymers having complex
molecular compositions. The complex nature of these fractions was proved by the presence of
several DSC and CRYSTAF crystallization peaks detected that are due to different crystallizable
components present in the fractions. FT-IR analyses showed that the 30 °C TREF fractions have
the highest concentration of carbonyl products. The number of the carbonyl products was found
to increase as the amount of the peroxide used during the degradation was also increased. In
addition, HT-HPLC analyses proved that the 30 °C TREF fractions are the most degraded
materials since there was a significant shift in elution peaks to lower volumes with addition of
the peroxide. The results from the HT-HPLC analyses indicated that copolymers with longer
ethylene sequences were largely affected by the action of the peroxide.
The overall results of the present study demonstrated that multidimensional analytical
approaches are essential for understanding the molecular heterogeneity of complex polyolefin
systems. These analytical approaches provided more insights on the microstructural properties of
vis-broken IPC and EPR copolymers.
7.2 Future work
Detailed characterization is necessary to obtain comprehensive information on the final
properties and applications of the investigated materials. The current study should be extended to
include mechanical and morphological studies of the vis-broken IPC and EPR copolymers.
The TREF fractions collected for the vis-broken IPC samples showed that the fractions exhibit
complex chemical compositions that are also partially due to co-crystallization and co-elution of
components having similar crystallizable components. The complex compositions of the
fractions can be decreased by increasing the number of the TREF fractions to be collected and to
use narrower temperature intervals. The suggested temperatures for the collection of the TREF
fractions are as follows, 30, 60, 80, 90, 110, 120 and 130 °C.
Stellenbosch University https://scholar.sun.ac.za

Page 77
In the last part of the present study, FT-IR analyses showed that the vis-broken IPC samples
contain large numbers of carbonyl groups due to the action of the peroxide during the
degradation process. A HT-HPLC separation based on the polarity of the degraded samples
would give additional information on the molecular complexity of the vis-broken samples.
Stellenbosch University https://scholar.sun.ac.za