Embed Size (px)
Citation preview
Page 1
Multidimensional Poverty Measurement in Pakistan: Time Series Trends and Breakdown
Taseer Salahuddin1
Asad Zaman2
1 Assistant Professor, Faculty of Arts and Social Sciences, University of Central Punjab, Lahore.
2Director General, International Institute of Islamic Economics, International Islamic University of
Islamabad.

Page 2
Abstract:
Traditionally poverty has been understood only as ‘lack of income’.
However, with the passage of time it was realized that poverty is a complex and
multidimensional phenomenon. Mahboob-ul-Haq (1973) and Sen (1975) argued that
development is about enlarging human capabilities, rather than only acquisition of
wealth. The purpose of this research is to argue that poverty being multidimensional in
nature, cannot be properly measured by unidimensional (income or calorie based) poverty
measures. This study has utilized Alkire-Foster multidimensional (AFM) poverty
measure (2007) for building time-series trends of poverty in Pakistan from 1998-2006.
The results show that multidimensional poverty measures provide more elaborate and
precise picture of poverty. Instead of an absolute poverty line, the AFM measure depicts
a spectrum of poverty levels from border-line cases to absolutely poor people.
Furthermore, time-series trends of deprivations in multiple dimensions have been built at
provincial level in Pakistan. This study demonstrates that people of Pakistan are highly
deprived in education and health. Education has shown worst deterioration in past decade
and a half. Unfortunately, it is this dimension, which is the foundation for capabilities
development in the long run.
JEL Classification: O11
Key Words: Poverty, Poverty Measurement, Multidimensional Poverty. Capabilities
Approach, Alkire-Foster Measure

Page 3
1. Introduction:
In the recent literature, consensus has emerged that poverty is a multidimensional
phenomenon; see Alkire and Santos (2010) for a review of the major arguments.
Nonetheless, the most widely used measures of poverty remain unidimensional, being
based on income or caloric intake cutoffs. The logic for the use of income based
measures was that it was only lack of income which led to deprivation – with sufficient
income; rational agents would automatically eliminate deprivations in all dimensions in
the right sequence of priorities. However, careful studies like Thorbecke (2005) and
Banerjee & Duflo (2006) show that this does not happen. Even while malnourished and
underfed, the poor spend significant portions of their budgets on festivals, weddings,
alcohol, tobacco and other non-essential items. The move from abstract theoretical
speculation based on mathematical models of human behavior to experiments and
observations of actual behavior has led to dramatic changes in the understanding of
poverty and how to alleviate it. Some of these insights are encapsulated in a new
approach to poverty advocated by Banerjee and Duflo (2011)3
Another motivation for more careful study of poverty is a silent revolution in the
understanding of development. Traditional economists treat development as a process of
accumulation of wealth, and current textbooks endorse this idea for the most part. On this
view, the poor are regarded as labor inputs to the production function, and valued at their
marginal product of labor. Elementary as it might appear, the idea that wealth is an input
3 http://pooreconomics.com/
Page 4
to improving human welfare, and that our goal as economists should be to provide lives
of comfort and dignity to all human beings, is revolutionary. Experience with
implementing development schemes based on conventional growth theory led Mahbob-
ul-Haq to the following important insight4:“…, after many decades of development, we
are rediscovering the obvious—that people are both the means and the end of economic
development.” Similarly, Sen (1975, 2006) has argued that development is about the
process of development of human capabilities, not the accumulation of wealth. A recent
study of the wealth of nations by the World Bank shows that most of the wealth on this
planet is generated by skills and capabilities of human beings, rather than natural
resources or accumulated capital5. Thus the poor are the most valuable resources in the
process of development, and providing for them adequately is the key to rapid economic
growth.
In this paper, we calculate the Alkire-Foster measure (AFM) (2007) of poverty on
the basis of available Pakistani data. This is a true multidimensional poverty index, which
treats income as means to ends and not an end in itself. We will show that it provides a
substantially clearer picture of poverty than large numbers of earlier studies based on
unidimensional measures. Because the measure is decomposable, we are able to provide a
breakdown across different dimensions, and also across provinces. The sharper
conclusions also provide much clearer guidance for anti-poverty policy.
4In another place, he writes that “we were told to take care of our GNP as that would take care of poverty
– let us reverse this and take care of poverty as this will take care of our GNP.” See Bari (2012) for an account of the intellectual journey of Mahbob-ul-Haq from conventional wealth oriented views of development to Human oriented views based on his experiences with development. 5 “Where is the Wealth of nations?” study by World Bank (2006)
http://siteresources.worldbank.org/INTEEI/214578-1110886258964/20748034/All.pdf

Page 5
Before proceeding to provide details of this alternative methodology, we provide
a brief review of existing approaches to poverty measurement in context of Pakistan. This
will place our discussion in a historical context, and provide a benchmark for
comparisons.
2. History of Poverty Measurement in Pakistan:
Studies on poverty measurement in Pakistan used various income-based
definitions of poverty measurement. Increase in number of measures led to increasing
confusion about the true level of poverty. Changes in cutoffs for calories, income,
indexation methods, some of which were politically motivated, led to conflicting and
contradictory pictures of poverty. A close study of Naseem (1973, 1977), Allaudin
(1975), Mujahid (1978), Irfan and Amjad (1984), Ahmed and Allison (1990), and Malik
(1988) showed that for same years and same data sets, changes in models of poverty
measurement, poverty lines and units of analysis lead to these differing results and trends.
Most confusing aspect here was the fact that all models used same income and
expenditure poverty definitions and yet achieved different results.
In 2003-04 Economic Survey of Pakistan government admitted that: “… many
poverty estimates have … neither helped in understanding changes in the standard of
living of a common man nor facilitated in assessing how to reduce poverty through
various policy changes.”6 In this 2003-04 year for the very first time in the history of
6 Economic survey of Pakistan 2003-04 pg 41.
Page 6
Pakistan an official poverty line of 2350 calories/day/adult was announced. This may
have brought uniformity in poverty measurement but it did not bring any improvement in
policy area. Ultimately, it is not of much help to know if the headcount of the poor is
going up or down, since it does not provide sufficient clues as to policies needed to help
them.
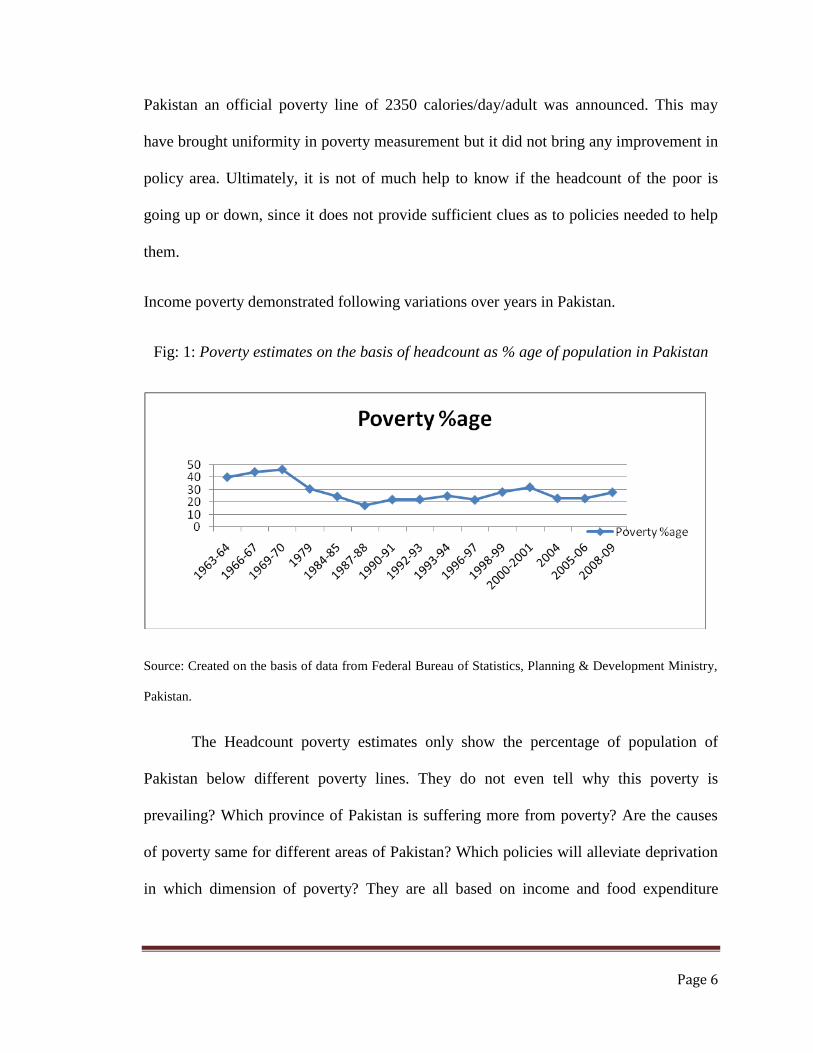
Income poverty demonstrated following variations over years in Pakistan.
Fig: 1: Poverty estimates on the basis of headcount as % age of population in Pakistan
Source: Created on the basis of data from Federal Bureau of Statistics, Planning & Development Ministry,
Pakistan.
The Headcount poverty estimates only show the percentage of population of
Pakistan below different poverty lines. They do not even tell why this poverty is
prevailing? Which province of Pakistan is suffering more from poverty? Are the causes
of poverty same for different areas of Pakistan? Which policies will alleviate deprivation
in which dimension of poverty? They are all based on income and food expenditure
Page 7
approaches of poverty measurement. Therefore, headcount measures fail to depict a true
and transparent picture of nature, extent, causes and intensity of poverty in Pakistan.
Despite these deficiencies, the unidimensional poverty indices have been widely
used due to three aspects. Firstly, they are simple and easy in application. Secondly, blind
trust in ‘trickledown’ theory suggests that growth is sufficient to remove poverty; this
theory has been repeatedly rejected across the globe.7 Thirdly, nonexistence of a sound
and robust multidimensional poverty index also favored the use of one dimensional
measure.
3. The Alkire-Foster Measure
A large number of complex and difficult problems have hindered the
development of suitable multidimensional measure of poverty. How to select the
dimensions of poverty? How to decide upon cut-offs or poverty lines within each
dimension? How to aggregate all these different dimensions? What weights to apply at
each dimension? How to capture the varying inter-relationships of these dimensions? The
Alkire-Foster measure provides satisfactory answers to all of these questions. For a
complete discussion of the debates and justifications for the choices, the reader may
consult training material for producing national human development reports by Alkire
7 “For the 1%, of the 1%, by the 1%,” Stiglitz has recorded how the top 1% of the USA population has
massively increased their share of the income and wealth of the entire country over the past two decades. http://www.vanityfair.com/society/features/2011/05/top-one-percent-201105
Page 8
and Seth (2011).8 The Alkire-Foster methodology has been used to construct the MPI, a
multi-dimensional poverty index which has specific dimensions and cutoffs.9
Internationally this index has been built using eleven different indicators
including health, education, shelter, occupation, empowerment, child development, living
standard, social exclusion, assets, air quality, and security.
In attempting to adopt this methodology for Pakistan, we found data was only
accessible regarding seven dimensions. Another limitation was unavailability of true
panel data. Instead ‘Household Income and Expenditure Survey’ (HIES) and ‘Pakistan
Social and Living Standard Measurement Survey’ (PSLM) were used for available years
since 1998-2006. It appears very hard to theoretically agree on the dimensions which
should be included as poverty constituents. There is a vast debate going on to include
many dimensions some of them are even currently considered as immeasurable like self
respect, social exclusion etc. All the same, one does not have to be a genius to identify
absolute basic necessities for human survival e.g. health, education, shelter, water
&sanitation, nutrition etc. A composite index should include as many of these real
dimensions as possible. Data availability as mentioned above hampers the true
measurement of poverty. Though no multidimensional poverty measurement has been
done in Pakistan before, but people like Zaidi & Devos (1994), Malik (1996), Kemal
(2003), Jamal (2005) and Haq (2005) have suggested that it is urgently needed. They
have also suggested health, education, living standard, assets, occupation or livelihood to
8 http://www.ophi.org.uk/wp-content/uploads/MPI-Primer1.pdf?cda6c1
9See Alkire, S. and Foster, J. 2007, 'Counting and Multidimensional Poverty Measures', OPHI Working
Paper 7 Oxford University: Oxford Poverty & Human Development Initiative.
Page 9
be some of the dimensions of poverty. We have used all dimensions on which data was
available to build a version of the MPI in Pakistan.
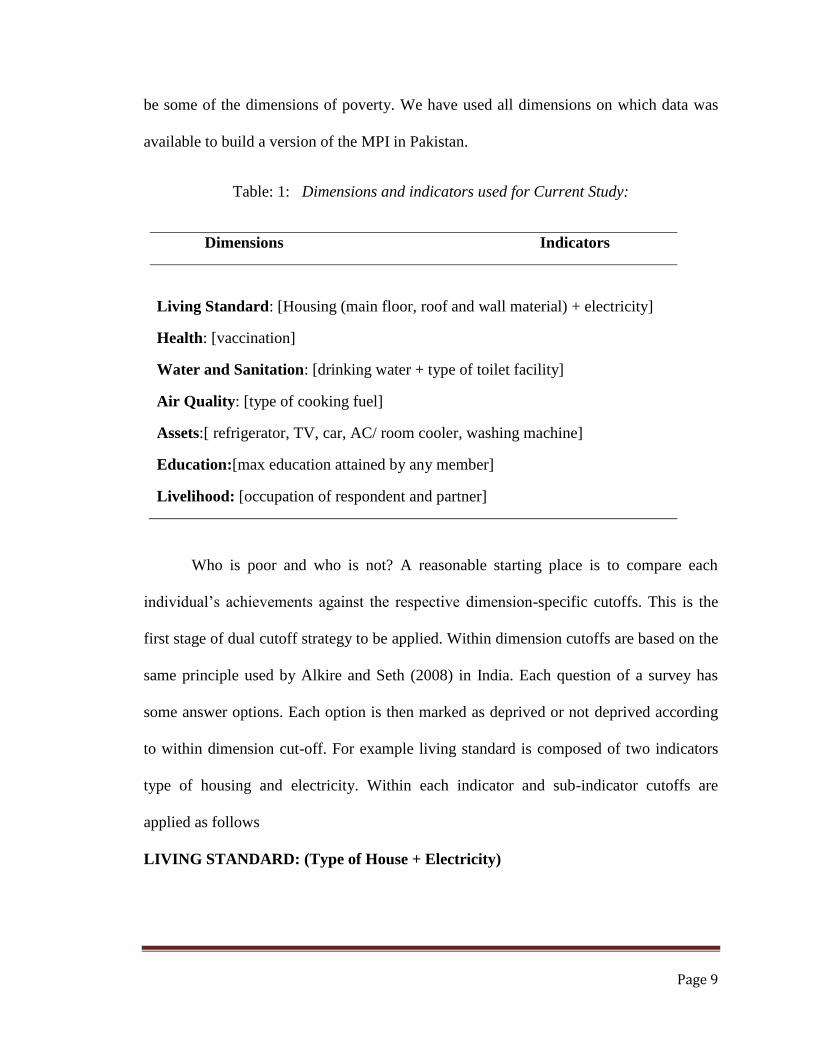
Table: 1: Dimensions and indicators used for Current Study:
Dimensions Indicators
Living Standard: [Housing (main floor, roof and wall material) + electricity]
Health: [vaccination]
Water and Sanitation: [drinking water + type of toilet facility]
Air Quality: [type of cooking fuel]
Assets:[ refrigerator, TV, car, AC/ room cooler, washing machine]
Education:[max education attained by any member]
Livelihood: [occupation of respondent and partner]
Who is poor and who is not? A reasonable starting place is to compare each
individual’s achievements against the respective dimension-specific cutoffs. This is the
first stage of dual cutoff strategy to be applied. Within dimension cutoffs are based on the
same principle used by Alkire and Seth (2008) in India. Each question of a survey has
some answer options. Each option is then marked as deprived or not deprived according
to within dimension cut-off. For example living standard is composed of two indicators
type of housing and electricity. Within each indicator and sub-indicator cutoffs are
applied as follows
LIVING STANDARD: (Type of House + Electricity)

Page 10
This dimension corresponds to Question 109,110,111& 107 in the PDHS
questionnaire (similarly these questions are also present in HIES and PSLM but with
different numbers)
Poverty Cut-off Z1 – in each question bold ones were considered as poor10
and
allotted 1 value and non bold ones were considered as non-poor and allotted 0 value.
Poverty cut-off denotes the situation under which a household is deprived in any two of
the above mentioned indicators.
Question 109 main material of floor (MFM): natural floor, earth/sand/mud floor,
finished floor: chips/terrazzo, ceramic tiles, marble, cement, carpet, bricks, mats, other.
Question 110 main material of roof (MRM): natural roofing:
thatch/bamboo/wood/mud, rudimentary roofing, cardboard/plastic, finished roofing:
iron sheets/asbestos, t-iron/wood/brick, reinforced brick cement/RCC, other.
Question 111 main material of walls (MWM): natural walls: mud/stones,
bamboo/sticks/mud, rudimentary walls: unbaked bricks/mud, plywood sheets,
carton/plastic, finished walls: stone, blocks, baked bricks, cement blocks/cement, tent,
others.
Question 107 House has electricity: yes, no.
Similarly these within dimension cutoffs are applied on other dimensions of the
study. But dimension specific cutoffs alone do not suffice to identify who is poor; we
must consider additional criteria that look across dimensions to arrive at a complete
10
See Alkire, S. and Seth, S. (2008) Measuring Multidimensional Poverty in India: A New Proposal. OPHI
discussion paper 15.

Page 11
specification of identification method. This is the second stage of dual cutoff method.
The most commonly used identification criterion is called the union method of
identification. In this approach, a person i is said to be multidimensional poor if there is at
least one dimension in which the person is deprived (k= 1). The other extreme
identification method is the intersection approach, which identifies person i as being poor
only if the person is deprived in all dimensions (k=d) (where d is the number of
dimensions under study). This criterion would accurately identify the poorest of the poor
but excludes those who are above the poverty threshold in even one dimension, even if
they are poor in all others. Secondly, as the dimensions grow the proportion of the
population appearing as poor declines to nearly zero. A natural alternative is to use an
intermediate cutoff level for ci that lies somewhere between the two extremes of 1 and d.
In other words, k identifies person i as poor when the number of dimensions in which i is
deprived is at least k; otherwise, if the number of deprived dimensions falls below the
cutoff k, then i is not poor according to k. Since k is dependent on both the within
dimension cutoffs and the across dimension cutoff k, Alkire& Foster have referred to k as
the dual cutoff method of identification. Here k includes the union and intersection
methods as special cases where k = 1 and k = d.
Page 12
Result and Discussion:
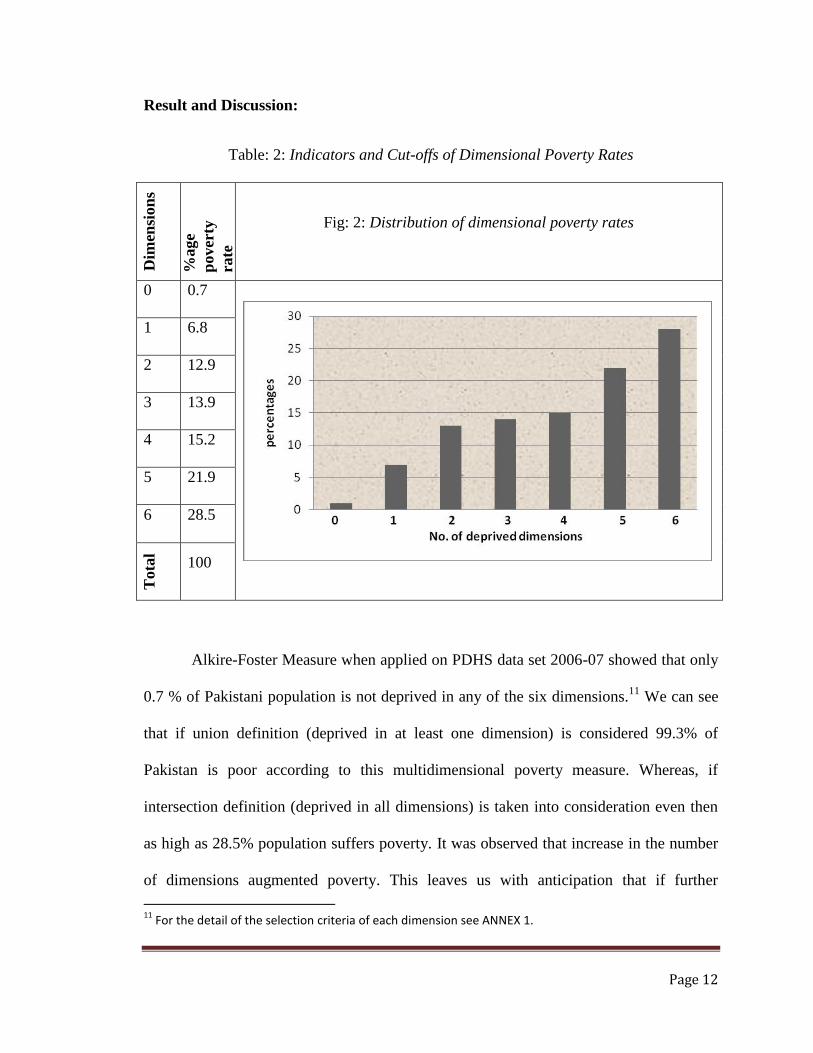
Table: 2: Indicators and Cut-offs of Dimensional Poverty Rates D
imen
sion
s
%age
pover
ty
rate
Fig: 2: Distribution of dimensional poverty rates
0 0.7
1 6.8
2 12.9
3 13.9
4 15.2
5 21.9
6 28.5
Tota
l
100
Alkire-Foster Measure when applied on PDHS data set 2006-07 showed that only
0.7 % of Pakistani population is not deprived in any of the six dimensions.11
We can see
that if union definition (deprived in at least one dimension) is considered 99.3% of
Pakistan is poor according to this multidimensional poverty measure. Whereas, if
intersection definition (deprived in all dimensions) is taken into consideration even then
as high as 28.5% population suffers poverty. It was observed that increase in the number
of dimensions augmented poverty. This leaves us with anticipation that if further
11
For the detail of the selection criteria of each dimension see ANNEX 1.
Page 13
dimensions were included like health, empowerment and child status etc. probably the
analysis would have shown a bleaker picture. Nearly 47% of the population is poor in
four dimensions.
In Table 3, the number of poor in multiple dimensions; the cut-off based
headcount ratios and the adjusted headcount ratios are shown. The union approach would
identify 92.5 per cent of rural population as poor. On the other hand, the intersection
approach leads to 28.5% poverty. If the poverty cut-off is two that means people are
deprived in two or more than two out of six dimensions. 65.6 per cent of population
belongs to poor households and it denotes the multidimensional headcount ratio for this
k=4 cut-off. To avoid criticisms of the multidimensional headcount ratio (it does not take
into account the breadth of multidimensional poverty, does not satisfy dimensional
monotonicity, and is not decomposable) the adjusted headcount ratio (M0) as a measure
of poverty has been used instead of a multidimensional headcount. For theoretical
properties of M0, see Alkire-Seth (2008).
We use the cut-off of two out of six subsequently, because leaving aside union
definition k=2 is the cut-off showing the broadest picture of deprivation. The third
column of Table 3.3 reports the adjusted headcount poverty rates for different cut-offs. If
the poverty cut-off is four out of six dimensions, then M0 is 0.568. As M0 = HA. For the
poverty cut-off of four out of six dimensions, H is equal to 0.656 and A is equal to
0.568/.656 = 0.866. A can be interpreted as the poor being deprived in 86.6 per cent of all
dimensions on average. Thus, the fourth column reports the average depth of poverty
among the population from the poor households. This shows that if k=6 is considered
then 28.5% of population is poor with 100 % average deprivation in all dimensions.
Page 14
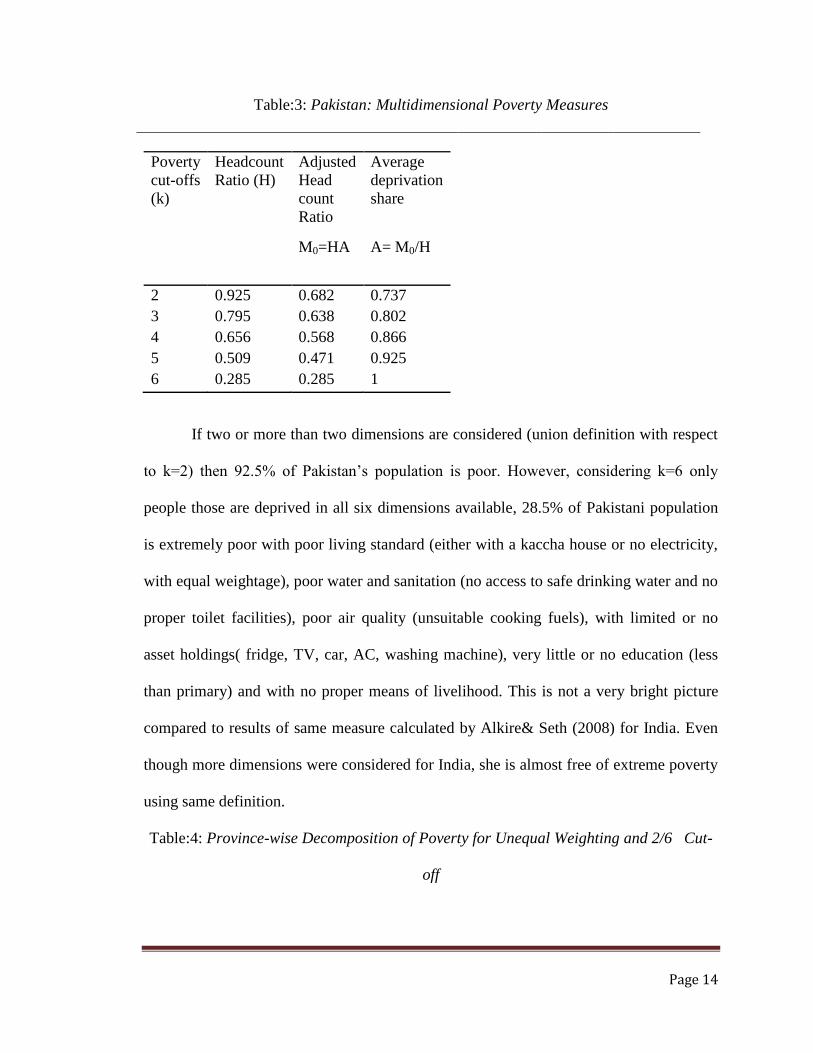
Table:3: Pakistan: Multidimensional Poverty Measures
Poverty
cut-offs
(k)
Headcount
Ratio (H)
Adjusted
Head
count
Ratio
Average
deprivation
share
M0=HA A= M0/H
2 0.925 0.682 0.737
3 0.795 0.638 0.802
4 0.656 0.568 0.866
5 0.509 0.471 0.925
6 0.285 0.285 1
If two or more than two dimensions are considered (union definition with respect
to k=2) then 92.5% of Pakistan’s population is poor. However, considering k=6 only
people those are deprived in all six dimensions available, 28.5% of Pakistani population
is extremely poor with poor living standard (either with a kaccha house or no electricity,
with equal weightage), poor water and sanitation (no access to safe drinking water and no
proper toilet facilities), poor air quality (unsuitable cooking fuels), with limited or no
asset holdings( fridge, TV, car, AC, washing machine), very little or no education (less
than primary) and with no proper means of livelihood. This is not a very bright picture
compared to results of same measure calculated by Alkire& Seth (2008) for India. Even
though more dimensions were considered for India, she is almost free of extreme poverty
using same definition.
Table:4: Province-wise Decomposition of Poverty for Unequal Weighting and 2/6 Cut-
off
Page 15
Regions(provinces) Population
share(%age)
H=q/n H rank Mo Mo Rank
Punjab 41.8% .901 1 .632 1
Sindh 27.1% .92 2 .685 2
NWFP 19.5% .95 3 .722 3
Baluchistan 11.6% .97 4 .776 4
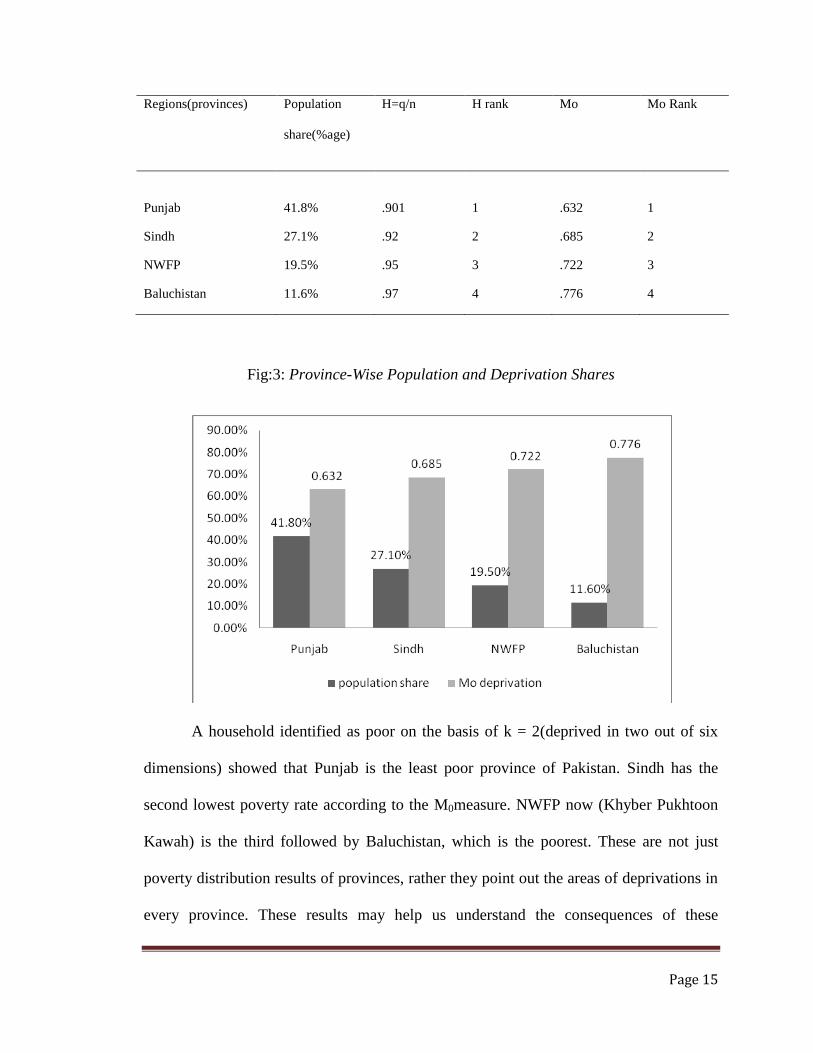
Fig:3: Province-Wise Population and Deprivation Shares
A household identified as poor on the basis of k = 2(deprived in two out of six
dimensions) showed that Punjab is the least poor province of Pakistan. Sindh has the
second lowest poverty rate according to the M0measure. NWFP now (Khyber Pukhtoon
Kawah) is the third followed by Baluchistan, which is the poorest. These are not just
poverty distribution results of provinces, rather they point out the areas of deprivations in
every province. These results may help us understand the consequences of these
Page 16
deprivations to Pakistan. Today the deep political frustrations and unrest in Baluchistan
may have a simple solution: removal of deprivations from the lives of people of
Baluchistan.
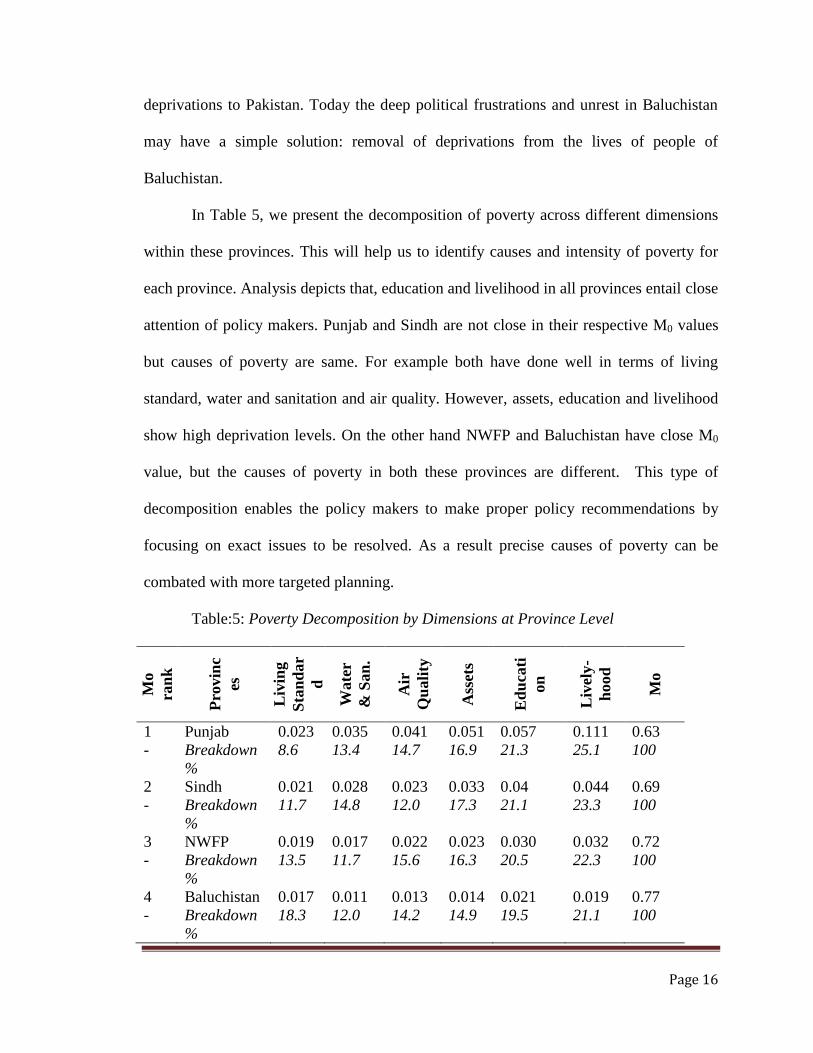
In Table 5, we present the decomposition of poverty across different dimensions
within these provinces. This will help us to identify causes and intensity of poverty for
each province. Analysis depicts that, education and livelihood in all provinces entail close
attention of policy makers. Punjab and Sindh are not close in their respective M0 values
but causes of poverty are same. For example both have done well in terms of living
standard, water and sanitation and air quality. However, assets, education and livelihood
show high deprivation levels. On the other hand NWFP and Baluchistan have close M0
value, but the causes of poverty in both these provinces are different. This type of
decomposition enables the policy makers to make proper policy recommendations by
focusing on exact issues to be resolved. As a result precise causes of poverty can be
combated with more targeted planning.
Table:5: Poverty Decomposition by Dimensions at Province Level
Mo
ran
k
Pro
vin
c
es
Liv
ing
Sta
nd
ar
d
Wate
r
& S
an
.
Air
Qu
ali
ty
Ass
ets
Ed
uca
ti
on
Liv
ely
-
hood
Mo
1 Punjab 0.023 0.035 0.041 0.051 0.057 0.111 0.63
- Breakdown
%
8.6 13.4 14.7 16.9 21.3 25.1 100
2 Sindh 0.021 0.028 0.023 0.033 0.04 0.044 0.69
- Breakdown
%
11.7 14.8 12.0 17.3 21.1 23.3 100
3 NWFP 0.019 0.017 0.022 0.023 0.030 0.032 0.72
- Breakdown
%
13.5 11.7 15.6 16.3 20.5 22.3 100
4 Baluchistan 0.017 0.011 0.013 0.014 0.021 0.019 0.77
- Breakdown
%
18.3 12.0 14.2 14.9 19.5 21.1 100
Page 17
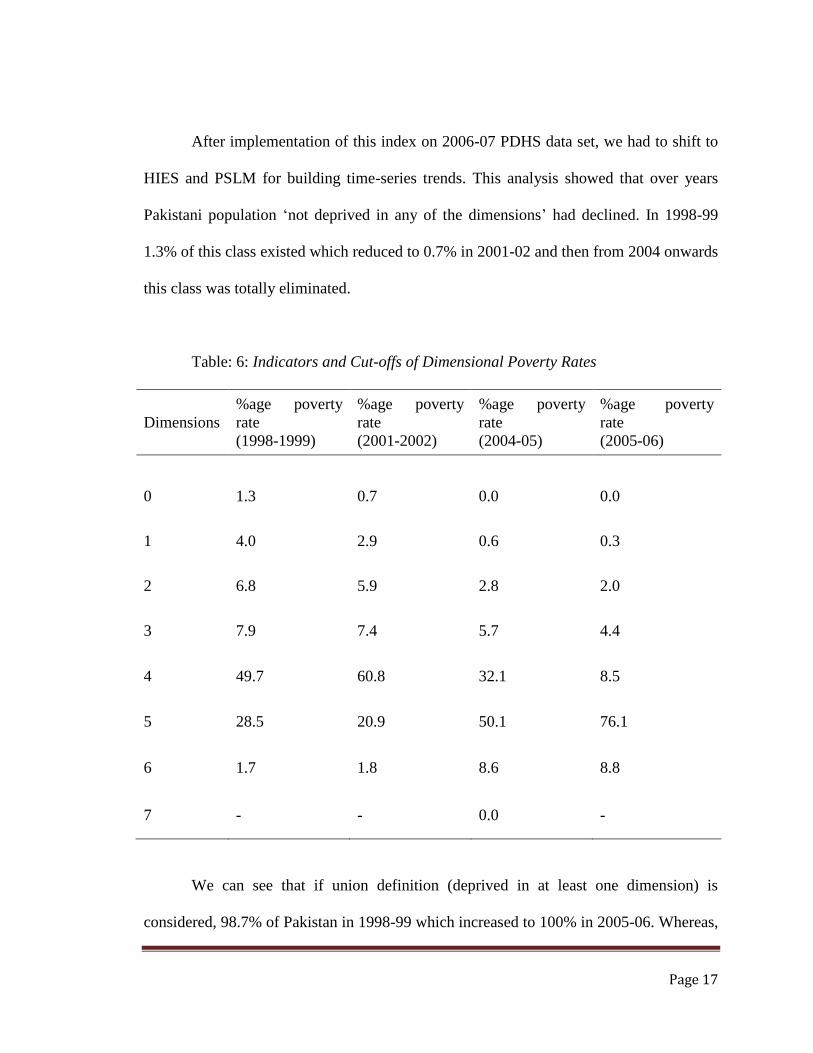
After implementation of this index on 2006-07 PDHS data set, we had to shift to
HIES and PSLM for building time-series trends. This analysis showed that over years
Pakistani population ‘not deprived in any of the dimensions’ had declined. In 1998-99
1.3% of this class existed which reduced to 0.7% in 2001-02 and then from 2004 onwards
this class was totally eliminated.
Table: 6: Indicators and Cut-offs of Dimensional Poverty Rates
Dimensions
%age poverty
rate
(1998-1999)
%age poverty
rate
(2001-2002)
%age poverty
rate
(2004-05)
%age poverty
rate
(2005-06)
0 1.3 0.7 0.0 0.0
1 4.0 2.9 0.6 0.3
2 6.8 5.9 2.8 2.0
3 7.9 7.4 5.7 4.4
4 49.7 60.8 32.1 8.5
5 28.5 20.9 50.1 76.1
6 1.7 1.8 8.6 8.8
7 - - 0.0 -
We can see that if union definition (deprived in at least one dimension) is
considered, 98.7% of Pakistan in 1998-99 which increased to 100% in 2005-06. Whereas,
Page 18
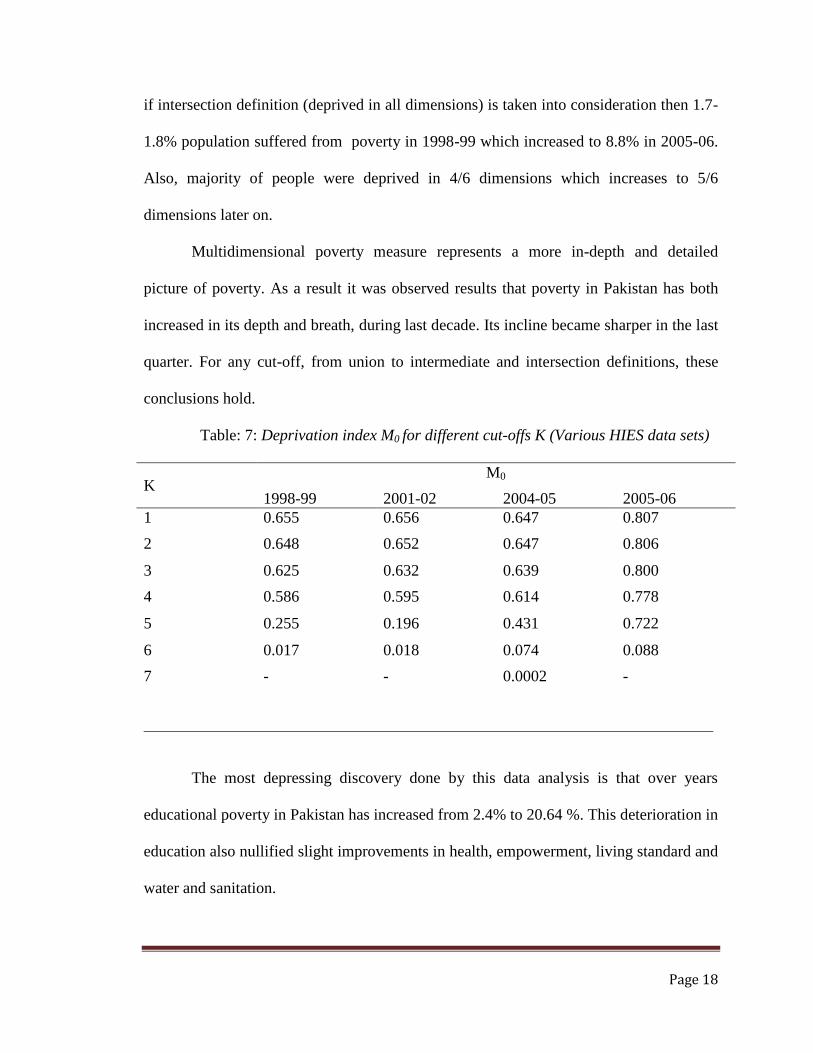
if intersection definition (deprived in all dimensions) is taken into consideration then 1.7-
1.8% population suffered from poverty in 1998-99 which increased to 8.8% in 2005-06.
Also, majority of people were deprived in 4/6 dimensions which increases to 5/6
dimensions later on.
Multidimensional poverty measure represents a more in-depth and detailed
picture of poverty. As a result it was observed results that poverty in Pakistan has both
increased in its depth and breath, during last decade. Its incline became sharper in the last
quarter. For any cut-off, from union to intermediate and intersection definitions, these
conclusions hold.
Table: 7: Deprivation index M0 for different cut-offs K (Various HIES data sets)
K M0
1998-99 2001-02 2004-05 2005-06
1 0.655 0.656 0.647 0.807
2 0.648 0.652 0.647 0.806
3 0.625 0.632 0.639 0.800
4 0.586 0.595 0.614 0.778
5 0.255 0.196 0.431 0.722
6 0.017 0.018 0.074 0.088
7 - - 0.0002 -
The most depressing discovery done by this data analysis is that over years
educational poverty in Pakistan has increased from 2.4% to 20.64 %. This deterioration in
education also nullified slight improvements in health, empowerment, living standard and
water and sanitation.

Page 19
Education plays pivotal role in the development of any country. Seminal research
by Barro (1997) shows that long run growth is primarily determine by investment in
education. Its deprivation leads to tribulations in long-run growth and progress. Pakistan
not only needs to find out the causes of this education poverty but also should try and
make policies for a quick recovery.
Table: 8: Time series trends in Dimension-wise poverty breakdown (%age) HIES
Data
Dimensions/
Years
1998-99 2001-02 2004-05 2005-06
M0
%age
M0
%age
M0
%age
M0
%age
Occupation 0.043 6.64 0.038 6.0 0.024 3.75 0.019 2.43
Education 0.016 2.4 0.016 2.0 0.091 13.9 0.166 20.64
Health 0.145 22.2 0.144 22.0 0.131 20.1 0.154 19.16
Women
Empowerment
0.147 22.5 0.149 22.8 - - 0.154 19.09
Living Standard 0.156 23.9 0.158 24.2 0.137 21.0 0.159 19.86
Water Sanitation 0.146 22.4 0.147 22.4 0.127 19.5 0.015 18.80
Assets - - - - 0.121 18.5 - -
Air Quality - - - - 0.017 2.59 - -
Page 20
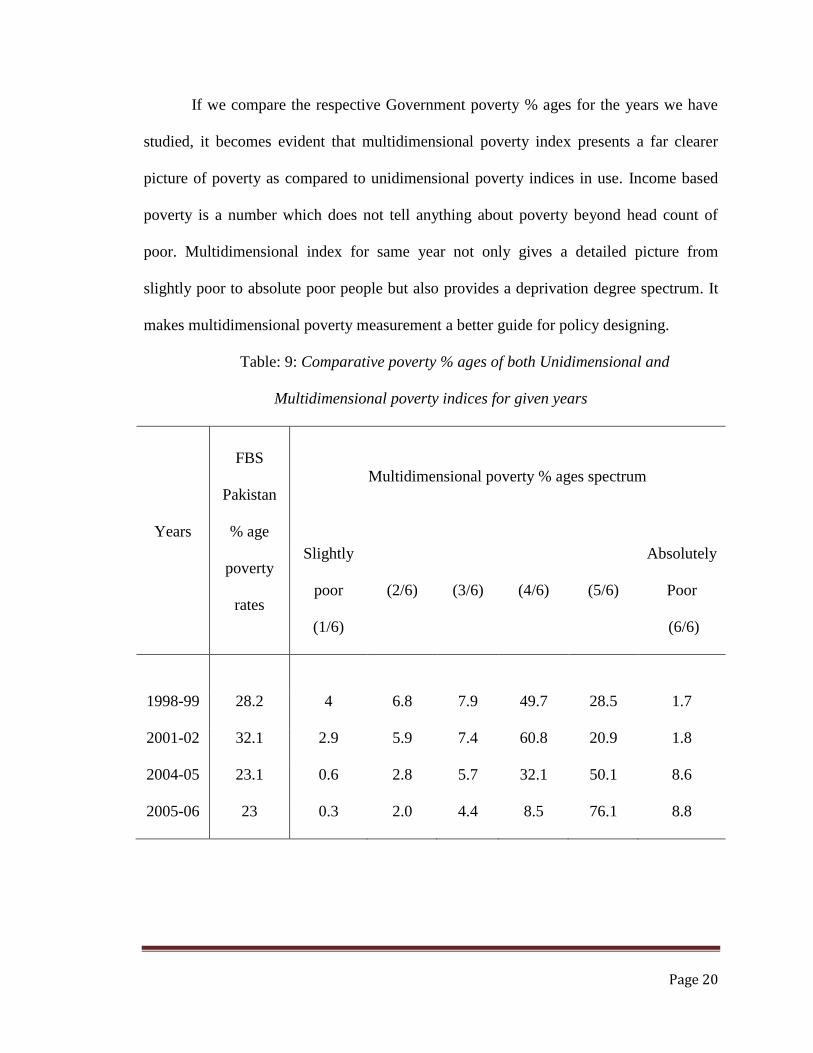
If we compare the respective Government poverty % ages for the years we have
studied, it becomes evident that multidimensional poverty index presents a far clearer
picture of poverty as compared to unidimensional poverty indices in use. Income based
poverty is a number which does not tell anything about poverty beyond head count of
poor. Multidimensional index for same year not only gives a detailed picture from
slightly poor to absolute poor people but also provides a deprivation degree spectrum. It
makes multidimensional poverty measurement a better guide for policy designing.
Table: 9: Comparative poverty % ages of both Unidimensional and
Multidimensional poverty indices for given years
Years
FBS
Pakistan
% age
poverty
rates
Multidimensional poverty % ages spectrum
Slightly
poor
(1/6)
(2/6) (3/6) (4/6) (5/6)
Absolutely
Poor
(6/6)
1998-99 28.2 4 6.8 7.9 49.7 28.5 1.7
2001-02 32.1 2.9 5.9 7.4 60.8 20.9 1.8
2004-05 23.1 0.6 2.8 5.7 32.1 50.1 8.6
2005-06 23 0.3 2.0 4.4 8.5 76.1 8.8

Page 21
Conclusions:
Poverty being a multidimensional phenomenon should have an equally
multidimensional measure for its true representation. A dimension level breakdown of
poverty analysis will help policy makers to design proper targeted policy of poverty
alleviation on the basis of area, demographic distributions, ethnicity and gender. These
results will help people to relate to the other issues in the society as a consequence of
deprivations in different dimensions of poverty. Whereas headcount measures do not
provide clues to suitable policy, our multidimensional measure shows that the critical
fronts are Health and Education. On both of these fronts, we have had a dramatic rise in
poverty. Both research and common sense agree on the idea that the future of the nation
lies with our youth. Failings on the educational front do not bode well for the future, and
it is an urgent need to take suitable measures to rectify this problem.
References:
Alkire, S. and Foster, J. (2007) Counting and Multidimensional Poverty
Measures. OPHI Working Paper 7 Oxford University: Oxford Poverty & Human
Development Initiative.
Alkire, S. and Santos, Maria Emma. (2007) Multidimensional Poverty Index.
OPHI discussion paper.
Alkire, S. and Seth, S. (2008) Measuring Multidimensional Poverty in India: A
New Proposal. OPHI discussion paper 15.
Allaudin, T. (1975) Mass Poverty in Pakistan: A Further Study. The Pakistan
Development Review 14:4
Page 22
Barro, Robert J. (1997) Determinants of Economic Growth: A Cross-Country
Empirical Study (Cambridge, MA: MIT Press).
Economic Survey of Pakistan, Planning and development Ministry, 2003-04.
Haq, Mahbub-ul. (1976) The Poverty Curtain: Choices for the Third World.
Columbia University Press. 247 pages. ISBN 0231040628
Haq, R. (2005) An analysis of poverty at the local level. The Pakistan
Development Review 44:4 Part II 1093-1109.
http://www.ophi.org.uk/wp-content/uploads/OPHI-wp15.pdf
Jamal, H. (2005) In search of poverty predictors- the case of urban and rural
Pakistan. The Pakistan Development Review 44:1 37-55
Kemal, A.R. (2003) ‘Structural Adjustment & poverty in Pakistan’ MIMAP
technical paper series # 14
Kemal, A.R. (2003) Institutional change, growth and poverty levels in Pakistan.
The Pakistan Development Review vol. 42, No. 4, pg 299
Malik, S.J. (1996) Determinants of rural poverty in Pakistan: A micro study. The
Pakistan Development Review 35:2 171-87
Mujahid, G. B. S. (1978) A note on measurement of poverty and income
inequalities in Pakistan- some observations on methodology. The Pakistan
Development Review 17:3
Naseem, S. M. (1973) Mass poverty in Pakistan: some preliminary findings. The
Pakistan Development Review 12:4
Naseem, S. M. (1977) Rural poverty and landlessness in Pakistan. In poverty and
landlessness in Asia. Geneva: ILO
Page 23
Sen, A. (1976) Poverty: An Ordinal Approach to Measurement.Econometrica,44:
219-31.
Sen, A. (1977)Rational Fools: A Critique of the Behavioral Foundations of
Economic Theory. Philosophy and Public Affairs, Vol. 6, No. 4. pp. 317-344;
Thorbecke, E. (2005) Multidimensional poverty: conceptual and measurement
issues. paper prepared for The Many Dimensions of Poverty International
Conference, UNDP International Poverty Centre, Brasilia, August 29-31, 2005
Zaidi, M. A. & De Vos, K. (1994) Trend analysis of relative poverty in Pakistan
(1984-85 – 1987-88). The Pakistan Development Review 33:4 Part II 915-934.