Embed Size (px)
Citation preview

Multilateral Environmental Agreements and the WTO
Daniel L. Millimet∗
Southern Methodist University & IZA
Jayjit Roy
Appalachian State University
May 12, 2014
Abstract
Rules promoting nondiscriminatory trade under the World Trade Organization (WTO), and its predecessor the
General Agreement on Tariffs and Trade (GATT), may have a ‘chilling’ effect on participation in multilateral en-
vironmental agreements (MEAs). This chilling effect may arise since many MEAs either directly distort trade or
because MEAs use trade policy to induce cooperation and/or prevent so-called trade leakage. We investigate the
empirical relevance of this chilling effect while simultaneously addressing two econometric difficulties: self-selection
into the GATT/WTO and the difficulty of actually classifying GATT/WTO membership status. To do so, we employ
a partial identification approach in order to bound the causal effect of GATT/WTO membership on participation
in MEAs using country-level panel data. The analysis reveals a positive association between WTO membership
and MEA participation in the absence of misclassification. However, under the assumptions considered here, one
is unable to exclude the possibility that the GATT/WTO has no causal effect on MEA participation for the full
sample. We do obtain strictly negative bounds for non-OECD countries in the WTO era (1995-2001), indicating a
negative, causal effect of WTO membership on MEA participation by less developed countries.
JEL: C21, F18, F64, Q37, Q56
Keywords: WTO, Multilateral Environmental Agreements, Partial Identification
∗The authors are grateful to Ronald Mitchell for sharing the data on environmental agreements, and comments from Dave McEvoy,seminar participants at Appalachian State University, North Carolina State University, SMU, and UNC Greensboro, and conferenceparticipants at the 2013 Southern Economic Association Meetings. Corresponding author: Daniel Millimet, Department of Economics,Box 0496, Southern Methodist University, Dallas, TX 75275-0496. Tel: (214) 768-3269. Fax: (214) 768-1821. E-mail: [email protected].

1 Introduction
Many aspects of the complex relationship between international trade and environmental quality have received
significant attention by researchers, environmentalists, and policymakers. While much is now known about the
interaction between trade and the environment, the same cannot be said about the interplay between international
trade agreements and domestic environmental policy. Here, we are interested in the relationship between membership
in the World Trade Organization (WTO) and its predecessor, the General Agreements on Tariffs and Trade (GATT),
and participation in multilateral environmental agreements (MEAs).1
Since World War II, more than 150 countries have joined the GATT/WTO. During the same period, numerous
MEAs have also been formed; over 350 international environmental agreements (IEAs) are currently in force and
most consist of at least five countries. Moreover, the importance of MEAs to the protection of the environment is
not likely to diminish in the future as the trend toward economic integration leads to a need for greater coordination
of environmental efforts. In this paper, we investigate the causal effect of GATT/WTO membership on MEA
participation.
In light of the positive time trends in WTO membership and the number of MEAs in force, the time series evidence
does not suggest a ‘chilling’ effect of WTO membership on the creation of new MEAs. Nonetheless, there are reasons
to be concerned. First, theoretical models of MEAs emphasize the need for full participation to achieve success, and
full participation requires punishments (or rewards) which typically are enacted through trade policies such as trade
sanctions, import tariffs, or export subsidies. Absent such punishments (or rewards), full participation is difficult
to sustain in theory. Moreover, trade leakage due to nonparticipants may undermine the effectiveness of MEAs
(Barrett 2005). In practice, Eckersley (2004, p. 26) states that “increasing international awareness of vulnerability
to a WTO challenge has given rise to a conservative or ‘cool’ implementation of trade restrictive obligations under
existing MEAs to avoid the threat of legal challenge.” Second, some MEAs must impede free trade by definition
to achieve their objectives. For example, the Convention on International Trade in Endangered Species of Wild
Fauna and Flora (CITES) aims “to ensure that international trade in specimens of wild animals and plants does not
threaten their survival.”2 Thus, the underlying premise of the MEA is to impede trade in certain goods for the sake
of environmental preservation.
Given that many MEAs are incompatible with the objectives of the WTO to further the “principles of liberaliza-
tion” through “commitments to lower custom tariffs and other trade barriers” and agreements to “require govern-
ments to make their trade policies transparent by notifying the WTO about laws in force and measures adopted,”
countries may be wary of joining MEAs that distort free trade due to fear of violating WTO rules (Rauscher 2005).3
Thus, even though an increasing number of MEAs have entered into force, less than full participation may, in part,
be attributable to the WTO and may undermine the effectiveness of these agreements. Alternatively, attempts by
relatively recent MEAs to ensure compatibility with multilateral trade rules through the avoidance of trade issues
do so at the expense of effectiveness, making them less appealing to potential participants. For example, Eckersley
(2004, p. 26) concludes that “the expanding reach of the WTO’s trade agreements does serve to cramp the scope
1For more general discussion of the relationship between the WTO and environmental policy, see Neumayer (2004), Bernasconi-Osterwalder et al. (2006), and Millimet and Tchernis (2009).
2See http://www.cites.org/eng/disc/what.php.3See http://wto.org/english/thewto_e/whatis_e/what_we_do_e.htm.
1

and operation of MEAs ...”
On the other hand, there are some reasons for optimism when it comes to the compatibility of WTO membership
and participation in MEAs. First, although the WTO aims to promote nondiscriminatory trade, Article XX of the
GATT allows for exceptions in order to protect human, animal, or plant health (or life) as long as the adopted
measures do not discriminate in an arbitrary or unjust manner, are not a form of disguised protection, and are
the least trade restrictive among alternatives. If WTO members consider a particular MEA to fall under this
exception, participation in the MEA may be undeterred by WTO membership. Second, while controversial, if WTO
membership increases trade, and subsequently economic growth, then this income effect may induce greater demand
for environmental protection and, hence, participation in MEAs. Third, WTO members may actually be more
inclined to participate in MEAs in order to avail non-tariff barriers (such as labeling requirements) to circumvent
the reduction in tariffs induced by WTO membership. While not allowed under WTO rules, countries may pursue
this path as the WTO has yet to witness a formal dispute involving a measure supported by a MEA.
In the end, then, whether the WTO has a causal effect on participation in MEAs is an empirical question.
Unfortunately, answering this question is not straightforward for two econometric reasons. First, countries self-select
into the WTO (subject to WTO approval). As such, membership status in the WTO may reflect other country-level
attributes (both observed and unobserved to the researcher) that are correlated with MEA participation. For example,
countries that are committed to global integration may have a strong desire to simultaneously join the WTO and
enter into a variety of MEAs. Or, countries may use participation in MEAs to signal creditworthiness to potential
creditors, as shown in Rose and Spiegel (2009), which may also facilitate accession into the WTO. Alternatively,
countries with certain political institutions may find it more difficult to agree to the terms of international trade and
environmental agreements (Barrett 2005; Wangler et al. 2011). The econometric difficulty posed by this potential
non-random selection is exacerbated by the lack of traditional instrumental variables (IVs); it is difficult to conceive
of country-level attributes impacting its propensity to enter into international trade agreements but not directly
affecting its propensity to enter into international environmental agreements.
The second econometric difficulty that arises, perhaps surprisingly, pertains to the measurement of WTO mem-
bership status. The literature on the effects of WTO membership on trade volumes has highlighted concerns over
de jure versus de facto accession into the WTO (Tomz et al. 2007). Since misclassification of a binary indicator
of membership status induces nonclassical measurement error this is not a trivial issue (Black et al. 2000; Millimet
2011).
To overcome these difficulties, we utilize the nonparametric partial identification method proposed in Kreider
et al. (2012) to account for both non-random selection and measurement error in WTO membership in a single
unifying framework. It provides sharp bounds on the average treatment effect (ATE) of WTO membership status
on MEA participation when membership into the WTO is non-random and potentially measured with error. These
bounds require weaker assumptions than those of an IV, classical measurement error, or linear response model while
addressing both selection and measurement error in WTO membership. However, as a consequence of imposing less
structure, we obtain bounds rather than point estimates. Nonetheless, the bounds reveal exactly what can be learned
under different assumptions concerning the nature of the selection process and the extent of misreporting. Tamer
(2010, p. 168) summarizes the advantages of this approach: “This partial identification approach favors the principle
2

that inference – and conclusions and actions – based on empirical models with fewer suspect assumptions is more
robust, hence more sensible and believable. Stronger assumptions will lead to more information about a parameter,
but less credible inferences can be conducted.” See also Manski (2013) for a detailed introduction to these issues in
a policymaking context.
In terms of the selection problem, we start with the assumption of exogenous selection. We then discuss what
can be learned without making any assumptions concerning the selection mechanism; this is the so-called worst-case
bounds (Manski 1995). Finally, we impose two monotonicity assumptions: a monotone instrumental variable (MIV)
assumption that the latent probability of MEA participation is nondecreasing in gross domestic product (GDP) per
capita and a monotone treatment selection (MTS) assumption that WTO members have a higher probability of being
MEA participants compared to non-members conditional on membership status. The MIV assumption is weaker
than that required for a typical IV (since the MIV is allowed to have a direct impact on the outcome of interest
and may be non-random itself). The MTS assumption posits positive selection into the WTO and its plausibility is
justified below.
In terms of the measurement error problem, the existing literature analyzing the effect of WTO membership
on trade and the environment defines membership in more than one way. While WTO membership is typically
based on a country’s formal accession to the WTO, Tomz et al. (2007) argue that this approach fails to capture
the role of colonies, de facto members, and provisional members as WTO participants. Moreover, Allee and Scalera
(2012, p. 245) “reclassify WTO membership based on type of accession.” Here, we utilize the date of a country’s
formal accession to the WTO to define membership. While we start with the assumption of arbitrary patterns of
measurement error, ranging from zero to 5% of the sample, we focus on the assumption of no false positives since,
according to Tomz et al. (2007), our definition may miss de facto members, but should not incorrectly classify
non-members as members.
To proceed, we utilize panel data on GATT/WTO membership and participation in MEAs for roughly 200
countries over 42 years. Thus, our paper is most similar to Egger et al. (2011). However, a few important distinctions
arise. First, Egger et al. (2011) assess the causal effect of trade liberalization on participation in MEAs. The authors’
measure of trade liberalization is obtained using a gravity model of bilateral trade. Preferential trade agreements
(PTAs) are one component of their gravity model. As a result, while they find a strong effect of trade liberalization
on MEA participation, the ceteris paribus effect of trade agreements may be positive or negative. When the authors
compare the predictions of their model with and without controls for PTAs, they find that PTAs induce a slight
increase in MEA participation. Second, WTO membership is not included in their analysis. Finally, the identification
strategy used differs from that considered here.4
Our results are striking and ought to serve as a note of caution and guide to future evaluations of the effects of
WTO membership on MEA participation. First, using three measures of participation in environmental agreements,
we obtain positive associations between WTO membership and MEA participation when failing to account for non-
random selection or misclassification. Second, if WTO membership status is incorrectly measured for even five percent
of the sample, the ATE cannot always be signed even under the assumption of exogenous selection. Third, bounds
4In a related study, Egger et al. (2013) classify MEAs into five clusters (i.e., biodiversity, atmosphere, land, chemicals and hazardouswastes, and seas) and analyze the determinants of participation in each type while allowing for spillover effects across clusters. Similarly,Davies and Naughton (2013) also consider the role of trade costs while examining the factors affecting IEA participation in a spatial lagmodel.
3

that account for non-random selection into the WTO always include zero for the full sample even if one assumes
no misclassification. However, we obtain strictly negative bounds for the subsample of non-OECD countries in the
WTO period (1995-2001). Finally, measurement error matters as it relates to a widening of the bounds. These results
highlight the importance of accounting for both non-random selection and measurement error in WTO membership
status, as well as exploring heterogeneity in the causal effect of WTO status over time and by development status,
in order to identify the causal impact of WTO membership on MEA participation. More importantly, the results
reveal fairly convincing evidence that WTO membership has a chilling effect on MEA participation by less developed
countries given the demands placed on them for accession to the WTO (Subramanian and Wei 2007).
The remainder of the paper is organized as follows. Section 2 presents the empirical methodology. Section 3
discusses the data. Section 4 discusses the results. Section 5 concludes.
2 Methodology
Our objective is to bound the ATE of WTO membership status on MEA participation. The ATE captures the
expected effect of WTO membership (relative to non-membership) for a random country chosen from the underlying
population. With binary outcomes, the ATE is defined as
ATE(1, 0) = P [M(WTO∗ = 1) = 1|X ∈ Ω]− P [M(WTO∗ = 0) = 1|X ∈ Ω] (1)
where P [·] denotes the probability of the argument being true, M is a binary indicator defined such that one
(zero) denotes MEA participation (non-participation), and WTO∗ is a binary indicator defined such that one (zero)
corresponds to true WTO membership (non-membership). The probabilities are conditioned on observed covariates
denoted by X ∈ Ω with values in the set Ω. In this approach, conditioning on covariates only helps to define
subpopulations of interest (Kreider et al. 2012). For notational simplicity, X ∈ Ω is dropped in the following
derivations. Furthermore, from here on let M(1) ≡ M(WTO∗ = 1) and M(0) ≡ M(WTO∗ = 0), where M(1) and
M(0) represent potential outcomes.
To assess the causal effect of WTO membership on MEA participation using observational data, two identification
problems must be addressed. The first is the well-known problem of the missing counterfactual. For instance, we do
not observe MEA participation for WTO members if instead they had not been members. This is referred to as the
selection problem. To see this, note that by the Law of Total Probability we can write
P [M(1) = 1] = P [M(1) = 1|WTO∗ = 1]P (WTO∗ = 1) + (2)
P [M(1) = 1|WTO∗ = 0]P (WTO∗ = 0).
If true WTO status is observed, the sampling process identifies P (WTO∗ = 1) and P (WTO∗ = 0) and the expected
outcome conditional on the outcome being observed, P [M(1) = 1|WTO∗ = 1]. However, the sampling process
fails to identify the average outcome for countries who are not WTO members, P [M(1) = 1|WTO∗ = 0]. Thus,
P [M(1) = 1] is not nonparametrically identified. A similar result holds for P [M(0) = 1].
The second identification problem arises if true WTO membership status is not observed for all countries. Let
4

WTO denote the observed indicator of WTO membership, where WTO equals one if the country is considered to
be a formal member and zero otherwise. This is referred to as the measurement or misclassification error problem.
With misclassification the sampling process fails to provide any useful information on actual WTO membership
status, WTO∗, absent assumptions on the extent and type of measurement error. In this case, all quantities on the
right hand side of equation (2) are unknown.
Let the latent variable Z∗ denote whether formal membership is accurate or not; Z∗ equals one if WTO∗ = WTO
and zero otherwise. Kreider et al. (2012) show that P [M(1) = 1] may be decomposed as follows:
P [M(1) = 1] = [P (M = 1,WTO = 1)− θ+1 + θ−1 ] + (3)
P [M = 1|WTO∗ = 0] [P (WTO = 0) + (θ+1 + θ+0 )− (θ−1 + θ−0 )]
where M is the observed (realized) MEA outcome, θ+j ≡ P (M = j,WTO = 1, Z∗ = 0) and θ−j ≡ P (M =
j,WTO = 0, Z∗ = 0) represent the proportion of false positive and false negative classifications of WTO membership,
respectively, for countries realizing outcome M = j, j = 0, 1.5 Examination of (3) reveals that all of the terms on
the right hand side except P (M = 1,WTO = 1) and P (WTO = 0) are unobserved. P [M = 1|WTO∗ = 0] is not
identified since WTO∗ is unobserved and the θ terms are not identified since Z∗ is unobserved.
Given the lack of nonparametric identification of the ATE, bounds are derived by combining various assumptions
concerning the nature of the selection process along with assumptions about the nature and extent of measurement
error.6
2.1 Classification Error Assumptions
When considering measurement error, we discuss two cases. In the first case, no structure is placed on the pattern of
reporting errors. We refer to this case as arbitrary errors. In the second case, some structure is imposed by assuming
that no countries are falsely considered to be WTO members. We refer to this as the case of no false positives.
While the literature examining the effect of WTO membership on trade and the environment defines membership
in more than one way (e.g., Rose 2004; Tomz et al. 2007; Millimet and Tchernis 2009; Roy 2011; Allee and Scalera
2012), we utilize the dates of a country’s formal accession to the WTO to define membership. However, Tomz et
al. (2007) contend that this fails to capture the role of colonies, de facto members, and provisional members as
WTO participants. In other words, the conventional definition of WTO membership mistakenly classifies a number
of WTO participants as non-members. Accordingly, the assumption of no false positive errors appears to be a
reasonable restriction. That said, for ease of exposition, it helps to begin with the case of arbitrary errors and then
impose the assumption of no false positives.
Formally, we follow Gundersen and Kreider (2008) and impose the following assumptions pertaining to classifi-
cation errors:
(A1) Upper Bound Error Rate Assumption: P (Z∗ = 0) ≤ Q
(A2) No False Positives Assumption: If WTO = 1, then Z∗ = WTO∗ = 1.
5The formulae and their derivations come from an earlier version of Kreider et al. (2012).6Estimation is performed using the command -tebounds- in Stata. See McCarthy et al. (2014).
5

Here, Q is an upper bound on the degree of misclassification. It takes a value of zero if one wishes to rule out the
possibility of measurement error in WTO membership status. The second assumption states that countries which are
considered to be WTO members are accurately classified; no such assumption is made concerning countries that are
considered non-members. The arbitrary errors case imposes only Assumption A1; the no false positives case imposes
both Assumptions A1 and A2. In both cases, we vary values of Q, setting Q = 0, 0.01, 0.03, and 0.05. As will be
evident in the presentation of the results, higher values of Q will only widen the bounds further.
The above assumptions on classification errors impose reasonable restrictions on the unknown misclassification
rates θ−1 , θ−0 , θ+1 , and θ+0 . Assumption A1 implies
0 ≤ θ−0 ≤ minQ,P (M = 0,WTO = 0) ≡ θUB−0
0 ≤ θ−1 ≤ minQ,P (M = 1,WTO = 0) ≡ θUB−1
0 ≤ θ+0 ≤ minQ,P (M = 0,WTO = 1) ≡ θUB+0
0 ≤ θ+1 ≤ minQ,P (M = 1,WTO = 1) ≡ θUB+1
and
θ+1 + θ−1 + θ+0 + θ−0 ≤ Q (4)
Assumption A2 implies
θ+1 = θ+0 = 0. (5)
2.2 Exogenous Selection
2.2.1 No Misclassification Errors
To examine the causal effect of WTO membership on MEA participation, the assumption of exogenous selection into
the WTO provides a useful starting point for the analysis. It is expressed as
P [M(1) = 1,WTO∗] = P [M(1) = 1]
which implies
P [M(1) = 1,WTO∗ = 1] = P [M(1) = 1,WTO∗ = 0] = P [M(1) = 1].
Accordingly, using (2) implies
P [M(1) = 1] = P [M = 1|WTO∗ = 1]
P [M(0) = 1] = P [M = 1|WTO∗ = 0] .
6

Finally, with exogenous selection and no misclassification errors, the ATE is nonparametrically identified and given
by
ATE = P [M(1) = 1]− P [M(0) = 1] (6)
= P [M = 1|WTO∗ = 1]− P [M = 1|WTO∗ = 0] .
2.2.2 Misclassification Errors
Allowing for misclassification, the ATE is no longer nonparametrically identified even under the assumption of
exogenous selection as WTO∗ is not observed in (6). To illustrate, note that
P [M(1) = 1] = P [M = 1|WTO∗ = 1]
can be decomposed as
P [M(1) = 1] =P (M = 1,WTO = 1) + θ−1 − θ
+1
P (WTO = 1) + (θ−1 + θ−0 )− (θ+1 + θ+0 )(7)
where the sampling process identifies only P (M = 1,WTO = 1) and P (WTO = 1). The term (θ−1 +θ−0 )− (θ+1 +θ+0 ),
in the denominator, denotes the unobserved excess of false negatives over false positives in the population. The term
(θ−1 − θ+1 ), in the numerator, reflects the excess of false negatives over false positives among those countries with
M = 1.
To derive bounds on the ATE under different assumptions concerning the nature and extent of the misclassification
errors, recall that ATE is given by
ATE = P [M(1) = 1]− P [M(0) = 1] . (8)
Thus, the bounds for the ATE are given by
UBATE = UBP [M(1)=1] − LBP [M(0)=1] (9)
LBATE = LBP [M(1)=1] − UBP [M(0)=1], (10)
where UB and LB denote the upper and lower bounds, respectively.
With arbitrary errors, Kreider et al. (2013) derive the following expressions for the bounds:
UBATE = supa∈[0,θUB−
1 ],f∈[0,minQ−a,θUB+0 ]
[P [M = 1,WTO = 1] + a
P (WTO = 1) + a− f− P [M = 1,WTO = 0]− a
P (WTO = 0)− a+ f
](11)
LBATE = infb∈[0,θUB+
1 ],h∈[0,minQ−b,θUB−0 ]
[P [M = 1,WTO = 1]− bP (WTO = 1)− b+ h
− P [M = 1,WTO = 0] + b
P (WTO = 0) + b− h
]. (12)
Estimation is accomplished by performing separate grid searches for b, h and a, f over the feasible region to minimize
7

(maximize) the LB (UB) of the ATE subject to verifying that each conditional probability does not exceed one:
P [M = 1,WTO = 1]− bP (WTO = 1)− b+ h
≤ 1
P [M = 1,WTO = 0] + b
P (WTO = 0) + b− h≤ 1
P [M = 1,WTO = 1] + a
P (WTO = 1) + a− f≤ 1
P [M = 1,WTO = 0]− aP (WTO = 0)− a+ f
≤ 1.
Under the assumption of no false positives, the bounds on the ATE are given by
UBATE = supa∈[0,θUB−
1 ]
[P [M = 1,WTO = 1] + a
P (WTO = 1) + a− P [M = 1,WTO = 0]− a
P (WTO = 0)− a
](13)
LBATE = infh∈[0,θUB−
0 ]
[P [M = 1,WTO = 1]
P (WTO = 1) + h− P [M = 1,WTO = 0]
P (WTO = 0)− h
]. (14)
Estimation is accomplished by performing separate grid searches for h and a over the feasible region to minimize
(maximize) the LB (UB) of the ATE subject to verifying that each conditional probability does not exceed one:
P [M = 1,WTO = 1]
P (WTO = 1) + h≤ 1
P [M = 1,WTO = 0]
P (WTO = 0)− h≤ 1
P [M = 1,WTO = 1] + a
P (WTO = 1) + a≤ 1
P [M = 1,WTO = 0]− aP (WTO = 0)− a
≤ 1.
2.3 No Selection Assumption
The bounds given in (11) – (14) invoke the assumption of exogenous selection which is highly improbable. As
argued above, many country-specific attributes, unobserved to the researcher, are likely correlated with both WTO
membership and MEA participation. Preferences regarding outward orientation, creditworthiness, and political
institutions represent several examples. Moreover, spatial considerations, found to be important in the literature,
imply that neighboring country attributes are also relevant. Consequently, we next consider what can be learned
about the ATE of WTO membership on MEA participation without invoking any assumptions concerning selection
into the treatment following Manski (1995).
2.3.1 No Misclassification Errors
In the absence of measurement error, but with no assumptions concerning selection, the only information available
concerning the missing counterfactuals are that they lie in the unit interval since they represent probabilities; formally,
P [M(1) = 1|WTO∗ = 0], P [M(0) = 1|WTO∗ = 1] ∈ [0, 1]. Accordingly, the individual components of the ATE are
bounded as follows
8

P [M = 1,WTO∗ = 1] ≤ P [M(1) = 1] ≤ P [M = 1,WTO∗ = 1] + P (WTO∗ = 0)
P [M = 1,WTO∗ = 0] ≤ P [M(0) = 1] ≤ P (WTO∗ = 1) + P [M = 1,WTO∗ = 0] .
Note, the width of the bounds on P [M(1) = 1] is the censoring probability, P (WTO∗ = 0), while the width of the
bounds on P [M(0) = 1] is the inclusion probability, P (WTO∗ = 1). As a result, although the bounds on the ATE
are sharp, the width always equals unity and includes zero (Manski 1995). So, without identifying restrictions on
the selection mechanism, it is impossible to sign the ATE. While the sign is unknown, extreme values are excluded
from the bounds, thus providing some potentially useful information.
2.3.2 Misclassification Errors
Allowing for measurement error, the bounds on individual components of the ATE become
P [M = 1,WTO = 1]− θ+1 + θ−1 ≤ P [M(1) = 1] ≤ P [M = 1,WTO = 1] + P (WTO = 0) + θ+0 − θ−0
P [M = 1,WTO = 0] + θ+1 − θ−1 ≤ P [M(0) = 1] ≤ P [M = 1,WTO = 0] + P (WTO = 1)− θ+0 + θ−0 .
With arbitrary errors, the bounds on ATE are given by
UBATE = P [M = 1,WTO = 1] + P (WTO = 0) + minQ, θUB+0 + θUB−1 − P [M = 1,WTO = 0] (15)
LBATE = P [M = 1,WTO = 1]−minQ, θUB+1 + θUB−0 − P [M = 1,WTO = 0]− P (WTO = 1). (16)
Under the assumption of no false positives, the bounds become potentially tighter and are given by
UBATE = P [M = 1,WTO = 1] + P (WTO = 0) + θUB−1 − P [M = 1,WTO = 0] (17)
LBATE = P [M = 1,WTO = 1]− θUB−0 − P [M = 1,WTO = 0]− P (WTO = 1). (18)
2.4 Monotonicity Assumptions
While the bounds given in (15) – (18) have the advantage of not invoking any assumptions concerning the selection
process into actual treatment assignment, they have the disadvantage of never being able to exclude zero from the
bounds. Thus, the sign of the ATE cannot be learned. To tighten the bounds on ATE, without going so far as to
assume exogenous selection, we assess the identifying power of two monotonicity assumptions which impose different
restrictions on the relationships between WTO membership, MEA participation, and the available data.
2.4.1 Monotone Treatment Selection
The Monotone Treatment Selection (MTS) assumption places some structure on the relationship between potential
outcomes and treatment assignment (Manski and Pepper 2000). Specifically, the MTS assumption posits that
countries that select into the WTO are more likely to participate in MEAs regardless of membership status. This
9
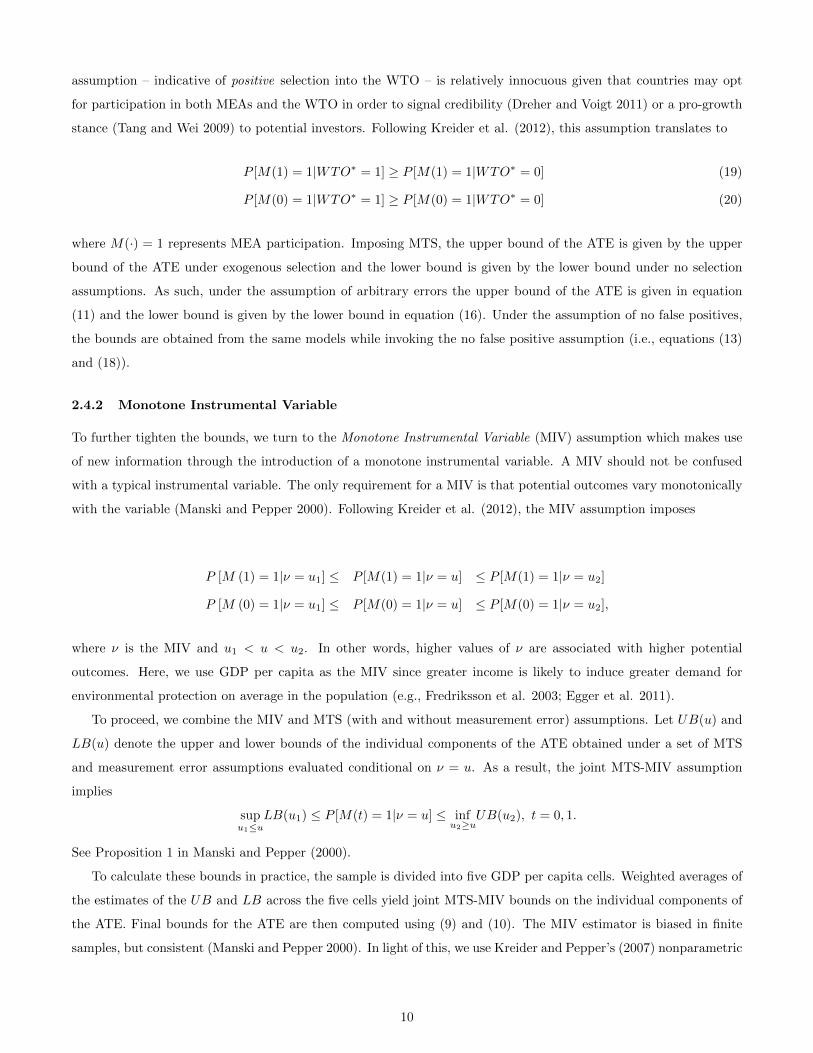
assumption – indicative of positive selection into the WTO – is relatively innocuous given that countries may opt
for participation in both MEAs and the WTO in order to signal credibility (Dreher and Voigt 2011) or a pro-growth
stance (Tang and Wei 2009) to potential investors. Following Kreider et al. (2012), this assumption translates to
P [M(1) = 1|WTO∗ = 1] ≥ P [M(1) = 1|WTO∗ = 0] (19)
P [M(0) = 1|WTO∗ = 1] ≥ P [M(0) = 1|WTO∗ = 0] (20)
where M(·) = 1 represents MEA participation. Imposing MTS, the upper bound of the ATE is given by the upper
bound of the ATE under exogenous selection and the lower bound is given by the lower bound under no selection
assumptions. As such, under the assumption of arbitrary errors the upper bound of the ATE is given in equation
(11) and the lower bound is given by the lower bound in equation (16). Under the assumption of no false positives,
the bounds are obtained from the same models while invoking the no false positive assumption (i.e., equations (13)
and (18)).
2.4.2 Monotone Instrumental Variable
To further tighten the bounds, we turn to the Monotone Instrumental Variable (MIV) assumption which makes use
of new information through the introduction of a monotone instrumental variable. A MIV should not be confused
with a typical instrumental variable. The only requirement for a MIV is that potential outcomes vary monotonically
with the variable (Manski and Pepper 2000). Following Kreider et al. (2012), the MIV assumption imposes
P [M (1) = 1|ν = u1] ≤ P [M(1) = 1|ν = u] ≤ P [M(1) = 1|ν = u2]
P [M (0) = 1|ν = u1] ≤ P [M(0) = 1|ν = u] ≤ P [M(0) = 1|ν = u2],
where ν is the MIV and u1 < u < u2. In other words, higher values of ν are associated with higher potential
outcomes. Here, we use GDP per capita as the MIV since greater income is likely to induce greater demand for
environmental protection on average in the population (e.g., Fredriksson et al. 2003; Egger et al. 2011).
To proceed, we combine the MIV and MTS (with and without measurement error) assumptions. Let UB(u) and
LB(u) denote the upper and lower bounds of the individual components of the ATE obtained under a set of MTS
and measurement error assumptions evaluated conditional on ν = u. As a result, the joint MTS-MIV assumption
implies
supu1≤u
LB(u1) ≤ P [M(t) = 1|ν = u] ≤ infu2≥u
UB(u2), t = 0, 1.
See Proposition 1 in Manski and Pepper (2000).
To calculate these bounds in practice, the sample is divided into five GDP per capita cells. Weighted averages of
the estimates of the UB and LB across the five cells yield joint MTS-MIV bounds on the individual components of
the ATE. Final bounds for the ATE are then computed using (9) and (10). The MIV estimator is biased in finite
samples, but consistent (Manski and Pepper 2000). In light of this, we use Kreider and Pepper’s (2007) nonparametric
10

finite sample bias-corrected MIV estimator.7
3 Data
The data on environmental agreements come from Mitchell (2013a).8 We do not consider all MEAs in the analysis.
To begin, we focus on MEAs with dates of signature between 1960 and 2001. Next, we utilize Appendix 6.1 in
Barrett (2003) and the United Nations Treaty Series Online Collection to further reduce the set of agreements to
open MEAs (i.e., those without any participation restrictions).9 In case of any discrepancy between the two sources,
the corresponding agreement text is consulted. The agreement texts are also relied upon to classify agreements
that are not listed in these sources. In this paper, we choose to focus solely on open MEAs (as opposed to MEAs
that are only relevant, and hence open, to a subset of countries) as this ensures that all countries face the same
pool of potential agreements in which they might participate. Moreover, it seems plausible that any causal effect
of WTO membership on MEA participation may differ between open treaties and those that are more regional in
nature. Thus, restricted MEAs merit their own, independent analysis. Finally, we exclude amendments to open
MEAs included in the analysis if the amendments entered into force via tacit acceptance provisions (i.e., without
requiring members of the underlying agreements to explicitly ratify).10
The unit of observation is a country-year. The dependent variable, M , is a binary indicator if the country
participates in a new MEA in a given year.11 A country may be counted as new participant of a particular MEA
according to three distinct criteria: (i) in the year that it signs the MEA, (ii) in the year that it ratifies the MEA,
and (iii) in the year that the MEA enters into force. However, a country may also withdraw from an agreement or
rejoin a MEA. Accordingly, the dependent variable is defined in three ways. First, for any country-year observation,
M is assigned a value of one if the country signs at least one MEA on which it had taken no prior action. Second,
M takes the value one if a country participates in a new MEA, where participation is defined as any of the three
possibilities listed above (signature, ratification, or entry into force). Third, for any country-year observation, M is
assigned a value of one if the country participates in at least one MEA regardless of when the country first started
participating. In other words, M equal to one implies that the country is a party to at least one MEA regardless of
when the decision to participate in the MEA was made. Thus, the first two outcomes reflect the ‘flow’ of participation,
whereas the final outcome captures the ‘stock.’
The treatment indicator, WTO, is based on formal dates of accession to the WTO.12 In other words, for any
country, WTO takes the value one from its year of formal membership onwards. The control group includes all other
countries. The MIV, ν, is real per capita Gross Domestic Product (GDP). The data mainly come from the World
Bank’s World Development Indicators.13 However, for some observations, the Quality of Government Institute’s
7See McCarthy et al. (2014) for additional discussion.8We are grateful to Ronald Mitchell for sharing the data on MEA actions undertaken by countries at different dates, as well as
answering our numerous questions.9See http://treaties.un.org/Home.aspx?lang=en.
10See Mitchell (2013b) for a discussion on environmental agreements with tacit acceptance provisions.11By new MEA we mean not that the MEA is new, but rather that the country decides to participate in an MEA to which it did not
participate in in prior years.12While the dates of formal accession are available at http://www.wto.org/english/thewto_e/gattmem_e.htm and http://www.wto.
org/english/thewto_e/whatis_e/tif_e/org6_e.htm, we utilize the data at http://www.stanford.edu/~tomz/pubs/pubs.shtml in orderto consider countries that no longer exist.
13Data are obtained using the command -wbopendata- in Stata (Azevedo 2011).
11

Quality of Government Dataset is employed which in turn contains information from sources such as the United
Nations Statistics Division and Gleditsch (2002).14 The data provided by Gapminder World are also consulted for
a very few observations.15 Summary statistics are provided in Table A1 in the Appendix.
Before proceeding, a few comments are warranted. First, using independence and dissolution dates of countries
from the Central Intelligence Agency’s World Factbook, we restrict the sample to only include countries that existed
between 1960 and 2001.16 Second, for most agreements, the data report country-specific actions which enable
ratifications to be further classified into sub-categories. For example, although Kenya ratified the African Nuclear
Weapon Free Zone Treaty in 2000, the instrument of ratification was deposited in 2001. Moreover, both actions may
be used to identify ratification. In such cases, the earliest date of ratification is recognized. Also, some MEAs assign
multiple dates of signature or entry into force for the same country (without any intermediate withdrawals). Again,
the earliest dates are considered. Finally, an open agreement is considered to remain so for the entire sample period.
As stated in Barrett (2003, p. 147), although “an agreement is open for signature for a fixed period ... provisions
are usually made for eligible countries to accede at any time.”
4 Results
4.1 Baseline Analysis
The baseline results for the full sample are presented in Figures 1-3 and Table 1. Figure 1 and Panel I in Table 1
define the outcome as equal to one if the country signs at least one new MEA in a given year, zero otherwise. Figure
2 and Panel II in Table 1 use an indicator depicting any form of new participation (i.e., signature, ratification, or
entry into force) as the outcome. Lastly, the binary outcome in Figure 3 and Panel III of Table 1 denotes whether the
country currently participates in any MEA regardless of the original participation date. In each figure, the left panel
compares the sharp bounds on the ATE obtained under the assumption of exogenous selection to those obtained
under no assumption on selection as Q varies from zero to five percent. The right panel reports the bounds under
different combinations of the monotonicity assumptions concerning selection under the no false positives assumption
concerning misclassification. The bounds in Table 1 (and the right panel in the figures) are obtained after imposing
the no false positives assumption. To address the uncertainty arising from sampling variability, the table also reports
Imbens-Manski (2004) 95% confidence intervals obtained using 100 bootstrap repetitions.
Turning to the results, several findings stand out. First, under the assumptions of exogenous selection (column 1
in Table 1) and no misclassification error, the ATE is positive and statistically significant for all three outcomes. In
the case of MEA participation based on signatures only, WTO membership is associated with a 19.0% increase (CI:
[16.9%, 21.1%]) in the probability of a country becoming a new signatory to an open MEA in a given year. In the
case of participation determined from signatures, ratifications, or instances of entry into force, WTO membership is
14The World Bank’s real GDP per capita data are in 2005 US dollars. Since some of the data from other sources are in 2000 US dollars,a conversion factor based on US GDP values (obtained from the Bureau of Economic Analysis) is utilized. More precisely, the values in2000 US dollars are divided by 0.89 obtained from:
Nominal GDP in 2000/Real GDP in 2000 (base 2009)
Nominal GDP in 2005/Real GDP in 2005 (base 2009).
15See http://www.gapminder.org/data/.16See https://www.cia.gov/library/publications/the-world-factbook/index.html.
12
associated with a 21.1% increase (CI: [18.7%, 23.6%]) in the probability of new MEA participation in a given year.
Finally, WTO membership is associated with a 17.0% increase (CI: [15.8%, 18.3%]) in the probability of a country
being a party to at least one open MEA in a given year.
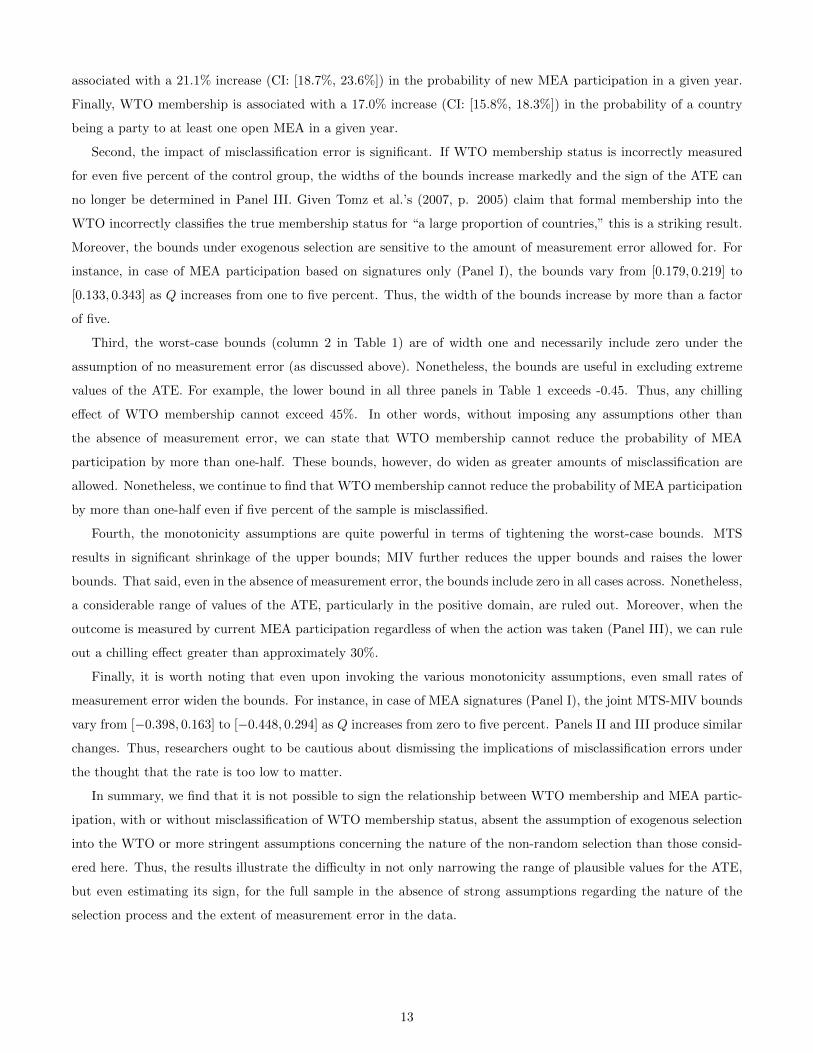
Second, the impact of misclassification error is significant. If WTO membership status is incorrectly measured
for even five percent of the control group, the widths of the bounds increase markedly and the sign of the ATE can
no longer be determined in Panel III. Given Tomz et al.’s (2007, p. 2005) claim that formal membership into the
WTO incorrectly classifies the true membership status for “a large proportion of countries,” this is a striking result.
Moreover, the bounds under exogenous selection are sensitive to the amount of measurement error allowed for. For
instance, in case of MEA participation based on signatures only (Panel I), the bounds vary from [0.179, 0.219] to
[0.133, 0.343] as Q increases from one to five percent. Thus, the width of the bounds increase by more than a factor
of five.
Third, the worst-case bounds (column 2 in Table 1) are of width one and necessarily include zero under the
assumption of no measurement error (as discussed above). Nonetheless, the bounds are useful in excluding extreme
values of the ATE. For example, the lower bound in all three panels in Table 1 exceeds -0.45. Thus, any chilling
effect of WTO membership cannot exceed 45%. In other words, without imposing any assumptions other than
the absence of measurement error, we can state that WTO membership cannot reduce the probability of MEA
participation by more than one-half. These bounds, however, do widen as greater amounts of misclassification are
allowed. Nonetheless, we continue to find that WTO membership cannot reduce the probability of MEA participation
by more than one-half even if five percent of the sample is misclassified.
Fourth, the monotonicity assumptions are quite powerful in terms of tightening the worst-case bounds. MTS
results in significant shrinkage of the upper bounds; MIV further reduces the upper bounds and raises the lower
bounds. That said, even in the absence of measurement error, the bounds include zero in all cases across. Nonetheless,
a considerable range of values of the ATE, particularly in the positive domain, are ruled out. Moreover, when the
outcome is measured by current MEA participation regardless of when the action was taken (Panel III), we can rule
out a chilling effect greater than approximately 30%.
Finally, it is worth noting that even upon invoking the various monotonicity assumptions, even small rates of
measurement error widen the bounds. For instance, in case of MEA signatures (Panel I), the joint MTS-MIV bounds
vary from [−0.398, 0.163] to [−0.448, 0.294] as Q increases from zero to five percent. Panels II and III produce similar
changes. Thus, researchers ought to be cautious about dismissing the implications of misclassification errors under
the thought that the rate is too low to matter.
In summary, we find that it is not possible to sign the relationship between WTO membership and MEA partic-
ipation, with or without misclassification of WTO membership status, absent the assumption of exogenous selection
into the WTO or more stringent assumptions concerning the nature of the non-random selection than those consid-
ered here. Thus, the results illustrate the difficulty in not only narrowing the range of plausible values for the ATE,
but even estimating its sign, for the full sample in the absence of strong assumptions regarding the nature of the
selection process and the extent of measurement error in the data.
13
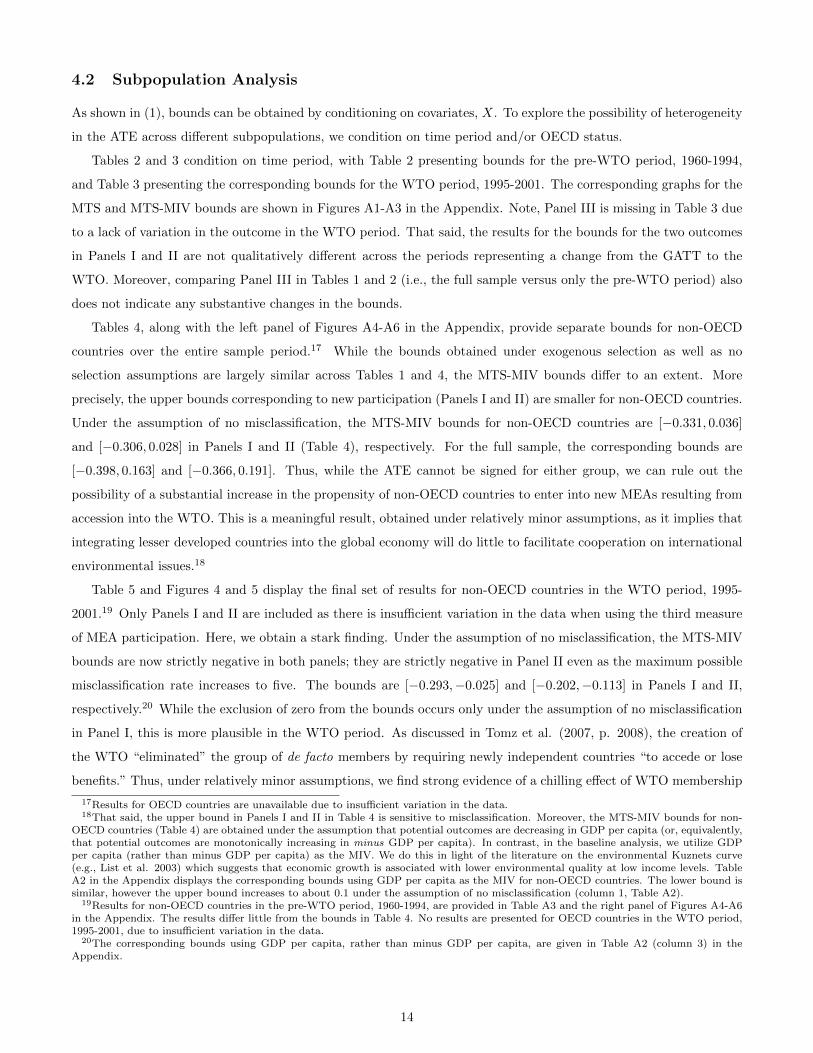
4.2 Subpopulation Analysis
As shown in (1), bounds can be obtained by conditioning on covariates, X. To explore the possibility of heterogeneity
in the ATE across different subpopulations, we condition on time period and/or OECD status.
Tables 2 and 3 condition on time period, with Table 2 presenting bounds for the pre-WTO period, 1960-1994,
and Table 3 presenting the corresponding bounds for the WTO period, 1995-2001. The corresponding graphs for the
MTS and MTS-MIV bounds are shown in Figures A1-A3 in the Appendix. Note, Panel III is missing in Table 3 due
to a lack of variation in the outcome in the WTO period. That said, the results for the bounds for the two outcomes
in Panels I and II are not qualitatively different across the periods representing a change from the GATT to the
WTO. Moreover, comparing Panel III in Tables 1 and 2 (i.e., the full sample versus only the pre-WTO period) also
does not indicate any substantive changes in the bounds.
Tables 4, along with the left panel of Figures A4-A6 in the Appendix, provide separate bounds for non-OECD
countries over the entire sample period.17 While the bounds obtained under exogenous selection as well as no
selection assumptions are largely similar across Tables 1 and 4, the MTS-MIV bounds differ to an extent. More
precisely, the upper bounds corresponding to new participation (Panels I and II) are smaller for non-OECD countries.
Under the assumption of no misclassification, the MTS-MIV bounds for non-OECD countries are [−0.331, 0.036]
and [−0.306, 0.028] in Panels I and II (Table 4), respectively. For the full sample, the corresponding bounds are
[−0.398, 0.163] and [−0.366, 0.191]. Thus, while the ATE cannot be signed for either group, we can rule out the
possibility of a substantial increase in the propensity of non-OECD countries to enter into new MEAs resulting from
accession into the WTO. This is a meaningful result, obtained under relatively minor assumptions, as it implies that
integrating lesser developed countries into the global economy will do little to facilitate cooperation on international
environmental issues.18
Table 5 and Figures 4 and 5 display the final set of results for non-OECD countries in the WTO period, 1995-
2001.19 Only Panels I and II are included as there is insufficient variation in the data when using the third measure
of MEA participation. Here, we obtain a stark finding. Under the assumption of no misclassification, the MTS-MIV
bounds are now strictly negative in both panels; they are strictly negative in Panel II even as the maximum possible
misclassification rate increases to five. The bounds are [−0.293,−0.025] and [−0.202,−0.113] in Panels I and II,
respectively.20 While the exclusion of zero from the bounds occurs only under the assumption of no misclassification
in Panel I, this is more plausible in the WTO period. As discussed in Tomz et al. (2007, p. 2008), the creation of
the WTO “eliminated” the group of de facto members by requiring newly independent countries “to accede or lose
benefits.” Thus, under relatively minor assumptions, we find strong evidence of a chilling effect of WTO membership
17Results for OECD countries are unavailable due to insufficient variation in the data.18That said, the upper bound in Panels I and II in Table 4 is sensitive to misclassification. Moreover, the MTS-MIV bounds for non-
OECD countries (Table 4) are obtained under the assumption that potential outcomes are decreasing in GDP per capita (or, equivalently,that potential outcomes are monotonically increasing in minus GDP per capita). In contrast, in the baseline analysis, we utilize GDPper capita (rather than minus GDP per capita) as the MIV. We do this in light of the literature on the environmental Kuznets curve(e.g., List et al. 2003) which suggests that economic growth is associated with lower environmental quality at low income levels. TableA2 in the Appendix displays the corresponding bounds using GDP per capita as the MIV for non-OECD countries. The lower bound issimilar, however the upper bound increases to about 0.1 under the assumption of no misclassification (column 1, Table A2).
19Results for non-OECD countries in the pre-WTO period, 1960-1994, are provided in Table A3 and the right panel of Figures A4-A6in the Appendix. The results differ little from the bounds in Table 4. No results are presented for OECD countries in the WTO period,1995-2001, due to insufficient variation in the data.
20The corresponding bounds using GDP per capita, rather than minus GDP per capita, are given in Table A2 (column 3) in theAppendix.
14

on new MEA participation by non-OECD countries during the WTO period. This finding is consistent with the
statement in Subramanian and Wei (2007, p. 152): “[D]eveloping countries that wanted to join the WTO after 1994
have been required to engage in serious trade liberalization. This sets them apart from the old developing members.”
The authors (p. 172) continue: “A non-member country that aspires to become a member has to make concessions
and obtain approval from every existing member country. As a result, it is easier to demand that these new entrants
reduce trade barriers to a greater extent than to do the same to the existing members... [P]ost-Uruguay Round
accessions have indeed been qualitatively different in the sense of extracting more trade liberalizing concessions from
prospective entrants.” Again, this implies that integrating lesser developed countries into the global economy will do
little to facilitate, and may actually impede, cooperation on international environmental issues.
5 Conclusion
As discussed in Horn and Mavroidis (2013, p. 1), while WTO members “are legally bound to respect negotiated
reductions of barriers to trade,” many members are also party to MEAs “that often impose rights or obligations for
members to restrict trade.” Thus, the relationship between the WTO and MEAs “has created significant controversy,
since neither ... clarify the relationship between these sometimes, at least seemingly, contradictory undertakings.”
However, although Egger et al. (2011) examine the effect of international openness (as measured by trade and
investment liberalization) on MEA membership, to our knowledge, the effect of WTO membership on participation
in environmental agreements has yet to be explicitly analyzed. Accordingly, we explore the causal relationship
between WTO membership and MEA participation while accounting for two important identification issues: non-
random selection and measurement error in WTO membership. Here, we examine the impact of WTO membership
on MEA participation, addressing both identification issues in a single partial identification framework proposed
in Kreider et al. (2012). This nonparametric approach is especially suitable for this analysis given that obtaining
consistent point estimates of an endogenous and mismeasured binary variable is not trivial (Black et al. 2000). Thus,
while the partial identification approach is less satisfying than a straightforward point estimate, it is more credible
as it highlights what we know without invoking perhaps untenable assumptions. As Manski (2013, p. 2-3) states:
“Exact predictions are common, and expressions of uncertainty are rare. Yet policy predictions often are fragile.
Conclusions may rest on critical unsupported assumptions or on leaps of logic. Then the certitude of policy analysis
is not credible.” Manski (2013, p. 3) advocates the “honest portrayal of partial knowledge.”
In this vein, we impose several weak assumptions concerning the nature of the selection and measurement error
processes to bound the causal impact of WTO membership. Using data on roughly 200 countries over 42 years, we
assess the identifying power of these assumptions to determine what can be learned about the average treatment
effect. While there are a host of interesting findings, the main finding is that, regardless of measurement error, the
relationship between WTO membership and MEA participation cannot be signed for the full sample – under the
assumptions considered here – as long as selection into the GATT/WTO is non-random. However, we obtain strictly
negative bounds for the subsample of non-OECD countries in the WTO period (1995-2001). This is consistent with
the stringent demands in terms of trade liberalization placed on developing countries in the post-Uruguay Round
period in order to gain accession into the WTO.
15

References
[1] Allee, T.L. and J.E. Scalera (2012), “The Divergent Effects of Joining International Organizations: Trade Gains
and the Rigors of WTO Accession,” International Organization, 66, 243-276.
[2] Azevedo, J.P. (2011), “wbopendata: Stata Module to Access World Bank Databases,” Statistical Software
Components S457234, Department of Economics, Boston College.
[3] Barrett, S. (2003), Environment and Statecraft: The Strategy of Environmental Treaty-Making, Oxford Univer-
sity Press, USA.
[4] Barrett, S. (2005), “The Theory of International Environmental Agreements ,” in K.-G. Maler and J.R. Vincent
(eds.) Handbook of Environmental Economics, Vol. 3., 1457-1516.
[5] Bernasconi-Osterwalder, N., D. Magraw, M.J. Oliva, E. Tuerk, and M. Orellana (2006), Environment and Trade:
A Guide to WTO Jurisprudence, Earthscan.
[6] Black, D.A., M.C. Berger, and F.A. Scott (2000), “Bounding Parameter Estimates with Nonclassical Measure-
ment Error,” Journal of the American Statistical Association, 95, 739-748.
[7] Davies, R.B. and H.T. Naughton (2013), “Cooperation in Environmental Policy: a Spatial Approach,” Interna-
tional Tax and Public Finance, forthcoming.
[8] Dreher, A. and S. Voigt (2011), “Does Membership in International Organizations Increase Governments’ Cred-
ibility? Testing the Effects of Delegating Powers,” Journal of Comparative Economics, 39, 326-348.
[9] Eckersley, R. (2004), “The Big Chill: The WTO and Multilateral Environmental Agreements,” Global Environ-
mental Politics, 4, 24-50.
[10] Egger, P., C. Jeßberger, and M. Larch (2011), “Trade and Investment Liberalization as Determinants of Multi-
lateral Environmental Agreement Membership,” International Tax and Public Finance, 18, 605-633.
[11] Egger, P., C. Jessberger, and M. Larch (2013), “Impacts of Trade and the Environment on Clustered Multilateral
Environmental Agreements,” The World Economy, 36, 331-348.
[12] Fredriksson, P.G., J.A. List, and D.L. Millimet (2003), “Corruption, Environmental Policy, and FDI: Theory
and Evidence from the United States,” Journal of Public Economics, 87, 1407-1430.
[13] Gleditsch, K.S. (2002), “Expanded Trade and GDP Data,” Journal of Conflict Resolution, 46, 712-724.
[14] Gundersen, C. and B. Kreider (2008), “Food Stamps and Food Insecurity: What Can Be Learned in the Presence
of Nonclassical Measurement Error?” Journal of Human Resources, 43, 352-382.
[15] Horn, H. and P.C. Mavroidis (2013), “Multilateral Environmental Agreements in the WTO: Silence Speaks
Volumes,” IFN Working Paper No. 983.
[16] Imbens, G.W. and C.F. Manski (2004), “Confidence Intervals for Partially Identified Parameters,” Econometrica,
72, 1845-1857.
16

[17] Klein, R. and F. Vella (2009), “A Semiparametric Model for Binary Response and Continuous Outcomes Under
Index Heteroskedasticity,” Journal of Applied Econometrics, 24, 735-762.
[18] Kreider, B. and J. Pepper (2007), “Disability and Employment: Reevaluating the Evidence in Light of Reporting
Errors,” Journal of the American Statistical Association, 102, 432-441.
[19] Kreider, B., J. Pepper, C. Gundersen, and D. Jolliffe (2012), “Identifying the Effects of SNAP (Food Stamps)
on Child Health Outcomes When Participation is Endogenous and Misreported,” Journal of the American
Statistical Association, 107, 958-975.
[20] Kreider, B., J. Pepper, and M. Roy (2013), “Does the Women, Infants, and Children (WIC) Program Improve
Infant Health Outcomes?” unpublished manuscript, Iowa State University.
[21] List, J.A., D.L. Millimet, and T. Stengos (2003), “The Environmental Kuznets Curve: Real Progress or Mis-
specified Models?” Review of Economics and Statistics, 85, 1038-1047.
[22] Manski, C. (1995), Identification Problems in the Social Sciences, Cambridge, MA: Harvard University Press.
[23] Manski, C. (2013), Public Policy in an Uncertain World, Cambridge, MA: Harvard University Press.
[24] Manski, C. and J. Pepper (2000), “Monotone Instrumental Variables: With an Application to the Returns to
Schooling,” Econometrica, 68, 997-1010.
[25] McCarthy, I., D.L. Millimet, and M. Roy (2014), “Bounding Treatment Effects: Stata Command for the Partial
Identification of the Average Treatment Effect with Endogenous and Misreported Treatment Assignment,”
unpublished manuscript, SMU.
[26] Millimet, D.L. (2011), “The Elephant in the Corner: A Cautionary Tale About Measurement Error in Treatment
Effects Models,” Advances in Econometrics, 27A, 1-39.
[27] Millimet, D.L. and R. Tchernis (2009), “On the Specification of Propensity Scores: with Applications to the
Analysis of Trade Policies,” Journal of Business & Economic Statistics, 27, 397-415.
[28] Mitchell, R.B. (2013a), International Environmental Agreements Database Project (Version 2013.2),
http://iea.uoregon.edu/.
[29] Mitchell, R.B. (2013b), “Binding International Law Without Ratification: Delegation and Tacit Acceptance
Provisions in International Environmental Law,” unpublished manuscript, Department of Political Science,
University of Oregon.
[30] Neumayer, E. (2004), “The WTO and the Environment: Its Past Record is Better than Critics Believe, but the
Future Outlook is Bleak,” Global Environmental Politics, 4, 1-8.
[31] Rauscher, M. (2005), “International Trade, Foreign Investment, and the Environment,” in K.-G. Maler and J.R.
Vincent (eds.) Handbook of Environmental Economics, Vol. 3., 1403-1456.
17

[32] Rose, A.K., (2004), “Do We Really Know That the WTO Increases Trade?” American Economic Review, 94,
98-114.
[33] Rose, A.K. and M.M. Spiegel (2009), “Noneconomic Engagement and International Exchange: The Case of
Environmental Treaties,” Journal of Money, Credit and Banking, 41, 337-363.
[34] Roy, J. (2011), “Is the WTO Mystery Really Solved?” Economics Letters, 113, 127-130.
[35] Subramanian, A. and S.-J.Wei (2007), “The WTO Promotes Trade, Strongly but Unevenly,” Journal of Inter-
national Economics, 72, 151-175.
[36] Tamer, E. (2010), “Partial Identification in Econometrics,” Annual Review of Economics, 2, 167-195.
[37] Tang, M. and S.-J. Wei (2009), “The Value of Making Commitments Externally: Evidence from WTO Acces-
sions,” Journal of International Economics, 78, 216-229.
[38] Teorell, J., N. Charron, S. Dahlberg, S. Holmberg, B. Rothstein, P. Sundin, and R. Svensson (2013), Quality of
Government Dataset (Version 15 May 2013), The Quality of Government Institute, University of Gothenburg,
http://www.qog.pol.gu.se.
[39] Tomz, M., J.L. Goldstein, and D. Rivers (2007), “Do We Really Know That the WTO Increases Trade? Com-
ment,” American Economic Review, 97, 2005-2018.
[40] Wangler, L., J.-C. Altamirano-Cabrera, and H.-P. Weikard (2011), “The Political Economy of International
Environmental Agreements: A Survey,” JENA Economic Research Papers, #2011-038.
[41] World Bank Group (2013), World Development Indicators 2013, World Bank Publications.
18

Figure 1. Sharp Bounds on the ATE of WTO Membership on MEA Participation: Signature (Full Sample)
Figure 2. Sharp Bounds on the ATE of WTO Membership on MEA Participation: Signature, Ratification, or Entry Into Force (Full Sample)
Figure 3. Sharp Bounds on the ATE of WTO Membership on MEA Participation: Any Participation (Full Sample)
0.1900.161
0.1040.048
0.1900.219
0.280
0.343
0.190 0.179 0.156 0.1330.190
0.2190.280
0.343
-0.430 -0.440 -0.460 -0.480
0.570 0.580 0.600 0.620
-0.430 -0.440 -0.460 -0.480
0.570 0.580 0.600 0.620
-0.5
00.
000.
501.
00A
TE
0.00 0.01 0.03 0.05Maximum Allowed Degree of Misclassification
Exogenous: Arbitrary Errors Exogenous: No False Positives
No Selection: Arbitrary Errors No Selection: No False Positives
Exogenous and No Selection Assumptions
-0.430 -0.440 -0.460 -0.480
0.1900.219
0.2800.343
-0.398 -0.408 -0.428 -0.448
0.1630.190
0.2440.294
-0.5
00.
000.
501.
00A
TE
0.00 0.01 0.03 0.05Maximum Allowed Degree of Misclassification
MTS Alone
Joint MTS & MIV
No False Positive ErrorsMTSp & MTSp-MIV Assumptions
0.211 0.1890.144
0.100
0.211 0.2350.283
0.333
0.211 0.1940.159
0.123
0.211 0.2350.283
0.333
-0.401 -0.411 -0.431 -0.451
0.599 0.609 0.629 0.649
-0.401 -0.411 -0.431 -0.451
0.599 0.609 0.629 0.649
-0.5
00.
000.
501.
00A
TE
0.00 0.01 0.03 0.05Maximum Allowed Degree of Misclassification
Exogenous: Arbitrary Errors Exogenous: No False Positives
No Selection: Arbitrary Errors No Selection: No False Positives
Exogenous and No Selection Assumptions
-0.401 -0.411 -0.431 -0.451
0.211 0.2350.283
0.333
-0.366 -0.376 -0.396 -0.416
0.191 0.2130.257
0.299
-0.5
00.
000.
501.
00A
TE
0.00 0.01 0.03 0.05Maximum Allowed Degree of Misclassification
MTS Alone
Joint MTS & MIV
No False Positive ErrorsMTSp & MTSp-MIV Assumptions
0.1700.135
0.062
-0.013
0.1700.206 0.227 0.237
0.1700.135
0.062
-0.013
0.170 0.175 0.186 0.197
-0.369 -0.379 -0.399 -0.419
0.631 0.641 0.661 0.681
-0.369 -0.379 -0.399 -0.419
0.631 0.641 0.661 0.681
-0.5
00.
000.
501.
00A
TE
0.00 0.01 0.03 0.05Maximum Allowed Degree of Misclassification
Exogenous: Arbitrary Errors Exogenous: No False Positives
No Selection: Arbitrary Errors No Selection: No False Positives
Exogenous and No Selection Assumptions
-0.369 -0.379 -0.399 -0.419
0.170 0.175 0.186 0.197
-0.288 -0.298 -0.318 -0.338
0.153 0.156 0.164 0.172
-0.5
00.
000.
501.
00A
TE
0.00 0.01 0.03 0.05Maximum Allowed Degree of Misclassification
MTS Alone
Joint MTS & MIV
No False Positive ErrorsMTSp & MTSp-MIV Assumptions

Figure 4. Sharp Bounds on the ATE of WTO Membership on MEA Participation: Signature (Non-OECD Countries, 1995-2001)
Figure 5. Sharp Bounds on the ATE of WTO Membership on MEA Participation: Signature, Ratification, or Entry Into Force (Non-OECD Countries, 1995-2001)
0.1650.138
0.0870.038
0.1650.192
0.250
0.311
0.165 0.1490.115
0.080
0.1650.192
0.250
0.311
-0.445 -0.455 -0.475 -0.495
0.555 0.565 0.585 0.605
-0.445 -0.455 -0.475 -0.495
0.555 0.565 0.585 0.605
-0.5
00.
000.
501.
00A
TE
0.00 0.01 0.03 0.05Maximum Allowed Degree of Misclassification
Exogenous: Arbitrary Errors Exogenous: No False Positives
No Selection: Arbitrary Errors No Selection: No False Positives
Exogenous and No Selection Assumptions
-0.445 -0.455 -0.475 -0.495
0.1650.192
0.2500.311
-0.293 -0.303 -0.323 -0.343
-0.0250.011
0.095
0.197
-0.5
00.
000.
501.
00A
TE
0.00 0.01 0.03 0.05Maximum Allowed Degree of Misclassification
MTS Alone
Joint MTS & MIV
No False Positive ErrorsMTSp & MTSp-MIV Assumptions
0.1310.103
0.046-0.014
0.1310.158
0.2110.262
0.1310.103
0.046-0.014
0.131 0.1470.180
0.217
-0.395 -0.405 -0.425 -0.445
0.605 0.615 0.635 0.655
-0.395 -0.405 -0.425 -0.445
0.605 0.615 0.635 0.655
-0.5
00.
000.
501.
00A
TE
0.00 0.01 0.03 0.05Maximum Allowed Degree of Misclassification
Exogenous: Arbitrary Errors Exogenous: No False Positives
No Selection: Arbitrary Errors No Selection: No False Positives
Exogenous and No Selection Assumptions
-0.395 -0.405 -0.425 -0.445
0.131 0.1470.180
0.217
-0.202 -0.212 -0.232 -0.252
-0.113 -0.094-0.053
-0.006
-0.5
00.
000.
501.
00A
TE
0.00 0.01 0.03 0.05Maximum Allowed Degree of Misclassification
MTS Alone
Joint MTS & MIV
No False Positive ErrorsMTSp & MTSp-MIV Assumptions

Table 1. Sharp Bounds on the ATE of WTO Membership on MEA Participation
Q Exogenous Selection Worst-Case MTS MTS & MIV(1) (2) (3) (4)
I. Sign a New MEA0.00 [ 0.190, 0.190] p.e. [ -0.430, 0.570] p.e. [ -0.430, 0.190] p.e. [ -0.398, 0.163] p.e.
[ 0.169, 0.211] CI [ -0.439, 0.580] CI [ -0.439, 0.208] CI [ -0.414, 0.188] CI
0.01 [ 0.179, 0.219] p.e. [ -0.440, 0.580] p.e. [ -0.440, 0.219] p.e. [ -0.408, 0.190] p.e.[ 0.161, 0.237] CI [ -0.449, 0.590] CI [ -0.449, 0.237] CI [ -0.424, 0.215] CI
0.03 [ 0.156, 0.280] p.e. [ -0.460, 0.600] p.e. [ -0.460, 0.280] p.e. [ -0.428, 0.244] p.e.[ 0.138, 0.298] CI [ -0.469, 0.610] CI [ -0.469, 0.298] CI [ -0.444, 0.269] CI
0.05 [ 0.133, 0.343] p.e. [ -0.480, 0.620] p.e. [ -0.480, 0.343] p.e. [ -0.448, 0.294] p.e.[ 0.115, 0.361] CI [ -0.489, 0.630] CI [ -0.489, 0.361] CI [ -0.464, 0.320] CI
II. Sign, Ratify, or Enter in Force a New MEA0.00 [ 0.211, 0.211] p.e. [ -0.401, 0.599] p.e. [ -0.401, 0.211] p.e. [ -0.366, 0.191] p.e.
[ 0.187, 0.236] CI [ -0.411, 0.610] CI [ -0.411, 0.232] CI [ -0.383, 0.213] CI
0.01 [ 0.194, 0.235] p.e. [ -0.411, 0.609] p.e. [ -0.411, 0.235] p.e. [ -0.376, 0.213] p.e.[ 0.173, 0.256] CI [ -0.421, 0.620] CI [ -0.421, 0.256] CI [ -0.393, 0.235] CI
0.03 [ 0.159, 0.283] p.e. [ -0.431, 0.629] p.e. [ -0.431, 0.283] p.e. [ -0.396, 0.257] p.e.[ 0.138, 0.304] CI [ -0.441, 0.640] CI [ -0.441, 0.304] CI [ -0.413, 0.279] CI
0.05 [ 0.123, 0.333] p.e. [ -0.451, 0.649] p.e. [ -0.451, 0.333] p.e. [ -0.416, 0.299] p.e.[ 0.101, 0.355] CI [ -0.461, 0.660] CI [ -0.461, 0.355] CI [ -0.433, 0.322] CI
III. Currently Participate in a MEA0.00 [ 0.170, 0.170] p.e. [ -0.369, 0.631] p.e. [ -0.369, 0.170] p.e. [ -0.288, 0.153] p.e.
[ 0.158, 0.183] CI [ -0.377, 0.640] CI [ -0.377, 0.181] CI [ -0.305, 0.172] CI
0.01 [ 0.135, 0.175] p.e. [ -0.379, 0.641] p.e. [ -0.379, 0.175] p.e. [ -0.298, 0.156] p.e.[ 0.124, 0.186] CI [ -0.387, 0.650] CI [ -0.387, 0.186] CI [ -0.315, 0.176] CI
0.03 [ 0.062, 0.186] p.e. [ -0.399, 0.661] p.e. [ -0.399, 0.186] p.e. [ -0.318, 0.164] p.e.[ 0.050, 0.197] CI [ -0.407, 0.670] CI [ -0.407, 0.197] CI [ -0.335, 0.184] CI
0.05 [ -0.013, 0.197] p.e. [ -0.419, 0.681] p.e. [ -0.419, 0.197] p.e. [ -0.338, 0.172] p.e.[ -0.025, 0.209] CI [ -0.427, 0.690] CI [ -0.427, 0.209] CI [ -0.355, 0.193] CI
Assumptions Regarding Selection
Notes: p.e. = point estimates; CI = confidence Interval. Imbens-Manski (2004) 95% CIs obtained using 100 bootstrap repetitions. Q = maximum rate of misclassification of WTO status. Assumption of no false positives is imposed. MIV is GDP per capita. Number of observations = 6739. See text for further details.

Table 2. Sharp Bounds on the ATE of WTO Membership on MEA Participation: 1960-1994
Q Exogenous Selection Worst-Case MTS MTS & MIV(1) (2) (3) (4)
I. Sign a New MEA0.00 [ 0.164, 0.164] p.e. [ -0.431, 0.569] p.e. [ -0.431, 0.164] p.e. [ -0.385, 0.133] p.e.
[ 0.144, 0.184] CI [ -0.441, 0.579] CI [ -0.441, 0.181] CI [ -0.404, 0.157] CI
0.01 [ 0.154, 0.194] p.e. [ -0.441, 0.579] p.e. [ -0.441, 0.194] p.e. [ -0.395, 0.162] p.e.[ 0.137, 0.211] CI [ -0.451, 0.589] CI [ -0.451, 0.211] CI [ -0.414, 0.186] CI
0.03 [ 0.134, 0.255] p.e. [ -0.461, 0.599] p.e. [ -0.461, 0.255] p.e. [ -0.415, 0.221] p.e.[ 0.117, 0.272] CI [ -0.471, 0.609] CI [ -0.471, 0.272] CI [ -0.434, 0.245] CI
0.05 [ 0.113, 0.318] p.e. [ -0.481, 0.619] p.e. [ -0.481, 0.318] p.e. [ -0.435, 0.277] p.e.[ 0.096, 0.335] CI [ -0.491, 0.629] CI [ -0.491, 0.335] CI [ -0.454, 0.301] CI
II. Sign, Ratify, or Enter in Force a New MEA0.00 [ 0.187, 0.187] p.e. [ -0.412, 0.588] p.e. [ -0.412, 0.187] p.e. [ -0.369, 0.150] p.e.
[ 0.162, 0.211] CI [ -0.423, 0.598] CI [ -0.423, 0.207] CI [ -0.387, 0.181] CI
0.01 [ 0.171, 0.212] p.e. [ -0.422, 0.598] p.e. [ -0.422, 0.212] p.e. [ -0.379, 0.174] p.e.[ 0.151, 0.232] CI [ -0.433, 0.608] CI [ -0.433, 0.232] CI [ -0.397, 0.205] CI
0.03 [ 0.140, 0.262] p.e. [ -0.442, 0.618] p.e. [ -0.442, 0.262] p.e. [ -0.399, 0.224] p.e.[ 0.120, 0.283] CI [ -0.453, 0.628] CI [ -0.453, 0.283] CI [ -0.417, 0.253] CI
0.05 [ 0.109, 0.314] p.e. [ -0.462, 0.638] p.e. [ -0.462, 0.314] p.e. [ -0.419, 0.273] p.e.[ 0.089, 0.335] CI [ -0.473, 0.648] CI [ -0.473, 0.335] CI [ -0.437, 0.301] CI
III. Currently Participate in a MEA0.00 [ 0.192, 0.192] p.e. [ -0.384, 0.616] p.e. [ -0.384, 0.192] p.e. [ -0.292, 0.159] p.e.
[ 0.173, 0.210] CI [ -0.395, 0.627] CI [ -0.395, 0.207] CI [ -0.312, 0.181] CI
0.01 [ 0.157, 0.197] p.e. [ -0.394, 0.626] p.e. [ -0.394, 0.197] p.e. [ -0.302, 0.164] p.e.[ 0.141, 0.213] CI [ -0.405, 0.637] CI [ -0.405, 0.213] CI [ -0.322, 0.186] CI
0.03 [ 0.087, 0.208] p.e. [ -0.414, 0.646] p.e. [ -0.414, 0.208] p.e. [ -0.322, 0.173] p.e.[ 0.071, 0.225] CI [ -0.425, 0.657] CI [ -0.425, 0.225] CI [ -0.342, 0.195] CI
0.05 [ 0.016, 0.221] p.e. [ -0.434, 0.666] p.e. [ -0.434, 0.221] p.e. [ -0.342, 0.182] p.e.[ -0.001, 0.238] CI [ -0.445, 0.677] CI [ -0.445, 0.238] CI [ -0.362, 0.205] CI
Assumptions Regarding Selection
Notes: p.e. = point estimates; CI = confidence Interval. Imbens-Manski (2004) 95% CIs obtained using 100 bootstrap repetitions. Q = maximum rate of misclassification of WTO status. Assumption of no false positives is imposed. MIV is GDP per capita. Number of observations = 5402. See text for further details.

Table 3. Sharp Bounds on the ATE of WTO Membership on MEA Participation: 1995-2001
Q Exogenous Selection Worst-Case MTS MTS & MIV(1) (2) (3) (4)
I. Sign a New MEA0.00 [ 0.212, 0.212] p.e. [ -0.424, 0.576] p.e. [ -0.424, 0.212] p.e. [ -0.424, 0.174] p.e.
[ 0.162, 0.262] CI [ -0.445, 0.597] CI [ -0.445, 0.254] CI [ -0.445, 0.236] CI
0.01 [ 0.194, 0.241] p.e. [ -0.434, 0.586] p.e. [ -0.434, 0.241] p.e. [ -0.434, 0.197] p.e.[ 0.152, 0.284] CI [ -0.455, 0.607] CI [ -0.455, 0.284] CI [ -0.455, 0.260] CI
0.03 [ 0.157, 0.305] p.e. [ -0.454, 0.606] p.e. [ -0.454, 0.305] p.e. [ -0.454, 0.245] p.e.[ 0.113, 0.349] CI [ -0.475, 0.627] CI [ -0.475, 0.349] CI [ -0.475, 0.311] CI
0.05 [ 0.116, 0.375] p.e. [ -0.474, 0.626] p.e. [ -0.474, 0.375] p.e. [ -0.474, 0.295] p.e.[ 0.070, 0.422] CI [ -0.495, 0.647] CI [ -0.495, 0.422] CI [ -0.495, 0.363] CI
II. Sign, Ratify, or Enter in Force a New MEA0.00 [ 0.166, 0.166] p.e. [ -0.354, 0.646] p.e. [ -0.354, 0.166] p.e. [ -0.354, 0.132] p.e.
[ 0.108, 0.224] CI [ -0.376, 0.669] CI [ -0.376, 0.215] CI [ -0.376, 0.192] CI
0.01 [ 0.136, 0.183] p.e. [ -0.364, 0.656] p.e. [ -0.364, 0.183] p.e. [ -0.364, 0.148] p.e.[ 0.086, 0.233] CI [ -0.386, 0.679] CI [ -0.386, 0.233] CI [ -0.386, 0.209] CI
0.03 [ 0.072, 0.221] p.e. [ -0.384, 0.676] p.e. [ -0.384, 0.221] p.e. [ -0.384, 0.184] p.e.[ 0.020, 0.272] CI [ -0.406, 0.699] CI [ -0.406, 0.272] CI [ -0.406, 0.247] CI
0.05 [ 0.003, 0.262] p.e. [ -0.404, 0.696] p.e. [ -0.404, 0.262] p.e. [ -0.404, 0.224] p.e.[ -0.052, 0.316] CI [ -0.426, 0.719] CI [ -0.426, 0.316] CI [ -0.426, 0.286] CI
Assumptions Regarding Selection
Notes: p.e. = point estimates; CI = confidence Interval. Imbens-Manski (2004) 95% CIs obtained using 100 bootstrap repetitions. Q = maximum rate of misclassification of WTO status. Assumption of no false positives is imposed. MIV is GDP per capita. Number of observations = 1337. See text for further details.

Table 4. Sharp Bounds on the ATE of WTO Membership on MEA Participation: Non-OECD Countries
Q Exogenous Selection Worst-Case MTS MTS & MIV(1) (2) (3) (4)
I. Sign a New MEA0.00 [ 0.131, 0.131] p.e. [ -0.428, 0.572] p.e. [ -0.428, 0.131] p.e. [ -0.331, 0.036] p.e.
[ 0.111, 0.152] CI [ -0.438, 0.581] CI [ -0.438, 0.148] CI [ -0.354, 0.077] CI
0.01 [ 0.121, 0.161] p.e. [ -0.438, 0.582] p.e. [ -0.438, 0.161] p.e. [ -0.341, 0.065] p.e.[ 0.103, 0.178] CI [ -0.448, 0.591] CI [ -0.448, 0.178] CI [ -0.364, 0.105] CI
0.03 [ 0.100, 0.220] p.e. [ -0.458, 0.602] p.e. [ -0.458, 0.220] p.e. [ -0.361, 0.125] p.e.[ 0.083, 0.237] CI [ -0.468, 0.611] CI [ -0.468, 0.237] CI [ -0.384, 0.163] CI
0.05 [ 0.079, 0.280] p.e. [ -0.478, 0.622] p.e. [ -0.478, 0.280] p.e. [ -0.381, 0.188] p.e.[ 0.062, 0.297] CI [ -0.488, 0.631] CI [ -0.488, 0.297] CI [ -0.404, 0.225] CI
II. Sign, Ratify, or Enter in Force a New MEA0.00 [ 0.163, 0.163] p.e. [ -0.416, 0.584] p.e. [ -0.416, 0.163] p.e. [ -0.306, 0.028] p.e.
[ 0.137, 0.190] CI [ -0.427, 0.595] CI [ -0.427, 0.185] CI [ -0.334, 0.072] CI
0.01 [ 0.146, 0.186] p.e. [ -0.426, 0.594] p.e. [ -0.426, 0.186] p.e. [ -0.316, 0.051] p.e.[ 0.124, 0.209] CI [ -0.437, 0.605] CI [ -0.437, 0.209] CI [ -0.344, 0.094] CI
0.03 [ 0.113, 0.233] p.e. [ -0.446, 0.614] p.e. [ -0.446, 0.233] p.e. [ -0.336, 0.097] p.e.[ 0.091, 0.255] CI [ -0.457, 0.625] CI [ -0.457, 0.255] CI [ -0.364, 0.140] CI
0.05 [ 0.080, 0.281] p.e. [ -0.466, 0.634] p.e. [ -0.466, 0.281] p.e. [ -0.356, 0.145] p.e.[ 0.058, 0.303] CI [ -0.477, 0.645] CI [ -0.477, 0.303] CI [ -0.384, 0.189] CI
III. Currently Participate in a MEA0.00 [ 0.169, 0.169] p.e. [ -0.426, 0.574] p.e. [ -0.426, 0.169] p.e. [ -0.364, 0.159] p.e.
[ 0.153, 0.186] CI [ -0.436, 0.584] CI [ -0.436, 0.183] CI [ -0.384, 0.179] CI
0.01 [ 0.134, 0.174] p.e. [ -0.436, 0.584] p.e. [ -0.436, 0.174] p.e. [ -0.374, 0.163] p.e.[ 0.120, 0.187] CI [ -0.446, 0.594] CI [ -0.446, 0.187] CI [ -0.394, 0.183] CI
0.03 [ 0.062, 0.183] p.e. [ -0.456, 0.604] p.e. [ -0.456, 0.183] p.e. [ -0.394, 0.170] p.e.[ 0.048, 0.197] CI [ -0.466, 0.614] CI [ -0.466, 0.197] CI [ -0.414, 0.191] CI
0.05 [ -0.009, 0.192] p.e. [ -0.476, 0.624] p.e. [ -0.476, 0.192] p.e. [ -0.414, 0.178] p.e.[ -0.024, 0.207] CI [ -0.486, 0.634] CI [ -0.486, 0.207] CI [ -0.434, 0.200] CI
Notes: p.e. = point estimates; CI = confidence Interval. Imbens-Manski (2004) 95% CIs obtained using 100 bootstrap repetitions. Q = maximum rate of misclassification of WTO status. Assumption of no false positives is imposed. MIV is minus GDP per capita. Number of observations = 5735. See text for further details.
Assumptions Regarding Selection

Table 5. Sharp Bounds on the ATE of WTO Membership on MEA Participation: Non-OECD, 1995-2001
Q Exogenous Selection Worst-Case MTS MTS & MIV(1) (2) (3) (4)
I. Sign a New MEA0.00 [ 0.165, 0.165] p.e. [ -0.445, 0.555] p.e. [ -0.445, 0.165] p.e. [ -0.293, -0.025] p.e.
[ 0.115, 0.215] CI [ -0.466, 0.576] CI [ -0.466, 0.207] CI [ -0.361, 0.103] CI
0.01 [ 0.149, 0.192] p.e. [ -0.455, 0.565] p.e. [ -0.455, 0.192] p.e. [ -0.303, 0.011] p.e.[ 0.107, 0.235] CI [ -0.476, 0.586] CI [ -0.476, 0.234] CI [ -0.371, 0.140] CI
0.03 [ 0.115, 0.250] p.e. [ -0.475, 0.585] p.e. [ -0.475, 0.250] p.e. [ -0.323, 0.095] p.e.[ 0.072, 0.293] CI [ -0.496, 0.606] CI [ -0.496, 0.293] CI [ -0.391, 0.221] CI
0.05 [ 0.080, 0.311] p.e. [ -0.495, 0.605] p.e. [ -0.495, 0.311] p.e. [ -0.343, 0.197] p.e.[ 0.036, 0.357] CI [ -0.516, 0.626] CI [ -0.516, 0.357] CI [ -0.411, 0.314] CI
II. Sign, Ratify, or Enter in Force a New MEA0.00 [ 0.131, 0.131] p.e. [ -0.395, 0.605] p.e. [ -0.395, 0.131] p.e. [ -0.202, -0.113] p.e.
[ 0.081, 0.181] CI [ -0.415, 0.626] CI [ -0.415, 0.173] CI [ -0.261, 0.007] CI
0.01 [ 0.103, 0.147] p.e. [ -0.405, 0.615] p.e. [ -0.405, 0.147] p.e. [ -0.212, -0.094] p.e.[ 0.061, 0.189] CI [ -0.425, 0.636] CI [ -0.425, 0.189] CI [ -0.270, 0.028] CI
0.03 [ 0.046, 0.180] p.e. [ -0.425, 0.635] p.e. [ -0.425, 0.180] p.e. [ -0.232, -0.053] p.e.[ 0.002, 0.224] CI [ -0.445, 0.656] CI [ -0.445, 0.224] CI [ -0.290, 0.074] CI
0.05 [ -0.014, 0.217] p.e. [ -0.445, 0.655] p.e. [ -0.445, 0.217] p.e. [ -0.252, -0.006] p.e.[ -0.060, 0.262] CI [ -0.465, 0.676] CI [ -0.465, 0.262] CI [ -0.310, 0.127] CI
Assumptions Regarding Selection
Notes: p.e. = point estimates; CI = confidence Interval. Imbens-Manski (2004) 95% CIs obtained using 100 bootstrap repetitions. Q = maximum rate of misclassification of WTO status. Assumption of no false positives is imposed. MIV is minus GDP per capita. Number of observations = 1135. See text for further details.

Appendix

Figure A1. Sharp Bounds on the ATE of WTO Membership on MEA Participation by Time Period: Signature Note: Left panel corresponds to 1960-1994; right panel to 1995-2001.
Figure A2. Sharp Bounds on the ATE of WTO Membership on MEA Participation by Time Period: Signature, Ratification, or Entry Into Force Note: Left panel corresponds to 1960-1994; right panel to 1995-2001.
Figure A3. Sharp Bounds on the ATE of WTO Membership on MEA Participation by Time Period: Any Participation Note: Left panel corresponds to 1960-1994. 1995-2001 analysis not feasible.
-0.431 -0.441 -0.461 -0.481
0.1640.194
0.2550.318
-0.385 -0.395 -0.415 -0.435
0.1330.162
0.2210.277
-0.5
00.
000.
501.
00A
TE
0.00 0.01 0.03 0.05Maximum Allowed Degree of Misclassification
MTS Alone
Joint MTS & MIV
No False Positive ErrorsMTSp & MTSp-MIV Assumptions
-0.424 -0.434 -0.454 -0.474
0.2120.241
0.305
0.375
-0.424 -0.434 -0.454 -0.474
0.174 0.1970.245
0.295
-0.5
00.
000.
501.
00A
TE
0.00 0.01 0.03 0.05Maximum Allowed Degree of Misclassification
MTS Alone
Joint MTS & MIV
No False Positive ErrorsMTSp & MTSp-MIV Assumptions
-0.412 -0.422 -0.442 -0.462
0.187 0.2120.262
0.314
-0.369 -0.379 -0.399 -0.419
0.150 0.1740.224
0.273
-0.5
00.
000.
501.
00A
TE
0.00 0.01 0.03 0.05Maximum Allowed Degree of Misclassification
MTS Alone
Joint MTS & MIV
No False Positive ErrorsMTSp & MTSp-MIV Assumptions
-0.354 -0.364 -0.384 -0.404
0.166 0.1830.221
0.262
-0.354 -0.364 -0.384 -0.404
0.132 0.1480.184
0.224
-0.5
00.
000.
501.
00A
TE
0.00 0.01 0.03 0.05Maximum Allowed Degree of Misclassification
MTS Alone
Joint MTS & MIV
No False Positive ErrorsMTSp & MTSp-MIV Assumptions
-0.384 -0.394 -0.414 -0.434
0.192 0.197 0.208 0.221
-0.292 -0.302 -0.322 -0.342
0.159 0.164 0.173 0.182
-0.5
00.
000.
501.
00A
TE
0.00 0.01 0.03 0.05Maximum Allowed Degree of Misclassification
MTS Alone
Joint MTS & MIV
No False Positive ErrorsMTSp & MTSp-MIV Assumptions
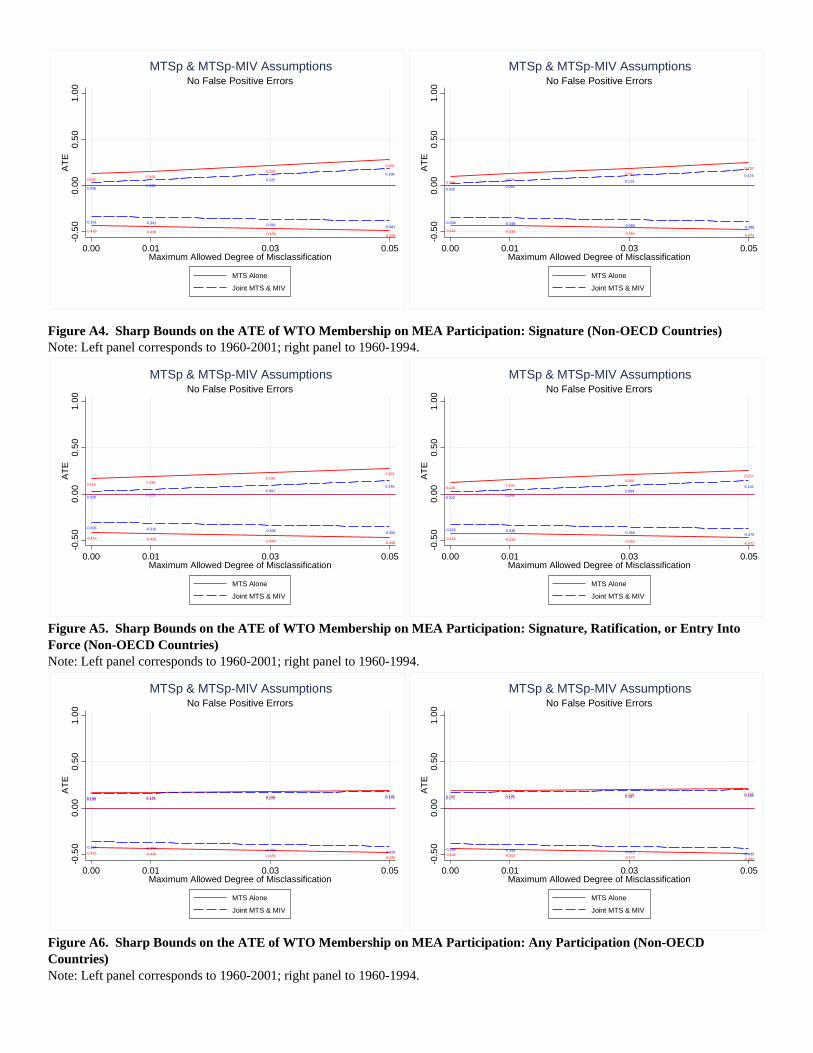
Figure A4. Sharp Bounds on the ATE of WTO Membership on MEA Participation: Signature (Non-OECD Countries) Note: Left panel corresponds to 1960-2001; right panel to 1960-1994.
Figure A5. Sharp Bounds on the ATE of WTO Membership on MEA Participation: Signature, Ratification, or Entry Into Force (Non-OECD Countries) Note: Left panel corresponds to 1960-2001; right panel to 1960-1994.
Figure A6. Sharp Bounds on the ATE of WTO Membership on MEA Participation: Any Participation (Non-OECD Countries) Note: Left panel corresponds to 1960-2001; right panel to 1960-1994.
-0.428 -0.438 -0.458 -0.478
0.1310.161
0.2200.280
-0.331 -0.341 -0.361 -0.381
0.0360.065
0.1250.188
-0.5
00.
000.
501.
00A
TE
0.00 0.01 0.03 0.05Maximum Allowed Degree of Misclassification
MTS Alone
Joint MTS & MIV
No False Positive ErrorsMTSp & MTSp-MIV Assumptions
-0.424 -0.434 -0.454 -0.474
0.0980.129
0.1910.253
-0.338 -0.348 -0.368 -0.388
0.0250.054
0.1130.174
-0.5
00.
000.
501.
00A
TE
0.00 0.01 0.03 0.05Maximum Allowed Degree of Misclassification
MTS Alone
Joint MTS & MIV
No False Positive ErrorsMTSp & MTSp-MIV Assumptions
-0.416 -0.426 -0.446 -0.466
0.163 0.1860.233
0.281
-0.306 -0.316 -0.336 -0.356
0.028 0.0510.097
0.145
-0.5
00.
000.
501.
00A
TE
0.00 0.01 0.03 0.05Maximum Allowed Degree of Misclassification
MTS Alone
Joint MTS & MIV
No False Positive ErrorsMTSp & MTSp-MIV Assumptions
-0.422 -0.432 -0.452 -0.472
0.130 0.1550.206
0.257
-0.326 -0.336 -0.356 -0.376
0.022 0.0460.094
0.143
-0.5
00.
000.
501.
00A
TE
0.00 0.01 0.03 0.05Maximum Allowed Degree of Misclassification
MTS Alone
Joint MTS & MIV
No False Positive ErrorsMTSp & MTSp-MIV Assumptions
-0.426 -0.436 -0.456 -0.476
0.169 0.174 0.183 0.192
-0.364 -0.374 -0.394 -0.414
0.159 0.163 0.170 0.178
-0.5
00.
000.
501.
00A
TE
0.00 0.01 0.03 0.05Maximum Allowed Degree of Misclassification
MTS Alone
Joint MTS & MIV
No False Positive ErrorsMTSp & MTSp-MIV Assumptions
-0.442 -0.452 -0.472 -0.492
0.190 0.195 0.205 0.215
-0.385 -0.395 -0.415 -0.435
0.171 0.176 0.187 0.198
-0.5
00.
000.
501.
00A
TE
0.00 0.01 0.03 0.05Maximum Allowed Degree of Misclassification
MTS Alone
Joint MTS & MIV
No False Positive ErrorsMTSp & MTSp-MIV Assumptions

Table A1. Summary StatisticsVariable Mean SD Minimum MaximumWTO Membership (1 = Yes) 0.559 0.497 0 1New MEA Signature (1 = Yes) 0.304 0.460 0 1New MEA Signature, Ratification, or Entry into Force (1 = Yes) 0.457 0.498 0 1Current MEA Participation (1 = Yes) 0.901 0.299 0 1Year 1982.257 11.901 1960 2001OECD (1 = Yes) 0.149 0.356 0 1GDP Per Capita) 7661.842 13444.440 50.0 124015.4
Notes: N = 6739.
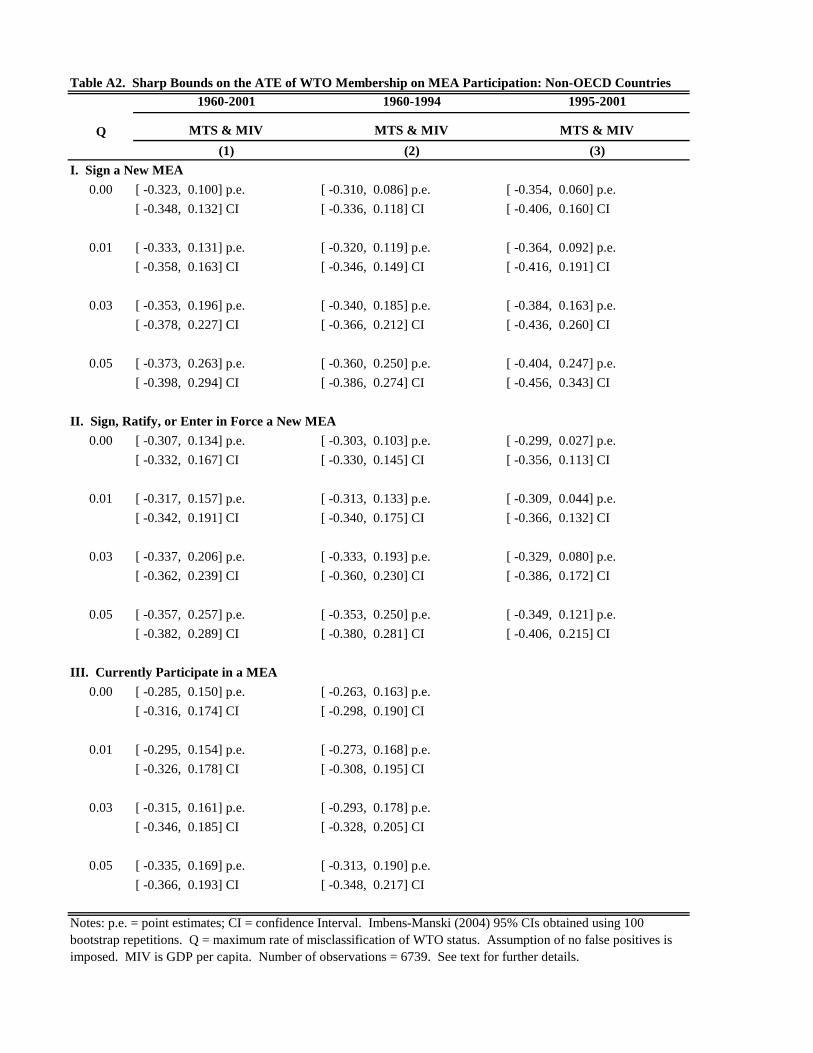
Table A2. Sharp Bounds on the ATE of WTO Membership on MEA Participation: Non-OECD Countries1960-2001 1960-1994 1995-2001
Q MTS & MIV MTS & MIV MTS & MIV(1) (2) (3)
I. Sign a New MEA0.00 [ -0.323, 0.100] p.e. [ -0.310, 0.086] p.e. [ -0.354, 0.060] p.e.
[ -0.348, 0.132] CI [ -0.336, 0.118] CI [ -0.406, 0.160] CI
0.01 [ -0.333, 0.131] p.e. [ -0.320, 0.119] p.e. [ -0.364, 0.092] p.e.[ -0.358, 0.163] CI [ -0.346, 0.149] CI [ -0.416, 0.191] CI
0.03 [ -0.353, 0.196] p.e. [ -0.340, 0.185] p.e. [ -0.384, 0.163] p.e.[ -0.378, 0.227] CI [ -0.366, 0.212] CI [ -0.436, 0.260] CI
0.05 [ -0.373, 0.263] p.e. [ -0.360, 0.250] p.e. [ -0.404, 0.247] p.e.[ -0.398, 0.294] CI [ -0.386, 0.274] CI [ -0.456, 0.343] CI
II. Sign, Ratify, or Enter in Force a New MEA0.00 [ -0.307, 0.134] p.e. [ -0.303, 0.103] p.e. [ -0.299, 0.027] p.e.
[ -0.332, 0.167] CI [ -0.330, 0.145] CI [ -0.356, 0.113] CI
0.01 [ -0.317, 0.157] p.e. [ -0.313, 0.133] p.e. [ -0.309, 0.044] p.e.[ -0.342, 0.191] CI [ -0.340, 0.175] CI [ -0.366, 0.132] CI
0.03 [ -0.337, 0.206] p.e. [ -0.333, 0.193] p.e. [ -0.329, 0.080] p.e.[ -0.362, 0.239] CI [ -0.360, 0.230] CI [ -0.386, 0.172] CI
0.05 [ -0.357, 0.257] p.e. [ -0.353, 0.250] p.e. [ -0.349, 0.121] p.e.[ -0.382, 0.289] CI [ -0.380, 0.281] CI [ -0.406, 0.215] CI
III. Currently Participate in a MEA0.00 [ -0.285, 0.150] p.e. [ -0.263, 0.163] p.e.
[ -0.316, 0.174] CI [ -0.298, 0.190] CI
0.01 [ -0.295, 0.154] p.e. [ -0.273, 0.168] p.e.[ -0.326, 0.178] CI [ -0.308, 0.195] CI
0.03 [ -0.315, 0.161] p.e. [ -0.293, 0.178] p.e.[ -0.346, 0.185] CI [ -0.328, 0.205] CI
0.05 [ -0.335, 0.169] p.e. [ -0.313, 0.190] p.e.[ -0.366, 0.193] CI [ -0.348, 0.217] CI
Notes: p.e. = point estimates; CI = confidence Interval. Imbens-Manski (2004) 95% CIs obtained using 100 bootstrap repetitions. Q = maximum rate of misclassification of WTO status. Assumption of no false positives is imposed. MIV is GDP per capita. Number of observations = 6739. See text for further details.

Table A3. Sharp Bounds on the ATE of WTO Membership on MEA Participation: Non-OECD, 1960-1994
Q Exogenous Selection Worst-Case MTS MTS & MIV(1) (2) (3) (4)
I. Sign a New MEA0.00 [ 0.098, 0.098] p.e. [ -0.424, 0.576] p.e. [ -0.424, 0.098] p.e. [ -0.338, 0.025] p.e.
[ 0.071, 0.126] CI [ -0.437, 0.589] CI [ -0.437, 0.121] CI [ -0.365, 0.069] CI
0.01 [ 0.089, 0.129] p.e. [ -0.434, 0.586] p.e. [ -0.434, 0.129] p.e. [ -0.348, 0.054] p.e.[ 0.066, 0.152] CI [ -0.447, 0.599] CI [ -0.447, 0.152] CI [ -0.375, 0.097] CI
0.03 [ 0.071, 0.191] p.e. [ -0.454, 0.606] p.e. [ -0.454, 0.191] p.e. [ -0.368, 0.113] p.e.[ 0.048, 0.213] CI [ -0.467, 0.619] CI [ -0.467, 0.213] CI [ -0.395, 0.155] CI
0.05 [ 0.053, 0.253] p.e. [ -0.474, 0.626] p.e. [ -0.474, 0.253] p.e. [ -0.388, 0.174] p.e.[ 0.030, 0.275] CI [ -0.487, 0.639] CI [ -0.487, 0.275] CI [ -0.415, 0.214] CI
II. Sign, Ratify, or Enter in Force a New MEA0.00 [ 0.130, 0.130] p.e. [ -0.422, 0.578] p.e. [ -0.422, 0.130] p.e. [ -0.326, 0.022] p.e.
[ 0.102, 0.158] CI [ -0.434, 0.591] CI [ -0.434, 0.154] CI [ -0.355, 0.069] CI
0.01 [ 0.115, 0.155] p.e. [ -0.432, 0.588] p.e. [ -0.432, 0.155] p.e. [ -0.336, 0.046] p.e.[ 0.092, 0.179] CI [ -0.444, 0.601] CI [ -0.444, 0.179] CI [ -0.365, 0.093] CI
0.03 [ 0.086, 0.206] p.e. [ -0.452, 0.608] p.e. [ -0.452, 0.206] p.e. [ -0.356, 0.094] p.e.[ 0.062, 0.230] CI [ -0.464, 0.621] CI [ -0.464, 0.230] CI [ -0.385, 0.142] CI
0.05 [ 0.057, 0.257] p.e. [ -0.472, 0.628] p.e. [ -0.472, 0.257] p.e. [ -0.376, 0.143] p.e.[ 0.034, 0.281] CI [ -0.484, 0.641] CI [ -0.484, 0.281] CI [ -0.405, 0.190] CI
III. Currently Participate in a MEA0.00 [ 0.190, 0.190] p.e. [ -0.442, 0.558] p.e. [ -0.442, 0.190] p.e. [ -0.385, 0.171] p.e.
[ 0.170, 0.210] CI [ -0.454, 0.570] CI [ -0.454, 0.207] CI [ -0.407, 0.199] CI
0.01 [ 0.155, 0.195] p.e. [ -0.452, 0.568] p.e. [ -0.452, 0.195] p.e. [ -0.395, 0.176] p.e.[ 0.137, 0.212] CI [ -0.464, 0.580] CI [ -0.464, 0.212] CI [ -0.417, 0.204] CI
0.03 [ 0.085, 0.205] p.e. [ -0.472, 0.588] p.e. [ -0.472, 0.205] p.e. [ -0.415, 0.187] p.e.[ 0.067, 0.222] CI [ -0.484, 0.600] CI [ -0.484, 0.222] CI [ -0.437, 0.214] CI
0.05 [ 0.015, 0.215] p.e. [ -0.492, 0.608] p.e. [ -0.492, 0.215] p.e. [ -0.435, 0.198] p.e.[ -0.003, 0.233] CI [ -0.504, 0.620] CI [ -0.504, 0.233] CI [ -0.457, 0.226] CI
Assumptions Regarding Selection
Notes: p.e. = point estimates; CI = confidence Interval. Imbens-Manski (2004) 95% CIs obtained using 100 bootstrap repetitions. Q = maximum rate of misclassification of WTO status. Assumption of no false positives is imposed. MIV is minus GDP per capita. Number of observations = 4600. See text for further details.
![Attachments [Plurilateral Agreements in General] [ITA] · Attachments [Plurilateral Agreements in General] 1. Multilateral Agreements and Plurilater al Agreements on Trade-related](https://img.pdfslide.net/doc/110x75/5f098b887e708231d42756e4/attachments-plurilateral-agreements-in-general-ita-attachments-plurilateral.jpg)

![Attachments [Plurilateral Agreements in General] …...Attachments [Plurilateral Agreements in General] 1. Multilateral Agreements and Plurilater al Agreements on Trade-related Issues](https://img.pdfslide.net/doc/110x75/5eb6874079a91941835bf687/attachments-plurilateral-agreements-in-general-attachments-plurilateral-agreements.jpg)