Embed Size (px)
Citation preview
RESEARCH ARTICLE Open Access
Multilevel analysis of individual, household,and community factors influencing childgrowth in NepalTim Smith and Gerald Shively*
Abstract
Background: Childhood malnutrition and growth faltering is a serious concern in Nepal. Studies of child growthtypically focus on child and mother characteristics as key factors, largely because Demographic and Health Surveys(DHS) collect data at these levels. To control for and measure the importance of higher-level factors thisstudy supplements 2006 and 2011 DHS data for Nepal with data from coincident rounds of the Nepal LivingStandards Surveys (NLSS). NLSS information is summarized at the district level and matched to children usingdistrict identifiers available in the DHS.
Methods: The sample consists of 7533 children aged 0 to 59months with complete anthropometric measurementsfrom the 2006 and 2011 NDHS. These growth metrics, specifically height-for-age and weight-for-height, are used inmultilevel regression models, with different group designations as upper-level denominations and different observedcharacteristics as upper-level predictors.
Results: Characteristics of children and households explain most of the variance in height-for-age and weight-for-height,with statistically significant but relatively smaller overall contributions from community-level factors. Approximately 6% oftotal variance and 22% of explained variance in height-for-age z-scores occurs between districts. For weight-for-height,approximately 5% of total variance, and 35% of explained variance occurs between districts.
Conclusions: The most important district-level factors for explaining variance in linear growth and weight gain are thepercentage of the population belonging to marginalized groups and the distance to the nearest hospital.Traditional determinants of child growth maintain their statistical power in the hierarchical models, underscoring theiroverall importance for policy attention.
BackgroundHuman capital is a key determinant of economic growthand development [1]. Persistent malnutrition throughoutearly childhood can severely hinder a child’s physicaland cognitive development [2] and, therefore, her accu-mulation of human capital. Malnutrition also increasesthe risk of contracting various illnesses and can deepena child’s level of malnutrition in a highly deleteriousdisease-hunger feedback loop, thereby perpetuating in-tergenerational poverty [3, 4]. Where malnutrition iswidespread, it can undermine a country’s economic per-formance and prospects for economic and social devel-opment. As a result, finding ways to reduce childhood
malnutrition at scale remains a development imperative.A related policy-relevant question is whether policymakers and development agencies should focus inter-ventions and investments on individuals, households, orcommunities, and in what proportions. Answering thesequestions is particularly important in the context ofSustainable Development Goals (SDG’s) two and three,which commit the international community to endinghunger and achieving health and wellbeing for people atall ages.This paper provides empirical insights into these issues
for Nepal, one of the least well-nourished countries inthe world, and one where human development is frus-trated by a range of economic, geographic and socialchallenges. A large proportion of children below fiveyears of age in Nepal suffer from malnutrition, as
© The Author(s). 2019 Open Access This article is distributed under the terms of the Creative Commons Attribution 4.0International License (http://creativecommons.org/licenses/by/4.0/), which permits unrestricted use, distribution, andreproduction in any medium, provided you give appropriate credit to the original author(s) and the source, provide a link tothe Creative Commons license, and indicate if changes were made. The Creative Commons Public Domain Dedication waiver(http://creativecommons.org/publicdomain/zero/1.0/) applies to the data made available in this article, unless otherwise stated.
* Correspondence: [email protected] of Agricultural Economics, Purdue University, West Lafayette, IN47907, USA
Smith and Shively BMC Pediatrics (2019) 19:91 https://doi.org/10.1186/s12887-019-1469-8

indicated by population-level anthropometric indicatorssuch as height-for-age and weight-for-age. Although theincidences of stunting and underweight fell substantiallybetween 2001 and 2011, 41% of children under five werestunted in 2011, 29% were underweight, and 11% wereacutely wasted [5]. In 2017, the Nepal Ministry of Healthreported that the stunting rate continued to decline after2011, but as of 2016, 36% of children in Nepal werestunted (HAZ < − 2.0) and 12% were severely stunted(HAZ < − 3.0) [6]. The problem of child malnutritiontherefore remains pressing in Nepal, and requires analysisthat rigorously asks what factors matter for the patterns ob-served, and at what levels. Recent reviews of maternal andchild nutrition [2, 7] highlight a range of individual- andhousehold-level factors that can influence a child’s health,nutrition and physical growth, among them mother’s healthand education, access to clean water and sanitation, andfood consumption and diet diversity. In Nepal, observedreductions in undernutrition over time have been traced toasset accumulation, health and nutrition interventions,gains in maternal education, and improvements in sanita-tion [8]. However, gaps remain in our understanding ofhow community factors might contribute to outcomes.These factors may be potentially important for understand-ing whole-population shifts in growth faltering [9, 10]. Forexample, as in many countries where infrastructure is weakand households are isolated, in Nepal supra-householdenvironmental conditions such as rainfall are correlatedwith outcomes, along with community-level factors such asroads and markets [11, 12].In this paper we study a range of individual, household,
and community factors in relation to height-for-age andweight-for-height. We build on a conceptual frameworkdeveloped by UNICEF [13] and extended by Smith andHaddad [14], who posit three distinct categories of nutri-tional determinants, arranged hierarchically: (i) immediatedeterminants, occurring at the child level and proximatelydetermining outcomes; (ii) underlying determinants, gener-ally occurring at the household level and mediated throughimmediate determinants; and (iii) basic determinants, i.e.those features of communities which provide the contextfor underlying and immediate determinants. This hierarchytranslates comfortably into a three-level mixed model re-gression framework, which we employ to test two generalhypotheses. The first is that community-level factors (spe-cifically local food supply, the local health environment,and cultural characteristics) are relevant to explaining ob-served patterns of growth, even when one controls forchild- and household-level characteristics. Evidence regard-ing this hypothesis provides insights into interventions thatmight prove effective in promoting child health and nutri-tion. The second hypothesis is that omitting thesehigher-level characteristics from models of child growthmay lead to an overestimation of the importance of
individual- and household-level factors (such as acute sick-ness, breastfeeding practices, mother’s education andhealth, and household wealth) in explaining observed vari-ance in growth metrics.We make two contributions. The first is that we in-
corporate data from multiple datasets, including Demo-graphic and Health Surveys (DHS) and Living StandardsMeasurement Surveys (LSMS), matching information atgeographic reference points and incorporating it underminimally onerous representation assumptions. This per-mits us to fill an empirical gap in the literature, by includingcovariates representing variables potentially amenable topolicy intervention at broad scales. The second contribu-tion is to demonstrate how hierarchical modelling tech-niques can be used to measure the relative contribution toand importance of relationships between child-level anthro-pometry and household- and community-level covariates ina way that constitutes a methodological improvement overstandard linear regression models. We are not the first toanswer questions about childhood nutrition by consideringdata observed at different levels in this way, however, andhave drawn on the small but focused literature on thesetopics. The most closely related study applies similar tech-niques to earlier data from the NDHS, but uses discretemeasures of underweight and stunting, and is unable toinclude the kinds of community variables available in theNLSS. Therefore, while previous research [15] reaches simi-lar conclusions regarding household and individual factors,we are able to incorporate and study the role of communitydeterminants in a more complete manner. The broaderliterature on multilevel models of childhood nutrition out-comes [16–20] also provides guidance regarding selectionof variables and the interpretation of results, but thesepapers either focus on allowing household parameters tovary over space or on including hierarchical random effects,rather than integrating community characteristics throughthe hierarchical structure as we do.
MethodsData sourcesTo estimate our models we stack data from twochild-level datasets constructed from the 2006 and 2011Nepal Demographic and Health Surveys (DHS). We thenmerge to these data information from the 2004 and 2010Nepal Living Standards Surveys (NLSS). The DHS sur-veys include our dependent variables for children underfive years of age, as well as child, mother and householdcharacteristics that have been shown in past studies tobe relevant to explaining child growth. The NLSS in-cludes measures of agricultural activity, access to ser-vices, infrastructure, and incomes at the individual andhousehold levels. The NLSS did not visit the samehouseholds as the DHS, so we cannot directly matchhousehold information. However, both surveys used the
Smith and Shively BMC Pediatrics (2019) 19:91 Page 2 of 14

same district definitions and identification codes. Thisallows us to aggregate household observations from theNLSS up to the district level, and then match a set ofdistrict-level NLSS variables to DHS households basedon district and year combinations. To our knowledge,there is no publicly available crosswalk that would allowa researcher to match children across surveys or tomatch geographic data at a finer scale (e.g. subdistrict,village, or municipality). Therefore, we do not attemptto produce any matches at scales finer than the district.We match 2004 NLSS data to the 2006 DHS, and 2010NLSS data to the 2011 DHS. The 2006 DHS includes5237 children, and the 2011 DHS includes 2335 chil-dren. When combined, these datasets provide anthropo-metric information on 7572 children under age five. Atotal of 39 children were omitted due to missing valuesfor independent variables, leaving 7533 child-level recordsfor analysis. The validity of our DHS-NLSS matching restson the assumption that these measures of communitycharacteristics from the NLSS are reliable measures of themore general circumstances surrounding a child subse-quently observed in the DHS. To account for differencesin lag lengths and potential observed and unobservedheterogeneity in trends across time and space we usesurvey year and birth year controls. Use of these data didnot require institutional review because respondents pre-viously provided informed consent and were rendered an-onymous before the data were released to us for analysis.Our dependent variables are the child’s height-for-age
z-score (HAZ) and weight-for-height z-score (WHZ).Z-scores measure the dispersion of the indicator asstandard deviations around a reference population me-dian, and are calculated as:
zi ¼ xi−xσx
ð1Þ
where xi is the individual observation and x and σx arethe median and the standard deviation of the referencepopulation. Z-scores were calculated using the WHO’scurrent Child Growth Standards reference population[21]. Our use of continuous z-score outcomes is note-worthy because many studies use a binary dependentvariable to indicate stunting (HAZ < − 2.0) or wasting(WHZ < − 2.0) [15, 16, 22, 23]. Z-score cutoffs (e.g. -2.0for stunting and wasting or − 3.0 for severe stunting orsevere wasting) can mask important information aboutthe entire distribution of outcomes and their use dis-cards information about that distribution, a fact recog-nized at the time z-scores were introduced by the WHO[24]. Elsewhere [25–27] it has been argued that thewidely-accepted − 2.0 cutoff is arbitrary, with little bio-logical basis for a threshold. Using a continuous measurein place of a binary indicator allows us to capture the
intensity of growth faltering in the population. Z-scoresused in this analysis are distributed normally, althoughplots of z-scores against quantiles of the normal distri-bution do reveal slight departures from normality in theextreme tails of the distributions, but not to a degreethat is detrimental to the analysis or amenable to correc-tion via a monotonic transformation of the data.Among immediate determinants, we include a large
set of child-level variables that have been shown to becorrelated with child growth in Nepal and elsewhere.These include the child’s age (in months), sex, and twinstatus, as well as two indicators of acute disease symptoms(diarrhea in the two weeks prior to anthropometric meas-urement and fever in the same period) as these are knownto place demands on a body’s physical resources [16].Given the importance of breastfeeding patterns in deter-mining nutrition, health and physical growth [2, 15], weinclude a binary variable indicating whether a child wasbeing breastfed at the time of measurement, along withthe total number of months of breastfeeding. In furtherrecognition of the importance of a mother’s status andeducation [17, 27–33], as well as natal and perinatal healthin early childhood development [2, 34–37], we also in-clude a set of maternal characteristics that are tied to chil-dren. These include a woman’s body mass index (BMI),her age at birth (in years), her education (in years), and abinary indicator of her hand-washing opportunities (codedas one if a place for handwashing with running water wasavailable in the household, and zero otherwise).We also include the squares of child’s age and breast-
feeding duration to allow for the possibility that the rela-tionship between HAZ and these time variables isnonlinear. This could be the case if, for example, house-holds are, on average, better at providing nutrition foryounger and older children compared to children in themiddle range of ages in our sample, or if breastfeedingafter a certain age is a less effective way of delivering nu-trition. Including the squares of these terms allows themarginal effect of the variable in question to depend onthe value of that variable as well as the estimated coeffi-cients, so that if the relationship between HAZ and thevariable changes across the variable’s range, we can de-tect that difference when we fit the regression.At the household level, we account for several under-
lying determinants. One is membership in the Dalit caste.While the caste system was officially abolished in Nepal1962, evidence suggests continued discrimination, whichmay affect a child’s status in ways not captured by theother variables included at this level [38]. We control foreconomic status via a wealth index, measured as thehousehold’s quintile value on an index of wealth generatedby DHS analysts applying weights to observed householdassets using principal components analysis. Elsewhere, thishas been used as a measure of household socioeconomic
Smith and Shively BMC Pediatrics (2019) 19:91 Page 3 of 14

status [17, 18, 33]. A substantial body of research suggeststhat economic wellbeing has a positive effect on children’snutritional status and growth [15, 31, 32, 39]. We also in-clude indicators of water and fuel sources, the former inrecognition of the importance of waterborne diseases tonutrition and health [40, 41], and the latter in recognitionof the potential importance of indoor air quality for upperrespiratory health and child growth [42, 43]. Indoor airpollution from tobacco smoke and the burning of biomassfuels is common in Nepal and have health effects with im-plications for child growth [44, 45]. We therefore includean indicator for the type of fuel used (one if the householdused biomass too cook; zero otherwise). We also includealtitude (in meters above sea level) as a control variable.We expect altitude to control for multiple factors thatcould impact growth. Altitude and linear growth are likelyto be negatively correlated due to remoteness, and also be-cause the reduced oxygen content of air at altitude mayimpair growth [46, 47].We also incorporate community-level basic determi-
nants. Previous multilevel regression work on child mor-tality and stunting included distance to the nearest healthfacility, community-level rates of education attainment,and infrastructure [29]. Our expectation is that omittinghigher-level factors could lead to mistaken inference re-garding point estimates on child- and household-level var-iables, and mask the importance of non-nutritioninterventions of interest to policy makers. Recent workfrom Nepal, for example, demonstrates the importance offood markets in mitigating the effects of climate on lineargrowth [10], and the role of transportation infrastructurein moderating food prices [48] and explaining patterns ofchild growth [49, 50].All district-level variables are derived from either the
NLSS or from Nepal census data. Because child andhousehold-level food consumption variables are not avail-able in the DHS, we measure the percentage of NLSS re-spondents who reported their food consumption withinthe last month as inadequate. Food shortages are deter-mined at least partially by factors which affect all house-holds in a district, such as weather, soil characteristics,and food prices. We also include a measure of market ac-cess (a commercialization ratio computed as the propor-tion of NLSS households in a district that reported sellingsome amount of their agricultural output). We include anindicator of access to healthcare (the median reported dis-tance to the nearest hospital, in minutes on foot) and ameasure of community-level hygiene (the percentage ofVillage Development Committees (VDCs) in a district thatwere declared open defecation free at the time of the sur-vey). Finally, to control for overall social conditions, we in-clude an ethnicity indicator (the percentage of a district’spopulation that belongs to a marginalized ethnic or castegroup, calculated from census data), and a measure of
gender equity (calculated from census data as the ratio offemale students to total students in a district). Descriptivestatistics for all variables are presented in Table 1. Thesestatistics are included primarily for reference, but somesummaries merit particular attention. First, we note thequite low average HAZ values, with a mean of − 1.88, im-plying that the average child is very close to the stuntingcutoff, a fact that underscores the urgency of understand-ing undernutrition in this context. Average levels ofmaternal education are also extremely low, which is con-cerning given the importance of this variable in the litera-ture. It is, however, worth noting that the average child isbreastfed for about a year, approximately consistent withWHO guidelines, a positive outcome for this particularperiod in children’s lives.Merging data from different surveys conducted over
different time frames, as we do here, is not ideal, but giventhe limited availability of data, and the fact that the DHSdoes not include the data we need to relate child growth tolocal the social and economic conditions we emphasize, itis necessary. Certain factors mitigate concerns about thisapproach, however. First, we note that districts in Nepal arequite small compared to the top-level subnational adminis-trative units in other countries; as of the 2011 census, themost populous district by far was Kathmandu, with around1.7 million residents, a population scale more comparableto Indian districts or U.S. counties than to states in eithercountry. At this scale, we are confident that measures ofthe local conditions we emphasize are relevant for chil-dren’s nutritional outcomes, and while we would prefer touse data at the village or municipality level, the data neces-sary to do this are, to our knowledge, either nonexistent orinaccessible. In a nationally representative survey like theNLSS, we expect sample means and medians at the districtlevel to act as reasonably good estimators of the populationanalogs, and we restrict our analysis to measures of centraltendencies of variables, which should reflect general socialand economic conditions. We therefore expect that,while our approach may introduce noise, it is unlikelyto introduce bias. To test this conjecture, we con-ducted Kolmogorov-Smirnov tests comparing residualsfrom regressions which include only variables derivedfrom the DHS to residuals from regressions which in-clude the district data. If the non-DHS variables weresystematically correlated with the residuals, we wouldsee differences between these distributions. We fail toreject the null hypothesis of no difference in all casesat the 95% confidence level, however.
Empirical strategyUsing multilevel models for z-scores has conceptual andtechnical advantages. When the level of observation atwhich the dependent variable occurs is nested withinother levels—for example children nested in households
Smith and Shively BMC Pediatrics (2019) 19:91 Page 4 of 14

and districts—including higher-level characteristics aschild-level predictors can lead to the misstatement (gen-erally understatement) of standard errors, as one valuewill be replicated across all members of the same group.With a multilevel model, the value is applied once, atthe group level, and information from the pooled regres-sion can help generate reliable estimates even for groupswith very low numbers of first-level observations [51].Using multilevel models also allows us to include errorterms at each level, which makes it possible to trackchanges in variance at each level across models. Takentogether, these properties give multilevel models a sub-stantial advantage over classical regression models whendealing with hierarchically structured data, like thoseanalysed here [15].The specific form of our multilevel regression models
is given by eqs. (2, 3, and 4):
Zi ¼ αjk þ βXi þ ei i ¼ 1;…; I ð2Þ
αjk ¼ γ j0 þ γk þ e j for j ¼ 1;…; J ; k ¼ 1;…;K ð3Þ
γk ¼ λk0 þ λkDk þ ek for k ¼ 1;…;K ð4Þwhere Zi is the z-score for child i in household j in districtk, αjk and β are intercept and coefficient vectors forindividual-level variables Xi, γ j
0 is a household-specificintercept, and γk are district-level intercepts, each of whichis a function of district-level variables Dk,district-level co-
efficients λk, and the district-level intercepts λk0 . Finally,ei, ej, and ek are error terms at each level. In this specifica-tion, αjk does not vary in household characteristics, but in-cluding a household level allows us to estimate householdintercept terms and variance components. The expandedvariance terms allow us to account for variance arising at
Table 1 Descriptive statistics for all variables used in the regressions
Variable Units Mean Std. Dev. Min. Max.
Child level (n = 7572)
HAZ Standard deviations −1.88 1.35 −5.96 4.59
WHZ Standard deviations −0.79 1.08 −4.94 4.07
Age Months 30.0 17.1 0 59
Age2 Months2 1193 1054 0 3481
Twin status 0/1 indicator 0.01 0.10 0 1
Female 0/1 indicator 0.49 0.5 0 1
Breastfeeding 0/1 indicator 59.3% 49.1% 0 1
Breastfeeding duration Months 12.1 14.5 0 59
Breastfeeding duration2 Months2 356 605 0 3481
Fever in past two weeks 0/1 indicator 0.19 0.39 0 1
Diarrhea in past two weeks 0/1 indicator 0.13 0.34 0 1
Mother’s education Years 2.8 3.8 0 14
Hand washing access 0/1 indicator 0.62 0.48 0 1
Mother’s BMI BMI value 20.6 2.7 14.0 36.9
Mother’s age at birth Years 24.9 5.9 13 47
Household level (n = 5450)
Wealth Quintile (1–5) 2.7 1.4 1 5
Water purification 0/1 indicator 0.13 0.34 0 1
Altitude Meters 836 730 46 3189
Ethnicity (Dalit) 0/1 indicator 0.163 0.37 0 1
Biomass fuel use 0/1 indicator 0.87 0.34 0 1
District level (n = 75)
Food short % of households 26.6% 18.7% 0.0% 91.7%
Educational Equity % girls in schools 48.7% 3.3% 37.7% 53.8%
Marginal % of households 47.0% 19.1% 6.1% 85.7%
Commercial sales % of households 45.1% 20.9% 0.0% 91.7%
Hospital distance minutes by foot 403 642 5 3600
Open defecation prevalence % VDC’s ODF free 11.1% 21.9% 0% 100%
Smith and Shively BMC Pediatrics (2019) 19:91 Page 5 of 14

child, household and district levels. We model a child’s z-score as a function of variables specific to the child (in-cluding characteristics of the mother and household). Wemodel variance at the district level as a function ofdistrict-level variables. We account for household-levelvariance, but given the low ratio of children under age fiveto households, the dataset does not support inclusion ofseparate household-level covariates at the household level.
ResultsThe main regression results are presented in Table 2 (forHAZ) and Table 3 (for WHZ). Models are organized asfollows. Model 1 is a null model, in which no predictorsare included but the variance is partitioned intobetween-child and between-district components by add-ing district-level shifts in the child-level random inter-cept value. Model 2 adds predictors at the child level,while maintaining district random intercepts. Models 3and 4 add different sets of predictors at the district level.For HAZ only, Model 5 includes a district-level sanita-tion variable. In all cases, continuous variables includedas explanatory variables have been standardized, so thatthe coefficient for any continuous variable is interpretedas the estimated change in the z-score resulting from aone standard deviation change in that variable. The ex-ception to this standardization is the wealth index vari-able which is centered on its median value of three.Model 1 demonstrates that a relatively low proportion of
the overall variance in anthropometric measures occursbetween districts (approximately 6% for HAZ and 5% forWHZ). As the results for Model 2 shows, conventional pre-dictors of malnutrition, occurring at the child and house-hold level and modeled at the child level in the hierarchicalregressions, are, for the most part significantly associatedwith HAZ and WHZ, with expected signs. Negative andstatistically significant correlates for HAZ include child’sage in months (mean = 30; std. dev. = 17.1), twin status(mean = 0.01; std. dev. = 0.10), altitude in meters (mean =836; std. dev. = 730), and minority status (mean = 0.16; std.dev. = 0.37). Results for WHZ, summarized in Table 3, aresimilarly intuitive. Negative and statistically significant cor-relates for WHZ also include indicators for acute sick-nesses: fever in the past two weeks (mean = 0.19 and std.dev. = 0.39) and diarrhea in the past two weeks (mean =0.13; std. dev. = 0.34), both of which are associated withrelatively large reductions in WHZ. Positive and statisticallysignificant correlates for HAZ and WHZ include mother’seducation in years (mean = 2.8; std. dev. = 3.8), mother’sBMI (mean = 20.6; std. dev. = 2.7) and the household wealthquintile. Surprisingly, the coefficient on the water treatmentindicator is not significantly different from zero at standardtest levels in these models.To compare different specifications of the upper-level
portions of the model, we run models for each of the
three community-level factors of interest: the food supply,the health environment, and cultural factors. Comparisonsacross models 2–5 for HAZ (Table 2) and models 2–4 forWHZ (Table 3) indicate that point estimates for the indi-vidual- and household-level variables are similar in sign,magnitude and significance across different upper-levelspecifications. We compare the performance of thesemodels using AIC and R-squared measures, computingand comparing variance from each model overall and ateach level relative to the variance in Model 1. As results inTable 2 show, including district-level predictors improvesthe model of HAZ, compared to including only child-levelpredictors with district random intercepts. Addingdistrict-level measures for food shortages or gender equityresults in measurable improvements in goodness of fit. Inthe WHZ models (Table 3) the coefficients are smaller,but the improvements in goodness of fit have a similarmagnitude, and follow similar patterns. Improvements tomodel fit when upper-level predictors are added to themodel are confirmed by the AIC and Likelihood Ratio (LR)tests. Partitioning upper-level variance into specific factors,rather than simply leaving between-group heterogeneitiescontrolled but completely unexplained, clarifies the model’spredictions. As an example, Model 4 partitions almost all ofthe district intercept variance in HAZ and WHZ into vari-ances in specific parameters. Characteristics of children andhouseholds explain most of the variance in height-for-ageand weight-for-height, with statistically significant but rela-tively smaller overall contributions from community-levelfactors. Approximately 6% of total variance and 22% of ex-plained variance in HAZ occurs between districts. ForWHZ, approximately 5% of total variance, and 35% of ex-plained variance occurs between districts. Figure 1 furtherillustrates the district-level variances by showing theaverage district-level intercepts from Model 1 for HAZcomputed at the sub-region level.As a robustness check, Table 4 reports intraclass cor-
relation coefficients (ICCs) under alternative upper-levelspecifications. Relative to using districts, using primarysampling units (PSUs) or Wards to define communitiesdoes not increase upper-level variance substantially,relative to the proportional increase in the number ofgroups. As a further check on robustness of the re-sults, a series of alternative regressions are reported in(Additional file 1). These include parallel regressionsthat add birth year fixed effects (Tables S1 and S3) anda set of regressions that cluster standard errors at thedistrict level (Tables S2 and S4). Signs, magnitudes andstatistical significance of point estimates are broadlysimilar to those reported in Table 2 and Table 3. TableS5 reports variance components for all includedvariables, splitting variance contributions at householdand district levels into between-group and within-group proportions.
Smith and Shively BMC Pediatrics (2019) 19:91 Page 6 of 14

Table
2Regression
results
forthree-level(child-hou
seho
ld-district)mod
elsof
HAZ
Mod
el1
Mod
el2
Mod
el3
Mod
el4
Mod
el5
Age
(mon
ths)
–−0.235***
(0.0583)
−0.233***
(0.0583)
−0.234***
(0.0583)
−0.234***
(0.0582)
Age
2
(mon
thssquared)
–0.177***
(0.0405)
0.177***
(0.0405)
0.178***
(0.0404)
0.178***
(0.0404)
Female
(0/1)
–0.00313
(0.0260)
0.00476
(0.0260)
0.00487
(0.0260)
0.00463
(0.0260)
Twin
(0/1)
–−0.651***
(0.144)
−0.648***
(0.144)
−0.643***
(0.144)
−0.644***
(0.143)
Stillbreastfeed
ing
(0/1)
–0.765***
(0.228)
0.768***
(0.228)
0.768***
(0.228)
0.766***
(0.228)
Mon
thsbreastfeed
ing
(mon
ths)
–−0.482***
(0.121)
−0.482***
(0.121)
−0.481***
(0.121)
−0.480***
(0.121)
Mon
thsbreastfeed
ing2
(mon
thssquared)
–0.126***
(0.0338)
0.126***
(0.0338)
0.126***
(0.0337)
0.125***
(0.0337)
Feverin
lasttw
oweeks
(indicator)
–0.0245
(0.0350)
0.0234
(0.0350)
0.0240
(0.0350)
0.0239
(0.0350)
Diarrhe
ain
lasttw
oweeks
(indicator)
–−0.0743
(0.0405)
−0.0743
(0.0405)
−0.0742
(0.0405)
−0.0737
(0.0405)
Mothe
r’sed
ucation
(years)
–0.159***
(0.0186)
0.161***
(0.0186)
0.161***
(0.0186)
0.161***
(0.0186)
Accessto
hand
washing
(indicator)
–0.166***
(0.0339)
0.160***
(0.0340)
0.164***
(0.0339)
0.163***
(0.0339)
Mothe
r’sBM
I(BMIu
nits)
–0.113***
(0.0153)
0.113***
(0.0153)
0.113***
(0.0153)
0.113***
(0.0153)
Mothe
r’sageat
birth
(years)
–0.00285
(0.0147)
0.00270
(0.0147)
0.00250
(0.0147)
0.00240
(0.0147)
Wealth
Inde
x(quintile,1–5,cen
tered)
–0.0870***
(0.0151)
0.0854***
(0.0152)
0.0888***
(0.0151)
0.0884***
(0.0151)
Water
purification
(0/1)
–0.0603
(0.0515)
0.0558
(0.0514)
0.0542
(0.0512)
0.0569
(0.0512)
Year
(1=2011,0
=2006)
–0.129***
(0.0329)
0.135***
(0.0372)
0.125***
(0.0378)
0.124**
(0.0377)
Altitude
(m.a.s.l.)
–−0.170***
(0.0267)
−0.182***
(0.0282)
−0.174***
(0.0261)
−0.179***
(0.0261)
Mothe
risaDalit
(0/1)
–−0.124**
(0.0409)
−0.132**
(0.0410)
−0.122**
(0.0409)
−0.121**
(0.0409)
Biom
assusage
(0/1)
–−0.0852
(0.0593)
−0.0882
(0.0594)
−0.0752
(0.0595)
−0.0798
(0.0596)
Con
stant
−1.913***
(0.0427)
−2.609***
(0.151)
−2.601***
(0.151)
−2.614***
(0.151)
−2.600***
(0.151)
Smith and Shively BMC Pediatrics (2019) 19:91 Page 7 of 14

Table
2Regression
results
forthree-level(child-hou
seho
ld-district)mod
elsof
HAZ(Con
tinued)
Mod
el1
Mod
el2
Mod
el3
Mod
el4
Mod
el5
Birthtim
ingcontrols
Mon
thMon
thMon
thMon
thMon
th
Residu
alvariance
1.367***
(0.0381)
0.935***
(0.0269)
0.935***
(0.0270)
0.935***
(0.0270)
0.935***
(0.0270)
Districtvariance
0.109***
(0.0222)
0.0333***
(0.0085)
0.0277**
(0.0086)
0.000352
(0.00573)
1.71E-15
(8.61e-15)
Hou
seho
ldvariance
0.351***
(0.0360)
0.395***
(0.0282)
0.388***
(0.0281)
0.388***
(0.0281)
0.388***
(0.0281)
Food
shortage
†(%
repo
rtingshortage
)–
–0.00568***
(0.00490)
––
Gen
dereq
uity†
(femaleen
rollm
entratio
)–
–0.0091***
(0.0059)
0.0043***
(0.0054)
0.0049***
(0.0055)
Marginal†
(%marginalized
)–
––
0.0244***
(0.0114)
0.0237***
(0.0100)
Com
mercial†
(%selling
food
)–
––
0.0034
(0.0075)
0.00194
(0.0084)
Hospitald
istance†
(minutes
onfoot)
––
–0.0121***
(0.0092)
0.0123***
(0.0094)
ODFfre
e†(%
ofVD
Cs)
––
––
0.00283***
(0.0038)
Observatio
ns7533
7533
7533
7533
7533
TotalV
ariance
1.827
1.3633
1.3507
1.3234
1.323
Level1
R-squared
–0.32
0.32
0.32
0.32
Level3
R-squared
–0.69
0.75
0.99
0.99
OverallR-squared
–0.25
0.26
0.28
0.28
DistrictICC
0.0597
0.0244
0.0205
0.0003
0.0000
Hou
seho
ldICC
0.252
0.3144
0.3078
0.2937
0.2932
Log-Likelihoo
d−12,743.5
−11,696.3
−11,690.4
−11,686.2
−11,685.4
AIC
25,494.95
23,460.55
23,452.85
23,448.44
23,448.73
Notes:Stand
arderrors
presen
tedin
parenthe
ses.†indicatesvaria
bleha
sbe
enstan
dardized
Use
oftheseda
tadidno
trequ
ireinstitu
tiona
lreview
becauserespon
dentspreviously
prov
ided
inform
edconsen
tan
dwererend
ered
anon
ymou
sbe
fore
theda
tawerereleased
tous
foran
alysis
**Den
otes
statistical
sign
ificanceat
the5%
confiden
celevel
***D
enotes
statistical
sign
ificanceat
the1%
confiden
celevel
Smith and Shively BMC Pediatrics (2019) 19:91 Page 8 of 14
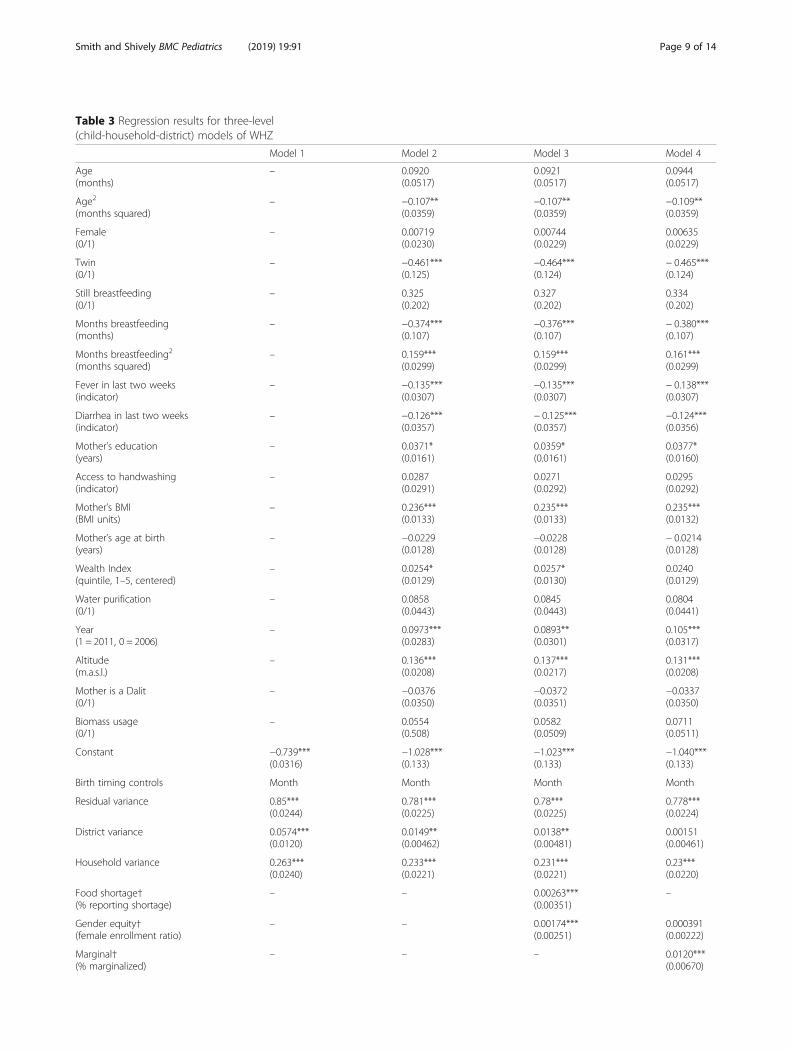
Table 3 Regression results for three-level(child-household-district) models of WHZ
Model 1 Model 2 Model 3 Model 4
Age(months)
– 0.0920(0.0517)
0.0921(0.0517)
0.0944(0.0517)
Age2
(months squared)– −0.107**
(0.0359)−0.107**(0.0359)
−0.109**(0.0359)
Female(0/1)
– 0.00719(0.0230)
0.00744(0.0229)
0.00635(0.0229)
Twin(0/1)
– −0.461***(0.125)
−0.464***(0.124)
− 0.465***(0.124)
Still breastfeeding(0/1)
– 0.325(0.202)
0.327(0.202)
0.334(0.202)
Months breastfeeding(months)
– −0.374***(0.107)
−0.376***(0.107)
− 0.380***(0.107)
Months breastfeeding2
(months squared)– 0.159***
(0.0299)0.159***(0.0299)
0.161***(0.0299)
Fever in last two weeks(indicator)
– −0.135***(0.0307)
−0.135***(0.0307)
− 0.138***(0.0307)
Diarrhea in last two weeks(indicator)
– −0.126***(0.0357)
− 0.125***(0.0357)
−0.124***(0.0356)
Mother’s education(years)
– 0.0371*(0.0161)
0.0359*(0.0161)
0.0377*(0.0160)
Access to handwashing(indicator)
– 0.0287(0.0291)
0.0271(0.0292)
0.0295(0.0292)
Mother’s BMI(BMI units)
– 0.236***(0.0133)
0.235***(0.0133)
0.235***(0.0132)
Mother’s age at birth(years)
– −0.0229(0.0128)
−0.0228(0.0128)
− 0.0214(0.0128)
Wealth Index(quintile, 1–5, centered)
– 0.0254*(0.0129)
0.0257*(0.0130)
0.0240(0.0129)
Water purification(0/1)
– 0.0858(0.0443)
0.0845(0.0443)
0.0804(0.0441)
Year(1 = 2011, 0 = 2006)
– 0.0973***(0.0283)
0.0893**(0.0301)
0.105***(0.0317)
Altitude(m.a.s.l.)
– 0.136***(0.0208)
0.137***(0.0217)
0.131***(0.0208)
Mother is a Dalit(0/1)
– −0.0376(0.0350)
−0.0372(0.0351)
−0.0337(0.0350)
Biomass usage(0/1)
– 0.0554(0.508)
0.0582(0.0509)
0.0711(0.0511)
Constant −0.739***(0.0316)
−1.028***(0.133)
−1.023***(0.133)
−1.040***(0.133)
Birth timing controls Month Month Month Month
Residual variance 0.85***(0.0244)
0.781***(0.0225)
0.78***(0.0225)
0.778***(0.0224)
District variance 0.0574***(0.0120)
0.0149**(0.00462)
0.0138**(0.00481)
0.00151(0.00461)
Household variance 0.263***(0.0240)
0.233***(0.0221)
0.231***(0.0221)
0.23***(0.0220)
Food shortage†(% reporting shortage)
– – 0.00263***(0.00351)
–
Gender equity†(female enrollment ratio)
– – 0.00174***(0.00251)
0.000391(0.00222)
Marginal†(% marginalized)
– – – 0.0120***(0.00670)
Smith and Shively BMC Pediatrics (2019) 19:91 Page 9 of 14

DiscussionResults suggest that individual- and household-levelcharacteristics matter more than district-level factors inexplaining HAZ and WHZ patterns. The relatively lowproportion of between-district variance in the nullmodel can be explained by a short list of household levelvariables. However, factors expected to play a role doimprove fit, and many show significant variance in theireffects across districts, a finding from the multilevelmodels which would go undetected in a classical regres-sion model. Access to healthcare, cultural and ethniccharacteristics, and aspects of the food economy explainvariance that remains after the inclusion of household
variables in the multilevel model. This pattern is consistentwith the relevant theory. However, while these featuresmake the models more reliable, they do not substantiallyimprove the fit of the model or the relative importance ofhousehold characteristics. This result is consistent with pastwork on child growth using multilevel models, where dif-ferences in first-level parameter values were observed be-tween Africa and Asia, but not within continents [30], andwhere between-community variance has been reported aslow [16, 19, 20]. In studies that included community-levelcovariates [19, 30], such variables were found to be less in-fluential for child growth and health than individual andhousehold covariates.
Table 3 Regression results for three-level(child-household-district) models of WHZ (Continued)
Model 1 Model 2 Model 3 Model 4
Commercial†(% selling food)
– – – 3.92e-12***(2.18e-11)
Hospital distance†(minutes on foot)
– – – 0.0130***(0.00668)
Observations 7533 7533 7533 7533
Total Variance 1.170 1.029 1.025 1.010
Level 1 R-squared – 0.08 0.08 0.09
Level 3 R-squared – 0.74 0.76 0.97
Overall R-squared 0.12 0.12 0.14
District ICC 0.049 0.015 0.013 0.001
Household ICC 0.274 0.241 0.239 0.229
Log-Likelihood −11,085.970 −10,705.570 −10,704.630 −10,696.715
AIC 22,179.950 21,479.140 21,481.260 21,469.430
Note: Standard errors presented in parentheses. † indicates variable has been standardized. ODF variable omitted from the WHZ regression**Denotes statistical significance at the 5% confidence level***Denotes statistical significance at the 1% confidence level
Fig. 1 District Intercepts by Sub-region
Smith and Shively BMC Pediatrics (2019) 19:91 Page 10 of 14

The canonical child and household level variables in-cluded in the first level of the HAZ and WHZ modelshave strong and significant coefficients. This finding per-sists throughout the varied district-level specifications.The fit statistics for the random intercept model (Model2) suggest that heterogeneities in levels of these variablesexplains the majority of between-district variance, furtheremphasizing their importance in explaining children’s nu-trition. That these variables are strongly associated withHAZ and WHZ in a multilevel model that controls forplace-based characteristics reinforces their importance,compared to an ordinary least squares regression model.Between-district variance is fairly limited, however.
The ICC of Model 1 shows that only 6% of variancein HAZ occurs between districts. This suggests thebenefits of the multilevel approach, both in terms ofreinforcing the role of first-level variables and interms of modelling district characteristics, is modest.As the alternative second-level specifications in Table4 demonstrate, using PSUs or Wards as the denomin-ation of communities does not increase thesecond-level variance substantially, relative to the pro-portional increase in number of groups, relative to districts.Similarly, including a household-level random interceptshows that a large percentage of variation occurs betweenhouseholds, conditional on individual- and district-level co-variates. Conventional wisdom for Nepal and other coun-tries with geographically isolated populations suggestslocation may be a key determinant of malnutrition, but thisperspective is not wholly supported by these results. How-ever, we do find an altitude effect in child growth, a patternthat future work might seek to corroboration elsewhere. Al-though one might expect to find a strong correlation be-tween wealth and growth outcomes, we find that maternaleducation is relatively more important for HAZ thanhousehold wealth: a one standard deviation change in ma-ternal education has almost twice as strong an effect onHAZ as a one quintile shift in a household’s wealth indexposition. Results for WHZ confirm the short-term import-ance of acute sickness, mother’s BMI and breastfeedingpractices for maintaining weight.The consistency of the first-level coefficients when dis-
trict random slopes are included in the models reinforces
the importance of these factors to our understanding ofchild growth patterns, consistent with the literature wecite above. [14–19, 28–32] In general, the interpretationof higher-level parameters is less straightforward thanthe interpretation of coefficients on first-level variablesbecause the model generates coefficient estimates foreach district-variable combination. This provides vari-ance parameters for each estimated upper-level effect,and for the random intercept values generated for eachgroup unit, e.g. the district, household, or ecologicalzone. We note that adding additional upper-level pa-rameters presents a computational challenge, becausethere are only 75 districts in Nepal. As a result, addingparameters at the district level rapidly reduces the ratioof groups to parameters, which can undermine statis-tical power and cause models to fail to converge. Ourresponse is to run sub-families of models for each ofthe three community-level factors included in the con-ceptual model for which we have good data, namely thefood supply, the health environment, and cultural fac-tors. These models individually underscore the import-ance of these variables. Sufficient collinearity amongdistrict-level variables suggests that there is little to begained by adding additional variables to the model. Un-doubtedly, these variables play similar roles and mayserve equally well as proxies for basic determinants inmodels of HAZ and WHZ.Several individual- and household-level variables known
to affect long-term growth through children’s health arenot included, due to data limitations. Birth order has beenidentified as an important determinant of growth out-comes, due to its influence on intra-household distribu-tion of resources and on parental care [52], but we wereunable to construct a birth order variable for the 2006DHS sample. A more detailed approach to measuringbreastfeeding practices could also improve this analysis,particularly if such an approach were to include a carefulmeasure of the exclusivity of breastfeeding. In Nepal,where breastfeeding is widespread [15], exposure toproper breastfeeding practices may be more importantthan simple exposure to breastfeeding [53], which is all weare able to measure and analyze.Our results confirm positive associations between
child growth and maternal education found elsewhere,and replicate findings for wealth, measured with thesame index we use here [8, 54, 55]. While the coefficienton the wealth index is consistent across models, it issmall. This is largely because many of the other house-hold variables, including maternal education, are likelyrelated to wealth, and in some cases – such as our sani-tation variables – may be channels through whichwealth is related to HAZ. In an unreported bivariate re-gression of HAZ on the wealth index, the coefficient isapproximately 0.24, and significant at the 1% confidence
Table 4 Intraclass correlation coefficients for alternative modelspecifications
Upper-Level Unit Null Model With Child Predictors
Household 24.4% 30.0%
PSU 10.9% 8.4%
Ward 9.8% 4.5%
District 6.1% 3.0%
Sub-region 3.1% 1.2%
Ecological Zone 1.3% 0.0%
Smith and Shively BMC Pediatrics (2019) 19:91 Page 11 of 14

level, but as we add maternal education, maternal BMI,handwashing access, and water purification to the modelconditional on the other variables, its value drops to thelevel we see in Table 2, with the largest decrease comingfrom adding maternal education. Previous work forNepal found no significant association between lineargrowth and an improved water supply, although a posi-tive association between HAZ and access to a flush toiletwas found [54, 56]. In our models, the water variable issignificant in only a few regressions, and even then, onlymarginally so (at the 90% confidence level). Rather thansuggesting that sanitation is unimportant to child growth,however, this result more likely indicates that our proxyfor sanitation is poorly measured or less relevant for along-term indicator such as HAZ. It would be inappropri-ate to interpret our finding as cause for dismissing im-proved sanitation as a potential pathway to improvednutrition more generally. For example, work based on2006 and 2011 data from Nepal shows that the share of adistrict that is declared “Open Defecation Free” is associ-ated with a small, but significant improvement in WHZfor children under five [57].One caveat remains. Although these results are broadly
consistent with recent work from Nepal and elsewhere, onemust exercise caution when generalizing these findingsbeyond Nepal, given the specific geographical, economic,political and social conditions there. Furthermore, directcomparisons between our study and other research, evenfor Nepal, may be hindered by the fact that some researchfocuses on binary indicators of stunting and wasting(i.e. HAZ < − 2.0 and WHZ < − 2.0) as outcome vari-ables, whereas we focus on the continuous z-scores.
ConclusionsWe set out in this paper to test two general hypotheses.In the first case, we find confirmatory evidence that thecommunity-level factors we considered (food shortages,gender equity, proportion of population belonging tomarginalized groups, commercialization of agriculture,distance to hospital and sanitation) are statistically rele-vant to explaining observed variance in height-for-ageand weight-for-height, even when controlling for child-and household-level characteristics. Differences amongdistricts are not as important as one might expect. How-ever, that roughly one-fifth of explained variance occursbetween districts for HAZ and more than one-third oc-curs between districts for WHZ provides evidence-basedsupport for the idea that broad-based interventions tar-geting community-level factors could prove effective inpromoting child growth in Nepal. No doubt, some ofthese factors reflect general improvements in local eco-nomic development, which over time contribute to theanthropometric patterns observed here. Furthermore, re-sults from the three-level (child-household-district)
model suggests that a nontrivial proportion of overallvariance occurs between households, and would be mis-attributed to children in a child-district model. This sug-gests that some between-child variance in HAZ andWHZ occurs at a level that could be addressed by tar-geting households, and some occurs at a level that couldbe addressed by targeting communities. As a result, a50-25-25 “rule of thumb” might be appropriate for pol-icymakers in Nepal: when developing policies aimed atimproving child growth outcomes, a starting point mightbe to focus 50% of efforts and attention directly on chil-dren, 25% on households, and 25% on communities,keeping in mind that the benefits of invested resourcesand the costs of those resources must be weighed, andmight differ markedly across potential interventions.Our second hypothesis was that omitting higher-level
characteristics from models of height-for-age andweight-for-height would overestimate the importance ofindividual- and household-level factors (such as acutesickness, breastfeeding practices, mother’s education andhealth, and wealth) in explaining observed variance ingrowth metrics. We do not find strong statistical supportfor this view. Including community-level variables asdistrict-level random slopes does not change lower-levelparameter estimates very much, and interpretations re-main remarkably stable. The results largely reinforce andunderscore the importance of many traditional lower-levelcorrelates with child growth. The main value of includingthese supra-household components is to account for a lar-ger proportion of variance in outcomes that is unex-plained in more parsimonious models.This study raises several questions for further research,
due largely to the ways in which multilevel models partitionvariance. Adding district-level covariates does not fully ex-plain between-household variation, as the variance share atthe household level remains fairly stable between specifica-tions, representing approximately 20 to 30% of unexplainedvariation across all models. This suggests that includinghousehold-specific data on long-term food security andother omitted characteristics, which is not possible usingDHS data alone, might improve the explanatory value ofchild growth models. Finally, this study cannot fully explainthe statistically significant improvements in HAZ andWHZ observed in Nepal between 2006 and 2011. Under-standing the source of these improvements probably re-quires more comprehensive longitudinal data than arecurrently available, although results from our multilevelframework reinforce existing understanding of the factorscorrelated with child growth. The flexibility of the multi-level approach appears to offer a wide array of benefits thatmake it a worthwhile tool for nutrition research based onobservational data, especially in settings where the combin-ation of child, household, and community features are ofpolicy interest and concern.
Smith and Shively BMC Pediatrics (2019) 19:91 Page 12 of 14

Additional file
Additional file 1: Table S1. Regression results for three-level (child-household-district) models of HAZ including birth year fixed effectsTable S2. Regression results for three-level (child-household-district)models of WHZ including birth year fixed effects Table S3. OLSregression results for models of HAZ including birth year fixed effectsTable S4. OLS regression results for models of WHZ including birthyear fixed effects Table S5. Variance components for all variables,between districts and households. (DOCX 40 kb)
AcknowledgementsFor suggestions, assistance and advice, the authors thank Michael Delgado,Raymond Florax, Pamela Jagger, Celeste Sununtnasuk, Ganesh Thapa andPatrick Webb.
FundingBoth authors received support from the Feed the Future Nutrition Innovation Lab,which is funded by the United States Agency for International Development. GSalso received support from the Purdue Policy Research Institute. The opinionsexpressed herein are those of the authors and do not necessarily reflect the viewsof the sponsors.
Availability of data and materialsThe NDHS and NLSS datasets are publicly provided. The exact data andcomputer code necessary for replication of the results presented here areavailable upon request.
Authors’ contributionsTS and GS conceived and designed this study. TS carried out the analysisand TS and GS interpreted the results, and wrote and edited the manuscript.Both authors read and approved the final manuscript.
Ethics approval and consent to participateProcedures and questionnaires for the NDHS were approved by the NepalHealth Research Council, Nepal and by the ICF International InstitutionalReview Board (IRB) in Maryland, USA. The ICF International IRB ensured thatthe survey complied with the U.S. Department of Health and HumanServices regulations for the protection of human subjects (45 CFR 46). Thehost country IRB ensured that the survey complied with laws and norms ofNepal. The NDHS obtained informed consent from the respondents, whowere voluntary participants. Mothers provided consent of their children toprovide the information.
Consent for publicationGS received permission from Measure DHS online to use, analyse, andpublish results from the dataset.
Competing interestsThe authors declare that they have no competing interests.
Publisher’s NoteSpringer Nature remains neutral with regard to jurisdictional claims inpublished maps and institutional affiliations.
Received: 26 May 2018 Accepted: 24 March 2019
References1. Mankiw NG, Romer D, Weil DN. A contribution to the empirics of economic
growth. Q J Econ. 1992;107:407–37.2. Black RE, Victora CG, Walker SP, Bhutta ZA, Christian P, de Onis M, Ezzati M,
Grantham-McGregor S, Katz J, Matorell R, Uauy R, maternal and childnutrition study group. Maternal and child undernutrition and overweight inlow-income and middle-income countries. Series on maternal and childundernutrition. Lancet. 2013;382:427–51.
3. Harper C, Marcus R. Enduring poverty and the conditions of childhood:Lifecourse and intergenerational poverty transmissions. World Dev.2003;31:535–54.
4. Pelletier DL, Frongillo EA Jr, Schroeder DG, Habicht JP. The effects ofmalnutrition on child mortality in developing countries. Bull World HealthOrgan. 1995;73:443–8.
5. Ministry of Health and Population (Nepal), New ERA and ICF InternationalInc. Nepal Demographic and Health Survey, 2011. Kathmandu: Ministry ofHealth and population, new ERA, and ICF international, Calverton, MD. 2012.
6. Ministry of Health and Population (Nepal), New ERA and ICF InternationalInc. Nepal Demographic and Health Survey 2016: Key Indicators. KKathmandu: Ministry of Health and Population, New ERA, and ICFInternational, Calverton, MD. 2017.
7. Horton S, Alderman H, Rivera JA. The Challenge of Hunger and Malnutrition.Chapter 6 (pp. 305–333) in Lomborg B (ed.) Global Crises, Global Solutions,Second Edition. Cambridge: Cambridge University Press, 710pp. 2009.
8. Headey DD, Hoddinott J. Understanding the Rapid Reduction ofUndernutrition in Nepal, 2001–2011. PLOS One. 2015. https://doi.org/10.1371/journal/pone.0145738.
9. Perumal N, Bassani DG, Roth DE. Use and misuse of stunting as a measureof child health. J Nutr. 2018;148(3):311–5.
10. Rose G, Day S. The population mean predicts the number of deviantindividuals. Br Med J. 1990;301:1031–4.
11. Mulmi P, Block S, Shively G, Masters W. Climatic conditions and child height:sex-specific vulnerability and the protective effects of sanitation and foodmarkets in Nepal. Econ Hum Biol. 2016;23:63–75.
12. Shively, GE. Infrastructure mitigates the sensitivity of child growth to localagriculture and rainfall in Nepal and Uganda Proceedings of the NationalAcademy of Sciences of the United States 2017; doi: https://doi.org/10.1073/pnas.1524482114.
13. UNICEF. (United Nations Children’s fund). Strategy for improved nutrition ofchildren and women in development countries. New York: UNICEF; 1990.
14. Smith L, Haddad L. Explaining child malnutrition in developing counties: a cross-country analysis. Research report 111. Washington, DC: International Food PolicyResearch Institute, Food Consumption and Nutrition Division; 2000.
15. Shrestha S. Essays on childhood nutritional deprivation in Nepal and off-farm employment in the United States: multi-level and spatial econometricmodeling approach. PhD Dissertation: Pennsylvania State University; 2007.
16. Griffiths P, Madise N, Whitworth A, Matthews Z. A tale of two continents: amultilevel comparison of the determinants of child nutritional status fromselected African and Indian regions. Health Place. 2004;10:183–99.
17. Saha K, Frongillo E, Alama D, Arifeen S, Persson L, Ramussen K. Appropriateinfant feeding practices result in better growth of infants and youngchildren in rural Bangladesh. Am J Clin Nutr. 2008;87:1852–9.
18. Harrtgen K, Misselhorn M. A multilevel approach to explain child mortalityand undernutrition in South Asia and Sub-Saharan Africa. Working paper152. Ibero America Institute for Economic Research. 2006.
19. Pongou R, Salomon JA, Ezzati M. Health impacts of macroeconomic crisesand policies: determinants of variation in childhood malnutrition trends inCameroon. Int J Epidemiol. 2006;35:648–56.
20. Madise N, Matthews Z, Margetts B. Heterogeneity of child nutritional statusbetween households: a comparison of six sub-Saharan African countries.Popul Stud. 1999;53:331–43.
21. WHO. WHO child growth standards: length/height-for-age, weight-for-age,weight-for-length, weight-for-height and body mass index-for-age: Methodsand development. Geneva: World Health Organization; 2006.
22. Fotso JC, Kuate-Defo B. Socioeconomic inequalities in early childhoodmalnutrition and morbidity: modification of the household-level effects bythe community SES. Health Place. 2005;11:205–25.
23. Singh A, Singh A, Faujdar R. Household food insecurity and nutritionalstatus of children and women in Nepal. Food Nutr Bull. 2014;35:3–11.
24. de Onis M, Blössner M. WHO global database on child growth andmalnutrition. Geneva: World Health Organization; 1997. https://apps.who.int/iris/bitstream/handle/10665/63750/WHO_NUT_97.4.pdf;jsessionid=FEEA96F18999B6821BD5721953376AE4?sequence=1
25. Yip R, Scanlon K. The relationship between child anthropometry andmortality in developing countries. J Nutr. 1994;124:2043S–6S.
26. de Onis M. Measuring nutritional status in relation to mortality. Bull WorldHealth Organ. 2000;78:1271–80.
27. Pelletier DL, Frongillo EA, Habicht JP. Epidemiologic evidence for apotentiating effect of malnutrition on child mortality. Am J Public Health.1993;83:1130–3.
28. Christiaensen L, Alderman H. Child malnutrition in Ethiopia: can maternalknowledge augment the role of income? Econ Dev Cult Chang. 2004;52:287–312.
Smith and Shively BMC Pediatrics (2019) 19:91 Page 13 of 14

29. Haddad L. Women’s status: levels, determinants, consequences formalnutrition, interventions, and policy. Asian Dev Rev. 1999;17:96–131.
30. Meinzen-Dick R, Behrman J, Menon P, Quisumbing A. Gender: a key dimensionlinking agricultural programs to improved nutrition and health. In: Fan S,Pandya-Lorch R, editors. Reshaping agriculture for nutrition and health.Washington, DC: International Food Policy Research Institute; 2012. p. 135–44.
31. Smith L, Ruel M, Ndiaye A. Why is child malnutrition lower in urban than ruralareas? Evidence from 36 developing countries. World Dev. 2005;33:1285–305.
32. Alderman H, Hoogeveen H, Rossi M. Reducing child malnutrition inTanzania combined effects of income growth and program interventions.Econ Hum Biol. 2006;4:1–23.
33. Filmer D, Prichett L. Estimating wealth effects without expenditure data–ortears: an application to educational enrollments in states of India.Demography. 2001;38:115–32.
34. Currie J, Hyson R. Is the impact of shocks cushioned by socioeconomicstatus? The case of low birth weight. Am Econ Rev. 1999;89:245–50.
35. Currie J, Morreti E. Biology as destiny? Short and long-run determinants ofintergenerational transmission of birth weight. J Labor Econ. 2007;25:231–64.
36. Almond D, Currie J, Duque V. Childhood circumstances and adultoutcomes: act II. J Econ Lit. 2018;56:1360–446.
37. Almond D, Mazumder B. Health capital and the prenatal environment: theeffect of Ramadan observance during pregnancy. Am Econ J Appl Econ.2011;3:56–85.
38. Central Bureau of Statistics (Nepal). Ethnic distribution report 2007.Kathmandu, Nepal: Central Bureau of Statistics; 2007.
39. Haddad L, Alderman A, Appleton S, Song L, Yohannes Y. Reducing childundernutrition: how far does income growth take us? Food consumptionand nutrition division discussion paper no. 137. Washington, DC:International Food Policy Research Institute; 2002.
40. Blanton LV, et al. Gut bacteria that prevent growth impairments transmitted bymicrobiota from malnourished children. Science. 2016;351(6275):aad3311–7.
41. Humphrey JH. Child undernutrition, tropical enteropathy, toilets, andhandwashing. Lancet. 2009;374:1032–5.
42. Fullerton DG, Bruce N, Gordon SB. Indoor air pollution from biomass fuelsmoke is a major health concern in the developing world. Trans R Soc TropMed Hyg. 2008;102:843–51.
43. Gani A. Air quality and under-five mortality rates in the low-incomecountries. J Dev Stud. 2015;51:851–64.
44. Mishra V, Retherford R. Does biofuel smoke contribute to anaemia andstunting in early childhood? Int J Epidemiol. 2007;36:117–29.
45. Kyu HH, Georgiades K, Boyle MH. Maternal smoking, biofuel smokeexposure and child height-for-age in seven developing countries. Int JEpidemiol. 2009;38:1342–50.
46. Wehby GL, Castilla EE, Lopez-Camelo J. The impact of altitude on infanthealth in South America. Econ Hum Biol. 2010;8:197–211.
47. Zahran S, Breunig IM, Link BG, Snodgrass JG, Weiler S. A quasi-experimentalanalysis of maternal altitude exposure and infant birth weight. Am J PublicHealth. 2014;104:S166–74.
48. Shively G, Thapa G. Markets, transportation infrastructure and food prices inNepal. Am J Agric Econ. 2016;99:660–82.
49. Thapa G, Shively G. Child nutrition and local food prices in Nepal. NepaleseJournal of Agricultural Economics. 2017.
50. Thapa G, Shively G. A dose-response model of road development and childnutrition in Nepal. Research in Transportation Economics. 2018. 70: 112–24.doi.org/10.1016/j.retrec.2018.11.002
51. Gelman A, Hill J. Data analysis using regression and multilevel/hierarchicalmodels. 2nd ed. New York: Cambridge University Press; 2009.
52. Horton S. Birth order and child nutritional status: evidence from thePhilippines. Econ Dev Cult Chang. 1988;36:341–54.
53. Kramer MS, Kakuma R. Optimal duration of exclusive breastfeeding.Cochrane Database of Systemic Reviews. 2012;8:1–139.
54. Shively G, Sununtnasuk C. Agricultural diversity and child stunting in Nepal.J Dev Stud. 2015;51:1078–96.
55. Tiwari R, Ausmann L, Agho KE. Determinants of stunting and severestunting among under-fives: evidence from the 2011 Nepal demographicand health survey. BMC Pediatr. 2014;14:1–15.
56. Shively G, Sununtnasuk C, Brown M. Environmental variability and childgrowth in Nepal. Health Place. 2015;35:37–51.
57. Webb P, Shively G, Mulmi P. Sanitation in Nepal: links to nutrition andresearch priorities. Nutrition CRSP research briefing paper no. 8. Boston:Tufts University Friedman School of Nutrition; 2012.
Smith and Shively BMC Pediatrics (2019) 19:91 Page 14 of 14


![Swachh Bharat Mission (Urban) [SBM (U)] - Home | … · 2017-12-11 · construction of individual household toilets is not feasible. Beneficiary household Beneficiary household groups](https://img.pdfslide.net/doc/110x75/5b4e28987f8b9a95198b5129/swachh-bharat-mission-urban-sbm-u-home-2017-12-11-construction.jpg)

![[Definitions] - maff.go.jp · Individual management entities (farm household) or a single-household corporation (a farm household that is incorporated). Organized management entities](https://img.pdfslide.net/doc/110x75/5f11f511dfc1d778be10ea34/definitions-maffgojp-individual-management-entities-farm-household-or-a.jpg)