Embed Size (px)
Citation preview
Draft
Multilevel Performance Management Framework for Small
to Medium Sized Water Utilities in Canada
Journal: Canadian Journal of Civil Engineering
Manuscript ID cjce-2015-0227.R1
Manuscript Type: Article
Date Submitted by the Author: 12-Jul-2015
Complete List of Authors: Haider, Husnain; University of British Columbia (Okanagan), School of Engineering Sadiq, Rehan; University of British Columbia (Okanagan), School of Enigneering Tesfamariam, Solomon; University of British Columbia (Okanagan), School of Enigneering
Keyword: Sustainable Utilities, Small to Medium Sized Water Utilities, Performance Indicators, Performance Benchmarking, Customer Satisfaction
https://mc06.manuscriptcentral.com/cjce-pubs
Canadian Journal of Civil Engineering
Draft
Title Page
Title of the Paper:
“Multilevel Performance Management Framework for Small to Medium Sized Water Utilities in Canada”
Author Names and Affiliations:
Author Name Affiliation Postal Address
Dr. Husnain Haider Postdoctoral Fellow, School of
Engineering, University of British
Columbia, Canada
School of Engineering
University of British Columbia Okanagan
3333 University Way
Kelowna, BC Canada V1V 1V7
Dr. Rehan Sadiq Professor,
School of Engineering,
University of British Columbia
(Okanagan)
Canada
School of Engineering
University of British Columbia Okanagan
3333 University Way
Kelowna, BC Canada V1V 1V7
Dr. Solomon Tesfamariam Associate Professor,
School of Engineering,
University of British Columbia
(Okanagan)
Canada
School of Engineering
University of British Columbia Okanagan
3333 University Way
Kelowna, BC Canada V1V 1V7
CORRESPONDING AUTHOR INFORMATION:
Dr. Husnain Haider
Postdoctoral Fellow
School of Engineering
University of British Columbia Okanagan
3333 University Way
Kelowna, BC Canada V1V 1V7
T: 1-250-801-0949
E: [email protected], [email protected]
WORD COUNT:
- Text only including references 5,250 Words
- Full paper including Figures and Tables 6,700 Words
Page 1 of 30
https://mc06.manuscriptcentral.com/cjce-pubs
Canadian Journal of Civil Engineering
Draft
Abstract 1
2
In Canada, small to medium sized water utilities (SMWU) do not often participate in National Water and 3
Wastewater Benchmarking Initiative due to lesser economies of scale, lack of resources and data 4
limitations. Consequently, such SMWU are managing their functional components (i.e., environmental, 5
personnel, operational, physical assets, customer satisfaction, public health, and financial) without 6
quantitatively assessing and knowing if they are meeting their performance objectives. A multilevel 7
performance management framework, consisting of five modules has been developed and implemented 8
for SMWU in BC, Canada. The framework provides an approach to identify and select the suitable 9
performance indicators for SMWU, and to use them for inter-utility performance benchmarking under 10
limited data. The subsequent modules can be used for detailed performance management at utility, 11
system, and sub-component levels. The utility managers can effectively employ this framework to 12
identify the underperforming functional components and can rationally take corrective actions, and 13
address customer satisfaction with efficient inventory management and data analyses. 14
15
Key Words: Sustainable Utilities; Small to Medium Sized Water Utilities; Performance Indicators; 16
Performance Benchmarking; Performance Management; Customer Satisfaction. 17
18
Page 2 of 30
https://mc06.manuscriptcentral.com/cjce-pubs
Canadian Journal of Civil Engineering
Draft
1. Introduction 19
20
Access to safe drinking water in sufficient quantity at an affordable cost is a basic human right, 21
irrespective of the geographical location and size of their community (WHO 2012). Like all other 22
infrastructure systems, the water supply systems (WSSs) face a number of unique challenges in the 21st 23
century, including rapid population growth, uncertain climate, socio-environmental issues, limited water 24
resources, and ongoing economic crises (Berg and Danilenko 2011). Water utilities are mandated to 25
provide a reliable, responsive, and affordable service to the public (USEPA 2003). The core of a water 26
utility’s business deals with managing physical assets and related services, which can be divided into 27
functional components of water resource management & environmental stewardship, operational 28
practices, personnel productivity, physical infrastructure, customer service, water quality and public 29
health, socio-economic issues, and financial viability. Each one of these components may consist of 30
several sub-components, e.g., personnel productivity may include staff adequacy, productivity ratio, 31
health and safety, as well as working environment. Moreover, a water utility may consist of one or more 32
WSSs. A utility will only attain high sustainability objectives, when all of its WSSs, functional 33
components and sub-components are performing efficiently. 34
35
Alegre and Coelho (2012) defines asset management for urban water utilities as “the set of processes that 36
utilities need to have in place in order to ensure the performance of the asset in line with the service 37
targets over time, that risks are adequately managed, and that the corresponding costs, in a lifetime cost 38
perspective, are as low as possible”. The first step towards effective asset management is assessing the 39
performance of above stated components of a water utility. Subsequently, based on the performance 40
benchmarking results, the utility management can establish desirable level of service with defined 41
acceptable risk, and can develop future financial plans. Even small water utilities can adopt sustainable 42
asset management strategies to enhance their effective service life (Brown 2004). 43
44
The water utilities have been commonly classified as small, medium and large based on the volume of 45
supplied water, number of connections, and population served (Lambert and Taylor 2010, Corton and 46
Berg 2009). In general, the utilities having population greater than 50,000, number of connections greater 47
than 10,000, and demand higher than 50 million gallons per day (MGD) have been considered as the large 48
ones (Haider et al. 2014, USEPA 2005, AWWA 2004). National Water and Wastewater Benchmarking 49
Initiative (NWWBI), Canada was established in 1997. As per the recent public report published in 2013 50
(stated performance of water, wastewater and storm water utilities FY 2011), the wastewater and water 51
utilities have been participating in NWWBI since 2003 and 2005, respectively. However, most of them 52
Page 3 of 30
https://mc06.manuscriptcentral.com/cjce-pubs
Canadian Journal of Civil Engineering
Draft
are large water utilities with population more than 50,000, which covers approximately 50% of the 53
Canadian utilities and more than 60% of the population. So far, the participation of small and medium 54
sized water utilities (SMWU) has been negligible in NWWBI (AECOM 2013). A possible reason seems 55
to be that there is no well-structured performance benchmarking framework available for such utilities 56
which is simple (though comprehensive) that can be implemented under technical and financial resource 57
constraints, and data scarcity. Secondly, due to lesser economies of scale, SMWU might be avoiding to 58
participate with large utilities which may delineate deficiency performance. Consequently, in Canada, 59
SMWU are mainly relying on emergency response in case of structural failures (e.g., water main break, 60
hydrant failure, etc.) or customer complaints (e.g., colored water, bad taste, low pressure, no water, etc.). 61
Moreover, without having a rational benchmarking procedure, such SMWU cannot quantitatively assess 62
whether they are meeting their primary performance objectives or not. 63
64
Generally SMWU are facing several technical, socio-economic, and environmental challenges to meet 65
regulatory guidelines. For example, according to Water Canada (2013), water utilities in British Columbia 66
have gone through highest number of boil water advisories as compared to other provinces, and most of 67
them are SMWU with population less than 50,000. Interior Health Canada (2013) has reported various 68
reasons for these advisories, such as source water contamination, improper flushing of hydrants, 69
construction, repair and maintenance works, equipment failure, and inadequate treatment, etc. 70
71
Around the world, various agencies have developed systems for inter-utility performance benchmarking 72
based on the performance indicators (PIs) (Coelho 1997; Alegre et al. 2006; Berg and Danilenko 2011; 73
National Water Commission (NWC) 2012; American Water Works Association (AWWA) 2004; Office 74
of Water Services (OFWAT) 2012; National Research Council (NRC) 2010; Canadian Standards 75
Association (CSA) 2010; Asian Development Bank (ADB) 2012). Haider et al. (2014) carried out a state-76
of-the-art review of these systems of PIs. CSA (2010) Technical Committee reviewed and recommended 77
the International Organization for Standardization (ISO) Standards guidelines (CAN/CSA-Z24510) for 78
improvement of service to users for Canadian water utilities in 2007; however, its application has not 79
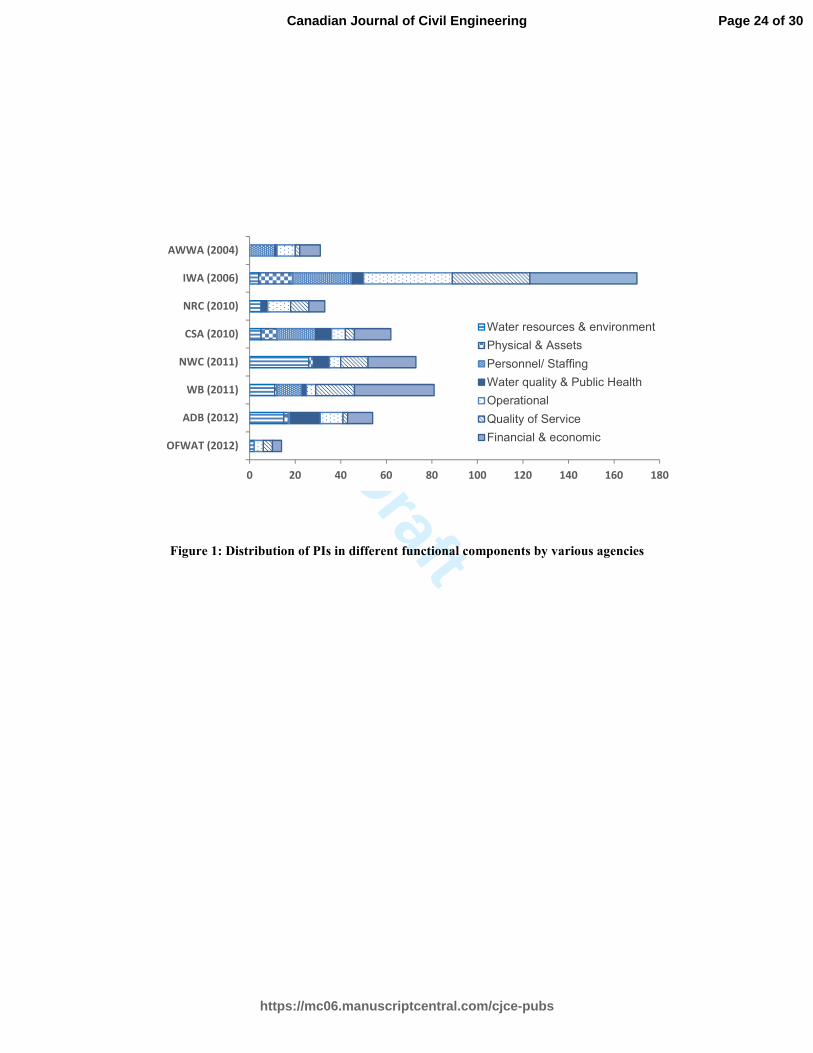
been reported for SMWU, so far. A summary of distribution of PIs for all functional components of a 80
water utility is shown in Figure 1. Literature review revealed that most of the systems developed by 81
various organizations encompassed the PIs for the specific requirements of the region under study (e.g., 82
NWC included over exhaustive list of water resources PIs due to the current water crises in Australia), or 83
the organization itself (e.g., funding agencies like ADB and World Bank focus on financial indicators). 84
Figure 1 shows that the PI system developed by International Water Association seems to be more 85
balanced with a maximum number (170) of total PIs (Alegre et al. 2006); however, such large number of 86
Page 4 of 30
https://mc06.manuscriptcentral.com/cjce-pubs
Canadian Journal of Civil Engineering
Draft
PIs need extensive data which is certainly not available with SMWU, particularly to initiate the 87
performance management process. 88
89
Large water utilities are fundamentally different than SMWU as these utilities are well-established in 90
terms of procedures and processes, contain much larger and expansive physical infrastructure, and such 91
utilities have to satisfy a large number of concerned and responsive customers. Also, the performance 92
related issues (e.g., extensive energy requirements, widespread environmental impacts, large pipe bursts, 93
and loss of amenities during vandalism) in larger utilities were recognized decades ago (Stone et al. 94
2002). In result, most of the existing performance benchmarking systems have primarily been developed, 95
i) for large water utilities, ii) to address specific issues associated with geographical characteristics, or iii) 96
global objectives of the agency developed the system. SMWU, however, have some advantages over 97
large water utilities; for example, they have: i) relatively less complex and newer physical infrastructures, 98
ii) simple organizational structures which provide more opportunity for change management, and iii) less 99
impacts on natural systems due to less withdrawals, and have less ecological footprint. Hence, SMWU 100
cannot adopt the existing systems of PIs as such with limited data. According to European Project (COST 101
Action C18: Performance assessment of urban infrastructure services), there is an urgent need for 102
comprehensive research to improve performance management in SMWU (Alegre 2010). 103
104
In NWWBI (2013) public report, the calculated values of different PIs are just compared with minimum, 105
average, and maximum values of the participating utilities (i.e., essentially larger ones). Such simple 106
comparison of individual PIs does not provide information about the overall performance of a water 107
utility. Secondly, all these benchmarks are available for larger utilities, due to inherent less economies of 108
scale in SMWU, the application of these benchmarks for inter-utility benchmarking of SMWU needs 109
extensive efforts. The benchmarking process needs to be practical using relevant and measurable PIs, 110
besides being comprehensive enough to cover all the functional components. When one or more 111
functional components are underperforming, the decision making can be improved by honing in the sub-112
components and processes. Such analysis need to be performed at intra-utility to evaluate the performance 113
of different WSSs operating within a utility. Presently, there are no frameworks available for both the 114
inter-utility benchmarking and intra-utility performance management; also, the research gap exist in terms 115
of addressing specific performance related issues (at component level) in SMWU. For example, in 116
SMWU, customer satisfaction is a primary objective of a water utility to provide reliable services. 117
Existing methods based on customer interviews might not be practically possible for smaller utilities; 118
therefore the operational personnel strive hard to respond to the complaints without any management 119
Page 5 of 30
https://mc06.manuscriptcentral.com/cjce-pubs
Canadian Journal of Civil Engineering
Draft
strategy. As a result, there is no structured mechanism available to evaluate the risk of customer 120
dissatisfaction. 121
122
A comprehensive assessment of the SMWU over their entire lifecycles (i.e., continuous benchmarking), 123
responding to the research gaps followed by effective asset management plans, can help the utilities for 124
attaining sustainability. There are several models, guidelines and decision support tools proposed and 125
developed by various agencies and organizations around the world to serve this purpose. Most of these 126
tools are based on extensive, long-term, and expansive (requiring large human and financial resources) 127
database, which is presently not available for SMWU in Canada. A comprehensive performance 128
management can help the utility to achieve its overall sustainability objectives, such as: i) optimization of 129
human and financial resources, ii) conservation of water resources, iii) protection of environment, iv) 130
provision of safe and productive working environment for personnel, v) protection of public health, vi) 131
provision of safe drinking water for the community, and vii) achieving customers’ reliability through 132
efficient operations and response to their complaints. 133
134
The overall goal of this research is to develop a comprehensive performance management framework for 135
SMWU. The specific objectives of this research are to develop modules for: i) identifying the 136
comprehensive potential PIs, ii) selecting the most suitable PIs for SMWU based on their, applicability, 137
measurability, understandability, and comparability, iii) establishing inter-utility performance 138
benchmarking, iv) conducting intra-utility performance management, v) developing a system for 139
customer satisfaction management, and vi) providing a proof-of-concept, by implementing these modules 140
for a case study of Okanagan Basin, BC, Canada. 141
142
2. Performance Management Framework for SMWU 143
144
A multilevel framework is developed for performance management of SMWU consisting for five stand-145
alone modules. The first two modules identify and select the PIs for SMWU. The third module 146
benchmarks the cross-utility performance based on the estimated value of the selected PIs. The PIs in this 147
module are calculated using data variables which are essentially the numerators and denominators in the 148
PIs’ formulae, e.g., the PI of ‘pressure complaints’ has been calculated in terms of “[(number of pressure 149
complaints)/(total population served)]”. In fourth module the utility managers can manage the 150
performance of different sub-components within a functional component in terms of performance 151
measures which are estimated by aggregating the relevant PIs for each performance measure. In last 152
module customer satisfaction is evaluated through a detailed analysis of the record of customer 153
Page 6 of 30
https://mc06.manuscriptcentral.com/cjce-pubs
Canadian Journal of Civil Engineering
Draft
complaints which have already been obtained as data variables for cross-utility benchmarking in the third 154
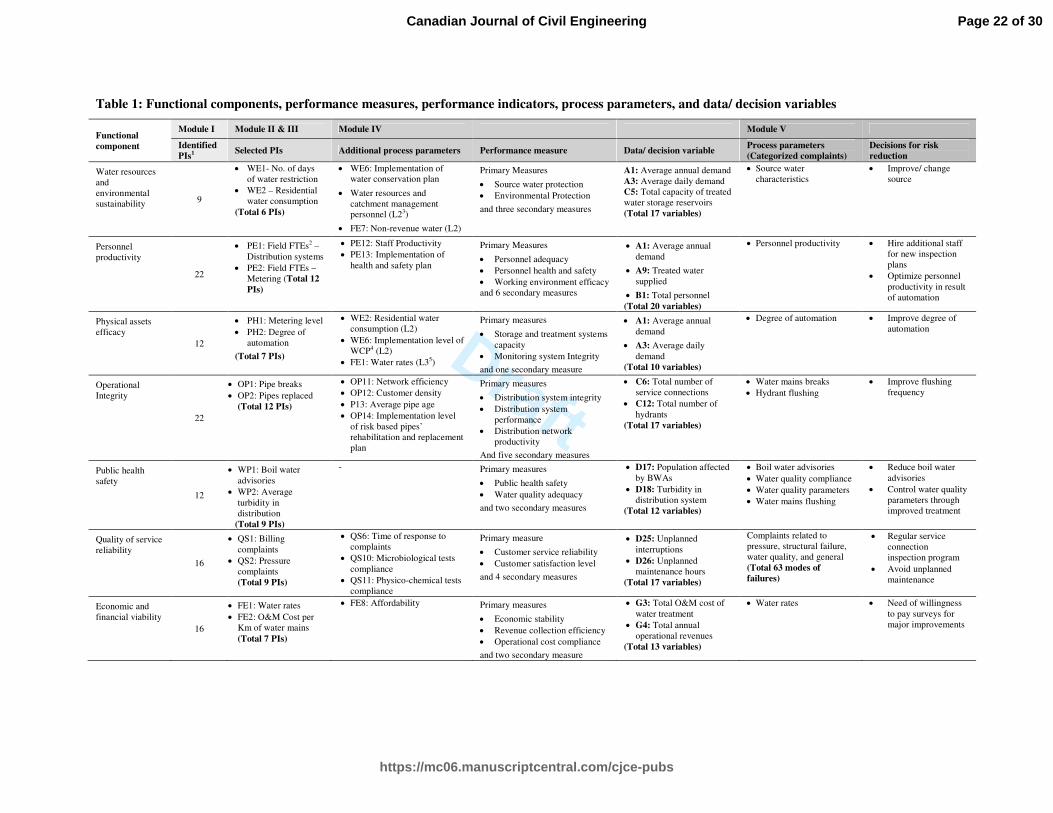
module. A comprehensive list of data variables, performance indicators, performance measures, process 155
parameters, and decision variables is presented in Table 1. 156
157
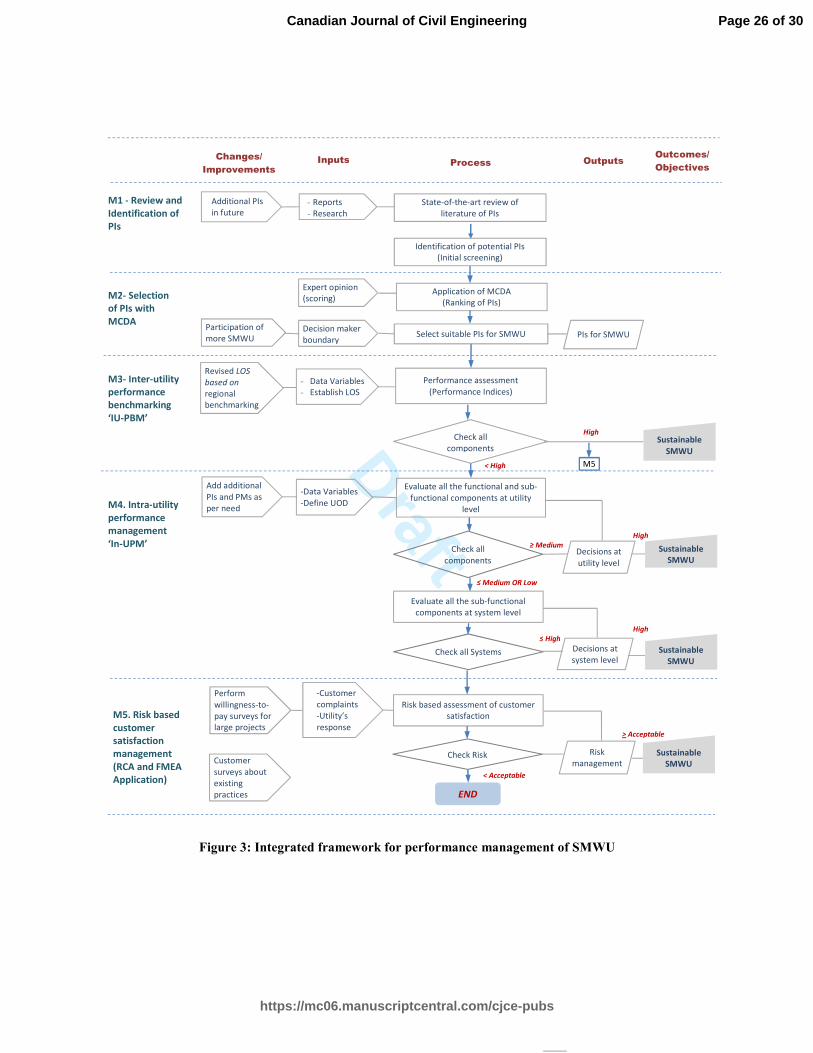
The framework showing interaction between all the five modules is presented in Figure 3. Figure shows 158
the integrated framework that processes the information at different levels and can estimate the 159
performance; it also shows the interaction among different modules, and describes the possible changes/ 160
improvements, inputs, process, outputs, and outcomes of each module systematically. A brief description 161
of the modules is given below. Details of the modeling results and application of individual modules can 162
be seen in Haider (2015) and Haider et al. (2014, 2015a, 2015b). 163
164
2.1 Module I: Identification of PIs 165
166
As described earlier that the existing systems of PIs are either too exhaustive or sometimes focused on a 167
specific component due to geographical limitations (refer to Figure 1). For instance, International Water 168
Association suggested more than 45 PIs to evaluate the financial viability of a water utility, such large 169
number of PIs require extensive data which is certainly not the case of SMWU. Also, due to overall less 170
operating costs and number of customers, SMWU can be evaluated with fewer PIs, particularly to initiate 171
the performance management process. Therefore, in this module, a comprehensive review of the literature 172
has been carried out to rationally assess the suitability of reported PIs systems for SMWU in terms of 173
their simplicity (easy and simple data requirements) and comprehensiveness (i.e., covering all the 174
components) (Figure 4) (Haider et al. 2014). On the basis of this detailed review, suitable PIs have been 175
identified and grouped as start-up-additional and advanced (depending on their relative importance) for 176
all the functional components for SMWU. Keeping in view the technical constraints (i.e., less trained, 177
motivated and aware personnel for planned performance management process), the first level consists of 178
the most significant and easy to measure PIs, and moving to a relatively complex set of PIs depending on 179
the availability of resources and specific operating conditions. Additional PIs can be included through 180
continuing literature review in this list to meet future needs for SMWU, e.g., technological advances, 181
improved data management systems, implementation of more stringent water conservation and 182
environmental protection regulations, etc. 183
184
185
Page 7 of 30
https://mc06.manuscriptcentral.com/cjce-pubs
Canadian Journal of Civil Engineering
Draft
2.2 Module II: Selection of Key Performance Indicators 186
187
The potential PIs identified in Module I are evaluated against applicability, understandability, 188
measurability and comparability criteria using the multicriteria decision analysis (MCDA) which have 189
been defined as: 190
Applicability: how much an indicator is applicable and relevant for the performance benchmarking of 191
SMWU? It is related to the overall technical, environmental, and socio-economic relevance of the 192
indicator. 193
Understandability: how much an indicator is understandable to both the public and the utility personnel? 194
It is related to the type of data the PI involves and interpretability of the indicator. 195
Measurability: how much the indicator is measurable? It is related to the availability, accuracy, and 196
frequency of monitoring data required for the calculation of the indicator. 197
Comparability: how much the calculated value of indicator is comparable with the other similar utilities 198
in the region and/ or national or international level? 199
200
It is important to select an appropriate method of MCDM for ranking and selection of PIs which should, i) 201
provide an opportunity to the utility managers to encompass the ranked PIs based on the data available 202
and the existing needs of their utility, and ii) not completely discard the remaining PIs initially identified 203
in Module I, as they might be useful in future with the improvement in benchmarking process and data 204
availability. The criteria weights and scoring of key PIs have been carried out through group decision 205
making by involving utility managers, technical field staff, and researchers from academia. The ranking 206
system was defined on ordinal scales to rank on a 5-point translated as 1 as ‘Very Low’; 2 as ‘Low’; 3 as 207
‘Average’; 4 as ‘High’; and 5 as ‘Very High’; and the weights were determined using Analytical 208
Hierarchical Process based on pair-wise comparison. The details of this module can be seen in Haider et 209
al. 2015a. 210
211
2.3 Module III: Inter-utility Performance Benchmarking (IU-PBM) 212
213
The performance improvement process in any water utility initiates with an effective performance 214
benchmarking, i.e., comparing the utility performance with other similar utilities (in size and geographical 215
location) and with the standards established by various regulatory agencies (Marques and Witte 2010; 216
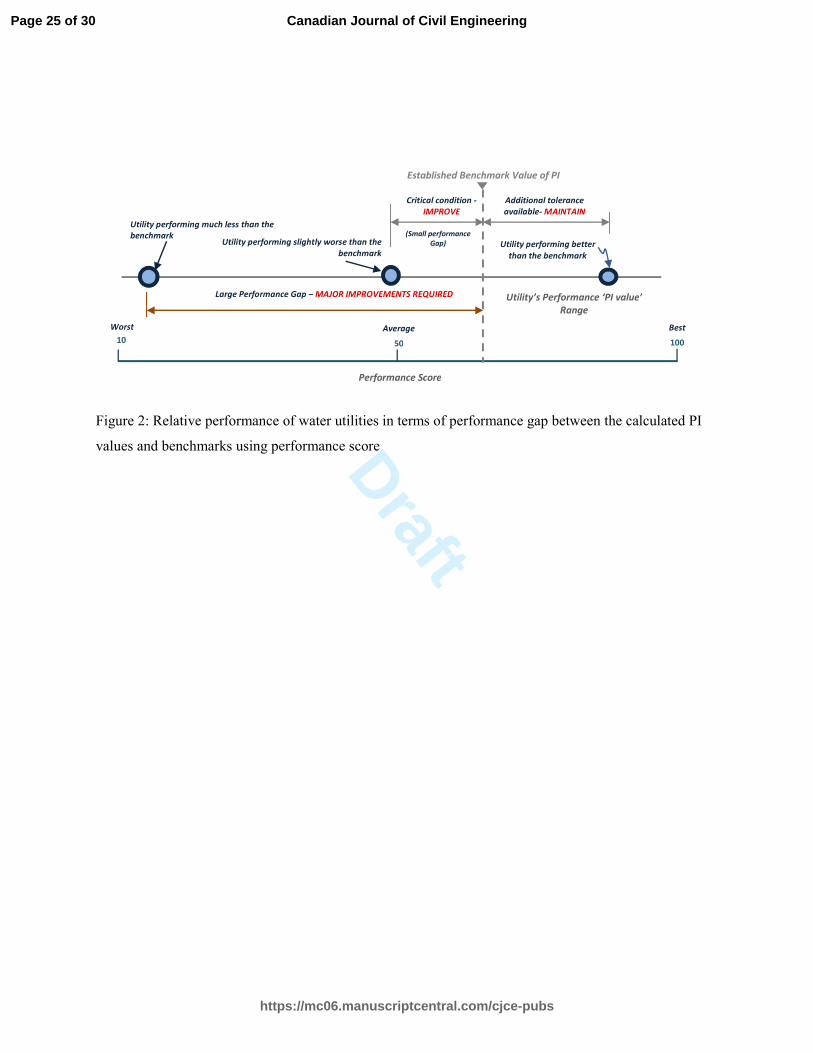
Alegre et al. 2006). It is essential to consider the relative performance of SMWU by calculating the 217
performance gap from the benchmark; this concept is explained in Figure 2. Any participating utility 218
performing better than the other one but performing slightly less than the benchmark could be motivated 219
Page 8 of 30
https://mc06.manuscriptcentral.com/cjce-pubs
Canadian Journal of Civil Engineering
Draft
to further improve its performance for the coming years. Likewise, the best performing participating 220
utility should also be rationally compared with the benchmark, i.e., it is possible that the best one itself is 221
just approaching the benchmark. Also, the best utility will need to maintain its performance with an even 222
higher value than the benchmark. Such comparison can be made with the help of a benchmarking 223
approach (with limited data) which can cover the entire variation of performance shown in Figure 2. 224
225
In Module III, the selected PIs in Module II are used to develop an inter-utility performance 226
benchmarking model (IU-PBM) for SMWU. IU-PBM accommodates all the possibilities for utilities; i) 227
performing much worse than the established benchmarks; ii) performing close (e.g., slightly higher or 228
lower) to the benchmark, and iii) which have been performing equal or better than the benchmarks. 229
Calculating performance levels by simply comparing the calculate value of PI from the best and worst 230
performing utilities in benchmarking might be misleading because, this approach does not consider the 231
average performing utilities in the evaluation process. The non-linear approach used in IU-PBM 232
sufficiently addresses this issue. Subsequently, linear, exponential, logarithmic and polynomial 233
benchmarking transformation functions (BTFs) have been established to translate the calculated PIs into 234
performance levels between 10 and 100, which is based on literature, NWWBI reports (i.e., 235
benchmarking data for large utilities) and expert judgment. The adjustment of reported values in NWWBI 236
reports and literature can be explained with an example of the ‘per capita water consumption’ (a water 237
resources indicator). As per NWWBI public report, the median value of this PI is just over 200 with a 238
maximum value of 593 lit/capita/day for large water utilities. While, this could be an average value in 239
SMWU; the value of this PI can go up to 900lit/capita/day (AECOM 2014). Therefore, the values have 240
been tweaked, keeping in view relatively higher residential water usage practices (due to lower treatment 241
levels, less population, less awareness about water conservation, etc.) in SMWU. Similarly, for other PIs 242
the NWWBI values have been rationally adjusted to develop BTFs for SMWU. 243
244
The performance levels of individual PIs obtained from BTFs might not be desirable by the senior 245
managers and decision makers. In general, utility managers are more interested in developing composite 246
indices to save their time and efforts which are required to evaluate the individual PI (Galar et al. 2014). 247
A performance index combines information obtained by calculating several PIs into one final 248
performance score; it consists of a weighting process and an aggregation process. The weighting process 249
is required to determine the importance weights of all the PIs under each component; and the aggregation 250
process is finally applied to combine the performance level with their respective weights. The weights are 251
estimated using Simos’ method from the ranking of the selected PIs by different smaller water utilities in 252
the Okanagan basin, British Columbia, Canada, and the opinion of experts working in water infrastructure 253
management. Finally, the performance indices have been established by aggregating the transformed 254
Page 9 of 30
https://mc06.manuscriptcentral.com/cjce-pubs
Canadian Journal of Civil Engineering
Draft
performance levels to appreciate the concept shown in Figure 2. The IU-PBM results presented in the 255
form of a web diagram demonstrate the utility’s performance to the top level management for pragmatic 256
decision making. IU-PBM accommodates wide variations in the calculated values of PIs, being mindful 257
of the smaller economies of scale in SMWU as compared to larger water utilities. Details of the 258
transformation functions and the model development can be seen in Haider et al. (2015b) 259
260
2.4 Module IV: Intra-utility performance management (In-UPM) 261
262
If the results of IU-PBM (Module III) show that all of the functional components are not performing 263
‘High’; this shows that there is a need for further investigations at utility level. In Module IV, an intra-264
utility performance management model (In-UPM) is developed to hone in the sub-components of each 265
component to evaluate the functional processes in more detail. A top-down hierarchical based approach is 266
used; starting from overall sustainability performance objectives of the functional components at the top, 267
followed by primary and secondary performance measures of the sub-components, and indicators (basic 268
building blocks) receiving inputs from data/ decision variables at the bottom. For example, ‘quality of 269
service reliability’ is one of the sustainability objectives. ‘Customer information level’ and ‘customer 270
satisfaction level’ are the two primary level performance measures under. At subsequent level, ‘customer 271
information level’ and ‘responses to the complaints’ are the secondary level performance measures under 272
the sub-component of ‘customer satisfaction level’ (i.e., a primary level measure). These secondary level 273
performance measures are inferred form the corresponding PIs, e.g., unplanned interruptions, total 274
response to reported complaints, time of response, etc. 275
276
Generally, SMWU lack in data collection and inventory management, and thus the decisions are made in 277
an uncertain environment. The issues related to data scarcity are addressed by utilizing benchmarking 278
data from larger utilities, peer-reviewed literature, and expert elicitation from local municipalities. In-279
UPM is robust enough to deal with temporal and spatial variations, i.e., it can assess the performance of a 280
water utility as a whole and/ or different WSSs operating within a utility for a given assessment period. 281
System level assessment is required when one or more functional components or sub-components are 282
either performing ‘medium’ or ‘low’. A sub-model to perform sensitivity analyses has also been 283
developed to rank the PIs based on their percent contribution to each functional component (Haider 284
2015). 285
286
287
288
Page 10 of 30
https://mc06.manuscriptcentral.com/cjce-pubs
Canadian Journal of Civil Engineering
Draft
2.5 Module V: Customer Satisfaction Management in SMWU 289
290
Unlike other products, customers do not necessarily have the same flexibility in selecting their water 291
supplier (KWR 2008). Due to this constraint, for acceptable quality of service, the utility managers should 292
maintain and operate their infrastructure in order to ensure safe and adequate water supply to the 293
consumers. In addition, the utility should respond efficiently to the complaints, failure to do so may result 294
in dissatisfaction of customers. After evaluating the performance of a utility at system and component 295
level using Module IV, the utility managers also need to assess their customers’ satisfaction before 296
finalizing the major decision actions. In other words, in case of dissatisfaction of their customers, they 297
should rationally optimize their decisions to improve underperforming systems and components in such a 298
way that the ultimate objective (i.e., customer satisfaction) of the utility shall also be achieved. In this 299
regard, a customer satisfaction management framework is developed in Module V. The conventional 300
methods for assessing CS are based on performance benchmarking and customer interviews. Former has 301
already been evaluated in terms of quality of service using Module III & IV; such results only guide about 302
the general performance and cannot be used for detailed evaluation of improvement actions. Latter 303
requires extensive human and financial resources and might not be sustainable for SMWU. 304
305
A risk-based model is developed in Module V primarily based on the evaluation of customer complaints, 306
and experience of the operational staff to support decision making for effective improvement actions. 307
Module V evaluates the customer dissatisfaction in terms of risk of customer satisfaction, which starts 308
when a customer reports a complaint to the utility; however, the complete evaluation process includes the 309
duration between the time of the report and response up to the complete resolution of the complaint. The 310
inherent assumption of the proposed approach is that if a utility receives fewer complaints, it implies that 311
the customers are satisfied with the utility’s performance. This module evaluates the risk under each 312
category of complaints and compares the cumulative risk with the acceptable risk. Keeping in view the 313
limitations of resources, the estimated risks associated with different causes are prioritized for effective 314
decision making. To achieve reliable customer service, the mitigation actions should continue to apply 315
until both the risk from individual failure cause and the cumulative risk approach equal to or less than the 316
acceptable risk. 317
318
319
320
321
Page 11 of 30
https://mc06.manuscriptcentral.com/cjce-pubs
Canadian Journal of Civil Engineering
Draft
3. FRAMEWORK IMPLEMENTATION 322
323
3.1 Study Area 324
325
The Okanagan basin is a 200km long narrow strip spanning over 8,000km2 from Armstrong (BC, Canada) 326
to the United States Border. The basin consists of four cities (i.e., Vernon, Kelowna, Penticton, and 327
Osoyoos) having one or more small to medium water utilities serving population less than 50,000 328
(OBWB 2014). Like most of the SMWU in Canada, these utilities have not been regularly participating in 329
NWWBI so far, and face challenges to meet desired level of service. Furthermore, the basin possesses 330
lowest per person water supply in Canada, on average an individual consumes 675 liters/ day, which is 331
more than double the Canadian average (OBWB 2014). Most of the utilities in Okanagan Basin are facing 332
water quality problems due to inadequate treatment (i.e., primarily disinfection); it is evident from the 333
highest number of boil water advisories in the BC in comparison to other provinces (Interior Health 334
Canada 2013). With these and other performance related issues and having no comprehensive and 335
structured performance management framework, the SMWU in Okanagan Basin are primarily relying on 336
emergency response instead of planned improvement actions. Therefore, the framework presented in 337
Figure 4 has been implemented for a medium sized water utility serving 16,000 residents in Okanagan 338
Basin to evaluate its practicality. 339
340
The land use of the study area (i.e., utility service area) is mixed, including residential, agricultural, 341
commercial, public, and industrial. The height of the service area is about 400m from mean sea level and 342
the terrain is rolling to hilly with medium to steep grades. Three WSSs consisting of 150km of water 343
mains are serving more than 6000 customers. All of the WSSs relying on separate water sources (i.e., 344
creek water, lake, partial groundwater augmentation). For all three systems, the source water is being 345
distributed after disinfection either through UV radiation followed by chlorination or chlorination as the 346
primary treatment, without conventional surface water filtration. The water mains with an average age of 347
less than 25 years vary between 50mm and 900mm diameters. Although, some older pipes up to 80 years 348
of age are still in service; in the past, the utility has not experienced frequent pipe breaks. 349
350
3.2 Results and Discussions 351
352
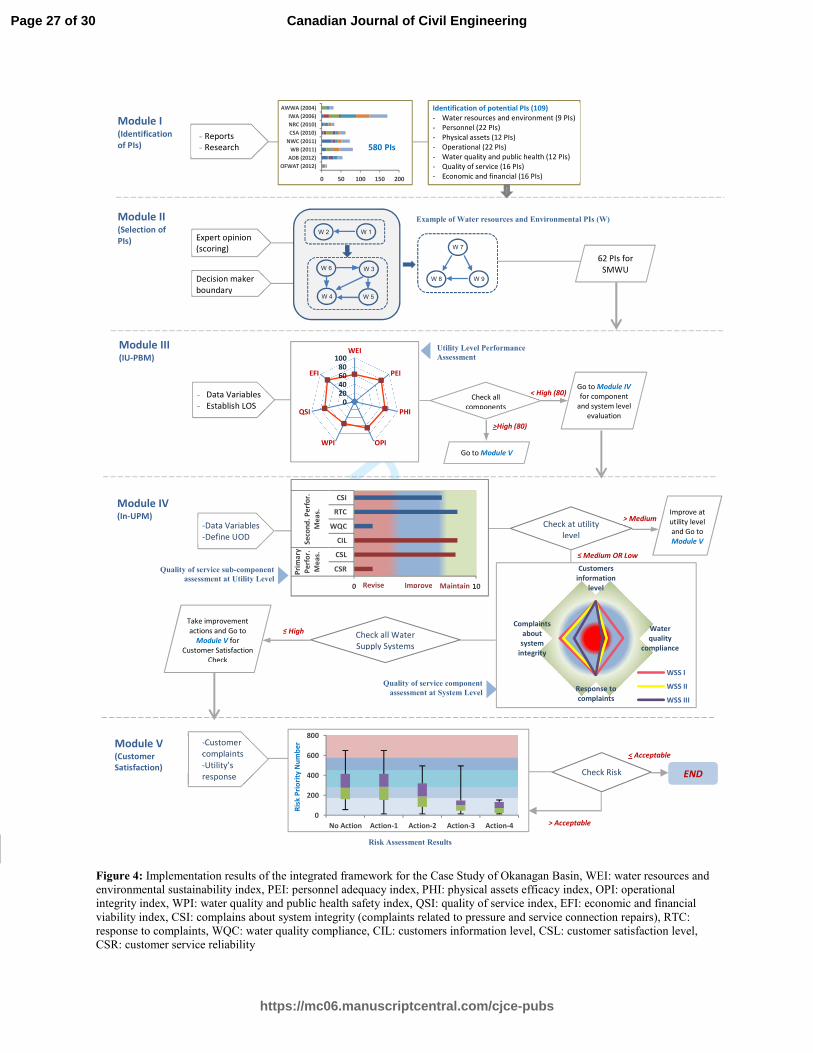
The results after implementing the proposed framework on the study area are shown in Figure 4. The 353
major findings are useful to evaluate the practicality of the framework at utility level management for 354
SMWU utilities. 355
Page 12 of 30
https://mc06.manuscriptcentral.com/cjce-pubs
Canadian Journal of Civil Engineering
Draft
In Module I, a total of 580 PIs covering different functional components of water utilities (Figure 1) were 356
evaluated, out of these, 109 potential PIs for SMWU were identified through a checklist and experts 357
opinion keeping in view the data limitations (Figure 4). It can be observed from Table 1 that relatively 358
more complex functional components such as personnel productivity and operational integrity needs 359
larger number of PIs for evaluation. Therefore, the primary objective of the screening process was to 360
identify the most suitable nevertheless comprehensive list of PIs to evaluate the performance of all the 361
functional components. Due to growing challenges of 21st century (i.e., global climate change, water 362
resources limitations, population growth, etc.) and technological advances, development of new PIs can 363
certainly be expected in future. In this regard, SMWU should continue the review process to include the 364
state-of-the-art PIs, which should be further investigated using the detailed selection method described in 365
Module I. 366
367
In Module II, 109 PIs identified in Module I have been evaluated against the applicability, 368
understandability, measurability and comparability criteria using ELECTRE outranking method. Utility 369
managers, field personnel, and experienced academicians were involved in the group decision making 370
process to obtain the criteria weights and scoring of PIs. This method presents the results in the form of 371
network maps which provide an opportunity to the utility managers to encompass the ranked PIs based on 372
the data available and the existing needs of their utility. ELECTRE method was used, because: i) distinct 373
outranking relations between different PIs can be established, ii) due to small differences of evaluations, 374
establishing preferences between various PIs is not evident, and iii) the PIs which might not be important 375
for a specific utility or in view of decision makes will still be available in the network diagrams. For an 376
instance, the example of water resources and environmental indicators is shown in Figure 4, where the 377
decision makers selected top 6 PIs (WE1 to WE6) to initiate the performance benchmarking process 378
depending on the above mentioned criteria; however, the remaining three previously identified PIs in 379
screening process are still present and can be included later (by revising the decision maker’s boundary) 380
in the benchmarking process. A total of 62 PIs were finally selected; detailed numbers of PIs for each 381
functional group are given in Table 1. 382
383
The selected PIs are then used for the performance benchmarking of SMWU in Module III. A inter-utility 384
performance benchmarking model (IU-PBM) for SMWU has been developed. Conventionally, a linear 385
comparison of a particular utility’s performance has been made with the best and worst performing 386
utilities to calculate a performance score. Such approach can be misleading when the best performing 387
utility either itself is not meeting required level of service or performing exceptionally high in comparison 388
to the average performing utilities in the benchmarking process. Therefore, in the absence of an existing 389
Page 13 of 30
https://mc06.manuscriptcentral.com/cjce-pubs
Canadian Journal of Civil Engineering
Draft
benchmarking data, rational transformation functions (i.e., polynomial, linear, exponential, and 390
logarithmic) have been established to convert the calculated PIs into the performance scores with the help 391
of NWWBI-PR, literature, and expert opinion. These BTFs transform the calculated value of all the 47 392
PIs into performance level between 10 and 100, with 10 being very poor and 100 being very good. 393
394
In order to develop the aggregated performance indices, the PIs are ranked by different utilities’ managers 395
and experts. The weights of the PIs between 0 and 1 were estimated with the help of Simos’ method 396
depending on their relative importance under each functional component. Subsequently, the transformed 397
performance levels were aggregated using the Technique for Order Preference by Similarity to Ideal 398
Solution (TOPSIS) method, which is based on the concept of similarity (i.e., relative closeness) to the 399
positive-ideal solution (PIS) and the remoteness from the negative-ideal solution (NIS) (Yoon and Hwang 400
1995). The benchmarking concept presented in Figure 2 has been well addressed with TOPSIS application 401
as it considers that how much the performance level of a PI is close to or away from the established level 402
of service (i.e., benchmarks or standards). 403
404
The results are shown in Figure 4 in the form of a web diagram. It is expected that with the participation 405
of SMWU in the benchmarking process, the level of service will be improved (Figure 4). This 406
improvement should be appreciated by recalibrating the transformation functions established in this 407
research. If all the functional components are performing ‘High’, it can be assumed that the utility will 408
obtain the ‘High’ performance form In-UPM simulations as well. In this situation, utility manager need to 409
directly move to Module V to check the risk of customer satisfaction. If one or more functional 410
components of the utility are not performing ‘High’, the managers need to evaluate the performance of 411
the underperforming functional components and sub-components at utility level using In-UPM developed 412
in Module IV (see performance measures column in Table 1 for sub-components). 413
414
Due to the limited performance benchmarking data, the evaluation criteria have been established using 415
data of NWWBI public reports, published literature, and expert knowledge. To deal with the inherent 416
uncertainties, fuzzy set theory has been used for performance inferencing. The fuzzy set theory was first 417
developed by Zadeh (1978) to methodically incorporate human reasoning in decision making. The 418
linguistically defined performance criteria (Low, Medium, High) and the corresponding suggestions 419
(Revise, Improve, Maintain) have been analysed and inferred with the qualitative and imprecise/uncertain 420
knowledge in the form of if-then rules (Mamdani 1977). 421
422
Page 14 of 30
https://mc06.manuscriptcentral.com/cjce-pubs
Canadian Journal of Civil Engineering
Draft
As an example, the results of In-UPM simulations for sub-components under the functional component of 423
quality of service reveals that water quality compliance (WQC) is low and needs to be revised through 424
detailed investigations at system level. Subsequently, three WSSs operating within the utility are 425
evaluated to identify the undeforming system for effective decision making. In Figure 4, In-UPM results 426
at system level show that the WQC in WSS I&III is low. The utility managers can take rational decisions 427
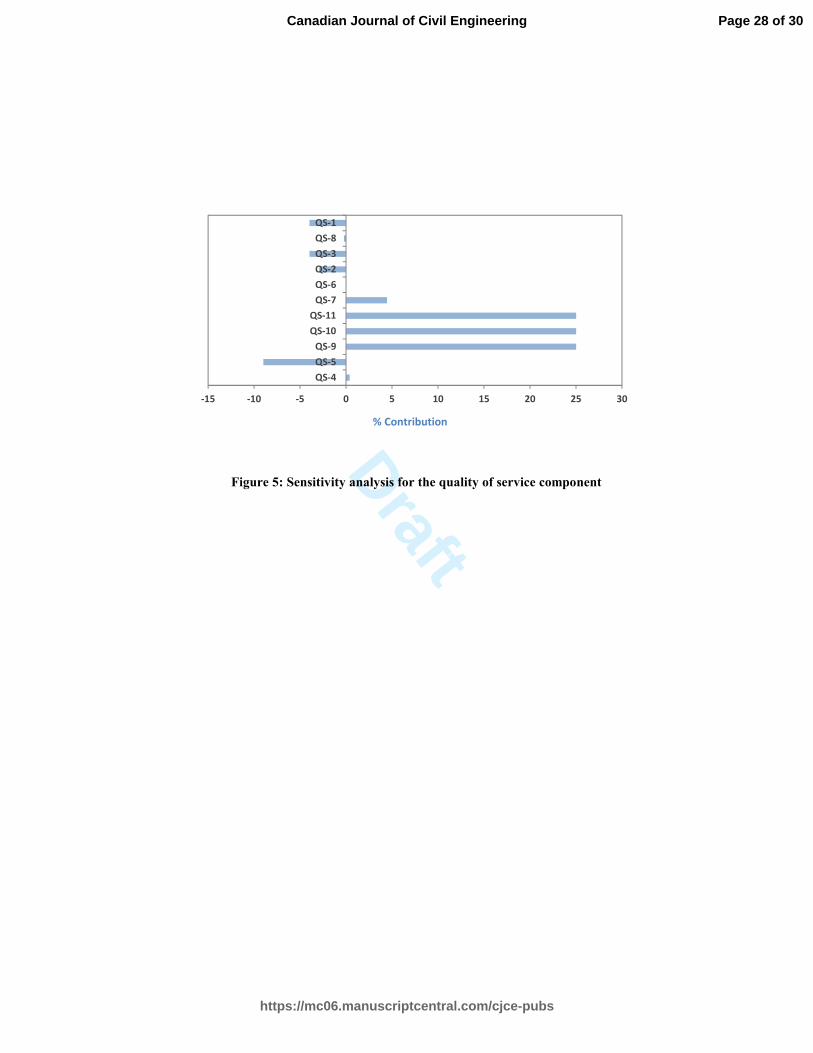
accordingly, e.g., change source, improve treatment level, mains flushing etc. Sensitivity analyses results 428
presented in Figure 5 reveals that PIs for WQC have significant contribution to quality of service 429
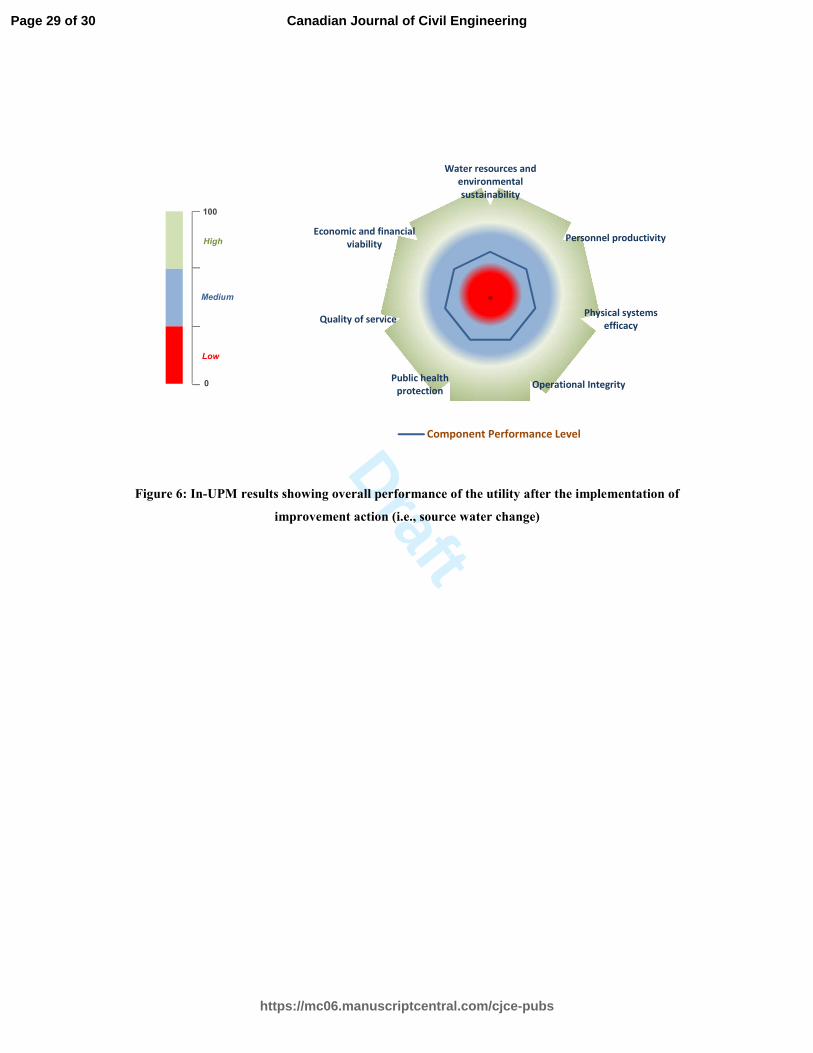
component. In the present case study, the water quality improvements achieved by changing the source 430
for underperforming WSSs are presented in Figure 6. Likewise, performance improvements can be 431
achieved for other functional components. 432
433
As a result of regular performance benchmarking process, the level of service can be revised and new PIs 434
and PMs can also be included. In-UPM can also be used to predict the improvement in performance as a 435
result of an improvement action. Once a decision action is selected based on the predicted simulations 436
results for the future scenario after improvement action, there is a need of checking its impact on the 437
customer satisfaction. Customer satisfaction is one of the most important objectives of any water utility. 438
Therefore, it is desirable to assess the satisfaction level of customers to evaluate the viability of the major 439
decision actions before practical implementation. This is also important due to the fact that major 440
infrastructure improvements may increase water rates, which can also increase customer dissatisfaction. 441
442
It is important for the utility managers to take rational decisions with optimal utilization of their human 443
and financial resources to reduce cumulative risk of customer satisfaction up to the acceptable level. 444
These decision actions may range from simple inspection and maintenance measures to expansive and 445
large scale infrastructure improvements. In this regard, a risk based customer satisfaction model is 446
developed as Module V based on the record of customer complaints (work orders). 447
448
The risk can be quantified with the help of failure mode effect analysis (FMEA) in terms of risk priority 449
number (RPN) as a product of probability of occurrence of failure (P), the consequence of the failure (C), 450
and detectability (D). Once, the complaint has been reported, the ‘C’ in terms of customer satisfaction, 451
depends on several factors, including the type of complaint, response time, and time to resolve the 452
complaint. An efficient response time can be defined as the time in which the complaint was responded to 453
with an acceptable satisfaction level. For example, response to an emergency leak should be immediate, 454
within 2 to 4 hours and a non-emergency leak within 24 hours. The third factor ‘D’ is defined as the 455
implementation level of risk mitigation measures. Traditionally, FMEA determines the criticality of a FM 456
Page 15 of 30
https://mc06.manuscriptcentral.com/cjce-pubs
Canadian Journal of Civil Engineering
Draft
in terms of RP) ranging between 1 and 1000 (Abdelgawad and Fayek, 2010). Different categories of 457
complaints are identified from an exhaustive record of customer complaints for SMWU, including 458
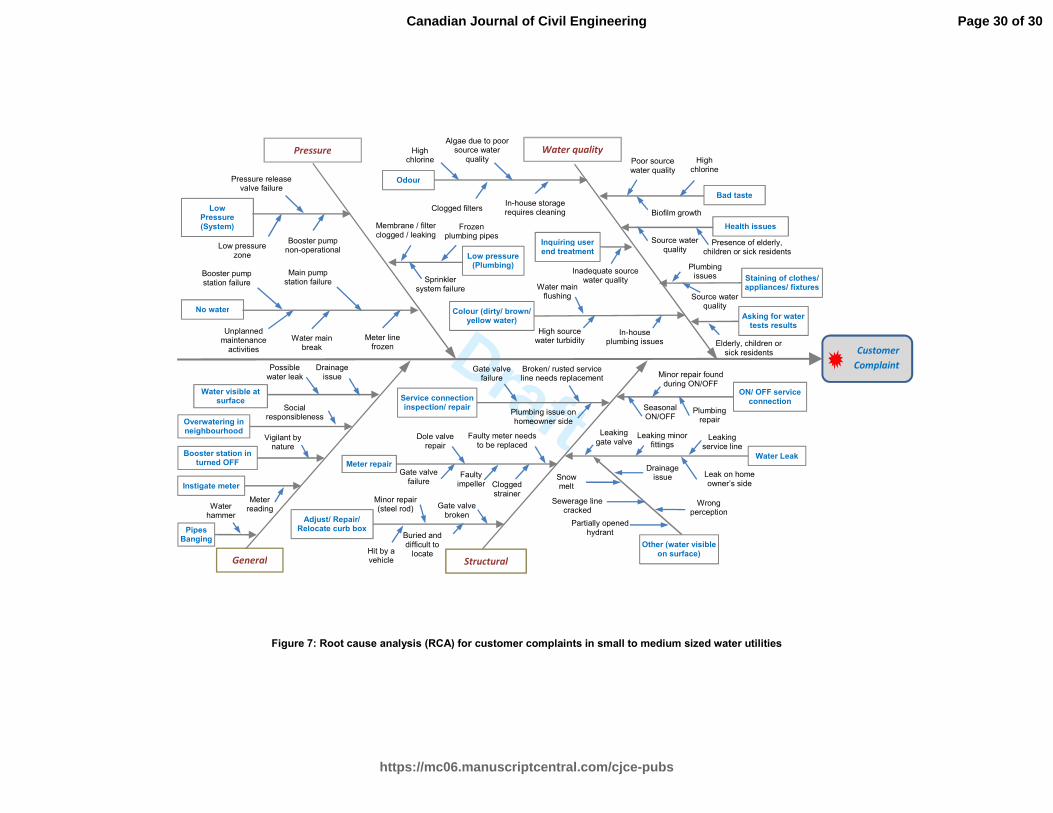
pressure, structural, water quality, and general. All possible modes of failures are identified using root 459
cause analysis in Figure 7; and the detailed risk of customer satisfaction is assessed with the help of 460
FMEA. In order to deal with inherent uncertainties associated with data limitations and expert opinion, 461
fuzzy set theory is integrated with FMEA. 462
463
The model results are shown in Figure 4. For existing scenario ‘No Action’, the risk of customer 464
satisfaction in terms of RPN is very high than the acceptable value (i.e., 150), which shows that 465
improvement actions are needed. If this value is within the acceptable risk value without any action, this 466
means that customer complaints are either very less in numbers or they are not of significant nature (e.g., 467
water quality complaints). In this case, the utility managers need to carefully evaluate their decisions 468
which they have planned as a result of Module IV simulations. These decision actions may range from 469
simple inspection and maintenance measures to expansive and large scale infrastructure improvements. In 470
this case study, the managers needed to take four actions: i) automation of booster stations, ii) a planned 471
service connection inspection program, iii) source water improvement, and iv) a conventional water 472
treatment facility. The reduction in RPN values in result of these actions are shown in Figure 4. Once, the 473
cumulative RPN value will approach to acceptable risk and all the functional components, sub-474
components and WSSs are performing ‘High’, the framework terminates. 475
476
4. Summary and Conclusions 477
478
The participation of small to medium sized water utilities in the NWWBI is almost negligible in Canada, 479
possibly due to less awareness and motivation, inefficient data management systems; moreover, due to 480
lesser economies of scale, SMWU might be avoiding to participate with large utilities which may 481
delineate deficiency performance. This research will help water utility managers across Canada and other 482
parts of the World to enhance performance management in SMWU. The integrated performance 483
management framework can be effectively used for future planning and decision making for optimal 484
utilization of limited resources in SMWU. The results also advocate the implementation of this 485
framework through strategic/ policy level decision making process in Canada to improve the performance 486
management procedures for SMWU. 487
488
Due to non-participation of SMWU in benchmarking process, the data is not available to establish 489
benchmarks for cross-utility comparisons. The inter-utility performance benchmarking model (IU-PBM) 490
Page 16 of 30
https://mc06.manuscriptcentral.com/cjce-pubs
Canadian Journal of Civil Engineering
Draft
provides the basis to initiate the benchmarking process amongst SMWU with existing data limitation at 491
provincial level or across the Canada. Certainly, the benchmarking relationships proposed in this work 492
can never replace the actual benchmarking processes involving similar sized utilities in the same region, 493
and need to be re-calibrated through a continuous benchmarking process. The weights of different PIs are 494
always influenced by the site specific characteristics of the participating utilities; therefore, the weights 495
established here can also be revised by involving larger number of SMWU in a region. IU-PBM is also 496
recommended to be enhanced for handling the uncertainties associated with data variables and expert 497
opinion. 498
499
Without comparing the performance before and after the implementation of decision actions, the utility 500
cannot assess the impacts of improvement actions on performance, and thus unable to rationally justify 501
the benefits of their spending. In general, the managers in smaller utilities take decisions without 502
performing a detailed performance assessment; they undoubtedly need a quantitative rationale for their 503
actions geared towards improvements in decision making process. The results of the intra-utility 504
performance management model (In-UPM) can help the utility managers at strategic level in obtaining 505
financial approvals from government agencies and can satisfy their customers and general public as well. 506
Moreover, such quantitatively demonstrated results showing the processes with high performance shall 507
motivate the managers for consistent efforts. 508
509
The proposed hierarchical framework of In-UPM is flexible to include additional performance factors. It 510
is recommended that with expected changes in infrastructure, availability of additional data and increased 511
participation of SMWU in national benchmarking process in future, additional data/ decisions variables, 512
PIs, and performance measures should be included to further facilitate the decision making process. 513
514
The PIs identified and selected provides guidelines to initiate and/or improve the performance assessment 515
process of the SMWU using appropriate PIs. Consistent review and improvement of the selected PIs is 516
recommended over time as per the site specific requirements of the utilities under study, changes in 517
international standards and environmental protocols, and increasing customer expectations. 518
519
The benchmarking relationships and the reference system developed in this work (in the absence of 520
extensive data of SMWU) cannot replace the actual benchmarking and performance management 521
processes involving similar sized utilities in the same region participating for several years. These 522
relationships and reference system developed in this study need to be re-calibrated through a continuous 523
benchmarking process. 524
Page 17 of 30
https://mc06.manuscriptcentral.com/cjce-pubs
Canadian Journal of Civil Engineering
Draft
525
The results of customer satisfaction module reveal that about half of the cumulative risk can be reduced 526
with the help of affordable interventions such as inspection and maintenance actions, while remaining risk 527
reduction requires large scale improvements in the infrastructure facilities. If sufficient resources are 528
available, the surveys based on customer interviews should never be overlooked. Such surveys might be 529
inevitable, particularly to determine customers willingness to pay for the improvement actions which can 530
drastically increase water rates, e.g., installation of conventional water treatment plants. 531
532
Acknowledgements 533
The financial support through NSERC Collaborative Research and Development Grant (Number: CRDPJ 534
434629-12) is acknowledged 535
Page 18 of 30
https://mc06.manuscriptcentral.com/cjce-pubs
Canadian Journal of Civil Engineering
Draft
References
Abdelgawad, M., and Fayek, A.R. 2010. Risk Management in the construction industry using combined
fuzzy FMEA and fuzzy AHP. Journal of Construction Engineering and Management, 136:1028-1036.
ADB. 2012. Handbook for selecting performance indicators for ADB-funded projects in the PRC. Asian
Development Bank, cited on July 2012. www.adb.org/prc.
AECOM. 2013. National Water and Wastewater benchmarking Initiative - 2013 Public Report, Canada.
www.nationalbenchmarking.ca
Alegre, H. 2010. Is strategic asset management applicable to small and medium utilities? Water Science
and Technology-WST, 62.9(2010):2051-2058.
AECOM. 2014. “Water utility master plan.” Final report prepared for the District of West Kelowna,
Kelowna, BC, Canada.
<http://www.districtofwestkelowna.ca/Modules/ShowDocument.aspx?documentid=12962> (Jul. 17,
2014).
Alegre, H., Bapista, J.M., Cabrera, E.Jr., Cubillo, F., Duarte P., Hirner, W., Merkel, W., and Parena, R.
2006. Performance Indicators for Water Supply Services. Manual of Best Practice Series, IWA
Publishing, London, UK.
Alegre H., Coelho S.T. 2012. Infrastructure Asset Management of Urban Water Systems. Chapter 3,
Water Supply System Analysis – Selected Topics, Book edited by Avi Ostfeld, INTEC.
AWWA. 2004. Selection and definition of performance indicators for water and wastewater utilities.
Water://Stats 2002 Distribution Survey. Denver, CO: American Water Works Association, USA.
Berg, C., and Danilenko, A. 2011. The IBNET water supply and sanitation performance Blue Book. The
International Benchmarking Network for Water and Sanitation Utilities Data book, Water and
Sanitation Program, The World Bank, Washington D.C.
Brown, C.E. 2004. Making small water systems strong. Journal of Contemporary Water Research &
Education, 128:27-30.
Coelho, S.T. 1997. Performance in water distribution – a system approach. Jhon Wiley and Sons Inc.,
New York, USA.
Corton, M.L., and Berg S.V. 2009. Benchmarking Central American water utilities. Utilities Policy,
17(2009):267–275.
CSA. 2010. Activities relating to drinking water and wastewater services – Guidelines for the
management of drinking water utilities and for the assessment of drinking water services, CAN/CSA-
Z24512-10, National Standard of Canada, ISO, Standards Council of Canada & Canadian Standards
Association.
Galar, D., Berges, L., Sandborn, P., and Kumar, U. 2014. The need for aggregated indicators in
performance asset management. Eksploatacja I Niezawodnosc – Maintenance and Reliability,
Page 19 of 30
https://mc06.manuscriptcentral.com/cjce-pubs
Canadian Journal of Civil Engineering
Draft
16(1):120-127.
Haider, H., Sadiq, R., and Tesfamariam, S. 2014. Performance Indicators for Small and Medium Sized
Water Supply Systems: A Review. Environmental Reviews, 22(1):1-40.
Haider, H., Sadiq, R., and Tesfamariam, S. 2015a. Selecting Performance Indicators for Small to Medium
Sized Water Utilities: Multi-criteria Analysis using ELECTRE Method. Urban water Journal,
12(4):305-327.
Haider, H., Sadiq, R., and Tesfamariam, S. 2015b. Inter-utility Performance Benchmarking Model for
Small to Medium Sized Water Utilities: Aggregated Performance Indices. ASCE’s Journal of Water
Resources Planning and Management, In Press. (DOI: 10.1061/(ASCE)WR.1943-5452.0000552).
Haider, H. 2015. Performance management framework for small to medium sized water utilities:
conceptualization to development and implementation, PhD Thesis, The University of British
Columbia, Canada.
Interior Health Canada. 2013. Cited on 28th June 2013,
http://www.interiorhealth.ca/YourEnvironment/InspectionReports/Pages/WaterNotifications.aspx
KWR. 2008. Consumer satisfaction, preference and acceptance regarding drinking water services: An
overview of literature findings and assessment methods, Kiwa Water Research, The Netherlands.
Lambert, A., and Taylor, R. 2010. Water loss guidelines, prepared for Water New Zealand, New Zealand
Water and Wastes Association, Wairoa, New Zealand.
Mamdani, E. H. 1977. Application of fuzzy logic to approximate reasoning using linguistic systems.
Fuzzy Set Systems, 26:1182–1191.
Marques, R., and Witte K. De. 2010. Towards a benchmarking paradigm in the European public water
and sewerage services. Public Money & Management, 30(10):42..
NRC. 2010. Framework for Assessment of State, Performance and Management of Canada’s Core Public
Infrastructure, National Research Council Canada, Final Report B5332.5.
NWC. 2012. National Performance Report 2010-2011: Urban Water Utilities, National Water
Commission, Australian Government.
OFWAT. 2012. Key performance indicators – guidance. Cited on August 2012, www.ofwat.gov.uk.
Stone, S., Dzuray, E.J., Meisegeier, D., Dahlborg, A.S., and Erickson, M. 2002. Decision-Support Tools
for Predicting the Performance of Water Distribution and Wastewater Collection Systems. USEPA.
USEPA. 2005. Drinking water infrastructure needs survey and assessment. United States Environmental
Protection Agency, Third Report to Congress, EPA-816-R-05-001, Office of water, Washington DC,
USA.
USEPA. 2003. Analysis and findings of the Gallup organization’s drinking water customer satisfaction
survey. The U.S. Environmental Protection Agency, Washington D.C. Office of Groundwater and
Drinking Water; 2003 Aug.
Water Canada. 2013. Cited on 12th September 2013. http://www.water.ca/textm.asp.
Page 20 of 30
https://mc06.manuscriptcentral.com/cjce-pubs
Canadian Journal of Civil Engineering
Draft
WHO. 2012. UN-water global annual assessment of sanitation and drinking water (GLASS) 2012 report:
the changes of extending sustaining services, UN Water Report 2012, Switzerland.
Yoon, K.P., and Hwang, C. 1995. Multiple attribute decision making-An Introduction. SAGE
Publications, California.
Zadeh, L. A., 1978. Fuzzy Sets as a Basis for a Theory of Possibility. Fuzzy Set Systems, 1:3-28.
Page 21 of 30
https://mc06.manuscriptcentral.com/cjce-pubs
Canadian Journal of Civil Engineering
Draft
Table 1: Functional components, performance measures, performance indicators, process parameters, and data/ decision variables
Functional
component
Module I Module II & III Module IV Module V
Identified
PIs1 Selected PIs Additional process parameters Performance measure Data/ decision variable
Process parameters
(Categorized complaints)
Decisions for risk
reduction
Water resources
and
environmental
sustainability 9
• WE1- No. of days
of water restriction
• WE2 – Residential
water consumption
(Total 6 PIs)
• WE6: Implementation of
water conservation plan
• Water resources and
catchment management
personnel (L23)
• FE7: Non-revenue water (L2)
Primary Measures
• Source water protection
• Environmental Protection
and three secondary measures
A1: Average annual demand
A3: Average daily demand
C5: Total capacity of treated
water storage reservoirs
(Total 17 variables)
• Source water
characteristics
• Improve/ change
source
Personnel
productivity
22
• PE1: Field FTEs2 –
Distribution systems
• PE2: Field FTEs –
Metering (Total 12
PIs)
• PE12: Staff Productivity
• PE13: Implementation of
health and safety plan
Primary Measures
• Personnel adequacy
• Personnel health and safety
• Working environment efficacy
and 6 secondary measures
• A1: Average annual
demand
• A9: Treated water
supplied
• B1: Total personnel
(Total 20 variables)
• Personnel productivity • Hire additional staff
for new inspection
plans
• Optimize personnel
productivity in result
of automation
Physical assets
efficacy
12
• PH1: Metering level
• PH2: Degree of
automation
(Total 7 PIs)
• WE2: Residential water
consumption (L2)
• WE6: Implementation level of
WCP4 (L2)
• FE1: Water rates (L35)
Primary measures
• Storage and treatment systems
capacity
• Monitoring system Integrity
and one secondary measure
• A1: Average annual
demand
• A3: Average daily
demand
(Total 10 variables)
• Degree of automation • Improve degree of
automation
Operational
Integrity
22
• OP1: Pipe breaks
• OP2: Pipes replaced
(Total 12 PIs)
• OP11: Network efficiency
• OP12: Customer density
• P13: Average pipe age
• OP14: Implementation level
of risk based pipes’
rehabilitation and replacement
plan
Primary measures
• Distribution system integrity
• Distribution system
performance
• Distribution network
productivity
And five secondary measures
• C6: Total number of
service connections
• C12: Total number of
hydrants
(Total 17 variables)
• Water mains breaks
• Hydrant flushing
• Improve flushing
frequency
Public health
safety
12
• WP1: Boil water
advisories
• WP2: Average
turbidity in
distribution
(Total 9 PIs)
- Primary measures
• Public health safety
• Water quality adequacy
and two secondary measures
• D17: Population affected
by BWAs
• D18: Turbidity in
distribution system
(Total 12 variables)
• Boil water advisories
• Water quality compliance
• Water quality parameters
• Water mains flushing
• Reduce boil water
advisories
• Control water quality
parameters through
improved treatment
Quality of service
reliability
16
• QS1: Billing
complaints
• QS2: Pressure
complaints
(Total 9 PIs)
• QS6: Time of response to
complaints
• QS10: Microbiological tests
compliance
• QS11: Physico-chemical tests
compliance
Primary measure
• Customer service reliability
• Customer satisfaction level
and 4 secondary measures
• D25: Unplanned
interruptions
• D26: Unplanned
maintenance hours
(Total 17 variables)
Complaints related to
pressure, structural failure,
water quality, and general
(Total 63 modes of
failures)
• Regular service
connection
inspection program
• Avoid unplanned
maintenance
Economic and
financial viability
16
• FE1: Water rates
• FE2: O&M Cost per
Km of water mains
(Total 7 PIs)
• FE8: Affordability Primary measures
• Economic stability
• Revenue collection efficiency
• Operational cost compliance
and two secondary measure
• G3: Total O&M cost of
water treatment
• G4: Total annual
operational revenues
(Total 13 variables)
• Water rates • Need of willingness
to pay surveys for
major improvements
Page 22 of 30
https://mc06.manuscriptcentral.com/cjce-pubs
Canadian Journal of Civil Engineering
Draft
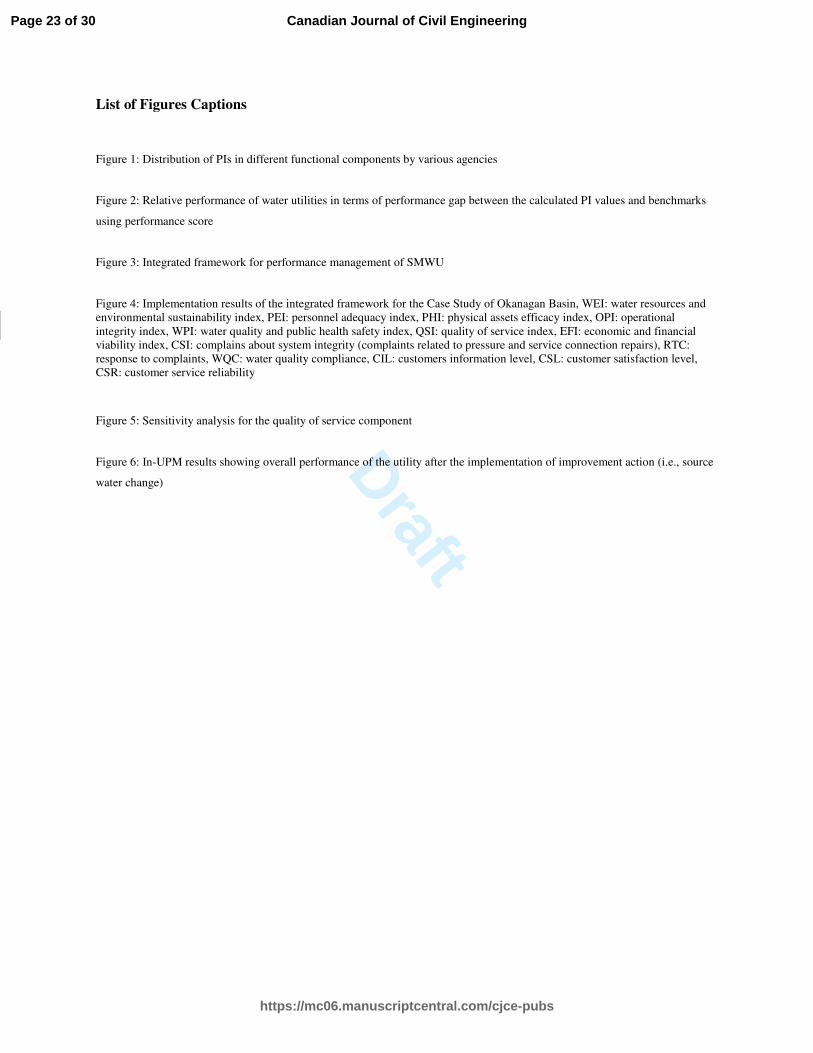
List of Figures Captions
Figure 1: Distribution of PIs in different functional components by various agencies
Figure 2: Relative performance of water utilities in terms of performance gap between the calculated PI values and benchmarks
using performance score
Figure 3: Integrated framework for performance management of SMWU
Figure 4: Implementation results of the integrated framework for the Case Study of Okanagan Basin, WEI: water resources and
environmental sustainability index, PEI: personnel adequacy index, PHI: physical assets efficacy index, OPI: operational
integrity index, WPI: water quality and public health safety index, QSI: quality of service index, EFI: economic and financial
viability index, CSI: complains about system integrity (complaints related to pressure and service connection repairs), RTC:
response to complaints, WQC: water quality compliance, CIL: customers information level, CSL: customer satisfaction level,
CSR: customer service reliability
Figure 5: Sensitivity analysis for the quality of service component
Figure 6: In-UPM results showing overall performance of the utility after the implementation of improvement action (i.e., source
water change)
Page 23 of 30
https://mc06.manuscriptcentral.com/cjce-pubs
Canadian Journal of Civil Engineering
Draft
Figure 1: Distribution of PIs in different functional components by various agencies
0 20 40 60 80 100 120 140 160 180
OFWAT (2012)
ADB (2012)
WB (2011)
NWC (2011)
CSA (2010)
NRC (2010)
IWA (2006)
AWWA (2004)
Water resources & environment
Physical & Assets
Personnel/ Staffing
Water quality & Public Health
Operational
Quality of Service
Financial & economic
Page 24 of 30
https://mc06.manuscriptcentral.com/cjce-pubs
Canadian Journal of Civil Engineering
Draft
Figure 2: Relative performance of water utilities in terms of performance gap between the calculated PI
values and benchmarks using performance score
10 50 100
Worst Best Average
Performance Score
Utility’s Performance ‘PI value’
Range
Established Benchmark Value of PI
Utility performing better
than the benchmark
Additional tolerance
available- MAINTAIN
Utility performing slightly worse than the
benchmark
Critical condition -
IMPROVE
Utility performing much less than the
benchmark
Large Performance Gap – MAJOR IMPROVEMENTS REQUIRED
(Small performance
Gap)
Page 25 of 30
https://mc06.manuscriptcentral.com/cjce-pubs
Canadian Journal of Civil Engineering
Draft
Figure 3: Integrated framework for performance management of SMWU
M3- Inter-utility
performance
benchmarking
‘IU-PBM’
Performance assessment (Performance Indices)
- Data Variables
- Establish LOS
Check all
components Sustainable
SMWU
High
Revised LOS
based on
regional
benchmarking
M4. Intra-utility
performance
management ‘In-UPM’
Evaluate all the functional and sub-
functional components at utility
level
Check all
components
≥ Medium
< High
-Data Variables
-Define UOD
Add additional
PIs and PMs as
per need
Evaluate all the sub-functional
components at system level
Check all Systems
≤ Medium OR Low
Decisions at
utility level
High Sustainable
SMWU
≤ High Decisions at
system level
High
Sustainable
SMWU
Inputs Process Outputs Changes/
Improvements
Outcomes/
Objectives
M1 - Review and
Identification of
PIs
State-of-the-art review of
literature of PIs - Reports
- Research
Additional PIs
in future
Identification of potential PIs
(Initial screening)
M2- Selection
of PIs with
MCDA
Application of MCDA (Ranking of PIs)
Expert opinion
(scoring)
Decision maker
boundary Participation of
more SMWU PIs for SMWU Select suitable PIs for SMWU
M5. Risk based
customer
satisfaction
management (RCA and FMEA
Application)
Risk based assessment of customer
satisfaction
• -Customer
complaints
• -Utility’s
response
Perform
willingness-to-
pay surveys for
large projects
Check Risk
< Acceptable
Risk
management
> Acceptable
Sustainable
SMWU
END
M5
Customer
surveys about
existing
practices
Page 26 of 30
https://mc06.manuscriptcentral.com/cjce-pubs
Canadian Journal of Civil Engineering
Draft
Figure 4: Implementation results of the integrated framework for the Case Study of Okanagan Basin, WEI: water resources and
environmental sustainability index, PEI: personnel adequacy index, PHI: physical assets efficacy index, OPI: operational
integrity index, WPI: water quality and public health safety index, QSI: quality of service index, EFI: economic and financial
viability index, CSI: complains about system integrity (complaints related to pressure and service connection repairs), RTC:
response to complaints, WQC: water quality compliance, CIL: customers information level, CSL: customer satisfaction level,
CSR: customer service reliability
>High (80)
Go to Module V
< Acceptable
Module I (Identification
of PIs)
Module II (Selection of
PIs)
62 PIs for
SMWU
Expert opinion
(scoring)
Decision maker
boundary
W 2 W 1
W 6 W 3
W 5 W 4
W 7
W 8 W 9
- Reports
- Research
Identification of potential PIs (109)
- Water resources and environment (9 PIs)
- Personnel (22 PIs)
- Physical assets (12 PIs)
- Operational (22 PIs)
- Water quality and public health (12 PIs)
- Quality of service (16 PIs)
- Economic and financial (16 PIs)
0 50 100 150 200
OFWAT (2012)
ADB (2012)
WB (2011)
NWC (2011)
CSA (2010)
NRC (2010)
IWA (2006)
AWWA (2004)
580 PIs
Example of Water resources and Environmental PIs (W)
Module III (IU-PBM)
Check all
components
< High (80) - Data Variables
- Establish LOS 0
20
40
60
80
100WEI
PEI
PHI
OPIWPI
QSI
EFI
Go to Module IV
for component
and system level
evaluation
Check at utility
level
Check all Water
Supply Systems
≤ Medium OR Low
≤ High
Module IV (In-UPM)
-Data Variables
-Define UOD
Customers
information
level
Water
quality
compliance
Response to
complaints
Complaints
about
system
integrity
WSS I
WSS II
WSS III
Take improvement
actions and Go to
Module V for
Customer Satisfaction
Check
• -Customer
complaints
• -Utility’s
response Check Risk END
Module V (Customer
Satisfaction)
0
200
400
600
800
No Action Action-1 Action-2 Action-3 Action-4
Ris
k P
rio
rity
Nu
mb
er
Utility Level Performance
Assessment
Quality of service component
assessment at System Level
Risk Assessment Results
> Acceptable
0 10
CSR
CSL
CIL
WQC
RTC
CSI
Pri
ma
ry
Pe
rfo
r.
Me
as.
Se
con
d.
Pe
rfo
r.
Me
as.
Improve Maintain Revise
Quality of service sub-component
assessment at Utility Level
Improve at
utility level
and Go to
Module V
> Medium
Page 27 of 30
https://mc06.manuscriptcentral.com/cjce-pubs
Canadian Journal of Civil Engineering
Draft
Figure 5: Sensitivity analysis for the quality of service component
-15 -10 -5 0 5 10 15 20 25 30
QS-4
QS-5
QS-9
QS-10
QS-11
QS-7
QS-6
QS-2
QS-3
QS-8
QS-1
% Contribution
Page 28 of 30
https://mc06.manuscriptcentral.com/cjce-pubs
Canadian Journal of Civil Engineering
Draft
Figure 6: In-UPM results showing overall performance of the utility after the implementation of
improvement action (i.e., source water change)
Water resources and
environmental
sustainability
Personnel productivity
Physical systems
efficacy
Operational IntegrityPublic health
protection
Quality of service
Economic and financial
viability
Component Performance Level
0
100
High
Medium
Low
Page 29 of 30
https://mc06.manuscriptcentral.com/cjce-pubs
Canadian Journal of Civil Engineering
Draft
Figure 7: Root cause analysis (RCA) for customer complaints in small to medium sized water utilities
Customer
Complaint
Pressure Water quality
General Structural
Low Pressure (System)
Pressure release valve failure
Low pressure zone
Booster pump non-operational
No water
Booster pump station failure
Main pump station failure
Unplanned maintenance activities
Water main break
Meter line frozen
Low pressure (Plumbing)
Membrane / filter clogged / leaking
Sprinkler system failure
Frozen plumbing pipes
Odour
High chlorine
Clogged filters In-house storage requires cleaning
Algae due to poor source water
quality
Colour (dirty/ brown/ yellow water)
High source water turbidity
Water main flushing
In-house plumbing issues
Inquiring user end treatment
Inadequate source water quality
Bad taste
Poor source water quality
Biofilm growth
High chlorine
Health issues
Source water quality
Presence of elderly, children or sick residents
Staining of clothes/ appliances/ fixtures
Source water quality
Plumbing issues
Asking for water tests results
Elderly, children or sick residents
Water visible at surface
Possible water leak
Drainage issue
Overwatering in neighbourhood
Social responsibleness
Booster station in turned OFF
Vigilant by nature
Instigate meter
Service connection inspection/ repair
Gate valve failure
Broken/ rusted service line needs replacement
Plumbing issue on homeowner side
ON/ OFF service connection
Plumbing repair
Seasonal ON/OFF
Minor repair found during ON/OFF
Pipes Banging
Water hammer
Adjust/ Repair/ Relocate curb box
Minor repair (steel rod)
Hit by a vehicle
Gate valve broken
Buried and difficult to locate
Meter repair
Dole valve repair
Faulty meter needs to be replaced
Clogged strainer
Faulty impeller
Gate valve failure
Water Leak
Leaking gate valve
Leaking minor fittings
Other (water visible on surface)
Leak on home owner’s side
Leaking service line
Snow melt
Sewerage line cracked
Drainage issue
Wrong perception
Partially opened hydrant
Meter reading
Page 30 of 30
https://mc06.manuscriptcentral.com/cjce-pubs
Canadian Journal of Civil Engineering