Embed Size (px)
Citation preview

International Journal of Advance Engineering and Research Development
Volume 2,Issue 6, June -2015
@IJAERD-2015, All rights Reserved 489
Scientific Journal of Impact Factor(SJIF): 3.134 e-ISSN(O): 2348-4470
p-ISSN(P): 2348-6406
Multimodal Biometric System for User Authentication with Fuzzy Fusion of Face
and Fingerprint
Shiv Ratan Singh1, Prof Jai Prakash
2
1Sr. Lecturer, Department of ECE,Guru Nanak Dev Institute of Technology, Govt of NCT of Delhi
Research Scholar Mewar University 2Visiting facult, Mewar University
Abstract—The vast majority of the successful commercial biometric systems at present depend on fingerprint or face.
Moreover, these biometric indicators complement one another in their strengths and advantages. While fingerprint gives
exceptionally high verification precision, but still carry some verification errors. The Face recognition is second most
preferred method with reasonably good accuracy. In this paper, integration of face and fingerprint recognition
techniques using fuzzy fusion method is detailed. The introductory results are promising and indicate that the fusion of face recognition and fingerprint methods further improves the accuracy of the user identification system.
Index Terms— Face recognition, Finger recognition, Fuzzy Logic
1. INTRODUCTION
A biometric system which relies on a single biometric identifier is most of the time unable to meet the desired
requirements in making a personal identification and verification. Th is happens due to the algorithms limitations. Now
days various biometric identifiers like, face, finger, voice, palm, retina and hand writ ing etc. are used . However, each of
these methods has their pros and cons. In this work we have concentred on finger and face recognition based system as
these are more preferred methods over others.
In past, the biometric systems were mostly used as an identity service, but in surveillance these methods were not used
(Fig. 1).
Fig. 1: Global Market by Application (2009)
Fig. 2: Global Market by Application (2017)
But in past few years trend has changed, and now the biometric is also preferred in surveillance applicat ion. This
acceptance of biometric system over the traditional methods over the years is increased and expected to grow in coming
years (Fig. 2).
International Journal of Advance Engineering and Research Development (IJAERD)
Volume 2,Issue 6, June -2015, e-ISSN: 2348 - 4470 , print-ISSN:2348-6406
@IJAERD-2015, All rights Reserved 490
Biometrics, which points out to the automatic indiv idual identification based on his behavioural or physiological
characteristics, depends on ―something which he is or he does‖ (e.g. placing his finger on a scanner) in order to make
identification of a person. As compared to the token-based and/or knowledge-based approaches, biometrics methods are
more reliable. The reason behind this is the uniqueness of the physiological or behavioural characteristic of each user. As
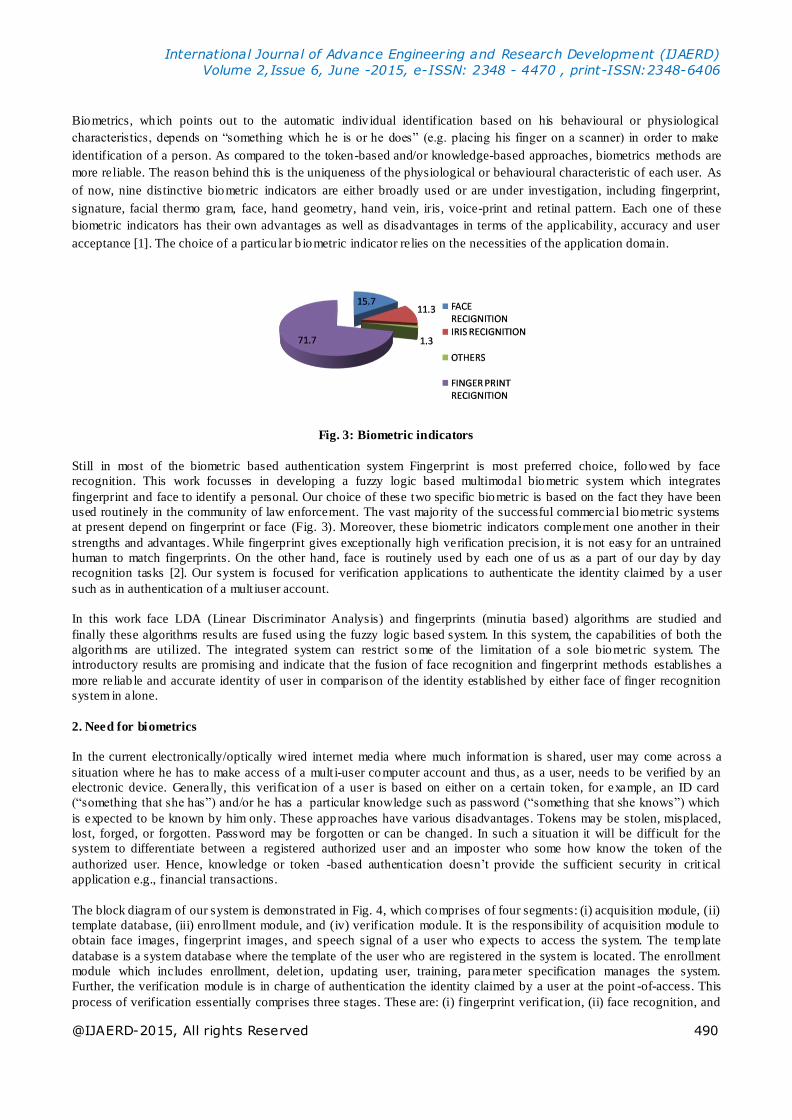
of now, nine distinctive biometric indicators are either broadly used or are under investigation, including fingerprint,
signature, facial thermo gram, face, hand geometry, hand vein, iris, voice-print and retinal pattern. Each one of these
biometric indicators has their own advantages as well as disadvantages in terms of the applicability, accuracy and user
acceptance [1]. The choice of a particu lar b iometric indicator relies on the necessities of the application domain.
Fig. 3: Biometric indicators
Still in most of the biometric based authentication system Fingerprint is most preferred choice, followed by face
recognition. This work focusses in developing a fuzzy logic based multimodal biometric system which integrates
fingerprint and face to identify a personal. Our choice of these two specific biometric is based on the fact they have been
used routinely in the community of law enforcement. The vast majority of the successful commercial biometric systems
at present depend on fingerprint or face (Fig. 3). Moreover, these biometric indicators complement one another in their
strengths and advantages. While fingerprint gives exceptionally high verification precision, it is not easy for an untrained
human to match fingerprints. On the other hand, face is routinely used by each one of us as a part of our day by day
recognition tasks [2]. Our system is focused for verification applications to authenticate the identity claimed by a user
such as in authentication of a mult iuser account.
In this work face LDA (Linear Discriminator Analysis) and fingerprints (minutia based) algorithms are studied and
finally these algorithms results are fused using the fuzzy logic based system. In this system, the capabilities of both the
algorithms are utilized. The integrated system can restrict some of the limitation of a sole biometric system. The
introductory results are promising and indicate that the fusion of face recognition and fingerprint methods establishes a
more reliab le and accurate identity of user in comparison of the identity established by either face of finger recognition
system in alone.
2. Need for biometrics
In the current electronically/optically wired internet media where much informat ion is shared, user may come across a
situation where he has to make access of a mult i-user computer account and thus, as a user, needs to be verified by an
electronic device. Generally, this verificat ion of a user is based on either on a certain token, for example, an ID card
(―something that she has‖) and/or he has a particular knowledge such as password (―something that she knows‖) which
is expected to be known by him only. These approaches have various disadvantages. Tokens may be stolen, misplaced,
lost, forged, or forgotten. Password may be forgotten or can be changed. In such a situation it will be difficult for the
system to differentiate between a registered authorized user and an imposter who some how know the token of the
authorized user. Hence, knowledge or token -based authentication doesn‘t provide the sufficient security in crit ical
application e.g., financial transactions.
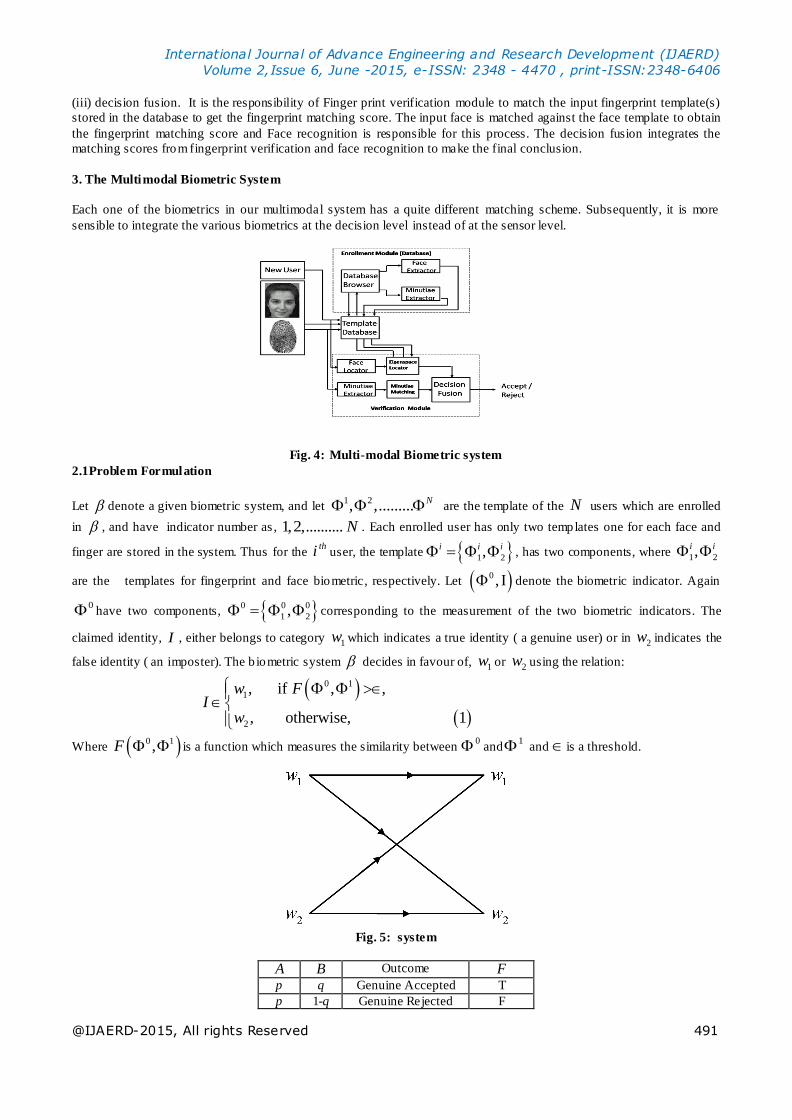
The block diagram of our system is demonstrated in Fig. 4, which comprises of four segments: (i) acquisition module, (ii)
template database, (iii) enro llment module, and (iv) verification module. It is the responsibility of acquisition module to
obtain face images, fingerprint images, and speech signal of a user who expects to access the system. The template
database is a system database where the template of the user who are registered in the system is located. The enrollment
module which includes enrollment, delet ion, updating user, training, para meter specification manages the system.
Further, the verification module is in charge of authentication the identity claimed by a user at the point -of-access. This
process of verification essentially comprises three stages. These are: (i) fingerprint verificat ion, (ii) face recognition, and
International Journal of Advance Engineering and Research Development (IJAERD)
Volume 2,Issue 6, June -2015, e-ISSN: 2348 - 4470 , print-ISSN:2348-6406
@IJAERD-2015, All rights Reserved 491
(iii) decision fusion. It is the responsibility of Finger print verification module to match the input fingerprint template(s)
stored in the database to get the fingerprint matching score. The input face is matched against the face template to obtain
the fingerprint matching score and Face recognition is responsible for this process. The decision fusion integrates the
matching scores from fingerprint verification and face recognition to make the final conclusion.
3. The Multimodal Biometric System
Each one of the biometrics in our multimodal system has a quite different matching scheme. Subsequently, it is more
sensible to integrate the various biometrics at the decision level instead of at the sensor level.
Fig. 4: Multi-modal Biometric system
2.1Problem Formulation
Let denote a given biometric system, and let 1 2, ,......... N are the template of the N users which are enrolled
in , and have indicator number as , 1,2,.......... N . Each enrolled user has only two templates one for each face and
finger are stored in the system. Thus for the thi user, the template 1 2,i i i , has two components, where
1 2,i i
are the templates for fingerprint and face biometric, respectively. Let 0 , I denote the biometric indicator. Again
0 have two components, 0 0 0
1 2, corresponding to the measurement of the two biometric indicators. The
claimed identity, I , either belongs to category 1w which indicates a true identity ( a genuine user) or in 2w indicates the
false identity ( an imposter). The b iometric system decides in favour of, 1w or 2w using the relation:
0 1
1
2
, if , ,
, otherwise, 1
w FI
w
Where 0 1,F is a function which measures the similarity between0 and
1 and is a threshold.
Fig. 5: system
A B Outcome F
p q Genuine Accepted T
p 1-q Genuine Rejected F

International Journal of Advance Engineering and Research Development (IJAERD)
Volume 2,Issue 6, June -2015, e-ISSN: 2348 - 4470 , print-ISSN:2348-6406
@IJAERD-2015, All rights Reserved 492
1-p q Imposter Accepted F
1-p 1-q Imposter Rejected T
Identi ty Summary
For a claimed identity I , there are four possibilit ies : (i) a claimed identity in 1w is determined to be in
1w , (ii) a
claimed identity in 1w is determined to be in
2w , (iii) a claimed identity in 2w is determined to be in
2w , (iv) a claimed
identity in 2w is determined to be in
1w . Outcome (i) corresponds to a genuine user being accepted,outcome (ii)
corresponds to a genuine user being rejected, outcome (iii) corresponds to an imposter user being rejected, and outcome
(iv) corresponds to an imposter being accepted. Obviously, outcomes (i) and (iii) are correct whereas outcomes (ii) and
(iv) are incorrect. Logically the outcome can be expresses as
ABBAF , however, the logical values are not ‗0‘ and ‗1‘ and are depends on some threshold as in table 1.
Ideally, a b iometric system should make only right decisions.In practise, because of the large intraclass variations in the
acquired digital representation of the biometric indicator, incorrect decisions cannot be avoided. The performance
measure of a biometric system are (i) false acceptance rate (FAR) and (ii) false reject rate ( FRR). The false acceptance
rate corresponds to the probability of outcome (iv) and the false reject rate is defined as the probability of outcome (ii).
As the lower the values of the FAR and FRR goes lower and lower, the reliability of the decision made by the system
increases. The FAR and FRR values of a particular biometric system are determined by the inherent interclass and
intraclass variations of the indicator and the design (e.g., feature extract ion, decision making) of the system.
4. Distance Metrics
In this work Mahalanobis Cosine distance measured is used which is detailed below:
Euclidean: The Euclidean distance measure (2L ) between two vectors u, v in any image space is calculated as
2
1
( , ) ( )N
E i i
i
D u v u v
(2)
Mahalanobis Cosine: For each vector pair u and v in image space the transformed vector pair m and n in Mahalanobis
space. The transformed vector pair now given as i
i
i
um
and
ii
i
vn
.Here i is the standard deviation of the i
th
dimension.
The Mahalanobis Cosine distance between two vectors u, v in image space is calculated as in
1
2 2
1 1
1
2 2
1 1
( ).
( , )
( ) ( )
.
( , )
N
i i
iMCos
N N
i i
i i
Ni i
i i i
MCosN N
i i
i ii i
m nm n
S u vm n
m n
u v
S u v
u v
(3)
and ( , ) 1 ( , )MCos MCosD u v S u v .
6. Face recognition
Face recognition is a process which investigates the similarity between the user face and the stored template to recognise
the user identity.
The eigenface approach for the face recogntion is well investigated and it performes very well. This is a two step
approach : (i) train ing stage and (ii) operational stage. In this method the dimention of the traing images are reduced .

International Journal of Advance Engineering and Research Development (IJAERD)
Volume 2,Issue 6, June -2015, e-ISSN: 2348 - 4470 , print-ISSN:2348-6406
@IJAERD-2015, All rights Reserved 493
Thereafter, a representation of the facial images in the eighenspace is created, and finally the trained facial images are
protected onto the eighenspace. A user facial image is finally projected onto the same eighenspace as in the operational
stage and the similarity between the input facial image and the template is computed. Assume that 0
2 represents the
input face image with claimed identity I and 1
2 is the representation of the thI template. The similarity between
0
2
and 2
I can be computed as follows:
0
222
0
22 ),( IIF (4)
Where denotes the 2L norm.
6.1 Linear Discriminant Analysis
LDA is a powerfu l face recognition technique that overcomes the limitation of Principle component analysis technique .
The LDA maximize the ratio of the determinant of the between-class scatter matrix to the determinant of the within class
scatter matrix of the projected samples. Linear d iscriminant group images of the same class and separates images of
different classes of the images [3-6].
Considering a C-class problem with each class i consisting of a set of iN , d-dimensional samples
1 2{ , ... }i
i i i
Nx x x }, where the superscript (.)i represents the class label. Defin ing the total number of samples as
1
C
i
i
N N
and the probability of occurrence of class ‗i‘ as i
i
Np
N , the sample mean for class ‗i‘ as
iN
j
i
j
i
i xN 1
1 and the grand sample mean as μ [13]
iC
ji
iN
j
i
j
C
ji
PxN
i
1
1 (5)
The within and between class scatter matrices represented as w and B , respectively, and computed as:
1 1 1
1 1 1
1
1
i
i
NC CTii i i i i
W j jWi i j
NC CTii i i
B iBi i j
P x xN
P NN
(6)
In above expression i
w is the covariance matrix estimate for class i and computed as
1
1 iNTi i i i i
j jwji
x xN
(7)
and i
B is the scatter matrix between the class i and the ‗grand class‘ and computed as
Ti i i
B (8)
In other words, w is estimated by ‗pooling‘ together{ , 1... }i
wi C . Similarly, this is also holds for B . Then,
finally LDA evaluates a projection matrix W, say of size r×d, that maximizes the criterion function [13]

International Journal of Advance Engineering and Research Development (IJAERD)
Volume 2,Issue 6, June -2015, e-ISSN: 2348 - 4470 , print-ISSN:2348-6406
@IJAERD-2015, All rights Reserved 494
det
det
T
B
W T
W
W WJ
W W
(9)
Above det{.} is matrix determinant. The maximum value of r is d − 1. For a test pattern y , its class label yC can be
computed as 2
i=1,2,..Carg min { ( ) }T i
Y iC W y D (10)
where iD take into account of prior information.
Fig. 6 Training database images (LDA)
The AT&T lab database is used which consists of 40 fo lders each folder contains 10 images of a particular person with
different facial expressions. Some of the train ing database images are shown in figure 6, and the normalized dataset is
presented in figure 7.
Fig. 7 Normalized Training database images (LDA)
Fig. 8 Fisherface Images
The fisher faces for the normalized training datasets are shown in figure 7. The mean image is shown in figure 8, which
consists of feature of all the training images.

International Journal of Advance Engineering and Research Development (IJAERD)
Volume 2,Issue 6, June -2015, e-ISSN: 2348 - 4470 , print-ISSN:2348-6406
@IJAERD-2015, All rights Reserved 495
Fig. 8 Mean Images
(a) (b)
Fig.9 (a)Input and (b)Re-constructed images
Table: 2: The Rank one Recognition Rate for different Methods using different number of Input images
In figure 9, input and reconstructed image is shown. These images are very much similar, with slight difference in
intensity.
Table 2, the Rank one Recognition Rate for di fferent number of Input images
Test Sample sizes (number of
images)
LDA
400 (280+120) 86.07%
300 (210+90) 90.48%
200 (140+60) 93.57%
100 (70+30) 95.71%
In Table 2, the Rank one Recognition Rate for different number of Input images is shown. It must be remembered that
first three images of each fo lder, i.e ., 30% of the total images are used as training images. For 100 images the recognition
rate is 95.71% and fo r 400 images, the recognition rate is 86.07%. Moreover, as the number of images increased form
100 to 400 the performance is not deteriorated much. But in alone LDA algorithm does not provide very effective
solution when rank one recognition rate is considered.
7. Fingerprint Identification
Fingerprint identification is well-accepted and popular biometrics. Fingerprints have been used for identification for over
a century due to its inherent advantages. In past thumb impression was used for the identification of a person. Now this
methods has become automated (i.e. a biometric) due to advancements in sensor and computer based applications ..
7.1 Minutia Based Matching:
Considering T and Q are the feature vectors, which represents minutiae points, from the template and query fingerprint,
respectively. Each element of these feature vectors is a minutia point . The representation of a minutia is the triplet
, ,x y , where ,x y is the minutia location and is the minutia angle. Assuming that number of minutiae in T and Q be
m and n, respectively [7-9]. Then T and Q can be represented as
1 2,..........., ,
' ' ' ' ' ' '
1 2,...........,
, , , , 1......
, , , , , 1......
m i i i i
m j j j j
T m m m m x y i m
Q m m m m x y j n
(11)

International Journal of Advance Engineering and Research Development (IJAERD)
Volume 2,Issue 6, June -2015, e-ISSN: 2348 - 4470 , print-ISSN:2348-6406
@IJAERD-2015, All rights Reserved 496
A minutia im in T and
'
jm in Q are considered as matched if:
2 2'( , ) ' 'j i j i j i osd m m x x y y r (12)
' ' '
0( , ) min | |,360 | |j i j i j idd m m (13)
Here, 0r and
0 are the parameters of the tolerance window.
If a proper alignment between query and template fingerprints can be adjusted then the number of ―matching‖ minutia
points can be maximized. Correct alignment of two fingerprints demands for finding a complex geometrical
transformation function (map()), that maps the two minutia sets (Q and T). The map() function should be tolerant to
distortion, and it should be able to recover rotation, translation and scale parameters with fair accuracy. Let match() be a
function defined as:
"1,
( , )0
j i
j i
if m and mmatch m m
otherwise
(14)
where, map ' "
j jm m .Thus, the minutia matching problem can be formulated as
( )
1
max ,m
P P i i
i
match map m m
(15)
where P() is the minutia correspondence function that determine the pairing between the minutia points in Q and T.
The minutia-based matching can be divided into three stages: coarse matching, fusion and fine matching. In itially, on a
number of seeds coarse matching is performed, and the obtained results are then fused to obtain a relationship between
minutiae in the template and query minutiae sets. Then using the support degree of the elements in the constrained
relations, the one-to-one correspondence is finally determined by comparison of similarity of local structures. Here, the
similarity measure is given as follows: Assume that only H pairs of matched points are found during the matching
process then the computed score obtained as
min( , )
HScore
M N (16)
where, M and N are the number of minutia in query and database image respectively.
The Fingerprint Verificat ion Competit ion (FVC2002) database is used for the analyzing the algorithm. The database
consist 8 fingerprint images with different orientations per person and a total of 9 persons are considered. Thus, in all a
total of 72 finger images are in the database and are indexed as1 to72.
(a)
(b)
Fig. 10 (a) Loaded Fingerprints person1 (2) Loaded Fingerprints person1
In Figure 10, for an example, loaded images of the first two persons are shown. It can be visualized from the figure that
various possible image orientations are considered. The algorithm test is performed on the all 72 images.
International Journal of Advance Engineering and Research Development (IJAERD)
Volume 2,Issue 6, June -2015, e-ISSN: 2348 - 4470 , print-ISSN:2348-6406
@IJAERD-2015, All rights Reserved 497
7.2 Processes
Fingerprint matching techniques require initial image processing of the finger set that has been obtained.
(a) Initial Image Processing
Fingerprint Image enhancement is a process which makes the image clearer for further operations. Sometimes the
fingerprint images captured from scanner or any other image capturing media are not of perfect quality. These
enhancement methods, increases the contrast between ridges and valleys . These processes are also helpful in connecting
the false broken points of ridges due to lack of ink. Hence, these methods are very useful for keeping a higher accuracy
to fingerprint recognition.
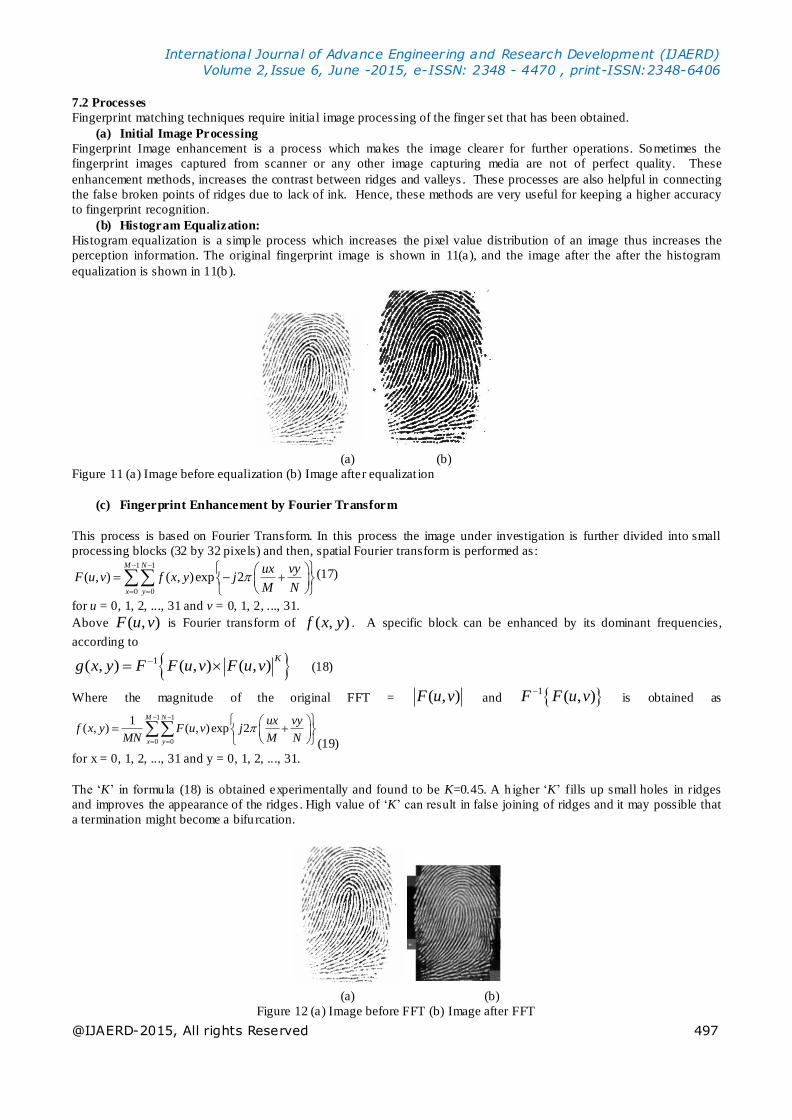
(b) Histogram Equalization:
Histogram equalization is a simple process which increases the pixel value distribution of an image thus increases the
perception information. The original fingerprint image is shown in 11(a), and the image after the after the histogram
equalization is shown in 11(b ).
(a) (b)
Figure 11 (a) Image before equalization (b) Image after equalizat ion
(c) Fingerprint Enhancement by Fourier Transform
This process is based on Fourier Transform. In this process the image under investigation is further divided into small
processing blocks (32 by 32 pixels) and then, spatial Fourier transform is performed as: 1 1
0 0
( , ) ( , )exp 2M N
x y
ux vyF u v f x y j
M N
(17)
for u = 0, 1, 2, ..., 31 and v = 0, 1, 2, ..., 31.
Above ),( vuF is Fourier transform of ),( yxf . A specific block can be enhanced by its dominant frequencies,
according to
1( , ) ( , ) ( , )K
g x y F F u v F u v (18)
Where the magnitude of the original FFT = ( , )F u v and 1 ( , )F F u v is obtained as
1 1
0 0
1( , ) ( , )exp 2
M N
x y
ux vyf x y F u v j
MN M N
(19)
for x = 0, 1, 2, ..., 31 and y = 0, 1, 2, ..., 31.
The ‗K‘ in formula (18) is obtained experimentally and found to be K=0.45. A higher ‗K‘ fills up small holes in ridges
and improves the appearance of the ridges . High value of ‗K‘ can result in false joining of ridges and it may possible that
a termination might become a bifu rcation.
(a) (b)
Figure 12 (a) Image before FFT (b) Image after FFT
International Journal of Advance Engineering and Research Development (IJAERD)
Volume 2,Issue 6, June -2015, e-ISSN: 2348 - 4470 , print-ISSN:2348-6406
@IJAERD-2015, All rights Reserved 498
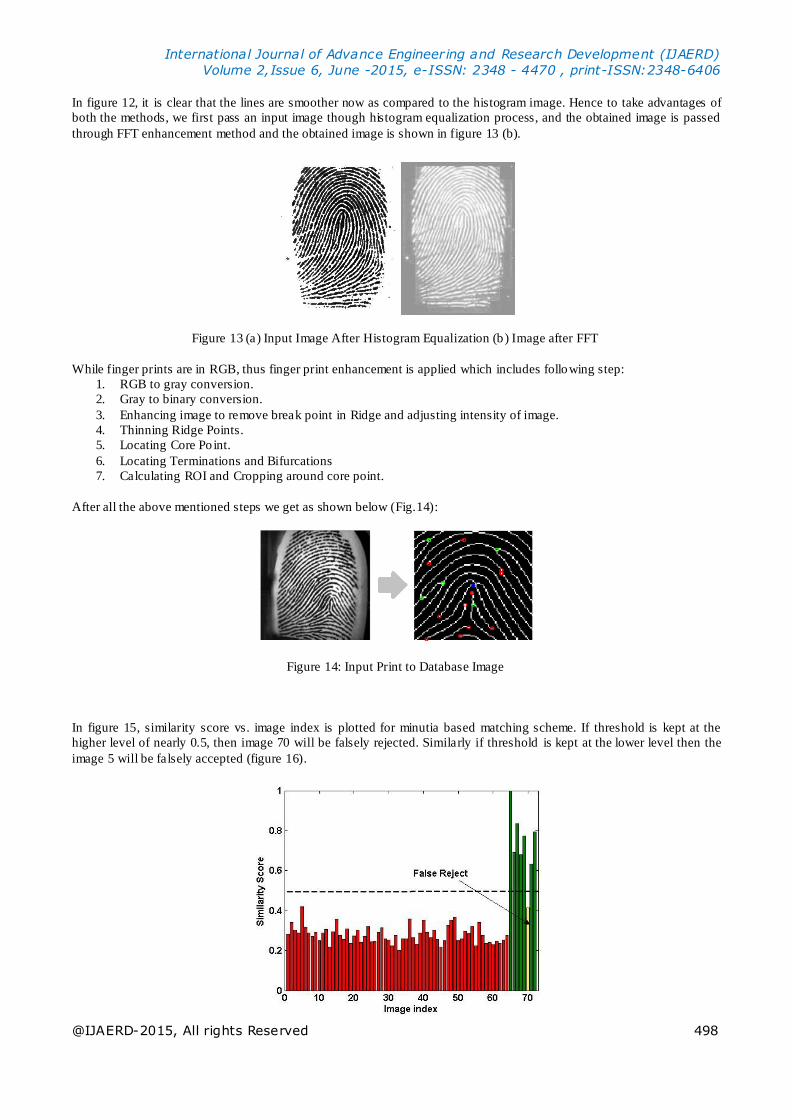
In figure 12, it is clear that the lines are smoother now as compared to the histogram image. Hence to take advantages of
both the methods, we first pass an input image though histogram equalization process, and the obtained image is passed
through FFT enhancement method and the obtained image is shown in figure 13 (b).
Figure 13 (a) Input Image After Histogram Equalization (b ) Image after FFT
While finger prints are in RGB, thus finger print enhancement is applied which includes following step:
1. RGB to gray conversion.
2. Gray to binary conversion.
3. Enhancing image to remove break point in Ridge and adjusting intensity of image.
4. Thinning Ridge Points.
5. Locating Core Po int.
6. Locating Terminations and Bifurcations
7. Calculating ROI and Cropping around core point.
After all the above mentioned steps we get as shown below (Fig.14):
Figure 14: Input Print to Database Image
In figure 15, similarity score vs. image index is plotted for minutia based matching scheme. If threshold is kept at the
higher level of nearly 0.5, then image 70 will be falsely rejected. Similarly if threshold is kept at the lower level then the
image 5 will be falsely accepted (figure 16).

International Journal of Advance Engineering and Research Development (IJAERD)
Volume 2,Issue 6, June -2015, e-ISSN: 2348 - 4470 , print-ISSN:2348-6406
@IJAERD-2015, All rights Reserved 499
Figure 15: Similarity Score vs. image index (test images 65-72, false reject 70)
Figure 16: Similarity Score vs. image index (test images 65-72, false accept 5)
The above mentioned techniques are based on the principle of learning and matching. As we increase the threshold value
for the matching, false rejection rate increases and similarly for the lower values of threshold false acceptance rate
increases. The main problems with fingerprint techniques are that algorithms are dependent on the quality and orientation
of the image and thus affect the results.
In the Table 3, given below, matched fingerprints are identified at different threshold scores. The simple procedure for
accepting the test images is as follows
if
Score thT T
Fingerprint matched
else
discard image
end
In table, test and matched fingerprints are shown at different thresholds. In the first set of experiment, images numbers
from 9 to 16 are tested at the threshold levels of 0.40, 0.46, 0.48 and 0.54.
Table 3 Minutia based fingerprint matching at various thresholds
Thres
hold
Score
Test images Matched
Fingerprints
0.40 9,10,11,12,13,
14,15,16
9,10,11,12,14,15,16,
18,20,3,34, 35, 38
0.46 9,10,11,12,13,
14,15,16
9,10,11,12,14,15,16,
20
0.48 9,10,11,12,13,
14,15,16
9,10,11,12,14,15,16,
20
0.54 9,10,11,12,13,
14,15,16
9,10,12,14,15,16
It is clear from the table that when the threshold is at low level of 0.40, the falsely accepted fingerprints are 3, 18, 20, 34,
35 and 38 and the falsely rejected image is 13. Now when the threshold is kept at the level of 0.48, the only false
acceptance is image 20 while the false rejection is 13. Now when the threshold is kept at the level of 0.54, the falsely
rejected fingerprints are 11 and 13.

International Journal of Advance Engineering and Research Development (IJAERD)
Volume 2,Issue 6, June -2015, e-ISSN: 2348 - 4470 , print-ISSN:2348-6406
@IJAERD-2015, All rights Reserved 500
As discussed above the face and fingerprint methods are not free form errors, thus a further improvement is needed to
reduce the errors.
8. Decision Fusion
On the basis of the integration of the decision made by the face recognition module and fingerprint verification module,
the ultimate decision is made by fuzzy system. In the event of having the output of each module is only a category label,
either 1w (claimed identity is true) or
2w (claimed identity is not true) can be done with certain level of accuracy . A
more precise decision can be made by accumulating the decision of individual methods if the output of each module is a
similarity value.
For fingerprint verification and face recognition, let 1X and
2X be the random variab les which denote the similarity
(dissimilarity) between an input and a template for fingerprint verification and face recognition, respectively. Let
j j ip X w where 2,1, ji be the class-conditional probability density functions of1X and
2X . As 1X and
2X
are statistically independent thus intersection is equivalent to multip licat ion. Hence the joint class-conditional probability
density function of 1X and
2X , can be written as:
2
1 2
1
and X , 1,2i j j i
j
p X w p X w i
(20)
Let 2R denote the three-dimensional space spanned by 1 2 and ;X X
2 2
1 2R and R denote the 1w - reg ion and
2w
- reg ion, respectively 2 2 2
1 2 0;R R R is the acceptable FAR. According to the Neymen-Pearson rule for hypothesis
testing, an observation 0 0 0
1 2, ,X X X can be classified as:
0 0
1 1 2 1
10 0 0 01 2 2 1 2 2
2
,,
, ,
p X X ww if
X X p X X w
w
(21)
Where denotes the minimum vales and satisfies the relation
1 1 2 1
2 1 2 2
,
,
p X X w
p X X w and
10 2 1 2 2 1 2,
Rp X X w dX dX
(22)
8.1 Fuzzification of Face recognition method
The idea of Fuzzification of the Face and fingerprint recognition techniques is shown in figure 17 [10]. For the input of
the Fuzzifier the selected membership function is and at the output of the fuzzy system the membership function is
chosen to be . As the samples follow I.I.D. process. Therefore, a truncated Gaussian membership function known as
function is selected. In the function , and defined as min imum, maximum and mean value of the train ing data
set. The 1 2, c c define the values at which the membership function takes a value of 0.5.
1
1
1
1
1
2
1
2
0
2
1 2
( ; , , )
2
1 2
0
m
m
m
m
m
m
m
m
z
zz c
zc z
zz
z c
zc z
z
(23)
The value of the m can be selected to alter the shape of the function. In this work the value of m is taken to be 2.
International Journal of Advance Engineering and Research Development (IJAERD)
Volume 2,Issue 6, June -2015, e-ISSN: 2348 - 4470 , print-ISSN:2348-6406
@IJAERD-2015, All rights Reserved 501
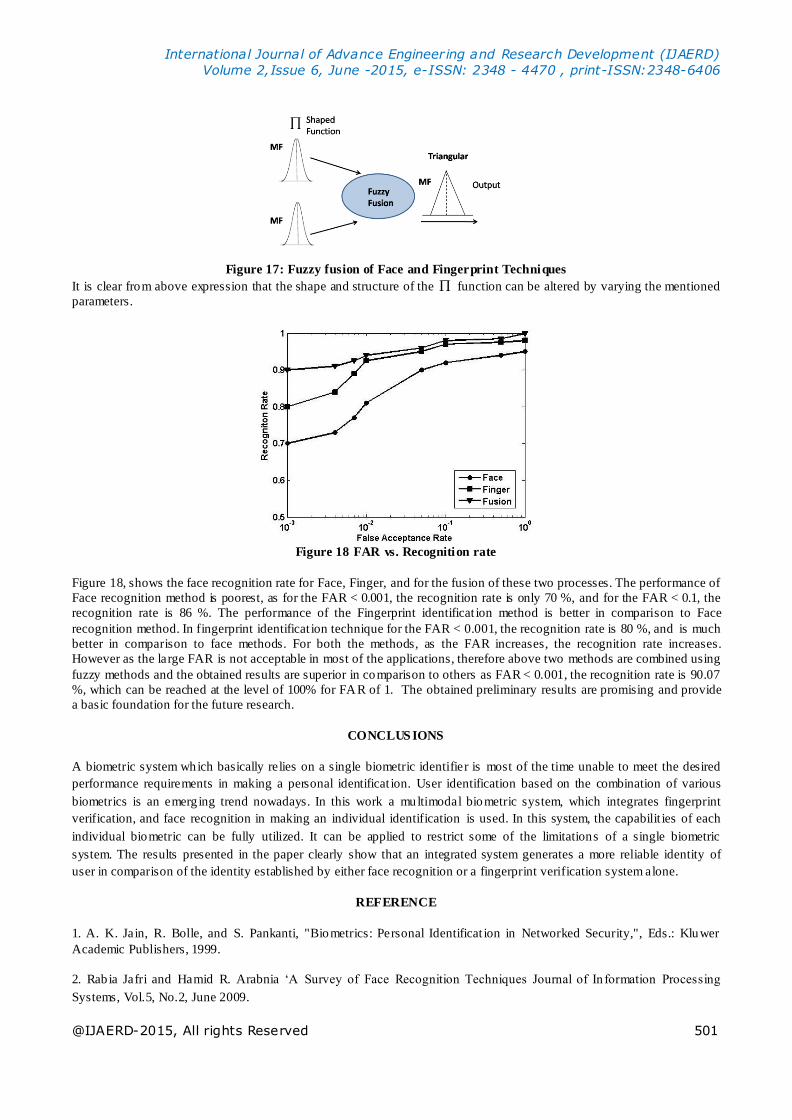
Figure 17: Fuzzy fusion of Face and Fingerprint Techniques
It is clear from above expression that the shape and structure of the function can be altered by varying the mentioned
parameters.
Figure 18 FAR vs. Recognition rate
Figure 18, shows the face recognition rate for Face, Finger, and for the fusion of these two processes. The performance of
Face recognition method is poorest, as for the FAR < 0.001, the recognition rate is only 70 %, and for the FAR < 0.1, the
recognition rate is 86 %. The performance of the Fingerprint identificat ion method is better in comparison to Face
recognition method. In fingerprint identificat ion technique for the FAR < 0.001, the recognition rate is 80 %, and is much
better in comparison to face methods. For both the methods, as the FAR increases, the recognition rate increases.
However as the large FAR is not acceptable in most of the applications, therefore above two methods are combined using
fuzzy methods and the obtained results are superior in comparison to others as FAR < 0.001, the recognition rate is 90.07
%, which can be reached at the level of 100% for FAR of 1. The obtained preliminary results are promising and provide
a basic foundation for the future research.
CONCLUS IONS
A biometric system which basically relies on a single biometric identifier is most of the time unable to meet the desired
performance requirements in making a personal identificat ion. User identification based on the combination of various
biometrics is an emerg ing trend nowadays. In this work a multimodal biometric system, which integrates fingerprint
verification, and face recognition in making an individual identification is used. In this system, the capabilit ies of each
individual biometric can be fully utilized. It can be applied to restrict some of the limitations of a single biometric
system. The results presented in the paper clearly show that an integrated system generates a more reliable identity of
user in comparison of the identity established by either face recognition or a fingerprint verification system alone.
REFERENCE
1. A. K. Jain, R. Bolle, and S. Pankanti, "Biometrics: Personal Identificat ion in Networked Security,", Eds.: Kluwer
Academic Publishers, 1999.
2. Rab ia Jafri and Hamid R. Arabnia ‗A Survey of Face Recognition Techniques Journal of In formation Processing
Systems, Vol.5, No.2, June 2009.

International Journal of Advance Engineering and Research Development (IJAERD)
Volume 2,Issue 6, June -2015, e-ISSN: 2348 - 4470 , print-ISSN:2348-6406
@IJAERD-2015, All rights Reserved 502
3. M. Turk and A. Pentland," Eigenfaces for recognition, "J. Cognitive Neuroscience, Vol. 3, 71-86., 1991.
4. Delac, K.; Grgic, M. & Grgic, S. (2006). Independent Comparat ive Study of PCA, ICA, and LDA on the FERET Data
Set, International Journal of Imaging Systems and Technology , Vol. 15, No. 5, 2006, pp. 252-260
5. Beveridge, J.R.; She, K.; Draper, B.A. & Givens, G.H. (2001). A Nonparametric Stat istical Comparison of Principal
Component and Linear Discriminant Subspaces for Face Recognition, Proc. of the IEEE Conference on Computer
6. P. N. Bellhumer, J. Hespanha, and D. Kriegman, ―Eigenfaces vs. fisherfaces: Recognition using class specific
linear projection,‖ IEEE Trans. Pattern Anal. Mach. Intell., vol. 17, no. 7, pp. 711–720, 1997.
7. Zhong Wei-Bo, Ning Xin-Bao and Wei Chen-Jian, ―A Fingerprint Matching Algorithm Based on Relat ive Topological
Relationship Among Minutiae,‖ IEEE International Conference on Neural Networks and Signal Processing, 2008, pp.
225-228.
8. Jiong Zang, Jie Yuan, Fei Shi and Si-dan Du, ―A Fingerprint Matching Algorithm of Minutiae Based on Local
Characteristic,‖ Fourth International Conference on Natural Computation, 2008, pp. 13-17.
9. Xuzhou Li and Fei Yu, ―A New Fingerprint Matching Algorithm Based on Minutiae,‖ Proceedings of International
Council of Chemical Trade Associations, 2009, pp. 869-873.
10. G. Riley, Expert Systems – Princip le and programming (Pws-Kent, Boston, 1981),1-59.