Embed Size (px)
Citation preview
IEEE 802.3aq Portland July 2004
Multimode Fiber Communication System Simulation
Gary Shaulov, Brent K. Whitlock
RSoft Design Group, Inc.200 Executive Blvd.Ossining, NY 10562
[email protected], 914-923-2164
IEEE 802.3aq Portland July 20042
Introduction• TIA standards development for laser optimized multimode fiber (TIA/EIA-
492AAAC) required new modeling and simulation approaches. RSoft participated in TIA working group on modal dependence of multimode fiber bandwidth since 2001 and developed tools to address TIA needs
• These tools have been validated and are now used by industry
• RSoft Design Group is participating in IEEE 802.3aq 10GBASE-LRM Task Force to help Ethernet community with developing new standards and to better understand the current industry needs and requirements
• Our objective is to use our multimode fiber simulator to address Channel Modeling ad-hoc discussion topics such as fiber modeling, studying launch conditions, time-varying effects, reproducing of and comparison with Cambridge model and Monte-Carlo model results.
• Here we present some results of our initial studies
• This work has been supported by a Navy SBIR contract (through GairBrown of the Naval Surface Warfare Center) and a NIST ATP contract (through the PCAD Consortium)
IEEE 802.3aq Portland July 20043
Requirements for Multimode Simulation• Model and simulate spatial characteristics of multimode fiber
– Modal and chromatic dispersion– Differential Mode Delay (DMD)– Mode coupling coefficients, mode power distribution (MPD)– Polarization
• Model modal fields of multimode components. Laser output beams can be modeled with different mode compositions to provide single-mode, restricted-mode, or overfilled launch with Gaussian, LG, HG, LP, donut spatial profiles, or any of their combinations
• Model a coupler/connector with 3D coupling into and out from fiber– x, y, z offsets, angular offsets, plus polarization
• Model and simulate encircled flux (EF)• Model and simulate effective modal bandwidth (EMB)• System simulation to also flexibly and accurately model other system
components including lasers and receivers taking transient behavior, nonlinearities, and noise into account
• Take temporal and modal characteristics into account for total system simulation performance including signal to noise ratio, BER, signal waveforms, eye diagrams, power penalties, etc.
IEEE 802.3aq Portland July 20044
Multimode Fiber Model – Our Approach
( ) ( ) ( ) ( ) 012
2222
2
2=
−β−++ rErLkrn
drrdE
rdrrEd
LMo
( ) ( ) )exp()exp(,, zjjLrEzrE βφφ ⋅⋅=
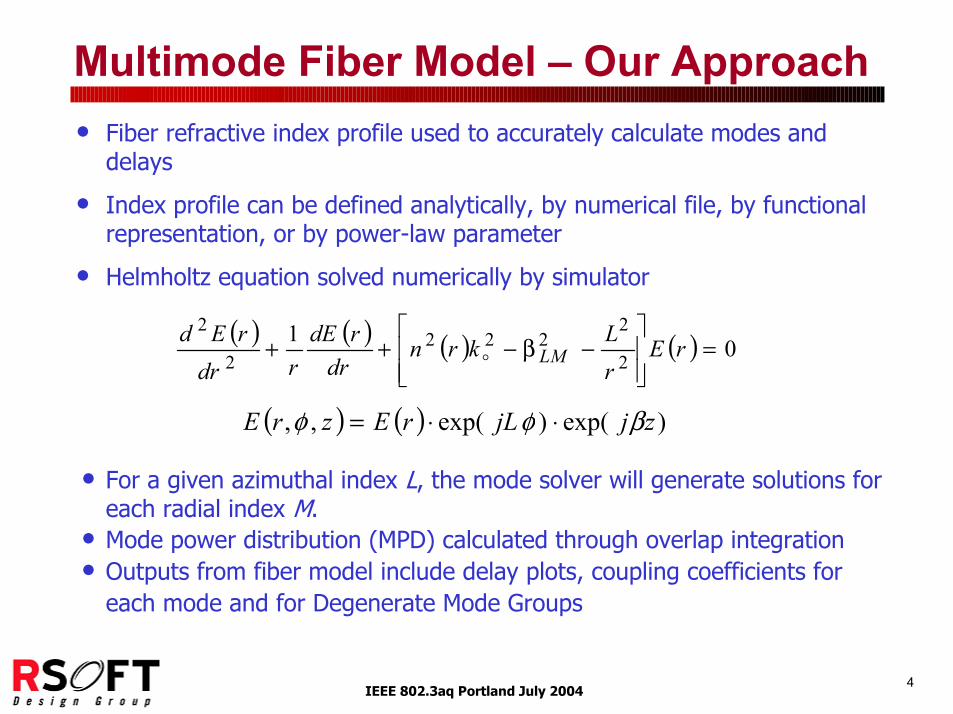
• Fiber refractive index profile used to accurately calculate modes and delays
• Index profile can be defined analytically, by numerical file, by functional representation, or by power-law parameter
• Helmholtz equation solved numerically by simulator
• For a given azimuthal index L, the mode solver will generate solutions for each radial index M.
• Mode power distribution (MPD) calculated through overlap integration• Outputs from fiber model include delay plots, coupling coefficients for
each mode and for Degenerate Mode Groups
IEEE 802.3aq Portland July 20045
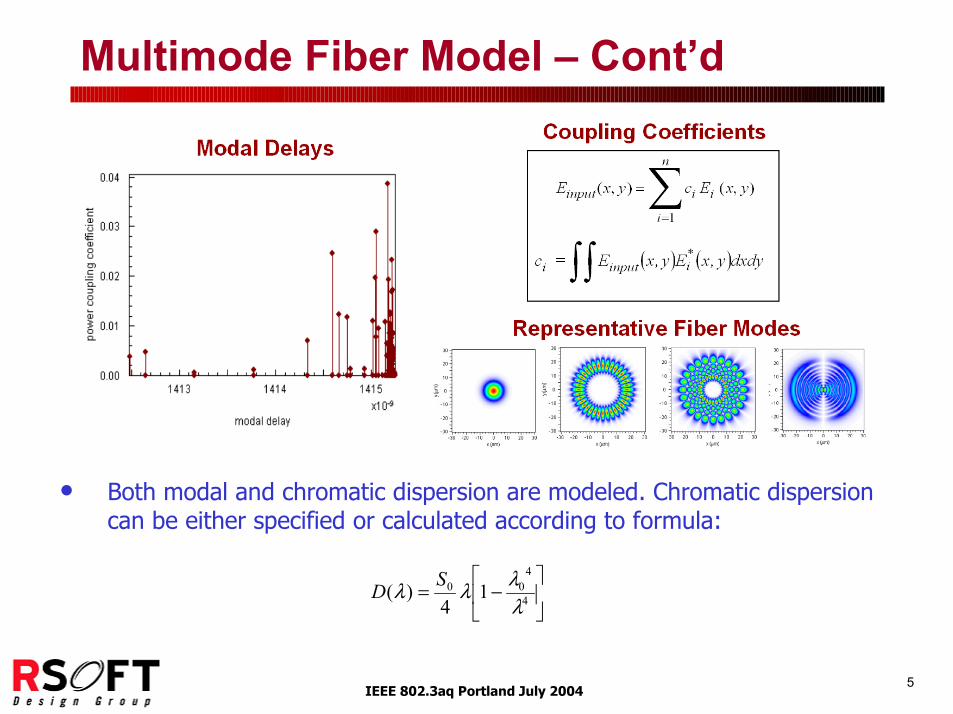
Multimode Fiber Model – Cont’d
• Both modal and chromatic dispersion are modeled. Chromatic dispersion can be either specified or calculated according to formula:
−= 4
400 1
4)(
λλλλ SD
IEEE 802.3aq Portland July 20046
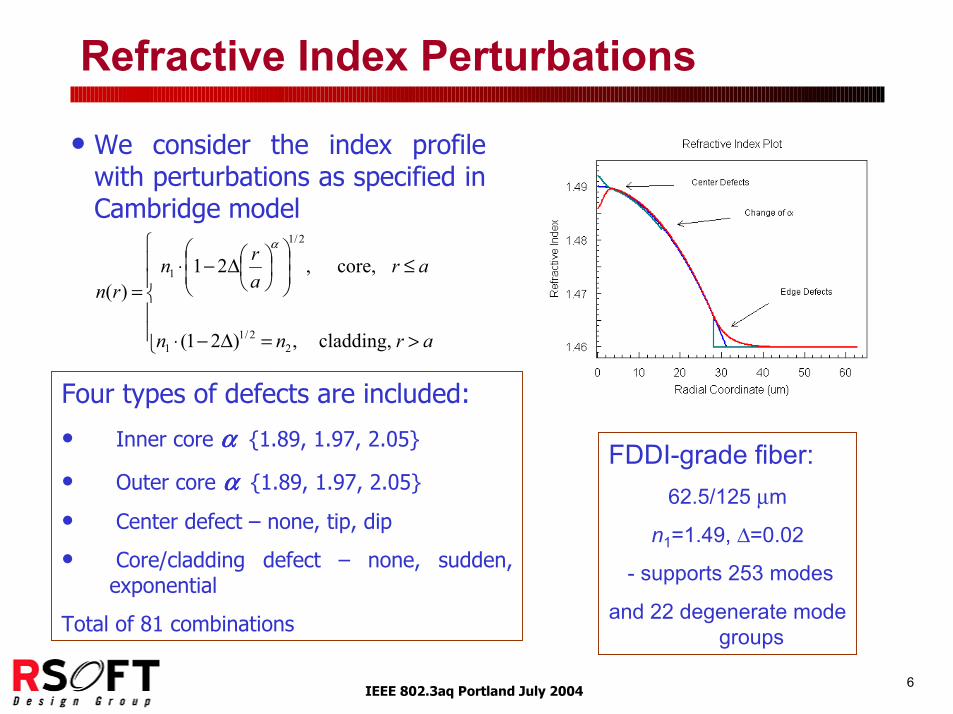
Refractive Index Perturbations
• We consider the index profile with perturbations as specified in Cambridge model
Four types of defects are included:
• Inner core αααα {1.89, 1.97, 2.05}
• Outer core αααα {1.89, 1.97, 2.05}
• Center defect – none, tip, dip
• Core/cladding defect – none, sudden, exponential
Total of 81 combinations
cladding, ,)21(
core, ,21)(
22/1
1
2/1
1
>=∆−⋅
≤
∆−⋅
=
arnn
ararn
rn
α
FDDI-grade fiber:62.5/125 µm
n1=1.49, ∆=0.02
- supports 253 modes
and 22 degenerate mode groups
IEEE 802.3aq Portland July 20047
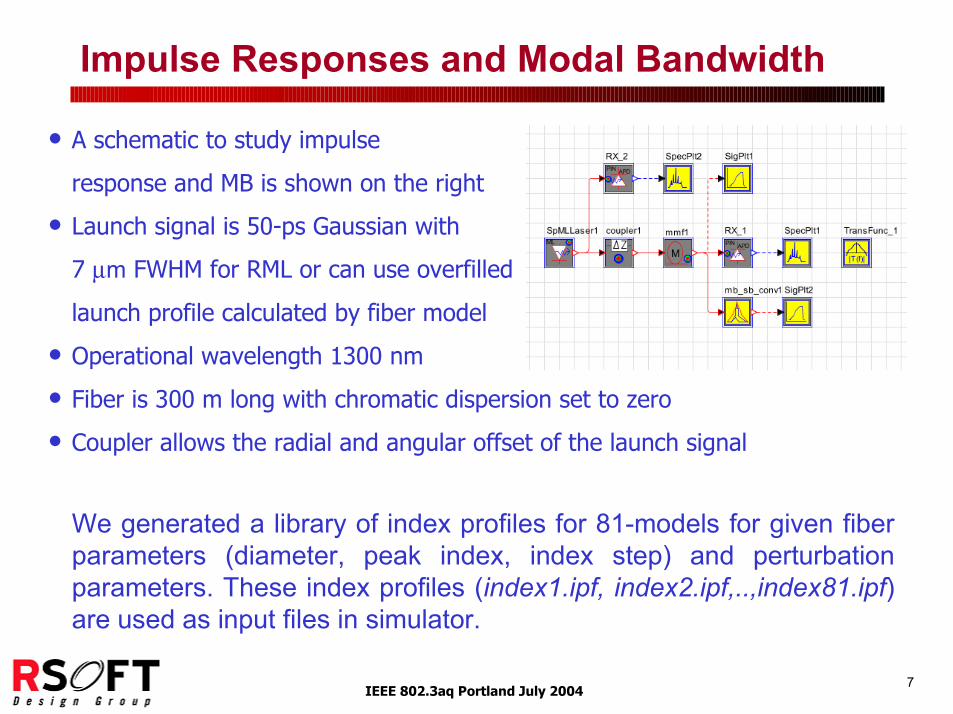
Impulse Responses and Modal Bandwidth
• A schematic to study impulse
response and MB is shown on the right
• Launch signal is 50-ps Gaussian with
7 µm FWHM for RML or can use overfilled
launch profile calculated by fiber model
• Operational wavelength 1300 nm
• Fiber is 300 m long with chromatic dispersion set to zero
• Coupler allows the radial and angular offset of the launch signal
We generated a library of index profiles for 81-models for given fiber parameters (diameter, peak index, index step) and perturbation parameters. These index profiles (index1.ipf, index2.ipf,..,index81.ipf) are used as input files in simulator.
IEEE 802.3aq Portland July 20048
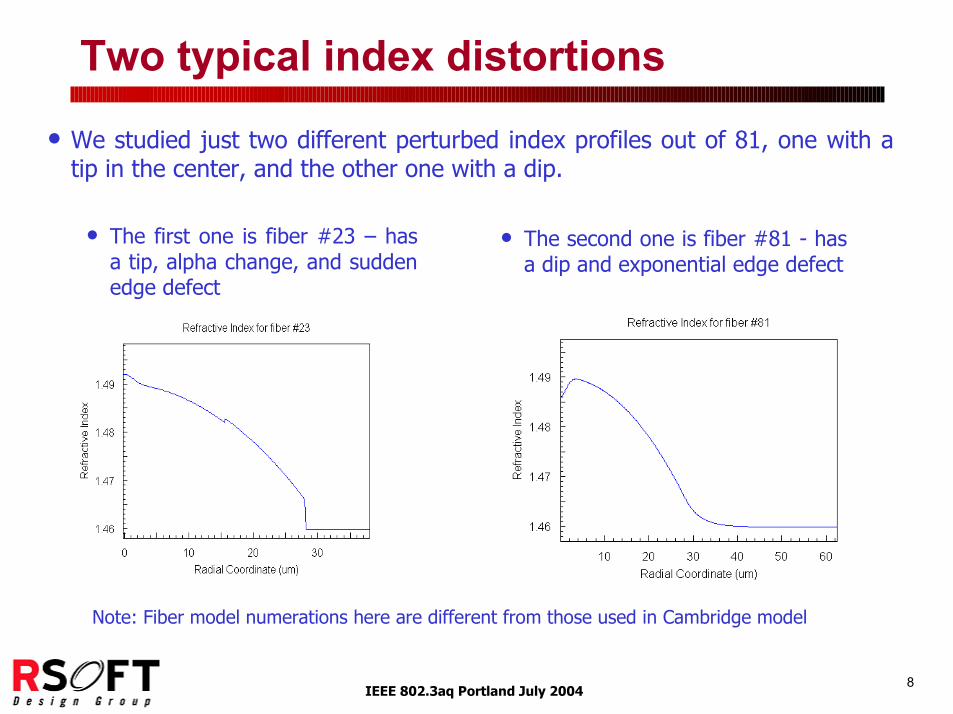
Two typical index distortions
• We studied just two different perturbed index profiles out of 81, one with a tip in the center, and the other one with a dip.
• The first one is fiber #23 – has a tip, alpha change, and sudden edge defect
• The second one is fiber #81 - has a dip and exponential edge defect
Note: Fiber model numerations here are different from those used in Cambridge model
IEEE 802.3aq Portland July 20049
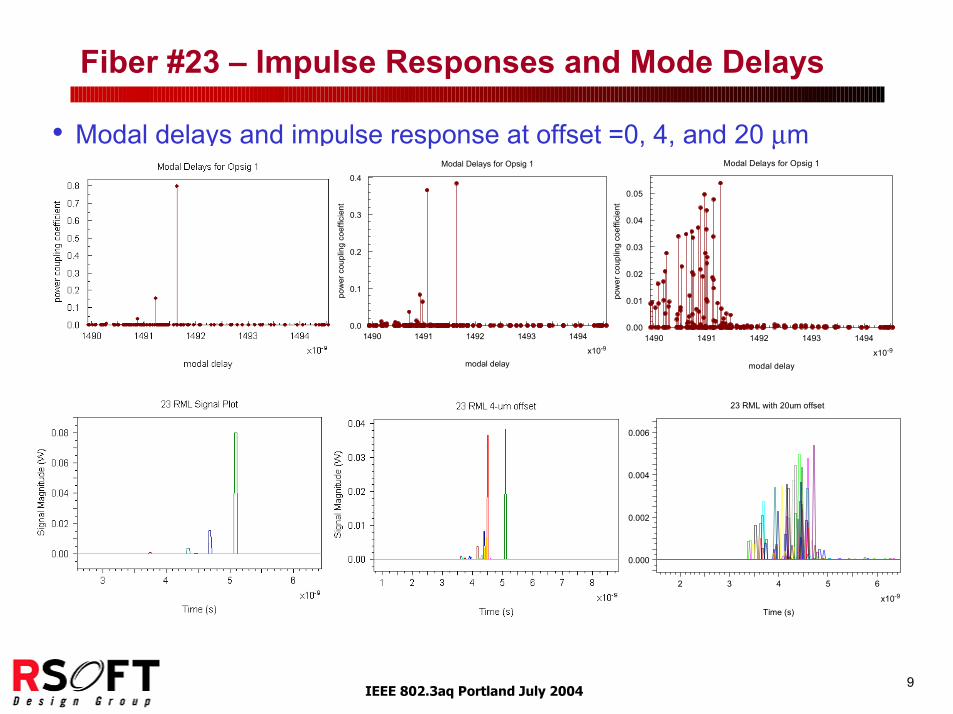
Fiber #23 – Impulse Responses and Mode Delays
• Modal delays and impulse response at offset =0, 4, and 20 µmModal Delays for Opsig 1
x10-9
modal delay
1490 1491 1492 1493 1494
pow
er c
oupl
ing
coef
ficie
nt
0.00
0.01
0.02
0.03
0.04
0.05
23 RML with 20um offset
x10-9
Time (s)
2 3 4 5 6
Sig
nal M
agni
tude
(W)
0.000
0.002
0.004
0.006
Modal Delays for Opsig 1
x10-9
modal delay
1490 1491 1492 1493 1494po
wer
cou
plin
g co
effic
ient
0.0
0.1
0.2
0.3
0.4
IEEE 802.3aq Portland July 200410
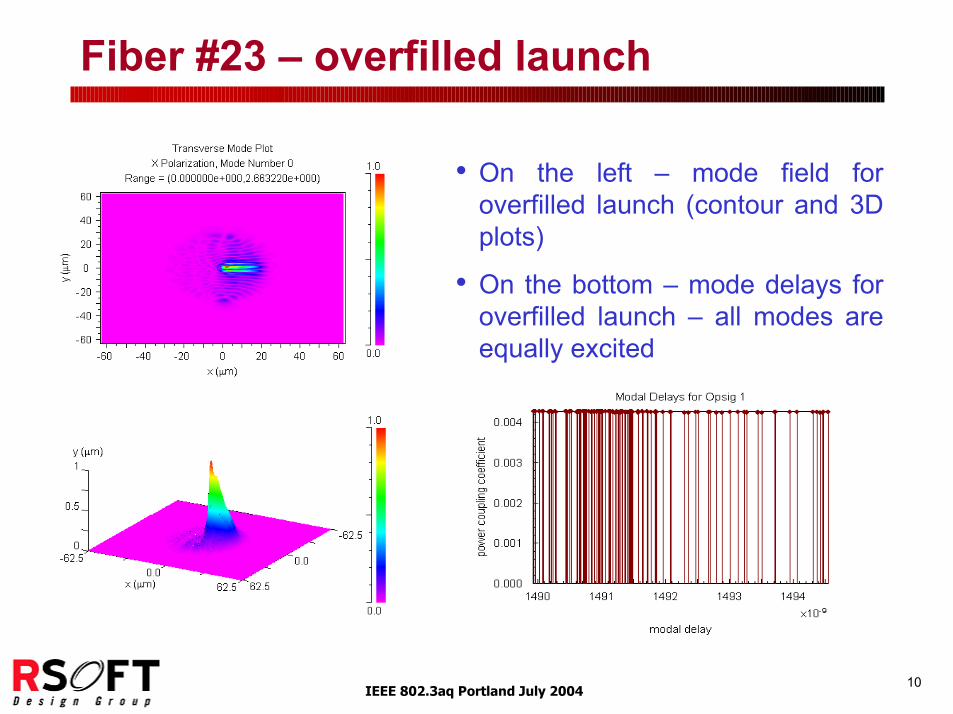
Fiber #23 – overfilled launch
• On the left – mode field for overfilled launch (contour and 3D plots)
• On the bottom – mode delays for overfilled launch – all modes are equally excited
IEEE 802.3aq Portland July 200411
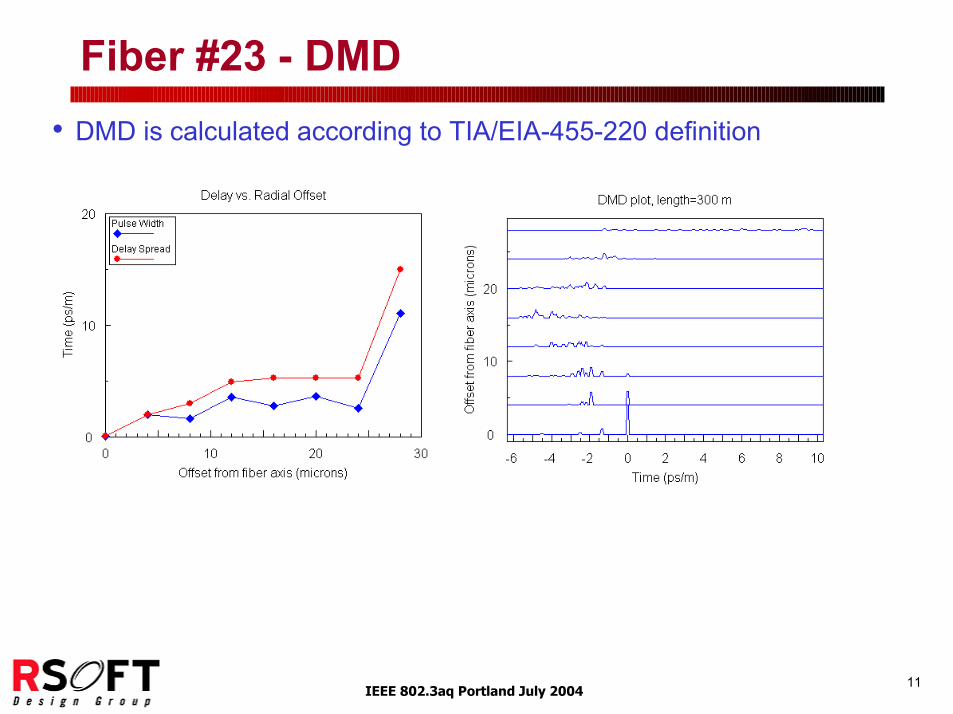
Fiber #23 - DMD• DMD is calculated according to TIA/EIA-455-220 definition
IEEE 802.3aq Portland July 200412
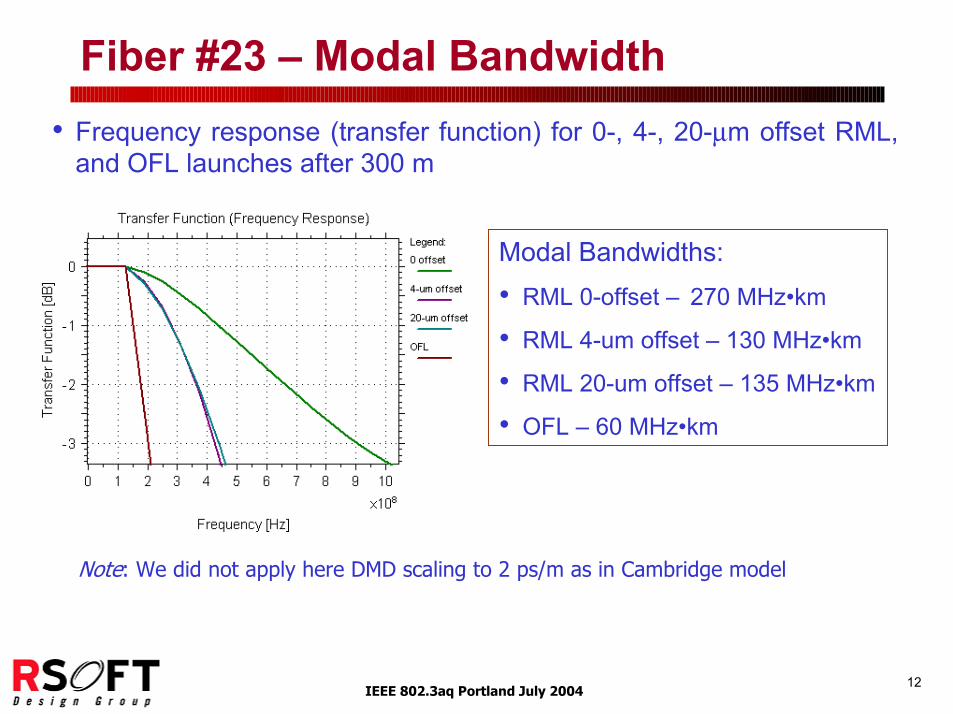
Fiber #23 – Modal Bandwidth• Frequency response (transfer function) for 0-, 4-, 20-µm offset RML,
and OFL launches after 300 m
Modal Bandwidths:• RML 0-offset – 270 MHz•km
• RML 4-um offset – 130 MHz•km
• RML 20-um offset – 135 MHz•km
• OFL – 60 MHz•km
Note: We did not apply here DMD scaling to 2 ps/m as in Cambridge model
IEEE 802.3aq Portland July 200413
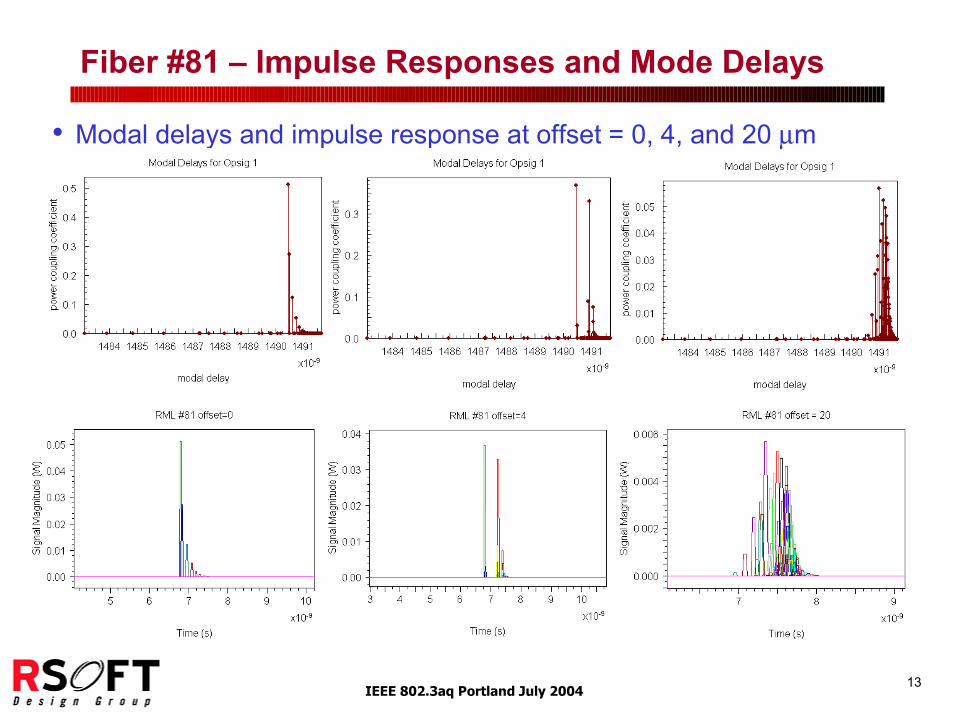
Fiber #81 – Impulse Responses and Mode Delays
• Modal delays and impulse response at offset = 0, 4, and 20 µm
IEEE 802.3aq Portland July 200414
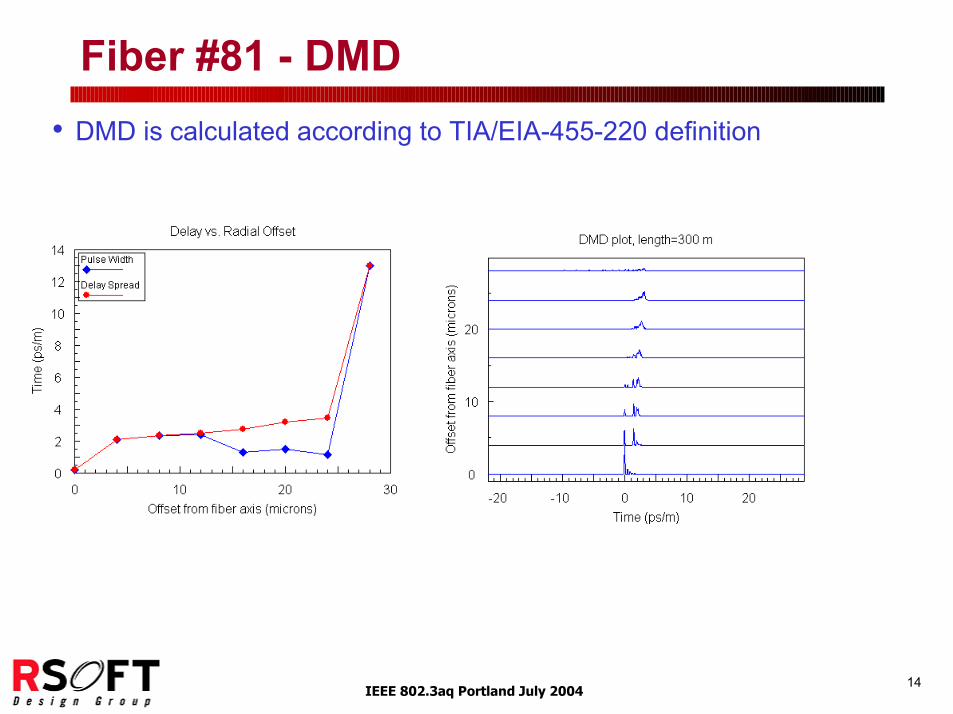
Fiber #81 - DMD• DMD is calculated according to TIA/EIA-455-220 definition
IEEE 802.3aq Portland July 200415
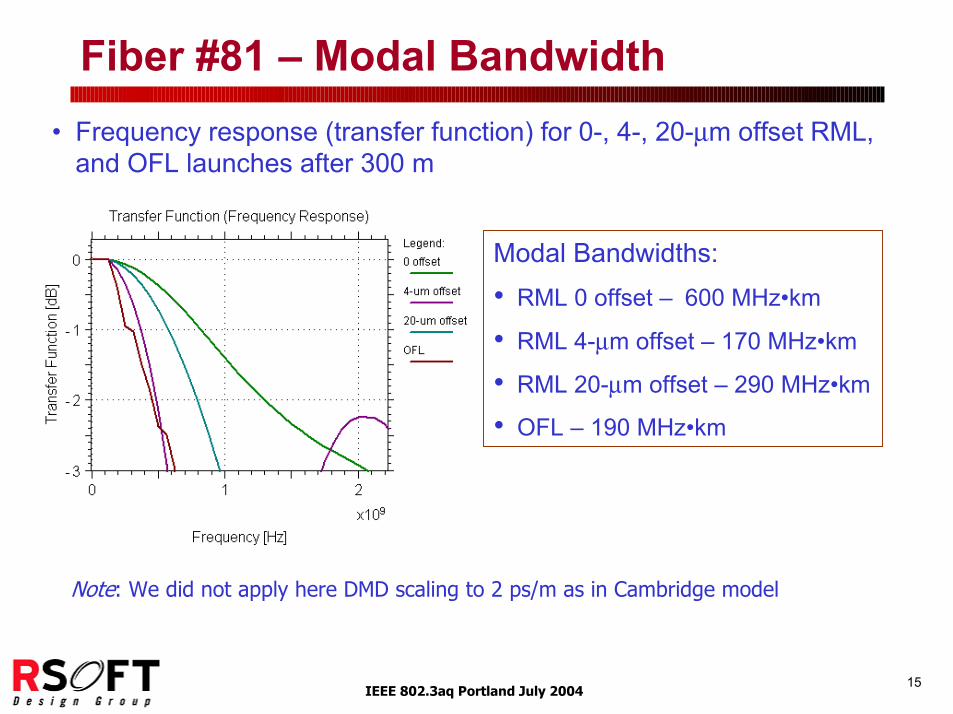
Fiber #81 – Modal Bandwidth• Frequency response (transfer function) for 0-, 4-, 20-µm offset RML,
and OFL launches after 300 m
Modal Bandwidths:• RML 0 offset – 600 MHz•km
• RML 4-µm offset – 170 MHz•km
• RML 20-µm offset – 290 MHz•km
• OFL – 190 MHz•km
Note: We did not apply here DMD scaling to 2 ps/m as in Cambridge model
IEEE 802.3aq Portland July 200416
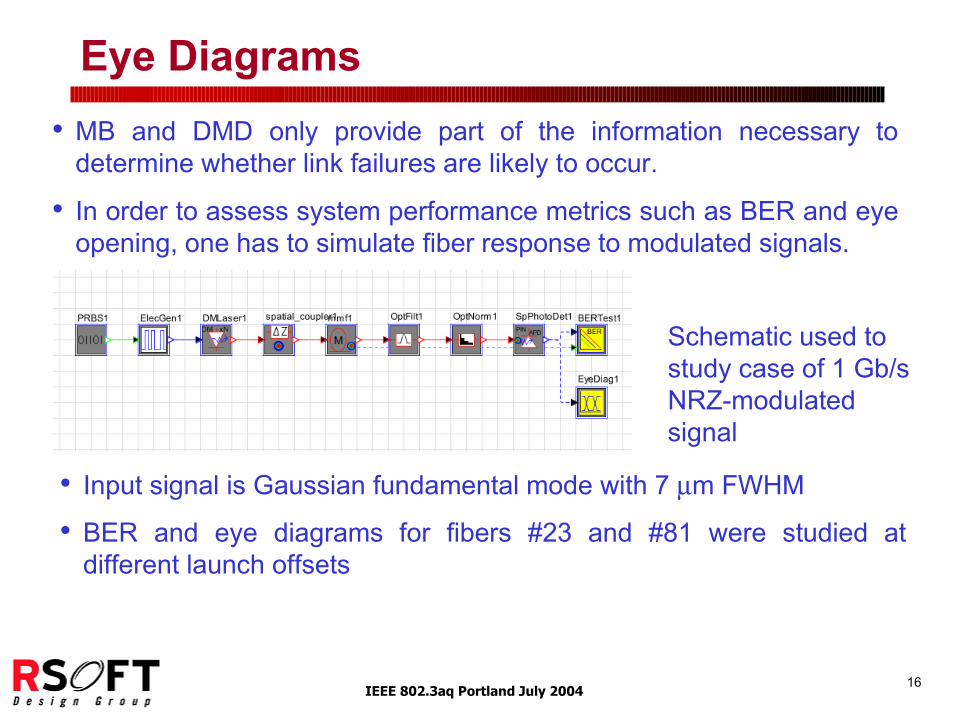
Eye Diagrams• MB and DMD only provide part of the information necessary to
determine whether link failures are likely to occur.
• In order to assess system performance metrics such as BER and eye opening, one has to simulate fiber response to modulated signals.
• Input signal is Gaussian fundamental mode with 7 µm FWHM
• BER and eye diagrams for fibers #23 and #81 were studied at different launch offsets
Schematic used to study case of 1 Gb/s NRZ-modulated signal
IEEE 802.3aq Portland July 200417
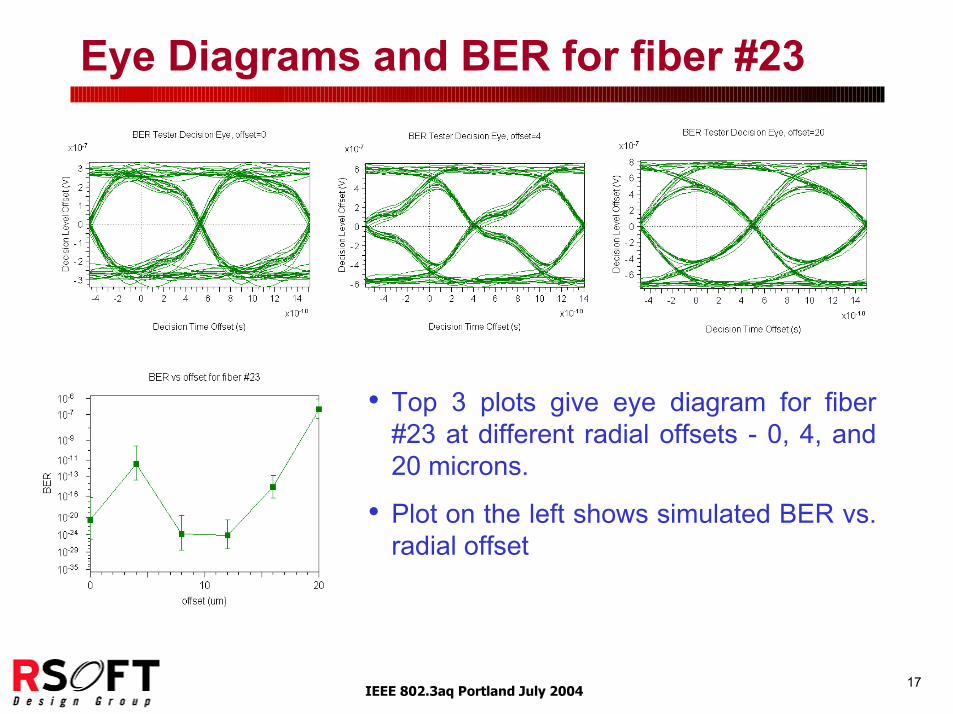
Eye Diagrams and BER for fiber #23
• Top 3 plots give eye diagram for fiber #23 at different radial offsets - 0, 4, and 20 microns.
• Plot on the left shows simulated BER vs. radial offset
IEEE 802.3aq Portland July 200418
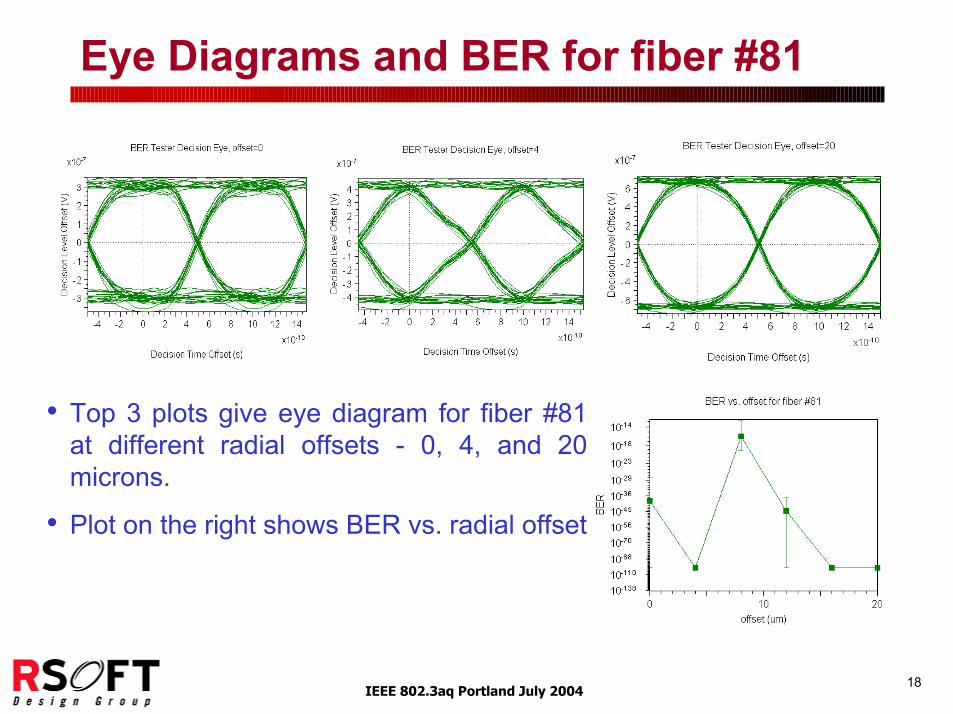
Eye Diagrams and BER for fiber #81
• Top 3 plots give eye diagram for fiber #81 at different radial offsets - 0, 4, and 20 microns.
• Plot on the right shows BER vs. radial offset
IEEE 802.3aq Portland July 200419
Summary
We demonstrated simulation results based on index profiles corresponding to the Cambridge model
• Simulations can take into account time-varying channel responses
• Further simulation studies can be performed by varying system and component parameters to study their impact on performance:
• Chromatic dispersion
• Fiber length
• Radial/angular offset launch conditions, launched modal field, beam width, etc.
• Launched temporal waveform / pulse shape
• Variations/perturbations on fiber index profiles
IEEE 802.3aq Portland July 200420
Selected References• B. K. Whitlock, E. Ghillino, J. Morikuni, P. Mena, R. Scarmozzino, "Mixed-Level and Mixed-Domain Modeling and Simulation for Optical Interconnect Design," 2004 Digest of the LEOS Summer Topical Meetings, paper MB 1.4, June 28, 2004.• J. Morikuni, E. Heller, P. Mena, B. K. Whitlock, and R. Scarmozzino, "A New Multimode Fiber Model for Optical Data Communication System Analysis," 2003 IEEE/LEOS Annual Meeting Conference Proceedings, paper MO3, Tucson, Arizona, October 27, 2003.• J. Morikuni, P. Mena, B. K. Whitlock, and R. Scarmozzino, "Multimode System Simulation as an Alternative to Spreadsheet Analysis for the Study of Gb/s Optical Communication Systems," 2003 IEEE/LEOS Annual Meeting Conference Proceedings, paper MO4, Tucson, Arizona, October 27, 2003.• J. Morikuni, P. Mena, B. K. Whitlock, and R. Scarmozzino, "Link-Level Design, Analysis, and Simulation of Multimode Data Communication Systems," 19th Annual National Fiber Optic Engineers Conference (NFOEC) Technical Proceedings, pp. 858-867, Orlando, FL, Sep. 10, 2003.• B. K. Whitlock, J. Morikuni, P. Mena, and R. Scarmozzino, "Recent Advances in Modeling and Simulation of Multimode Optical Links," 14th Annual IEEE Workshop on Interconnections Within High Speed Digital Systems, Paper MB2, Santa Fe, NM, May 5, 2003.• J. Morikuni, P. Mena, B. K. Whitlock, and R. Scarmozzino, "Simulation-Based Prediction of Multimode Fiber Bandwidth for 10 Gb/s Systems," 2002 IEEE/LEOS Annual Meeting Conference Proceedings, paper WEE1, pp. 604-605, Glasgow, Scotland, November 13, 2002.• J. Morikuni, P. Mena, B. K. Whitlock, and R. Scarmozzino, "Simulation of Modal Delays for 10 Gb/s Multimode Fiber Applications," 2002 IEEE/LEOS Annual Meeting Conference Proceedings, paper ThDD4, pp. 903-904, Glasgow, Scotland, November 14, 2002.• J. Morikuni, P. Mena, B. K. Whitlock, and R. Scarmozzino, "Measurement requirements for optical and optoelectronic model verification, validation, and calibration," Technical Digest: Symposium on Optical Fiber Measurements, 2002, NIST Special Publication 988, Boulder, Colorado, September 25, 2002.• B. K. Whitlock, "Simulation Tools for Fiber Optic Link Design," SAE Avionics System Division Meeting, Tempe, Arizona, Oct. 15, 2002.• J. Morikuni, B. Whitlock, P. Mena, and R. Scarmozzino, "Modeling and Simulation of Multimode Optical Fibers and Systems," Telecommunication Industry Association (TIA) Plenary Meeting, Kiawah Island, South Carolina, June 2002.
Most available at http://www.rsoftdesign.com/products/system_simulation/ModeSYS/publications.cfm