Embed Size (px)
Citation preview

Multinational Comparisons of Health Systems Data, 2014
Chloe Anderson The Commonwealth Fund
November 2014

2
Health Care Spending

0
1000
2000
3000
4000
5000
6000
7000
8000
9000
1980 1984 1988 1992 1996 2000 2004 2008 2012
US ($8,745)
NOR ($6,140)
SWIZ ($6,080)
NETH ($5,219)*
GER ($4,811)
DEN ($4,698)
CAN ($4,602)
FR ($4,288)
SWE ($4,106)
AUS ($3,997)*
JPN ($3,649)
UK ($3,289)
NZ ($3,172)*
Source: OECD Health Data 2014.
Average Health Care Spending per Capita, 1980–2012 Adjusted for Differences in Cost of Living
3
Dollars ($US)
* 2011.

0
2
4
6
8
10
12
14
16
18
1980 1983 1986 1989 1992 1995 1998 2001 2004 2007 2010
US (16.9%)
NETH (12.1%)*
FR (11.6%)
SWIZ (11.4%)
GER (11.3%)
DEN (11.0%)
CAN (10.9%)
JPN (10.3%)
NZ (10.0%)*
SWE (9.6%)
NOR (9.3%)
UK (9.3%)
AUS (9.1%)*
GDP refers to gross domestic product. Source: OECD Health Data 2014.
Health Care Spending as a Percentage of GDP, 1980–2012
Percent
* 2011.
4

5 Health Care Spending per Capita by Source of Funding, 2012 Adjusted for Differences in Cost of Living
4,160 4,001 3,691 4,029 3,224 3,317 3,336
2,733 2,762 2,623
3,540
497 493 85
688 651 92 533 230 202
1,045
1,582
627 584 690 320 678 731
297 347
0
1,000
2,000
3,000
4,000
5,000
6,000
7,000
8,000
9,000
US SWIZ GER DEN CAN FR SWE AUS* UK NZ*
Out-of-pocket spendingPrivate spendingPublic spending
* 2011.
Dollars ($US)
Source: OECD Health Data 2014.
8,745
6,080
4,811 4,698 4,602 4,288 4,106 3,997
3,289 3,172

Spending per Hospital Discharge, 2012 Adjusted for Differences in Cost of Living
5,586 7,147
8,434 8,785 9,346 9,975 11,363 11,472
13,540 14,832
15,754
20,932
0
4,000
8,000
12,000
16,000
20,000
24,000
GER OECDMedian
NZ* FR AUS* SWE** NOR** DEN** SWIZ NETH CAN* US**
Dollars ($US)
6
* 2011. ** 2010. Source: OECD Health Data 2014.

7 Pharmaceutical Spending per Capita, 2012 Adjusted for Differences in Cost of Living
295 297
414 450 478 512 562 588
651 668 718
771
1,010
0
100
200
300
400
500
600
700
800
900
1,000
1,100
DEN NZ* NOR NETH SWE OECDMedian
SWIZ AUS* FR GER JPN* CAN* US
* 2011. Source: OECD Health Data 2014.
Dollars ($US)

36 54 60 77 98 127 147
200 249 250 267
631
0
100
200
300
400
500
600
700
NOR JPN* SWE AUS* DEN NZ* CAN* NETH GER FR SWIZ US
Spending on Health Insurance Administration per Capita, 2012 Adjusted for Differences in Cost of Living
Source: OECD Health Data 2014.
Dollars ($US)
* 2011.
8

9
Health Care Supply and Utilization

Number of Practicing Physicians per 1,000 Population, 2012
4.2 4.0 3.9 3.9
3.3 3.1 3.1
2.8 2.7 2.5 2.5 2.3
0
1
2
3
4
5
NOR GER SWE* SWIZ AUS OECDMedian
FR UK NZ CAN US* JPN
Source: OECD Health Data 2014.
10
* 2011.

11 Magnetic Resonance Imaging (MRI) Machines per Million Population, 2012
46.9
34.5
15.0 11.8 11.1
8.8 8.7 6.8
0
10
20
30
40
50
JPN* US AUS NETH NZ CAN FR UK
* 2011. Source: OECD Health Data 2014.

Hospital Discharges per 1,000 Population, 2012
83
111 119 125 142 148
163 163 166 168 172 173 175
251
0
50
100
150
200
250
300
CAN* JPN* NETH US** UK* NZ SWE** OECDMedian
SWIZ FR DEN** AUS* NOR** GER
* 2011. ** 2010. Source: OECD Health Data 2014.
12

13 Average Annual Number of Physician Visits per Capita, 2012
13.0
9.7
7.9 6.9 6.7 6.7
6.2
4.7 4.4 4.0 3.7
0
2
4
6
8
10
12
14
JPN* GER CAN* AUS FR OECDMedian
NETH DEN NOR US** NZ
* 2011. ** 2010. Source: OECD Health Data 2014.

14 Hip Replacement Inpatient Cases per 100,000 Population, 2012
130.0 144.6
171.9 176.9 203.5
215.7 223.1 230.3 236.9 250.0
287.3 307.0
0
50
100
150
200
250
300
350
CAN* NZ*** OECDMedian
UK*** US** NETH** DEN FR SWE NOR GER SWIZ
* 2011. ** 2010. *** Data from publicly-funded hospitals only. Source: OECD Health Data 2014.

15
Health Promotion and Disease Prevention

Cervical Cancer Screening Rates, 2012
85.0 78.3 77.2 75.9 73.4 71.1
64.9 64.2 57.3
37.7
0
20
40
60
80
100
US* UK NZ NOR CAN FR* NETH DEN AUS JPN*
Percent of women screened
Note: UK, NZ, NOR, DEN, and AUS based on program data; all other countries based on survey data. * 2010. Source: OECD Health Data 2014.
16

Flu Immunization Among Adults Age 65 or Older, 2012
75.5
66.9 64.3 64.1
53.1 51.6 50.0 46.0 43.1
11.4
0
20
40
60
80
100
UK US* NZ CAN FR OECDMedian
JPN SWIZ** DEN NOR
Percent
* 2011. ** 2010. Source: OECD Health Data 2014.
17
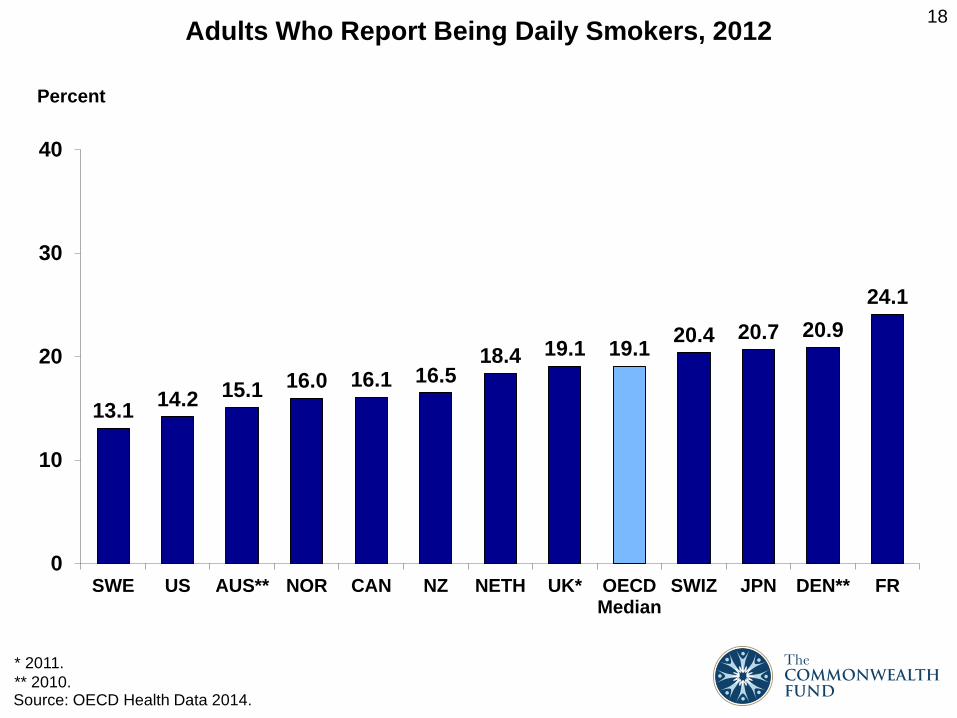
18 Adults Who Report Being Daily Smokers, 2012
13.1 14.2 15.1 16.0 16.1 16.5 18.4 19.1 19.1 20.4 20.7 20.9
24.1
0
10
20
30
40
SWE US AUS** NOR CAN NZ NETH UK* OECDMedian
SWIZ JPN DEN** FR
Percent
Source: OECD Health Data 2014.
* 2011. ** 2010.

19
Quality and Patient Safety

Mortality Amenable to Health Care
Deaths per 100,000 population*
* Countries’ age-standardized death rates before age 75; including ischemic heart disease, diabetes, stroke, and bacterial infections. Analysis of World Health Organization mortality files and CDC mortality data for U.S. Source: Adapted from E. Nolte and M. McKee, “Variations in Amenable Mortality—Trends in 16 High-Income Nations,” Health Policy, published online Sept. 12, 2011.
20

Breast Cancer Five-Year Relative Survival Rate, 2007–2012 (or nearest period)
88.7 87.7 87.7 87.4 87.3 86.4 86.1 85.9 85.0 82.0 82.0
0
20
40
60
80
100
US AUS CAN SWE JPN NZ NOR NETH GER DEN UK
Source: OECD Health Data 2014.
Percent
21
Note: UK and SWE data are from 2007–2012; NZ, NOR, NET, and DEN data are from 2006–2011; AUS data are from 2005–2010; US and GER data are from 2004–2009; CAN data are from 2003–2008; JPN data are from 2000–2005.

* 2012. ** 2010. *** 2009. Source: OECD Health Data 2014.
3.3 4.6 5.1 6.7 7.1 7.1
8.7 9.0 10.0 13.5
17.1 18.4 19.2
0
10
20
30
40
SWE AUS* UK NZ FR SWIZ** NOR OECDMedian
CAN NETH** US** GER DEN***
Diabetes Lower Extremity Amputation Rates per 100,000 Population, 2011
22

23
Prices

Total Hospital and Physician Costs, 2013
4,995 5,177
6,645
9,845
13,910
0
2,000
4,000
6,000
8,000
10,000
12,000
14,000
16,000
NETH AUS NZ SWIZ US
Dollars ($US)
24
Appendectomy
15,742
36,509 40,368 42,130
75,345
0
10,000
20,000
30,000
40,000
50,000
60,000
70,000
80,000
NETH SWIZ NZ AUS US
Bypass Surgery
Notes: US refers to the commercial average. Appendectomy prices reflect a blend of inpatient and outpatient prices based on relative utilization in each setting. Source: International Federation of Health Plans, 2013 Comparative Price Report.
Dollars ($US)

Diagnostic Imaging Prices, 2013
138
350
461
1,005
1,145
0
200
400
600
800
1,000
1,200
1,400
SWIZ AUS NETH NZ US
Notes: US refers to the commercial average. MRI refers to magnetic resonance imaging; CT refers to computed tomography. Source: International Federation of Health Plans, 2013 Comparative Price Report.
25
MRI
97
279
432 500
731
896
0
200
400
600
800
1,000
CAN NETH SWIZ AUS NZ US
CT Scan (abdomen) Dollars ($US) Dollars ($US)
26
Long-Term Care and Social Supports

Source: OECD Health Data 2014.
13.7 13.8 14.2 14.9 15.3 16.2 16.5 16.7 17.1 17.3 17.3 18.7
21.0
24.1
0
10
20
30
US NZ AUS CAN NOR NETH OECDMedian
UK SWIZ DEN FR SWE GER JPN
Percent of Population Age 65 or Older, 2012 27
Percent

* 2011. Source: OECD Health Data 2014.
72.2 68.5 65.5
59.0 56.8 54.3 52.0 51.6 51.1 48.7
40.2
25.0
0
10
20
30
40
50
60
70
80
SWE SWIZ NETH NZ FR NOR GER* OECDMedian
UK DEN* US* JPN
Beds in Residential Long-Term Care Facilities per 100,000 Population Age 65 or Older, 2012
28
Note: Long-term care facilities include nursing and residential care facilities that provide accommodation and long-term care services. The data used in this measure vary across countries—such as the inclusion of private institutions (in addition to public institutions), psychiatric hospital units, substance abuse treatment centers, and rehabilitation centers—and different countries may have different types or a different mix of facilities. Thus, caution is in order in interpreting cross-national differences.

Source: E. H. Bradley, L. A. Taylor, and H. V. Fineberg, The American Health Care Paradox: Why Spending More is Getting Us Less, Public Affairs, 2013.
Health and Social Care Spending Percent of GDP
12 12 11 11 12 16
9 8 9 10 9
21 21 20 18 15
9
16 15 11 10 11
0
10
20
30
40
FR SWE SWIZ GER NETH US NOR UK NZ CAN AUS
Health care Social care
Percent
29