Embed Size (px)
Citation preview

Multinational Production Data Set: Documentation
Natalia Ramondo∗ Andres Rodrıguez-Clare† Felix Tintelnot‡
UC-San Diego UC Berkeley and NBER U. of Chicago
January 9, 2015
1 Data Description
1.1 Data Sources
The construction of the MP database combines several sources of data. The main information source
is published and unpublished data by UNCTAD (the Investment and Enterprise Program, FDI Statis-
tics, FDI Country Profiles).1 The data on sales by affiliates of foreign firms include both local sales
and exports to any other country outside host country, including exports to the home country. Ad-
ditionally, the UNCTAD data include the number of local affiliates owned by foreign firms, as well
as their employment and asset value. Moreover, bilateral FDI flows and stocks from the Balance of
Payments are also included.
A foreign affiliate is defined as a firm who has more than ten percent of its shares owned by a
foreigner. Some countries report magnitudes for majority-owned affiliates only (more than 50 percent
of ownership). Nonetheless, majority-owned affiliates are the largest part of the total number of
foreign affiliates in a host economy. The data cover, for the most part, non-financial affiliates in all
sectors.2 Unfortunately, systematic data by industry or sector are not available. The data period
considered is 1996-2001. Since data availability varies by year and country we use an average of the
∗E-mail: [email protected]†E-mail: [email protected]‡E-mail: [email protected] data are available upon request at [email protected] few countries report data only for foreign affiliates in manufacturing. For consistency of our procedure across
countries, we treat these observations as missing observations.
1

variable of interest over those years.3
Table 1 shows, for selected countries, the source of information at the country level as well as the
characteristics of the data in terms of coverage, availability, criteria of ownership, for bilateral affiliate
sales and number of affiliates (inward and/or outward).4 All countries in our sample report bilateral
FDI stocks for the Balance of Payments to UNCTAD.
A country that reports multinational activity can present magnitudes for local affiliates of foreign
firms (inward), and foreign affiliates of local firms (outward), or both. Our criteria is that we first
choose the data as reported by the source (home) country; if this country does not report any data,
we choose as source of information the receiving (host) country. Our criteria reverses the one uses
for trade data, which gives priority to the data on trade flows as reported by the importer country.
One reason to reverse the criteria is that it is more likely that if statistics are not reported by
”Ultimate Beneficiary Owner” (UBO) in the receiving country, there would be misreporting of the
country of origin of such flow. Capturing it from the source country might attenuate this type of
problems with the data recording. For instance, suppose that the U.S. operations of a firm in France
are owned by a U.S. firm in Netherlands, which in turn depends directly from the parent in the
United States. If French statistics followed the UBO criteria (which, in fact, they do not), they would
correctly classify this subsidiary in France as American; if they did not follow the UBO criteria, they
would incorrectly classify this affiliate as Dutch, and hence, underreporting affiliate revenues from
the United States and over-reporting them from Netherlands . In turn, in the U.S. statistics, this
French affiliate will appear as French, not Dutch; moreover, in the Dutch statistics this firm, correctly,
will not appear as a Dutch multinational with affiliates in French. Hence, giving priority to the
statistics reported by the source country will attenuate these reporting problems.
There is an additional source of misreporting when the host, rather than the source, country is
considered. The revenues of affiliates from i in n reported by n may be subject to an underreporting
problem because the destination country n may report only revenue from local sales of the affiliates
as opposed to their revenues from sales to all countries. Unfortunately, the documentation provided
by UNCTAD, for each country, does not clearly indicate if the reported magnitudes refer to total or
only local sales. Our criteria tries to get around this underreporting problem.
All that said, we find that for MP on the aggregate the numbers would be almost identical if
3More recent years (2004) are available at UNCTAD for very few countries and variables; we chose not to include thosedata because they are very sparse.
4This is the group of countries for which UNCTAD lists the national statistical source.
2

priority were given to the information coming from the host country. In the original sample of 159
countries from UNCTAD, for the period 1990-2002, the average sales reported by the source is U$
13,009 million, while the same average when reported by the host country is U$ 12,770 million. The
correlation between the two series is 0.98, with no country below 0.90. For the sample period 1996-
2001 the averages are U$ 9,992 and U$ 9,651 million, respectively. Regarding the bilateral number
of affiliates, using as criteria records by the source first and by the host country second delivers
averages over the period 1990-2002 of 128, while the reverse criteria delivers 123 affiliates for the
average country-pair. The correlation between the two series is 0.94, with no country below 0.88.
Our second main source of data is the Thomson and Reuters Financial data set that records merg-
ers and acquisitions (M&A) across country pairs, for the period 1990-2010, in all sectors. To our
knowledge, this database is the most comprehensive description of domestic and international M&A.
Consistent with the UNCTAD data, we restrict the sample to the period 1990-2001, accumulating the
number of M&A transactions for each country pair during that period. Following the criteria of the
UNCTAD data, we also restrict our sample to target firms in the non-financial sectors that are ac-
quired by firms in all sectors. Even though the Thomson and Reuters data records both the value and
the number of bilateral M&A transactions, we restrict our attention to the count data, since the value
of M&A transactions is only recorded for publicly listed companies.
A major advantage of the M&A database is that it has a much broader coverage of country-pair
transactions than the available UNCTAD data on affiliate sales. Furthermore, M&A transactions
are a good proxy of economic activity in a country, and hence, a good predictor of sales of firms.
Therefore, as discussed further below, we will use the substantial correlation between the number of
acquisitions and the sales of affiliates to predict the missing values of MP.
1.2 Sample Selection
The UNCTAD data include a total of 151 countries. We select countries that have a real GDP per
capita of more than 5,000 US dollars (PPP-adjusted) and a population of more than three million.5
We add China, India, and Indonesia, to the sample. In total, our data set contains 59 countries which
entails 3,422 (58× 59) bilateral (ordered) pairs.
Table 2 lists the sample of countries. Our sample represents more than 90 percent of world GDP
5We also exclude Puerto Rico and Taiwan for lack of any data.
3

and almost 95 percent of world’s FDI inward and outward stocks, respectively, for the year 2000.6
1.3 Zeros and Missing Values
A pervasive problem with the UNCTAD data on bilateral sales of affiliates is the presence of missing
values. But in our sample, we not only encounter missing values, but true bilateral zero MP val-
ues. The fairly comprehensive M&A data will help us to better estimate missing values for bilateral
affiliate sales and number of affiliates, as explained below.
Table 3 summarizes the number of observations with missing and non-missing values, for affiliate
sales and number of affiliates from UNCTAD, and the number of M&A transactions from Thomson
and Reuters.
Out of the 3, 422 (58 × 59) possible bilateral relationships, we can assign a non-missing value to
2,311 and 2,232 pairs, for affiliate sales and number of affiliates, respectively. We also report non-
missing values for FDI stocks across country pairs. We assign a zero value for sales, number of
affiliates, and FDI stock, if and only if the six measures of bilateral multinational activity recorded
in the UNCTAD data set (i.e., FDI stocks and flows, affiliate sales, assets, and employment, and
number of affiliates) are all zero or missing for the period 1996-2001. As it can be seen in Table 3,
in the UNCTAD data, FDI stocks from the Balance of Payment of countries have substantially better
coverage (3, 171 non-missing values) than the variables directly linked to the activity of affiliates. We
assume that there is no missing values in the M&A data; a zero value simply means there was not an
M&A transaction in the period 1990-2001.
We will need to estimate 1,111 observations for bilateral affiliate sales, and 1,190 for the number
of affiliates across country pairs. Some of those missing values will be zeros. Still, we will be left with
missing observations as explained below. Table 4 records missing values from the UNCTAD data,
by country, both for inward and outward magnitudes of affiliate sales, number of affiliates, and FDI
stocks.
2 Extrapolation Procedure
We exploit the high and tight correlation between the number of cross-M&A deals and either affiliate
sales or number of affiliates to estimate missing values. Alternately, we estimate affiliate sales using
6Aggregate FDI stocks by country are available at http://unctadstat.unctad.org.
4
FDI stocks.
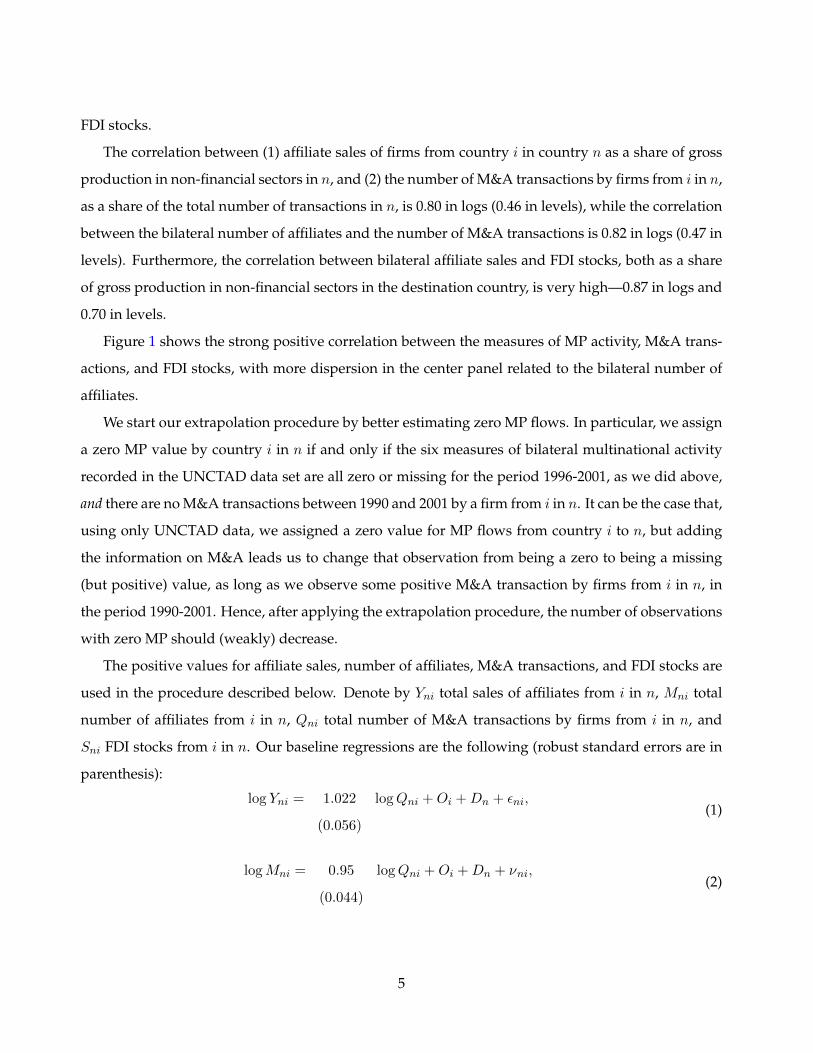
The correlation between (1) affiliate sales of firms from country i in country n as a share of gross
production in non-financial sectors in n, and (2) the number of M&A transactions by firms from i in n,
as a share of the total number of transactions in n, is 0.80 in logs (0.46 in levels), while the correlation
between the bilateral number of affiliates and the number of M&A transactions is 0.82 in logs (0.47 in
levels). Furthermore, the correlation between bilateral affiliate sales and FDI stocks, both as a share
of gross production in non-financial sectors in the destination country, is very high—0.87 in logs and
0.70 in levels.
Figure 1 shows the strong positive correlation between the measures of MP activity, M&A trans-
actions, and FDI stocks, with more dispersion in the center panel related to the bilateral number of
affiliates.
We start our extrapolation procedure by better estimating zero MP flows. In particular, we assign
a zero MP value by country i in n if and only if the six measures of bilateral multinational activity
recorded in the UNCTAD data set are all zero or missing for the period 1996-2001, as we did above,
and there are no M&A transactions between 1990 and 2001 by a firm from i in n. It can be the case that,
using only UNCTAD data, we assigned a zero value for MP flows from country i to n, but adding
the information on M&A leads us to change that observation from being a zero to being a missing
(but positive) value, as long as we observe some positive M&A transaction by firms from i in n, in
the period 1990-2001. Hence, after applying the extrapolation procedure, the number of observations
with zero MP should (weakly) decrease.
The positive values for affiliate sales, number of affiliates, M&A transactions, and FDI stocks are
used in the procedure described below. Denote by Yni total sales of affiliates from i in n, Mni total
number of affiliates from i in n, Qni total number of M&A transactions by firms from i in n, and
Sni FDI stocks from i in n. Our baseline regressions are the following (robust standard errors are in
parenthesis):
log Yni = 1.022 logQni +Oi +Dn + εni,
(0.056)(1)
logMni = 0.95 logQni +Oi +Dn + νni,
(0.044)(2)
5

andlog Yni = 0.76 logSni +Oi +Dn + υni,
(0.045)(3)
for i 6= n, and two sets of country fixed-effects, Oi and Dn. In order to have a minimum number
of observations to reasonably pin down the fixed effects of a country as both a source and a host,
we only include those country pairs in the regressions for which each country has at least three non-
missing data points in UNCTAD as a source or destination country, respectively.7 Notice that the
source and destination country fixed effects, among other things, pick up variations across countries
in average sales, and in the pattern of greenfield FDI versus M&A.8 As robustness (not shown), we
also interact our main regressor (i.e. Qni or Sni) with real GDP per capita in the host country, but
such interaction is never significant.
We use the results of these regressions to impute the missing values for bilateral foreign affili-
ate sales and number of foreign affiliates across country pairs. The results from this procedure are
described in the next section.
2.1 Results
To be clear, the possibilities after applying our extrapolation procedure are the following: (1) We can
have a zero value that becomes a positive value because all UNCTAD variables were zero or missing
but we have some M&A transactions, or stay as a zero value; and (2) We can have a missing value
that becomes a positive value because we did not have any UNCTAD data for affiliate sales (and/or
number of affiliates), but we have some positive value for M&A transactions, or stays as a missing
value.
Notice that we can have a missing value for affiliate sales, a positive FDI stock, and zero M&A
transactions in which case this observation remains missing when we consider M&A transactions in
the extrapolation procedure, but become positive when we consider FDI stocks instead. Conversely,
we can have a missing value for FDI stocks, a missing value for affiliate sales, and a positive number
7The countries that fall into this category for at least one of the three equations above are: Cuba, Guatemala, Lebanon,Libya, Slovakia, Turkmenistan, and Tunisia.
8Firms can establish foreign affiliates either via greenfield investment or via acquisition of an existing foreign company.One might think that, if there is a large set of firms available in a related sector in the destination country, the newlyentering firm may be more likely to acquire an existing firm than to establish a new affiliate via greenfield investment.Using new data collected by the German Bundesbank on the mode of entry of newly established affiliates owned byGerman companies, from 2005-2009, we find that the ratio of greenfield to M&A investments is falling in real GDP percapita of the destination country.
6

of M&A transactions in which case this observation remains missing when we consider FDI stocks
in the extrapolation procedure, but become positive when we consider M&A transactions instead.
Finally, we can have missing values for all three variables—FDI stocks, affiliate sales, and number
of M&A transactions—in which case the observation remains missing in either extrapolation proce-
dure.There are 332 observations that fall into the first case and hence, remain as missing values for
the extrapolation that uses the number of M&A transactions, but not in the one that uses FDI stocks.
Analogously, there are 82 observations that fall into the second case and hence, remain as missing
values for the extrapolation that uses FDI stocks, but become positive for the procedure that uses
the number of M&A transactions. 120 observations present missing affiliate sales, FDI stocks, and
number of M&A transactions.
Additionally, we can have a positive value for affiliate sales (and/or number of affiliates) from
UNCTAD, but zero M&A transactions during the period and hence, such observation is not included
in the extrapolation procedure. There are 87 observations with a positive value for sales and zero
M&A for the period 1990-2001 (69 observations if we consider number of affiliates); these observa-
tions present non-missing values before and after the extrapolation procedure.
Finally, it is not possible to have a missing value in the UNCTAD data that becomes zero after we
consider the M&A data because this is a case in which, even though the number of M&A transactions
is zero for the period 1990-2001, some variable in the UNCTAD data set, other than affiliate sales
(and/or number of affiliates), is not missing, indicating that the country pair was involved in an MP
relationship.
Analogously to results in Table 3, we present in Table 5 the numbers of missing and non-missing
values implied by our extrapolation procedure. Out of the 3,422 possible bilateral MP relationships,
almost 45 percent are zeros; the remaining 55 percent present some MP activity. We are still left with
728 positive missing values for affiliate sales (738 for the number of affiliates) because these are obser-
vations for which we do not observe any M&A transaction during the period 1990-2001 and, hence,
we are not able to apply the extrapolation procedure. Using FDI stocks, brings the number of missing
positive observations down to 692. Overall, extrapolating bilateral affiliate sales and number of affil-
iates using M&A transactions allows us to more than double the number of positive observations of
all possible country pairs. For some countries, the coverage is perfect after extrapolation. For exam-
ple, between the twelve Western European and North American countries used in Tintelnot (2012),
all values of affiliate sales are positive and non-missing; similarly for the 18 OECD countries used in
7
Arkolakis, Ramondo, Rodriguez-Clare, and Yeaple (2013).
Table 6 , analogously to Table 4, contains the number of missing values by country with respect to
all 59 partner countries after applying the extrapolation procedure. One thing is worth noticing here.
For instance, for the United States, the number of missing values for affiliate sales went from 4 to 6
when the imputed data uses the number of M&A transactions. Is that possible? The answer is yes.
This is a case in which a zero observation in the UNCTAD data becomes missing after applying the
extrapolation procedure even though we observe some M&A transaction. This happens in very few
cases in which the extrapolation in (1) cannot be completed because there is not a minimum number
of observations to pin down the origin or destination fixed effects. In the example of the United
States, Lebanon does not have enough (positive) observations to pin down the origin fixed effects, so
that the missing value for affiliate sales cannot be estimated with M&A transactions.
Table 7 presents sales of affiliates, as a share of non-financial gross production (see the Appendix
for a description of these data), both inward (∑
i 6=n Yni/Yn) and outward (∑
n6=i Yni/Yi), both from
the extrapolation procedures using the number of M&A transactions and FDI stocks, respectively;
we refer to these shares as inward and outward MP shares, respectively.9 We also present the number
of foreign affiliates and affiliates abroad into and from each country, as well as the raw data.
The inward MP share is an important variable since this is the variable that some models use
to evaluate the gains of moving from isolation to the situation with the observed MP flows. It is
important to have an accurate estimate of inward MP shares: countries with higher inward MP shares
are more open, and hence, have higher gains.
As expected, the imputed data deliver higher MP activity, both in terms of total sales and number
of affiliates. While the raw data delivers an average inward MP share of 15.4 percent, the imputed
data reaches 17.7 percent. At the same time, the average number of foreign affiliates into a receiving
country increases from 1,522 in the raw data to 1,857 in the imputed data. Similar increases are
present for outward MP magnitudes. Improvements with respect to the raw data are heterogenous
across countries. Countries with very complete data, such as the United States and Germany, do
not improve after applying the extrapolation procedure. But some countries in the sample present
very large improvements. For instance, for Belgium, Colombia, Hungary, Slovakia, Lithuania, and
9The data are, of course, available in levels, without any normalization, giving the user the choice about her mostconvenient normalization. Notice that some countries present very high inward MP shares, such as Hungary or Singapore(for which this share is even bigger than one). One should keep in mind that the denominator of such shares is imputedfor most of non-OECD countries, as described in the Appendix.
8

Russia, inward MP shares increase by more than 50 percent using the imputed data. Among poorer
countries, the improvement is very large regarding outward MP: Brazil, Greece, India, Uruguay, and
Poland, for instance, increase their outward MP shares by almost two fold, reaching almost a four-
fold increase in the case of Argentina.
Additionally, using FDI stocks or the number of M&A transactions for extrapolation give very
similar results in terms of outward and inward MP, on average. There is, however, considerable
variation across countries between the two extrapolation methods. For instance, while for Chile the
improvement with respect to the raw data on inward MP shares is of around 25 percent using M&A
transactions, it is more than 50 percent when FDI stocks are used instead. The opposite is true for a
country like Lithuania: using M&A transactions increases inward MP shares by more than 50 percent,
while using FDI stocks to extrapolate that share leaves the raw data almost unchanged.
The number of M&A transactions may be a better indicator of bilateral MP activity than FDI
stocks. Since they are constructed from FDI flows, FDI stocks may be a worse indicator because
companies can raise capital locally, phase their investment over a period of time, and channel their
investment through different countries for tax efficiency (see IMF, 2004). Even though FDI stocks have
broader coverage, we recommend using the variable “sales MandA,” which contains the actual data
on bilateral affiliate sales completed with the M&A-extrapolation procedure, for empirical exercises
that involve data on bilateral MP. Section 2.2 presents the variables contained in our data set.
Finally, notice that missing values do not seem to be random in the UNCTAD data in the following
sense. We systematically predict less MP for those pairs that were missing in the UNCTAD data: a
missing bilateral pair has (predicted) average sales of U$ 665 million, equivalent to 0.0026 as a share
of the host country’s gross value of production, while a non-missing (positive) pair in UNCTAD has
average sales of U$ 11,347 millions, equivalent to 0.016 as a share of the host country’s gross value of
production. Comparing the simple average across all country-pairs with the raw and imputed data,
respectively, points out to the same bias: while the average MP share calculated with the raw data is
0.0154, the imputed data deliver much lower averages, of around 0.004 for affiliate sales (using either
M&A transactions or FDI stocks). That is, the imputed data come from pairs with systematically low
MP.
9

2.2 Data Presentation
We provide both the original UNCTAD data and the data completed with our extrapolation proce-
dure on affiliate sales and number of affiliates from country i to n. Please email us for the data. The
output file is in STATA(12), called “bilateral mp.dta,” and contains the following variables:
Variable Name Definition Source
ISO d code for receiving country U.N.
ISO o code for source country U.N.
sales raw affiliate sales, original data UNCTAD, avg. 96-01
stocks FDI stocks UNCTAD, avg. 96-01
num raw number of affiliates, original data UNCTAD, avg. 96-01
MandA number of cross-border M&A Thomson and Reuters, 90-01
sales MandA affiliate sales, imputed data from M&A own calculations, avg. 96-01
sales stocks affiliate sales, imputed data from FDI stocks own calculations, avg. 96-01
num aff MandA number of affiliates, imputed data from M&A own calculations, avg. 96-01
gross prod nonfin d gross value of production, receiving country, own calculations, avg. 96-01
non-financial sectors
Auxiliary Data
As auxiliary data – which is not directly used in the extrapolation procedure for MP but enables the
calculation of MP shares – we use the OECD-STAN database for gross production and the World De-
velopment Indicators (WDI) for GDP. For countries for which gross production data are not available
from STAN—most of non-OECD countries—we use data on GDP to predict the magnitude of gross
production in the respective country. Let Yn denote the gross value of production in non-financial
sectors in country n, calculated from STAN for the OECD countries by subtracting the value of gross
production in the financial sectors from the total value of gross production. Since such data are avail-
able only for OECD countries, we impute values for the remaining countries using data on current
GDP. Estimates from ordinary least squares (OLS), with robust standard errors, yield
log Yn = 0.26 + 0.97 logGDPn,
(0.0047) (0.002)(4)
10

with an R-squared of 0.96, and 1, 566 observations. Gross production in non-financial sectors is used
to present inward and outward MP shares in Table 7, for the reader convenience.
11

Tables and Figures
12

Table 1: Availability and coverage of affiliate revenues and number of affiliates. UNCTAD. Selected countries.
Reporting Availability by year Coverage Ownership NationalCountry 1996 1997 1998 1999 2000 2001 type of aff. sectors inward outward Criteria SourceBEL n/a n/a x n/a n/a n/a MOA all n/a x UBO National Bank of Belgium (Eurostat)CAN n/a n/a x n/a x x MOA all n/a x n/a CANSIMCZE n/a n/a n/a x n/a n/a all all x x non UBO Czech National BankFIN[ x x x x x x all nf x x UBO Bank of FinlandFRA† x x x x x x MOA all x x non UBO Bank of France and Ministry of FinanceGBR x x n/a n/a n/a n/a MOA nf x n/a UBO Office for National StatisticsGER x x x x x x all all x x UBO BundesbankIRL x x x x x n/a MOA mfg x x UBO Central Statistics OfficeJPN x x x x x x all nf x x UBO Ministry of Economy, trade, and IndustryNLD‡ n/a n/a n/a n/a n/a n/a MOA nf x x non UBO Centrak Bureau of Statistics (CBS)NOR x n/a n/a n/a n/a n/a MOA mfg x n/a UBO OECD: Measuring GlobalizationPOL n/a n/a n/a x x n/a MOA nf x n/a n/a Central Statistical OfficePRT n/a x x x x x MOA all x x n/a Bank of PortugalSWE\ n/a n/a x x x n/a MOA nf x n/a UBO www.itps.seUSA x x x x x x all nf x x UBO Bureau of Economic Analysis
MOA = Majority-owned affiliate. UBO = Ultimate Beneficiary Owner. NF = non-financial affiliates. Inward (Outward) refers to magnitudes for foreign affiliatesin (from) country n. Belgium (BEL), Canada (CAN) and Portugal (PRT) only report affiliate revenues, not the number of affiliates. (†): France (FRA), for inwardmagnitudes, only records affiliates in the manufacturing sector. [: Finland (FIN) reports outward magnitudes for only majority-owned affiliates. (‡): Netherlands(NLD) only reports the number of foreign affiliates abroad and at home, not revenues. (\): Sweden (SWE) reports number of affiliates in all sectors, including thefinancial sector.
13

Table 2: List of countries
Code Name Code NameARG Argentina ISR IsraelAUS Australia ITA ItalyAUT Austria JPN JapanBEL Belgium KOR KoreaBGR Bulgaria LBN LebanonBLR Belarus LBY LibyaBRA Brazil LTU LithuaniaCAN Canada MEX MexicoCHE Switzerland MYS MalaysiaCHL Chile NLD NetherlandsCHN China NOR NorwayCOL Colombia NZL New ZealandCRI Costa Rica POL PolandCUB Cuba PRT PortugalCZE Czech Republic ROM RomaniaDNK Denmark RUS RussiaDOM Dominican Rep. SAU Saudi ArabiaESP Spain SGP SingaporeFIN Finland SLV SloveniaFRA France SVK SlovakiaGBR Great Britain SWE SwedenGER Germany THA ThailandGRC Greece TKM TurkmenistanGTM Guatemala TUN TunisiaHRV Croatia TUR TurkeyHUN Hungary URY UruguayIDN Indonesia USA United StatesIND India VEN VenezuelaIRL Ireland ZAF South AfricaIRN Iran
Belgium includes Luxembourg.
14

Table 3: Missing and non-missing values. Original Data.
UNCTAD Thomson and Reutersaffiliate revenues number of affiliates FDI stocks number of M&A
Non-missing values 2,311 2,232 3,171 3,422positive 590 511 1,450 1,396zero 1,721 1,721 1,721 2,026negative – – 10 –
Missing values 1,111 1,190 241 –Total observations 3,422 3,422 3,422 3,422
Own calculations based on UNCTAD data for affiliate revenues, number of affiliates, and FDI stocks from i
in n, average over 1996-2001, and Thomson and Reuters data for the number of M&A’s transactions by firmsfrom i in n between 1990-2001.
15

Figure 1: Bilateral MP and M&A Transactions. Raw Data.
(a) Affiliate revenues and M&A
-15
-10
-50
log
of a
ff. re
venu
es b
y i i
n n,
as
shar
e of
gro
ss p
rodu
ctio
n in
n
-10 -8 -6 -4 -2 0log of number of M&A by i in n, as share total M&A in n
(b) Number of affiliates and M&A
02
46
8lo
g of
num
ber o
f affi
liate
s by
i in
n
0 2 4 6 8log of number of M&A, by i in n
(c) Affiliate revenues and FDI stocks
-15
-10
-50
log
of a
ff. re
venu
es b
y i i
n n,
as
shar
e of
gro
ss p
rodu
ctio
n in
n
-20 -15 -10 -5 0log of FDI stocks by i in n, as share of gross production in n
Left Panel: (log of) affiliate revenues of firms from i in n, as a share of gross production in non-financial sectors in country n, andthe (log of) number of M&A transactions from i in n, as a share of the total number of transactions in n. Center Panel: (log of)number of affiliates and the (log of) number of M&A’s transactions from i in n. Right Panel: (log of) affiliate revenues and FDIstocks from i in n, as a share of gross production in non-financial sectors in country n. Number of M&A’s transactions are fromThomson and Reuters, 1990-2001. FDI stocks, affiliate revenues, and number of affiliates are from UNCTAD, an average over1995-2001.
16

Table 4: Missing values by country. Original data, UNCTAD.
Inward Outwardaff. revenues num. of aff. FDI stocks aff. revenues num. of aff. FDI stocks
ARG 18 22 5 29 28 12AUS 26 29 5 31 28 4AUT 25 33 3 21 23 2BEL 12 15 6 11 17 9BGR 36 35 1 22 22 2BLR 2 2 3 2 3 1BRA 34 39 2 27 27 9CAN 19 33 0 35 38 1CHE 21 24 1 34 37 4CHL 27 29 12 24 24 8CHN 21 18 4 21 18 4COL 34 35 2 27 27 3CRI 22 21 17 10 9 4CUB 4 3 4 4 4 1CZE 14 37 0 11 36 0DNK 31 23 2 29 35 0DOM 8 8 7 3 3 1ESP 25 38 20 38 39 14FIN 18 6 3 3 35 2FRA 30 42 3 30 40 5GBR 27 28 0 31 35 3GER 4 4 2 1 1 5GRC 21 23 4 30 32 4GTM 7 6 2 5 5 3HRV 18 17 0 15 14 0HUN 35 36 0 31 32 6IDN 17 18 2 15 14 4IND 13 14 2 21 20 4IRL 14 5 7 17 21 3IRN 13 11 4 16 16 6ISR 16 16 6 24 20 5ITA 25 15 1 12 2 11JPN 31 27 7 18 12 7KOR 29 29 0 42 27 0LBN 3 2 4 5 5 3LBY 3 3 3 2 2 2LTU 6 7 5 2 2 0MEX 33 36 3 21 24 4MYS 22 22 5 23 23 1NLD 24 22 0 31 35 3NOR 10 20 0 30 34 2NZL 27 29 1 32 33 3POL 16 16 1 38 37 1PRT 21 40 1 16 36 5ROM 19 19 4 13 13 5RUS 21 21 2 20 19 5SAU 5 5 5 8 6 5SGP 22 22 4 25 23 3SLV 16 15 1 2 2 2SVK 24 25 2 26 28 1SWE 30 20 17 34 37 11THA 15 16 1 17 17 1TKM 1 1 1 0 0 0TUN 20 19 21 0 0 0TUR 18 29 7 24 22 12URY 10 10 5 9 10 5USA 4 3 9 3 1 10VEN 28 29 0 17 18 5ZAF 16 18 2 23 19 5Total 1,111 1,190 241 1,111 1,190 241
Own calculations based on UNCTAD data for affiliate sales, number of affiliates, and FDI stocks from i in n,average over 1996-2001.
17

Table 5: Zero, missing, and positive values. Imputed Data.
Affiliate revenues Number of affiliates Number of M&AM&A FDI stocks
Non-missing values 2,694 2,730 2,684 3,422positive 1,215 1,251 1,205 1,396zero 1,479 1,479 1,479 2,026
Missing values 728 692 738 0Total observations 3,422 3,422 3,422 3,422
Column 1 corresponds to the extrapolation in (1). Column 2 refers to the extrapolation in (2). Columns 3 corresponds tothe extrapolation in (3). Calculations are made using observations which are averages over the period 1996-2001. The dataon number of M&A’s transactions in column 4 are from Thomson and Reuters, between 1990-2001.
18

Table 6: Missing values by country. Imputed data.
Inward Outwardaff. rev. with M&A num. of aff. aff. rev. with FDI stocks aff. rev. with M&A num. of aff. aff. rev. with FDI stocks
ARG 9 10 14 20 19 16AUS 12 13 15 2 2 9AUT 15 16 12 10 13 4BEL 10 11 24 5 6 26BGR 14 14 8 20 19 5BLR 1 2 5 2 3 2BRA 15 16 12 14 13 14CAN 13 14 13 9 9 9CHE 13 15 11 8 8 8CHL 9 10 16 26 26 26CHN 14 16 14 9 8 14COL 19 20 10 27 27 27CRI 15 14 18 11 10 11CUB 9 8 9 5 5 5CZE 11 15 8 10 29 3DNK 20 19 10 6 6 4DOM 8 8 7 3 3 3ESP 16 17 23 11 11 20FIN 14 5 10 2 5 0FRA 23 24 17 11 11 10GBR 16 16 16 8 8 13GER 4 4 4 1 1 1GRC 12 12 9 8 9 5GTM 13 12 13 6 6 6HRV 5 6 2 15 14 15HUN 14 15 9 19 19 7IDN 11 11 11 25 24 25IND 9 9 14 9 9 20IRL 10 7 11 6 6 15IRN 15 13 15 14 14 5ISR 25 25 25 6 5 15ITA 16 16 10 6 2 8JPN 15 15 13 8 7 7KOR 14 13 9 17 8 7LBN 6 5 6 6 6 6LBY 7 7 7 7 7 7LTU 4 4 15 7 7 7MEX 18 20 11 13 14 10MYS 14 14 16 35 35 35NLD 17 19 11 8 8 11NOR 7 9 12 7 8 8NZL 16 16 9 35 36 35POL 14 14 11 24 22 2PRT 18 24 11 16 28 6ROM 19 19 4 13 13 13RUS 8 8 13 7 6 11SAU 4 5 11 26 24 26SGP 13 13 13 36 34 36SLV 16 15 16 4 4 4SVK 7 7 4 17 18 1SWE 23 19 21 6 6 11THA 8 8 13 26 26 26TKM 1 1 1 1 1 1TUN 24 23 24 2 2 2TUR 11 12 9 15 15 12URY 8 8 14 7 8 7USA 4 3 3 3 1 3VEN 16 17 9 10 10 9ZAF 6 7 11 38 34 38Total 728 738 692 728 738 692
Columns 1 and 4 correspond to the extrapolation in (1). Columns 3 and 6 correspond to the extrapolation in (3). Columns2 and 5 refer to the extrapolation in (2). Inward variables to totals into country n; outward variables refer to totals fromcountry n. Calculations are made using observations which are averages over the period 1996-2001.
19

Table 7: Outward and Inward MP. Original and Imputed Data.
Inward MP Outward MPaffiliate revenues number of affiliates affiliate revenues number of affiliates
raw data M&A FDI stocks raw data M&A raw data M&A FDI stocks raw data M&A(1) (2) (3) (4) (5) (6) (7) (8) (9) (10)
ARG 0.079 0.108 0.100 657 1,665 0.006 0.039 0.011 31 533AUS 0.188 0.228 0.227 1,746 2,725 0.055 0.070 0.060 278 741AUT 0.279 0.297 0.291 3,584 3,942 0.128 0.137 0.140 2,026 2,151BEL 0.331 0.472 0.342 2,082 3,594 0.271 0.334 0.287 1,408 2,527BGR 0.030 0.037 0.038 92 203 0.003 0.003 0.006 12 33BLR 0.003 0.003 0.003 14 29 0.003 0.003 0.003 5 5BRA 0.120 0.139 0.137 1,381 2,744 0.005 0.011 0.006 73 371CAN 0.352 0.354 0.354 2,797 3,718 0.177 0.198 0.195 1,309 2,044CHE 0.318 0.353 0.365 2,424 3,033 0.689 0.792 0.787 4,191 6,181CHL 0.098 0.127 0.147 308 624 0.003 0.003 0.003 14 14CHN 0.038 0.047 0.041 2,557 2,647 0.002 0.004 0.002 136 430COL 0.070 0.157 0.093 233 880 0.002 0.002 0.002 17 17CRI 0.098 0.101 0.104 86 131 0.001 0.001 0.001 4 4CUB 0.000 0.000 0.000 2 2 0.000 0.000 0.000 - -CZE 0.338 0.338 0.338 1,402 1,779 0.016 0.016 0.016 59 101DNK 0.106 0.135 0.129 1,023 1,046 0.156 0.190 0.180 1,332 1,951DOM 0.064 0.064 0.066 47 47 0.001 0.001 0.001 3 3ESP 0.167 0.172 0.168 2,194 3,816 0.022 0.031 0.028 252 827FIN 0.195 0.195 0.196 1,615 1,619 0.378 0.379 0.378 770 1,063FRA 0.201 0.202 0.202 4,655 6,958 0.193 0.206 0.203 3,197 5,572GBR 0.316 0.318 0.318 6,515 6,635 0.222 0.257 0.245 3,664 7,089GER 0.290 0.290 0.290 12,241 12,281 0.354 0.354 0.354 28,191 28,191GRC 0.054 0.072 0.081 289 510 0.006 0.010 0.012 39 121GTM 0.058 0.058 0.058 109 109 0.001 0.001 0.001 4 4HRV 0.024 0.031 0.027 131 179 0.006 0.006 0.006 20 20HUN 0.278 0.444 0.436 1,392 1,903 0.011 0.014 0.015 29 112IDN 0.103 0.115 0.114 769 1,123 0.004 0.004 0.004 26 26IND 0.034 0.036 0.037 661 749 0.004 0.006 0.010 35 100IRL 0.348 0.351 0.348 1,163 1,166 0.122 0.130 0.128 299 464IRN 0.001 0.001 0.001 20 20 0.003 0.003 0.004 31 47ISR 0.063 0.063 0.063 149 149 0.022 0.027 0.026 135 279ITA 0.094 0.127 0.111 3,306 3,315 0.057 0.057 0.057 2,295 2,295JPN 0.041 0.045 0.043 1,831 1,920 0.143 0.144 0.145 10,588 10,758KOR 0.050 0.056 0.055 725 935 0.039 0.052 0.050 417 890LBN 0.007 0.007 0.007 14 14 0.023 0.023 0.023 26 26LBY 0.000 0.000 0.000 - - 0.000 0.000 0.000 - -LTU 0.028 0.046 0.029 41 108 0.000 0.000 0.000 - -MEX 0.163 0.192 0.178 1,383 2,197 0.019 0.023 0.020 191 1,070MYS 0.338 0.402 0.378 989 1,482 0.009 0.009 0.009 27 27NLD 0.407 0.418 0.411 3,587 3,603 0.776 0.978 0.875 4,944 7,741NOR 0.131 0.134 0.142 382 626 0.147 0.179 0.165 951 1,267NZL 0.149 0.218 0.178 325 675 0.017 0.017 0.017 22 22POL 0.222 0.222 0.222 3,342 3,354 0.002 0.004 0.004 74 253PRT 0.372 0.381 0.373 544 1,048 0.031 0.031 0.031 34 138ROM 0.024 0.024 0.058 256 256 0.001 0.001 0.001 8 8RUS 0.017 0.027 0.029 366 667 0.019 0.026 0.021 107 218SAU 0.037 0.044 0.039 125 187 0.052 0.052 0.052 154 154SGP 1.095 1.306 1.281 1,637 2,678 0.041 0.041 0.041 99 99SLV 0.060 0.060 0.060 50 50 0.010 0.010 0.010 5 5SVK 0.140 0.216 0.214 352 559 0.013 0.019 0.018 12 37SWE 0.297 0.298 0.298 4,228 4,233 0.251 0.300 0.286 1,902 2,758THA 0.267 0.309 0.304 1,185 1,663 0.003 0.003 0.003 19 19TKM 0.002 0.002 0.002 2 2 0.000 0.000 0.000 - -TUN 0.020 0.020 0.020 104 104 0.000 0.000 0.000 - -TUR 0.063 0.064 0.063 385 607 0.003 0.004 0.004 81 128URY 0.064 0.104 0.079 77 160 0.006 0.011 0.018 16 118USA 0.153 0.153 0.153 11,393 11,393 0.189 0.189 0.189 20,145 20,145VEN 0.098 0.162 0.128 305 747 0.135 0.149 0.143 47 284ZAF 0.102 0.125 0.119 538 928 0.037 0.037 0.037 56 56
Average 0.154 0.177 0.171 1,522 1,857 0.083 0.095 0.090 1,522 1,857Columns 2 and 7, 3 and 8 correspond to the extrapolations in (1) and (3), respectively. Columns 5 and 10 refer to theextrapolation in (2). ”Raw” refers to the original data from UNCTAD. Inward MP shares are
∑i6=n Yni/Yn, while outward
MP shares are∑
n 6=i Yni/Yi. Observations are averages over the period 1996-2001.
20