Embed Size (px)
Citation preview
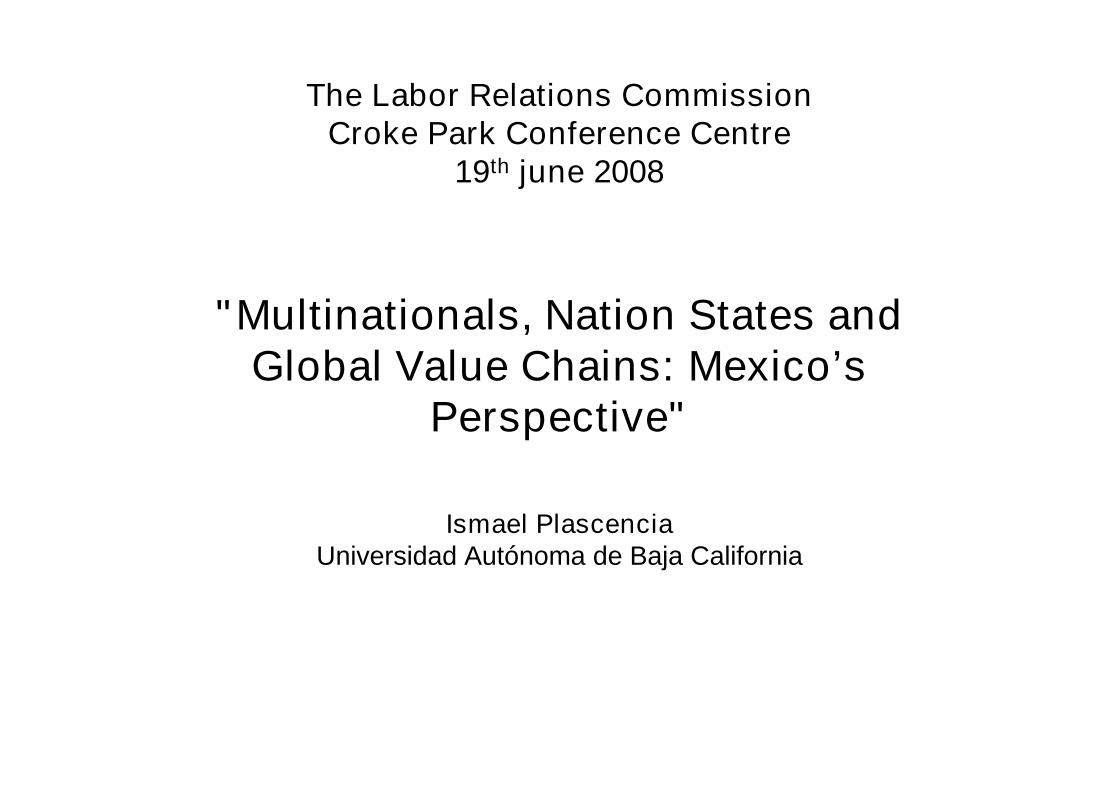
"Multinationals, Nation States andGlobal Value Chains: Mexico’s
Perspective"
Ismael PlascenciaUniversidad Autónoma de Baja California
The Labor Relations CommissionCroke Park Conference Centre
19th june 2008
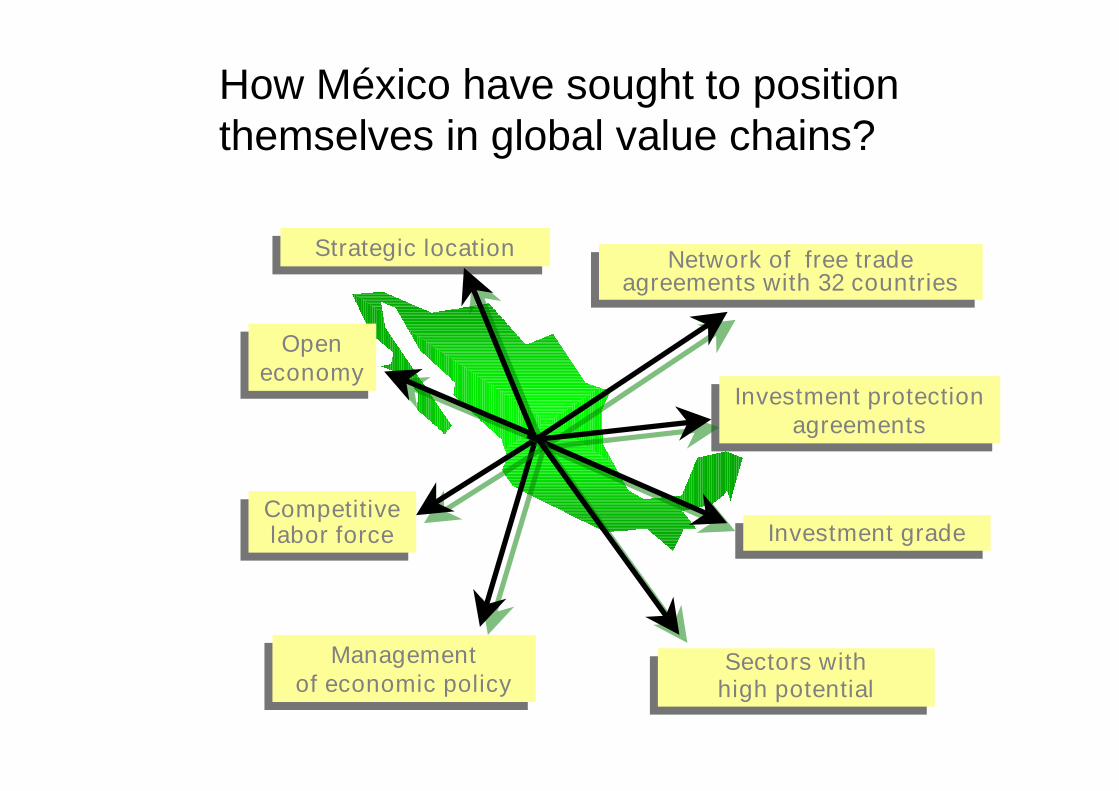
Investment protectionagreements
Investment protectionagreements
Sectors withhigh potential
Sectors withhigh potential
Openeconomy
Openeconomy
Strategic locationStrategic locationNetwork of free trade
agreements with 32 countries
Network of free tradeagreements with 32 countries
Competitivelabor force
Competitivelabor force
Managementof economic policy
Managementof economic policy
Investment gradeInvestment grade
How México have sought to positionthemselves in global value chains?
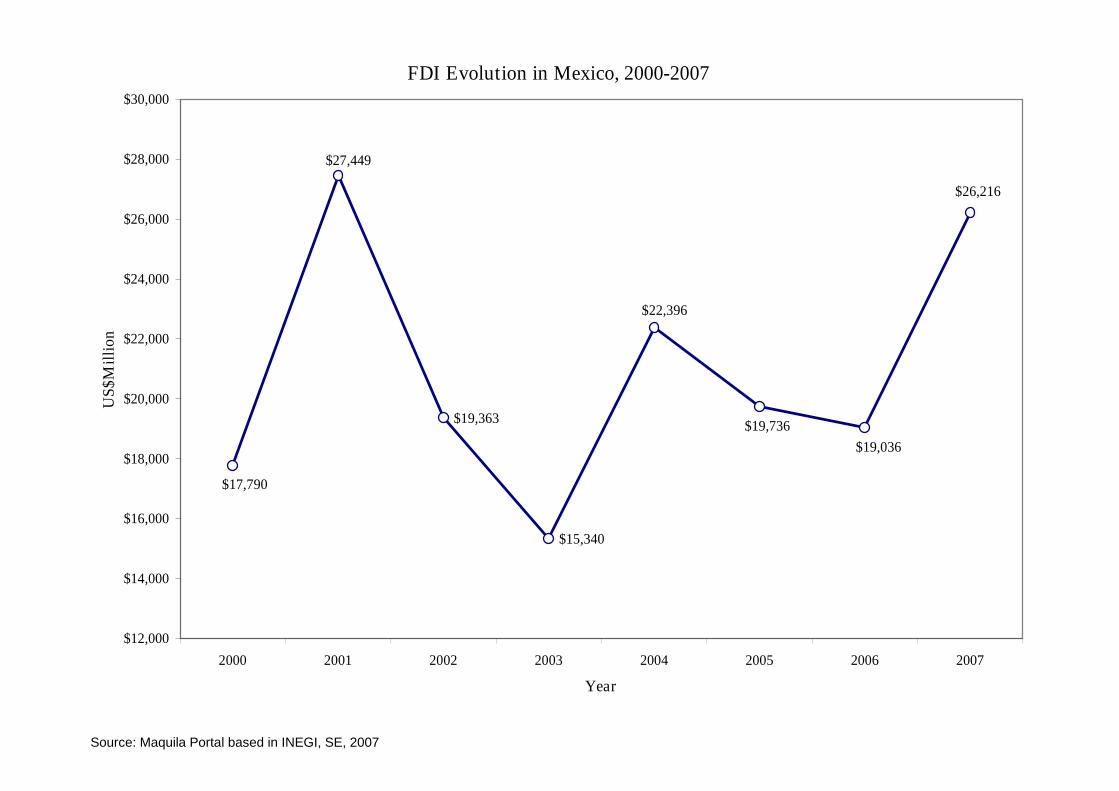
FDI Evolution in Mexico, 2000-2007
$19,363
$15,340
$27,449
$17,790
$26,216
$19,036
$19,736
$22,396
$12,000
$14,000
$16,000
$18,000
$20,000
$22,000
$24,000
$26,000
$28,000
$30,000
2000 2001 2002 2003 2004 2005 2006 2007
Year
US
$M
illi
on
Source: Maquila Portal based in INEGI, SE, 2007
Source: Maquila Portal based in INEGI, SE, 2007
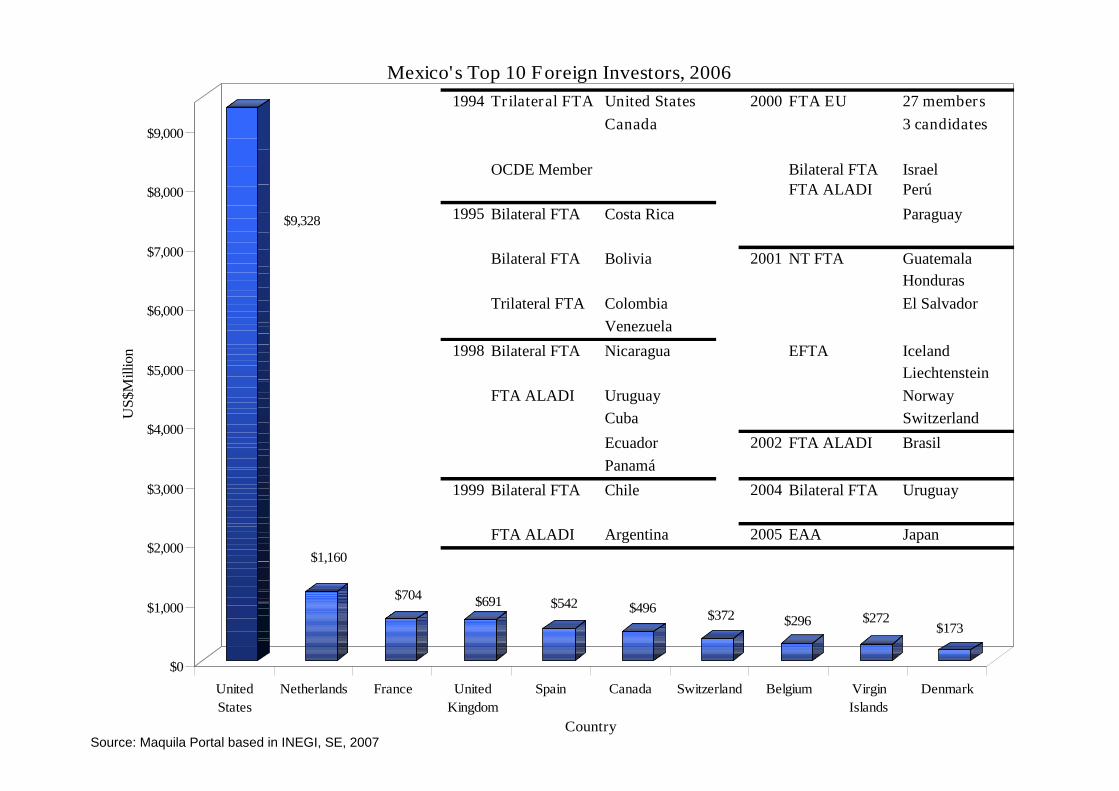
$9,328
$1,160
$704 $691 $542 $496$372 $296 $272
$173
$0
$1,000
$2,000
$3,000
$4,000
$5,000
$6,000
$7,000
$8,000
$9,000U
S$M
illion
United
States
Netherlands France United
Kingdom
Spain Canada Switzerland Belgium Virgin
Islands
Denmark
Country
Mexico's Top 10 Foreign Investors, 2006
1994 Trilateral FTA United States 2000 FTA EU 27 members
Canada 3 candidates
OCDE Member Bilateral FTA IsraelFTA ALADI Perú
1995 Bilateral FTA Costa Rica Paraguay
Bilateral FTA Bolivia 2001 NT FTA Guatemala
Honduras
Trilateral FTA Colombia El Salvador
Venezuela
1998 Bilateral FTA Nicaragua EFTA Iceland
Liechtenstein
FTA ALADI Uruguay Norway
Cuba Switzerland
Ecuador 2002 FTA ALADI Brasil
Panamá
1999 Bilateral FTA Chile 2004 Bilateral FTA Uruguay
FTA ALADI Argentina 2005 EAA Japan
Source: Maquila Portal based in INEGI, SE, 2007
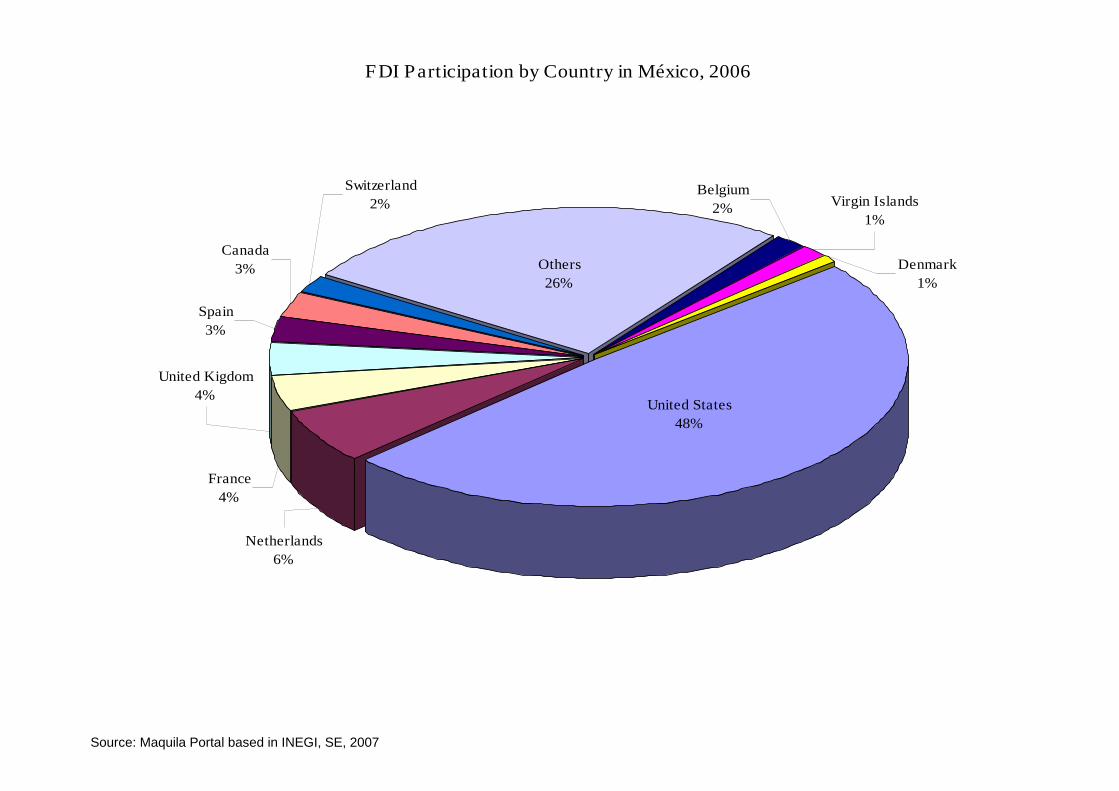
FDI Participation by Country in México, 2006
Denmark
1%
Netherlands
6%
France
4%
United Kigdom
4%
Others
26%
Belgium
2%Virgin Islands
1%
United States
48%
Switzerland
2%
Spain
3%
Canada
3%

Country of Origin of the Main MNCs in Mexico(percentages of total FDI)
Source: Author elaboration with base on CEPAL, 2006
1996
1997
1998
1999
2000
2001
2002
2003
2004
2005
0
20
40
60
80
United States Spain Netherlands United Kingdom Canada Others
Source: Maquila Portal based in INEGI, SE, 2007
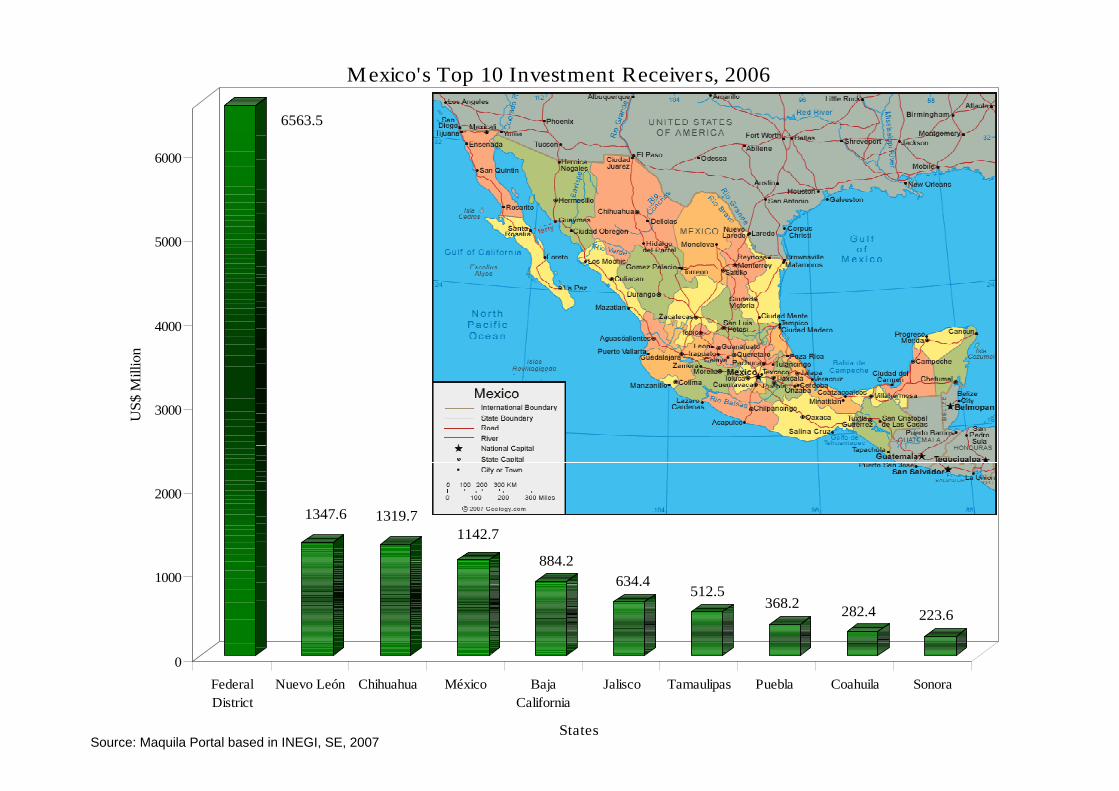
6563.5
1347.6 1319.71142.7
884.2
634.4512.5
368.2282.4 223.6
0
1000
2000
3000
4000
5000
6000
US
$M
illion
Federal
District
Nuevo León Chihuahua México Baja
California
Jalisco Tamaulipas Puebla Coahuila Sonora
States
Mexico's Top 10 Investment Receivers, 2006
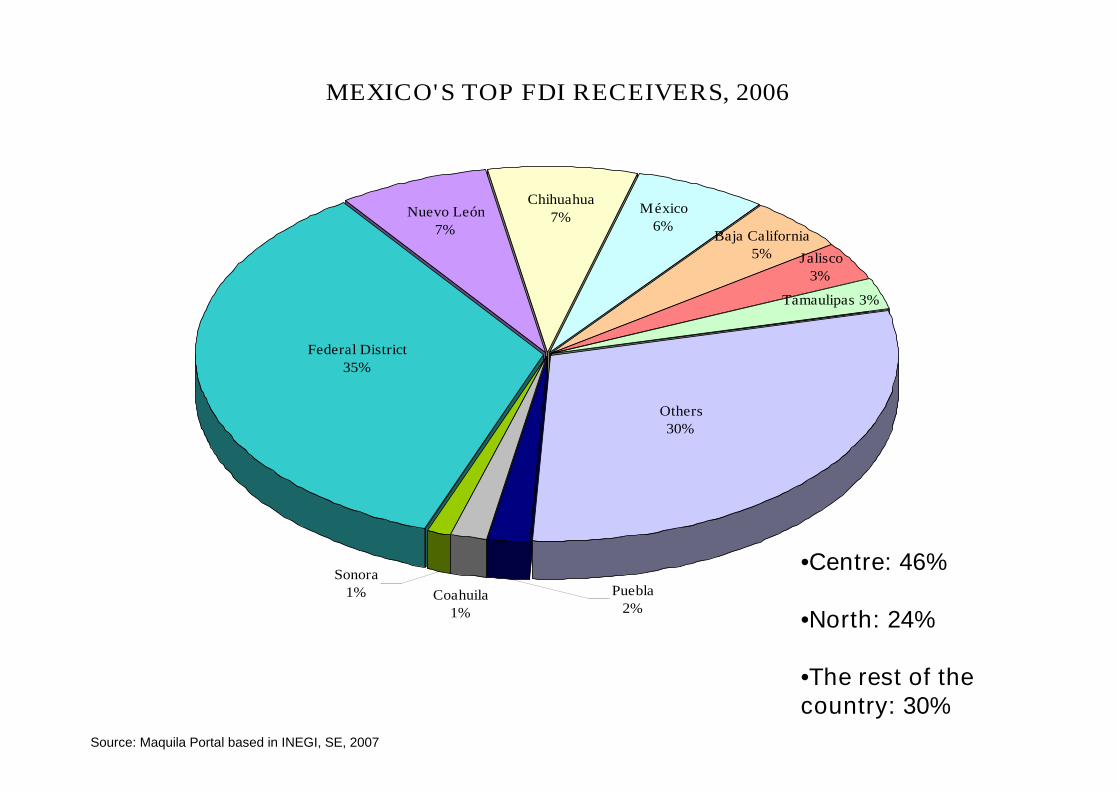
MEXICO'S TOP FDI RECEIVERS, 2006
Tamaulipas 3%
Federal District
35%
Others30%
Puebla2%
Coahuila1%
Sonora1%
Chihuahua
7%México
6%Nuevo León
7% Baja California5% Jalisco
3%
Source: Maquila Portal based in INEGI, SE, 2007
•Centre: 46%
•North: 24%
•The rest of thecountry: 30%
Path dependence of the actual situation
• Natural Resources: Mexico assumed a strong position in defending itsnatural resources in the 1930s with the nationalization of the oil industry.Mexico became a unique case in the history of Latin America.Government needs to privatized the oil extraction and energy sector.
• Manufactures: FDI came with the inward growth model, which gaveinvestors monopolistic profits (through protection). A new round beganwith the opening of the economy and its export oriented approachsince 1983. MNCs became interested in taking advantage of a lowcost area, located geographically close to the largest market in theworld. That’s why this sector its attain to the cyclical economy of theUS: almost 90% of the Mexico’s exports goes to US.
• Services: After the 1994 financial crisis, almost all of the banks weresold to foreign investors. On the other hand, wholesale and retail firms(Walt-Mart, Costco) start operations to take advantage of the Mexicanmarket .
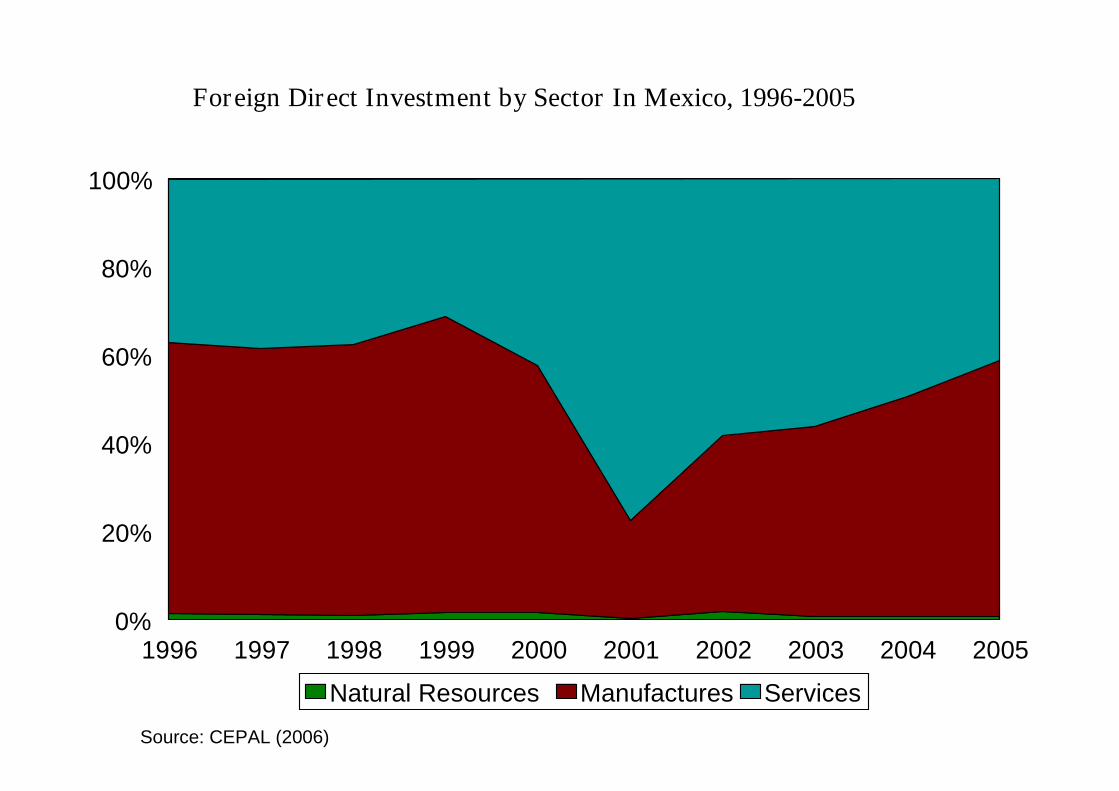
Foreign Direct Investment by Sector In Mexico, 1996-2005
Source: CEPAL (2006)
1996 1997 1998 1999 2000 2001 2002 2003 2004 20050%
20%
40%
60%
80%
100%
Natural Resources Manufactures Services
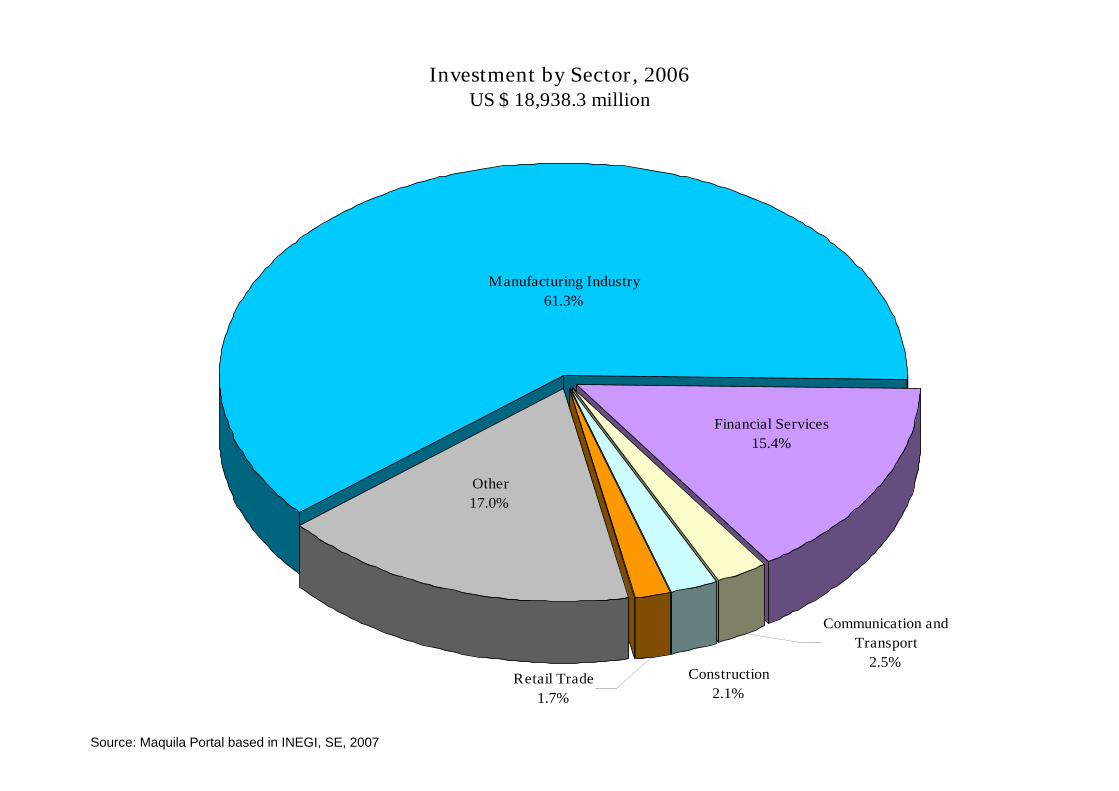
Investment by Sector, 2006US $ 18,938.3 million
Construction
2.1%
Communication and
Transport
2.5%Retail Trade
1.7%
Other
17.0%
Manufacturing Industry
61.3%
Financial Services
15.4%
Source: Maquila Portal based in INEGI, SE, 2007
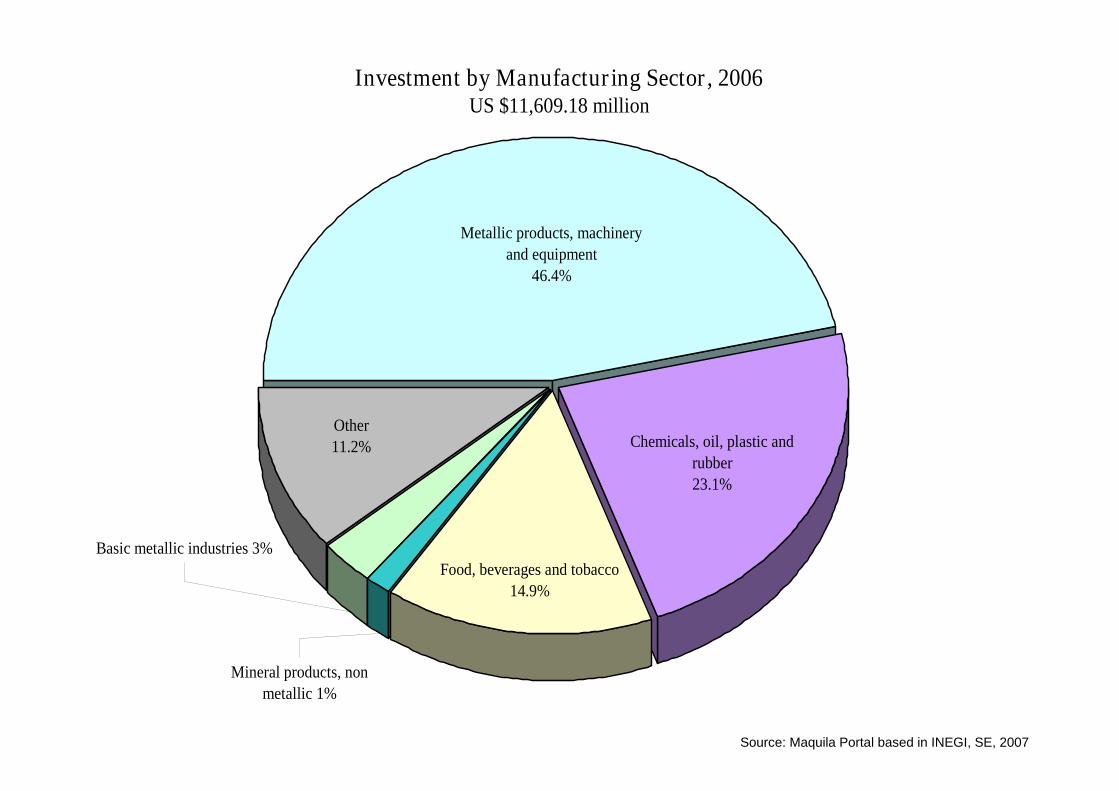
Investment by Manufacturing Sector, 2006US $11,609.18 million
Metallic products, machinery
and equipment
46.4%
Chemicals, oil, plastic and
rubber
23.1%
Food, beverages and tobacco
14.9%
Other
11.2%
Mineral products, non
metallic 1%
Basic metallic industries 3%
Source: Maquila Portal based in INEGI, SE, 2007
What kinds of MNCs are presentin Mexico?
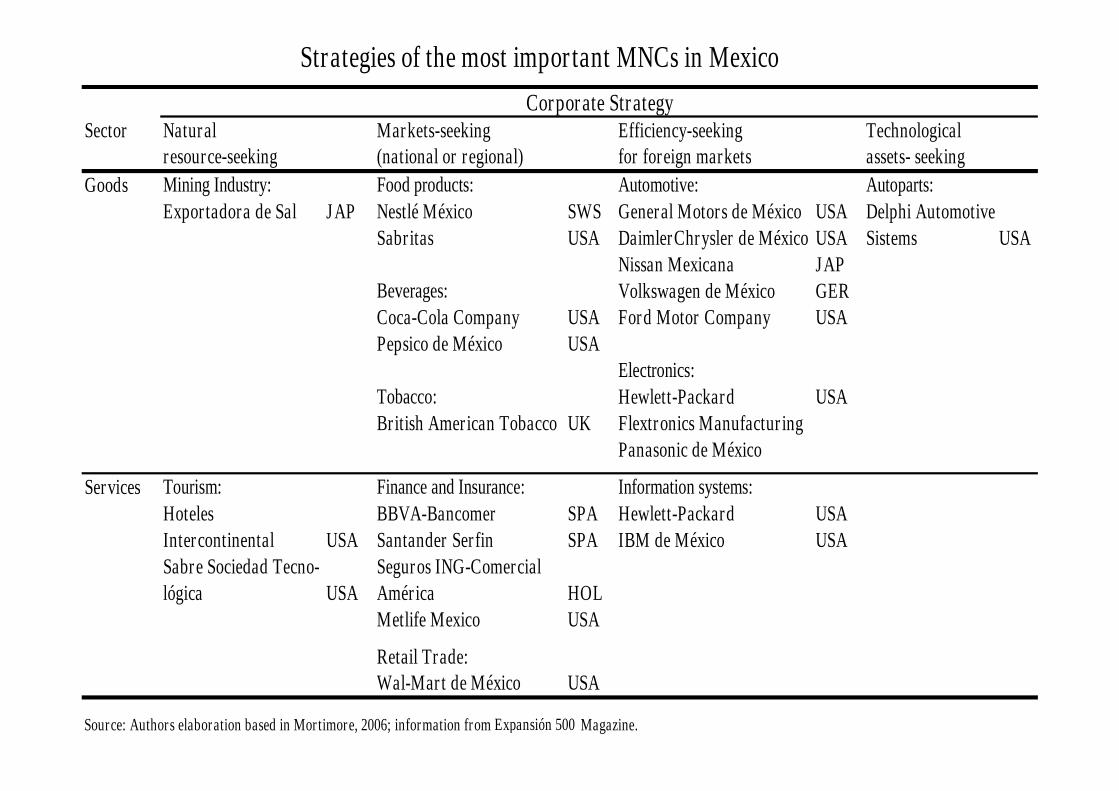
Sector Natural Markets-seeking Efficiency-seeking Technologicalresource-seeking (national or regional) for foreign markets assets- seeking
Goods Mining Industry: Food products: Automotive: Autoparts:
Exportadora de Sal JAP Nestlé México SWS General Motors de México USA Delphi AutomotiveSabritas USA DaimlerChrysler de México USA Sistems USA
Nissan Mexicana JAPBeverages: Volkswagen de México GERCoca-Cola Company USA Ford Motor Company USAPepsico de México USA
Electronics:Tobacco: Hewlett-Packard USABritish American Tobacco UK Flextronics Manufacturing
Panasonic de México
Services Tourism: Finance and Insurance: Information systems:
Hoteles BBVA-Bancomer SPA Hewlett-Packard USAIntercontinental USA Santander Serfin SPA IBM de México USASabre Sociedad Tecno- Seguros ING-Comerciallógica USA América HOL
Metlife Mexico USA
Retail Trade:Wal-Mart de México USA
Source: Authors elaboration based in Mortimore, 2006; information from Expansión 500 Magazine.
Strategies of the most important MNCs in Mexico
Corporate Strategy
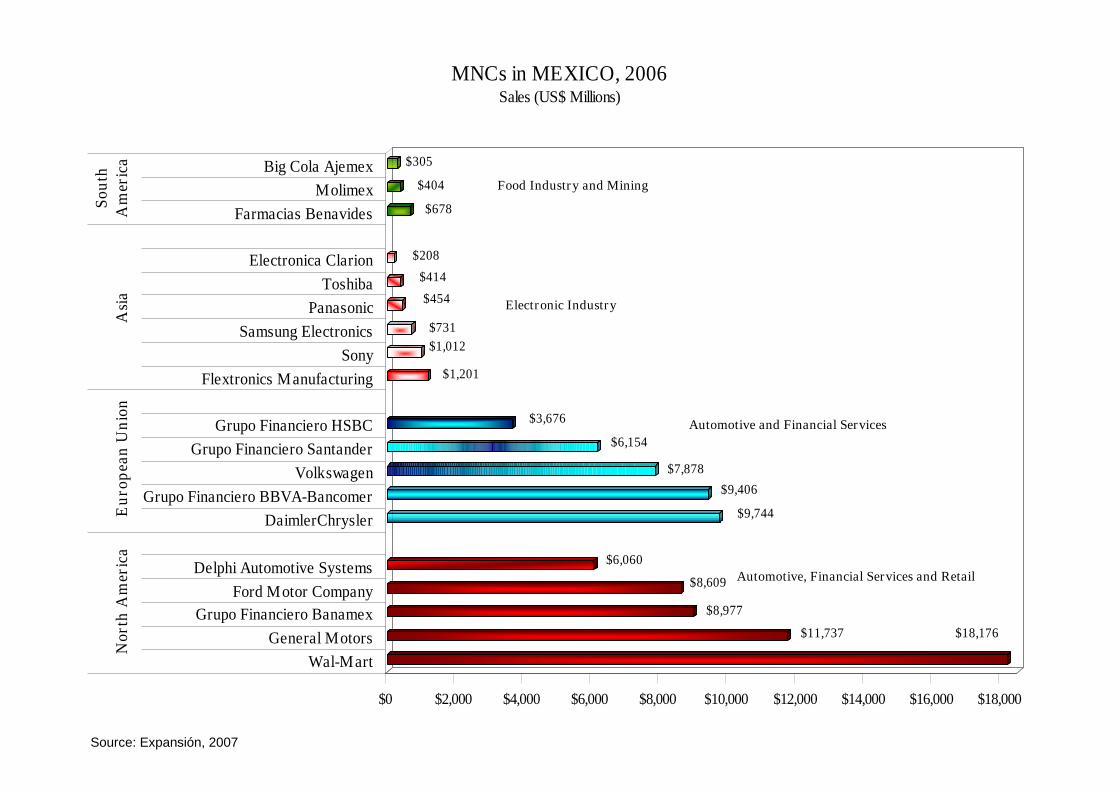
Source: Expansión, 2007
$18,176$11,737
$8,977
$8,609
$6,060
$9,744
$9,406
$7,878
$6,154
$3,676
$1,201
$1,012
$731
$454
$414
$208
$678
$404
$305
$0 $2,000 $4,000 $6,000 $8,000 $10,000 $12,000 $14,000 $16,000 $18,000
Wal-Mart
General Motors
Grupo Financiero Banamex
Ford Motor Company
Delphi Automotive Systems
DaimlerChrysler
Grupo Financiero BBVA-Bancomer
Volkswagen
Grupo Financiero Santander
Grupo Financiero HSBC
Flextronics Manufacturing
Sony
Samsung Electronics
Panasonic
Toshiba
Electronica Clarion
Farmacias Benavides
Molimex
Big Cola Ajemex
No
rth
Am
eric
aE
uro
pea
nU
nio
nA
sia
So
uth
Am
eric
a
MNCs in MEXICO, 2006Sales (US$ Millions)
Food Industry and Mining
Electronic Industry
Automotive and Financial Services
Automotive, Financial Services and Retail
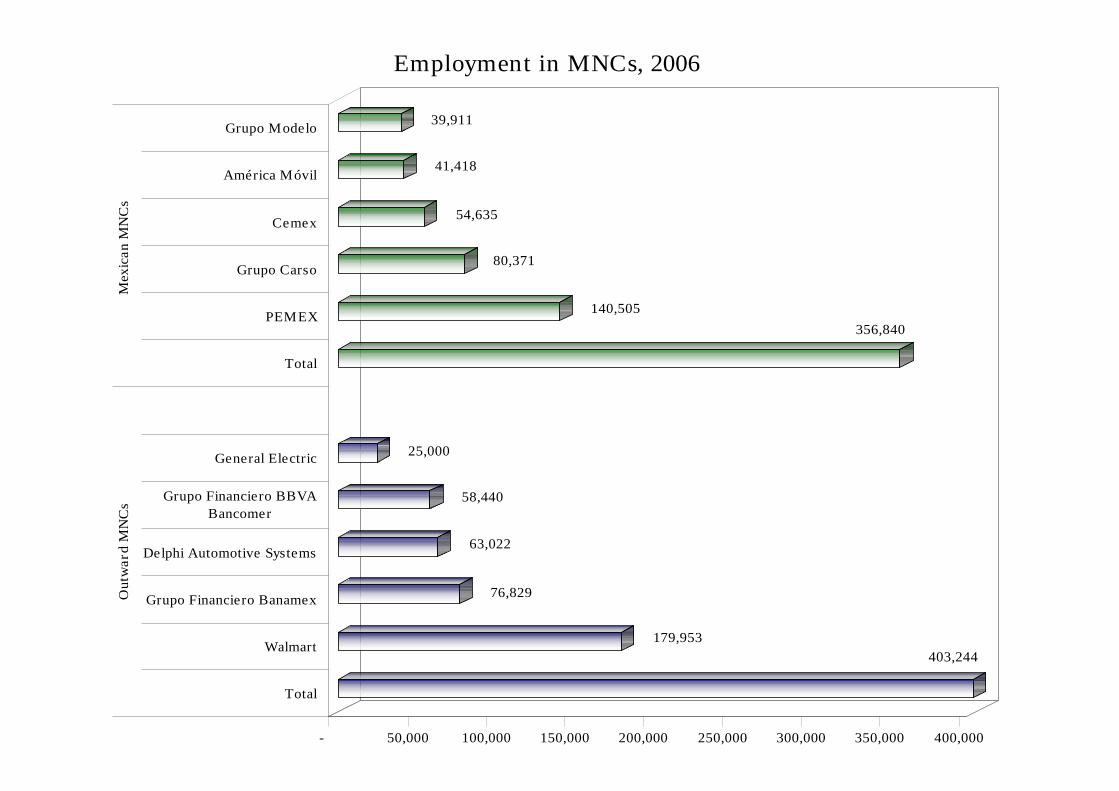
403,244
179,953
76,829
63,022
58,440
25,000
356,840
140,505
80,371
54,635
41,418
39,911
- 50,000 100,000 150,000 200,000 250,000 300,000 350,000 400,000
Total
Walmart
Grupo Financiero Banamex
Delphi Automotive Systems
Grupo Financiero BBVA
Bancomer
General Electric
Total
PEMEX
Grupo Carso
Cemex
América Móvil
Grupo ModeloO
utw
ard
MN
Cs
Mex
ica
nM
NC
s
Employment in MNCs, 2006
How’s the changing role of localoperations in the global division of
labour of these MNCs?
• MNC’s in Mexico are making andimportant upgrading in their operationsmainly due to process restructuring andchange of operations from US to Mexico.
• The most important sectors areautomotive, electronics and recently theaeronautic sector.
QRO.
COAHUILA
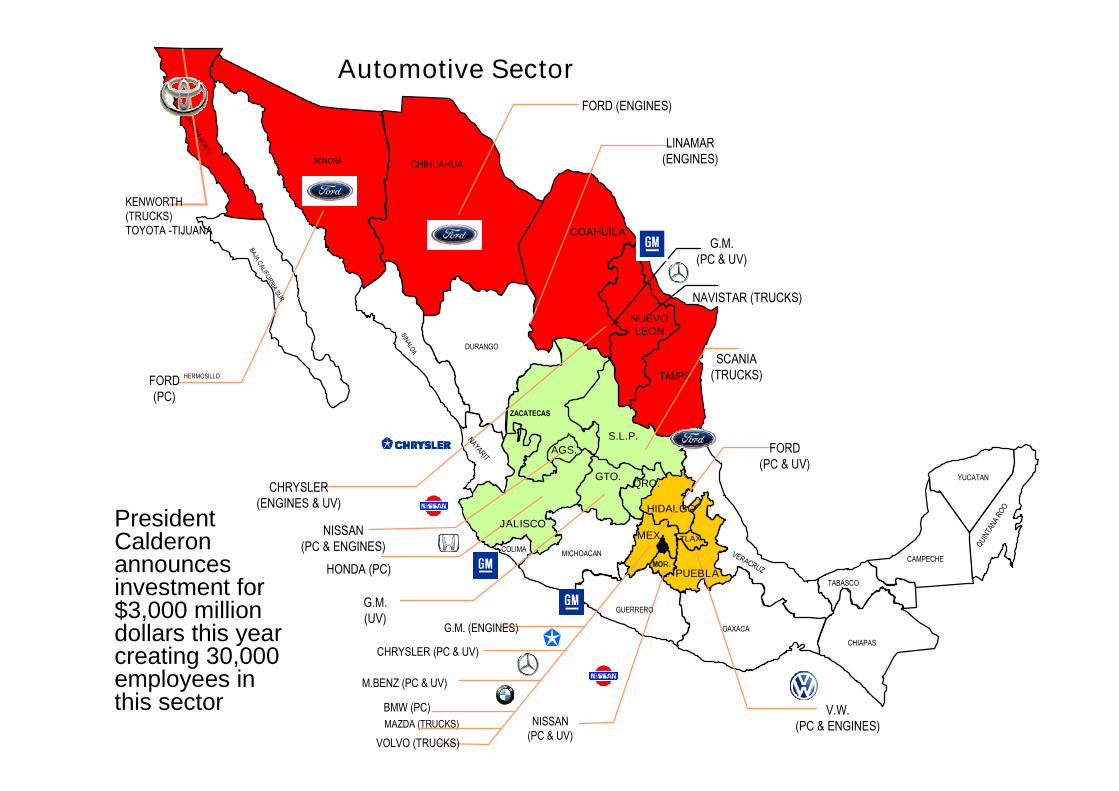
HERMOSILLOFORD(PC)
CHRYSLER(ENGINES & UV)
AGS.
NISSAN(PC & ENGINES)
GTO.
G.M.(UV)
M.BENZ (PC & UV)
V.W.(PC & ENGINES)
HONDA (PC)
SONORA
FORD (ENGINES)
CHIHUAHUA
LINAMAR(ENGINES)
MOR.
NISSAN(PC & UV)
BAJAC
ALIFOR
NIA
NO
RTE
BAJAC
ALIFOR
NIA
SUR
SINALO
A DURANGO
NAYARIT
ZACATECAS
S.L.P.
TAMPS.
VERACRUZ
COLIMAMICHOACAN
GUERRERO
OAXACA
CHIAPAS
TABASCO
CAMPECHE
YUCATAN
QU
INTA
NA
RO
OHIDALGO
TLAX.MEX.
PUEBLA
NUEVOLEON
G.M.(PC & UV)
G.M. (ENGINES)
CHRYSLER (PC & UV)
BMW (PC)
FORD(PC & UV)
MAZDA (TRUCKS)
VOLVO (TRUCKS)
KENWORTH(TRUCKS)TOYOTA -TIJUANA
SCANIA(TRUCKS)
NAVISTAR (TRUCKS)
JALISCO
Automotive Sector
PresidentCalderonannouncesinvestment for$3,000 milliondollars this yearcreating 30,000employees inthis sector
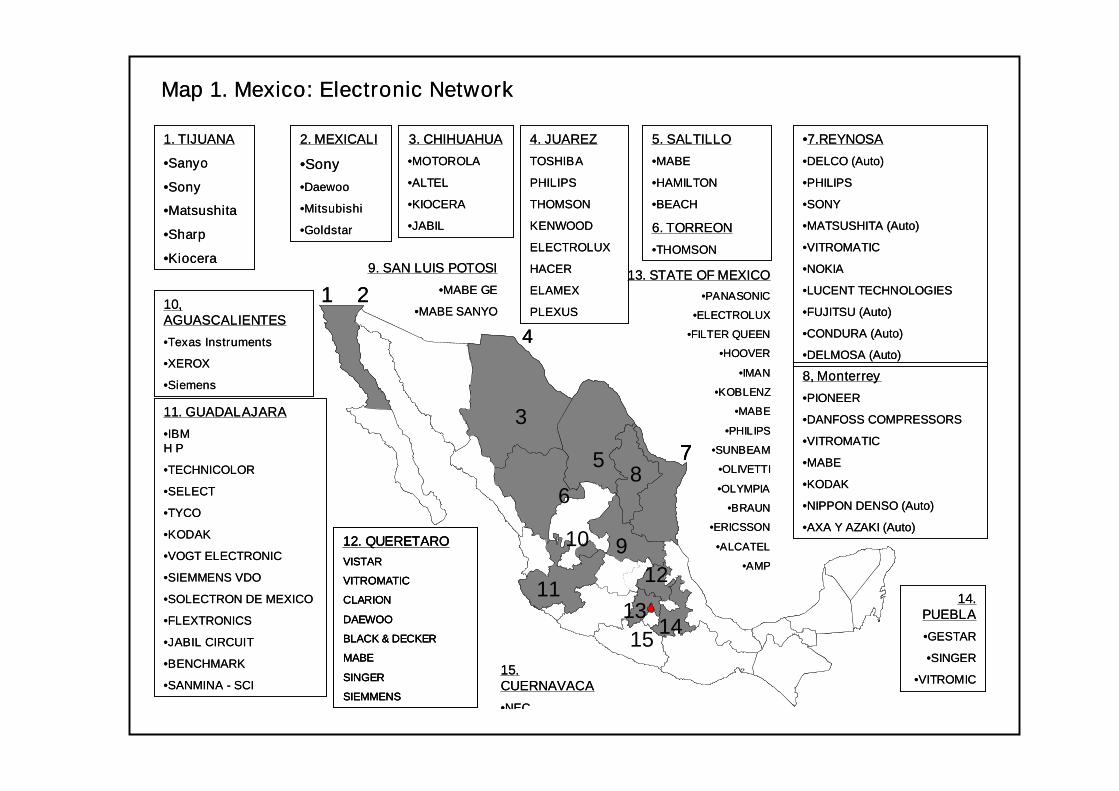
1. TIJUANA
•Sanyo
•Sony
•Matsushita
•Sharp
•Kiocera
10,AGUASCALIENTES
•Texas Instruments
•XEROX
•Siemens
11. GUADALAJARA
•IBMH P
•TECHNICOLOR
•SELECT
•TYCO
•KODAK
•VOGT ELECTRONIC
•SIEMMENS VDO
•SOLECTRON DE MEXICO
•FLEXTRONICS
•JABIL CIRCUIT
•BENCHMARK
•SANMINA - SCI
Map 1. Mexico: Electronic Network
2. MEXICALI
•Sony
•Daewoo
•Mitsubishi
•Goldstar
3. CHIHUAHUA
•MOTOROLA
•ALTEL
•KIOCERA
•JABIL
4. JUAREZ
TOSHIBA
PHILIPS
THOMSON
KENWOOD
ELECTROLUX
HACER
ELAMEX
PLEXUS
5. SALTILLO
•MABE
•HAMILTON
•BEACH
6. TORREON
•THOMSON
•7.REYNOSA
•DELCO (Auto)
•PHILIPS
•SONY
•MATSUSHITA (Auto)
•VITROMATIC
•NOKIA
•LUCENT TECHNOLOGIES
•FUJITSU (Auto)
•CONDURA (Auto)
•DELMOSA (Auto)
8, Monterrey
•PIONEER
•DANFOSS COMPRESSORS
•VITROMATIC
•MABE
•KODAK
•NIPPON DENSO (Auto)
•AXA Y AZAKI (Auto)
13. STATE OF MEXICO
•PANASONIC
•ELECTROLUX
•FILTER QUEEN
•HOOVER
•IMAN
•KOBLENZ
•MABE
•PHILIPS
•SUNBEAM
•OLIVETTI
•OLYMPIA
•BRAUN
•ERICSSON
•ALCATEL
•AMP
9. SAN LUIS POTOSI
•MABE GE
•MABE SANYO
14.PUEBLA
•GESTAR
•SINGER
•VITROMIC
1 2
12. QUERETARO
VISTAR
VITROMATIC
CLARION
DAEWOO
BLACK & DECKER
MABE
SINGER
SIEMMENS
3
4
5
6
7
13
8
11
910
12
14
15.CUERNAVACA
•NEC
15
1. TIJUANA
•Sanyo
•Sony
•Matsushita
•Sharp
•Kiocera
10,AGUASCALIENTES
•Texas Instruments
•XEROX
•Siemens
11. GUADALAJARA
•IBMH P
•TECHNICOLOR
•SELECT
•TYCO
•KODAK
•VOGT ELECTRONIC
•SIEMMENS VDO
•SOLECTRON DE MEXICO
•FLEXTRONICS
•JABIL CIRCUIT
•BENCHMARK
•SANMINA - SCI
Map 1. Mexico: Electronic Network
2. MEXICALI
•Sony
•Daewoo
•Mitsubishi
•Goldstar
3. CHIHUAHUA
•MOTOROLA
•ALTEL
•KIOCERA
•JABIL
4. JUAREZ
TOSHIBA
PHILIPS
THOMSON
KENWOOD
ELECTROLUX
HACER
ELAMEX
PLEXUS
5. SALTILLO
•MABE
•HAMILTON
•BEACH
6. TORREON
•THOMSON
•7.REYNOSA
•DELCO (Auto)
•PHILIPS
•SONY
•MATSUSHITA (Auto)
•VITROMATIC
•NOKIA
•LUCENT TECHNOLOGIES
•FUJITSU (Auto)
•CONDURA (Auto)
•DELMOSA (Auto)
8, Monterrey
•PIONEER
•DANFOSS COMPRESSORS
•VITROMATIC
•MABE
•KODAK
•NIPPON DENSO (Auto)
•AXA Y AZAKI (Auto)
13. STATE OF MEXICO
•PANASONIC
•ELECTROLUX
•FILTER QUEEN
•HOOVER
•IMAN
•KOBLENZ
•MABE
•PHILIPS
•SUNBEAM
•OLIVETTI
•OLYMPIA
•BRAUN
•ERICSSON
•ALCATEL
•AMP
9. SAN LUIS POTOSI
•MABE GE
•MABE SANYO
14.PUEBLA
•GESTAR
•SINGER
•VITROMIC
1 2
12. QUERETARO
VISTAR
VITROMATIC
CLARION
DAEWOO
BLACK & DECKER
MABE
SINGER
SIEMMENS
3
4
5
6
7
13
8
11
910
12
14
12. QUERETARO
VISTAR
VITROMATIC
CLARION
DAEWOO
BLACK & DECKER
MABE
SINGER
SIEMMENS
3
4
5
6
7
13
8
11
910
12
14
15.CUERNAVACA
•NEC
15
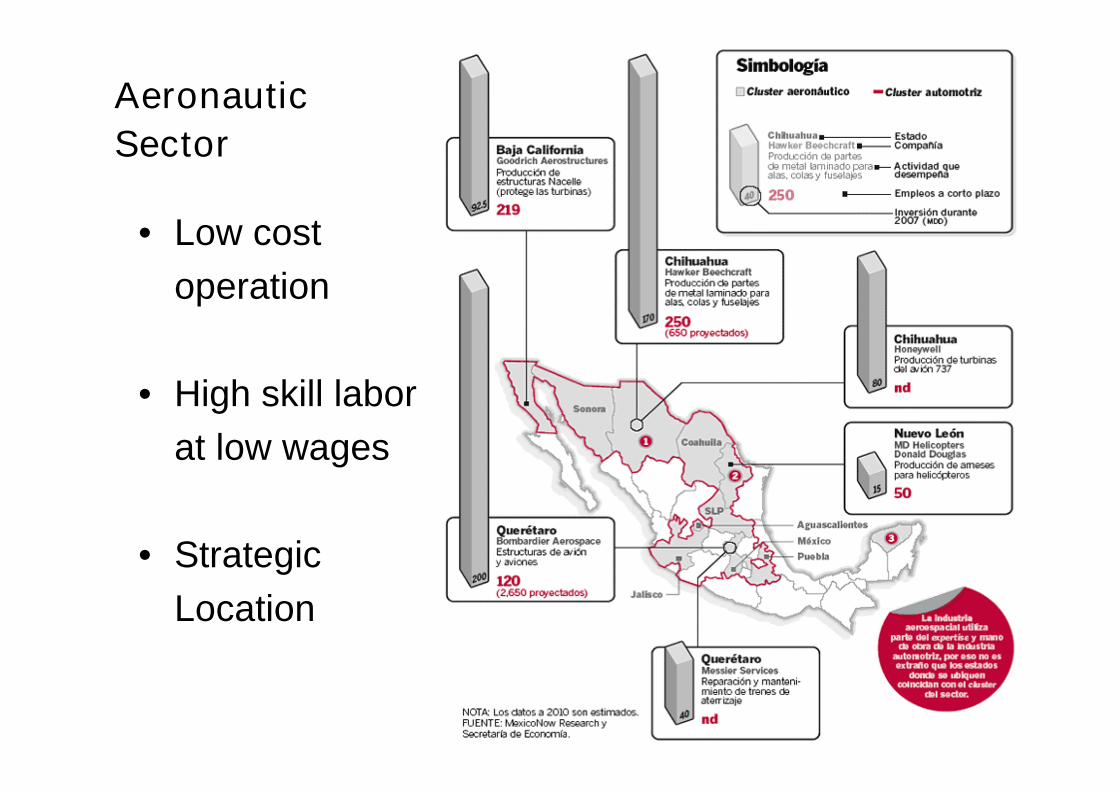
• Low cost
operation
• High skill labor
at low wages
• Strategic
Location
Aeronautic
Sector
MNCs from Mexico
• Emerging MNCs (“Trans-Latins”) from Mexicohave become an important phenomenon,particularly since the mid-1990s.
• Outward FDI by Trans-Latins is accounting foran increasing share of total FDI in Latin America.
• Their participation is mainly in basic industries,food and beverage, and services that are takingadvantage of proximity to the US.
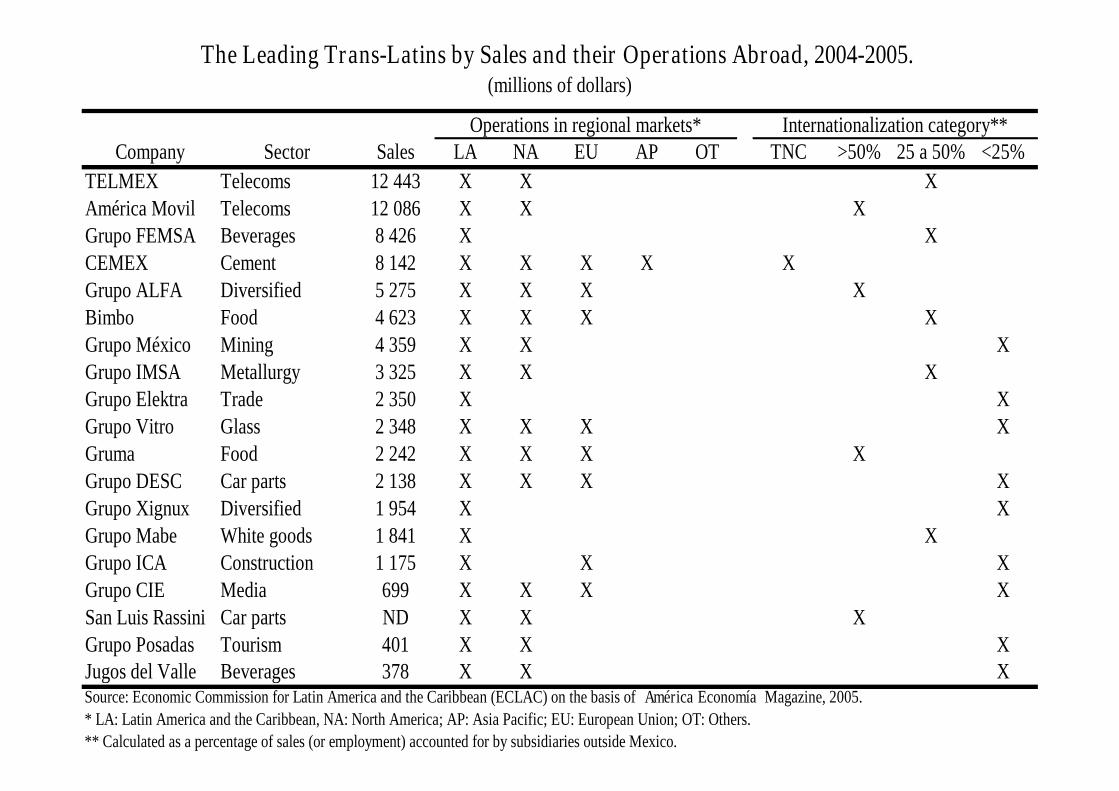
Company Sector Sales LA NA EU AP OT TNC >50% 25 a 50% <25%
TELMEX Telecoms 12 443 X X XAmérica Movil Telecoms 12 086 X X XGrupo FEMSA Beverages 8 426 X XCEMEX Cement 8 142 X X X X XGrupo ALFA Diversified 5 275 X X X XBimbo Food 4 623 X X X XGrupo México Mining 4 359 X X XGrupo IMSA Metallurgy 3 325 X X XGrupo Elektra Trade 2 350 X XGrupo Vitro Glass 2 348 X X X XGruma Food 2 242 X X X XGrupo DESC Car parts 2 138 X X X XGrupo Xignux Diversified 1 954 X XGrupo Mabe White goods 1 841 X XGrupo ICA Construction 1 175 X X XGrupo CIE Media 699 X X X XSan Luis Rassini Car parts ND X X XGrupo Posadas Tourism 401 X X XJugos del Valle Beverages 378 X X X
* LA: Latin America and the Caribbean, NA: North America; AP: Asia Pacific; EU: European Union; OT: Others.
** Calculated as a percentage of sales (or employment) accounted for by subsidiaries outside Mexico.
(millions of dollars)
The Leading Trans-Latins by Sales and their Operations Abroad, 2004-2005.
Operations in regional markets* Internationalization category**
Source: Economic Commission for Latin America and the Caribbean (ECLAC) on the basis of América Economía Magazine, 2005.
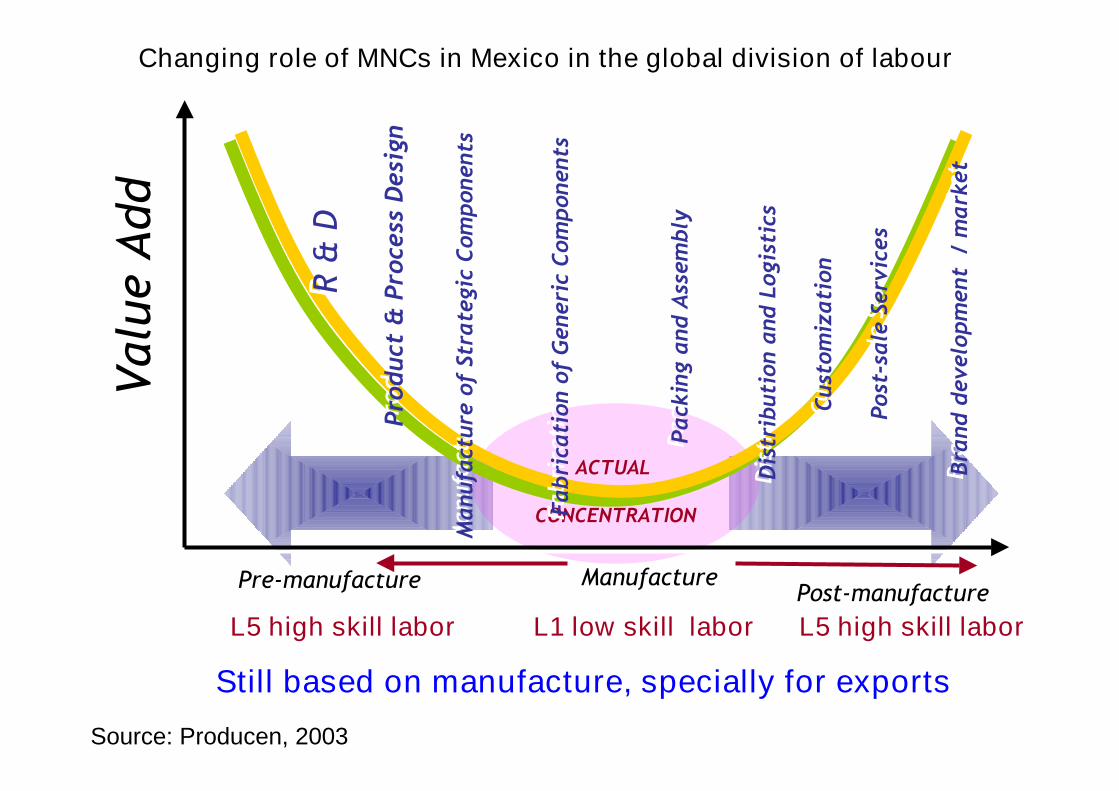
Still based on manufacture, specially for exports
ACTUAL
CONCENTRATION
Valu
eA
dd
Valu
eA
dd
Pre-manufacturePre-manufacture ManufactureManufacturePost-manufacturePost-manufacture
R&
DR
&D
Manufa
cture
of
Str
ate
gic
Com
ponents
Manufa
cture
of
Str
ate
gic
Com
ponents
Fabri
cati
on
of
Generi
cC
om
ponents
Fabri
cati
on
of
Generi
cC
om
ponents
Pro
duct
&Pro
cess
Desi
gn
Pro
duct
&Pro
cess
Desi
gn
Pack
ing
and
Ass
em
bly
Pack
ing
and
Ass
em
bly
Cust
om
izati
on
Cust
om
izati
on
Dis
trib
uti
on
and
Logis
tics
Dis
trib
uti
on
and
Logis
tics
Bra
nd
develo
pm
ent
/m
ark
et
Bra
nd
develo
pm
ent
/m
ark
et
Post
-sale
Serv
ices
Post
-sale
Serv
ices
L1 low skill laborL1 low skill labor L5 high skill laborL5 high skill laborL5 high skill laborL5 high skill labor
Changing role of MNCs in Mexico in the global division of labour
Source: Producen, 2003
How has Mexico sought to position itself inglobal value chains?
• First, creating the environment conditions to be anexport platform for manufactures.
• Second, trying to upgraded through more advancedtechnology (FDI strategic policy) (‘maquilasgenerations’) and stimulating linkages betweenOEMs & suppliers(Contract Manufacturers), andlinkages with educational sector and support localinstitutions.
• Third, trying to build and national/regionalinnovation system and moved from ‘maquiladoramodel’ to a higher value activities (related withknowledge-economy).
What are the HR, employment and publicpolicy implications of this strategy?
• Volatility in the volume of employment.
• High skill workers
• Labor flexibility
• Cost reduction pressures or Low wagestrategy mainly because of the presuresfrom China

Thank You