Embed Size (px)
Citation preview

Multiparameter RNA and Codon Optimization: AStandardized Tool to Assess and Enhance AutologousMammalian Gene ExpressionStephan Fath1, Asli Petra Bauer2, Michael Liss1, Anne Spriestersbach3, Barbara Maertens3, Peter Hahn3,
Christine Ludwig1, Frank Schafer3, Marcus Graf1, Ralf Wagner1,2*
1 Geneart AG, BioPark, Regensburg, Germany, 2 Molecular Microbiology and Gene Therapy Unit, Institute of Medical Microbiology and Hygiene, University of Regensburg,
Regensburg, Germany, 3 QIAGEN GmbH, Hilden, Germany
Abstract
Autologous expression of recombinant human proteins in human cells for biomedical research and product development isoften hampered by low expression yields limiting subsequent structural and functional analyses. Following RNA and codonoptimization, 50 candidate genes representing five classes of human proteins – transcription factors, ribosomal andpolymerase subunits, protein kinases, membrane proteins and immunomodulators – all showed reliable, and 86% evenelevated expression. Analysis of three representative examples showed no detrimental effect on protein solubility whileunaltered functionality was demonstrated for JNK1, JNK3 and CDC2 using optimized constructs. Molecular analysis of asequence-optimized transgene revealed positive effects at transcriptional, translational, and mRNA stability levels. Sinceimproved expression was consistent in HEK293T, CHO and insect cells, it was not restricted to distinct mammalian cellsystems. Additionally, optimized genes represent powerful tools in functional genomics, as demonstrated by the successfulrescue of an siRNA-mediated knockdown using a sequence-optimized counterpart. This is the first large-scale studyaddressing the influence of multiparameter optimization on autologous human protein expression.
Citation: Fath S, Bauer AP, Liss M, Spriestersbach A, Maertens B, et al. (2011) Multiparameter RNA and Codon Optimization: A Standardized Tool to Assess andEnhance Autologous Mammalian Gene Expression. PLoS ONE 6(3): e17596. doi:10.1371/journal.pone.0017596
Editor: Grzegorz Kudla, University of Edinburgh, United Kingdom
Received October 14, 2010; Accepted January 30, 2011; Published March 3, 2011
Copyright: � 2011 Fath et al. This is an open-access article distributed under the terms of the Creative Commons Attribution License, which permits unrestricteduse, distribution, and reproduction in any medium, provided the original author and source are credited.
Funding: This work was funded by Geneart AG (primary funder) and in part by Qiagen GmbH. Assessment of Mip1a expression and analysis of underlyingmolecular mechanisms was funded by the Bayerische Forschungsstiftung, Grant 288/02 (ForImmun). The funders designed the study, collected and analysed data,decided to publish and prepared the manuscript. Geneart AG performed gene synthesis and codon and RNA optimized constructs, performed and analyzedmammalian gene expression experiments, performed and analyzed functionality of JNK1 expression, performed siRNA-mediated knockdown of optimized genesand wrote the manuscript. The molecular analysis of MIP1a-expression was performed by University of Regensburg, Germany. Qiagen GmbH performed andanalyzed Sf9 expression experiments and performed and analyzed the CDC2 rescue study.
Competing Interests: The authors declare competing financial interests: Geneart performed the gene design, optimization and synthesis; optimized genes aremarketed as QIAgenes by QIAGEN. The authors also declare competing interests in the form of patent family WO04059556 including all national patents andpending applications. The authors declare that all other data and materials described in the manuscript adhere to all the PLoS ONE policies on sharing data andmaterials. S.F., M.L., C.L., M.G. and R.W. are employed by Geneart AG; A.S., B.M., P.H. and F.S. are employed by Qiagen GmbH and A.P.B. and R.W. are employed bythe University of Regensburg.
* E-mail: [email protected]
Introduction
Heterologous expression of recombinant proteins is an indis-
pensable process in modern biotechnology and biomedicine. E. coli
is the preferred host for protein production due to its fast growth,
easy handling, inexpensive culturing and well-studied genetics.
However, besides the lack of posttranslational modifications or a
suitable environment for membrane proteins, E. coli-mediated
expression is often associated with protein misfolding or aggregation
[1], imposing restrictions on large-size or oligomeric proteins.
To overcome these limitations, the repertoire of expression
systems for recombinant proteins was extended to gram-positive
bacteria, yeast, filamentous fungi, insect cells and plants [2–4].
Nevertheless, non-mammalian cells’ inability to synthesize au-
thentic human glycoproteins finally directed endeavors towards
improving mammalian expression systems to fulfill the structural
and functional quality requirements for downstream applications.
Accordingly, 70% of recombinant protein pharmaceuticals and
most proteins used for vaccination, human therapy or diagnostics
are currently produced in mammalian cells [5]. In particular, cell
lines such as CHO or HEK293 have become golden standards for
high-yield production of functional recombinant human proteins.
However, even in autologous hosts, transcriptional silencing,
mRNA destabilization, alternative splicing, premature polyade-
nylation, or inefficient translation often compromise protein
expression. Although sometimes solved by engineering the
expression host (e.g. providing rare tRNA pools [6]) or using
improved expression cassettes with strong or tissue-specific
promoters, most of these problems are gene-specific, requiring
direct modification of the coding sequence.
Several DNA- or mRNA-based sequence motifs apparently play
a decisive role in modulating gene expression. Whereas UpA-
dinucleotides, preferred targets of endoribonuclease cleavage,
seem to be critical for mRNA stability [7], CpG-dinucleotides
provide hot-spots for mutations [8] and were implicated in
methylation-dependent gene silencing [9]. In contrast, the
intragenic CpG-content of transgenes was reported to directly
correlate with de novo transcription [10]. AU-rich (ARE)-elements
PLoS ONE | www.plosone.org 1 March 2011 | Volume 6 | Issue 3 | e17596

in the 39 untranslated region of mRNAs are well-studied
determinants of mRNA instability [11,12], and some more
complex AU-rich, repressive sequence-motifs identified in certain
viral RNAs must be eliminated to allow independent mammalian
expression of such genes [13–16].
Instead of identifying and eliminating such motifs, the same
effect can be achieved by adapting the codon usage of these AT-
rich viral genes to the more GC-rich codon preferences of
mammalian genes. Due to the degeneracy of the genetic code, the
use of synonymous codons for defined amino acids differs in each
organism. Indeed, the strategy of using synonymous codons while
maintaining the original protein sequence proved particularly
successful in HIV research, increasing the stability of certain
mRNAs by orders of magnitude [16,17].
Several studies have proven the immense impact of codon choice
on gene expression in mammalian cells [18,19]. In particular, non-
mammalian gene expression in mammalian hosts was significantly
enhanced by substituting rare codons with more frequent ones
[20–22]. Besides inter-species variations, codon usage even differs
among human tissue cells [23] and mammalian housekeeping genes
are usually associated with higher GC-content than low-expressing
genes [24]. Recently, differences in tissue-specific expression of
individual tRNA species and the relative abundance of tRNA-
isoacceptors [25] were described to strongly correlate with the
codon usage of genes highly expressed in specific tissues.
Such findings strongly suggest that a comprehensive optimiza-
tion strategy involving simultaneous modulation of multiple
sequence parameters might be the best solution to guaranteeing
optimal performance of human genes in autologous expression
systems. Despite individual reports describing mammalian
expression enhancement using optimized genes (reviewed in
[18]), no representative study has been carried out to scrutinize
the general validity of improving autologous expression by gene
optimization.
Here, we describe the first large-scale study addressing the
influence of multiparameter optimization on autologous human
protein expression. Our system was designed to represent the most
important human protein classes. We provide evidence that our
optimization approach is a reliable tool for improving expression,
affecting processes at different molecular levels.
Results
Design of a comparative large-scale study on autologousexpression of codon- and RNA-optimized human genes
To scrutinize the general validity of codon optimization for
enhancing recombinant human protein expression in mamma-
lian cell culture, we designed a large-scale study that included a
broad selection of human genes. We chose 50 proteins from the
NCBI-Entrez-database, representing the five most important
protein classes of pharmaceutical and scientific interest: tran-
scription factors (TF), ribosomal proteins (RB), protein kinases
(PK), membrane proteins (MP), and immunomodulators (IM),
summarized together with their database accession numbers in
Table 1.
Using the sliding window approach [26] as described in the
methods section we optimized the various candidate genes’ coding
regions taking the following sequence-based parameters into
account (for review see [19]): (i) Codon choice, (ii) increase in
GC-content, (iii) avoiding UpA- and introducing CpG-dinucleo-
tides, (iv) removing destabilizing RNA elements, (v) removing
cryptic splice-sites, (vi) avoiding intragenic poly(A)-sites,
(vii) removing direct repeats, (viii) avoiding RNA secondary
structures, and (ix) deleting internal ribosomal entry sites. All
selected genes were synthesized de novo as wildtype and sequence-
optimized versions, both encoding the same amino acid sequence.
To assess protein expression, all coding regions were linked to a 39-
histidine6-tag to allow efficient detection using the a-Penta-His
antibody. A FASTA file containing the sequences of all wildtype
and sequence optimized constructs used in this study is provided as
supplementary information (File S1).
Gene optimization results in reliable expression andincreased protein yields
For statistical evaluation of gene expression, three different
plasmid preparations of each construct were transfected indepen-
dently into HEK293T cells. Equal sample amounts were analyzed
by Western blotting, and signals were standardized against an
endogenous 60 kD protein not affected by transgene expression,
but reliably cross-reacting with the a-Penta-His antibody (Fig. 1A).
Since three membrane proteins were not detected by the a-Penta-
His antibody, we synthesized these genes with a 36-Flag-tag,
which enabled efficient detection of all six, wildtype and
optimized, gene products. The respective protein amounts were
standardized to endogenous GAPDH or b-actin levels. Commer-
cial monoclonal antibodies were used for HCK- and LAMP1-
specific protein detection (results not shown).
Sequence optimization frequently led to substantially elevated
protein levels as seen in Western blots (Fig. 1A). Relative
expression levels of wildtype and optimized gene constructs were
calculated for each protein in all the protein classes (Fig. 1B, C;
Table 1). Altogether, six out of 50 wildtype genes tested failed to
express detectable levels of protein, whereas all 50 sequence-
optimized constructs were successfully expressed (Fig. 1D; Table 1).
In summary, 96% of the optimized constructs performed
equally, or better than their wildtype counterparts, while 86%
clearly achieved increased protein expression levels. Notably, 53%
of those 86% increased expression performance by at least 100%
(Table 1), underlining the high quality of the in silico optimization
and de novo synthesis process.
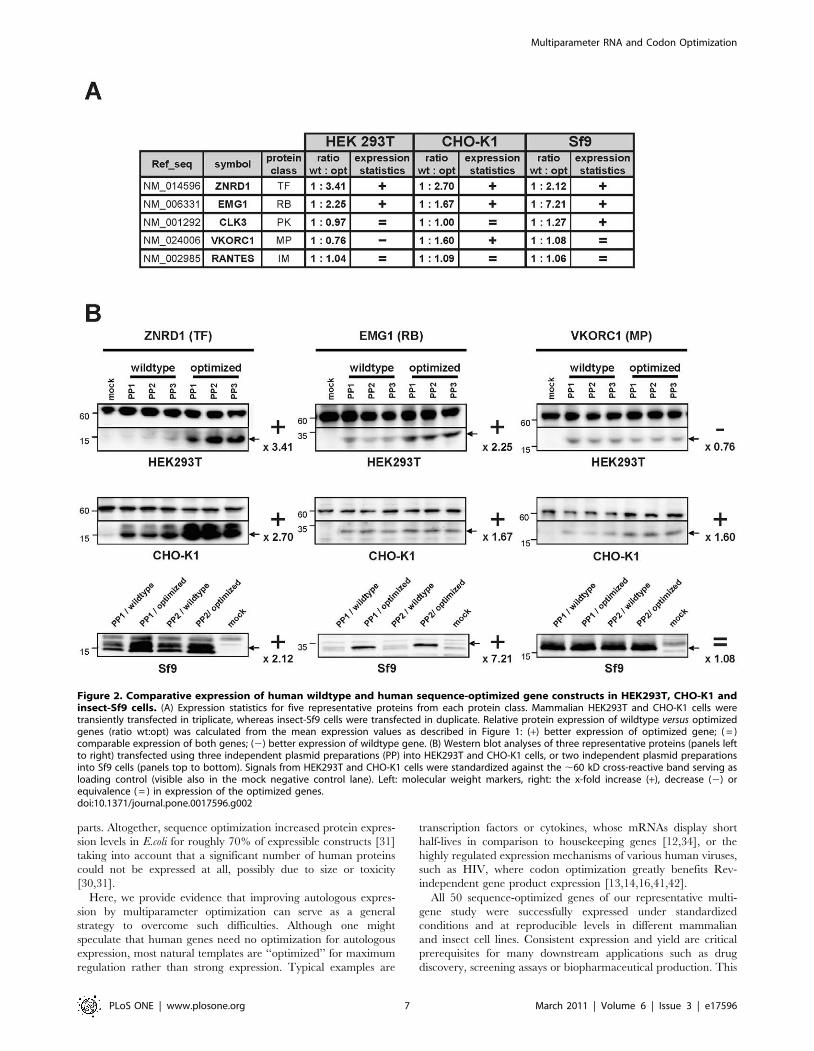
Next, we asked whether our optimization strategy is comparably
efficient in other mammalian or eukaryotic cells. We tested five
representative gene constructs from our collection in either CHO-
K1, routinely used to generate stable cell lines, or insect-Sf9 cells
widely used for recombinant protein production, in comparison to
HEK293T cells (Fig. 2). In general, the impact of gene
optimization was comparable in all three systems: All tested
optimized constructs performed comparably, or even better than
the wildtype genes in CHO or Sf9 cells, and only the optimized
vkorc1 gene was more poorly expressed in HEK293T cells. More
importantly, these data demonstrate that the multiparameter
algorithm used to optimize genes for mammalian expression is
equally suitable for improving expression in insect cells.
Gene optimization affects multiple levels of geneexpression
To investigate the molecular mechanisms underlying optimiza-
tion-based expression improvement, we chose the test gene mip-1a.
This belongs to a family of cytokines subject to stringent and
sensitive regulation, and might therefore be particularly susceptible
to optimization-induced effects. To avoid potential saturation
effects resulting from multi-copy expression in transient transfec-
tions, we generated cell lines expressing a stably integrated version
of the wildtype or sequence-optimized mip-1a gene. The single-
copy integration of the transgenes into a specific locus allows direct
comparison of gene-specific effects in the same genomic context
and should reveal minimal discrepancies in expression.
Multiparameter RNA and Codon Optimization
PLoS ONE | www.plosone.org 2 March 2011 | Volume 6 | Issue 3 | e17596

Table 1. Direct comparison of expression levels of 50 wildtype and sequence-optimized human genes.
Ref_seq symbol PClength(bp) CAI % GC
codonsaltered(n)
codonsaltered(%)
ratioexpression
expressionstatistics
wt opt wt opt wt: opt
NM_001514 TFIIB TF 948 0.77 0.97 44% 62% 213 67% 1:1.18 +
NM_004379 CREB1 TF 981 0.76 0.96 47% 63% 213 65% 1:2.80 +
NM_014596 ZNRD1 TF 409 0.83 0.98 54% 64% 69 55% 1:3.41 +
NM_016269 Lef1 TF 1197 0.82 0.97 51% 63% 232 58% 1:3.28 +
NM_006331 EMG1 RB 763 0.79 0.97 51% 64% 149 61% 1:2.25 +
NM_139071 SMARCD1 RB 1305 0.82 0.98 52% 62% 248 57% 1:1.85 +
NM_002648 PIM1 PK 939 0.85 0.97 59% 62% 137 44% 1:1.12 +
NM_006875 PIM2 PK 933 0.82 0.97 60% 65% 167 54% 1:1.28 +
NM_001001852 PIM3 PK 978 0.87 0.97 69% 66% 130 40% 1:1.01 =
NM_025195 Trb1 PK 1116 0.84 0.97 61% 64% 200 54% 1:1.23 +
NM_004972 JAK2 PK 3396 0.77 0.98 39% 60% 784 69% 1:6.00 +
NM_002110 HCK PK 1578 0.88 0.98 57% 62% 224 43% 1:2.40 +
NM_005356 LCK PK 1527 0.87 0.98 58% 63% 222 44% 1:1.90 +
NM_002019 FLT1 PK 4014 0.80 0.98 45% 60% 821 61% 1:3.94 +
NM_002755 MAP2K1 PK 1179 0.84 0.97 53% 62% 207 53% 1:1.05 =
NM_004073 PLK3 PK 1938 0.84 0.97 61% 64% 322 50% 1:1.15 +
NM_002745 Erk2 PK 1080 0.81 0.98 47% 61% 204 57% 1:1.34 +
NM_001315 p38a PK 1080 0.82 0.98 47% 62% 213 59% 1:2.57 +
NM_002750 JNK1 PK 1152 0.78 0.98 42% 60% 261 68% 1:2.78 +
NM_002753 JNK3 PK 1266 0.81 0.98 45% 60% 238 56% 1:14.73 +
NM_001292 CLK3 PK 487 0.85 0.97 60% 67% 92 61% 1:0.97 =
NM_001892 CK1a PK 1011 0.79 0.98 44% 60% 201 60% 1:1.95 +
NM_003042 GAT1 MP 1797 0.87 0.98 56% 61% 254 42% 1:1.19 +
NM_001045 Serotonin-TP* MP 1890 0.83 0.97 53% 60% 322 51% 1:1.27 +
NM_030956 TLR10 MP 2433 0.76 0.98 38% 58% 551 68% only opt +
NM_014437 SLC39A1 MP 972 0.83 0.96 62% 65% 160 49% 1:0.29 2
NM_000220 KCNJ1 MP 1173 0.81 0.98 45% 60% 231 59% only opt +
NM_001651 AQP5 MP 795 0.87 0.96 63% 63% 112 42% 1:9.05 +
NM_001753 CAV1 MP 534 0.84 0.99 50% 59% 88 49% 1:1.04 =
NM_000593 TAP1 MP 2424 0.82 0.96 60% 65% 446 55% 1:1.97 +
NM_000544 TAP2 MP 2109 0.84 0.96 59% 64% 345 49% 1:2.37 +
NM_005561 LAMP1 MP 1251 0.84 0.97 56% 62% 206 49% 1:1.28 +
NM_002294 LAMP2 MP 1230 0.78 0.98 43% 61% 280 68% only opt +
NM_014398 LAMP3 MP 1248 0.78 0.97 50% 64% 269 65% 1:2.80 +
NM_000086 CLN3 MP 1314 0.84 0.97 60% 64% 211 48% 1:2.64 +
NM_014319 LEMD3 MP 2733 0.76 0.96 52% 64% 583 64% 1:1.29 +
NM_000914 OPRM1 MP 1200 0.83 0.98 49% 60% 212 53% 1:2.70 +
NM_023921 TAS2R10 MP 921 0.75 0.99 36% 55% 204 66% only opt +
NM_024006 VKORC1 MP 520 0.83 0.98 59% 65% 73 45% 1:0.76 2
NM_002507 NGFR MP 1281 0.88 0.97 66% 66% 170 40% 1:1.15 +
NM_000585 IL-15 IM 486 0.73 0.98 36% 58% 126 78% only opt +
NM_011337.2 Mip1a IM 276 0.82 0.97 52% 59% 52 57% 1:1.48 +
NM_000586 IL-2 IM 459 0.78 0.97 39% 58% 98 64% only opt +
NP_000610 IFNc IM 498 0.77 0.98 39% 56% 116 69% 1:1.81 +
NM_006850 IL-24 IM 618 0.82 0.98 50% 62% 103 50% 1:1.20 +
NM_000572 IL-10 IM 534 0.86 0.98 51% 59% 80 45% 1:1.35 +
NM_002985 RANTES IM 304 0.84 0.96 56% 62% 46 51% 1:1.04 =
Multiparameter RNA and Codon Optimization
PLoS ONE | www.plosone.org 3 March 2011 | Volume 6 | Issue 3 | e17596

MIP-1a production was determined by ELISA using culture
supernatants, since secreted MIP-1a levels directly correspond to
the expressed protein amounts. CHO cells expressing the
optimized variant revealed a 300% increase in protein expression
(Fig. 3A), a two-fold increase compared to MIP-1a expression in
the transient HEK293T cell system (Table 1). It seems the single-
copy status results in optimization-mediated effects becoming even
more apparent in stably expressed genes.
Gene-specific effects on de novo RNA synthesis examined by
nuclear run-on experiments revealed a 30% increase in RNA
amounts transcribed from the optimized mip-1a gene (Fig. 3B). To
test the influence of gene optimization on mRNA stability, we
inhibited RNA synthesis with Actinomycin D for different time
periods before determining mip-1a mRNA half-lives. Real-time
PCR revealed that the optimized construct’s mRNA half-life
increased by 14% (Fig. 3C), suggesting gene optimization directly
influences mRNA stability.
The combined positive effects of gene optimization on de novo
synthesis rates and mRNA stability were expected to significantly
increase the resulting mRNA steady-state levels. To confirm this,
mip-1a transcripts isolated from nuclear and cytoplasmic cell
fractions were analyzed by Northern blots (Fig. 3D). We detected a
single distinct signal corresponding to the expected size of
unspliced mip-1a mRNA, which argues against cryptic splicing
events. We quantified mRNA amounts by reverse-transcription
and quantitative real-time PCR of nuclear and cytoplasmic
transcripts from both cell lines. The results confirmed previous
observations, revealing an 80% increase in gene-optimized mip-1atranscript amounts in both cell fractions (Fig. 3E).
Finally, we tested the influence of gene optimization on
translational efficiency using a cell-based translation assay. To
exclude the nuclear compartment, HEK293T cells were infected
with an MVA virus expressing a T7-RNA polymerase that
mediates cytoplasmic transcription of transfected mip-1a genes
under the control of the T7-promoter. MIP-1a levels were
determined 24 hours post-transfection by ELISA (Fig. 3F). As
expected, the optimized variant showed a 20% increase in
translational efficiency, likely associated with the higher CAI
value (Table 1).
Taken together, these experiments suggest that gene optimiza-
tion affects gene expression at the transcriptional, posttranscrip-
tional and translational level, thus significantly elevating MIP-1aprotein levels.
Kinases overexpressed from an optimized gene showunaltered activity
Overexpression of transgenes in heterologous expression
systems often results in insoluble and non-functional proteins
due to misfolding or incorrect posttranslational modifications. In
principle, autologous expression should overcome these problems,
although sequence modifications introduced by gene optimization
might influence protein folding, and therefore solubility and
protein function. Given results of heterologous expression in E. coli
showing that optimizing high level expression does not necessarily
correlate with soluble protein production, we chose three kinases
with significant expression level increase (JNK1 - 2.8-fold increase,
JNK3 – 15-fold increase, p38a - 2.6-fold increase; Table 1) using
heavy detergent lysis buffer. To test for solubility of overexpressed
proteins, we reproduced protein expression but cells were lysed
under more mild conditions followed by subsequent centrifugation
for 30 minutes at 16000 g. Western Blot analysis confirmed our
initial findings (Table 1) and resulted in even higher expression
levels in case for JNK3 and p38a, demonstrating that overex-
pressed protein according to gene optimization was soluble
(Fig. 4A). To compare the functionality of proteins produced
from optimized or wildtype genes, we chose kinase JNK1 and
JNK3 (showing the most significant expression level increase of all
proteins in the study, Table 1, Fig.1) as representative candidates.
JNK1 and JNK3 recombinant proteins purified under native
conditions were incubated with GST-c-Jun-bound beads to test
the capability of the respective kinases to phosphorylate their
substrate. Western blotting of the kinase proteins pulled down by
the GST-c-Jun beads confirmed equivalent (saturated) amounts of
wildtype and optimized JNK1 (Fig. 4B, upper blot). In vitro
phosphorylated c-Jun was then quantified by Western blotting
using antibodies specific for phosphorylated substrate. No
difference in in vitro activity was observed between the two kinase
constructs, indicating that the increased expression induced by
gene optimization had no impact on protein function (Fig. 4B,
lower blot). In case for JNK3, Ni-affinity purification of only JNK3
‘‘optimized’’ did provide sufficient protein to saturate GST-c-Jun
substrate beads as demonstrated by Western blot analysis (data not
shown), while ‘‘wildtype’’ JNK3 only bound minor amounts of
protein (Fig. 4C, upper blot and panel) obtained from expression
in a 6well format. Termination of the kinase reaction at a certain
timepoint revealed recombinant kinase activity (wt AND opt)
clearly over endogenous background activity (mock), while higher
Table 1. Cont.
Ref_seq symbol PClength(bp) CAI % GC
codonsaltered(n)
codonsaltered(%)
ratioexpression
expressionstatistics
wt opt wt opt wt: opt
NM_024013 IFNa IM 567 0.85 0.97 50% 61% 99 52% 1:1.16 +
NM_001012271 BIRC5 other 495 0.84 0.96 54% 61% 84 51% 1:4.24 +
NM_001786 CDC2 other 891 0.76 0.98 39% 59% 217 73% 1:2.85 +
Columns left to right: Ref_seq.: Gene Bank accession number; symbol: encoded protein, e.g. *Serotonin-TP = Serotonin transporter; PC: protein class (TF = transcriptionfactor; RB = ribosomal protein; PK = kinase; MP = membrane protein; IM = immunomodulator; and two other proteins); length: size of open reading frame in basepairs; CAI (codon adaptation index) [19,48]: measure for the ‘‘relative adaptability’’ of the codon usage of the gene of interest to codons used in highly expressed genes.The CAI represents the geometric mean of the relative adaptiveness values of the used codons. The relative adaptiveness value of a synonymous codon represents theratio of the frequency of this codon in the codon usage of a given expression system and the frequency of the most frequent synonymous codon for the specific aminoacid, leading to a value of 1.0 for the optimal codon and less frequently used codons are scaled down accordingly. %GC: percentage of GC-content in the respectivetransgene; codons altered (n): total number of codons altered in the open reading frame; codons altered (%): percentage of codons altered in the open reading frame;ratio expression wt: opt: mean expression from three independent transfections of wildtype genes were set to 1 and then compared to the mean expression ofoptimized genes; expression statistics: wt,opt: +; wt = opt (+/2 10%): = ; wt.opt: 2. Average variations $10% were considered an improvement in expression (+).doi:10.1371/journal.pone.0017596.t001
Multiparameter RNA and Codon Optimization
PLoS ONE | www.plosone.org 4 March 2011 | Volume 6 | Issue 3 | e17596

Multiparameter RNA and Codon Optimization
PLoS ONE | www.plosone.org 5 March 2011 | Volume 6 | Issue 3 | e17596

amounts of ‘‘optimized’’ protein resulted in higher amounts of
phosphorylated substrate (Fig. 4C, lower blot and panel). This
clearly demonstrates activity of overexpressed JNK3 kinase.
Recombinant kinase activity of p38a from optimized constructs
was determined as well, resulting in in vitro phosphorylated
substrate ATF-2, but could not be separated free of doubt from
endogenous kinase activity (data not shown).
Optimized synthetic genes represent valuable tools inRNAi
Short-interfering RNA (siRNA)-mediated gene silencing is a
widespread strategy to analyze gene function. However, a key
challenge is differentiating between a true cellular phenotype
and so-called off-target effects, since a given siRNA may
concomitantly trigger a multitude of unspecific secondary
mechanisms. If siRNA-mediated downregulation of a specific
gene provides a detectable cellular phenotype, a rescue
experiment is required to see whether co-expressing the targeted
gene with the siRNA restores the wildtype phenotype. Rescue
experiments are often limited by the availability of siRNAs
targeting the endogenous, but not the exogenous gene. Due to
the presence of ‘‘silent mutations’’ in optimized genes, sequence-
optimized constructs can be employed for virtually any RNAi
rescue experiment.
To test this, we analyzed the cell cycle regulator CDC2 in
MCF-7 cells, where the sequence-optimized gene construct
expressed 2.9-fold higher protein levels than the wildtype
(Fig. 5A). 16.2% of untransfected MCF-7 cells were in the G2
phase, as assessed by FACS analysis, but transfection of siRNA
targeting endogenous cdc2 mediated CDC2-knockdown to
induce cell-cycle arrest, with 36.3% of the cells in the G2-phase
(Fig. 5B). To verify that this cell-cycle arrest was CDC2-
dependent, the sequence-optimized cdc2 gene construct was co-
transfected with CDC2 siRNA. Cells in the G2-phase were
reduced to 23.4%, indicating that expression of the sequence-
optimized CDC2 construct rescued around 60% of cells from the
knockdown effect. Co-transfection of the sequence-optimized
CDC2 construct with a non-silencing control did not affect cell-
cycle distribution. Once again, the significantly increased
expression of the sequence-optimized gene apparently did not
influence protein function.
Occasionally, it might be desirable to silence or modulate the
overexpression of a transgene. We tested the specific knockdown of
three sequence-optimized constructs with an siRNA that does not
target sequences in the human genome but specifically binds to a
39 non-coding region present in the expression vector pQE-Tri-
System6 (Fig. 5C). Satisfyingly, co-transfection of this unique
siRNA mediated efficient downregulation of protein expression in
all three cases tested (Fig. 5D). These results provide yet another
example of how sequence-optimized constructs can be powerful
tools in functional genomics.
Discussion
Recent advances in gene optimization combined with de novo
gene synthesis allow fast and efficient construction of synthetic
genes individually tailored for specific applications. Whereas
former approaches to optimizing genes or eliminating inhibitory
motifs were mainly based on site-directed mutagenesis of a native
template [15,27], state-of-the-art techniques can rapidly synthesize
full-length genes that have been sequence-optimized in silico based
on the available amino acid sequence [19]. De novo synthesis has
become affordable and guarantees controlled access to any of the
25,000 genes within the human genome, some of which are
difficult to obtain by classic PCR-based cloning or have been
incorrectly deposited in clone selection banks.
The simple sequence optimization strategy of backtranslating an
amino acid sequence by using the most frequently used
synonymous codon for each amino acid has been superseded by
the development of advanced algorithms, which take into account
multiple criteria to calculate a near optimal solution for the
experimental requirements. Well-designed gene optimization is
nevertheless a big challenge due to the fact that even a rather small
amino acid sequence can result in a huge number of potential
DNA sequences. The often employed Monte Carlo Methods take
only a tiny fraction of the whole sequence space into account, and
in most cases a less than optimal solution with respect to the
theoretically ideal combination of codons representing the desired
properties will be found in reasonable time. Many of the
optimization parameters to be considered represent local sequence
properties spanning a region of just a few dozen bases rather than
global phenomena. This is obvious for codon usage, short
sequence motifs, like restriction sites, splice site recognition
patterns and other sequence elements but is also relevant
regarding GC-content and the prevention of stable hairpin loops.
Since it is unachievable to assess all possible codon combinations
representing a given amino acid sequence, it becomes clear from
the aforesaid, that it is acceptable for many sequence features to
reduce the search space by performing an exhaustive search for
the best solution only inside a small sequence window, which is
moved along the whole reading frame. This sliding window
approach [26], which was implemented in the GeneOptimizerHsoftware and used for this study, has the additional advantage, that
it performs unidirectional as sequences are processed naturally in
the cell. Accordingly, the position dependent impact of certain
sequence features, like the avoidance of bad codons near the 59
end are taken into account properly [28,29].
The effect of codon bias on expression has been analyzed for
multiple individual genes. However, the focus remained on
heterologous non-mammalian expression systems [18,30–40].
Two multigene studies directly compared expression of 30 [30]
and 100 [31] wildtype and sequence-optimized human genes in
E.coli. Although optimized for E.coli, some human genes were still
poorly expressed compared to their respective wildtype counter-
Figure 1. Comparative expression analysis of wildtype versus optimized genes representing different protein classes. (A) Each proteinwas expressed in triplicate (PP, plasmid preparation) in HEK293T cells. Either cell supernatants (immunomodulators, IM) or cell lysates (all otherprotein classes) were harvested and analyzed by Western blots using the a-Penta-His antibody. One example from each protein class is shown. Across-reactive 60 kD band used to standardize protein amounts is visible, including in the empty vector negative controls (mock). Left: molecularweight markers, right: arrows indicating specific protein bands. (B) After quantifying Western blot signals, relative expression levels were derived fromcomparing mean expression (three independent transfections) of wildtype or optimized constructs, with wildtype set to 1 (see Table 1). The x-foldexpression increase following gene optimization is indicated for each protein (only opt = no detectable wildtype expression). (C) Summary of relativeexpression levels of all proteins analyzed in each protein class. Average variations $10% were considered improved expression. (D) Statistical analysisof gene expression of (n) constructs in each protein class. Expression lists the number (n) and percent (%) of wildtype and optimized gene constructsexpressed (successful) or not expressed (unsuccessful). Median opt/wt values of relative expression were calculated from total expression ratiosderived as described above: opt/wt.1 indicates higher expression of optimized sequences. Where only the optimized construct was expressed, theopt/wt ratio was set to 2 for median calculation. Cases of opt.wt show the percentage of optimized constructs with elevated protein expression.doi:10.1371/journal.pone.0017596.g001
Multiparameter RNA and Codon Optimization
PLoS ONE | www.plosone.org 6 March 2011 | Volume 6 | Issue 3 | e17596
parts. Altogether, sequence optimization increased protein expres-
sion levels in E.coli for roughly 70% of expressible constructs [31]
taking into account that a significant number of human proteins
could not be expressed at all, possibly due to size or toxicity
[30,31].
Here, we provide evidence that improving autologous expres-
sion by multiparameter optimization can serve as a general
strategy to overcome such difficulties. Although one might
speculate that human genes need no optimization for autologous
expression, most natural templates are ‘‘optimized’’ for maximum
regulation rather than strong expression. Typical examples are
transcription factors or cytokines, whose mRNAs display short
half-lives in comparison to housekeeping genes [12,34], or the
highly regulated expression mechanisms of various human viruses,
such as HIV, where codon optimization greatly benefits Rev-
independent gene product expression [13,14,16,41,42].
All 50 sequence-optimized genes of our representative multi-
gene study were successfully expressed under standardized
conditions and at reproducible levels in different mammalian
and insect cell lines. Consistent expression and yield are critical
prerequisites for many downstream applications such as drug
discovery, screening assays or biopharmaceutical production. This
Figure 2. Comparative expression of human wildtype and human sequence-optimized gene constructs in HEK293T, CHO-K1 andinsect-Sf9 cells. (A) Expression statistics for five representative proteins from each protein class. Mammalian HEK293T and CHO-K1 cells weretransiently transfected in triplicate, whereas insect-Sf9 cells were transfected in duplicate. Relative protein expression of wildtype versus optimizedgenes (ratio wt:opt) was calculated from the mean expression values as described in Figure 1: (+) better expression of optimized gene; ( = )comparable expression of both genes; (2) better expression of wildtype gene. (B) Western blot analyses of three representative proteins (panels leftto right) transfected using three independent plasmid preparations (PP) into HEK293T and CHO-K1 cells, or two independent plasmid preparationsinto Sf9 cells (panels top to bottom). Signals from HEK293T and CHO-K1 cells were standardized against the ,60 kD cross-reactive band serving asloading control (visible also in the mock negative control lane). Left: molecular weight markers, right: the x-fold increase (+), decrease (2) orequivalence ( = ) in expression of the optimized genes.doi:10.1371/journal.pone.0017596.g002
Multiparameter RNA and Codon Optimization
PLoS ONE | www.plosone.org 7 March 2011 | Volume 6 | Issue 3 | e17596

highlights a further advantage of autologous expression over the
often unsuccessful expression of human genes in E.coli [31]. The
majority of optimized genes induced a clear increase in detectable
protein levels throughout all protein classes, while only two
membrane proteins (VKORC1 and SLC39A1) were poorly
expressed in HEK293T cells compared to their wildtype
counterparts. We assume that this phenomenon is likely a cell-
specific effect of overexpression rather than a direct result of
optimization, since the respective genes showed comparable or
even increased expression in CHO and insect-Sf9 cells. A more
detailed sequence analysis comparing genes that were successfully
optimized with those that were not, addressed CAI and GC
content (Table 1), as well as CpG content, 59CAI and DG values
(data not shown) did not explain why 2 out 50 optimized genes
showed decreased expression levels.
Increased expression triggered by codon-adaptation is mostly
ascribed to translational effects [20,43,44], whereas more recent
publications suggest that gene-optimization predominantly affects
mRNA levels [24,40–42,45–47]. The results from cells stably
expressing wildtype or optimized mip-1a genes demonstrate that
our optimization approach affects expression on the transcription-
al, posttranscriptional and translational level, while the secretory
pathway was not affected by MIP-1a expression, according to only
1% of intracellular protein detected using the wildtype or
optimized construct (unpublished data).
Gene-optimization significantly enhanced the CAI in all tested
genes, a parameter often cited in the context of translational
efficiency [17,39,48]. Accordingly, a high CAI correlated with
clear improvement of MIP-1a translation as demonstrated in a
cell-based assay. Interestingly, those wildtype genes showing no
expression indeed mostly exhibit a relatively low CAI of #0.78
(Table 1), whereas all optimized genes mediating high-level
expression have a CAI value close to 1, suggesting that the CAI
might serve to predict the likelihood of successful expression in
mammalian cells.
Apart from translation-specific effects, our gene-optimization
clearly improved mip-1a mRNA steady-state levels and prolonged
mRNA half-lives, correlating with a significant increase in GC-
content. Although the GC-content appears to determine mRNA
secondary structure and thus mRNA stability, it cannot account
Figure 3. Influence of sequence optimization on expression-related mechanisms acting on stably integrated mip1a genes. (A)Relative protein expression levels of wildtype or optimized mip1a genes stably expressed in CHO-K1 cells were calculated from the mean values*measured by ELISA. (B) De novo transcription of RNA was measured by nuclear run-on assays. Cell nuclei were incubated with biotin-16-labeleddUTPs, separated via streptavidin-labeled magnetic beads, reverse-transcribed, and the resulting cDNAs were quantified by real-time PCR. De novosynthesized mip-1a transcripts* were normalized to hph cDNA levels, and the wildtype value* was set to 100%. (C) To determine mRNA stability bothcell lines were incubated with 2.4 mM Actinomycin D for 0, 1.5, 3, 6, 12 and 24 hours. Total RNA was extracted at the respective time points and mip-1a mRNA levels quantified by real-time PCR were standardized against hph-specific mRNA amounts to obtain relative mip-1a mRNA half-lives ofwildtype and optimized genes*. (D) Nuclear or cytoplasmic mip-1a mRNAs (2 mg) were subjected to Northern blot analysis using a DIG-labeled probehybridizing to the BGH-polyA signal. Beta-actin served as an internal loading control. (E) Total RNA was separated from nuclear and cytoplasmicfractions, reverse-transcribed, and subjected to quantitative SYBR-Green real-time PCR using specific primers for both gene variants and the hph geneinternal control. The resulting mip-1a cDNAs were verified by sequencing and amounts were standardized to hph cDNA levels to obtain mean mRNAsteady-state values*. (F) To determine translation rates, HEK293T cells were infected with MVA-T7 prior to transient transfection with mip-1a variantsunder the control of a T7-promoter (+MVA). Transfected but uninfected cells served as negative controls (-MVA). Protein levels in cell supernatantswere determined 24 hours post-transfection by ELISA. Expression levels obtained from wildtype transfections of infected cells were set to 100% andvalues from optimized genes were calculated accordingly. *Mean values derived from 2 independent experiments. + indicates relative improvementsdue to gene optimization.doi:10.1371/journal.pone.0017596.g003
Multiparameter RNA and Codon Optimization
PLoS ONE | www.plosone.org 8 March 2011 | Volume 6 | Issue 3 | e17596

Multiparameter RNA and Codon Optimization
PLoS ONE | www.plosone.org 9 March 2011 | Volume 6 | Issue 3 | e17596

for the overall improvement in expression achieved by the
optimized genes, since some of them display a GC-content similar
to their wildtype counterparts. A strong increase in mRNA levels
has been described for individual genes using the same gene-
optimization approach [10,16,17,19,31]. However, it remains to
be determined in individual cases to what extent enhanced mRNA
structure/stability or increased de novo transcription, as specifically
demonstrated for the optimized mip-1a gene, contribute to the
available RNA amounts. The latter observation is particularly
interesting due to a recent publication assigning a role to
intragenic CpG-dinucleotides in boosting transcriptional activity
[10]. This hypothesis would underline the importance of codon
composition and the contribution of specific-sequence motifs to
overall protein production. The sequence determinants driving
optimal performance in mammalian cells are presumably far more
complex than those affecting expression in bacterial hosts, which –
apart from codon bias – seems to strongly depend on the stability
of 59mRNA structures [38,40]. A recent report even suggests that
codon order, and correlation with isoaccepting-tRNAs, rather
than codon composition, contribute to rapid translation in
eukaryotes [49].
These insights will certainly help to adapt and improve future
optimization strategies for maximum expression success. Notwith-
standing, this large-scale study proves that our multiparameter
optimization was successful with 50 human genes representing the
most important protein classes. Gene optimization clearly
improved protein expression in the majority of cases and selected
overexpressed gene products proved to be functional.
In principle, one would assume that autologous expression
should overcome problems of overexpression such as insolubility
or misfolding of proteins resulting in non-functional protein as
often observed for heterologous expression systems such as E. coli.
Nevertheless, sequence modifications introduced by gene optimi-
zation might influence protein folding, and therefore solubility
and/or function. However, potentially insoluble or non-functional
protein due to overexpression is not a problem of gene
optimization per se, and functionality and solubility has to be
analysed for each case of overexpressed protein and any
‘‘expression optimization strategy’’, such as e.g. the use of strong
promoters, integration copy number, fermentation conditions, etc.
Our results are very encouraging, since high expressers with an
expression level increase of 2.6-fold to 15-fold showed no
detrimental effect on solubility (JNK1, JNK3, p38a) or function
(JNK1, JNK3 and CDC2). This positive effect of gene optimiza-
tion on protein expression resulting in functional protein was also
demonstrated in a recent publication by some of the authors [50],
where a single electro-gene transfer of an RNA- and codon
optimized EPO gene into skeletal muscle resulted in a 3- to 4-fold
increase of EPO production over mice treated with non-optimized
EPO genes, sustaining for .1 year and triggering a significant
increase in hematocrit and hemoglobin without causing adverse
effects [50]. Furthermore in addition to the mechanistic insights of
overexpression in the stable system described for MIP1-a, the
study provides supporting mechanistic insights of overexpression
in a transient system [50].
Finally, particularly interesting, the successful application of
optimized genes in RNAi experiments emphasizes the potential
and value of gene optimization in functional genomics research.
We belief that de novo synthesis of RNA- and codon-optimized
genes will become a standard process for recombinant human
protein production, and will serve to improve and standardize any
application relying on reproducible, efficient and high quality
expression.
Materials and Methods
Construct design and optimizationHuman gene sequences were obtained from the NCBI
GeneEntrez Database. The coding regions were optimized using
the GeneOptimizerH expert software, employing a deterministic
sliding window algorithm [26] to cope with the vast sequence
space in multiparameter DNA sequence optimization. A variation
window covering several amino acid positions slides along the
coding sequence. Candidate sequences are built comprising a
section of the already optimized sequence upstream to the
variation window and each of all possible combinations of
synonymous codons within the window. The candidate sequences
are assessed with a quality function [26] taking codon usage, GC-
content, mRNA structure and species-specific sequence motifs into
account. The first codon of the best candidates’ variation window
is fixed and the window is shifted by one codon position towards
the 39end.
Wildtype and sequence-optimized genes were synthesized using
synthetic oligonucleotides, assembled by primer extension-based
PCR, cloned, and verified by sequencing (for review see [19] page
425–438). All constructs contain a C-terminal His6-tag followed by
two STOP-codons to ensure efficient termination. Slc39A, cln3,
and serotonin-tp genes were synthesized as wildtype and optimized
versions containing a Flag3-tag separated by a serine-glycine-
linker.
Cell culture and protein expressionFor expression in mammalian or insect cells, wildtype and
sequence-optimized transgenes were cloned into plasmids pQE-
TriSystem6 (Qiagen) or pIEx-4 (Novagen). After preparing three
independent plasmid preparations from separate clones, 1.2 mg of
vector DNA was transiently transfected into HEK293T (HEK
293T/17, ATCC, CRL-11268) and CHO cells (CHO-K1, ATTC,
CCL-61) seeded at 80-90% density, using Attractene (Qiagen) or
Fugene (Roche) according to the manufacturer’s instructions in
OPTI-PRO serum-free medium (Invitrogen). Insect-Sf9 cells
(Novagen, Cat.-No.:71104) were transfected using GeneJuice
(Novagen). Cell lines stably expressing MIP-1a constructs were
generated using the Flp-In System (Invitrogen) according to the
manufacturer’s instructions. Constructs were cloned into vector
pcDNA5/FRT (Invitrogen) and transfected into CHO Flp-In-cells
Figure 4. Solubility testing and in vitro analysis of JNK1- and JNK3 specific kinase activity. (A) HEK293T cells were transiently transfectedwith three different plasmid preparations (PP) of wildtype or optimized jnk1, jnk3 and p38a-kinase genes. Cells were lysed under mild conditionsfollowed by subsequent centrifugation for 30 min at 16000 g and protein expression was analyzed by Western blots using the a-Penta-His antibody.Protein expression levels were standardized against the cross-reactive 60 kD protein band displayed on the blots. Relative expression was determinedby relating the mean value obtained from optimized genes to the mean value of wildtype genes, with wildtype set at 1. (B) JNK1-kinase assay.Recombinant kinase proteins were purified from cell lysates and saturating amounts were pulled down with GST-c-Jun beads. Equal amounts of theprotein complexes were subjected to Western blot analysis using the a-Penta-His antibody, JNK1 protein amounts in each sample were standardizedagainst the cross-reactive 60 kD band. Kinase activity was quantified by in vitro phosphorylation of the bead-bound c-Jun substrate in the presence ofATP and subsequent detection of phosphorylated c-Jun proteins in Western blots using the antibody a-P-Ser63. (C) JNK3-kinase assay was carried outas described in (B).doi:10.1371/journal.pone.0017596.g004
Multiparameter RNA and Codon Optimization
PLoS ONE | www.plosone.org 10 March 2011 | Volume 6 | Issue 3 | e17596

Multiparameter RNA and Codon Optimization
PLoS ONE | www.plosone.org 11 March 2011 | Volume 6 | Issue 3 | e17596

(Invitrogen). Positive clones were selected with increasing amounts
of hygromycin B at a maximum concentration of 500 mg/ml.
Protein expression analysisTransfected HEK293T and CHO cells were harvested after 2–
3 days in TDLB buffer (50 mM Tris/HCl pH 8.0; 150 mM NaCl;
0.5% sodium deoxycholat; 0.1% SDS; 0.1% TritonX-100) and
sonicated (Bandelin Sonoplus, cycle 5). Kinases tested for soluble
protein were harvested in 20 mM Tris (pH 7.5), 150 mM NaCl,
1 mM EDTA, 1 mM EGTA, 1% Triton, 2.5 mM sodium
pyrophosphate, 1 mM b-glycerophosphate,1 mM Na3VO4,
1 mg/ml Leupeptin, sonicated and centrifuged for 30 minutes at
16000 g.
Immunomodulators were precipitated with TCA from harvest-
ed cell supernatants. Protein expression was quantified as
described earlier [26]. Protein concentration was measured using
DC Protein Assay (Bio-Rad) and equal amounts were loaded on
4–20%-SDS–PAGE-gels (Invitrogen) for Western Blot analysis.
Western Blot signals were detected using a-Penta-His antibody
(Qiagen) with BM Chemiluminescence Western-Blotting-Sub-
strate (POD) (Roche) or SuperSignal West-Femto-Maximum-
Sensitivity-Substrate (ThermoScientific) and quantified using
GelProAnalyzer-Software6 (INTAS). Wildtype and optimized
constructs were analyzed in triplicates on the same gel, by
measuring the integrated optical density (IOD) of each protein
signal in the linear range of a 16 bit CCD camera system. In
contrast to the low dynamic range and fast saturation on X-ray
film, no saturation effects were detected in any measures.
Expression levels were standardized against an endogenous
60 kD cross-reactive band by measuring the integrated optical
density (IOD) of each band. Quantified results were standardised,
averaged and the ratio wildtype (set at 100%) versus optimized
construct was determined. Lysate from mock-treated cells,
transformed with the empty expression construct, served as
negative controls for analysis. Flag-tagged proteins or proteins
detected with specific antibodies were standardized against
endogenous GAPDH or b-actin as described above. Proteins
expressed in Sf9 cells were quantified using fluorescence-based
methods as described elsewhere [31]. Expression levels of stably
integrated mip-1a genes were measured using a commercial ELISA
kit (R&D Systems).
RNA analysisNorthern blot analysis was performed as described earlier [10].
Nuclei and cytoplasm were separated by centrifugation, and RNA
was isolated using the RNeasy-Kit (Qiagen). Specific mRNAs were
detected via chemiluminescence using Digoxigenin (DIG)-labeled
probes and a-DIG-antibodies (Roche). MIP-1a-antisense RNA
probes hybridizing to the BGH-polyA signal present in all
transcripts were generated using the ‘‘Riboprobe in vitro Tran-
scription Kit’’ (Promega). For in vitro transcription a T7 promoter-
extended PCR product was generated, enabling initiation of T7-
polymerase. DIG-11-UTP was incorporated for detecting the
probe; mip-1a probe: 59-CTCGAGCATGCATCTAGAGGG-
CCCTATTCTATAGT GTCACCTAAATGCTAGAGCTCG-
CTGATCAGCCTCGACTGTGCCTTCTAGTTGCCA GCC-
ATCTGTTGTTTGCCCCTCCCCCGTGCCTTCCTTGACC-
CTGGAAGGTGCCACTC CCACTGTCCTTTCC-39; b-actin-
probe: 59-AGAGGCATACAGGGACAGCACAGCCTG AAT-
GGCTACGTACATGGCTGGGGTGTTGAAGGTCTCAAA-
CATGATCTATAAAGA AAAATGAGGCATTGTCAAACTC-
CAAAAGCCACAAGTAGTCAAGGCAGGTAGGAC TGTC-
AGGACAGATATGGGACATGCAGAGTGCAAGAACACAG-
CTAAGGTAAGTGT GCTGGGAGAAATCTCAGGACAGG-
GGCTCCATTTTAAACCTACTGTGCATCTACTGAATACA-
CACTCCAAGGCCACTTATCACCAGCCTCAT-39
Real-time PCRTotal RNA was extracted as described above. cDNA was
synthesized using oligo(dT)15 primers, M-MLV RNaseH-Point-
Mutant reverse transcriptase (Promega) and 500 ng DNA-free
RNA as templates according to manufacturer’s guidelines.
Reverse-transcribed RNA was quantified using DyNAmo Capil-
lary SYBR Green qPCR kits (Finnzymes) as described earlier [51].
Forward and reverse oligonucleotides for amplifying the entire
open reading frames were 59-ATGAAGGTCTCCACCACTGC-
39 and 59-TCATGAAGACTAGGCATTCAG TTC-39 for wild-
type mip-1a, 59-ATGAAGGTGAGCACCACAGCT-39 and 59-
TCATGAA GACTAGGCGTTCAGC-39 for optimized mip-1a,
and 59-CTGGAGCGAGGCGATGTTC-39 and 59-CTGCG-
GGCGATTTGTGTAC-39 for the hph gene.
PCR efficiency of the respective oligonucleotides was analyzed
using serial plasmid dilutions and determined to be 1,847 for mip1awildtype and 1,828 for the optimized mip1a gene. Real-time PCR
derived data were quantified relatively according to Pfaffl et al. [51]
taking the divergent efficiencies into account. The specificity of
obtained PCR products was verified via melting curve analysis and
sequencing.
Nuclear run-on and mRNA half-lifeNuclear run-on analysis was performed as formerly described
[52], using biotin labeling, magnetic bead capture and analysis by
fluorescence-based RT-PCR. De novo synthesized RNA was
quantified using real-time PCR as described above. mRNA half-
life was analyzed as described in Leclerc et al. [53].
MVA-T7-mediated expressionFor cytoplasmic mip-1a expression under the control of the T7-
promoter, HEK293T cells were infected at an MOI of 10 with
modified Vaccinia-Ankara virus providing a T7-RNA polymerase
Figure 5. Rescue of siRNA-mediated knock-down of an endogenous gene with an optimized gene variant. (A) Cells were transientlytransfected with three different plasmid preparations (PP) of wildtype and optimized cdc2 genes and expression levels were analyzed by Westernblotting using the a-Penta-His antibody. Relative expression was determined as described in Figure 1. (B) Untreated MCF-7 cells, or cells transfectedwith CDC2 siRNA only (knock-down), CDC2 siRNA plus the optimized cdc2 gene (rescue), or a non-silencing siRNA plus the optimized cdc2 constructwere stained with propidium iodide after 72 hours and subjected to FACS analysis to determine cell-cycle distribution. The percentage of negativecontrol cells compared to knockdown phenotype cells shifted from 16.2%/14.9% to 36.3%, i.e. around 20%. Negative control cells compared torescued cells shifted from 16.2%/14.9% to 23.4%, i.e. around 8%, indicating that the optimized cdc2 construct rescued around 60% of cells fromknock-down. Endogenous CDC2 knockdown was confirmed by real-time RT-PCR with primers exclusively detecting endogenous cdc2, whereasexpression of exogenous CDC2 from the sequence-optimized construct was confirmed by real-time RT-PCR with primers exclusively detectingexogenous cdc2 (data not shown). (C) Schematic representation of the expression cassette in plasmid pQE-Tri-System6 containing the optimized cdc2gene sequence and the siRNA target site in the 39 untranslated region. (D) The specificity of siRNA-mediated knockdown was tested by co-transfecting three sequence-optimized genes from different protein classes with site-specific or non-silencing siRNAs, followed by analyzing proteinexpression by Western blots.doi:10.1371/journal.pone.0017596.g005
Multiparameter RNA and Codon Optimization
PLoS ONE | www.plosone.org 12 March 2011 | Volume 6 | Issue 3 | e17596

(MVA-T7) followed by transient transfections with vector pPCR-
Script (pT7, Stratagene) containing the mip-1a genes under the
control of a T7-promoter. MIP-1a levels were determined
24 hours post-transfection by ELISA.
Kinase assayCell lysates of cells transfected with wildtype or optimized jnk1-
and jnk3-constructs were prepared in triplicates according to a
commercial assay protocol (SAPK/JNK-Assay-Kit (Nonradioac-
tive), Cell Signaling TechnologyH). Samples were pooled, adjusted
to 20 mM imidazole and purified with 20 ml of Ni-agarose beads
to remove endogenous kinase activity (HIS-SelectTM Nickel
Affinity Gel, Sigma). Ni-bound proteins were washed (PBS,
500 mM NaCl, 20 mM imidazole) and eluted for 30 min at room
temperature (PBS, 500 mM NaCl, 200 mM imidazole). Saturat-
ing amounts of eluted protein were pulled down with GST-c-Jun-
coated beads and kinase activity was determined in the presence of
ATP according to the above protocol.
Gene silencing and rescueTo knock-down endogenous CDC2, MCF-7 cells (DSMZ,
DSMZ no.: ACC115) were transfected with 50 nM of a cdc2-specific
siRNA using HiPerFect (Qiagen). CDC2 knock-down was rescued
by co-transfecting 0.4 mg of the pQE-TriSystem6 vector carrying a
sequence-optimized cdc2 gene. To determine cell-cycle distribu-
tion, cells were harvested 72 hours post-transfection, stained with
propidium iodide and subjected to FACS analysis.
For siRNA-mediated gene silencing, 1 mg of vector pQE-
TriSystem6 DNA encoding sequence-optimized genes (Fig. 5C)
was co-transfected with 8.4 nM of an siRNA targeting the 39
untranslated region 59-AAGCGTTGAAATAGCGTACAA-39 of
the expression construct. Cells were harvested 48 hours post-
transfection and analyzed by Western blotting using the a-Penta-
His antibody.
Supporting Information
File S1 Construct sequences. File S1 contains the sequences of
all wildtype and sequence optimized constructs used in this study.
(FAS)
Acknowledgments
We thank Nicole Brinker and Steffi Kirch for their excellent technical
support performing Sf9 and CDC2 rescue experiments.
Author Contributions
Conceived and designed the experiments: SF APB ML AS BM PH FS MG
RW. Performed the experiments: SF APB AS BM PH. Analyzed the data:
SF APB AS BM PH. Contributed reagents/materials/analysis tools: SF
APB AS BM PH. Wrote the paper: SF CL. Designed, performed and
analyzed mammalian expression experiments, functional kinase assays and
wrote the manuscript: SF. Designed, performed and analyzed MIP1a
experiments: APB. Designed and performed Sf9-expression experiments:
AS BM. Performed the CDC2-rescue study: PH. Helped design the
experiments: ML. Revised the manuscript: CL. Designed and initiated the
study: FS MG RW. Designed and set up the de novo gene synthesis- and
optimization approach: MG RW.
References
1. Makrides SC (1996) Strategies for achieving high-level expression of genes inEscherichia coli. Microbiol Rev 60: 512–538.
2. Schirrmann T, Al Halabi L, Dubel S, Hust M (2008) Production systems for
recombinant antibodies. Front Biosci 13: 4576–4594.
3. Schmidt M, Hoffman DR (2002) Expression systems for production of
recombinant allergens. Int. Arch Allergy Immunol 128: 264–270.
4. Brondyk WH (2009) Selecting an appropriate method for expressing a
recombinant protein. Methods Enzymol 463: 131–147.
5. Wurm FM (2004) Production of recombinant protein therapeutics in cultivatedmammalian cells. Nat Biotechnol 22: 1393–1398.
6. Zhou J, Liu WJ, Peng SW, Sun XY, Frazer I (1999) Papillomavirus capsidprotein expression level depends on the match between codon usage and tRNA
availability. J. Virol 73: 4972–4982.
7. Duan J, Antezana MA (2003) Mammalian mutation pressure, synonymous
codon choice, and mRNA degradation. J. Mol Evol 57: 694–701.
8. Salser W (1978) Globin mRNA sequences: analysis of base pairing and
evolutionary implications. Cold Spring Harb Symp Quant Biol 42(Pt 2):985–1002.
9. Chevalier-Mariette C, Henry I, Montfort L, Capgras S, Forlani S, et al. (2003)
CpG content affects gene silencing in mice: evidence from novel transgenes.
Genome Biol 4: R53.
10. Bauer AP, Leikam D, Krinner S, Notka F, Ludwig C, et al. (2010) The impact ofintragenic CpG content on gene expression. Nucleic Acids Res 38: 3891–908.
11. Espel E (2005) The role of the AU-rich elements of mRNAs in controllingtranslation. Semin Cell Dev Biol 16: 59–67.
12. Chen CY, Xu N, Shyu AB (1995) mRNA decay mediated by two distinct AU-
rich elements from c-fos and granulocyte-macrophage colony-stimulating factor
transcripts: different deadenylation kinetics and uncoupling from translation.Mol Cell Biol 15: 5777–5788.
13. Maldarelli F, Martin MA, Strebel K (1991) Identification of posttranscriptionally
active inhibitory sequences in human immunodeficiency virus type 1 RNA:
novel level of gene regulation. J. Virol 65: 5732–5743.
14. Schwartz S, Felber BK, Pavlakis GN (1992) Distinct RNA sequences in the gagregion of human immunodeficiency virus type 1 decrease RNA stability and
inhibit expression in the absence of Rev protein. J. Virol 66: 150–159.
15. Schneider R, Campbell M, Nasioulas G, Felber BK, Pavlakis GN (1997)
Inactivation of the human immunodeficiency virus type 1 inhibitory elementsallows Rev-independent expression of Gag and Gag/protease and particle
formation. J. Virol 71: 4892–4903.
16. Graf M, Bojak A, Deml L, Bieler K, Wolf H, et al. (2000) Concerted action of
multiple cis-acting sequences is required for Rev dependence of late humanimmunodeficiency virus type 1 gene expression. J. Virol 74: 10822–10826.
17. Graf M, Deml L, Wagner R (2004) Codon-optimized genes that enable
increased heterologous expression in mammalian cells and elicit efficientimmune responses in mice after vaccination of naked DNA. Methods Mol. Med
94: 197–210.
18. Gustafsson C, Govindarajan S, Minshull J (2004) Codon bias and heterologousprotein expression. Trends Biotechnol 22: 346–353.
19. Graf M, Schoedl T, Wagner R (2009) Rationales of Gene Design and De Novo
Gene Construction. In: Systems Biology and Synthetic Biology Fu P, Panke S,
eds. (John Wiley). pp 411–438.
20. Zolotukhin S, Potter M, Hauswirth WW, Guy J, Muzyczka N (1996) A"humanized" green fluorescent protein cDNA adapted for high-level expression
in mammalian cells. J. Virol 70: 4646–4654.
21. Levy JP, Muldoon RR, Zolotukhin S, Link CJ Jr. (1996) Retroviral transfer and
expression of a humanized, red-shifted green fluorescent protein gene intohuman tumor cells. Nat. Biotechnol 14: 610–614.
22. Wells KD, Foster JA, Moore K, Pursel VG, Wall RJ (1999) Codon optimization,
genetic insulation, and an rtTA reporter improve performance of thetetracycline switch. Transgenic Res 8: 371–381.
23. Plotkin JB, Robins H, Levine AJ (2004) Tissue-specific codon usage and theexpression of human genes. Proc. Natl. Acad. Sci.U. S. A 101: 12588–12591.
24. Kudla G, Lipinski L, Caffin F, Helwak A, Zylicz M (2006) High guanine
and cytosine content increases mRNA levels in mammalian cells. PLoS Biol 4:e180.
25. Dittmar KA, Goodenbour JM, Pan T (2006) Tissue-specific differences in
human transfer RNA expression. PLoS Genet 2: e221.
26. Raab D, Graf M, Notka F, Schoedl T, Wagner R (2010) The GeneOptimizer
Algorithm: Using a sliding window approach to cope with the vast sequencespace in multiparameter DNA sequence optimization. Syst Synth Biol 4(3):
215–25.
27. Kink JA, Maley ME, Ling KY, Kanabrocki JA, Kung C (1991) Efficient
expression of the Paramecium calmodulin gene in Escherichia coli after fourTAA-to-CAA changes through a series of polymerase chain reactions. J
Protozool 38: 441–447.
28. Goldman E, Rosenberg AH, Zubay G, Studier FW (1995) Consecutive low-usage leucine codons block translation only when near the 59 end of a message in
Escherichia coli. J Mol Biol 245: 467–473.
29. Vervoort EB, van Ravestein A, van Peij NN, Heikoop JC, van Haastert PJ, et al.
(2000) Optimizing heterologous expression in dictyostelium: importance of 59
codon adaptation. Nucleic Acids Res 28: 2069–2074.
30. Burgess-Brown NA, Sharma S, Sobott F, Loenarz C, Oppermann U, et al.
(2008) Codon optimization can improve expression of human genes inEscherichia coli: A multi-gene study. Protein Expr. Purif 59: 94–102.
Multiparameter RNA and Codon Optimization
PLoS ONE | www.plosone.org 13 March 2011 | Volume 6 | Issue 3 | e17596

31. Maertens B, Spriestersbach A, von Groll U, Roth U, Kubicek J, et al. (2010)
Gene optimization mechanisms: A multi-gene study reveals a high success rate offull-length human proteins expressed in Escherichia coli. Protein Sci 19:
1312–26.
32. Nomura M, Ohsuye K, Mizuno A, Sakuragawa Y, Tanaka S (1984) Influence ofmessenger RNA secondary structure on translation efficiency. Nucleic Acids
Symp. Ser. pp 173–176.33. Nishikubo T, Nakagawa N, Kuramitsu S, Masui R (2005) Improved
heterologous gene expression in Escherichia coli by optimization of the AT-
content of codons immediately downstream of the initiation codon. J. Biotechnol120: 341–346.
34. Krishna Rao DV, Rao JV, Narasu ML, Bhujanga Rao AK (2008) Optimizationof the AT-content of codons immediately downstream of the initiation codon
and evaluation of culture conditions for high-level expression of recombinanthuman G-CSF in Escherichia coli. Mol Biotechnol 38: 221–232.
35. Ivanov IG, Alexandrova R, Dragulev B, Leclerc D, Saraffova A, et al. (1992)
Efficiency of the 59-terminal sequence (omega) of tobacco mosaic virus RNA forthe initiation of eukaryotic gene translation in Escherichia coli. Eur. J. Biochem
209: 151–156.36. Iost I, Dreyfus M (1995) The stability of Escherichia coli lacZ mRNA depends
upon the simultaneity of its synthesis and translation. EMBO J 14: 3252–3261.
37. Andersson SG, Kurland CG (1990) Codon preferences in free-livingmicroorganisms. Microbiol Rev 54: 198–210.
38. Supek F, Smuc T (2010) On Relevance of Codon Usage to Expression ofSynthetic and Natural Genes in Escherichia coli. Genetics 185: 1129–34.
39. Welch M, Govindarajan S, Ness JE, Villalobos A, Gurney A, et al. (2009) Designparameters to control synthetic gene expression in Escherichia coli. PLoS One 4:
e7002.
40. Kudla G, Murray AW, Tollervey D, Plotkin JB (2009) Coding-sequencedeterminants of gene expression in Escherichia coli. Science 324: 255–258.
41. Nguyen KL, llano M, Akari H, Miyagi E, Poeschla EM, et al. (2004) Codonoptimization of the HIV-1 vpu and vif genes stabilizes their mRNA and allows
for highly efficient Rev-independent expression. Virology 319: 163–175.
42. Anson DS, Dunning KR (2005) Codon-optimized reading frames facilitate high-
level expression of the HIV-1 minor proteins. Mol Biotechnol 31: 85–88.43. Andre S, Seed B, Eberle J, Schraut W, Bultmann A, et al. (1998) Increased
immune response elicited by DNA vaccination with a synthetic gp120 sequence
with optimized codon usage. J. Virol 72: 1497–1503.44. Robinson F, Jackson RJ, Smith CW (2008) Expression of human nPTB is limited
by extreme suboptimal codon content. PLoS One 3: e1801.45. Sokolowski M, Tan W, Jellne M, Schwartz S (1998) mRNA instability elements
in the human papillomavirus type 16 L2 coding region. J. Virol 72: 1504–1515.
46. Furth PA, Baker CC (1991) An element in the bovine papillomavirus late 39
untranslated region reduces polyadenylated cytoplasmic RNA levels. J. Virol 65:
5806–5812.47. Tan W, Felber BK, Zolotukhin AS, Pavlakis GN, Schwartz S (1995) Efficient
expression of the human papillomavirus type 16 L1 protein in epithelial cells byusing Rev and the Rev-responsive element of human immunodeficiency virus or
the cis-acting transactivation element of simian retrovirus type 1. J. Virol 69:
5607–5620.48. Sharp PM, Li WH (1987) The codon Adaptation Index–a measure of directional
synonymous codon usage bias, and its potential applications. Nucleic Acids Res15: 1281–1295.
49. Cannarozzi G, Schraudolph NN, Faty M, von Rohr P, Friberg MT, et al. (2010)
A role for codon order in translation dynamics. Cell 141: 355–367.50. Kosovac D, Wild J, Ludwig C, Meissner S, Bauer AP, et al. (2010) Minimal
doses of a sequence- optimized transgene mediate high-level and long-term EPOexpression in vivo: challenging CpG-free gene design. Gene Therapy. pp 1–10.
51. Pfaffl MW (2001) A new mathematical model for relative quantification in real-time RT-PCR. Nucleic Acids Res 29: e45.
52. Patrone G, Puppo F, Cusano R, Scaranari M, Ceccherini I, et al. (2000) Nuclear
run-on assay using biotin labeling, magnetic bead capture and analysis byfluorescence-based RT-PCR. Biotechniques 29: 1012–1017.
53. Leclerc GJ, Leclerc GM, Barredo JC (2002) Real-time RT-PCR analysis ofmRNA decay: half-life of Beta-actin mRNA in human leukemia CCRF-CEM
and Nalm-6 cell lines. Cancer Cell Int 2: 1.
Multiparameter RNA and Codon Optimization
PLoS ONE | www.plosone.org 14 March 2011 | Volume 6 | Issue 3 | e17596