Embed Size (px)
DESCRIPTION
Multiple Causes of Food Insecurity: Multiple Regression Analysis. Reference: Gujarati (2004). THE THREE-VARIABLE MODEL. THE THREE-VARIABLE MODEL. THE THREE-VARIABLE MODEL. Maternal education and community characteristics as indicators of nutritional status of children – application - PowerPoint PPT Presentation
Citation preview
Multiple Causes of Food Insecurity: Multiple Regression Analysis
Reference: Gujarati (2004)
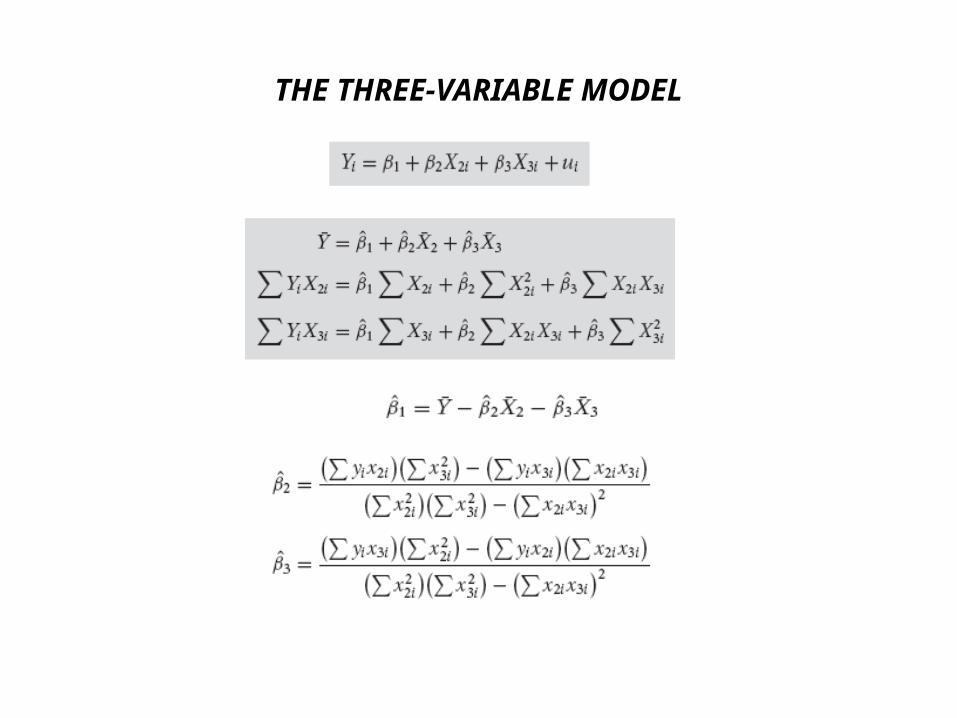
THE THREE-VARIABLE MODEL
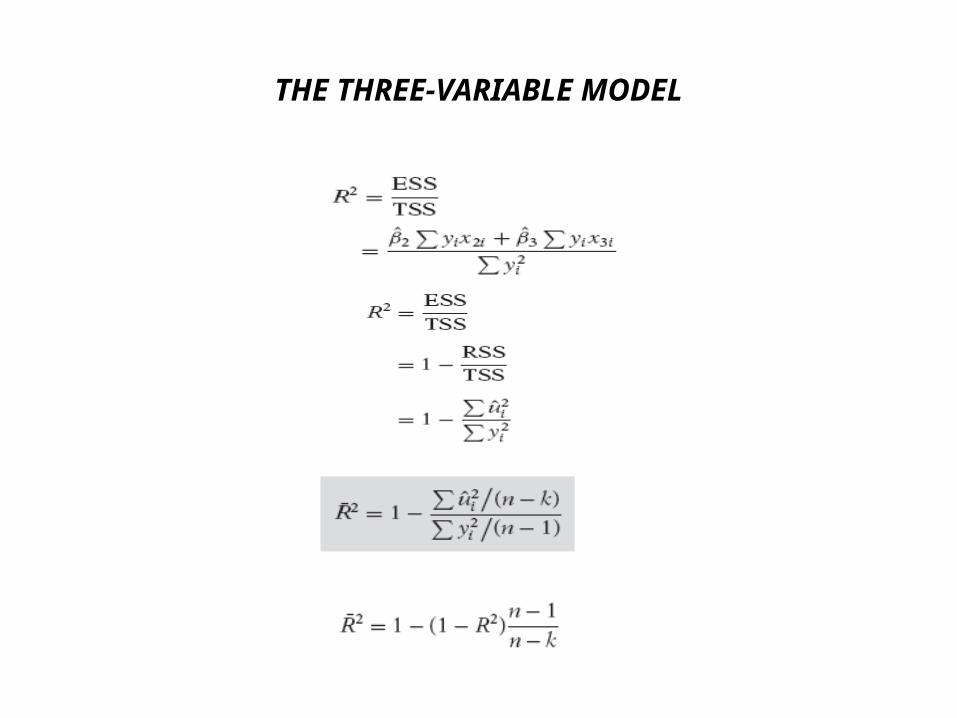
THE THREE-VARIABLE MODEL

THE THREE-VARIABLE MODEL
Nutritional Status of Children 5
Maternal education and community characteristics as indicators of nutritional
status of children – applicationof multivariate regression
Nutritional Status of Children 6
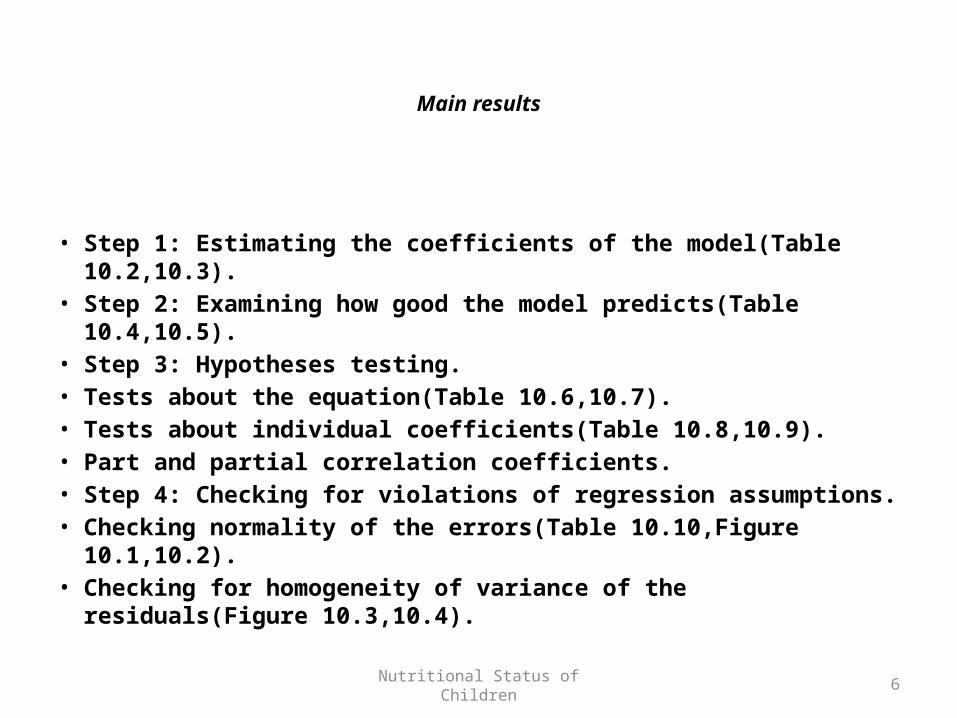
Main results
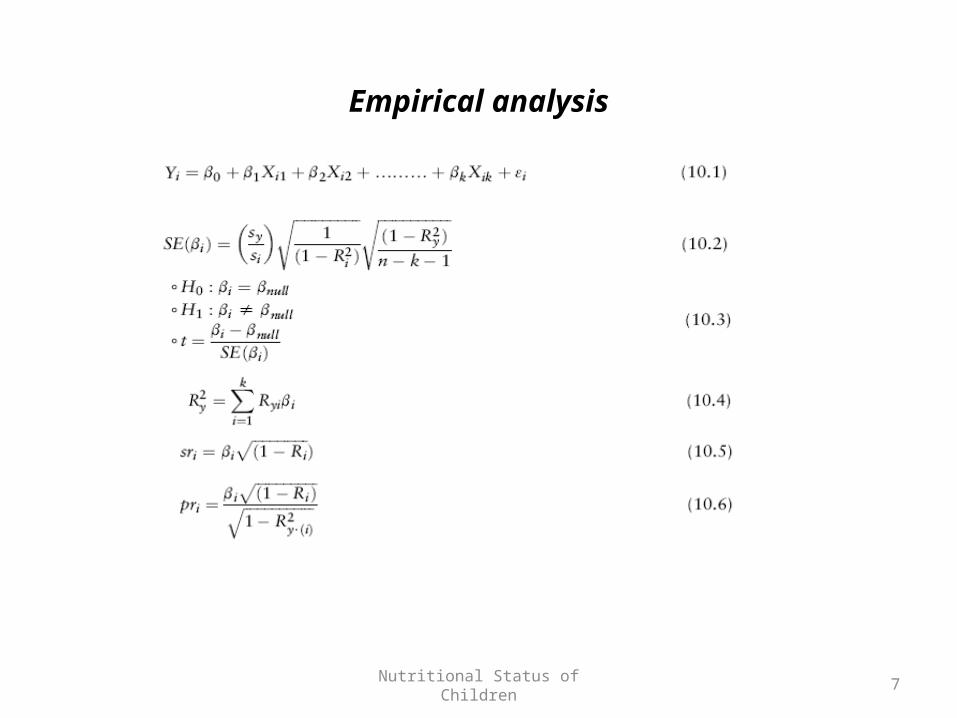
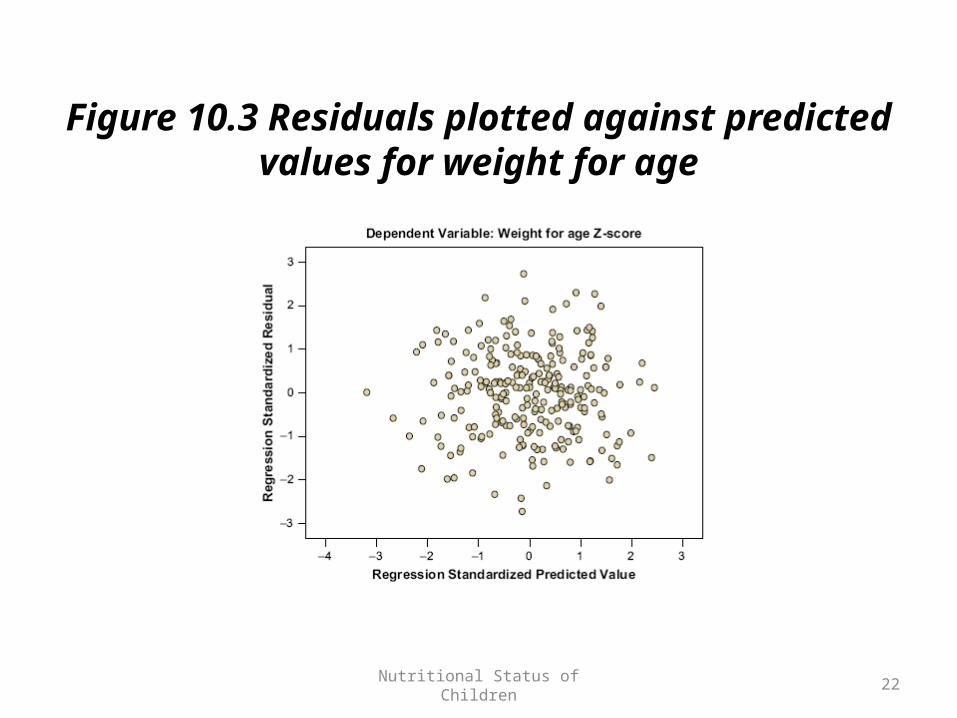
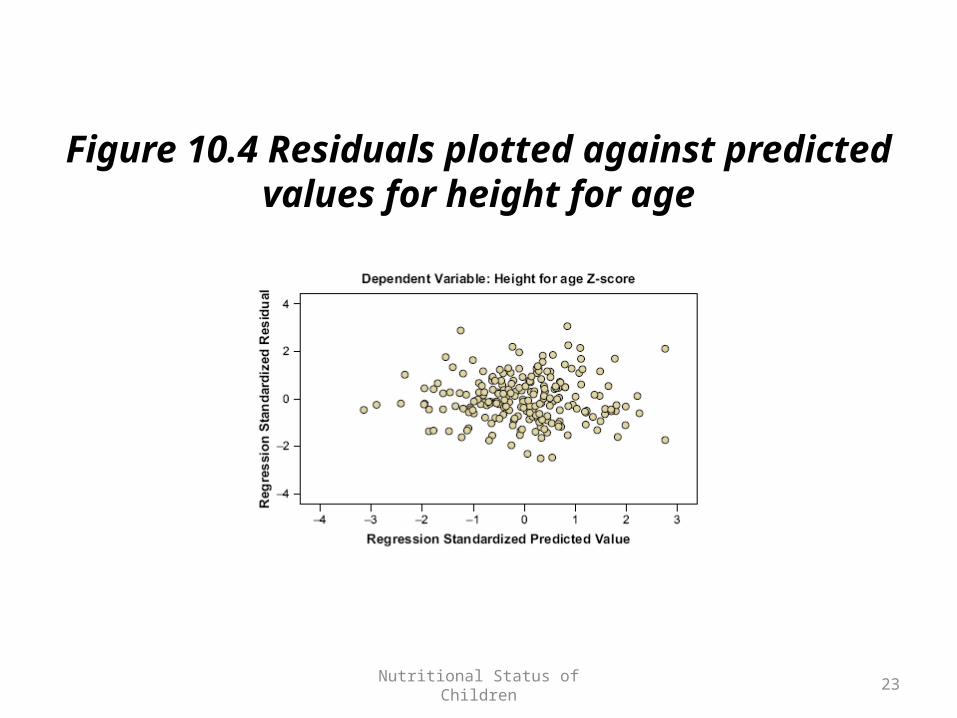
• Step 1: Estimating the coefficients of the model(Table 10.2,10.3).• Step 2: Examining how good the model predicts(Table 10.4,10.5).• Step 3: Hypotheses testing.• Tests about the equation(Table 10.6,10.7).• Tests about individual coefficients(Table 10.8,10.9).• Part and partial correlation coefficients.• Step 4: Checking for violations of regression assumptions.• Checking normality of the errors(Table 10.10,Figure 10.1,10.2).• Checking for homogeneity of variance of the residuals(Figure
10.3,10.4).
Nutritional Status of Children 7
Empirical analysis

Nutritional Status of Children 8
Empirical analysis
Data description and methodology
Nutritional Status of Children 9
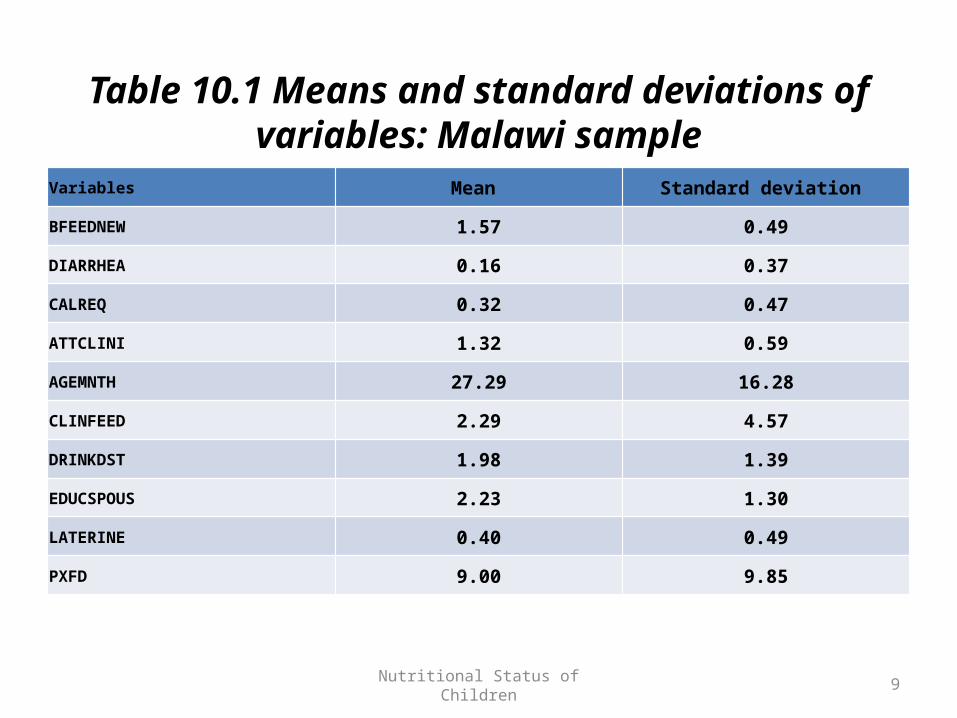
Table 10.1 Means and standard deviations of variables: Malawi sample
Variables Mean Standard deviation
BFEEDNEW 1.57 0.49
DIARRHEA 0.16 0.37
CALREQ 0.32 0.47
ATTCLINI 1.32 0.59
AGEMNTH 27.29 16.28
CLINFEED 2.29 4.57
DRINKDST 1.98 1.39
EDUCSPOUS 2.23 1.30
LATERINE 0.40 0.49
PXFD 9.00 9.85
Nutritional Status of Children 10
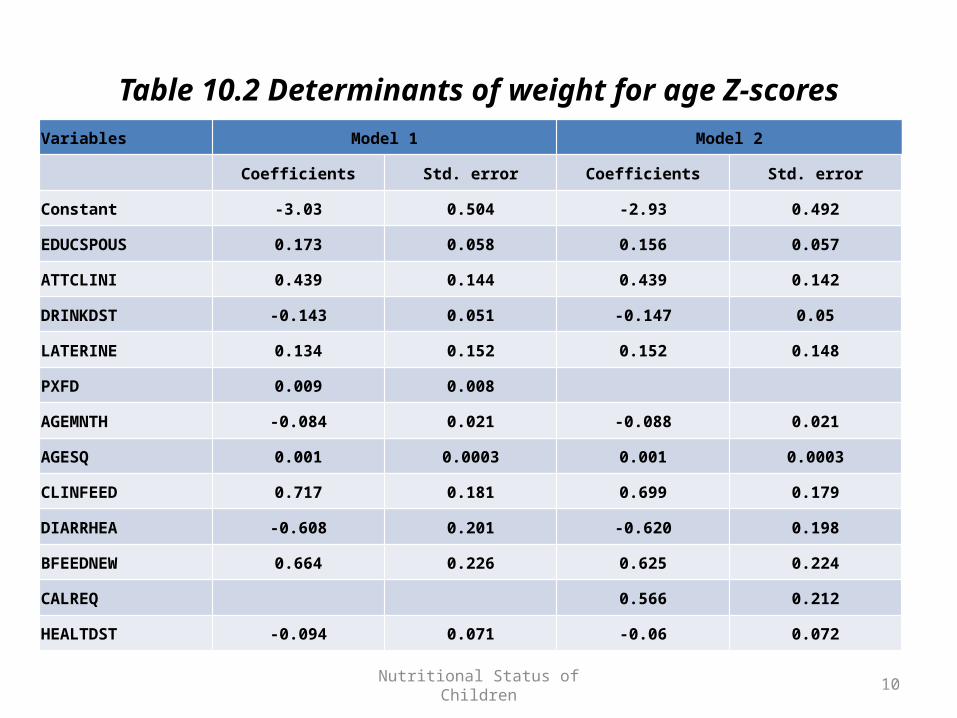
Table 10.2 Determinants of weight for age Z-scoresVariables Model 1 Model 2
Coefficients Std. error Coefficients Std. error
Constant -3.03 0.504 -2.93 0.492
EDUCSPOUS 0.173 0.058 0.156 0.057
ATTCLINI 0.439 0.144 0.439 0.142
DRINKDST -0.143 0.051 -0.147 0.05
LATERINE 0.134 0.152 0.152 0.148
PXFD 0.009 0.008
AGEMNTH -0.084 0.021 -0.088 0.021
AGESQ 0.001 0.0003 0.001 0.0003
CLINFEED 0.717 0.181 0.699 0.179
DIARRHEA -0.608 0.201 -0.620 0.198
BFEEDNEW 0.664 0.226 0.625 0.224
CALREQ 0.566 0.212
HEALTDST -0.094 0.071 -0.06 0.072
Nutritional Status of Children 11
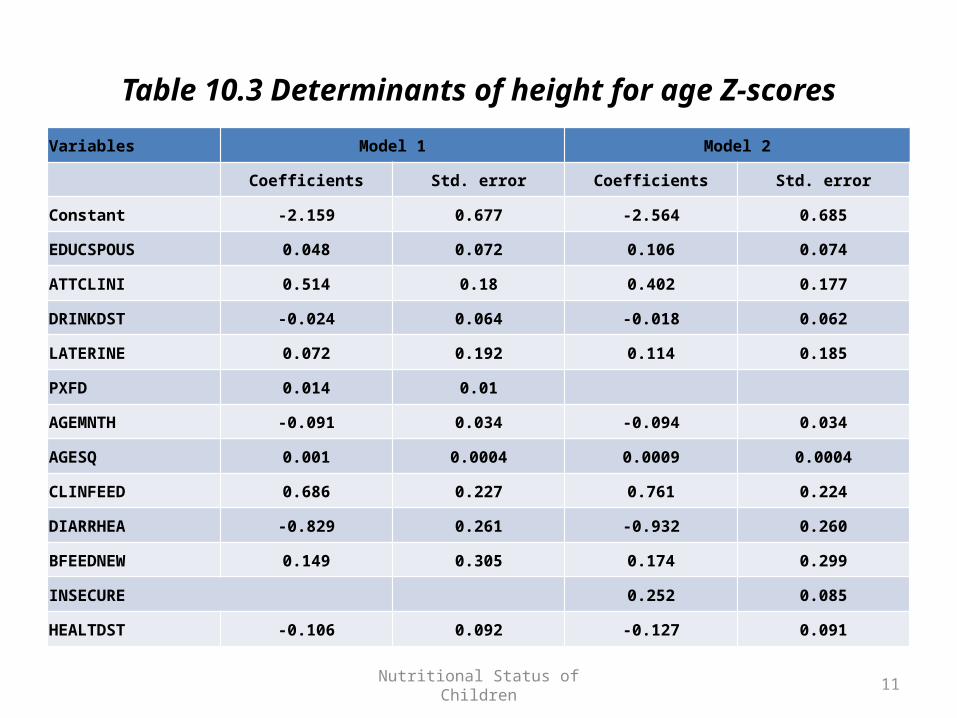
Table 10.3 Determinants of height for age Z-scoresVariables Model 1 Model 2
Coefficients Std. error Coefficients Std. error
Constant -2.159 0.677 -2.564 0.685
EDUCSPOUS 0.048 0.072 0.106 0.074
ATTCLINI 0.514 0.18 0.402 0.177
DRINKDST -0.024 0.064 -0.018 0.062
LATERINE 0.072 0.192 0.114 0.185
PXFD 0.014 0.01
AGEMNTH -0.091 0.034 -0.094 0.034
AGESQ 0.001 0.0004 0.0009 0.0004
CLINFEED 0.686 0.227 0.761 0.224
DIARRHEA -0.829 0.261 -0.932 0.260
BFEEDNEW 0.149 0.305 0.174 0.299
INSECURE 0.252 0.085
HEALTDST -0.106 0.092 -0.127 0.091
Nutritional Status of Children 12
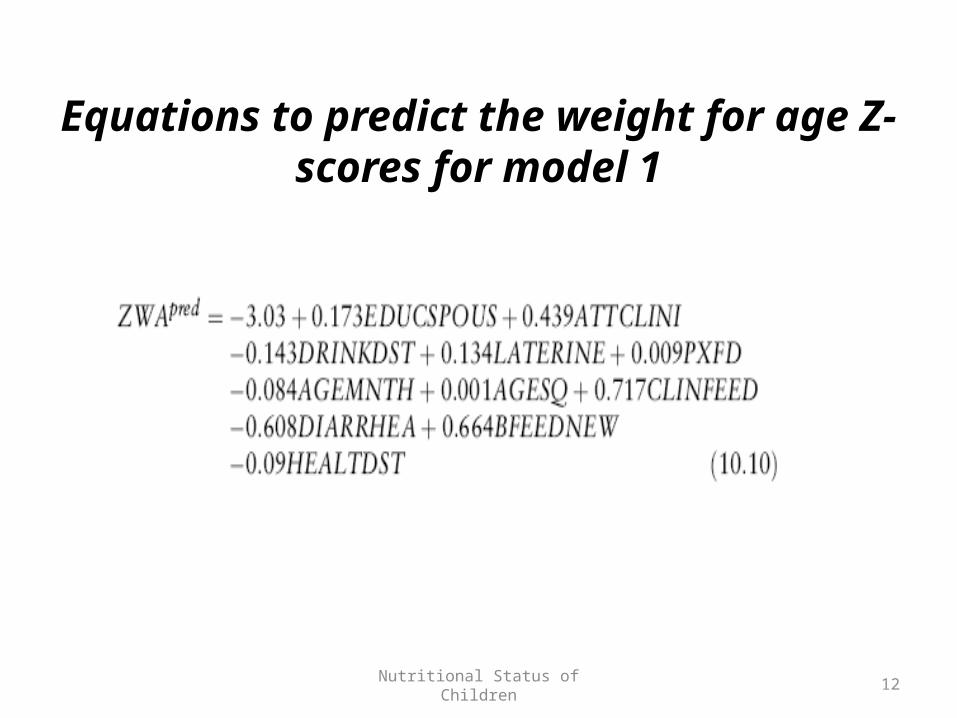
Equations to predict the weight for age Z-scores for model 1
Nutritional Status of Children 13
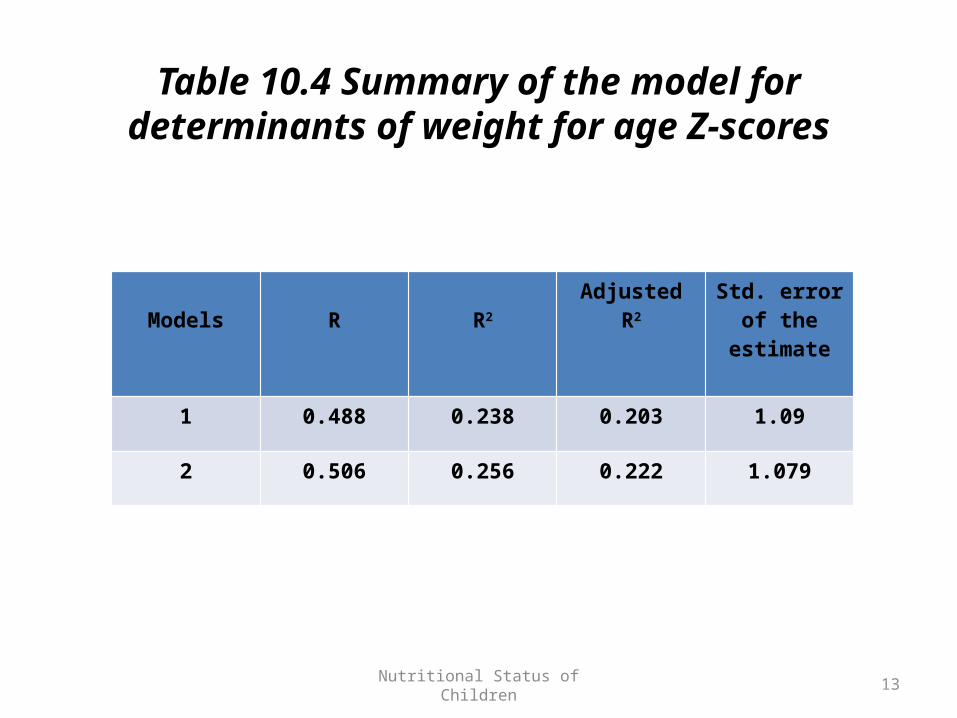
Table 10.4 Summary of the model for determinants of weight for age Z-scores
Models R R2 Adjusted R2 Std. error of the estimate
1 0.488 0.238 0.203 1.09
2 0.506 0.256 0.222 1.079
Nutritional Status of Children 14
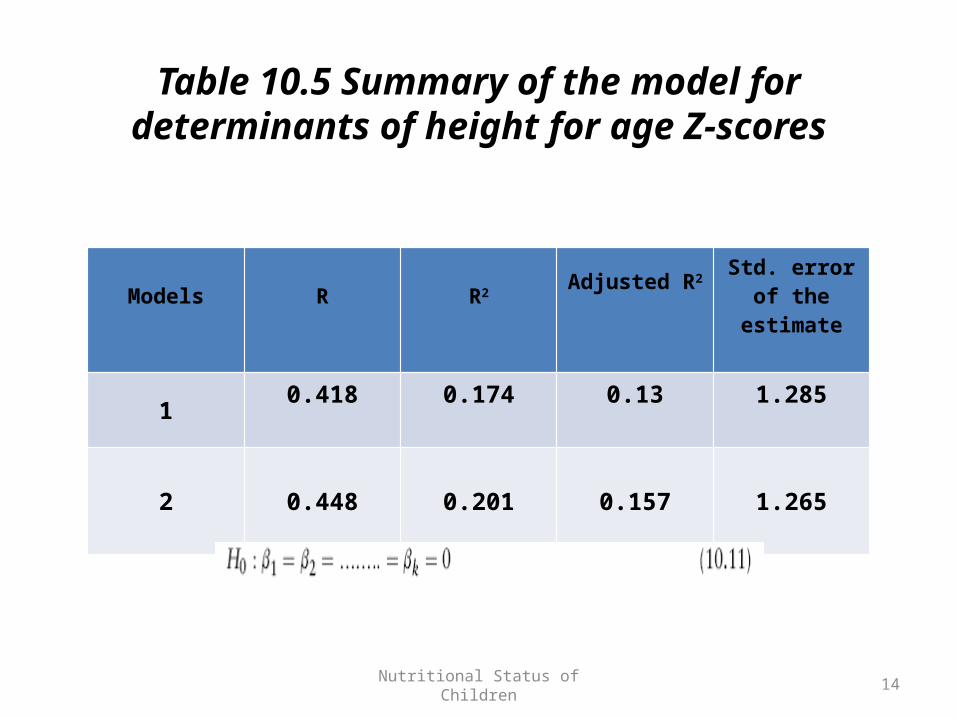
Table 10.5 Summary of the model for determinants of height for age Z-scores
Models R R2 Adjusted R2 Std. error of the estimate
1 0.418 0.174 0.13 1.285
2 0.448 0.201 0.157 1.265
Nutritional Status of Children 15
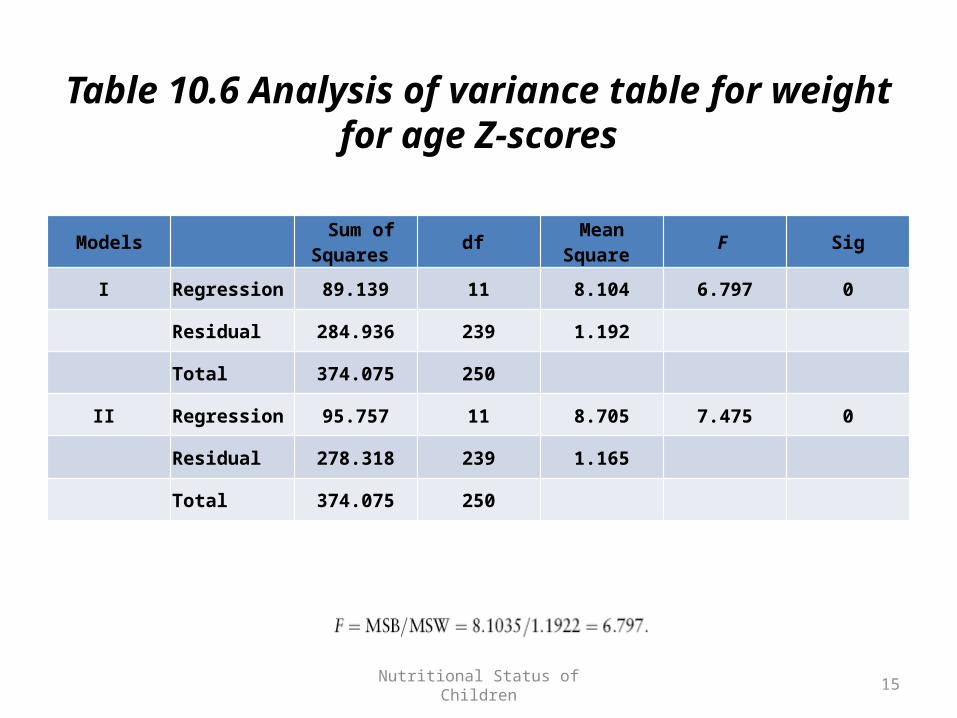
Table 10.6 Analysis of variance table for weight for age Z-scores
Models Sum of Squares df Mean Square F Sig
I Regression 89.139 11 8.104 6.797 0
Residual 284.936 239 1.192
Total 374.075 250
II Regression 95.757 11 8.705 7.475 0
Residual 278.318 239 1.165
Total 374.075 250

Nutritional Status of Children 16
Table 10.7 Analysis of variance table for height for age Z-scores
Models Sum of Squares df Mean Square F Sig
I Regression 70.948 11 6.45 3.901 0.00
Residual 335.649 203 1.653
Total 406.597 214
II Regression 81.525 11 7.411 4.628 0.00
Residual 325.072 203 1.601
Total 406.597 214
Nutritional Status of Children 17
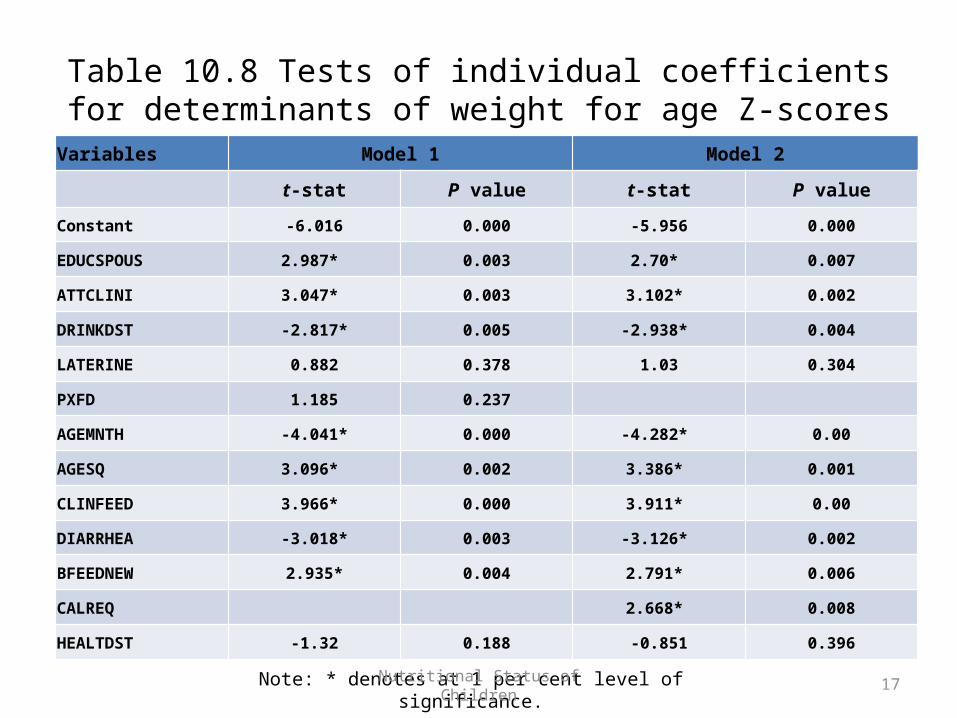
Table 10.8 Tests of individual coefficients for determinants of weight for age Z-scores
Variables Model 1 Model 2
t-stat P value t-stat P value
Constant -6.016 0.000 -5.956 0.000
EDUCSPOUS 2.987* 0.003 2.70* 0.007
ATTCLINI 3.047* 0.003 3.102* 0.002
DRINKDST -2.817* 0.005 -2.938* 0.004
LATERINE 0.882 0.378 1.03 0.304
PXFD 1.185 0.237
AGEMNTH -4.041* 0.000 -4.282* 0.00
AGESQ 3.096* 0.002 3.386* 0.001
CLINFEED 3.966* 0.000 3.911* 0.00
DIARRHEA -3.018* 0.003 -3.126* 0.002
BFEEDNEW 2.935* 0.004 2.791* 0.006
CALREQ 2.668* 0.008
HEALTDST -1.32 0.188 -0.851 0.396
Note: * denotes at 1 per cent level of significance.
Nutritional Status of Children 18
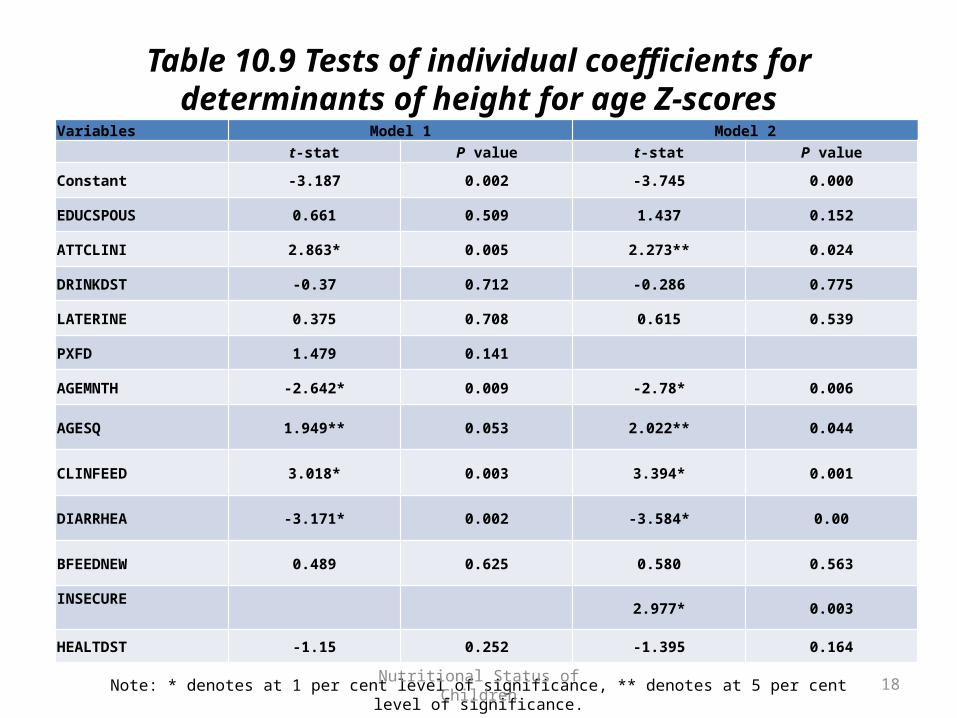
Table 10.9 Tests of individual coefficients for determinants of height for age Z-scores
Variables Model 1 Model 2t-stat P value t-stat P value
Constant -3.187 0.002 -3.745 0.000
EDUCSPOUS 0.661 0.509 1.437 0.152
ATTCLINI 2.863* 0.005 2.273** 0.024
DRINKDST -0.37 0.712 -0.286 0.775
LATERINE 0.375 0.708 0.615 0.539
PXFD 1.479 0.141
AGEMNTH -2.642* 0.009 -2.78* 0.006
AGESQ 1.949** 0.053 2.022** 0.044
CLINFEED 3.018* 0.003 3.394* 0.001
DIARRHEA -3.171* 0.002 -3.584* 0.00
BFEEDNEW 0.489 0.625 0.580 0.563
INSECURE 2.977* 0.003
HEALTDST -1.15 0.252 -1.395 0.164
Note: * denotes at 1 per cent level of significance, ** denotes at 5 per cent level of significance.

Nutritional Status of Children 19
Table 10.10 Part and partial correlation coefficients for weight for age and height for age
Variables Weight for age Height for agePart correlation Partial correlation Part correlation Partial correlation
EDUCSPOUS 0.169 0.19 0.042 0.046
ATTCLINI 0.172 0.193 0.183 0.197
DRINKDST -0.159 -0.179 -0.024 -0.026
LATERINE 0.05 0.057 0.024 0.026
PXFD 0.067 0.076 0.094 0.103
AGEMNTH -0.228 -0.253 -0.168 -0.182
AGESQ 0.175 0.196 0.124 0.136
CLINFEED 0.224 0.248 0.192 0.207
DIARRHEA -0.17 -0.192 -0.202 -0.217
BFEEDNEW 0.166 0.187 0.031 0.034
HEALTDST -0.075 -0.085 -0.073 -0.08
Nutritional Status of Children 20
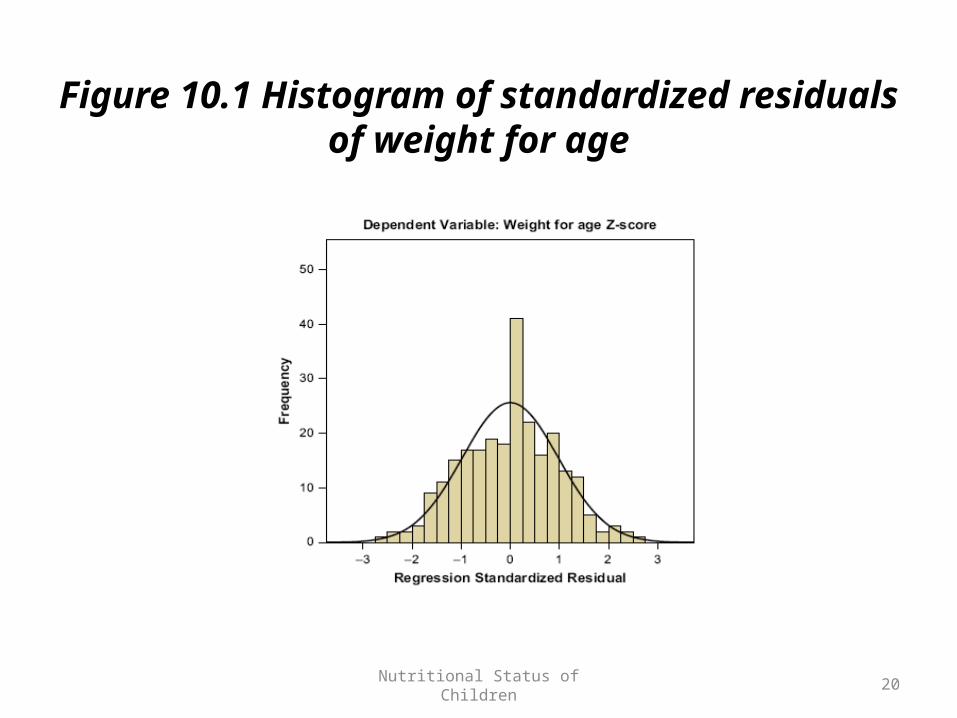
Figure 10.1 Histogram of standardized residuals of weight for age
Nutritional Status of Children 21
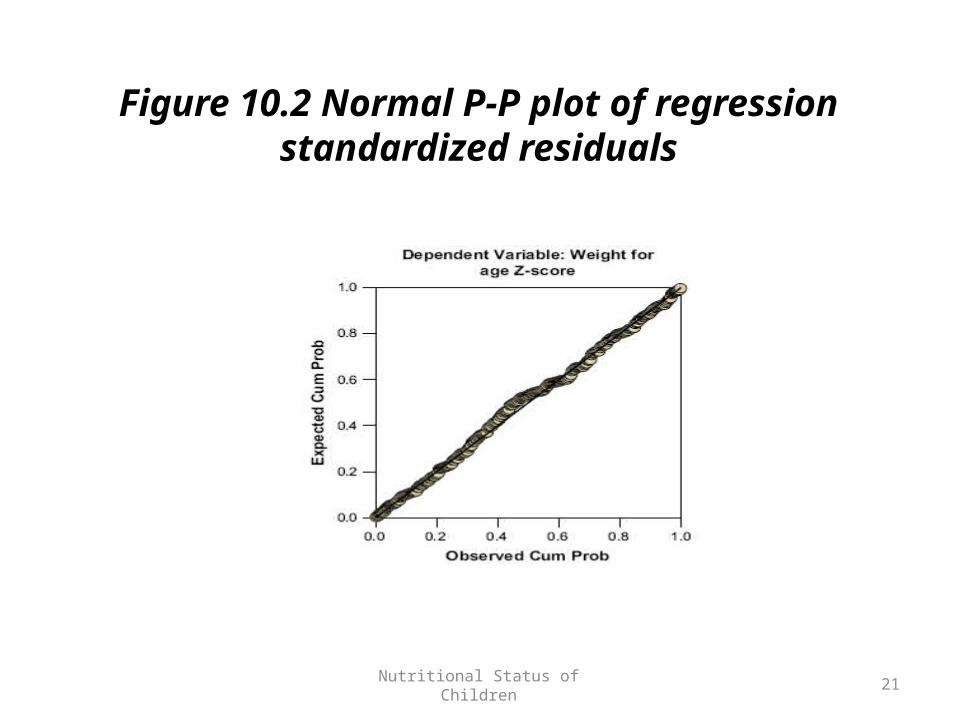
Figure 10.2 Normal P-P plot of regression standardized residuals
Nutritional Status of Children 22
Figure 10.3 Residuals plotted against predicted values for weight for age
Nutritional Status of Children 23
Figure 10.4 Residuals plotted against predicted values for height for age