Embed Size (px)
Citation preview
APPROVED: Richard G. Smith, Major Professor and Chair
of the Department of Behavior Analysis Shahla Ala’i-Rosales, Committee Member Janet Ellis, Committee Member David Hartman, Dean of the School of
Community Service Sandra L. Terrell, Dean of the Robert B.
Toulouse School of Graduate Studies
MULTIPLE-RESPONDENT ANECDOTAL ASSESSMENTS FOR BEHAVIOR
DISORDERS: AN ANALYSIS OF INTERRATER AGREEMENT
AND CORRESPONDENCE WITH FUNCTIONAL
ANALYSIS OUTCOMES
Anney Renee Fahrenholz, B.S.
Thesis Prepared for the Degree of
MASTER OF SCIENCE
UNIVERSITY OF NORTH TEXAS
August 2004

Fahrenholz, Anney Renee, Multiple-Respondent Anecdotal Assessments
for Behavior Disorders: An Analysis of Interrater Agreement and Correspondence
With Functional Analysis Outcomes. Master of Science (Behavior Analysis),
August 2004, 48 pp., 7 tables, 8 illustrations, references, 19 titles.
An analysis of interrater agreement across multiple respondents on
anecdotal assessments and correspondence between functional analysis
outcomes was completed. Experiment I evaluated overall agreement among
multiple respondents (direct-care staff) on the hypothesized function of each
residents (28 adults with mental retardation) problematic behavior using the
Motivational Assessment Scale (MAS) and the Functional Analysis Screening
Tool (FAST). Results of the questionnaires indicated that respondents agreed on
the function of the problematic behavior for 10 of the 28 residents. Experiment II
examined whether, for selected cases in which 4 out of 5 respondents agreed on
the function of the problematic behavior, correspondence occurred between
functional analyses and anecdotal assessments outcomes. Two of the 6
functional analyses did not evoke the problematic behavior. However, 4
functional analyses did produce corresponding outcomes suggesting that, when
the functional analyses produced interpretable data, the results of the functional
analyses corresponded with those of the anecdotal assessments.

ii
ACKNOWLEDGMENTS
I would like to sincerely thank Dr. Richard Smith for years of guidance and
supervision, and for inspiring me to strive for the best. I would like to recognize the other
individuals who helped make this project possible. Thank you to the Behavior Analysis
Resource Center crew, specifically Bobby Buckner, Kimberly Smith, Heather Moore,
Jaime Flores, Amanda McAllister, Carla Smith, Caroline Cason, and Lana Kliethermes
for assisting with the inexhaustible data collection. I would like to express my
appreciation to Denton State School for their ongoing support and to the faculty in the
Department of Behavior Analysis at the University of North Texas for instilling in me an
understanding and passion for the scientific analysis of behavior. And most importantly I
want to thank my husband, Sam Fahrenholz, for his continuous support, for all the
sacrifices he has made, and for his incredible willingness to journey with me across the
nation in support of my education.

iii
TABLE OF CONTENTS
Page
ACKNOWLEDGMENTS.................................................................................................ii LIST OF TABLES..........................................................................................................iv LIST OF ILLUSTRATIONS............................................................................................ v Chapter
1. INTRODUCTION ..................................................................................... 1 2. EXPERIMENT I: EVALUATION OF INTERRATER AGREEMENT WITHIN
AND ACROSS ASSESSMENTS ............................................................. 7 Methods Results Discussion
3. EXPERIMENT II: EVALUATION OF CORRESPONDENCE BETWEEN ANECDOTAL AND EXPERIMENTAL ANALYSES OUTCOMES .......... 20
Methods Results and Discussion
4. GENERAL DISCUSSION ............................................................................. 41 REFERENCES............................................................................................................ 46

iv
LIST OF TABLES
Page
1. Demographic information for EXP 1 participants .............................................. 17
2. Percentage of agreement within and across assessments, across respondents ......................................................................................................................... 17
3. Resident-by-resident results, with primary categories listed across respondents......................................................................................................................... 18
4. Frequency and percentage of primary categories ............................................ 19
5. Comparison of most frequently cited hypothesized maintaining variables........ 19
6. Demographic information for EXP 2 participants .............................................. 31
7. Correspondence between anecdotal assessments and the functional analyses ......................................................................................................................... 40
v
LIST OF ILLUSTRATIONS
Page
1. Results of Brad’s functional analysis ................................................................ 32
2. Results of Donna’s functional analysis ............................................................. 33
3. Results of Donna’s extended alone sessions ................................................... 34
4. Results of Deanna’s functional analysis ........................................................... 35
5. Results of Lydia’s functional analysis ............................................................... 36
6. Results of Lydia’s functional analysis displaying non-targeted SIB .................. 37
7. Results of Katie’s functional analysis................................................................ 38
8. Results of Kris’ functional analysis ................................................................... 39

1
CHAPTER 1
INTRODUCTION
Assessment and treatment of the functional properties of aberrant behavior has
been a major area of interest in our field for over 20 years. A growing emphasis on
treatments derived from a knowledge of the environmental functions of aberrant
behavior has led behavior analysts to develop a range of assessment methodologies;
thus, functional assessment has become an essential step prior to the design of a
treatment package (Sturmey, 1994). Functional assessment has been defined as the
process of gathering information about the antecedents and consequences that are
functionally related to the occurrence of a problem behavior (Miltenberger, 2001). Three
common methods of assessment include: indirect assessment, in which information is
gathered through interviews, rating scales and questionnaires; direct observation, in
which an observer records antecedent, behavioral and consequential events as they
occur; and experimental methods, in which antecedents and consequences are
manipulated to observe their effect on the target behavior (Miltenberger, 2001).
Experimental methods involve the systematic manipulation of antecedents and
consequences that evoke and maintain problem behaviors, while eliminating extraneous
variables that may occur in the individual.s natural setting. Iwata, Dorsey, Slifer,
Bauman, and Richman (1982) arranged different experimental conditions to determine
whether the reinforcer maintaining their participants. aberrant behavior was attention
from adults, access to preferred items, escape from demands, or sensory stimulation. A
primary advantage of functional analysis is that it demonstrates a cause-and-effect
relationship between the controlling variables and the problem behavior. That is,
functional relationships among suspected environmental and behavioral events are

2
confirmed or disconfirmed by systematically manipulating environmental events and
observing their effects on behavior. A major disadvantage of experimental analysis is
that it requires extensive effort and time. Additionally, professional expertise is
necessary to conduct the analysis and interpret the results (Miltenberger, 2001). Some
researchers and clinicians have evaluated methodological variations of �standard�
experimental analysis procedures, such as conducting a brief, 90-min analysis, in
response to these disadvantages and in order to make them more practical for
outpatient and clinical settings (Derby et al., 1992; Northup, Wacker, Sasso, Steege,
Cigrand, Cook, & DeRaad, 1991; Vollmer, Marcus, Ringdahl, & Roane, 1995). However,
to date, no broadly acceptable alternative method has emerged.
A second type of functional assessment is descriptive assessment. A descriptive
assessment involves observing naturally occurring antecedent and consequential
events and recording the occurrence of target behaviors in real time. An advantage of
the descriptive assessment is that it suggests how reinforcement operates in the
individual�s natural environment (i.e., the external validity of outcomes is enhanced by
conducting the assessment in the setting in which the problem behavior typically
occurs). In addition, the observer records potentially relevant environmental and
behavioral events as they occur, rather than relying on memory as in paper-and pencil
types of assessment (Anderson & Long, 2002; Miltenberger, 2001). However, because
experimenters have no control over environmental variables, information gathered
during these assessments provides correlational, not causal, information regarding
environment-behavior relations. An additional disadvantage is that direct observation
requires more time and effort compared to anecdotal assessments (Miltenberger, 2001).

3
A third type of assessment is anecdotal assessment. Anecdotal methods involve
gathering information about environmental and behavioral events indirectly, typically
from caregivers or teachers. A number of anecdotal or indirect methods (i.e. interview
formats, checklists, and rating scales) have been developed to solicit information about
situations in which behavior problems are more or less likely to occur (Iwata, Zarcone,
Vollmer, & Smith, 1994). Advantages of using anecdotal assessments are they are easy
to conduct, do not require substantial time, and a number of interview formats and
questionnaires are available to the public (Miltenberger, 2001). A disadvantage of
anecdotal assessments is their reliance on opinions or memory. Also, these
assessments generate hypotheses about the functional properties of target behaviors
but do not directly test those hypotheses. It has been recommended that these types of
instruments be used strictly as preliminary information-gathering tools (Iwata et al.,
1994; Sturmey, 1994).
Previous research on anecdotal assessments has yielded mixed results
regarding the validity and reliability of these assessments. An anecdotal assessment
that is frequently used in clinical, school, and institutional settings is the Motivational
Assessment Scale (MAS) (Durand & Crimmins, 1988). The MAS was developed to
identify the potential influences of contingent attention, escape, and self-stimulation on
self-injurious behavior (SIB). Interrater reliability was assessed by administering the
MAS to 35 teachers and teacher�s aides who worked with 50 children with SIB.
Interrater correlational analyses compared the teachers and teacher aides� responses
on individual items (correlation range = .66 � .92), on mean scores for the subscales
(correlation range = .80 � .95), and on ranks within each subscale (correlation range =

4
.66 � .81). Results showed that all three correlational analyses were significant at the
.001 level. After concluding that the MAS produced reliable outcomes, correspondence
with experimental analyses was assessed by comparing the teacher�s ratings on 8
children to results from analogue (experimental) analyses. Results of the
correspondence study indicated that the MAS results corresponded with the results of
the analogue data. Additional studies have conducted item-by-item factor analyses to
validate the differentiation of the MAS categories of maintaining variables (attention,
tangible, escape and sensory) or to show that these categories occasioned differential
responding from assessors (Bihm, Kienlen, Ness, & Poindexter, 1991; Singh, Donatelli,
Best, Williams, Barrera, Lenz, Landrum, Ellis, & Moe, 1993). Singh et al. (1993)
suggested that MAS results reliably differentiate only when assessing the function of
aberrant behavior that occurs at high rates (more than 15 times per hour). Results from
a study by Bihm et al. (1991) verified that the MAS categories of reinforcement were
applicable to different types of aberrant behavior (i.e. aggression, self-injury, etc).
Although some research indicates that the MAS is a reliable assessment tool,
other research has produced inconsistent results. A replication of Durand and Crimmins
(1988) study indicated that the MAS did not generate reliable outcomes across
respondents (Zarcone, Rodgers, Iwata, Rourke, & Dorsey, 1991). Using 2 respondents
per client from both institutional and school settings, these researchers assessed the
reliability of the MAS by using both an item-by-item percentage agreement method and
a more lenient �adjacent scores� percentage agreement method. Results showed that
agreement scores using the item-by-item method ranged from 0% to 63% (M = 20%)
and agreement scores using the �adjacent� method ranged from 0% to 88% (M = 48%).

5
Only 29% of the paired respondents actually agreed on the variables maintaining the
SIB. Several other studies have supported the results of Zarcone et al. (Churchill &
Smith, 1996; Simmons & Smith, 2001; Smith & Churchill, 1996).
Many methods developed for assessing the functions of behavior require
extensive amounts of time, effort and highly specific skills. Development of simple
questionnaires to assess the functions of target behaviors has been seen as a response
to this problem. Despite the disadvantages of anecdotal assessments, a well-designed
questionnaire that could accurately assess the function of a target behavior and be
administered quickly to a wide range of informants could provide an efficient and
effective alternative to more intrusive methods (Sturmey, 1994).
The current study was designed to further evaluate the usefulness of anecdotal
assessments. Specific goals of this study were to evaluate overall agreement between
multiple respondents on the primary function of aberrant behavior using the MAS and
the Functional Analysis Screening Tool (FAST) (Iwata & DeLeon, 1996) and, if
agreement occurred across respondents, to assess correspondence between the
results of a functional analysis and the anecdotal assessments. For each set of five
respondents and one resident, the percentage of agreement on the primary function of
aberrant behavior was calculated across the MAS and FAST, and functional analyses
were conducted for a set of residents for whom MAS and FAST outcomes showed high
levels of agreement across respondents. The current study extends the anecdotal
assessment literature in three ways. First, past research on anecdotal assessment has
only evaluated the responses of 2 respondents per client. The current study assessed
agreement across multiple (5) respondents. Second, the current study analyzed
6
agreement both within and across anecdotal assessments. Two questionnaires were
administered to all respondents; the MAS and the FAST (Iwata & DeLeon,1996). Lastly,
functional analyses were conducted with a sample of residents for whom anecdotal
assessments had yielded high agreement measures across respondents.

7
CHAPTER 2
EXPERIMENT I: EVALUATION OF INTERRATER AGREEMENT WITHIN AND ACROSS ASSESSMENTS
Method
Participants and Setting
Experiment I was conducted at a large, long-term, state residential facility for
adults with developmental disabilities. The anecdotal assessments were administered to
the respondents in secluded, quiet areas of the resident�s homes or vocational sites.
Residents. The residents were 28 adults with developmental disabilities, who had
a history of SIB or physical aggression toward others and property. These behaviors
were identified by residential unit psychologists as target behaviors for formal behavior
intervention. The behaviors ranged from frequent and severe (e.g., more than 202
times/month) to infrequent and mild (e.g., less than 5 times/month). The residents� ages
ranged from 23 to 66 years, and they functioned in the mild to profound range of mental
retardation. Refer to Table 1 for a description of the residents� ages, functioning levels
and target behaviors.
Respondents. Each resident�s problem behavior was rated by 5 staff members
who had worked directly with that resident for at least 6 months. All respondents had a
minimum high-school diploma or equivalent and worked as either direct-contact staff,
vocational staff or Qualified Mental Retardation Professional (QMRP). For confidentiality
purposes staff were identified by their employee numbers.

8
Materials
Materials used in this experiment included 2 sets of questionnaires for each
resident (1 for the respondent and 1 for the interviewer), a sheet with the MAS rating
scale and what each number represented, and pencils.
MAS. The MAS was developed by Durand and Crimmins (1988) as an
individualized assessment tool to identify contingencies of reinforcement maintaining
aberrant behavior. The 16-item questionnaire was organized to provide information
about 4 possible categories of reinforcing consequences: attention, tangible, escape,
and sensory. Four questions were allocated to each category and respondents rated
each question using a 7-point (i.e., 0 � 6) Likert-type scale. A score of zero indicated
that the behavior never occurred under the circumstances identified in the question; a
score of 6 indicated that the behavior always occurred under the circumstances
identified in the question; and scores between those values indicated intermediate
ratings (e.g., a score of 3 indicated that the behavior occurred �sometimes� under the
circumstances identified in the question). A score was obtained for each category by
summing the points from the 4 questions from that category. Categories were then
rank-ordered according to the total scores, and the category receiving the most points
was considered the hypothesized maintaining variable.
FAST. The FAST was developed by Iwata and DeLeon (1996) to identify
variables that maintain aberrant behavior. Four possible categories of reinforcement
were examined: social positive reinforcement in the form of attention and/or preferred
items, social negative reinforcement in the form of escape from tasks or demands,
automatic positive reinforcement in the form of sensory stimulation, and automatic

9
negative reinforcement in the form of pain attenuation. Five questions were allocated to
each category and each question was answered in a Yes/No format. A point was
awarded for every �Yes� response given by the respondent. The points were summed
for each category, and the category receiving the most points was considered the
hypothesized maintaining variable.
Administration Procedures
Graduate and undergraduate behavior analysis students were trained to
administer the anecdotal assessments. The MAS and FAST were administered to each
respondent individually. Both the interviewer and the respondent had copies of the
assessments. Before either assessment was administered, background information
(e.g. name of resident, ID number of respondent, date, etc.) was entered on the form by
the interviewer. Definitions of the problem behaviors, including topographical
descriptions, were developed based on target behaviors identified in each resident�s
behavior intervention program. Before the administration of the MAS, a sheet of paper
listing the Likert-scale numbers and description of what each number represented was
provided for each respondent. Each question was read aloud to the respondent by the
interviewer and respondents were instructed to reply to each question with a number
from the Likert scale. If the respondent indicated difficulty answering a question or
asked for clarification, the interviewer repeated the question. No additional information
or clarifications were provided. The MAS was administered first, followed by the FAST.
Upon completion of the assessments, the interviewer thanked the respondent for
participating, left the area, and scored the instruments.
10
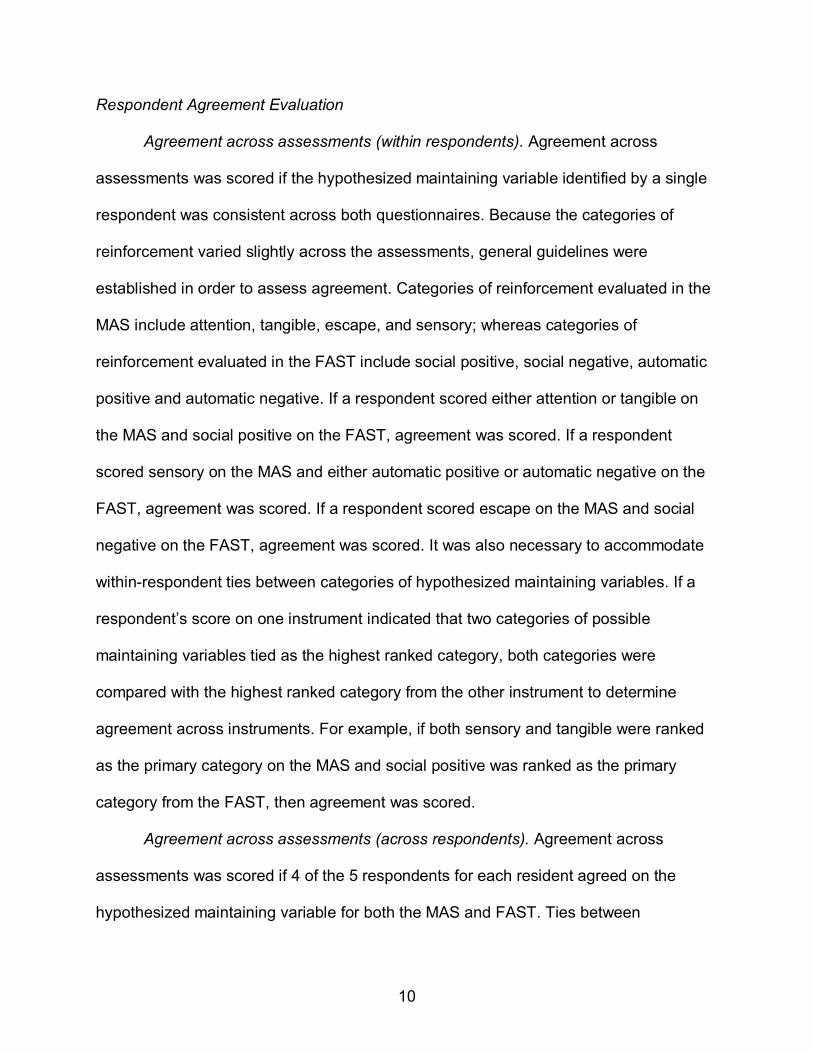
Respondent Agreement Evaluation
Agreement across assessments (within respondents). Agreement across
assessments was scored if the hypothesized maintaining variable identified by a single
respondent was consistent across both questionnaires. Because the categories of
reinforcement varied slightly across the assessments, general guidelines were
established in order to assess agreement. Categories of reinforcement evaluated in the
MAS include attention, tangible, escape, and sensory; whereas categories of
reinforcement evaluated in the FAST include social positive, social negative, automatic
positive and automatic negative. If a respondent scored either attention or tangible on
the MAS and social positive on the FAST, agreement was scored. If a respondent
scored sensory on the MAS and either automatic positive or automatic negative on the
FAST, agreement was scored. If a respondent scored escape on the MAS and social
negative on the FAST, agreement was scored. It was also necessary to accommodate
within-respondent ties between categories of hypothesized maintaining variables. If a
respondent�s score on one instrument indicated that two categories of possible
maintaining variables tied as the highest ranked category, both categories were
compared with the highest ranked category from the other instrument to determine
agreement across instruments. For example, if both sensory and tangible were ranked
as the primary category on the MAS and social positive was ranked as the primary
category from the FAST, then agreement was scored.
Agreement across assessments (across respondents). Agreement across
assessments was scored if 4 of the 5 respondents for each resident agreed on the
hypothesized maintaining variable for both the MAS and FAST. Ties between

11
categories of hypothesized maintaining variables were analyzed slightly different across
assessments (across respondents). If a respondent�s score on one instrument indicated
that two categories of possible maintaining variables tied as the highest ranked
category, both categories were compared with the highest ranked categories across the
other respondents assessments to determine agreement within assessments (across
respondents). For example, if both sensory and tangible were ranked as the primary
category on the MAS for respondent 1and all other respondents ranked tangible as the
primary category, then agreement across respondents on the MAS was scored.
Additionally, agreement across assessments (across respondents) was scored only
when 4 out of 5 respondents agreed on 1 maintaining variable. If 4 (or 5) respondents
scored tangible on the MAS and social positive on the FAST, then agreement was
scored. If 2 respondents scored tangible and 3 respondents scored attention on the
MAS and all respondents scored social positive on the FAST, then agreement was not
scored. Agreements were summed across residents and the total was divided by the
total number of residents to obtain a percentage of assessments that produced
agreement.
Agreement within assessments (across respondents). Agreement within
assessments was scored if 4 of the 5 respondents for each resident agreed on the
hypothesized maintaining variable for either the MAS or FAST. Agreements were
summed across residents and the total was divided by the total number of residents to
obtain a percentage of assessments that produced agreement. Scoring rules described
above (agreement across assessments [across respondents]) for ties were used.

12
Reliability of scoring. All data from MAS and FAST assessments were calculated
by 2 graduate or undergraduate students trained in the administration and scoring of the
instruments. Agreement was assessed on a question-by-question basis and was 100%
for both instruments.
Results
Table 2 shows percentages of agreement within and across assessments,
across respondents. For the MAS, 4 of 5 respondents agreed on the hypothesized
maintaining variable for 54% (15/28) of residents. For the FAST, 4 of 5 respondents
agreed on the hypothesized maintaining variable for 79% (22/28) of residents. Across
the two assessments, 4 of 5 respondents agreed on the hypothesized maintaining
variable for 54% (15/28) of residents. A further analysis examined perfect agreement
across all 5 respondents on the hypothesized maintaining variable. Perfect agreement
occurred for 14% (4/28) of residents on the MAS, 36% (10/28) of residents on the
FAST, and 4% (1/28) of residents across both assessments.
Table 3 displays resident-by-resident results, with primary categories of
hypothesized maintaining variables listed across respondents. This table uses a
scatterplot format to permit more detailed visual analyses of agreement across
assessments, within and across respondents. Yellow shading indicates within-
respondent agreements, bold type indicates agreement across respondents, and green
shading indicates agreement across instruments. These results show that agreement
across assessments and within respondents occurred for 77% of residents. As
previously noted, agreement both within and across assessments was achieved for 10
of 28, or 36% of residents.

13
Table 4 shows frequencies and percentages of primary categories of maintaining
variables scored across respondents to the MAS and FAST. Of the 140 respondents to
the MAS, 72 respondents (or 51%) scored tangible as the primary category; 42
respondents (or 30%) scored sensory reinforcement; 23 respondents (or 16%) scored
escape; and 12 respondents (or 9%) scored attention. Nine respondents� scores
showed a two-way tie between hypothesized maintaining variables, resulting in a total
score of 106%. Of the 140 respondents to the FAST, 101 respondents (or 72%) scored
social positive reinforcement as the primary category; 53 respondents (or 38%) scored
social negative reinforcement; 15 respondents (or 11%) scored automatic positive
reinforcement; and 15 respondents (or 11%) scored automatic negative reinforcement.
Thirty-eight respondents� scores showed a 2-way tie between categories and 5
respondents� scores showed a 3-way tie between categories, resulting in an overall
percentage of 131%.
Discussion
Anecdotal assessments are frequently used in clinics, schools, and other
facilities as a means of gathering information on an individual�s behavior. Their use is
prevalent because they are easy to administer and require limited time. However, it is
important to interpret the results of anecdotal assessments with some caution because
these assessments expect the respondent to rely on their memory and verbally report
on past events regarding another individual�s behavior and then to draw conclusions
about these behavioral episodes. Regardless of these disadvantages, results of
Experiment I produced relatively encouraging levels of agreement on the hypothesized
14
maintaining variable across respondents. Overall, 36% agreed on the hypothesized
maintaining variable across both assessments.
The respondents were more likely to agree on the hypothesized maintaining
variable on the FAST (79%) compared to the MAS (54%). Differences between the
anecdotal assessments� measures may have affected level of agreement on the
hypothesized maintaining variables. For example, further analysis of response patterns
within the assessments indicated that respondents were more likely to identify multiple
maintaining variables (i.e., were more likely to produce �ties�) on the FAST than on the
MAS. On the FAST, 38 respondents had 2-way ties and 5 respondents had 3-way ties
(33%) on the primary categories of maintaining variables, compared to 8 respondents
who had 2-way ties (9%) on the MAS. Therefore, agreement across raters was more
likely to be seen for the FAST, because more categories were scored as primary
categories of hypothesized maintaining variables per respondent. These statistics
suggest that the FAST may be a less sensitive measure. The FAST utilized a Yes/No
response which allowed for more agreement, compared to the MAS which used a 0-6
Likert scale to measure responses. The MAS was a more sensitive measure because
the assessment produced differentiated responses within respondents. That is, a given
respondent was more likely to come up with a single hypothesized maintaining variable
on the MAS than on the FAST. For an assessment to be useful, respondents must be
able to respond differentially within the instrument and also be able to agree with other
respondents.
Table 5 presents a comparison of the literature regarding the most frequently
identified maintaining variables from the MAS. The categories most frequently cited by
15
Durand and Crimmins (1988) included sensory (17%), attention (17%), tangible (48%),
and escape (18%). Additionally, Zarcone et al. (1991) reported that their respondents
cited sensory (38%), attention (8%), tangible (31%) and escape (16%) as likely
maintaining variables. A comparison of these findings to Experiment I outcomes show
some similarities. Multiple agreements or ties occurred across all 3 experiments ranging
from 6-9%. Surprisingly, attention was ranked as the least probable maintaining
reinforcer and tangible was ranked as either the highest (Durand & Crimmins, 1988; and
current study) or second highest category (Zarcone et al. 1991). By comparison, a 152
single-subject, experimental-epidemiological analysis indicated that 38.1% (58/152) of
functional analyses on SIB were maintained by social negative reinforcement followed
by 26.3% (40/152) of functional analyses maintained by social positive reinforcement
(Iwata et al., 1994).
Some limitations of Experiment I should be discussed. First, differences between
assessments may have affected agreement scores between instruments. Differences in
response format (i.e., Likert-scale vs. Yes/No format), the number of questions asked
(i.e., 16 vs.18) and the categories of possible maintaining variables (i.e., sensory,
attention, tangible and escape vs. social positive, social negative, automatic positive
and automatic negative) may account for overall agreement differences. The differences
between the assessments make it challenging to compare the final scores. Second, an
updated version of the FAST, which eliminated or reworded ambiguous questions, is
now available (Iwata & DeLeon, 1997). The new version of the FAST eliminated
questions such as �The behavior usually occurs in the presence of other persons� (Item
1) and �The person engages in other annoying behaviors to get attention� (Item 4).

16
Third, due to high employee turnover, a wide range of staff participated as respondents.
Although all respondents were required to have known the resident for at least 6
months, direct-contact staff, vocational trainers, and QMRPs all served as respondents.
Differences in relationships with residents based on different staff positions and
responsibilities may have affected their responses to these assessments. Fourth,
definitions of the problem behaviors were based on definitions from each resident�s
behavioral intervention program. Therefore, some target behaviors included more than
one topography of aberrant behavior. For example, the definition of SIB for one resident
included both eye poking and face hitting. Although these two behaviors were defined
as self-injurious, they may have been maintained by different contingencies (e.g., eye
poking may have been maintained by sensory stimulation, and face hitting may have
been maintained by attention from caregivers). It is recommended that these
questionnaires assess only one topography of behavior at a time.
Based on the results of Experiment I, several residents were selected to
participate in Experiment II. Potential participants were drawn from the pool of residents
for whom both within and across assessment agreement was achieved in Experiment I.
Other selection criteria included reports that the problem behaviors assessed in
Experiment I continued to be a problem and availability to participate.

17
Table 1
Demographic Information for Experiment I Participants
Resident Age Level of Functioning Target Behavior Topography of Target Behavior1 58 Profound SIB Head slap, scratch self2 47 Profound SIB Eye Poke3 46 Profound SIB Head bang4 43 Profound SIB Hit head, pull hair5 38 Severe SIB Head bang, hit self6 55 Severe SIB Bite hand/wrist7 56 Severe SIB Head bang8 51 Severe SIB Hit/scratch self9 44 Severe SIB Bite self
10 61 Mild SIB Scratch, throw self on ground11 46 Severe SIB Skin pick, scratch self12 58 Mild SIB Head bang, bite self13 37 Severe SIB Bite/ hit self14 65 Moderate SIB Head hit15 37 Moderate SIB Throw against walls, slap self16 66 Moderate SIB Hit, pinch or scratch self17 39 Mild SIB Head bang, bite self, run into walls18 23 Severe SIB Bite, pinch or punch self, head bang, skin pick 19 50 Profound SIB Skin pick, bite self, head bang20 49 Profound SIB Bite & pinch self21 39 Profound SIB Hand mouth22 51 Moderate SIB Any act that injures self23 25 Severe AGP Grab & throw materials, overturn furniture.
PAO Push, grab, punch or hit another person24 49 Profound SIB Eye poke, hit self25 24 Moderate SIB Slap/scratch self, head bang26 45 Mild SIB Head bang, scratch, hair pull, arm bite27 54 Profound SIB Arm bite28 36 Profound SIB Arm bite & head hit
Table 2
Agreement Within and Across Assessments, Across Respondents
MAS FAST MAS & FAST4 of 5 agree 15 of 28 22 of 28 10 of 28
% 54 79 36
5 of 5 agree 4 of 28 10 of 28 1 of 28% 14 36 4

18
Table 3 Resident-by-Resident Results, With the Primary Maintaining Variables Listed Across Respondents Residents Respondent 1 Respondent 2 Respondent 3 Respondent 4 Respondent 5 Agreement
MAS FAST MAS FAST MAS FAST MAS FAST MAS FAST MAS FAST 1 Sen A- Tan S+ Esc S+ Sen S+/A- Tan S+/S- 2Sen/2Tan 4S+ 2 Sen S+/A+ Sen A+ Sen A+ Sen A+ Sen S+ 5Sen 4A+ 3 Sen A+ Esc S- Esc S- Tan S- Tan S+/S- 2Tan/2Esc 4S- 4 Att S+/A+ Tan S+ Att S+/A - Esc S+/S- Tan S+/S- 2Tan/2Att 5S+ 5 Esc S- Tan S+ Tan S+ Att S+ Tan S+/S- 3Tan/1Att 4S+ 6 Tan S+/A+ Tan S+ Tan S+ Att S-/A+ Tan S+/S- 4Tan/1Att 4S+ 7 Att S+ Tan S+ Att S+ Tan S+ Sen S+ 2Att/2Tan 5S+ 8 Tan S+ Tan S+ Tan S+ Sen/Tan S- Sen A- 4Tan 3S+ 9 Tan S+ Sen A+ Tan S+/S- Sen S+ Tan S- 3Tan 3S+ 10 Tan S+ Tan S+ Tan S+ Sen S+/S- Tan S+ 4Tan 5S+ 11 Sen A- Tan S- Tan S+ Esc S+ Sen S- 2Tan/2Sen 2S+/2S-12 Esc S- Esc S- Esc S+/S- Esc/Tan S+/S- Tan S+/S- 4Esc 5S- 13 Tan S+/S- Tan S+ Tan S+/S- Esc S+ Tan S- 4Tan 4S+ 14 Att S+ Esc A- Esc S+/S- Esc/Tan S- Tan S+ 3Esc 3S+ 15 Tan S+/S- Esc S+ Att S+/S-/A- Tan S+/S- Tan S+ 3Tan/1Att 5S+ 16 Sen/Tan S+ Tan S+ Sen S-/A- Sen S+ Sen S+ 4Sen 4S+ 17 Tan S+ Tan S+/S- Sen S+/S-/A - Tan S+/S- Att S+/S- 3Tan/1Att 5S+/4S-18 Tan S+ Tan S- Esc/Tan S+ Tan S+/S- Tan S+/S- 5Tan 4S+/3S-19 Tan S+ Sen/Att S+ Esc S+ Sen S+ Att S+/A+/A- 2Att/2Sen 5S+ 20 Sen S+/S- Sen A- Sen A- Sen S+ Esc S+/S- 4Sen 3S+ 21 Sen A+ Sen A+ Sen/Esc S+ Sen S+/A+ Tan S+ 4Sen 3A+/3S+22 Tan S+ Tan S+ Tan S+/S- Tan S+ Tan S+ 5Tan 5S+ 23 Tan S+/S- Tan S+ Sen S+ Tan S+ Tan S+ 4Tan 5S+ 24 Sen S-/A+ Sen A+/S+ Sen S- Sen A+ Sen/Tan S+/A+/A- 5Sen 4A+ 25 Tan S+/S- Tan S+ Att S+ Tan S+ Tan/Att S+/S- 4Tan 5S+ 26 Tan S+ Sen S+ Tan S+ Sen S+ Tan S- 3Tan 4S+ 27 Sen S- Sen S+ Tan A- Sen/Tan S+ Tan S+/S-/A+ 4Sen 3S+ 28 Esc S- Esc S+ Tan S- Tan S- Esc S- 3Esc 4S-
Note: On the MAS, Sen = sensory; Esc = escape; Att = attention; Tan = tangible. On the FAST, S+ = social positive; S- = social negative; A+ = automatic positive; A- = automatic negative

19
Table 4
Frequency and Percentage of Primary Hypothesized Maintaining Variables Scored
Functional Analysis Screening Tool (FAST)
Sensory Auto +Attention Auto -Tangible Social +Escape Social -Total Total
Percentage
23
Motivational Assessment Scale (MAS)
Frequency Frequency
149
Percentage
30%9%
51%16%106%
421272
184
11%11%72%38%131%
1515
10153
Note. Frequency exceeds 140 and percentages exceed 100% due to within-respondent
ties on the primary hypothesized maintaining variable.
Table 5
Comparison of the Most Frequently Cited Primary Maintaining Variables.
Sensory Attention Tangible Escape Multiple
Durand & Crimmins (1988) 17% 17% 48% 18% 8%
Zarcone et al (1991) 38% 8% 31% 16% 6%
Fahrenholz & Smith (2004) 30% 9% 51% 16% 9%
Note. From � Reliability analysis of the motivation assessment scale: A failure to
replicate,� by J. Zarcone, T. Rodgers, B. Iwata, D. Rourke, & M. Dorsey, 1991,
Research in Developmental Disabilities, 12, pp. 349-360. From �Identifying the variables
maintaining self-injurious behavior, � by M. Durand & D. Crimmins, 1988, Journal of
Autism and Developmental Disorders, 18, pp. 99-117.

20
CHAPTER 3
EXPERIMENT II: EVALUATION OF CORRESPONDENCE
BETWEEN ANECDOTAL AND EXPERIMENTAL ANALYSES OUTCOMES
Method
Participants and Setting
All sessions were conducted at the Behavior Analysis Resource Center (BARC),
a clinic for assessment and treatment of problem behaviors, located within the
residential facilities campus. The observation room wherein the sessions were
conducted contained a table, two chairs, and appropriate materials for each analogue
session.
A sample of the residents for whom 4 out of 5 respondent�s data agreed on the
categories of hypothesized maintaining variables across assessments served as
participants. See Table 5 for a listing of each participant�s demographic information.
Brad, whose problem behaviors included physical aggression against people and
property, was 25 years old and was diagnosed with severe mental retardation. Donna,
whose problem behaviors include eye poking and hitting herself in the face, was 49
years old and was diagnosed with profound mental retardation. Deanna, whose problem
behaviors included eye poking, was 47 years old and was diagnosed with profound
mental retardation. Lydia, whose problem behaviors included, scratching herself and
throwing herself on the ground, was 61 year old and was diagnosed with mild mental
retardation. Kris, whose problem behavior was biting and hitting self, was 37 years old
and was diagnosed with severe mental retardation. Katie, whose problem behaviors

21
included biting, pinching, punching self, head banging, and picking at sores, was 23
years old and was diagnosed with severe mental retardation.
Problem Behaviors
The operational definitions used during the functional analyses were based on
the participants� formal behavior intervention programs. Physical aggression to others
(Brad) was defined as pushing, grabbing, punching or hitting another person.
Aggression against property (Brad) was defined as grabbing or throwing leisure or
training items and throwing or overturning furniture. Eye-poking (Donna and Deanna)
was defined as inserting the finger or thumb into any part of the eye. Hitting self (Donna
and Kris) was defined as using the hand to hit self in the mouth or face or, for Kris, as
any time her hand made audible contact with any part of her own body. Throwing self
on ground (Lydia) was defined as occurring anytime Lydia fell to the floor onto her
bottom from a standing or sitting position. Scratching self (Lydia) was defined as
anytime Lydia�s fingernails made a mark on the surface of her arms or other body parts.
Biting self (Kris and Katie) was defined as any time the hand or arm crossed the plane
of the lips and contact between the teeth occurred for at least 1 s. Head banging (Katie)
was defined as anytime Katie repeatedly banged her head against furniture, walls, or
the floor. Scratching and picking at sores (Katie) was defined as anytime she repeatedly
picked or scratched at sores or scabs on her body. Pinching self (Katie) was defined as
anytime Katie�s fingers pinched her face for at least 1 s. Punching self (Katie) was
defined as any time her hand or fist made audible contact with her face.

22
Observation Procedures and Interobserver Agreement (IOA)
Target behaviors were recorded by trained observers using handheld Compaq
iPAQ© computers. Event recording was used to record scratching/picking at sores,
pinching self, punching self, scratching self, throwing self of ground, hitting self,
aggression against others, and aggression against property. Duration recording was
used to record eye poking, biting, and head banging. All data were converted to
percentages using a partial-interval 10-s method. Sessions were divided into 10-s
intervals, and intervals were scored as containing target behaviors if a target behavior
was recorded during that interval. The total number of intervals containing target
behaviors were summed, and this sum was divided by the total number of intervals in a
session to obtain session percentage measures.
A second observer simultaneously but independently scored 49% of Brad�s
sessions, 38% of Donna�s sessions, 77% of Deanna�s sessions, 58% of Lydia�s
sessions, 55% of Kris� sessions, and 100% of Katie�s sessions. IOA was calculated by
dividing session time into 10-s intervals. The number of intervals in which observers
agreed on the occurrence or nonoccurrence of problem behaviors was divided by the
total number of intervals in the session and the result was multiplied by 100. Mean
agreement was 96% for Brad (range 92-100%), 91% for Donna (range 87-97%), 94%
for Deanna (range 80-100%), 99% (range 95-100%) for Lydia, 100% for Kris (range =
100%), and 100% for Katie (range = 100%).
General Procedure
Experimental analysis conditions similar to those described by Iwata, Dorsey,
Slifer, Bauman, and Richman (1982/1994) (alone or no interaction, attention, play,

23
demand and tangible) were presented using a multielement design. All sessions were
10 min in length and were conducted in the above order. One to 5 sessions were
completed per day, at the same time each day, 2-3 times a week. For Donna, 10
extended alone sessions were conducted at the end of the experimental analysis. The
following is a description of the experimental conditions (see Iwata et al., 1982/1994, for
a more complete description of these conditions).
Alone (Deanna & Donna) or no interaction (Lydia, Kris, Katie). During this
condition the participant was seated in the observation room by herself (alone condition)
or with a therapist present (no interaction condition). No materials were present and the
therapist provided no consequences for target behaviors. This condition was designed
to evaluate whether the target behavior were maintained by automatic (sensory)
reinforcement.
Attention. During this condition, the participant and the therapist were in the
observation room together. Leisure materials (e.g., books, toys, cards, magazines, etc)
were placed on the table. Contingent on the target behavior, attention from the therapist
was given in the form of statements of concern or reprimands and eye contact. This
condition was designed to evaluate whether the target behavior was maintained by
social positive reinforcement in the form of attention.
Play. During this condition, the participant and therapist were in the observation
room together. Leisure items (e.g., books, toys, cards, magazines, etc) were placed on
the table. No demands were given and the therapist interacted with the subject at least
once every 30 s (e.g., play cards, talk about leisure items, sing songs, etc). Target
behaviors were ignored. This condition was designed to serve as a control.

24
Demand. During this condition, the participant and the therapist were in the
observation room seated at the table. Every 30 s the therapist initiated a task trial (e.g.,
�Donna, clap your hands�) using a 3-prompt sequence (verbal prompting, modeling, and
physical guidance). Continuous demands were used with Brad, Kris, and Katie. Tasks
were chosen based on the participant�s level of functioning and training objectives (e.g.,
matching cards, folding towels, imitative motor skills). Compliance prior to the third
prompt resulted in verbal praise (e.g., �Good job, Brad�) and termination of the trial.
Contingent on the target behavior, the trial was terminated for 30-s. For Brad,
occurrences of the target behavior prior to the next trial resulted in a 10-s delay of the
presentation of the next trial. This condition was designed to evaluate whether the target
behavior was maintained by social negative reinforcement in the form of escape from
task trials.
Tangible (Brad, Kris, Katie, & Lydia). Prior to this condition, a multiple-stimulus-
without-replacement preference assessment was completed for each participant
(DeLeon, 1996). The preference assessment identified the following highly preferred
items: cookies or Cheetohs® (Brad), pennies (Kris), jelly beans (Katie), and tea or soda
(Lydia). During this condition, the participant and the therapist were in the observation
room. Immediately before each tangible session, the participant was allowed
noncontingent access to the leisure item for approximately 10-s or was allowed to
consume a small amount of the edible. Then the participant and therapist were seated
in the observation room. The therapist held the preferred item in plain view of the
participant. Contingent on target behaviors, the participant received 10-s access to the
preferred item or received a small amount of the edible. This condition was designed to

25
evaluate whether the target behavior was maintained by access to social positive
reinforcement in the form of tangible items.
Results and Discussion
Results of the functional analyses and extended alone sessions for all
participants are presented in Figures 1 through 8. Refer to Table 6 for the results of the
correspondence analysis between the anecdotal assessments and the functional
analyses for all participants.
Brad. Brad�s results are shown in Figure 1. Although the aberrant behaviors
occurred throughout all conditions, the tangible condition consistently produced the
highest percentage of problem behaviors (43%). Further analysis of the analogue
assessment indicated that the attention (36%) and demand (25%) conditions also
contained high percentages of the aberrant behavior. Thus, results of the functional
analysis suggested that Brad�s aggression against property (AGP) and physical
aggression toward others (PAO) were maintained by multiple sources of social
reinforcement.
Results of Brad�s correspondence analysis are shown in Table 6. Consistent with
the analogue functional analysis, results of the MAS suggested that Brad�s AGP and
PAO were maintained by contingent presentation of tangible items and the FAST
indicated social positive as the primary category of reinforcement. Further analysis of
the anecdotal scores indicated that attention (MAS) and social negative (FAST) were
the second ranked categories of reinforcement. Therefore, the scores on the anecdotal
assessments demonstrated a perfect correspondence with the results of the functional
analysis.

26
Some limitations of Brad�s functional analysis should be considered. First, two
different topographies, PAO and AGP were examined concurrently. Verbal anecdotes
from direct-contact staff indicated that the two behaviors occurred together; therefore,
both behaviors were examined simultaneously during the functional analysis. It is
recommended that separate functional analyses be completed for different topographies
to confirm whether or not they are in the same response class. Second, data from two
demand sessions were lost during the transfer of data from the hand held computers to
the personal computer. However, review of written data summaries from those sessions
did not indicate significant variance between these data and those from other demand
sessions.
Some interesting within-session findings should be noted. Although Brad had
more opportunities to engage in AGP during the attention, demand and play conditions
due to additional materials that were available, more AGP (and PAO) occurred in the
tangible condition. In addition, informal observation suggested that certain therapists
associated with different conditions appeared to evoke different levels of the aberrant
behaviors. For example, although formal data were not collected on intensity of aberrant
behaviors, clear differences in intensity and topography of PAO across therapists were
observed (e.g., physical aggression against the demand therapist typically consisted of
individual slaps to his head; whereas, physical aggression against the tangible therapist
typically consisted of hair pulling, pulling on clothes and slapping head and body).
Donna. Donna�s results are displayed in Figure 2. She emitted high levels of SIB
in all conditions of the experimental analysis. SIB occurred during 54% of intervals in
the alone condition, 50% of intervals in the attention condition, 47% of intervals in the

27
demand condition, and 36% of intervals in the play condition. Given that the highest
measures of SIB were observed in the alone condition and that SIB occurred across all
conditions, the functional analysis outcomes suggest that her SIB was either
automatically maintained or was maintained by multiple contingencies. To determine if
her SIB would persist in the absence of social contingencies over longer periods of time,
10 30-min extended alone sessions were conducted. Figure 3 presents the results of
the extended alone sessions. Outcomes of this assessment show high levels of SIB;
although a slight descending pattern was observed during the first several sessions, the
data stabilized at levels comparable to those seen during the functional analysis
following the 6th session. These outcomes support the conclusion that Donna�s SIB was
maintained automatically (although the possibility that the behavior was sensitive to
other reinforcement contingencies remains viable).
Comparison of the results of the functional analysis and anecdotal assessments
revealed correspondence among the outcomes. MAS results suggested that Donna�s
SIB was maintained by sensory consequences, and the FAST outcomes indicated that
her behavior was maintained by automatic positive reinforcement. Therefore, the scores
on the anecdotal assessments were consistent with the results of the functional analysis
and extended alone conditions.
Although correspondence occurred between the anecdotal assessments and the
functional analysis, some limitations should be mentioned. For example, both eye-
poking (5092 total s or 196 s/session) and hitting self occurred (20 times total or
.77/session) during the functional analysis. However, hitting self was not observed at all
during the extended alone sessions. Therefore, it is reasonable to suspect that these

28
topographies were maintained by independent contingencies. It is recommended that
each topography of SIB be examined separately in order to provide differentiated and
unambiguous results. It should also be noted that during some sessions, Donna
assumed a seated position (with her feet on the chair and head resting on her knees, so
that her face and hands were obscured from observers� vision) that, to the layout of the
observation room (2-way window only on one wall), made it somewhat difficult to
discriminate eye poking responses. Eye poking was not recorded when Donna was
sitting in this position; therefore, eye poking may have occurred for longer durations
than were recorded. Another limitation of Donna�s functional analysis is that a tangible
condition was not included. However, review of her anecdotal assessment outcomes
indicated that the second highest categories of hypothesized maintaining variables were
tangible (MAS) and social positive (FAST). Thus, a tangible condition should have been
included in order to evaluate the effects of this contingency on her SIB.
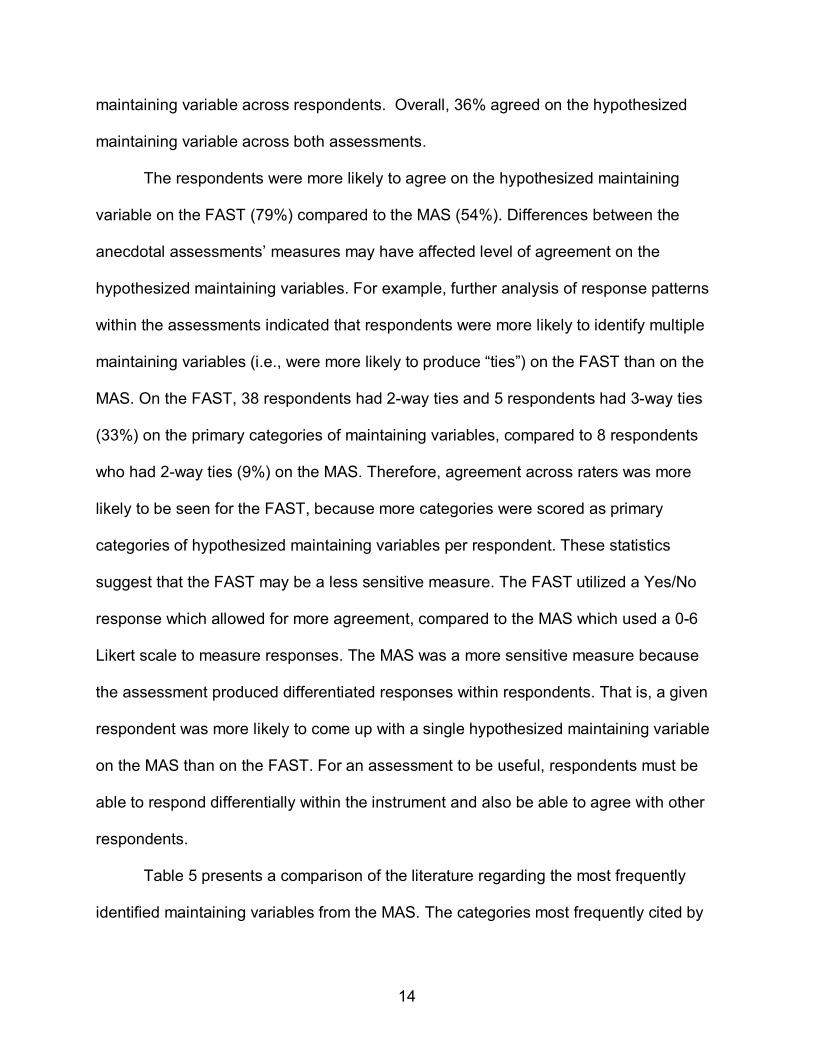
Deanna. Deanna�s results are shown in Figure 4. SIB occurred exclusively in the
alone condition. Functional analysis results indicate that Deanna�s eye poking was
maintained by automatic reinforcement, presumably in the form of sensory stimulation.
Scores on the MAS and FAST indicated that respondents scored sensory on the
MAS and automatic positive on the FAST as the primary categories of hypothesized
maintaining consequences. The scores on the anecdotal assessments were consistent
with the results of the functional analysis.
Lydia. Lydia�s results are shown in Figure 5. SIB occurred most frequently in the
tangible condition. Extremely low rates of the target topographies of SIB occurred

29
throughout the analysis. Lydia never threw herself on the ground, and scratched herself
only 0-1 time/session.
Although low rates of aberrant behavior occurred during the functional analysis,
correspondence was observed between the anecdotal assessments and the functional
analysis. MAS results had suggested that Lydia�s SIB was maintained by tangible
reinforcement and FAST outcomes suggested social positive reinforcement as the likely
maintaining contingency. Therefore, the scores on the anecdotal assessments were
consistent with the results of the functional analysis.
Some interesting findings occurred during Lydia�s functional analysis. Non-
targeted topographies of SIB, specifically head banging and biting self, occurred
throughout the functional analysis, although these behaviors never produced
programmed consequences. Figure 6 shows duration data on non-targeted forms of
SIB. It appeared that some of this behavior was oriented toward escape from the
observation room, as she would stand in front of the therapist, engage in various forms
of SIB and inappropriate toileting behavior, and scream, �Let me out� or, �They have me
locked up in here.�
Lydia also responded differentially to female and male therapists. She exhibited
physical aggression (range 0 � 38 occurrences/session) toward male therapists and
shouted accusations at them. When a female �no interaction� therapist was substituted
for the male no physical aggression was observed.
Katie. Katie�s results are in Figure 7. No aberrant behaviors occurred during the
functional analysis.

30
Correspondence was not found between her anecdotal assessments and the
functional analysis because no aberrant behaviors occurred during the functional
analysis.
The absence of problem behaviors during the functional analysis may be the
result of various factors. First, Katie was participating in another procedure in which she
received soda for an arbitrary response at the time of the present study at the BARC.
The BARC may have become associated with the delivery of positive reinforcement
which may have contributed to the absence of aberrant behaviors during the functional
analysis. Another possible limitation is that the functional analysis conditions may not
have been sufficiently analogous to those operating in the natural environment to evoke
problem behaviors. A suggestion for future research is to conduct a structured
descriptive assessment (SDA), which involving systematic manipulation of antecedent
variables in Katie�s daily environment while allowing consequences to occur naturally
(Anderson & Long, 2002). Such procedures might identify evocative variables present in
the natural environment that could then be incorporated in a functional analysis.
Kris. Kris� results are displayed in Figure 8. No aberrant behaviors occurred
during the functional analysis.
Correspondence was not found between her anecdotal assessments and the
functional analysis because no problem behaviors occurred during the functional
analysis.
After 15 sessions during which SIB did not occur, several modifications were
made to the demand and tangible sessions. In the demand condition, task trials were
presented continuously, rather than every 30 s. In tangible sessions, Kris was allowed

31
access to the pennies after 2 min without SIB. Reports by therapists indicated that the
pennies (ranked most preferred in her preference assessment) appeared to lose their
value over time. Kris would return the pennies to the therapist or refuse to take the
pennies from the therapist. A brief preference assessment before each session may
have detected changes in Kris� preferences across time. Also, as with Katie, Kris�
functional analysis may have benefited from a prior SDA.
Table 6
Demographic Information for Experiment II Participants
Resident Age Level of Functioning Target BehaviorBrad 25 Severe Agression against people & property
Deanna 47 Profound Eye pokingDonna 49 Profound Eye poking & hitting selfLydia 61 Mild Scratch & throw self on groundKris 37 Severe Biting & hitting selfKatie 23 Severe Biting, pinching, punching self,
head banging, & picking at sores

32
Figure 1. Brad�s functional analysis graph.
0
20
40
60
80
100
1 6 11 16 21 26 31 36C O N S E C U T I V E S E S S I O N S
PE
RC
EN
TAG
E O
F 10
-S IN
TER
VA
LS
PA
O &
AG
P
ATTN
PLAY
DEM
TAN
BRAD
Figure 1: Percentage of 10-s intervals of aggression against property and physical
aggression against others.

33
Figure 2. Donna�s functional analysis graph.
0
20
40
60
80
100
1 6 11 16 21 26C O N S E C U T I V E S E S S I O N S
PER
CEN
TAG
E O
F 10
-S IN
TER
VALS
SIB
ALONE
ATTN
PLAY
DEM
DONNA
Figure 2: Percentage of 10-s intervals of SIB (eye poking and hitting self in face).

34
Figure 3. Donna�s extended alone graph.
0
20
40
60
80
100
1 2 3 4 5 6 7 8 9 10C O N S E C U T I V E S E S S I O N S
PER
CEN
TAG
E O
F 10
-S IN
TER
VALS
SIB
SIB
DONNA
Figure 3: Percentage of 10-s intervals of SIB during extended alone sessions.
35
Figure 4. Deanna�s functional analysis graph.
0
50
100
150
200
250
300
1 3 5 7 9 11
C O N S E C U T I V E S E S S I O N S
DU
RA
TIO
N O
F E
YE
PO
KIN
G
Alone
Attention
Play
Demand
DEANNA
Figure 4: Duration of SIB (eye poking).

36
Figure 5. Lydia�s functional analysis graph.
0
1
2
3
4
5
1 6 11 16 21 26 31C O N S E C U T I V E S E S S I O N S
F R
E Q
U E
N C
Y O
F S
I B
Alone
Attention
Play
Demand
Tangible
LYDIA
Figure 5: Frequency of SIB (throwing self on ground and scratching self).

37
Figure 6: Lydia�s functional analysis graph displaying non-targeted SIB.
0
10
20
30
40
50
60
1 6 11 16 21 26 31 C O N S E C U T I V E S E S S I O N S
DU
RA
TIO
N O
F TO
POG
RA
PHIE
S O
F O
THER
SIB
Alone
Attention
Play
Demand
Tangible
LYDIA
Figure 6: Duration of non-targeted SIB (head banging and biting self).

38
Figure 7. Katie�s functional analysis graph.
0
20
40
60
80
100
1 2 3 4 5 6 7 8 9 10
C O N S E C U T I V E S E S S I O N S
PER
CE
NTA
GE
OF
10-S
INTE
RV
ALS
SIB
Alone
Attention
Play
Demand
Tangible
KATIE
Figure 7: Percentage of 10-s intervals of SIB (biting, head banging, scratching sores,
pinching, and punching self).

39
Figure 8. Kris� functional analysis graph.
0
20
40
60
80
100
1 6 11 16
C O N S E C U T I V E S E S S I O N S
PE
RC
EN
TAG
E O
F 10
-S IN
TER
VA
LS
SIB
Alone
Attention
Play
Demand
Tangible
KRIS
Figure 8: Percentage of 10-s intervals of SIB (biting and hitting self).

40
Table 7
Correspondence between the anecdotal assessments and the functional analyses
Sensory Attention Tangible Escape Auto+ Auto- Social+ Social- Alone/No I Attention Tangible Demand PlayBrad
Total score 63 80 95 63 11 6 24 21 N/A 36% 43% 25% 18%Mean 12.6 16 19 12.6 2.2 1.2 4.8 4.2
DonnaTotal score 97 23 67 50 23 9 16 15 54% 50% N/A 47% 36%
Mean 19.4 4.6 13.4 10 4.6 1.8 3.2 3Deanna
Total score 91 30 42 55 16 3 13 7 228 sec 1 sec N/A 0 0Mean 18.2 6 8.4 11 3.2 0.6 2.6 1.4Lydia
Total score 59 35 98 71 11 3 21 16 0 0.14 0.33 0.14 0Mean 11.8 7 19.6 14.2 2.2 0.6 4.2 3.2Kris
Total score 47 35 94 85 9 5 20 19 0% 0% 0% 0% 0%Mean 9.4 7 18.8 17 1.8 1 4 3.8Katie
Total score 63 64 88 72 11 10 21 16 0% 0% 0% 0% 0%Mean 12.6 12.8 17.6 14.4 2.2 2 4 3.2
Note. The highest possible score per category on the MAS is 24 and on the FAST is 5. The highest score on either the anecdotal assessments or functional analyses is shaded blue and the second highest score is shaded green.
Functional AnalysisMotivational Assessment Scale Functional Analysis Screening Tool

41
CHAPTER 4
GENERAL DISCUSSION
Thorough assessment of the function of aberrant behavior is integral to the
development of an effective treatment program. Common assessment methodologies
consist of anecdotal assessments, descriptive assessments, and functional analyses;
and each method has its advantages and disadvantages. Because the majority of
schools, institutions, and clinics do not have the time, resources, and expertise required
to implement some assessment methodologies, anecdotal assessments may be an
attractive alternative. However, the usefulness of these procedures may be
unquestionable, based on the results of prior research. Therefore, a better
understanding of the appropriate uses of anecdotal assessments is needed in order to
establish their utility as a quick, yet accurate way to assess aberrant behavior.
The purposes of the current study were to evaluate overall agreement between
multiple respondents on the primary function of aberrant behavior using the MAS and
the FAST and, if agreement was observed, to assess correspondence between the
results of a functional analysis and the anecdotal assessments. By soliciting responses
to the MAS and FAST from 5 caregivers for each resident assessed, it was possible to
evaluate agreement within and across anecdotal assessments. Correspondence
between assessments was assessed by selecting those residents whose outcomes
showed high levels of across-rater agreement and comparing them to functional
analysis results for some participants. The study attempted to extend the literature
regarding the accurate application of anecdotal assessments and their correspondence
with experimental analyses.

42
Results of Experiment I indicated that a significant percentage of respondents
agreed on the contingencies of reinforcement that maintain aberrant behavior, and that
these outcomes were common across the instruments. Fifty-four percent of the
residents� assessments produced high levels of agreement (at least 4 of 5 respondents)
on the MAS; 79% of assessments produced high levels of agreement on the FAST;
and, for 36% of residents, relatively encouraging levels of agreement were seen across
assessments. Additionally, respondents were highly likely to score across-assessment
agreement (77%). The results of Experiment I suggest that it is possible to obtain
agreement across multiple respondents on the function of aberrant behavior using
multiple assessments.
For 4 of the 6 participants in Experiment II results of the anecdotal assessments
and functional analyses led to similar hypotheses regarding the function of the
residents� problem behavior. For 2 participants, functional analysis outcomes did not
confirm anecdotal assessment results; however, for these participants, aberrant
behavior was not evoked during the functional analysis. Therefore, when functional
analyses produced interpretable data, the results of the functional analyses
corresponded with those of the anecdotal assessments.
Previous research has indicated that anecdotal assessments are notoriously
unreliable and invalid (Churchill & Smith, 1996; Simmons & Smith, 2001; Smith &
Churchill, 1996; Zarcone et al., 1991). The results of the present study indicate that, for
a significant proportion (between 36%-79%) of participants, anecdotal assessments
may be useful in identifying possible contingencies of reinforcement. However, the
current results suggest that some changes in typical methods of assessment

43
administration appear to be necessary to achieve these results. Whereas these
assessments are typically administered to one, or possibly two, respondents, the results
of this study, when taken in the context of previous findings suggesting that anecdotal
assessments are unreliable, suggest that a more constructive approach is to administer
more than one type of anecdotal assessment to several respondents. Although
increasing the number of assessments increases the likelihood of disagreement, it
seems intuitively appealing to believe that the likelihood of correctly identifying
behavioral function (i.e., being �right,�) is high when there is agreement among multiple
assessments and/or assessors. The present data provide preliminary support for that
notion.
Some limitations of the study should be discussed. First, a limited number of
functional analyses were conducted. Of the 10 residents whose respondents agreed on
categories of hypothesized maintaining variables, only 6 functional analyses were
conducted due to participant availability and decreases in behavior problems. Second,
functional analysis conditions varied across participants. The tangible condition was
eliminated from Deanna and Donnas functional analysis and the alone condition was
eliminated from Brads functional analysis due to assumptions regarding the function of
their aberrant behavior. Third, those functional analyses that produced unclear data
should have been followed by additional analyses. Other assessment procedures, such
as direct observation or SDA, may have been useful in identifing naturally-occurring
antecedents and consequences that evoke and maintain the aberrant behavior
(Anderson & Long, 2002). Finally, time and resources did not permit data collection of
treatment, however information gathered from the anecdotal assessments and the

44
functional analyses were incorporated into the resident�s treatment programs. Additional
treatment analyses would have been helpful to unequivocally confirm the results of
Experiment I and Experiment II. In fact, if treatment data had shown that intervention
based on the results of Katie�s and Kris� anecdotal assessments had been effective,
then the superior validity of those outcomes relative to the results of their functional
analyses would have been demonstrated. However, because no treatment data were
presented, the results of the current study must be interpreted with caution.
Several questions remain to be addressed in future research. For example,
whereas the current results indicate that agreement among 4 of 5 respondents across
both the MAS and FAST is sufficient to produce valid outcomes, it is not clear that this
level of agreement is necessary for those outcomes. Further research will be necessary
to determine if agreement across fewer respondents or across both instruments is
critical to the production of valid outcomes or, alternatively, if valid outcomes could be
achieved with fewer respondents or assessments.
In addition, a study showing a direct progression from anecdotal assessments to
treatment should be conducted in order to establish the general utility of assessing the
function of aberrant behavior utilizing only the anecdotal approach. In its current usage,
anecdotal assessment is used as the primary source of information on which to build
treatment, rather than as an adjunct to more intrusive methods. Therefore, it will be
important to demonstrate that the results of this (or, perhaps, an even more efficient
variant of this) procedure is sufficient to provide the necessary information. Such
information would be extremely valuable to clinicians, for whom time and funding
constraints preclude extensive (and expensive) assessments.

45
Results of this investigation indicate that it is possible to produce a moderate
amount of agreement across respondents to 2 anecdotal assessments and, when
agreement occurs, the results seem to correspond with those from functional analyses.
Although preliminary, these outcomes have promising implications. Pending subsequent
validation, the current outcomes suggest a new approach to the use of anecdotal
assessments for aberrant behavior. If anecdotal assessments can be administered in a
way that results in reliable and valid hypotheses about the variables maintaining
problem behaviors, then extended functional analysis may not be necessary. Before
recommending that anecdotal assessments be used as the primary mode of
assessment, however, additional experimental analyses will be necessary. Ultimately,
the utility of this approach remains to be demonstrated by the development of effective
interventions based on its outcomes.

46
REFERENCES
Anderson, C. & Long, E. (2002). Use of a structured descriptive assessment
methodology to identify variables affecting problem behavior. Journal of Applied
Behavior Analysis, 35, 137-154.
Bihm, E., Kienlen, T., Ness, E., & Poindexter, A. (1991). Factor structure of the
motivation assessment scale for persons with mental retardation. Psychological
Reports, 68, 1235-1238.
Churchill, R. & Smith, R. (1996). Assessment of interrater agreement using the
Motivation Assessment Scale. 22nd annual meeting of the Association for Behavior
Analysis, San Francisco, CA.
Derby, K., Wacker, D., Sasso, G., Steege, M., Northup, J., Cigrand, K. et al
(1992). Brief functional assessment techniques to evaluate aberrant behavior in an
outpatient setting: A summary of 79 cases. Journal of Applied Behavior Analysis, 25,
197-209.
DeLeon, I. & Iwata, B. (1996). Evaluation of a multiple-stimulus presentation
format for assessing reinforcer preferences. Journal of Applied Behavior Analysis, 29,
519-532.
Durand, M. & Crimmins, D. (1988). Identifying the variables maintaining self-
injurious behavior. Journal of Autism and Developmental Disorders, 18, 99-117.
Iwata, B.A., & DeLeon, I.G. (1996). The functional analysis screening tool (FAST).
Unpublished manuscript, University of Florida, Gainesville, FL 32611.

47
Iwata, B. A., & DeLeon, I. G. (1997). Development and reliability analysis of the
functional analysis screening tool (FAST). Unpublished manuscript.
Iwata, B. A., Dorsey, M. F., Slifer, K. J., Bauman, K. E., & Richman, G. S. (1982).
Toward a functional analysis of self-injury. Analysis and Intervention in Developmental
Disabilities, 2, 1-20.
Iwata, B. A., Dorsey, M. F., Slifer, K. J., Bauman, K. E., & Richman, G. S. (1982).
Toward a functional analysis of self-injury. Journal of Applied Behavior Analysis, 27,
197-209.
Iwata, B., Zarcone, J., Vollmer, T., & Smith, R., (1994). Assessment and treatment
of self-injurious behavior. In Schopler & Mesibov (Eds.), Behavioral Issues in Autism
(pp. 131-159). NY: Plenum.
Miltenberger, R. (2001). Understanding problem behaviors through functional
assessment. In Miltenberger (2nd Ed.), Behavior modification: Principles and procedures
(pp.285-312). Belmont, CA: Wadsworth Thomson Learning
Northup, J., Wacker, D., Sasso, G., Steege, M., Cigrand, K., Cook, J., & DeRaad,
A. (1991). A brief functional analysis of aggressive and alternative behavior in an
outclinic setting. Journal of Applied Behavior Analysis, 24, 509-522.
Simmons, J. & Smith, R. (May, 2001). Analysis of Interrater agreement on
anecdotal functional assessments: Effects of rater training in behavior analysis. 27th
annual meeting of the Association for Behavior Analysis, New Orleans, LA.
Singh, N., Donatelli, L., Best, A., Williams, D., Barrera, F., Lenz, M., Landrum, T.,
Ellis, C., & Moe, T. (1993). Factor structure of the motivation assessment scale. Journal
of Intellectual Disability Research, 37, 65-74.

48
Smith, R. & Churchill, R. (May, 1996). Item-by-item analysis of Interrater
agreement using the Motivation Assessment Scale. 22nd annual meeting of the
Association for Behavior Analysis, San Francisco, CA.
Sturmey, P. (1994). Assessing the functions of aberrant behaviors: A review of
psychometric instruments. Journal of Autism and Developmental Disorders, 24, 293-
304.
Vollmer, T., Marcus, B., Ringdahl, J., & Roane, H. (1995). Progressing from brief
assessments to extended experimental analyses in the evaluation of aberrant behavior.
Journal of Applied Behavior Analysis, 28, 561-576.
Zarcone, J., Rodgers, T., Iwata, B., Rourke, D., & Dorsey, M. (1991). Reliability
analysis of the motivation assessment scale: A failure to replicate. Research in
Developmental Disabilities, 12, 349-360.