Embed Size (px)
Citation preview

Copyright ⓒ The Korean Society for Aeronautical & Space SciencesReceived: July 15, 2015 Revised: January 11, 2016 Accepted: February 24, 2016
37 http://ijass.org pISSN: 2093-274x eISSN: 2093-2480
PaperInt’l J. of Aeronautical & Space Sci. 17(1), 37–44 (2016)DOI: http://dx.doi.org/10.5139/IJASS.2016.17.1.37
Multiplexed Hard-Polymer-Clad Fiber Temperature Sensor Using An Optical Time-Domain Reflectometer
Jung-Ryul Lee*Department of Aerospace Engineering, Korea Advanced Institute of Science and Technology 291 Daehak-ro,Yuseong-gu, Daejeon
34141, Republic of Korea
Hyeng-Cheol Kim**Kyeong In Tech Co., Ltd, 15, Paryong-ro 359 Beon-gil, Uichang-gu,Changwon-si, Gyeonsangnam-do 51354, Republic of Korea
Abstract
Optical fiber temperature sensing systems have incomparable advantages over traditional electrical-cable-based monitoring
systems. However, the fiber optic interrogators and sensors have often been rejected as a temperature monitoring technology
in real-world industrial applications because of high cost and over-specification. This study proposes a multiplexed fiber optic
temperature monitoring sensor system using an economical Optical Time-Domain Reflectometer (OTDR) and Hard-Polymer-
Clad Fiber (HPCF). HPCF is a special optical fiber in which a hard polymer cladding made of fluoroacrylate acts as a protective
coating for an inner silica core. An OTDR is an optical loss measurement system that provides optical loss and event distance
measurement in real time. A temperature sensor array with the five sensor nodes at 10-m interval was economically and
quickly made by locally stripping HPCF clad through photo-thermal and photo-chemical processes using a continuous/pulse
hybrid-mode laser. The exposed cores created backscattering signals in the OTDR attenuation trace. It was demonstrated that
the backscattering peaks were independently sensitive to temperature variation. Since the 1.5-mm-long exposed core showed
a 5-m-wide backscattering peak, the OTDR with a spatial resolution of 40 mm allows for making a sensor node at every 5 m
for independent multiplexing. The performance of the sensor node included an operating range of up to 120oC, a resolution of
0.59 oC, and a temperature sensitivity of -0.00967 dB/oC. Temperature monitoring errors in the environment tests stood at 0.76 oC and 0.36 oC under the temperature variation of the unstrapped fiber region and the vibration of the sensor node. The small
sensitivities to the environment and the economic feasibility of the highly multiplexed HPCF temperature monitoring sensor
system will be important advantages for use as system-integrated temperature sensors.
Key words: Smart structure, Hard-Polymer-Clad Fiber, Optical Time Domain Reflectometer, Laser clad stripping method
1. Introduction
With the recent development of optical networks, low-
cost fiber-optic components have become available. As a
result, it has been possible to develop cost-effective fiber-
optic sensors for various sensing applications [1]. Fiber-optic
sensors offer many benefits over conventional electrical
sensors. Most important is their immunity to corrosion and
electromagnetic interference, which enables applications
under harsh environmental conditions. Fiber-optic sensors
have small size, good flexibility, and light weight, and they can
be integrated easily into structures, where fiber optics can be
used to implement smart structures. They are indispensable for
achieving high-speed, large-capacity communication systems
[2-4]. The monitoring of physical, chemical, and biological
parameters in situ is of great importance for process control
in manufacturing industries, for the protection of ecosystems,
and for the prevention of global warming. Temperature is
This is an Open Access article distributed under the terms of the Creative Com-mons Attribution Non-Commercial License (http://creativecommons.org/licenses/by-nc/3.0/) which permits unrestricted non-commercial use, distribution, and reproduc-tion in any medium, provided the original work is properly cited.
* Professor, Corresponding author: [email protected] ** Staff of Kyeng In Tech Co., Ltd,
(37~44)15-117.indd 37 2016-03-29 오후 7:25:44

DOI: http://dx.doi.org/10.5139/IJASS.2016.17.1.37 38
Int’l J. of Aeronautical & Space Sci. 17(1), 37–44 (2016)
one of the most important parameters in these applications
[5]. A number of fiber optic methods have been used, and
some have been commercialized for industrial temperature
measurements [6]. Optical fiber temperature sensors are key
devices with a wide range of applications in numerous areas
such as aerospace, high-power transformers, buildings,
nuclear plants, chemical plants, fire alarm systems for coal
mines, and temperature detection for underground power
cables. At present, the FBG sensor is popular because of
its multiplexing capabilities. However, FBG sensors have
temperature-strain cross sensitivity, and the grating writing
process is complex, and the photosensitive single-mode
fiber is quite expensive [7-12].
A wide range of techniques and approaches have been
presented for measuring a very wide set of measurands
for a wide range of application sectors [13]. A distributed
optical fiber temperature sensing system has incomparable
advantages over a traditional monitoring system, whether
in the sensing or in the system performance [14]. Periodic
or continuous monitoring of structures establishes better
maintenance schedules, determines structural health
and subsequent safety ratings, verifies load ratings of
novel structures and materials, provides fatigue damage
information, and improves life-cycle costs. Distributed
sensors have been proposed for a number of measurands
and have been realized at least at the prototype level to a
small extent commercially, but the only real significant
success has been the distributed temperature sensor (DTS)
[15]. Distributed sensors are most suitable for large structural
applications, since all the segments of an optical fiber act
as sensors, which allow the perturbations within various
segments of the structure to be sensed [16].
Three main types of scattering are known to occur in
these sensors: Rayleigh scattering at the original wavelength,
Brillouin scattering at a wavelength shifted by about 20 nm,
and Raman scattering at a wavelength shifted by about 50
nm [3]. Using Raman scattering, it is possible to obtain
distributed temperature measurements over lengths of
typically a few kilometers. In contrast to Brillouin scattering,
no strain measurement is possible. The Raman scattering
produces two broadband components at higher and lower
frequencies than the exciting pump wave. Measuring the
intensity ratio between these bands, which are called the
Stokes and anti-Stokes emissions, it is possible to calculate
the temperature at any given point along the fiber line. The
Raman backscattering intensity depends on temperature
and can be used as a measure for the temperature along the
fiber. The Raman backscattered light has two components
above and below the incident light: the Raman Stokes
and Raman Anti-Stokes peak, as shown in Fig. 1. The
backscattered light is spread across a range of wavelengths.
Some of these wavelengths are affected by temperature
changes, while others are less affected. Using a very accurate
detector, the difference in the signal strength is measured,
and the temperature is derived from these measurement
results. Raman systems are available commercially from
York and have been used in different structural monitoring
applications [15].
Hard-polymer-clad fiber (HPCF) is one type of optical fiber
that has emerged over the last few decades as an option for
many optical applications. The HPCF structure is generally
a silica core with a clad of thin, hard polymer material and
an outer jacket. HPCF is less expensive than all-silica fiber
constructions, and offers benefits of high strength, lower
static fatigue, less strain at the core-clad interface, high core-
to-clad ratios, and lighter weights [17]. HPCF also has merits
over plastic optical fiber (POF) in terms of long-distance
communication and thermal and mechanical robustness
[18].
We propose an economical multiplexed fiber optic
temperature monitoring system. The laser clad stripping
method is used to elaborate multiple sensor nodes quickly
in an HPCF line. The single sensor node length, i.e. the clad
removal length, is controlled by adjusting the laser beam
diameter, power, and energy [19]. An optical time-domain
reflectometer (OTDR) is connected to the HPCF sensor
array to test the responses of the multiplexed sensor nodes
and normal fiber zones to the changes in temperature and
vibration, and to configure a multiplexed HPCF temperature
monitoring sensor system by demonstrating the independent
temperature sensing capability of each node.
2. Sensing Principle
2.1 Optical time domain reflectometer
The OTDR technique has been a standard tool to
investigate broken and damaged locations of optical fibers,
and to measure their optical properties. Conventional fiber
optic sensors, for example, fiber Bragg gratings (FBG) and
commercially from York and have been used in different structural monitoring applications [15].
Hard-polymer-clad fiber (HPCF) is one type of optical fiber that has emerged over the last few
decades as an option for many optical applications. The HPCF structure is generally a silica core with
a clad of thin, hard polymer material and an outer jacket. HPCF is less expensive than all-silica fiber
constructions, and offers benefits of high strength, lower static fatigue, less strain at the core-clad
interface, high core-to-clad ratios, and lighter weights [17]. HPCF also has merits over plastic optical
fiber (POF) in terms of long-distance communication and thermal and mechanical robustness [18].
We propose an economical multiplexed fiber optic temperature monitoring system. The laser clad
stripping method is used to elaborate multiple sensor nodes quickly in an HPCF line. The single
sensor node length, i.e. the clad removal length, is controlled by adjusting the laser beam diameter,
power, and energy [19]. An optical time-domain reflectometer (OTDR) is connected to the HPCF
sensor array to test the responses of the multiplexed sensor nodes and normal fiber zones to the
changes in temperature and vibration, and to configure a multiplexed HPCF temperature monitoring
sensor system by demonstrating the independent temperature sensing capability of each node.
Fig. 1. Raman scattering spectrum [15].
2. Sensing Principle
2.1 Optical time domain reflectometer
The OTDR technique has been a standard tool to investigate broken and damaged locations of
optical fibers, and to measure their optical properties. Conventional fiber optic sensors, for example,
fiber Bragg gratings (FBG) and their sensing systems are still too expensive to be accepted in many
4
Fig. 1. Raman scattering spectrum [15].
(37~44)15-117.indd 38 2016-03-29 오후 7:25:44

39
Jung-Ryul Lee Multiplexed Hard-Polymer-Clad Fiber Temperature Sensor Using An Optical Time-Domain Reflectometer
http://ijass.org
their sensing systems are still too expensive to be accepted
in many real-world applications, and too complex to isolate
pure temperature measurements because of their multi-
measurand sensitivity. Alternatively, OTDR is very cost
effective compared to FBG interrogation systems and can
easily measure optical loss and its location in real time.
An OTDR injects a series of optical pulses into a test fiber
and measures the optical intensity of the light scattered
(Rayleigh backscatter) or reflected back from the event along
the fiber. When a short pulsed light is launched in one end
of a sensing fiber, this pulsed light travels through the fiber.
This light is scattered everywhere and partially guided back
to the launching end. The scattering lights are categorized
into three wavelength bands: Rayleigh, Brillouin, and
Raman scatterings [20]. Rayleigh backscattering is a linear
process. At any point along the fiber, the magnitude of the
backscattered optical power is linearly proportional to the
optical power at that location. Due to the effect of fiber loss,
both the transmitted and the backscattered powers are
gradually attenuated along the fiber. The measurement of
the time-dependent waveform of the backscattered power
at the fiber input terminal provides the information about
the loss distribution along the fiber. This information can be
used to precisely calculate the attenuation coefficient [21].
A commercial portable OTDR (JDSU MTS-6000 OTDR with
a multimode module) with a wavelength of 850 nm and a
pulse duration of 10 ns was used to verify the response of the
sensor nodes to temperature.
2.2 Temperature sensing principle of clad-removed optical fiber
Figure 2 shows an index profile of the step-index HPCF
(BFL37-200, Thorlabs). The fiber used was a multimode
HPCF with a numerical aperture (NA) of 0.37, a core diameter
of 200 μm, and a cladding diameter of 230 μm, where bare
HPCFs without the jacket were used.
Light is guided into the silica core. The fraction of scattered
light that travels back toward the input end is described by
equation (1) [22]
real-world applications, and too complex to isolate pure temperature measurements because of their
multi-measurand sensitivity. Alternatively, OTDR is very cost effective compared to FBG
interrogation systems and can easily measure optical loss and its location in real time. An OTDR
injects a series of optical pulses into a test fiber and measures the optical intensity of the light
scattered (Rayleigh backscatter) or reflected back from the event along the fiber. When a short pulsed
light is launched in one end of a sensing fiber, this pulsed light travels through the fiber. This light is
scattered everywhere and partially guided back to the launching end. The scattering lights are
categorized into three wavelength bands: Rayleigh, Brillouin, and Raman scatterings [20]. Rayleigh
backscattering is a linear process. At any point along the fiber, the magnitude of the backscattered
optical power is linearly proportional to the optical power at that location. Due to the effect of fiber
loss, both the transmitted and the backscattered powers are gradually attenuated along the fiber. The
measurement of the time-dependent waveform of the backscattered power at the fiber input terminal
provides the information about the loss distribution along the fiber. This information can be used to
precisely calculate the attenuation coefficient [21]. A commercial portable OTDR (JDSU MTS-6000
OTDR with a multimode module) with a wavelength of 850 nm and a pulse duration of 10 ns was
used to verify the response of the sensor nodes to temperature.
2.2 Temperature sensing principle of clad-removed optical fiber
Figure 2 shows an index profile of the step-index HPCF (BFL37-200, Thorlabs). The fiber used was a
multimode HPCF with a numerical aperture (NA) of 0.37, a core diameter of 200 μm, and a cladding
diameter of 230 μm, where bare HPCFs without the jacket were used.
Light is guided into the silica core. The fraction of scattered light that travels back toward the input end
is described by equation (1) [22]
21
22
21 )(
~n
nnf
− , (1)
5
(1)
where n1 and n2 are the core and clad refractive indices,
respectively, and n3 is that of air, as shown in Fig. 2. In an HPCF,
the equation above holds true. When the clad is removed, i.e.
n2 = n3 = 1, the fraction of scattered light (f) at the removed
clad part locally increases, and thus, a backscattering peak
is observed in the OTDR. If the core temperature increases,
the core density decreases, and thus, the core refractive
index decreases as well, but the air refractive index (n3)
is barely changed. Therefore, the fraction of the scattered
light (f) is decreased, and a lowered backscattering peak is
observed in the OTDR. Since a sensor node that is sensitive
to the temperature variation is created by removing the clad
layer from the optical fiber, dense sensor nodes for quasi-
distributed sensing can be fabricated economically.
3. HPCF Temperature Sensor Node Fabrication
Mechanical, chemical, and laser stripping methods are
used to remove the clad of polymer-clad fibers. In this study,
a continuous-wave-mode/pulsed-mode switchable hybrid
diode-pumped solid-state laser with a wavelength of 1064
nm was used to strip the clad off the HPCF, exposing the
inner silica core to the external environment [21]. The laser
stripping method enabled the control of the removal length
easily by considering the beam diameter using equation (2)
[17]:
where n1 and n2 are the core and clad refractive indices, respectively, and n3 is that of air, as shown in Fig.
2. In an HPCF, the equation above holds true. When the clad is removed, i.e. n2 = n3 = 1, the fraction of
scattered light (f) at the removed clad part locally increases, and thus, a backscattering peak is observed in
the OTDR. If the core temperature increases, the core density decreases, and thus, the core refractive
index decreases as well, but the air refractive index (n3) is barely changed. Therefore, the fraction of the
scattered light (f) is decreased, and a lowered backscattering peak is observed in the OTDR. Since a
sensor node that is sensitive to the temperature variation is created by removing the clad layer from the
optical fiber, dense sensor nodes for quasi-distributed sensing can be fabricated economically.
Fig. 2. Refractive index distribution of the hard polymer clad fiber (HPCF).
3. HPCF Temperature Sensor Node Fabrication
Mechanical, chemical, and laser stripping methods are used to remove the clad of polymer-clad fibers.
In this study, a continuous-wave-mode/pulsed-mode switchable hybrid diode-pumped solid-state laser
with a wavelength of 1064 nm was used to strip the clad off the HPCF, exposing the inner silica core to
the external environment [21]. The laser stripping method enabled the control of the removal length
easily by considering the beam diameter using equation (2) [17]:
θ)(= DIB + , (2)
where B is the beam diameter in millimeters, I is the distance from the laser root to the laser head in
millimeters, D is the distance in millimeters from the laser head to the HPCF, and θ is the beam
Index n(r)
Radius r
Core n1=1.4525Clad n2=1.4045
Air n3=1
6
(2)
where B is the beam diameter in millimeters, I is the
distance from the laser root to the laser head in millimeters,
D is the distance in millimeters from the laser head to the
HPCF, and θ is the beam divergence angle in radians [15].
The parameters related to the hybrid laser are I = 437.5 mm
and θ = 1.6 mrad and the wavelength is 1064 nm. The same
setup, energy in the pulsed mode (0.15 J/cm2 with a 20-Hz
pulse-repetition frequency), and power (200 W/cm2) in the
CW mode for the hard polymer clad stripping in Ref. 19 has
been used. Varying the separation distance (D = 187.5 mm,
656.5 mm and 812.5 mm) according to equation (2) for the
where n1 and n2 are the core and clad refractive indices, respectively, and n3 is that of air, as shown in Fig.
2. In an HPCF, the equation above holds true. When the clad is removed, i.e. n2 = n3 = 1, the fraction of
scattered light (f) at the removed clad part locally increases, and thus, a backscattering peak is observed in
the OTDR. If the core temperature increases, the core density decreases, and thus, the core refractive
index decreases as well, but the air refractive index (n3) is barely changed. Therefore, the fraction of the
scattered light (f) is decreased, and a lowered backscattering peak is observed in the OTDR. Since a
sensor node that is sensitive to the temperature variation is created by removing the clad layer from the
optical fiber, dense sensor nodes for quasi-distributed sensing can be fabricated economically.
Fig. 2. Refractive index distribution of the hard polymer clad fiber (HPCF).
3. HPCF Temperature Sensor Node Fabrication
Mechanical, chemical, and laser stripping methods are used to remove the clad of polymer-clad fibers.
In this study, a continuous-wave-mode/pulsed-mode switchable hybrid diode-pumped solid-state laser
with a wavelength of 1064 nm was used to strip the clad off the HPCF, exposing the inner silica core to
the external environment [21]. The laser stripping method enabled the control of the removal length
easily by considering the beam diameter using equation (2) [17]:
θ)(= DIB + , (2)
where B is the beam diameter in millimeters, I is the distance from the laser root to the laser head in
millimeters, D is the distance in millimeters from the laser head to the HPCF, and θ is the beam
Index n(r)
Radius r
Core n1=1.4525Clad n2=1.4045
Air n3=1
6
Fig. 2. Refractive index distribution of the hard polymer clad fiber (HPCF).
Table 1. Exposure time of laser beam for the clad removal.
divergence angle in radians [15]. The parameters related to the hybrid laser are I = 437.5 mm and θ = 1.6
mrad and the wavelength is 1064 nm. The same setup, energy in the pulsed mode (0.15 J/cm2 with a 20-
Hz pulse-repetition frequency), and power (200 W/cm2) in the CW mode for the hard polymer clad
stripping in Ref. 19 has been used. Varying the separation distance (D = 187.5 mm, 656.5 mm and 812.5
mm) according to equation (2) for the beam diameter, 1-mm, 1.75-mm, and 2-mm core lengths were
exposed to air to investigate the effect of the exposed core length on the scattering peak signal. The
exposure time to remove clads is summarized in Table 1.
Table 1. Exposure time of laser beam for the clad removal.
Sensor node length Pulsed mode Continuous wave mode
0.75 mm 20 s 3 s1 mm 20 s 3 s
1.5 mm 25 s 4 s1.75 mm 35 s 4 s
2 mm 48 s 4 s
4. Experiments & Results
4.1 HPCF sensor node response to different different exposed to node length
The HPCF with a 1.5-mm section of exposed core was first tested under temperature variation by
placing it into a thermal chamber and connecting the OTDR to one of the fiber ends, as shown in the
experimental setup in Fig. 3(a). The running averaging in signal acquisition was 60 times and the
spatial resolution of the OTDR setting was 40 mm. First the back scattering peak induced by
removing the clad is observed in Fig. 3(b) and stood at 3.8 dB at the temperature of 20 °C which can
be explained by equation (1). The experiment was then conducted by monitoring the peak value of the
backscattering signal with respect to the temperature, which ranged from 20 °C to 120 °C. As plotted
in Fig. 3(b), the backscattering peak decreased with increasing temperature. As shown in Fig. 3(c), the
response to the temperature could be fit to a linear distribution. This implies that the exposed core can
be used as a temperature-monitoring sensor node.
7
(37~44)15-117.indd 39 2016-03-29 오후 7:25:45

DOI: http://dx.doi.org/10.5139/IJASS.2016.17.1.37 40
Int’l J. of Aeronautical & Space Sci. 17(1), 37–44 (2016)
beam diameter, 1-mm, 1.75-mm, and 2-mm core lengths
were exposed to air to investigate the effect of the exposed
core length on the scattering peak signal. The exposure time
to remove clads is summarized in Table 1.
4. Experiments & Results
4.1 HPCF sensor node response to different differ-ent exposed to node length
The HPCF with a 1.5-mm section of exposed core was
first tested under temperature variation by placing it into
a thermal chamber and connecting the OTDR to one of
the fiber ends, as shown in the experimental setup in Fig.
3(a). The running averaging in signal acquisition was 60
times and the spatial resolution of the OTDR setting was
40 mm. First the back scattering peak induced by removing
the clad is observed in Fig. 3(b) and stood at 3.8 dB at the
temperature of 20 oC which can be explained by equation
(1). The experiment was then conducted by monitoring
the peak value of the backscattering signal with respect
to the temperature, which ranged from 20 oC to 120 oC. As
plotted in Fig. 3(b), the backscattering peak decreased with
increasing temperature. As shown in Fig. 3(c), the response
to the temperature could be fit to a linear distribution. This
implies that the exposed core can be used as a temperature-
monitoring sensor node.
Since the backscattering signal is generated from the
exposed core, it is imperative to investigate the effect of the
exposed core lengths. The 0.75-mm [19], 1-mm, 1.75-mm,
and 2-mm sensor nodes were obtained by the proposed
methods for laser stripping and control of the core-exposure
length. The fabrication time was about 30 s for each sensor
node. Those were also placed into the thermal chamber in
the same way as in the experiment for the 1.5-mm sensor
node, with the temperature varied from 20 oC to 120 oC. As
summarized in Fig. 4(a), a longer sensor node generated a
higher back scattering peak, and the peak values of the sensor
nodes decreased linearly with increasing temperature. In
contrast to the 1-mm temperature sensor node, the 1.5-mm
and 2-mm temperature sensor nodes with longer exposed
core lengths showed linear distributions over the whole
temperature range tested. The 1.5-mm sensor node showed
a loss rate of -0.01005 dB/oC and R-squared value of linear fit
of 0.98207, which was higher than that of the 2-mm sensor
Fig. 3. (a) HPCF sensor node thermal test setup, (b) 1.5-mm sensor node response at different
temperatures, (c) Scattering loss change caused from temperature variation.
Since the backscattering signal is generated from the exposed core, it is imperative to investigate the
effect of the exposed core lengths. The 0.75-mm [19], 1-mm, 1.75-mm, and 2-mm sensor nodes were
obtained by the proposed methods for laser stripping and control of the core-exposure length. The
fabrication time was about 30 s for each sensor node. Those were also placed into the thermal
chamber in the same way as in the experiment for the 1.5-mm sensor node, with the temperature
varied from 20 °C to 120 °C. As summarized in Fig. 4(a), a longer sensor node generated a higher
(a)
HPCF
Thermal chamber
Node
Inside
OTDR
8
(a) (b) (c)
Fig. 3. (a) HPCF sensor node thermal test setup, (b) 1.5-mm sensor node response at different temperatures, (c) Scattering loss change caused from temperature variation.
back scattering peak, and the peak values of the sensor nodes decreased linearly with increasing
temperature. In contrast to the 1-mm temperature sensor node, the 1.5-mm and 2-mm temperature
sensor nodes with longer exposed core lengths showed linear distributions over the whole temperature
range tested. The 1.5-mm sensor node showed a loss rate of -0.01005 dB/°C and R-squared value of
linear fit of 0.98207, which was higher than that of the 2-mm sensor node. As plotted in Fig. 4(b), the
scattering loss rates were multiplied by the R-squared value of the scattering loss linear fits. The
scattering loss rate (L) implying the sensitivity and the R-squared value (R2) related to the
measurement linearity was formulated as SL:
2RLSL ×= , (3)
The 1.5-mm sensor node out of the sensor node lengths tested showed a maximum SL value and thus
the 1.5-mm sensor node was used to develop multiplexed HPCF temperature monitoring sensors.
9
Fig. 4. (a) Temperature versus the backscattering peak value depending on the sensor node length, (b)
Multiplication values of scattering loss rate and R-square depending on the sensor node length.
To investigate the repeatability of the HPCF temperature monitoring sensor, the 1.5-mm sensor node
was tested at 40 °C in the thermal chamber. Eight measurements were carried out, and the results are
shown in Fig. 5(a). The eight backscattering signals in the OTDR attenuation traces did not show any
change. As presented in Fig. 5(b), the measured backscattering peak shows a standard deviation of
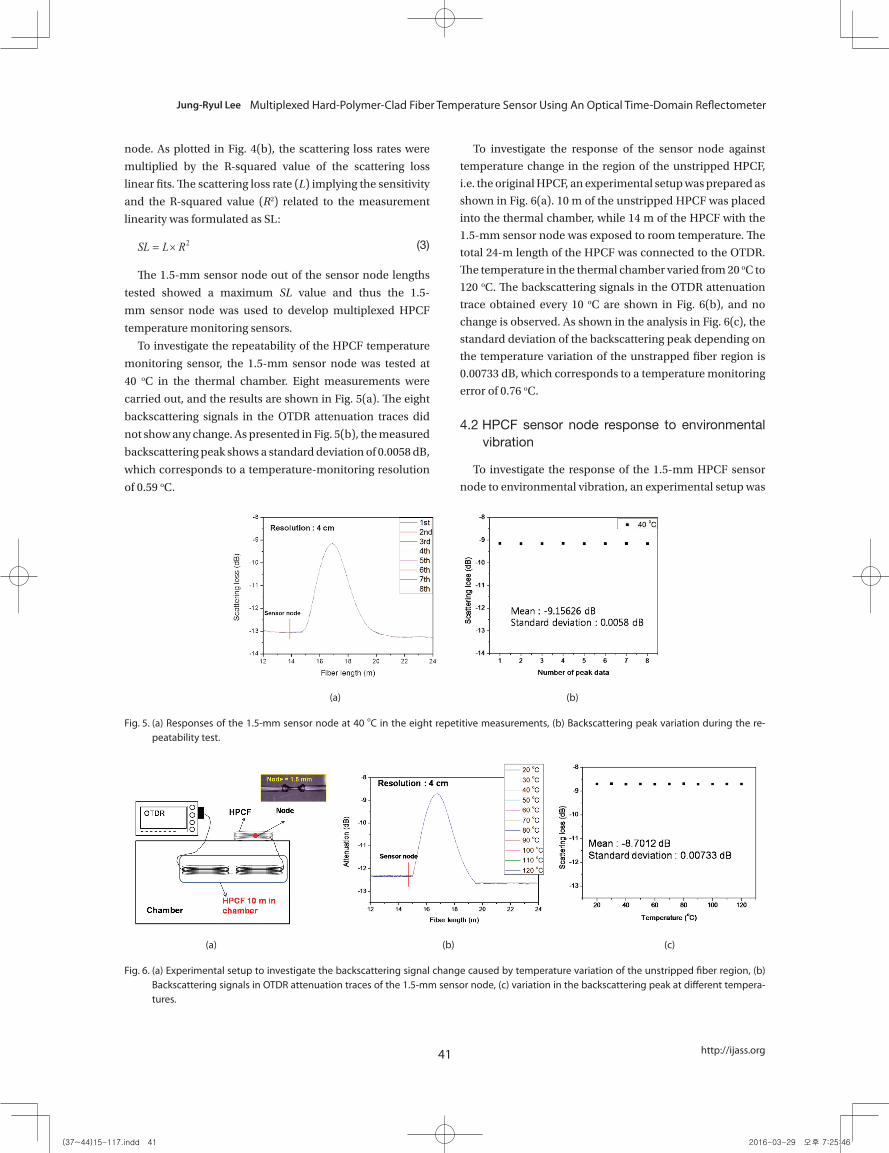
0.0058 dB, which corresponds to a temperature-monitoring resolution of 0.59 °C.
To investigate the response of the sensor node against temperature change in the region of the
unstripped HPCF, i.e. the original HPCF, an experimental setup was prepared as shown in Fig. 6(a).
10 m of the unstripped HPCF was placed into the thermal chamber, while 14 m of the HPCF with the
1.5-mm sensor node was exposed to room temperature. The total 24-m length of the HPCF was
connected to the OTDR. The temperature in the thermal chamber varied from 20 °C to 120 °C. The
backscattering signals in the OTDR attenuation trace obtained every 10 °C are shown in Fig. 6(b), and
no change is observed. As shown in the analysis in Fig. 6(c), the standard deviation of the
backscattering peak depending on the temperature variation of the unstrapped fiber region is 0.00733
dB, which corresponds to a temperature monitoring error of 0.76 °C.
0.6 0.8 1.0 1.2 1.4 1.6 1.8 2.00.003
0.004
0.005
0.006
0.007
0.008
0.009
0.010
*SLR
R (d
B/o C)
Sensor node length (mm)
*SL = Scattering loss rate × R-Square
1.5 mm
(b)
*SL
10
(a) (b)
Fig. 4. (a) Temperature versus the backscattering peak value depending on the sensor node length, (b) Multiplication values of scattering loss rate and R-square depending on the sensor node length.
(37~44)15-117.indd 40 2016-03-29 오후 7:25:46
41
Jung-Ryul Lee Multiplexed Hard-Polymer-Clad Fiber Temperature Sensor Using An Optical Time-Domain Reflectometer
http://ijass.org
node. As plotted in Fig. 4(b), the scattering loss rates were
multiplied by the R-squared value of the scattering loss
linear fits. The scattering loss rate (L) implying the sensitivity
and the R-squared value (R2) related to the measurement
linearity was formulated as SL:
back scattering peak, and the peak values of the sensor nodes decreased linearly with increasing
temperature. In contrast to the 1-mm temperature sensor node, the 1.5-mm and 2-mm temperature
sensor nodes with longer exposed core lengths showed linear distributions over the whole temperature
range tested. The 1.5-mm sensor node showed a loss rate of -0.01005 dB/°C and R-squared value of
linear fit of 0.98207, which was higher than that of the 2-mm sensor node. As plotted in Fig. 4(b), the
scattering loss rates were multiplied by the R-squared value of the scattering loss linear fits. The
scattering loss rate (L) implying the sensitivity and the R-squared value (R2) related to the
measurement linearity was formulated as SL:
2RLSL ×= , (3)
The 1.5-mm sensor node out of the sensor node lengths tested showed a maximum SL value and thus
the 1.5-mm sensor node was used to develop multiplexed HPCF temperature monitoring sensors.
9
(3)
The 1.5-mm sensor node out of the sensor node lengths
tested showed a maximum SL value and thus the 1.5-
mm sensor node was used to develop multiplexed HPCF
temperature monitoring sensors.
To investigate the repeatability of the HPCF temperature
monitoring sensor, the 1.5-mm sensor node was tested at
40 oC in the thermal chamber. Eight measurements were
carried out, and the results are shown in Fig. 5(a). The eight
backscattering signals in the OTDR attenuation traces did
not show any change. As presented in Fig. 5(b), the measured
backscattering peak shows a standard deviation of 0.0058 dB,
which corresponds to a temperature-monitoring resolution
of 0.59 oC.
To investigate the response of the sensor node against
temperature change in the region of the unstripped HPCF,
i.e. the original HPCF, an experimental setup was prepared as
shown in Fig. 6(a). 10 m of the unstripped HPCF was placed
into the thermal chamber, while 14 m of the HPCF with the
1.5-mm sensor node was exposed to room temperature. The
total 24-m length of the HPCF was connected to the OTDR.
The temperature in the thermal chamber varied from 20 oC to
120 oC. The backscattering signals in the OTDR attenuation
trace obtained every 10 oC are shown in Fig. 6(b), and no
change is observed. As shown in the analysis in Fig. 6(c), the
standard deviation of the backscattering peak depending on
the temperature variation of the unstrapped fiber region is
0.00733 dB, which corresponds to a temperature monitoring
error of 0.76 oC.
4.2 HPCF sensor node response to environmental vibration
To investigate the response of the 1.5-mm HPCF sensor
node to environmental vibration, an experimental setup was
Fig. 5. (a) Responses of the 1.5-mm sensor node at 40 ℃ in the eight repetitive measurements, (b)
Backscattering peak variation during the repeatability test.
11
Fig. 5. (a) Responses of the 1.5-mm sensor node at 40 ℃ in the eight repetitive measurements, (b)
Backscattering peak variation during the repeatability test.
11
(a) (b)
Fig. 5. (a) Responses of the 1.5-mm sensor node at 40 oC in the eight repetitive measurements, (b) Backscattering peak variation during the re-peatability test.
Fig. 5. (a) Responses of the 1.5-mm sensor node at 40 ℃ in the eight repetitive measurements, (b)
Backscattering peak variation during the repeatability test.
11
Fig. 6. (a) Experimental setup to investigate the backscattering signal change caused by temperature
variation of the unstripped fiber region, (b) Backscattering signals in OTDR attenuation traces of the
1.5-mm sensor node, (c) variation in the backscattering peak at different temperatures.
4.2 HPCF sensor node response to environmental vibration
To investigate the response of the 1.5-mm HPCF sensor node to environmental vibration, an
experimental setup was prepared as shown in Fig. 7(a). The HPCF was bonded to the shaker, vibration
was then applied to the temperature-monitoring sensor node, and OTDR attenuation traces were
measured as shown in Fig. 7(b). The sensor node was subjected to 3-Hz sinusoidal excitation between
-0.00255g and 0.0034g, 20-Hz sinusoidal excitation between -0.05099g and 0.05099g and random
excitation between -0.05099g and 0.05099g among 3 to 20 Hz. As presented in Fig. 7(c), the results
12
(a) (b) (c)
Fig. 6. (a) Experimental setup to investigate the backscattering signal change caused by temperature variation of the unstripped fiber region, (b) Backscattering signals in OTDR attenuation traces of the 1.5-mm sensor node, (c) variation in the backscattering peak at different tempera-tures.
(37~44)15-117.indd 41 2016-03-29 오후 7:25:46

DOI: http://dx.doi.org/10.5139/IJASS.2016.17.1.37 42
Int’l J. of Aeronautical & Space Sci. 17(1), 37–44 (2016)
prepared as shown in Fig. 7(a). The HPCF was bonded to
the shaker, vibration was then applied to the temperature-
monitoring sensor node, and OTDR attenuation traces
were measured as shown in Fig. 7(b). The sensor node was
subjected to 3-Hz sinusoidal excitation between -0.00255g
and 0.0034g, 20-Hz sinusoidal excitation between -0.05099g
and 0.05099g and random excitation between -0.05099g and
0.05099g among 3 to 20 Hz. As presented in Fig. 7(c), the results
did not show any visible change in the OTDR attenuation
trace and the standard deviation of the backscattering peak
measured during the vibration application was 0.00345 dB,
which corresponds to a temperature monitoring error of
0.36 oC. Therefore, the proposed temperature sensor node
obtained by removing the clad of the HPCF is insensitive
to the vibration. This characteristic is an important merit
for use as a temperature-monitoring sensor to be built into
structures.
4.3 Multiplexed temperature sensor nodes
The most important advantage of the proposed system is
the capability of multiplexed temperature monitoring. To
confirm the multiplexed temperature sensor response to
temperature, five 1.5-mm-long sensor nodes were made in
a single HPCF line by the laser stripping method as shown
in Fig. 8. Then, the temperature sensor line was connected to
the OTDR. Fig. 9 shows the backscattering of five multiplexed
sensor nodes comparing 25 oC with 120 oC. According to the
linear fit equation of the 1.5-mm sensor node, the scattering
loss value is 3.88815 dB at 25 oC and 2.9695 dB at 120 oC.
As shown in Fig. 9, all the sensor nodes stood at scattering
losses of about 3.88 dB at 25 oC and then about 2.96 dB
at 120 oC. As shown in Fig. 10, the 1st to 3rd sensor nodes
were exposed to 120 oC, and the 4th and 5th sensor nodes
were exposed to 25 oC. As shown in Fig. 10, the scattering
losses of the 1st to 3rd sensor nodes were about 2.96 dB,
and those of the 4th and 5th sensor nodes were about 3.88
dB, respectively. Consequently, the multiplexing capability
of the proposed system was successfully demonstrated by
identifying the temperatures at the respective sensor nodes.
Since the 1.5-mm-long exposed core generated a 5-m-wide
did not show any visible change in the OTDR attenuation trace and the standard deviation of the
backscattering peak measured during the vibration application was 0.00345 dB, which corresponds to
a temperature monitoring error of 0.36 °C. Therefore, the proposed temperature sensor node obtained
by removing the clad of the HPCF is insensitive to the vibration. This characteristic is an important
merit for use as a temperature-monitoring sensor to be built into structures.
13 (a) (b) (c)
Fig. 7. (a) Vibration test setup, (b) Responses of the 1.5-mm temperature sensor node to vibration (c) Peak value variation of the back scattering signal caused by vibration.
Fig. 8. Developed multiplexed HPCF temperature sensor array.
Fig. 9. Attenuation trace change in the five multiplexed sensor nodes exposed to a temperature of
120℃.
Fig. 10. Attenuation trace change for the case of the 1st to 3rd sensor nodes exposed to a temperature
of 120℃ and of the 4th and 5th sensor nodes exposed to a temperature of 25℃.
15
Fig. 8. Developed multiplexed HPCF temperature sensor array.
Fig. 8. Developed multiplexed HPCF temperature sensor array.
Fig. 9. Attenuation trace change in the five multiplexed sensor nodes exposed to a temperature of
120℃.
Fig. 10. Attenuation trace change for the case of the 1st to 3rd sensor nodes exposed to a temperature
of 120℃ and of the 4th and 5th sensor nodes exposed to a temperature of 25℃.
15
Fig. 9. Attenuation trace change in the five multiplexed sensor nodes exposed to a temperature of 120oC.
Fig. 8. Developed multiplexed HPCF temperature sensor array.
Fig. 9. Attenuation trace change in the five multiplexed sensor nodes exposed to a temperature of
120℃.
Fig. 10. Attenuation trace change for the case of the 1st to 3rd sensor nodes exposed to a temperature
of 120℃ and of the 4th and 5th sensor nodes exposed to a temperature of 25℃.
15
Fig. 10. Attenuation trace change for the case of the 1st to 3rd sensor nodes exposed to a temperature of 120oC and of the 4th and 5th sensor nodes exposed to a temperature of 25oC.
did not show any visible change in the OTDR attenuation trace and the standard deviation of the
backscattering peak measured during the vibration application was 0.00345 dB, which corresponds to
a temperature monitoring error of 0.36 °C. Therefore, the proposed temperature sensor node obtained
by removing the clad of the HPCF is insensitive to the vibration. This characteristic is an important
merit for use as a temperature-monitoring sensor to be built into structures.
13
(37~44)15-117.indd 42 2016-03-29 오후 7:25:47

43
Jung-Ryul Lee Multiplexed Hard-Polymer-Clad Fiber Temperature Sensor Using An Optical Time-Domain Reflectometer
http://ijass.org
backscattering signal, the given OTDR allows for a sensor
node to be made at every 5 m for independent multiplexing.
In fabricating the temperature sensor array in Fig. 8, the core
exposure was done for the temperature sensor node at every
10 m, and a backscattering loss of less than 2 dB was used to
make the five independent sensor nodes, even though ten
sensor nodes could be arrayed. Therefore, at least 35 senor
nodes can be arrayed with a single HPCF about 230-m long,
and much more sensor nodes can be implemented in a longer
HPCF line, which implies various multiplexed temperature
monitoring applications can be realized economically by the
proposed technique.
5. Conclusion
A multiplexed fiber optic temperature-monitoring
sensor system has been proposed using an economical
OTDR and HPCF. The sensor nodes were economically and
quickly made by locally stripping the clad of HPCF through
photothermal and photochemical processes using a CW/
Pulse hybrid-mode laser. The core length to be exposed was
easily controlled by adjusting the laser beam diameter. Since
the fraction of scattered light at the removed clad part locally
increased, the backscattering peak happened in the OTDR
attenuation trace. When the exposed core temperature
increases, the core density decreases, and thus, the core
refractive index decreases as well, but the air refractive
index (n3) is barely changed. Therefore, the fraction of the
scattered light was decreased, which was observed as the
lowered backscattering peak in the OTDR attenuation trace.
The sensitivity of the backscattering peak to temperature
variation was fitted with a linear distribution. 1.5-mm sensor
nodes were selected to develop multiplexed temperature
monitoring sensors by measuring the sensitivities and
linearity of the respective sensor node lengths.
A temperature sensor array with five sensor nodes at
intervals of 10 m was fabricated within 3 min, and the
independent temperature monitoring capability of each
sensor node was demonstrated. The 1.5-mm-long exposed
core showed a 5-m-wide backscattering peak in the 40 mm
setting in OTDR resolution. Therefore, it implies that the
given OTDR allows for a sensor node to be made at every
5 m for independent multiplexing. The performance of the
sensor node included an operating range of up to 120oC,
a resolution of 0.59 oC, and a temperature sensitivity of
-0.01005 dB/oC. There were temperature monitoring errors
in the environment tests at 0.76 oC and 0.36 oC under the
temperature variation of the unstrapped fiber region and
the vibration of the sensor node. The small sensitivities to
the environment and economic feasibility of the highly
multiplexed HPCF temperature monitoring sensor system
will be important advantages for use as system-integrated
temperature sensors in aerospace experiments and systems.
Acknowledgement
This research was supported by the Leading Foreign
Research Institute Recruitment Program (2011-0030065)
and the Space Core Technology Development Program
(2013-042548) through the National Research Foundation of
Korea and the research grant (UD130058JD) of the Agency
for Defense Development of the Korean government.
References
[1] Marcos, A., R., Valdir, A., S. and Francisco, S., “Side-
polished Microstructured Optical Fiber for Temperature
Sensor Application”, IEEE Photonics Technology Letters, Vol.
19, No. 21, 2007, pp. 1738-1740.
[2] Daniel, C.B., Lothar, S., Michael, N.T. and Michael,
K., “Structural Monitoring Using Fiber-optic Bragg Grating
Sensors”, Structural Health Monitoring, Vol. 2, No. 2, 2003,
pp. 145-152.
[3] Fumio, T., Kazushi, U. and Takeo, K., “Multipoint
Temperature Measurement Technology using Optical Fiber”,
FUJITSU Sci. Tech., Vol. 46, No. 1, 2010, pp. 28-33.
[4] Yoo, W., J., Jang, K., W., Seo, J., K., Moon, J., Han, K.,
Park, J., Park, B., G. and Lee, B., “Development of a 2-Channel
Embedded Infrared Fiber-Optic Temperature Sensor Using
Silver Halide Optical Fibers”, Sensors, Vol. 11, No. 10, 2011,
pp. 9549-9559.
[5] Liqiu, M., Ping, L. and Qiying, C., “A Multiplexed
Fiber Bragg Grating Sensor for Simultaneous Salinity and
Temperature Measurement”, Journal of Applied Physics, Vol.
103, Issue 5, 2008, pp. 1-7.
[6] Eric, U., “Fiber Optic Sensors; an Introduction for
Engineers and Scientists”, WILEY-INTERSCIENCE, 2006, pp.
413-419.
[7] Hewa-Gamage, G. and Chu, P., L., “A Multiplexed Point
Temperature Fibre Sensor Array using OTDR Technique
and TDM Mechanism”, Institute of Electrical and Electronics
Engineers, Vol. 2, 2002, pp. 111-118.
[8] Jianfeng, W., Yongxing, J., Zaixuan, Z., Changyu, S.
and Yanqing, Q., “Research of Distributed Optical Fiber
Temperature Sensor (DTS) System with Optical Switch”,
Institute of Electrical and Electronics Engineers, Vol. 10, 2010,
pp. 1-4.
(37~44)15-117.indd 43 2016-03-29 오후 7:25:47

DOI: http://dx.doi.org/10.5139/IJASS.2016.17.1.37 44
Int’l J. of Aeronautical & Space Sci. 17(1), 37–44 (2016)
[9] Moyo, P., Brownjohn, J., Suresh, R. and Tjin, S.,
“Development of Fiber Bragg Grating Sensors for Monitoring
Civil Infrastructure”, Engineering Structures, Vol. 27, No. 12,
2005, pp. 1828-1834.
[10] Hideaki, I., Hiroshi, Y., Keiji, S. and Akira, M.,
“Structural Health Monitoring System Using FBG-Based
Sensors for a Damage Tolerant Building”, International
Workshop on Structural Health Monitoring, Vol. 1, 2001, pp.
1-10.
[11] Miao, S., Ben, X., Xinyong, D. and Yi, L., “Optical
Fiber Strain and Temperature Sensor Based on an In-line
Mach-Zehnder Interferometer using Thin-core Fiber”, Optics
Communications, Vol. 285, No. 18, 2012, pp. 3721-3725.
[12] Zhan-Sheng, G., “Strain and Temperature Monitoring
of Asymmetric Composite Laminate using FBG Hybrid
Sensors”, Structural Health Monitoring, Vol. 6, No. 3, 2007,
pp. 191-197.
[13] Jose, M., Luis, R., Antonio, Q. and Adolfo, C., “Fiber
Optic Sensors in Structural Health Monitoring”, Journal of
Lightwave Technology, Vol. 29, No. 4, 2002, pp. 587-608.
[14] Liu, Y., Lei, T., Wei, T., Sun, Z., Wang, C. and Liu,
T., “Application of Distributed Optical Fiber Temperature
Sensing System based on Raman Scattering in Coal Mine
Safety Monitoring”, Institute of Electrical and Electronics
Engineers, Vol. 1, 2012, pp. 1-4.
[15] Jose, M., L., “Handbook of Optical Fibre Sensing
Technology”, WILEY, 2002, pp. 482-493.
[16] Hong-Nan, L., Dong-Sheng, L. and Gang-Bing,
S., “Recent Applications of Fiber Optic Sensors to Health
Monitoring in Civil engineering”, Engineering Structures, Vol.
26, No. 11, 2004, pp. 1647-1657.
[17] Yun, C. Y., Dipesh, D., Lee, J. R., Park, G. and Kwon,
I. B., “Design of Multiplexed Fiber Optic Chemical Sensing
System using Clad-removable Optical Fibers”, Optics & Laser
Technology, Vol. 44, No. 1, 2012, pp. 269-280.
[18] Kim, D. U., Bae, S. C., Kim, J., Kim, T. Y., Park, C. S.
and Oh, K., “Hard Polymer Cladding Fiber (HPCF) Links for
High-Speed Short Reach 1 4 Passive Optical Network (PON)
Based on All-HPCF Compatible used Taper Power Splitter”,
Institute of Electrical and Electronics Engineers Photonics
Technology Letters, Vol. 17, No. 11, 2005, pp. 2355-2357.
[19] Kim, H. C. and Lee, J. R., “A Novel Fiber Optic
Temperature Monitoring Sensor using Hard-polymer-clad
fiber and Optical Time-domain Reflectometer”, Journal of
Intelligent Material Systems and Structures, Vol. 25, No. 5,
2014, pp. 654-661.
[20] Hwang, D., Yoon, D., Kwon, I., Seo, D. and Chung, Y.,
“Novel Auto-correction Method in a Fiber-optic distributed-
temperature Sensor using Reflected Anti-Stokes Raman
Scattering”, Optics Express, Vol. 18, No. 10, 2010, pp. 9747-
9754.
[21] Rongqing, H. and Maurice, O., “Fiber Optic
Measurement Techniques”, ELSEVIER ACADEMIC PRESS,
2009, pp. 384-385.
[22] Kohich, A., Kiyoshi, N. and Takeshi, I., “Optical Time
Domain Reflectometry in a Single-Mode Fiber”, IEEE Journal
of Quantum Electronics, Vol. 17, No. 6, 1981, pp. 862-868.
[23] Kalpakjian, S. and Schmid, S. R., Manufacturing
Processes for Engineering Materials, Second Ed. Addison-
Wesley Publishing Company, New York, USA, 1992.
(37~44)15-117.indd 44 2016-03-29 오후 7:25:47


![Sensitivity analysis of transonic flow past a NASA …past.ijass.org/On_line/admin/files/(232~240)14-020.pdf10%-thick supercritical NASA SC(2)-0710 airfoil [9]: 2 not thoroughly investigated](https://img.pdfslide.net/doc/110x75/5ac15cd07f8b9a357e8c9682/sensitivity-analysis-of-transonic-flow-past-a-nasa-pastijassorgonlineadminfiles23224014-020pdf10-thick.jpg)


![Conceptual Design Optimization of Tensairity Girder Using ...past.ijass.org/On_line/admin/files/(29~36)15-076.pdf · adaptive sampling method [9] are used to build the surrogate model](https://img.pdfslide.net/doc/110x75/6061be112ccc0b142c43805d/conceptual-design-optimization-of-tensairity-girder-using-pastijassorgonlineadminfiles293615-076pdf.jpg)


![Estimation of Composite Laminate Design Allowables Using ...past.ijass.org/On_line/admin/files/4.(360~369)15-087.pdf15]. Park [16] improved it for analyzing composite material characteristics](https://img.pdfslide.net/doc/110x75/611b2b74f7cc4838e54d0f9c/estimation-of-composite-laminate-design-allowables-using-pastijassorgonlineadminfiles436036915-087pdf.jpg)