Embed Size (px)
Citation preview
Research ArticleMultiscreening LC-MS/MS Designed for Ten Pesticide andSix Antimicrobial Residues in Eggs
Julia Arantes Galvão,1 Ricardo Seiti Yamatogi,1 Alexander Welker Biondo,2
José Paes de Almeida Nogueira Pinto,1 José Roberto Marques Silva,3
Caio Antonio Carbonari,3 and Edivaldo Domingues Velini3
1Department of Veterinary Hygiene and Public Health, School of Veterinary Medicine and Animal Science,Univ. Estadual Paulista (UNESP), Distrito de Rubiao Junior, s/n, 18618-970 Botucatu, SP, Brazil2Department of Veterinary Medicine, Federal University of Parana, 80035-050 Curitiba, PR, Brazil3Center for Advanced Research in Matology (CARM), Chromatography Laboratory, Faculty of Agricultural Sciences,Paulista State University, 18618-970 Botucatu, SP, Brazil
Correspondence should be addressed to Julia Arantes Galvao; [email protected]
Received 28 July 2016; Accepted 6 December 2016; Published 22 January 2017
Academic Editor: Angel A. Carbonell-Barrachina
Copyright © 2017 Julia Arantes Galvao et al. This is an open access article distributed under the Creative Commons AttributionLicense, which permits unrestricted use, distribution, and reproduction in any medium, provided the original work is properlycited.
A multiscreening method was experimentally validated for pesticide and antimicrobial residues in spiked eggs at levels of 5, 50,and 500 𝜇g L−1. The residue extraction was performed with acetonitrile and 1% formic acid. The extracted material was storedat −70∘C until detection and quantitation within 24-hour period by LC-MS/MS. Pesticide and antimicrobial residue recoveryperformed adequate standard deviation and the results were from 94.10% (ampa) to 9.20% (carbaryl) for pesticides and from95.70% (enrofloxacin) to 46.20% (sulfathiazole) for antimicrobial.Themethod was highly accurate, considering the linearity for allpesticide and antimicrobial residues (𝑟2 > 0.99), with quantitation limits ranging from 0.78 to 6.25𝜇g L−1 for pesticides and 0.78 to3.13 𝜇g L−1 for antibiotics. A highly correlation coefficient (𝑟 > 0.99) was found, except for carbaryl. Although time extraction andcarbaryl recovery remain to be improved, the method has shown a rapid pesticide and antimicrobial residue detection.
1. Introduction
Although pesticides have been the main global tool for weed,pest, and disease in agricultural control, detection methodsof pesticide residues in animal products remain antiquatedcompared to agricultural and environmental methodologies[1]. In recent years, Brazilian agriculture has experiencedexponential growth, as well as the country becoming theworld’s top consumer of pesticides [2, 3].
Eggs have been considered an inexpensive and nutritivefood source with worldwide production of 68,262 thousandtons in 2013 [4], with antimicrobial residues in food securityhaving been uncertain in developing countries, but detectionmethodology established and routinely used [5–8].
Whereas EuropeanUnion has listed veterinary drug pres-ence in two alert notifications (trimethoprim, sulfonamide,enrofloxacin, and toltrazuril) between January, 2013, and
September, 2016, in eggs and egg products, no pesticidenotification has been made during this period [9]. Moreover,no specific regulation has been globally provided for eggand egg products, although maximum levels of pesticide andantibiotic residues in foodwere establishedworldwide [10, 11].
Since Brazil has been also listed as the seventh worldbiggest egg producer [12], a rapid, simple, and reliablemultiresidue detection would provide current sanitary status,food control, and prevention. Accordingly, the aim of thepresent study was to validate a multiscreening method basedonLC-MS/MS for ten pesticide and six antimicrobial residuesin egg contents.
2. Material and Methods
2.1. Egg Samples. Egg samples were provided by two high-production egg farms certified by the Brazilian Inspection
HindawiJournal of Food QualityVolume 2017, Article ID 9718451, 6 pageshttps://doi.org/10.1155/2017/9718451
2 Journal of Food Quality
Service in Sao Paulo State, Brazil: Farm A with both conven-tional and free-range systems and Farm B with conventionalsystem.Therewere 10 eggs from each system, totaling 30 eggs.These samples were stored at under frost conditions (−20∘C)in a Falcon tube until analysis.
2.2. Equipment and Residues. Analyses were carried out bya LC-MS/MS system, composed by commercially availableHigh Performance Liquid Chromatograph (ProeminenceUFLC, Shimadzu Co., Sao Paulo, Brazil) coupled to a massspectrometer (3200QTRAP, Applied Biosystems, Sao Paulo,Brazil). The triple quadrupole analysis mode, which is Q3only defined to detect one especial mass and known fragmentfrom the intactmolecule of identifiedmass filtered byQ1, wasselected and used [13, 14].
Pesticide residues of aminomethylphosphonic acid(ampa), epoxiconazole, fipronil, metolachlor, malathion, flu-triafol, pyraclostrobin, carbendazim, glyphosate, and carba-ryl, complying with the maximum residue limits (MRL)established by Codex Alimentarius for soy and corn grains[15], were selected and tested. These residues represented themost common pesticides applied in corn and soy crops, theworldwide main ingredients for laying hen feeding.
Antimicrobials residues of enrofloxacin, sulfamethazine,sulfadimethoxine, sulfadiazine, chloramphenicol, and sul-fathiazole, complying with the maximum residue limits(MRL) established for eggs [15], were selected and tested.In addition, comparisons were made with a previous studyof drug use in poultry in Parana State [18] and worldwide[19, 20].
2.3. Validation of Liquid Chromatography Analysis and MassSpectrometry. To validate the methodology, several experi-mental studies for analytical curve linearity, limit of detectionand quantitation, precision (repeatability, and intermediateprecision), and accuracy [21, 22] were considered.
To optimize mass spectrometry conditions, direct injec-tions to the equipment were performed with standard analyt-ical solution of 1mg L−1 from each compound, individually.The analytical standards for tests were commercially acquiredwith 98% purity or higher (Sigma-Aldrich, Sao Paulo, Brazil).From infusions, ESI (electrospray ionization) was pickedas the ionization source, which produces analyte ions onliquid phase prior to entering mass spectrometer. Negativeionization mode was utilized to glyphosate and ampa. Forother compounds, positive ionization was done.
Chromatographic conditions used for compound quan-tifications on negative ionization mode were a chromato-graphic column (Gemini 5 micrometers C18 110 A 150mm ×4.6mm) with phase A (PA) = 5mM of ammonium acetatein water and phase B (PB) = 5mM of ammonium acetatein methanol on mobile phase, 0–4min = 10% PB and 90%PA; 4–6min = 95% PB and 5% PA; 6–8min = 95% PB and5% PA; 8–10min = 10% PB and 90% PA with 12min stopon mobile phase gradient and on mobile phase flow rate0.500mLmin−1.
Chromatographic conditions used for compound quan-tifications on positive ionization mode were a chromato-graphic column (Synergi 2.5 micrometers Hydro-RP 110 A 50
× 4.60mm) with phase A (PA) = 0.1% formic acid in waterand phase B (PB) = 0.1% formic acid in methanol on mobilephase, 0–0.5min = 10% PB and 90% PA; 0.5–4.5min = 95%PB and 5% FA; 4.5–7.5min = 95% PB and 5% PA; 7.5–9.5min= 10% PB and 90% PA with 11min stop on mobile phasegradient and on mobile phase flow rate 0.400mLmin−1.
Monitoring more than one ion was necessary to avoiderroneous identifications of the composing quantification.LC-MS/MS use enabled control of molecular ion and ionictransition from substance fragmentation, ensuring sensitivityand specificity for an accurate measurement of weak tracesof analytes, sometimes present in highly complex matrices[13, 14].
2.4. Analytical Curve. The analytical curve is the quantifica-tion tool most commonly used. It consists in determiningresponse of any particular instrument to various concen-trations of a tested substance. Commonly chromatographicanalytical techniques use a first-order linear associationbetween detector response (𝑦) and concentration (𝑥) of theanalyte [23, 24]. This mathematical relation must also havea high correlation coefficient (𝑟 > 0.9999) and may be repre-sented by the linear regression equation described below [25]:
𝑦 = 𝑎𝑥 + 𝑏, (1)
where 𝑏 is the intersection of the calibration curve and 𝑎 isthe slope.
2.5. Residue Extraction. The congealed egg content sam-ples were defrosted into a refrigerator for 24 hours. Then,2.50 g of homogenate albumen and yolk were weighted andhomogenized into a Falcon tube with 5mL of ultrapurewater by Turrax. After, 15mL of acetonitrile containing 1%formic acid was aggregated, generating a 20-fold dilutionof the sample. Diluted sample was maintained under con-tinuous and intense stirring for one hour. The tube wascentrifuged (10min/2000 rcf) (Rotanta 460R), and 0.50mLof the supernatant was sifted through 0.45𝜇M Millex HVfilters (Millipore), with a 13mm durapore membrane, andpackaged in a 9mm amber vial (Flow Supply), for subsequentquantification by LC-MS/MS (Mol et al. 2008 adapted).
For checking the recovery, a sample enrichment wasperformed by a sample solution containing a mixture ofthe analytical standards representing itself contents of 5, 50,and 500 𝜇g L−1 from each compound. Four replications wereperformed.Theaverage recovery and standard deviationwerecalculated by matching enriched samples versus calibrationmatrix standards. Recovery outcome reflected on the recu-peration of extraction process. Results were calculated bycomparing response obtained from each component with thematching matrix pattern.
3. Results and Discussion
3.1. Validation of Liquid Chromatography Analysis and MassSpectrometry. The molecular mass and fragments producedfrom each pesticide molecule, respectively, were ampa 109.99(62.90, 78.90, and 80.80), epoxiconazole 330.15 (121.00,101.10, and 75.10) fipronil 436.91 (368.00, 251.10, and 263.10),
Journal of Food Quality 3
metolachlor 284.21 (252.30, 176.20, and 91.10), malathion331.01 (99.00, 127.10, and 125.00), flutriafol 302.10 (70.00,123.20, 95.00), pyraclostrobin 388.13 (163.20, 194.30, and104.20), carbendazim 192.25 (160.20, 132.30, and 105.10), gly-phosate 167.92 (63.10, 78.80, and 150.20), and carbaryl 202.15(145.10, 127.10, and 117.20), and, for each antimicrobials,respectively, were enrofloxacin 360.23 (342.30, 245.30, and203.20), sulfamethazine 279.01 (108.20, 92.20, and 156.30),sulfadimethoxine 311.01 (155.90, 108.20, and 64.90), sulfadi-azine 250.87 (156.20, 64.90, and 108.20), chloramphenicol322.84 (275.00, 165.10, and 83.20), and sulfathiazole 256.04(92.10, 156.10, 65.20).
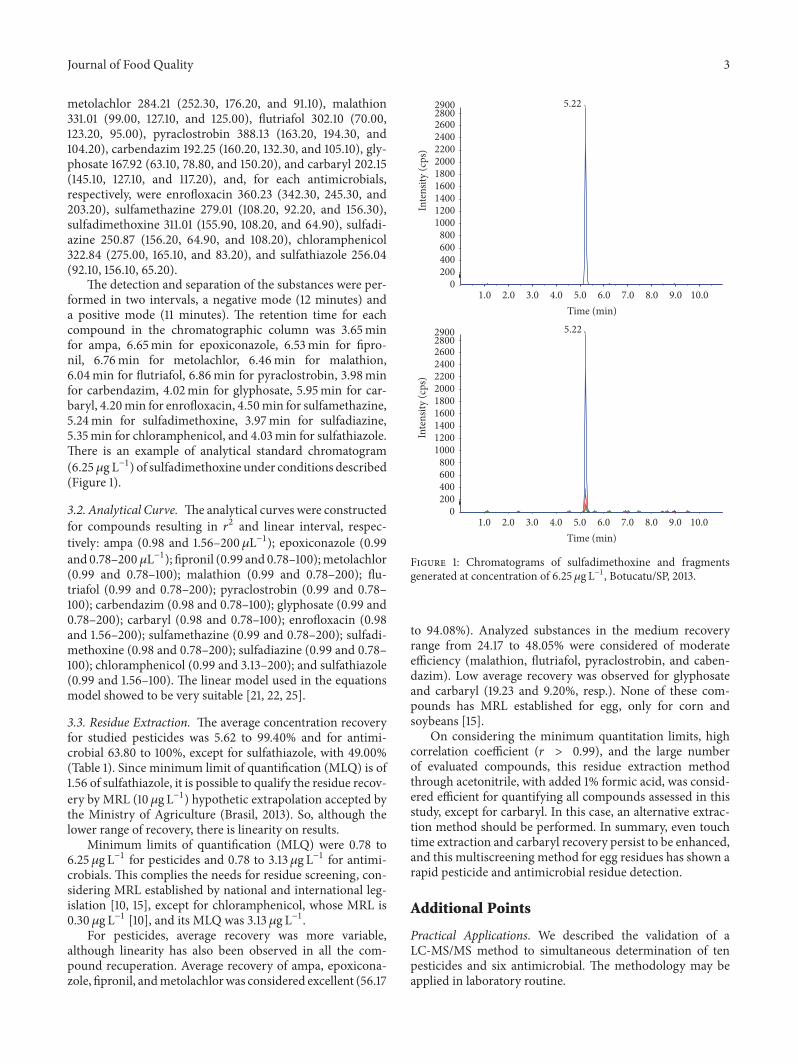
The detection and separation of the substances were per-formed in two intervals, a negative mode (12 minutes) anda positive mode (11 minutes). The retention time for eachcompound in the chromatographic column was 3.65minfor ampa, 6.65min for epoxiconazole, 6.53min for fipro-nil, 6.76min for metolachlor, 6.46min for malathion,6.04min for flutriafol, 6.86min for pyraclostrobin, 3.98minfor carbendazim, 4.02min for glyphosate, 5.95min for car-baryl, 4.20min for enrofloxacin, 4.50min for sulfamethazine,5.24min for sulfadimethoxine, 3.97min for sulfadiazine,5.35min for chloramphenicol, and 4.03min for sulfathiazole.There is an example of analytical standard chromatogram(6.25 𝜇g L−1) of sulfadimethoxine under conditions described(Figure 1).
3.2. Analytical Curve. Theanalytical curves were constructedfor compounds resulting in 𝑟2 and linear interval, respec-tively: ampa (0.98 and 1.56–200𝜇L−1); epoxiconazole (0.99and 0.78–200𝜇L−1); fipronil (0.99 and 0.78–100);metolachlor(0.99 and 0.78–100); malathion (0.99 and 0.78–200); flu-triafol (0.99 and 0.78–200); pyraclostrobin (0.99 and 0.78–100); carbendazim (0.98 and 0.78–100); glyphosate (0.99 and0.78–200); carbaryl (0.98 and 0.78–100); enrofloxacin (0.98and 1.56–200); sulfamethazine (0.99 and 0.78–200); sulfadi-methoxine (0.98 and 0.78–200); sulfadiazine (0.99 and 0.78–100); chloramphenicol (0.99 and 3.13–200); and sulfathiazole(0.99 and 1.56–100). The linear model used in the equationsmodel showed to be very suitable [21, 22, 25].
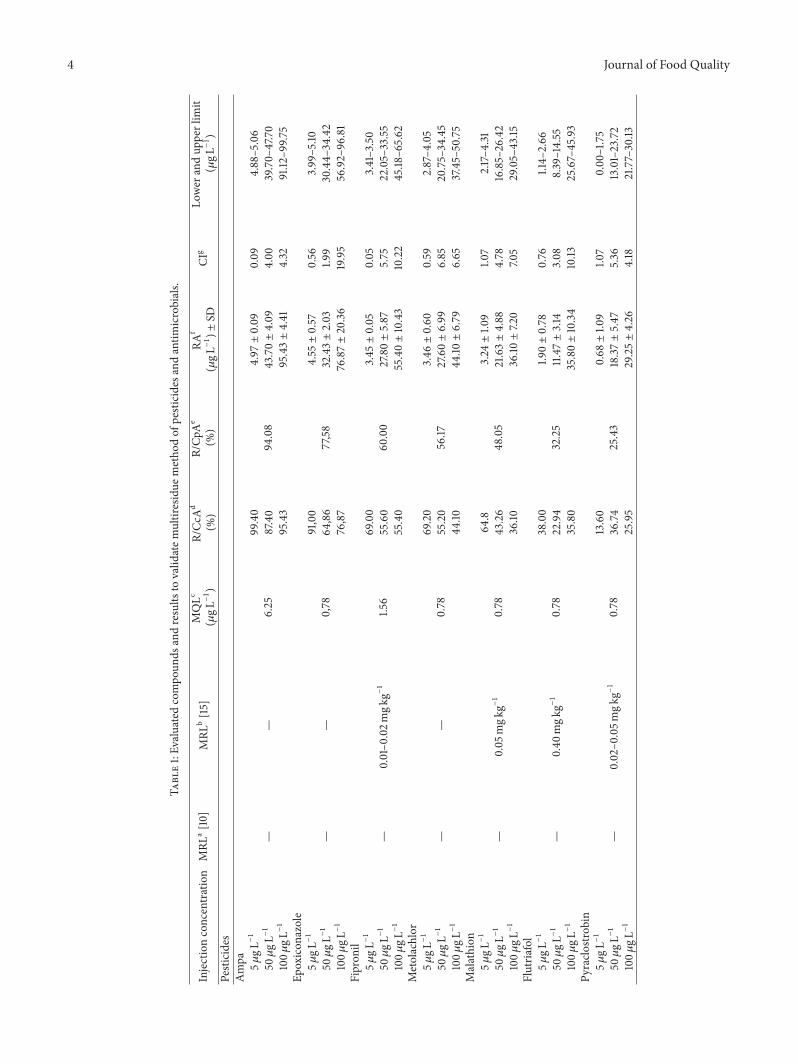
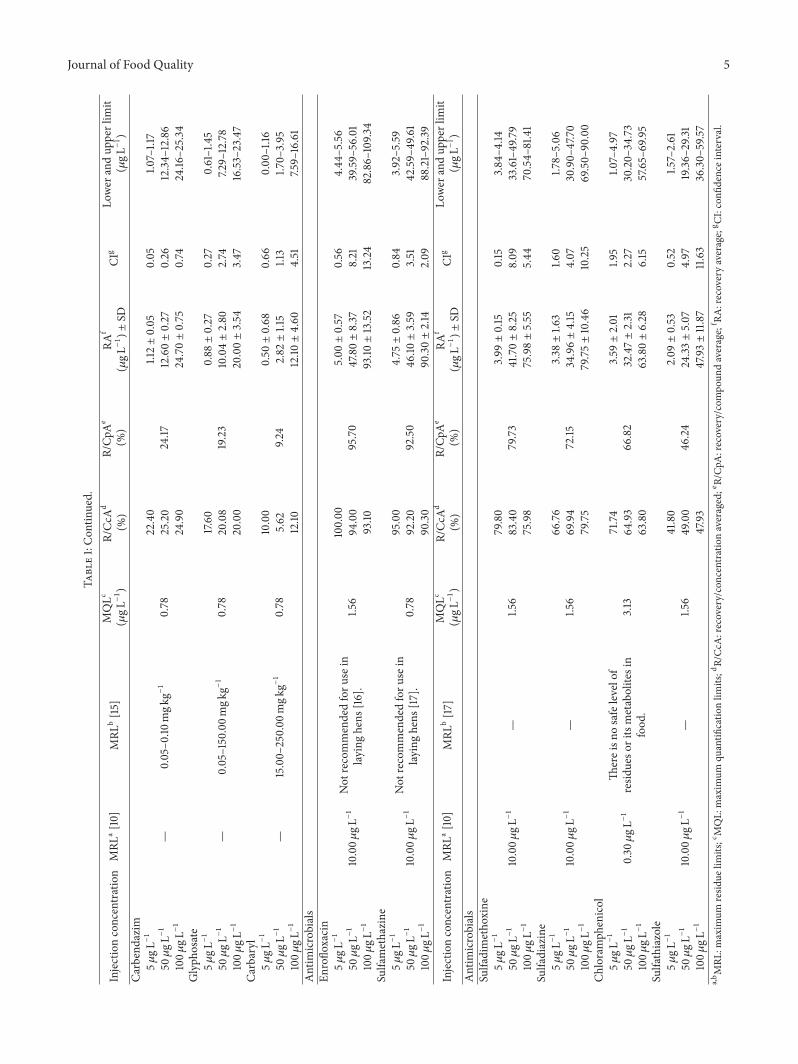
3.3. Residue Extraction. The average concentration recoveryfor studied pesticides was 5.62 to 99.40% and for antimi-crobial 63.80 to 100%, except for sulfathiazole, with 49.00%(Table 1). Since minimum limit of quantification (MLQ) is of1.56 of sulfathiazole, it is possible to qualify the residue recov-ery by MRL (10 𝜇g L−1) hypothetic extrapolation accepted bythe Ministry of Agriculture (Brasil, 2013). So, although thelower range of recovery, there is linearity on results.
Minimum limits of quantification (MLQ) were 0.78 to6.25 𝜇g L−1 for pesticides and 0.78 to 3.13 𝜇g L−1 for antimi-crobials. This complies the needs for residue screening, con-sidering MRL established by national and international leg-islation [10, 15], except for chloramphenicol, whose MRL is0.30 𝜇g L−1 [10], and its MLQ was 3.13 𝜇g L−1.
For pesticides, average recovery was more variable,although linearity has also been observed in all the com-pound recuperation. Average recovery of ampa, epoxicona-zole, fipronil, andmetolachlorwas considered excellent (56.17
1.0 2.0 3.0 4.0 5.0 6.0 7.0 8.0 9.0 10.0Time (min)
0200400600800
10001200140016001800200022002400260028002900
Inte
nsity
(cps
)
5.22
1.0 2.0 3.0 4.0 5.0 6.0 7.0 8.0 9.0 10.0Time (min)
0200400600800
10001200140016001800200022002400260028002900
Inte
nsity
(cps
)
5.22
Figure 1: Chromatograms of sulfadimethoxine and fragmentsgenerated at concentration of 6.25𝜇g L−1, Botucatu/SP, 2013.
to 94.08%). Analyzed substances in the medium recoveryrange from 24.17 to 48.05% were considered of moderateefficiency (malathion, flutriafol, pyraclostrobin, and caben-dazim). Low average recovery was observed for glyphosateand carbaryl (19.23 and 9.20%, resp.). None of these com-pounds has MRL established for egg, only for corn andsoybeans [15].
On considering the minimum quantitation limits, highcorrelation coefficient (𝑟 > 0.99), and the large numberof evaluated compounds, this residue extraction methodthrough acetonitrile, with added 1% formic acid, was consid-ered efficient for quantifying all compounds assessed in thisstudy, except for carbaryl. In this case, an alternative extrac-tion method should be performed. In summary, even touchtime extraction and carbaryl recovery persist to be enhanced,and this multiscreening method for egg residues has shown arapid pesticide and antimicrobial residue detection.
Additional Points
Practical Applications. We described the validation of aLC-MS/MS method to simultaneous determination of tenpesticides and six antimicrobial. The methodology may beapplied in laboratory routine.
4 Journal of Food Quality
Table1:Ev
aluatedcompo
unds
andresults
tovalid
atem
ultiresidue
metho
dof
pesticides
andantim
icrobials.
Injectionconcentration
MRL
a[10]
MRL
b[15]
MQLc
(𝜇gL−1)
R/CcA
d
(%)
R/Cp
Ae
(%)
RAf
(𝜇gL−1)±
SDCI
gLo
wer
andup
perlim
it(𝜇gL−1)
Pesticides
Ampa 5𝜇gL−1
——
6.25
99.40
94.08
4.97±0.09
0.09
4.88–5.06
50𝜇gL−1
87.40
43.70±4.09
4.00
39.70–
47.70
100𝜇
gL−1
95.43
95.43±4.41
4.32
91.12
–99.7
5Ep
oxicon
azole
5𝜇gL−1
——
0,78
91,00
77,58
4.55±0.57
0.56
3.99–5.10
50𝜇gL−1
64,86
32.43±2.03
1.99
30.44–
34.42
100𝜇
gL−1
76,87
76.87±20.36
19.95
56.92–96.81
Fipron
il5𝜇
gL−1
—0.01–0
.02m
gkg−1
1.56
69.00
60.00
3.45±0.05
0.05
3.41–3.50
50𝜇gL−1
55.60
27.80±5.87
5.75
22.05–33.55
100𝜇
gL−1
55.40
55.40±10.43
10.22
45.18
–65.62
Metolachlor
5𝜇gL−1
——
0.78
69.20
56.17
3.46±0.60
0.59
2.87–4
.05
50𝜇gL−1
55.20
27.60±6.99
6.85
20.75–34.45
100𝜇
gL−1
44.10
44.10±6.79
6.65
37.45–50.75
Malathion
5𝜇gL−1
—0.05
mgk
g−1
0.78
64.8
48.05
3.24±1.0
91.0
72.17–4
.3150𝜇gL−1
43.26
21.63±4.88
4.78
16.85–26.42
100𝜇
gL−1
36.10
36.10±7.2
07.0
529.05–43.15
Flutria
fol
5𝜇gL−1
—0.40
mgk
g−1
0.78
38.00
32.25
1.90±0.78
0.76
1.14–
2.66
50𝜇gL−1
22.94
11.47±3.14
3.08
8.39–14.55
100𝜇
gL−1
35.80
35.80±10.34
10.13
25.67–45.93
Pyraclo
strobin
5𝜇gL−1
—0.02–0
.05m
gkg−1
0.78
13.60
25.43
0.68±1.0
91.0
70.00–1.75
50𝜇gL−1
36.74
18.37±5.47
5.36
13.01–23.72
100𝜇
gL−1
25.95
29.25±4.26
4.18
21.77–30.13
Journal of Food Quality 5
Table1:Con
tinued.
Injectionconcentration
MRL
a[10]
MRL
b[15]
MQLc
(𝜇gL−1)
R/CcA
d
(%)
R/Cp
Ae
(%)
RAf
(𝜇gL−1)±
SDCI
gLo
wer
andup
perlim
it(𝜇gL−1)
Carbendazim
5𝜇gL−1
—0.05–0
.10mgk
g−1
0.78
22.40
24.17
1.12±0.05
0.05
1.07–1.17
50𝜇gL−1
25.20
12.60±0.27
0.26
12.34–
12.86
100𝜇
gL−1
24.90
24.70±0.75
0.74
24.16
–25.34
Glyph
osate
5𝜇gL−1
—0.05–150.00m
gkg−1
0.78
17.60
19.23
0.88±0.27
0.27
0.61–1.45
50𝜇gL−1
20.08
10.04±2.80
2.74
7.29–
12.78
100𝜇
gL−1
20.00
20.00±3.54
3.47
16.53
–23.47
Carbaryl
5𝜇gL−1
—15.00–
250.00
mgk
g−1
0.78
10.00
9.24
0.50±0.68
0.66
0.00–1.16
50𝜇gL−1
5.62
2.82±1.15
1.13
1.70–
3.95
100𝜇
gL−1
12.10
12.10±4.60
4.51
7.59–
16.61
Antim
icrobials
Enroflo
xacin
5𝜇gL−1
10.00𝜇
gL−1
Not
recommendedforu
sein
laying
hens
[16].
1.56
100.00
95.70
5.00±0.57
0.56
4.44
–5.56
50𝜇gL−1
94.00
47.80±8.37
8.21
39.59–
56.01
100𝜇
gL−1
93.10
93.10±13.52
13.24
82.86–
109.3
4Sulfamethazine
5𝜇gL−1
10.00𝜇
gL−1
Not
recommendedforu
sein
laying
hens
[17].
0.78
95.00
92.50
4.75±0.86
0.84
3.92–5.59
50𝜇gL−1
92.20
46.10±3.59
3.51
42.59–
49.61
100𝜇
gL−1
90.30
90.30±2.14
2.09
88.21–92.39
Injectionconcentration
MRL
a[10]
MRL
b[17]
MQLc
(𝜇gL−1)
R/CcA
d
(%)
R/Cp
Ae
(%)
RAf
(𝜇gL−1)±
SDCI
gLo
wer
andup
perlim
it(𝜇gL−1)
Antim
icrobials
Sulfadimetho
xine
5𝜇gL−1
10.00𝜇
gL−1
—1.5
679.80
79.73
3.99±0.15
0.15
3.84–4
.1450𝜇gL−1
83.40
41.70±8.25
8.09
33.61–49.79
100𝜇
gL−1
75.98
75.98±5.55
5.44
70.54–
81.41
Sulfadiazine
5𝜇gL−1
10.00𝜇
gL−1
—1.5
666.76
72.15
3.38±1.6
31.6
01.7
8–5.06
50𝜇gL−1
69.94
34.96±4.15
4.07
30.90–
47.70
100𝜇
gL−1
79.75
79.75±10.46
10.25
69.50–
90.00
Chloramph
enicol
5𝜇gL−1
0.30𝜇gL−1
Thereisn
osafelevelof
resid
ueso
ritsmetabolitesin
food
.3.13
71.74
66.82
3.59±2.01
1.95
1.07–4.97
50𝜇gL−1
64.93
32.47±2.31
2.27
30.20–
34.73
100𝜇
gL−1
63.80
63.80±6.28
6.15
57.65–69.95
Sulfathiazole
5𝜇gL−1
10.00𝜇
gL−1
—1.5
641.80
46.24
2.09±0.53
0.52
1.57–2.61
50𝜇gL−1
49.00
24.33±5.07
4.97
19.36–
29.31
100𝜇
gL−1
47.93
47.93±11.87
11.63
36.30–
59.57
a,bMRL
:maxim
umresid
uelim
its;cMQL:maxim
umqu
antifi
catio
nlim
its;dR/CcA
:recovery/concentrationaveraged;eR/Cp
A:recovery/compo
undaverage;
f RA:recoveryaverage;
g CI:confi
denceinterval.
6 Journal of Food Quality
Disclosure
Julia Arantes Galvao is currently at Department of VeterinaryMedicine, Federal University of Parana, 80035-050 Curitiba,PR, Brazil.
Competing Interests
The authors declare that they have no competing interests.
References
[1] M. LeDoux, “Analytical methods applied to the determinationof pesticide residues in foods of animal origin. A review of thepast two decades,” Journal of Chromatography A, vol. 1218, no. 8,pp. 1021–1036, 2011.
[2] Agencia Nacional de Vigilancia Sanitaria (ANVISA), Seminariovolta a discutir mercado de agrotoxicos em 2012, 2012, http://portal.anvisa.gov.br/.
[3] I. B. Geografia and E. De Estatıstica, Indicadores de desenvolvi-mento sustentavel: Brasil: 2015/IBGE, Coordenacao de RecursosNaturais e Estudos Ambientais, Estudos e Pesquisas. InformacaoGeografica No. 10, Coordenacao de Geografia, Rio de Janeiro,Brazil, 2015.
[4] STATISTA, Global egg production from 1990 to 2013, https://www.statista.com/statistics/263972/egg-production-worldwide-since-1990/.
[5] W. A.Moats, “Inactivation of antibiotics by heating in foods andother substrates—a review,” Journal of Food Protection, vol. 51,no. 6, pp. 491–497, 1988.
[6] Y. Xu, J. Ding, H. Chen et al., “Fast determination of sulfon-amides from egg samples using magnetic multiwalled carbonnanotubes as adsorbents followed by liquid chromatography–tandem mass spectrometry,” Food Chemistry, vol. 140, no. 1-2,pp. 83–90, 2013.
[7] N. Bilandzic, Ð. Bozic, B. S. Kolanovic, I. Varenina, L. Cvetnic,and Z. Cvetnic, “Distribution of sulfamonomethoxine andtrimethoprim in egg yolk and white,” Food Chemistry, vol. 178,pp. 32–37, 2015.
[8] S. Moscoso, F. S. De Los Santos, A. G. Andino, S. Diaz-Sanchez,and I. Hanning, “Detection of quinolones in commercial eggsobtained from farms in the Espaıllat Province in theDominicanRepublic,” Journal of Food Protection, vol. 78, no. 1, pp. 214–217,2015.
[9] European Commission, RASFF—Food and Feed SafetyAlerts—European Commission, 2016, https://webgate.ec.euro-pa.eu/rasff-window/portal/.
[10] Ministry of Agriculture, Livestock, and Food Supply, “Monitor-ing subprogram and exploratory subprogram of the nationalplan for the control of residues and contaminants—PNCRCof 2015,” Normative Instruction 13, Ministry of Agriculture,Livestock and Food Supply, Brasilia , Brazil, 2015.
[11] European Commission, “Commission Regulation (EU) No37/2010 of 22 December 2009 on pharmacologically activesubstances and their classification regarding maximum residuelimits in foodstuffs of animal origin,” Official Journal of theEuropean Union, vol. L 15/1, 2010.
[12] FAO. Food andAgricultureOrganization of theUnitedNations,FAO Statistical Pocketbook, Food and Agriculture Organizationof the United Nations, Rome, Italy, 2015.
[13] C. L.Queiroga, Analisadores demassa:QTRAP, Espectrometriade Massas: Princıpios E Aplicacoes, 2010, http://www.espectro-metriademassas.com.br.
[14] S. K. G. Grebe and R. J. Singh, “LC-MS/MS in the clinical labo-ratory—where to from here?” Clinical Biochemist Reviews, vol.32, no. 1, pp. 5–31, 2011.
[15] FAO/WHO. Food and Agriculture Organization of the UnitedNations, WHO. World Health Organization, Food Standards,Codex Alimentarius: pesticide residues in food and feed, 2013.
[16] EMEA, The European Agency for the Evaluation of MedicinalProducts Veterinary Medicines and Inspections, Committeefor VeterinaryMedicinal Products, Enrofloxacin, EMEA/MRL/820/02-FINAL, 2002.
[17] FAO/WHO—Food and Agriculture Organization of the UnitedNations.WHO.WorldHealthOrganization, International FoodStandards, Codex Alimentarius: Maximum Residue Limits(MRLs) and Risk Management Recommendations (RMRs) forresidues of veterinary drugs in foods, 2015.
[18] M. Machinski Jr., A. Benini, D. P. Neto et al., Medicamentosveterinarios utilizados na avicultura de postura no estado doParana, Curitiba: Programa Estadual de Controle de Resıduosde Medicamentos Veterinarios em Alimentos de Origem Ani-mal, PAMvet-PR, 2005.
[19] V. Goetting, K. A. Lee, and L. A. Tell, “Pharmacokineticsof veterinary drugs in laying hens and residues in eggs: areview of the literature,” Journal of Veterinary Pharmacology andTherapeutics, vol. 34, no. 6, pp. 521–556, 2011.
[20] T. Marmulak, L. A. Tell, R. Gehring, R. E. Baynes, T. W.Vickroy, and J. E. Riviere, “Egg residue considerations duringthe treatment of backyard poultry,” Journal of the American Vet-erinaryMedical Association, vol. 247, no. 12, pp. 1388–1395, 2015.
[21] M. Ribani, C. H. Collins, and C. B. G. Bottoli, “Validation ofchromatographic methods: evaluation of detection and quanti-fication limits in the determination of impurities in omepra-zole,” Journal of Chromatography A, vol. 1156, no. 1-2, pp. 201–205, 2007.
[22] SANCO, “Guidance document on analytical quality control andvalidation procedures for pesticide residues analysis in foodand feed,” Document SANCO/12571/2013, Health & ConsumerProtection Directorate-General, Brussels, Belgium, 2013.
[23] M. Feinberg, “Validation of analytical methods based on accu-racy profiles,” Journal of Chromatography A, vol. 1158, no. 1-2,pp. 174–183, 2007.
[24] G. A. Shabir, “Validation of high-performance liquid chromato-graphymethods for pharmaceutical analysis: understanding thedifferences and similarities between validation requirements ofthe US Food and Drug Administration, the US Pharmacopeiaand the International Conference on Harmonization,” Journalof Chromatography A, vol. 987, no. 1-2, pp. 57–66, 2003.
[25] FAO/ISRIC—Food and Agriculture Organization of the UnitedNations. ISRIC-International Soil Reference and InformationCentre, Guidelines for Quality Management in Soil and PlantLaboratories, (FAO Soils Bulletin—74). 7 Quality of AnalyticalProcedures, 1998.

Submit your manuscripts athttps://www.hindawi.com
Hindawi Publishing Corporationhttp://www.hindawi.com Volume 2014
Anatomy Research International
PeptidesInternational Journal of
Hindawi Publishing Corporationhttp://www.hindawi.com Volume 2014
Hindawi Publishing Corporation http://www.hindawi.com
International Journal of
Volume 2014
Zoology
Hindawi Publishing Corporationhttp://www.hindawi.com Volume 2014
Molecular Biology International
GenomicsInternational Journal of
Hindawi Publishing Corporationhttp://www.hindawi.com Volume 2014
The Scientific World JournalHindawi Publishing Corporation http://www.hindawi.com Volume 2014
Hindawi Publishing Corporationhttp://www.hindawi.com Volume 2014
BioinformaticsAdvances in
Marine BiologyJournal of
Hindawi Publishing Corporationhttp://www.hindawi.com Volume 2014
Hindawi Publishing Corporationhttp://www.hindawi.com Volume 2014
Signal TransductionJournal of
Hindawi Publishing Corporationhttp://www.hindawi.com Volume 2014
BioMed Research International
Evolutionary BiologyInternational Journal of
Hindawi Publishing Corporationhttp://www.hindawi.com Volume 2014
Hindawi Publishing Corporationhttp://www.hindawi.com Volume 2014
Biochemistry Research International
ArchaeaHindawi Publishing Corporationhttp://www.hindawi.com Volume 2014
Hindawi Publishing Corporationhttp://www.hindawi.com Volume 2014
Genetics Research International
Hindawi Publishing Corporationhttp://www.hindawi.com Volume 2014
Advances in
Virolog y
Hindawi Publishing Corporationhttp://www.hindawi.com
Nucleic AcidsJournal of
Volume 2014
Stem CellsInternational
Hindawi Publishing Corporationhttp://www.hindawi.com Volume 2014
Hindawi Publishing Corporationhttp://www.hindawi.com Volume 2014
Enzyme Research
Hindawi Publishing Corporationhttp://www.hindawi.com Volume 2014
International Journal of
Microbiology