Embed Size (px)
Citation preview
ICES mar. Sei. Symp., 193: 1. 1991
Multispecies Models Relevant to Management of Living Resources
Preface
Scientific quality is undoubtedly the most important aspect of a contribution to a symposium, but the value of a contribution is also greatly heightened by a vivid and stirring presentation, and the discussion it stimulates. In order to underline the importance of the latter in communicating scientific results, it was decided to give awards for the “best presentations” . On the basis of a plenary vote, the awards were presented to H. Gislason (paper) and to M. Tasker, R. Furness, M. Harris, and R. S. Bailey (poster) for their excellent use of audiovisual aids.
The Co-conveners would like to express their gratitude to J. Harwood (UK), A. Laurec (France), J. G. Pope (UK), and H. Sparholt (Denmark), who put great effort into the organization of the Symposium as mem
bers of the Steering Committee. In addition, they would like to thank the referees of the papers selected for publication for their invaluable contribution and expertise in formulating many suggestions for improvement. It seems only appropriate that the names of these scientists be listed here: R. S. Bailey, N. J. Bax, W. Brugge, S. Clark, E. B. Cohen, W. Dekker, W. Gabriel, S. Garcia, H. Gislason, J. Gulland, T. Helgason, J. R.G. Hislop, M. Holden, E. Houde, G. R. Lilly, J. McGlade, G. Magnusson, R. Marasco, B. M. van der Meer, S. Mehl, B. Mesnil, S. A. Murawski, W. J. Overholtz, O. K. Pâlsson, D. Pauly, E. K. Pikitch, J. G. Pope, J. E. Powers, J. C. Rice, A. Rosenberg, B. J. Rothschild, K. J. Sainsbury, F. M. Serchuk, T. Smith,H. Sparholt, W. Stobo, K. J. Sullivan, and C. Tucker.
1
ICES mar. Sci. Symp., 193: 147-152. 1991
Predation-controlled recruitment in the Bering Sea fish ecosystem
T. Laevastu and N. Bax
Laevastu, T., and Bax, N. 1991. Predation-controlled recruitment in the Bering Sea fish ecosystem. - ICES mar. Sei. Symp., 193: 147-152. t
Factors controlling recruitment to the exploitable stock, quantitative knowledge of them, and their relative magnitudes, are briefly reviewed. This review indicates that predation on eggs, larvae, and pre-fishery juveniles may be a major recruitment- controlling process in mid-latitude fish ecosystems. Predation in the Bering Sea fish ecosystem is evaluated numerically. This evaluation shows that predation on larvae and juveniles is the principal cause of fish mortality in the eastern Bering Sea. If this predation is prey-density dependent within the ecosystem, it can act to stabilize recruitment from year to year. Cod recruitment from 1978 to 1987 in the Bering Sea is given as an example. Changes in fishing patterns are suggested to affect the observed age composition of catches and thus apparent recruitment. The numerical methods of computation of recruitment and predation in biomass-based fish ecosystem simulations are briefly described, their interactions explained, and the advantages and shortcomings of recruitment forecasts explored.
T. Laevastu and N. Bax: NMFS, Alaska Fisheries Science Center, 7600 Sand Point Way NE, Seattle, WA 98115, USA.
Processes controlling recruitment
Recruitment to the exploitable part of a stock is defined as the numbers of young fish surviving to recruit to the fishery. In this paper we review the processes which may affect the survival of young fish. Some of the processes and factors affecting recruitment are listed in Table 1. Each factor affects recruitment to various degrees depending on species, region, and year. Quantitative evaluation of these effects is difficult, especially determination of the effect of the environment on early life history stages (Laevastu et al., 1988), which has frequently been considered the main cause of recruitment variation. Several environmental effects on recruitment could be mediated via predation, such as the effect of temperature on growth and food requirements. Some of the environmental effects influencing advection and migration also relate to predation because of their impact on the joint distribution of predator and prey.
Some causes of mortalities in fish and their relative magnitudes are presented in Table 2. Quantitative knowledge on mortalities is quite incomplete. However, recent stomach analyses and ecosystem simulations suggest that predation might be one of the main processes controlling juvenile abundance and thus recruitment (e.g. Sissenwine et a i, 1984; Gislason and Helga- son, 1985).
The effects and importance of predation on fish mor
talities and on fish ecosystem dynamics in general can be evaluated with numerical ecosystem simulation. Among the essential basic input data to these simulations are food composition data (from stomach content analyses),
Table 1. Determinants of recruitment (a general summary).
Process/condition State of knowledge
SpawningSize of spawning stock
Egg survival and hatching Turbulence (e.g. by storms) Temperature anomalies
Larvae (survival)Starvation
Predation
Transport
Prefishery juveniles Predation
Other mortalities
Emigration/immigration
Great variability in S/R relationEffects known, little
quantified, but usually small.
Might occur, but not a major factor.
Evidence indicates that it might be major factor in larval mortality.
Little quantified, variable in space and time.
Recent analyses and multispecies research show predation to be main process controlling juvenile abundance.
Less quantified than predation (see Table 2).
Magnitude and variability little known.
147
Tabic 2. Mortalities in fish stocks (Laevastu and Favorite, 1988, modified).
Mortalities Relative magnitude
Natural mortalitiesPredation In most cases the largest
component of naturalmortality
Senescent or spawning May be largest component ofstress mortality in older age
classesDiseases Little known, assumed smallStarvation Increases susceptibility to
predationMorphologically Probably minor, although see
malformed larvae Kaufman (1966), Blaxter(1968), Vladimirov (1975)
Environmental extremesCold Occurs seldomOxygen (lack of) Rare local occurrencePollution Small, local (e.g. estuaries)
Fishing (mortality) None to very large, dependson intensity of fishing
food requirements, growth rates, and the total species composition of the ecosystem (which is one of the determinants of the availability and relative density of food items). The PROBUB ecosystem simulation for the eastern Bering Sea (Laevastu and Larkins, 1981), pertaining to the year 1980, was used in this study. The model was modified to allow substitution of "basic food” (zooplankton and benthos) for preferred prey items if the seasonal abundance of "basic food” permitted this and preferred prey items were unavailable. Otherwise partial starvation was permitted to occur and to affect growth rates. The simulation was run in seasonal time steps to an internally consistent equilibrium, which was reached when the removal of biomasses by predation, other mortalities, and fishing equaled biomass production.
Some of the results from ecosystem simulation for the eastern Bering Sea pertaining to predation are shown in Tables 3 to 5 and Figure 1. The standing stocks and annual consumption of marine ecological groups (fish, zooplankton, and macrobenthos) in the eastern Bering Sea and Aleutians are shown in Table 3. Fish are further divided into three additional ecological groups in Table 4. Annual predation rate, or predation to biomass ratio,
Table 3. Standing stocks and annual consumption in the eastern Bering Sea and Aleutian Region.
Ecological group
Annual mean
Standing stock Consumption
t (mill.) % t (mill.) %
Fish1 33.2 32.8 21.4 21.8Zooplankton 53.3 52.6 62.4 63.5Epifauna 8.5 8.4 8.0 8.2Infauna 6.3 6.2 6.0 6.5
'including squids, 0.53 million tonnes and crab, 1.35 million tonnes.
is computed as total annual predation divided by the annual mean standing stock. More detailed data on annual production, mortalities, food composition, and predation on cod are given in Table 5.
The predominance of predation over other mortalities is indicated by the observation that of the annual growth of biomass (or biomass production) of cod, 74% is removed by fish predation, the main predator being pollock which is the most abundant species in the Bering Sea. Mammals eat 9% of the annual production of cod. Cod is one of the major piscivores in the eastern Bering Sea, with fish constituting 35% of its food.
Considering that predation is by far the greatest component of mortality of fish and that it operates mainly on larvae and juveniles, it becomes obvious that predation will materially affect the recruitment in most species in the eastern and central Bering Sea. Predation rate depends on the relative sizes of predator and prey, their relative (size specific) abundance, and the availability of alternative prey; thus predation is dependent on the relative density of prey items. Consequently, if recruitment were mainly affected by predation, it would vary relatively little from year to year; long-term trends would be evident when the ecosystems composition changes. To test this hypothesis, the variation in recruitment of cod in the eastern Bering Sea is considered in the next section.
Fish constitutes about 22% of the food of the fish in the eastern Bering Sea ecosystem (Fig. 1). Consequently the carrying capacity of a given ocean region with a high standing stock of fish depends not only on the pro
Table 4. Standing stocks, annual growth rate (production to biomass ratio), and predation rate (predation to biomass ratio) of fish ecosystem components in the eastern Bering Sea and Aleutian Region (area 900000 km2).
Fish ecosystem component
Annual mean
Standing stock t (mill.)
Growth rate (per unit biomass)
Predation rate (per unit biomass)
Pelagic fish and squids 4.8 1.07 0.84Scmipelagic fish 17.6 0.84 0.68Demersal fish and crabs 10.9 0.60 0.50
148
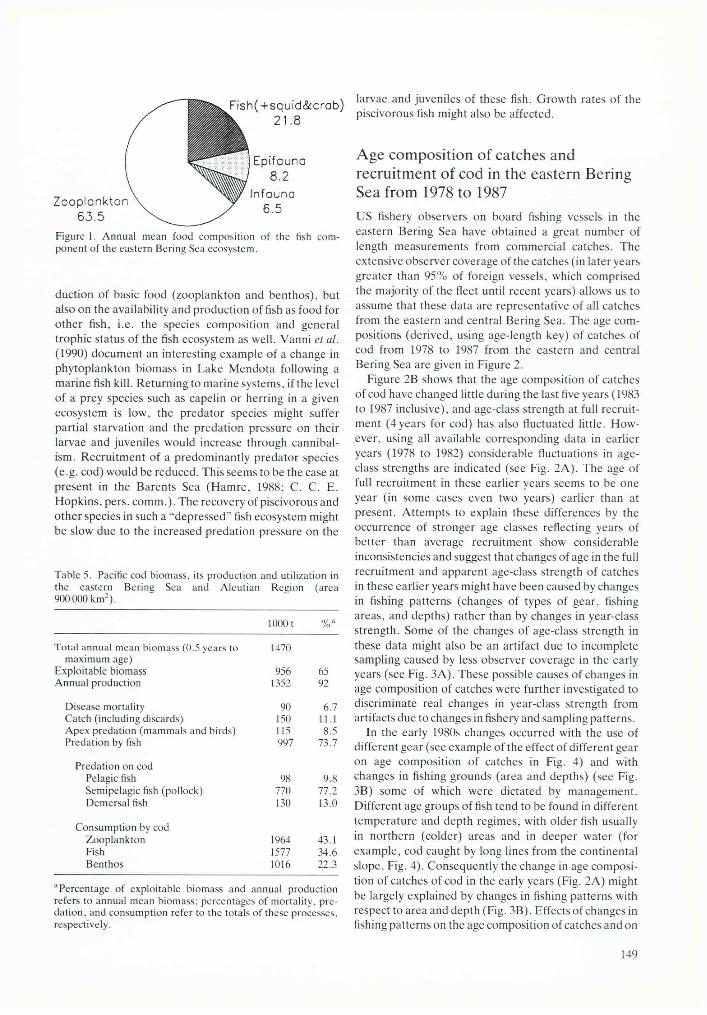
Fish( + squid&crab) 21.8
Zooplankton6 3 .5
Epifauna8.2
Infauna6 .5
larvae and juveniles of these fish. Growth rates of the piscivorous fish might also be affected.
Figure 1. Annual mean food composition of the fish component of the eastern Bering Sea ecosystem.
duction of basic food (zooplankton and benthos), but also on the availability and production of fish as food for other fish, i.e. the species composition and general trophic status of the fish ecosystem as well. Vanni et al. (1990) document an interesting example of a change in phytoplankton biomass in Lake Mendota following a marine fish kill. Returning to marine systems, if the level of a prey species such as capelin or herring in a given ecosystem is low, the predator species might suffer partial starvation and the predation pressure on their larvae and juveniles would increase through cannibalism. Recruitment of a predominantly predator species (e.g. cod) would be reduced. This seems to be the case at present in the Barents Sea (Hamre, 1988; C. C. E. Hopkins, pers. comm.). The recovery of piscivorous and other species in such a “depressed” fish ecosystem might be slow due to the increased predation pressure on the
Table 5. Pacific cod biomass, its production and utilization in the eastern Bering Sea and Aleutian Region (area 900000 km2).
10001 % a
Total annual mean biomass (0.5 years to 1470maximum age)
Exploitable biomass 956 65Annual production 1352 92
Disease mortality 90 6.7Catch (including discards) 150 11.1Apex predation (mammals and birds) 115 8.5Predation by fish 997 73.7
Predation on codPelagic fish 98 9.8Semipelagic fish (pollock) 770 77.2Demersal fish 130 13.0
Consumption by codZooplankton 1964 43.1Fish 1577 34.6Benthos 1016 22.3
a Percentage of exploitable biomass and annual production refers to annual mean biomass; percentages of mortality, predation, and consumption refer to the totals of these processes, respectively.
Age composition of catches and recruitment of cod in the eastern Bering Sea from 1978 to 1987
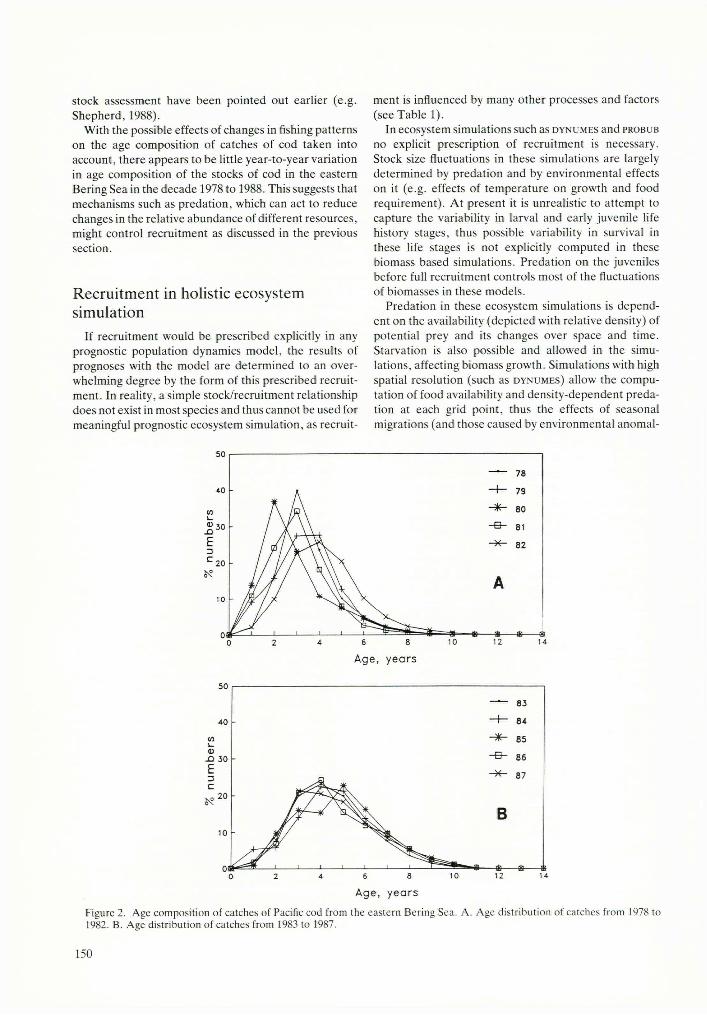
US fishery observers on board fishing vessels in the eastern Bering Sea have obtained a great number of length measurements from commercial catches. The extensive observer coverage of the catches (in later years greater than 95% of foreign vessels, which comprised the majority of the fleet until recent years) allows us to assume that these data are representative of all catches from the eastern and central Bering Sea. The age compositions (derived, using age-length key) of catches of cod from 1978 to 1987 from the eastern and central Bering Sea are given in Figure 2.
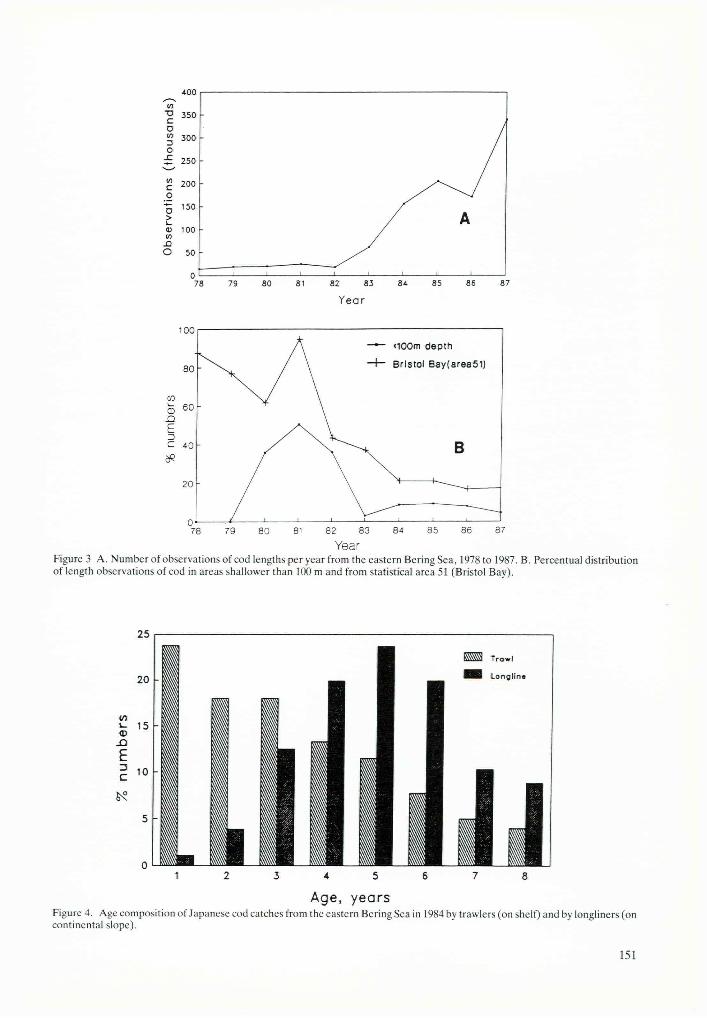
Figure 2B shows that the age composition of catches of cod have changed little during the last five years (1983 to 1987 inclusive), and age-class strength at full recruitment (4 years for cod) has also fluctuated little. However, using all available corresponding data in earlier years (1978 to 1982) considerable fluctuations in age- class strengths are indicated (see Fig. 2A). The age of full recruitment in these earlier years seems to be one year (in some cases even two years) earlier than at present. Attempts to explain these differences by the occurrence of stronger age classes reflecting years of better than average recruitment show considerable inconsistencies and suggest that changes of age in the full recruitment and apparent age-class strength of catches in these earlier years might have been caused by changes in fishing patterns (changes of types of gear, fishing areas, and depths) rather than by changes in year-class strength. Some of the changes of age-class strength in these data might also be an artifact due to incomplete sampling caused by less observer coverage in the early years (see Fig. 3A). These possible causes of changes in age composition of catches were further investigated to discriminate real changes in year-class strength from artifacts due to changes in fishery and sampling patterns.
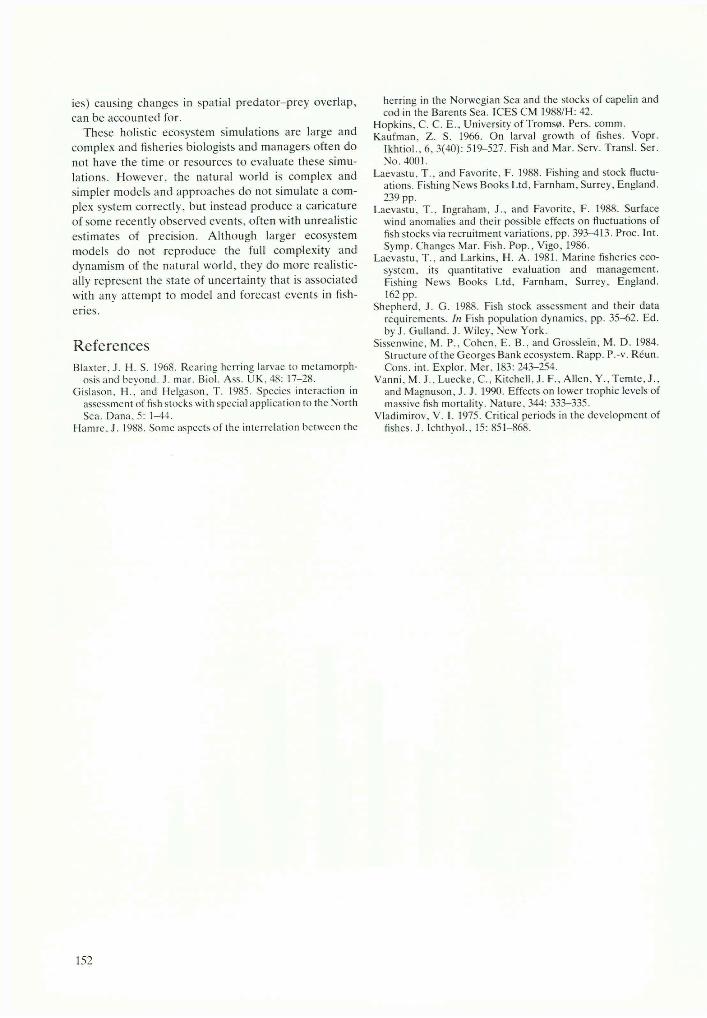
In the early 1980s changes occurred with the use of different gear (see example of the effect of different gear on age composition of catches in Fig. 4) and with changes in fishing grounds (area and depths) (see Fig. 3B) some of which were dictated by management. Different age groups of fish tend to be found in different temperature and depth regimes, with older fish usually in northern (colder) areas and in deeper water (for example, cod caught by long lines from the continental slope, Fig. 4). Consequently the change in age composition of catches of cod in the early years (Fig. 2A) might be largely explained by changes in fishing patterns with respect to area and depth (Fig. 3B). Effects of changes in fishing patterns on the age composition of catches and on
149
stock assessment have been pointed out earlier (e.g. Shepherd, 1988).
With the possible effects of changes in fishing patterns on the age composition of catches of cod taken into account, there appears to be little year-to-year variation in age composition of the stocks of cod in the eastern Bering Sea in the decade 1978 to 1988. This suggests that mechanisms such as predation, which can act to reduce changes in the relative abundance of different resources, might control recruitment as discussed in the previous section.
Recruitment in holistic ecosystem simulation
If recruitment would be prescribed explicitly in any prognostic population dynamics model, the results of prognoses with the model are determined to an overwhelming degree by the form of this prescribed recruitment. In reality, a simple stock/recruitment relationship does not exist in most species and thus cannot be used for meaningful prognostic ecosystem simulation, as recruit
ment is influenced by many other processes and factors (see Table 1).
In ecosystem simulations such as d y n u m e s and p r o b u b
no explicit prescription of recruitment is necessary. Stock size fluctuations in these simulations are largely determined by predation and by environmental effects on it (e.g. effects of temperature on growth and food requirement). At present it is unrealistic to attempt to capture the variability in larval and early juvenile life history stages, thus possible variability in survival in these life stages is not explicitly computed in these biomass based simulations. Predation on the juveniles before full recruitment controls most of the fluctuations of biomasses in these models.
Predation in these ecosystem simulations is dependent on the availability (depicted with relative density) of potential prey and its changes over space and time. Starvation is also possible and allowed in the simulations, affecting biomass growth. Simulations with high spatial resolution (such as d y n u m e s) allow the computation of food availability and density-dependent predation at each grid point, thus the effects of seasonal migrations (and those caused by environmental anomal-
50
80
- e - a i
- X - 82
30_Q
20
Age, years
50
84
85
- B - 86
- X - 87
40
-Q 30
20
Age, yea rs
Figure 2. Age composition of catches of Pacific cod from the eastern Bering Sea. A. Age distribution of catches from 1978 to 1982. B. Age distribution of catches from 1983 to 1987.
150
400
350
300
250
200
150
100
50
084 85 86 8778 79 80 81 82 83
Y ear
100
<100m depth
Bristol Bay(area5l )
n
40
20
85 8683 8480
YearFigure 3 A. Number of observations of cod lengths per year from the eastern Bering Sea, 1978 to 1987. B. Percentual distribution of length observations of cod in areas shallower than 100 m and from statistical area 51 (Bristol Bay).
Lon g l ln e
1 2 3 4 5 6 7 8
Age, yearsFigure 4. Age composition of Japanese cod catches from the eastern Bering Sea in 1984 by trawlers (on shelf) and by longliners (on continental slope).
151
ies) causing changes in spatial predator-prey overlap, can be accounted for.
These holistic ecosystem simulations are large and complex and fisheries biologists and managers often do not have the time or resources to evaluate these simulations. However, the natural world is complex and simpler models and approaches do not simulate a complex system correctly, but instead produce a caricature of some recently observed events, often with unrealistic estimates of precision. Although larger ecosystem models do not reproduce the full complexity and dynamism of the natural world, they do more realistically represent the state of uncertainty that is associated with any attempt to model and forecast events in fisheries.
ReferencesBlaxter, J. H. S. 1968. Rearing herring larvae to metamorph
osis and beyond. J. mar. Biol. Ass. UK, 48: 17-28.Gislason. H., and Helgason, T. 1985. Species interaction in
assessment of fish stocks with special application to the North Sea. Dana, 5: 1—44.
Hamre, J. 1988. Some aspects of the interrelation between the
herring in the Norwegian Sea and the stocks of capelin and cod in the Barents Sea. ICES CM 1988/H: 42.
Hopkins, C. C. E ., University of Tromsø. Pers. comm. Kaufman, Z. S. 1966. On larval growth of fishes. Vopr.
Ikhtiol., 6, 3(40): 519-527. Fish and Mar. Serv. Transi. Ser. No. 4001.
Laevastu, T., and Favorite, F. 1988. Fishing and stock fluctuations. Fishing News Books Ltd, Farnham, Surrey, England. 239 pp.
Laevastu, T., Ingraham, J., and Favorite, F. 1988. Surface wind anomalies and their possible effects on fluctuations of fish stocks via recruitment variations, pp. 393-413. Proc. Int. Symp. Changes Mar. Fish. Pop., Vigo, 1986.
Laevastu, T ., and Larkins, H. A. 1981. Marine fisheries ecosystem. its quantitative evaluation and management. Fishing News Books Ltd, Farnham, Surrey, England.162 pp.
Shepherd, J. G. 1988. Fish stock assessment and their data requirements. In Fish population dynamics, pp. 35-62. Ed. by J. Gulland. J. Wiley, New York.
Sissenwine. M. P., Cohen, E. B., and Grosslein, M. D. 1984. Structure of the Georges Bank ecosystem. Rapp. P.-v. Réun. Cons. int. Explor. Mer, 183: 243-254.
Vanni, M. J.. Luecke, C., Kitchcll. J. F., Allen, Y., Tcmte, J., and Magnuson, J. J. 1990. Effects on lower trophic levels of massive fish mortality. Nature, 344: 333-335.
Vladimirov, V. I. 1975. Critical periods in the development of fishes. J. Ichthyol., 15: 851-868.
152