Embed Size (px)
Citation preview

Computers and Electronics in Agriculture 57 (2007) 177–189
Multispectral detection of organic residues on poultryprocessing plant equipment based on hyperspectral
reflectance imaging technique�
Byoung-Kwan Cho 1, Yud-Ren Chen ∗, Moon S. KimInstrumentation and Sensing Laboratory, U.S. Department of Agriculture, Agricultural Research Service,
Henry A. Wallace Beltsville Agricultural Research Center, Building 303, BARC-East,10300 Baltimore Avenue, Beltsville, MD 20705, USA
Received 19 May 2006; received in revised form 27 February 2007; accepted 9 March 2007
Abstract
Diluted organic residues, such as feces, ingesta and other biological substances on poultry processing plant equipment surfaces,not easily discernible by human eye, are potential contamination sources for poultry carcasses. Development of sensitive detectionmethods for diluted organic residues is essential to ensure safe production of poultry carcasses. Hyperspectral imaging techniqueshave shown good potential for detecting the presence of fecal and other biological contaminants on food and processing equipmentsurfaces. In this study, the use of high spatial resolution hyperspectral reflectance is presented as a tool for selecting a few multispectralbands to detect diluted organic residues on the surface of materials used for manufacturing processing equipment. Reflectanceimaging methods were explored for use in the detection of a range of diluted organic residues for both wet and dry conditions.Results showed that low concentrations of wet and dry residues, diluted up to 1:100 by weight with double distilled water, could bedifferentiated from stainless steel background with accuracies of 94.0 and 99.7%, respectively. Spectral bands determined in thisstudy could be used for developing a multispectral inspection system for sanitation monitoring of poultry processing plants.© 2007 Elsevier B.V. All rights reserved.
Keywords: Hyperspectral; Multispectral; Reflectance image; Fecal contamination
1. Introduction
The importance of safe and secure production of food commodities has been increasingly recognized in the currentmass production environment of the meat industry. Food-related illnesses are mainly caused by bacteria, which areoften transmitted through fecal matter and ingesta on meat and poultry (FSIS, 2004; FDA, 2001). Undercooked ormishandled meat and poultry carrying pathogens such as E. coli O 157:H7, salmonella, and listeria can cause serioushuman illness and even death (Cody et al., 1999; Mead et al., 1999). Inspection regulations of the United States
� Mention of trade names or commercial products is solely for the purpose of providing specific information and does not imply endorsement orrecommendation by the USDA.
∗ Corresponding author. Tel.: +1 301 504 8450; fax: +1 301 504 9466.E-mail address: [email protected] (Y.-R. Chen).
1 Present address: Bioindustrial Machinery Engineering Department, Division of Bioresource Engineering, College of Agriculture and LifeScience, Chungnam National University, 220 Gung-Dong, Yusung-Gu, Daejeon 305-764, South Korea.
0168-1699/$ – see front matter © 2007 Elsevier B.V. All rights reserved.doi:10.1016/j.compag.2007.03.008

178 B.-K. Cho et al. / Computers and Electronics in Agriculture 57 (2007) 177–189
Department of Agriculture (USDA), Food Safety and Inspection Service (FSIS), require that unwholesome poultryproducts, which may be contaminated with human pathogens, be removed from processing lines.
During poultry processing operations, bird carcasses and processing equipment can be contaminated with ingestafrom the stomach (proventriculus/gizzard), and with feces from the intestines, through incidental ruptures of thedigestive tract. These contaminants may contain human pathogens and can cause cross-contamination of subsequentcarcasses on the processing line. Research efforts have been made to develop optical sensing technologies that candetect fecal and ingesta residues on poultry carcasses (Park et al., 2002, 2005). However, sanitation monitoring forequipment surfaces during and after processing is also needed to reduce cross-contamination to comply with zerotolerance of contaminant free production. Diluted fecal and ingesta residues on processing equipment, in either wetor dry conditions and not easily discernable from water and background by human eye, pose contamination risks forpoultry carcasses. Hence, the development of sensitive detection methods for fecal and ingesta residues is essential toensure the safe processing of wholesome poultry products.
Recently, hyperspectral imaging techniques have been found useful for food safety applications such as the deter-mination of a few key spectral bands for multispectral detection of contamination on food surfaces. The processingtimes typically needed for the large volumes of data acquired by hyperspectral imaging make its use impractical forreal-time inspection at food processing plants. However, research has shown multispectral imaging to be well suitedfor such inspection operations, including multiple studies by USDA Agricultural Research Service (ARS) laboratories.Detection methods for fecal and ingesta contamination on poultry carcasses using visible (Vis) and near-infrared (NIR)multispectral reflectance imaging techniques derived from hyperspectral imaging studies were studied by researchersat the ARS Russell Research Center in Athens, Georgia. Results indicated that using band ratios of images at 565 and517 nm, fecal and ingesta matter could be discriminated from poultry carcasses with approximately 92.5% accuracy(Park et al., 2002, 2005). The ARS Instrumentation and Sensing Laboratory (ISL) in Beltsville, Maryland, successfullydemonstrated the detection of cattle feces on apples using hyperspectral fluorescence imaging (Kim et al., 2002). ISLresearchers showed that multispectral imaging using two to four fluorescence emission bands was sufficient to detectfeces on apples.
In this study, hyperspectral imaging is used to investigate the feasibility of multispectral reflectance imaging tech-niques for the detection of diluted poultry residues, specifically feces and ingesta, and other product residues, such asblood, skin, meat, fat, and smeared fluids from poultry skin, on poultry processing equipment surfaces. The contami-nants on equipment surfaces may be found in either wet or dry conditions, contingent upon the length of time elapsedbetween cessation of operations and sanitation inspection, such as short breaks within a shift or overnight plant shutdowns. The objective of this study was to determine the optimal wavebands and classification algorithms to detectand discriminate between diluted residues in wet and dry conditions on the surface of poultry processing equipment.Findings in this study can potentially be used for developing low-cost and wearable/portable multispectral imagingdevices for sanitation monitoring of processing equipment in poultry processing plants.
2. Materials and methods
2.1. Materials
Fecal and ingesta samples were obtained from the digestive tracts of approximately 40 fresh chicken carcasses at achicken processing plant in Cordova, Maryland, from June to November 2005. Single samples of skin, meat, and fatwere extracted from each of 24 chicken carcasses. Blood samples were also collected from 24 chickens. The sampleswere placed in plastic bags, covered with ice, and transported to the ISL facility within 2 h. For this study, essentialcontrol variables affecting the composition of fecal and ingesta samples are listed in Table 1.
Fecal matter from the colon, ceca, small intestine, and duodenum, and ingesta from the proventriculus and gizzard,were collected in plastic containers. The dry matter content was measured to be 274.0 ± 56 �g/g wet base for ingesta,and to be 149.0 ± 18, 161.0 ± 21, and 180.0 ± 21 �g/g wet base, for feces from the duodenum, small intestine, andceca, respectively. Note that the dry matter content for fecal matter from the colon was not obtained due to insufficientsample quantity. Each fecal and ingesta sample was diluted 1:5, 1:10, 1:50, and 1:100 by weight with double distilled(DD) water. Using a pipette with approximately 2 mm of the tip removed to accommodate particulates, 50 �l dropsof undiluted and diluted fecal matter, ingesta, and DD water were then applied to the surface of stainless steel sheets(S30200, Allegheny Ludlum, Pittsburgh, PA, USA) commonly used for manufacturing poultry processing equipment.

B.-K. Cho et al. / Computers and Electronics in Agriculture 57 (2007) 177–189 179
Table 1Control variables and corresponding fixed values for the experiments
Control variables Values
Bird 7 week male and femaleDiet Soybean mealFeed withdrawal 10 hWater withdrawal 10 h
Blood samples were also applied in 50 �l drops. Approximately 8 mm diameter pieces of skin, meat, and fat werecut from poultry carcasses using a scalpel and gently placed on the stainless steel plate. Smeared spots were madeby smearing a piece of poultry skin on the surface of the stainless steel plate. The sample residues which did notoriginate from within the digestive tract, i.e. the poultry blood, skin, meat, fat, and smeared organic fluid were named“product residues” to differentiate from the contaminant residues, i.e. fecal matter and ingesta. After collecting initialhyperspectral images of the steel plates with freshly applied (wet) sample residues, the samples were allowed to airdry at room temperature in the laboratory for a minimum of 24 h, after which images were acquired of the steel plateswith the dried sample residues.
2.2. Hyperspectral imaging system
A schematic diagram of the ISL hyperspectral imaging system is shown in Fig. 1. It consists of a 16-bit digital imager,a spectrograph, and a lens along with a sample transport mechanism and lighting sources. The digital imager contains athermo-electrically cooled (three-stage Peltier device), electron multiplying charge-coupled device (EMCCD) with 288(V) × 560 (H) pixels (DV465-FL, Andor Technology Limited, South Windor, CT, USA). The line-scan spectrograph(ImSpector V9, Spectral Imaging Ltd., Oulu, Finland) is based on prism-grating-prism (PGP) optics and is coupled toan f1.4 C-mount lens (Rainbow CCTV S6X11, International Space Optics, S.A., Irvine, CA, USA). The spectrographdisperses incoming radiation from each spatial location on the scan line across the spectral dimension. The sample isscanned line-by-line with spectral range in the visible to NIR from 425.7 nm to 951.2 nm with about 4.5 nm intervals(112 wavebands). Note that for this investigation, 101 wavebands spanning the region from 450 to 900 nm were used.A programmable, precision positioning table (NF90-Bislide, Velmex Inc., Bloomfield, NY, USA) moves samplestransversely through the linear field of view (FOV). The use of a programmable positioning table allows geo-spatiallyidentical sample images for reflectance measurements acquired independently. The system was designed to capturereflectance measurements for samples up to 30 cm wide. For each line scan, the positioning table was incrementedby 0.5 mm. Two 21 V, 150 W halogen lamps powered by regulated DC power supplies were used as the illuminatinglight source for the reflectance measurements. Light from the lamps are transmitted through optical fiber-bundles that
Fig. 1. Schematic illustration of the hyperspectral imaging system.
180 B.-K. Cho et al. / Computers and Electronics in Agriculture 57 (2007) 177–189
are arranged in a line (30-cm long) at the exit-end to illuminate the narrow line of the FOV. Two line lights illuminatethe FOV at 5◦ forward and backward angles to minimize shadows caused by samples with three-dimensional features.Interface software was developed using Visual Basic (Version 6.0, Microsoft, Seattle, WA) operating in a MS Windowsenvironment to control the EMCCD camera system and acquire image data. Individual line-scan data were saved ina 16-bit binary format along with a header file (per set) containing imaging parameter information. A white diffusereflectance reference panel (Spectralon by Labsphere, North Sutton, NH) was used to calculate relative reflectancevalues (R). An R (%) for an individual pixel (i) at a given wavelength was calculated using the following equation:
Ri = RSi − RDi
RRi − RDi
× 100 (1)
where RS, RD, and RR are the raw intensity values of an individual pixel from the sample image, dark current image,and white reference, respectively. The exposure times of the CCD and the light intensities were adjusted so that themaximum intensity level of the diffuse reference panel was approximately one third of the full dynamic range. For adetailed description of spectral and spatial calibration procedures of the ISL hyperspectral imaging system, refer toKim et al. (2001)
2.3. Image processing
Matlab software (version 7.0.4, The Mathworks, Natick, MA) was used to process hyperspectral images and toperform analyses. To reduce the image data volume to be analyzed and to increase the signal-to-noise ratio, spatialbinning of 3 × 3 was used. The region of interest (ROI) used for each sample residue area consisted of approximately 50binned pixels. Spectral information of each binned pixel in the selected ROI was saved for use in determining optimalwavebands and threshold values. This study focused on selecting a single optimal waveband and also a two-wavebandratio that could be applied toward developing low-cost, portable or wearable imaging devices. Selection was basedon F values of ANOVA between two groups of interest for classification, such as organic residues versus inorganicsamples (stainless steel or water), or contaminant residues versus product residues. Following the waveband selection,the optimal global threshold value at which the classification accuracy was highest was determined by investigatingiterative threshold increments of 0.01.
A total of over 60,000 3 × 3 binned pixel spectra were available. Over 10,000 of these 60,000 pixel spectra werefrom stainless steel surfaces. To avoid bias, equal sample sizes for individual groups were maintained. To evaluateclassification accuracies for differentiating residues (including both contaminant and product residues) from stainlesssteel background, a data set of 45,000 randomly selected spectra was used, while for differentiating contaminantresidues from product residues, a data set of 8000 randomly selected spectra was used for wet and dry conditions,respectively. For both data sets, 80% of the data was used for calibration and the remaining 20% for validation.
3. Results and discussion
3.1. Classification of wet contaminant and product residues
Preliminary evaluation of the images showed that some of the diluted samples and DD water exhibited specularresponses at all wavelengths under investigation. The image on the left in Fig. 2 shows the reflectance image at 469 nmof representative ceca samples (1:5, 1:50, and 1:100 dilution) and DD water on the stainless steel plate. Fig. 2 showsthat specular effects of the line lights are visible for the 1:100 freshly diluted ceca sample and for DD water. Meanreflectance spectra of the ROIs in the image are also shown in Fig. 2, including specular and non-specular regionsof freshly diluted feces and DD water drop samples, and stainless steel surface. The spectra show that the relativereflectance for specular regions of the samples was higher than 100% (relative to the reflectance of the white referencepanel) at all wavelengths. Even the non-shiny stainless steel surfaces showed specular reflectance characteristics, asevidenced by higher than 100% reflectance. Several factors, such as the sample geometry, illumination and sensorview angles, can also affect the observed reflectance, especially for that of the specular samples. Since the R valuesof diluted feces fell within the same range of R values for stainless steel, specular ceca and water, and water at theboundary region, it was difficult to discriminate the diluted fecal matter using a single waveband.

B.-K. Cho et al. / Computers and Electronics in Agriculture 57 (2007) 177–189 181
Fig. 2. Representative mean spectra of 1:5 (�) and 1:50 diluted (©) non-specular and specular regions of 1:100 diluted ceca (�), specular (�) andedge region (�) of DD water drop, and stainless steel surface (�).
Fig. 3a shows representative spectra of undiluted feces and ingesta samples. The shapes of the spectra were similarto those of the previous study (Park et al., 2005); however, R values were relatively higher due to the light scatteringfrom the surrounding specular background. The feces and ingesta spectra exhibited absorption features in the visibleregion that may be associated with the feedstuff. A study has shown that protoporphrin IX is a major constituent foundin chicken feces that can affect the spectral shapes (Kim et al., 2003). In general, R values of fecal matter varied withthe location within the digestive tract from which the fecal matter originated. Representative mean spectra of productresidues (blood, skin, meat, fat, and skin smear) are shown in Fig. 3b. The R values of skin smear (a transparent coating)resembled the stainless steel since the incident light is minimally absorbed through the thin oily film. The spectrumof blood shows high absorption at wavelengths shorter than red. The absorption characteristics of oxymyoglobin wereobserved at around 545 and 580 nm (Liu et al., 2000). The above observations suggest that when using a single spectralband, detection and classification of fecal contamination may be difficult due to the transparency and specular natureof samples placed on highly reflective background surfaces.
Results based on the analyses of single R bands were not found to be useful and were omitted for brevity. F values ofone-way ANOVA for the residues and background materials (stainless steel and water) were calculated for all possible
Fig. 3. Representative mean spectra of wet (a) poultry fecal and ingesta contaminant residues and (b) poultry product residues.
182 B.-K. Cho et al. / Computers and Electronics in Agriculture 57 (2007) 177–189
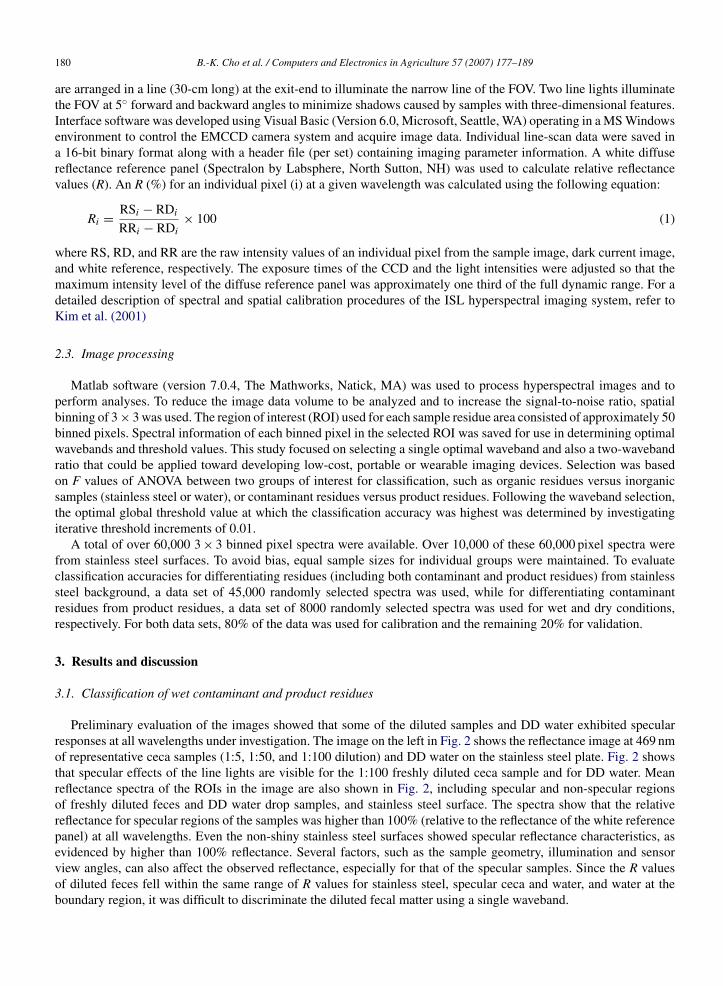
Fig. 4. Wavebands and threshold value selection. (a) F values for wavelength pairs used for discriminating wet residues from stainless steel andwater, and (b) classification accuracy as a function of R895/R469 band ratio threshold value, with frequency histogram for ratio values of wetresidues and water/stainless steel background. (c) F values for wavelength pairs used for discriminating wet contaminant residues from wet productsresidues, and (d) classification accuracy as a function of R580/R527 band ratio threshold value with frequency histogram for ratio values of wetcontaminant residues and wet product residues.
two-waveband combinations in the 450–900 nm region to find the best waveband ratio pair for discriminating wetresidues from the background. A larger F value indicates a more statistically significant mean separation between thetwo groups. Fig. 4a shows a contour plot of the F values obtained from ANOVA for the residues and backgroundgroups. The result shows that the means of the two groups were most significantly separated by a two-band ratio at 469and 895 nm wavelengths (R895/R469). Ratio values of the residues (contaminant and product) at these two wavebandswere significantly higher than those of stainless steel and water background. Classification accuracy was then calculatedfor each value within the range of that band ratio to find an optimal threshold value. To find an optimal threshold ratiovalue for separating wet residues from steel and water, classification accuracies were calculated for values across therange of ratio values. Fig. 4b shows a plot of classification accuracy as a function of R895/R469 used as the thresholdfor classification. Results indicated that for the R895/R469 band ratio, the highest classification accuracy (91.8%) forresidues versus stainless steel and water was obtained by using a threshold value of 1.07. This observation is illustratedby the frequency histogram; although the two groups show overlap due to the large variation in ratio values for the residuegroups, the relatively low ratio values, mostly from stainless steel and water samples, are largely grouped together witha peak value at 1.025 in contrast to the wider spread of a higher ratio values for the contaminant and product residues.

B.-K
.Cho
etal./Com
putersand
Electronics
inA
griculture57
(2007)177–189
183Table 2Validation results of classification for wet samples
Class Type Dilution Residues vs. background Contaminant vs. product residues
Corra Incorrb % Accuracy Corra Incorrb % AccuracyBackground Water – 334 533 38.5
Stainless steel – 3626 7 99.8Total (background) 3960 540 88.0
ResiduesContaminant residues
Colon None 128 0 100 12 18 40.01:5 161 0 100 12 21 36.41:10 134 1 99.3 18 17 51.41:50 130 5 96.3 21 7 75.01:100 136 12 91.9 18 11 62.1Total 689 18 97.5 81 74 52.3
Ceca None 125 0 100 4 14 22.21:5 106 5 95.5 3 19 13.61:10 120 3 97.6 6 10 37.51:50 120 3 97.6 12 6 66.71:100 111 8 93.3 12 4 75.0Total 582 19 96.8 37 53 41.1
Small intestine None 155 0 100 22 8 73.31:5 204 0 100 47 3 94.01:10 204 1 99.5 37 3 92.51:50 168 17 90.8 33 7 82.51:100 137 33 80.6 22 15 59.5Total 868 51 94.5 161 36 81.7
Duodenum None 161 3 98.2 26 3 89.71:5 192 2 99.0 41 8 83.71:10 197 4 98.0 36 5 87.81:50 158 23 87.3 20 14 58.81:100 151 27 84.8 25 10 71.4Total 859 59 93.6 148 40 78.7
Ingesta None 177 5 97.3 20 17 54.11:5 176 2 98.9 35 7 83.31:10 167 13 92.8 27 8 77.11:50 120 46 72.3 19 11 63.31:100 92 48 65.7 10 16 38.5Total 732 114 86.5 111 59 65.3
Total (contaminant residues) – 538 262 67.3
Product residuesBlood None 132 1 99.2 194 0 100Skin – 91 2 97.8 141 0 100Meat – 82 0 100 128 11 92.1Fat – 81 7 92.0 157 1 99.4Smeared – 113 0 100 146 22 86.9Total (product residues) 499 10 98.0 766 34 95.8
Total (residues) 4229 271 94.0 –
a Correctly classified.b Incorrectly classified.

184 B.-K. Cho et al. / Computers and Electronics in Agriculture 57 (2007) 177–189
The two-band ratio and simple threshold methods were also applied to investigate the feasibility for discriminatingthe fecal and ingesta contaminant residues from the product residues (blood, skin, meat, fat, and skin smear). Fromall the two-band combinations available, the ratio of reflectances at the wavebands at 527 and 580 nm (R580/R527)showed the highest F value from the ANOVA between the contaminant residue and product residue groups (Fig. 4c).Usually the ratio values of the feces and ingesta were higher than those of the product residues. The best classificationaccuracy was obtained with a threshold band ratio value of 1.07. The two wavebands, 527 and 580 nm, to discriminatecontaminant residues from product residues obtained in this study were slightly different from the wavebands (e.g. 517and 565 nm) reported by other group (Park et al., 2002, 2005). Although they differed by only 10–15 nm, the differencemay emanate from variations in feedstuff and the inclusion of diluted feces and ingesta, blood, meat, and smearedorganic fluid in this study.
The wavelengths and threshold values observed with the calibration data set were validated with an independent testdata set. The detailed validation results are listed in Table 2 for discriminating all residues from water and the stainlesssteel background, and for discriminating specific contaminant residues and product residues. Against the background(stainless steel and water), the first three columns show the validation results for classification of residues as residuesversus background (stainless steel or water). The classification accuracies for the feces and ingesta without dilutionand diluted up to 1:5 were greater than 97.3 and 95.5%, respectively. The accuracy markedly decreased for dilutionsgreater than 1:50. The stainless steel was correctly classified at 99.8%; however, 61.5% of water drops were incorrectly
Fig. 5. (a) Photo of wet poultry contaminant and product residues on a stainless steel plate; illustration of the image processing sequence: 3 × 3binned images (b) at 469 nm and (c) at 895 nm, (d) two-waveband ratio image (R895/R469), (e) binary image from a threshold of 1.07 applied tothe ratio image, images at (f) 527 nm and (g) 580 nm after masking, (h) two-waveband ratio image (R580/R527), and (i) detection of contaminantresidues using the resultant binary image from applying a threshold of 1.07 to the R580/R527 ratio image.

B.-K. Cho et al. / Computers and Electronics in Agriculture 57 (2007) 177–189 185
classified and could be significant sources of false positives. The overall validation accuracy for discriminating allresidues from DD water and stainless steel was 94.0% with 12.0% of false positive.
In classifying residues as contaminant residues versus product residues, the classification accuracies for identifyingproduct residues (the last column) were much higher than those for identifying the fecal and ingesta contaminantresidues (95.8% versus 67.3%). This may be due to the much lower variation displayed by the product residue samples,compared to the contaminant residues and their wide range of dilutions.
An algorithm using images at 469 and 895 nm wavebands was developed for detecting the full range of diluted fecesand ingesta on strainless steel background, inspite of the existing product residues and water drops on it. Beginningwith a photo of a set of wet residue samples on a stainless steel plate, Fig. 5 shows a sequence of processed imagesillustrating the application of the multispectral preprocessing, two-band ratio and thresholding methods for classifyingthe residues. In each of the first five columns, samples are arranged from top to bottom with no dilution in row 1,with dilutions (by weight) of 1:5, 1:10, 1:50, and 1:100 in rows 2–5, and with samples of DD water in row 6 alongthe bottom. The contaminant materials shown in columns 1–5 (from left to right) are fecal matter from the colon,ceca, small intestine, and duodenum, and ingesta, respectively. Samples of product residues are arranged in column6 from top to bottom as follows: blood, skin, meat, fat, and skin smear. Fig. 5b and c are 469 and 895 nm wavebandimages after 3 × 3 binning. The displayed intensity range of each column image in Fig. 5b and c was between 1 and99% of respective maximum intensity; hence, the intensity ranges of the individual column images are not the same.Fig. 5d is a R895/R469 band ratio image, resulting from dividing the reflectance intensity at 895 nm by that at 469 nm.The water drop samples and stainless steel areas are noticeably darker than the other samples in the ratio images.Fig. 5e is the binary-classification image created from the 1.07 threshold value to the R895/R469 band ratio image.Portions of the highly diluted feces spots are missing, and parts of water drops are shown as contaminant residues (falsepositives). Fig. 5f and g are the 527 and 580 nm images after masking with Fig. 5e to identify residue areas. Fig. 5h is aR580/R527 band ratio image resulting from dividing the reflectance intensity at 580 nm by that at 527 nm. The resultantbinary image obtained by applying a threshold of 1.07 to the R580/R527 band ratio image showed the detection ofalmost the full range of diluted feces and ingesta (Fig. 5i). The image also shows a few false positives for the productresidues.
3.2. Classification of contaminant and products residues allowed to air dry
Fig. 6 shows representative reflectance spectra for undiluted, 1:5 and 1:50 diluted fecal matters, product residues, andstainless steel that were allowed to air dry for 24 h at room temperature. The R values of stainless steel are significantlyhigher than those of the contaminant and product residues throughout the entire spectral region from 450–900 nm.
Fig. 6. Representative mean spectra of dry undiluted (�), 1:5 (©) and 1:50 diluted (�) ceca, blood (�), skin (�), meat (�), fat (♦), and skin smear(�) residues and stainless steel (�).

186 B.-K. Cho et al. / Computers and Electronics in Agriculture 57 (2007) 177–189
Fig. 7. Wavebands and threshold value selection. (a) F values by single wavelength used for discriminating dry residues from stainless steel, and (b)classification accuracy as a function of 527 nm reflectance threshold value with frequency histogram for reflectance values of dry residues and steelbackground. (c) F values for wavelength pairs used for discriminating dry contaminant residues from dry product residues, and (d) classificationaccuracy as a function of R580/R527 band ratio threshold value with frequency histogram for ratio values of dry contaminant residues and dryproduct residues.
Therefore, stainless steel can be easily discriminated with a simple threshold value. F values of one-way ANOVA forreflectance values of stainless steel and dry residues were calculated and are shown in Fig. 7a. The R values at 527 nmappeared to show the most significant differences between the two groups. Residues and stainless steel were classifiedwith the highest accuracy (99.8%) at a threshold R value of 129.73%. The histogram (Fig. 7b) also exhibits distinctivedistributions for the R values of the two groups.
Since the spectra of fecal, ingesta, and product residues cannot be accurately classified with a single waveband,the two-band ratio method used for the wet samples was also applied to the spectral data for dried residues. Fig. 7cshows F values of ANOVA for the ratio values of the dry contaminant and product residue samples. The highest Fvalue was observed for the ratio of 580 and 527 nm, which were the same wavebands found for the wet residues.Using this same R580/R527 band ratio and a threshold value of 1.07, the dry contaminants and product residuesamples were correctly classified with an accuracy of 82.9% (Fig. 7d). The validation results are listed in Table 3.The validation accuracies were 100% for discriminating dried fecal and ingesta residues diluted up to 1:50 fromstainless steel. The overall classification accuracy for discriminating dried residues from stainless steel was 99.7%,with 0.2% false positives, which was better than that achieved for the wet samples. The classification accuracies fordiscriminating dried fecal and ingesta contaminant residues from dried product residues ranged from 29 to 100%. The

B.-K
.Cho
etal./Com
putersand
Electronics
inA
griculture57
(2007)177–189
187Table 3Validation results of classification for dry samples
Class Type Dilution Residues vs. background Contaminant vs. product residues
Corra Incorrb % Accuracy Corra Incorrb % AccuracyBackground Stainless steel – 4491 9 99.8
ResiduesContaminant residues
Colon None 150 0 100 16 16 50.01:5 157 0 100 24 1 96.01:10 154 0 100 32 7 82.11:50 141 0 100 15 8 65.21:100 143 1 99.3 28 7 80.0Total 745 1 99.9 115 39 74.7
Ceca None 145 0 100 7 17 29.21:5 137 0 100 27 4 87.11:10 125 0 100 25 0 1001:50 114 0 100 27 0 1001:100 120 1 99.2 27 1 96.4Total 641 1 99.8 113 22 83.7
Small intestine None 171 0 100 27 9 75.01:5 180 0 100 44 0 1001:10 189 0 100 46 1 97.91:50 152 0 100 31 6 83.81:100 141 1 99.3 19 7 73.1Total 833 1 99.9 167 23 87.9
Duodenum None 175 0 100 32 2 94.11:5 175 0 100 32 0 1001:10 162 0 100 37 1 97.41:50 143 0 100 27 4 87.11:100 131 0 100 18 7 72.0Total 786 0 100 146 14 91.3
Ingesta None 174 0 100 38 10 79.21:5 144 0 100 21 3 87.51:10 135 0 100 16 9 64.01:50 144 0 100 20 7 74.11:100 130 10 92.9 23 14 62.2Total 727 10 98.6 118 43 73.3
Total (contaminant residues) – 659 141 82.4
Product residuesBlood None 169 0 100 180 1 99.4Skin – 145 0 100 134 13 91.2Meat – 111 0 100 110 15 88.0Fat – 168 1 99.4 154 19 89.0Smeared – 161 0 100 111 63 63.8Total (product residues) – 689 111 86.1
Total (residues) 4486 14 99.7 –
a Correctly classified.b Incorrectly classified.

188 B.-K. Cho et al. / Computers and Electronics in Agriculture 57 (2007) 177–189
Fig. 8. (a) Photo of dried poultry contaminant and products residues on a stainless steel plate; illustration of image processing sequence: (b) 3 × 3binned image at 527 nm, (c) binary image from applying a threshold of 129.73 to the 527 nm image, images at (d) 527 nm and (e) 580 nm aftermasking, (f) two-waveband ratio (R580/R527) image, and (g) detection of contaminant residues using the resultant binary image from applying athreshold of 1.07 to the R580/R527 image.
overall classification accuracy for discriminating dried contaminant residues from dried product residues was 82.4%,with 13.9% false positives. Although the overall classification accuracy for discriminating dried feces and ingestafrom product residues was improved, the incidence of false positives also increased compared to the incidence for wetsamples.
Fig. 8 shows a sequence of processed images illustrating the application of the multispectral preprocessing, two-band ratio and thresholding methods for classifying the residues. Beginning with a photo of a set of residue sampleson a stainless steel plate that were allowed to air dry at room temperature for 24 h, the regions of stainless steel wereeliminated from the 527 nm waveband image (Fig. 8b) using a 129.73% R value as a threshold. The resultant image(Fig. 8c) shows that most of the dried residues were successfully discriminated from the stainless steel surface. Thisimage was used as a mask for further processing to classify dried contaminants versus dried product residues. Afterusing the mask to remove the background steel areas on the 527 and 580 nm images (Fig. 8d and e), a two-bandintensity ratio using those two waveband images was performed to discriminate the dried feces and ingesta residuesfrom the dried product residues (Fig. 8f). The resultant binary image obtained by applying a threshold of 1.07 tothe ratio image showed the detection of the range of diluted and dried fecal and ingesta matter residues (Fig. 8g).Most of the pixels in the dry blood sample area were successfully eliminated; however a few false positives wereobserved in the sample areas for skin, meat, fat, and skin smear residues. The dry contaminants were discriminatedfrom the product residues using a ratio of two wavebands that included the 527 nm waveband that was also used toseparate dry residues from stainless steel. Hence, only two wavebands were needed for discriminating dried contam-inants, while at least four wavebands (for two different band ratios) were necessary for classifying wet contaminantresidues.

B.-K. Cho et al. / Computers and Electronics in Agriculture 57 (2007) 177–189 189
4. Conclusion
The goal of this study was to investigate the feasibility of multispectral reflectance imaging technique for detection ofpoultry contaminant and product residues on processing equipment surfaces. A two-band reflectance image ratio usingspectral bands at 469 and 895 nm (R895/R469) was capable of detecting (against background water and stainless steel)wet residues diluted up to 1:100 by weight with an accuracy of 94.0%. Another two bands at 527 and 580 nm were foundto be the best for a two-band ratio (R580/R527) to discriminate wet contaminant residues from wet product residueswith an accuracy of 67.3%. Dry residues could be detected (against stainless steel background) using a single waveband,527 nm, with an accuracy of 99.7%. Fecal and ingesta contaminants which were dried in room temperature could bediscriminated from dried product residues by a band ratio using the 580 and 527 nm wavebands (R580/R527), withan accuracy of 82.4%. The possible explanation for the higher classification accuracies for detecting organic residuesfrom background water and stainless steel than those for detecting contaminant residues from product residues maybe due to the distinctive reflectance spectra of inorganic materials, compared to those of the organic residues. Forclassification of contaminant residue and product residue samples using the two-band ratio method, the band ratio ofthe 580 and 527 nm wavebands (R580/R527) was found to result in the highest accuracies, regardless of wet or driedsample condition. However, results indicated that this imaging technique yielded better accuracy in detection driedresidues than wet residues on processing plant equipment. The wavebands investigated in this study could be helpfulfor developing low cost and portable/wearable multispectral devices for monitoring the sanitation of poultry processingplants.
Acknowledgements
The authors would like to thank Mr. Frank B. Gwozdz for his assistance in preparing the samples used in this study,and Ms. Diane E. Chan for her assistance in preparing this manuscript.
References
Cody, S.H., Glynn, M.K., Farrar, J.A., Cairns, K.L., Griffin, P.M., Kobayashi, J., Fyfe, M., Hoffman, R., King, A.S., Lewis, J.H., Swanminathan, B.,Bryant, R.G., Vugia, D.J., 1999. An outbreak of Escherichia coli O157:H7 infection from unpasteurized commercial apple juice. Ann. Intern.Med. 130, 202–209.
Food and Drug Administration (FDA), 2001. Hazard analysis and critical control point (HAACP); Procedures for the safe and sanitary processingand importing of juices. Fed. Reg. 66, 6137–6202.
Food Safety and Inspection Service (FSIS), 2004. Livestock post-mortem inspection activities-enforcing the zero tolerances for fecal materials,ingesta, and milk. FSIS Directive 6420.2, http://www.fais.usda.gov.
Kim, M.S., Chen, Y.R., Mehl, P.M., 2001. Hyperspectral reflectance and fluorescence imaging system for food quality and safety. T. ASAE. 44,721–729.
Kim, M.S., Lefcourt, A.M., Chen, Y., 2003. Optimal fluorescence excitation and emission bands for detection of fecal contamination. J. Food Prot.66, 1198–1207.
Kim, M.S., Lefcourt, A.M., Chen, Y., Kim, I., Chao, K., Chan, D., 2002. Multispectral detection of fecal contamination on apples based onhyperspectral imagery - part 2: application of fluorescence imaging. T. ASAE. 45, 2039–2047.
Liu, Y., Chen, Y., Ozaki, Y., 2000. Two-dimensional visible/near-infrared correlation spectroscopy study of thermal treatment of chicken meats. J.Agric. Food Chem. 48, 901–908.
Mead, P.S., Slutsker, L., Dietz, V., McCaig, L.F., Bresee, J.S., Shapiro, C., Griffin, P.M., Tauxe, R.V., 1999. Food-related illness and death in theUnited States. Emerging Infectious Diseases. 5, 607–625.
Park, B., Lawrence, K.C., Windham, W.R., Buhr, R.J., 2002. Hyperspectral imaging for detection fecal and ingesta contaminations on poultrycarcasses. T. ASAE. 45, 2017–2026.
Park, B., Lawrence, K.C., Windham, W.R., Smith, D.P., 2005. Detection of cecal contaminations in visceral cavity of broiler carcasses usinghyperspectral imaging. Appl. Eng. Agric. 21, 627–635.