Embed Size (px)
Citation preview
Mp
HGa
b
c
a
ARRAA
KBMSPLCC
1
gipsumpu
0
0h
Journal of Biotechnology 162 (2012) 210– 223
Contents lists available at SciVerse ScienceDirect
Journal of Biotechnology
jou rn al h om epa ge: www.elsev ier .com/ locate / jb io tec
ultivariate analysis of cell culture bioprocess data—Lactate consumption asrocess indicator
uong Lea,1, Santosh Kabburb,1, Luciano Pollastrini c, Ziran Sunc, Keri Mills c, Kevin Johnsonc,eorge Karypisb, Wei-Shou Hua,∗
Department of Chemical Engineering and Materials Science, University of Minnesota, Minneapolis, MN 55455, USADepartment of Computer Science and Engineering, University of Minnesota, Minneapolis, MN 55455, USAGenentech, Inc., Vacaville, CA 95688, USA
r t i c l e i n f o
rticle history:eceived 29 April 2012eceived in revised form 31 July 2012ccepted 30 August 2012vailable online xxx
eywords:ioprocess data miningultivariate data analysis
upport vector regressionartial least square regressionactate consumptionell culturehinese hamster ovary (CHO) cells
a b s t r a c t
Multivariate analysis of cell culture bioprocess data has the potential of unveiling hidden process charac-teristics and providing new insights into factors affecting process performance. This study investigatedthe time-series data of 134 process parameters acquired throughout the inoculum train and the pro-duction bioreactors of 243 runs at the Genentech’s Vacaville manufacturing facility. Two multivariatemethods, kernel-based support vector regression (SVR) and partial least square regression (PLSR), wereused to predict the final antibody concentration and the final lactate concentration. Both product titerand the final lactate level were shown to be predicted accurately when data from the early stages ofthe production scale were employed. Using only process data from the inoculum train, the predictionaccuracy of the final process outcome was lower; the results nevertheless suggested that the history ofthe culture may exert significant influence on the final process outcome. The parameters contributingmost significantly to the prediction accuracy were related to lactate metabolism and cell viability in boththe production scale and the inoculum train. Lactate consumption, which occurred rather independentlyof the residual glucose and lactate concentrations, was shown to be a prominent factor in determining
the final outcome of production-scale cultures. The results suggest possible opportunities to intervenein metabolism, steering it towards the type with a strong propensity towards high productivity. Suchintervention could occur in the inoculum stage or in the early stage of the production-scale reactors.Overall, this study presents pattern recognition as an important process analytical technology (PAT). Fur-thermore, the high correlation between lactate consumption and high productivity can provide a guideto apply quality by design (QbD) principles to enhance process robustness.. Introduction
In recent years, cell culture bioprocessing has seen a tremendousrowth in data generation and collection. In modern manufactur-ng facilities, it is not uncommon to encounter hundreds of processarameters being monitored and acquired automatically every feweconds throughout the entire production train. This enormous vol-me of data further accumulates across multiple campaigns and atultiple manufacturing sites. Mining these historical data holds
romise to gain insights into fluctuations in process performance,ncover hidden characteristics of high-performing cultures, and
∗ Corresponding author at: 421 Washington Avenue SE, Minneapolis, MN 55455-132, USA. Tel.: +1 612 626 7630; fax: +1 612 626 7246.
E-mail address: [email protected] (W.-S. Hu).1 These authors contributed equally to this work.
168-1656/$ – see front matter © 2012 Elsevier B.V. All rights reserved.ttp://dx.doi.org/10.1016/j.jbiotec.2012.08.021
© 2012 Elsevier B.V. All rights reserved.
discern process parameters with pivotal contributions to the over-all process performance.
Cell culture bioprocess data, however, pose significant chal-lenges to mining practices due to the inherent heterogeneitiesin time scale and data type (Charaniya et al., 2008). Yet manyhave successfully applied an array of classification and predic-tion techniques to investigate hidden process patterns. Principalcomponent analysis (PCA), partial least square regression (PLSR),and other unsupervised techniques, which have the advantage ofcapturing the interactions among process parameters, have beenused for detecting state transitions related to product and lactateformation, online monitoring, fault detection and diagnosis, scale-up assessment, process characterization, and root cause analysis(Bachinger et al., 2000; Gunther et al., 2007; Kirdar et al., 2008;
Ündey, 2004). In other studies, powerful supervised approachessuch as decision tree (DT), artificial neural network (ANN), andsupport vector regression (SVR) were used to optimize a controlscheme incorporating time-course data, predict the final process
echnology 162 (2012) 210– 223 211
oeadh
heoetrmoadZeeflUps
ppatibw(tttf
2
2
mcfsiorp
easwepfpptw
ac
Table 1Temporal process parameters used in the analysis: 33 parameters at each of theinoculum scales (80 L, 400 L, and 2000 L), and 35 parameters at the production scale(12,000 L).
Offline parameters Online parametersAmmonium ion concentration Air sparge rateDissolved CO2 (pCO2) Air sparge set pointDissolved O2 (pO2) Backpressure (12,000 L only)Glucose concentration CO2 sparge rateIntegrated packed cell volume(IntvPCV) (12,000 L only)
Dissolved oxygen (DO) controlleroutput
Lactate concentration DO (primary)Osmolarity DO (secondary)Packed cell volume (PCV) Flowrate overlaypH (offline) Jacket temperatureSodium ion concentration O2 sparge rateViability pH controller outputViable cell density (VCD) pH (online)
Derived parameters Pressure exhaust valveSpecific cell growth rate (�) Reactor weightSpecific glucose consumption rate(qLac)
Total air sparged
Specific lactate consumption rate(qGlc)
Total base added
Total CO2 spargedTotal O2 sparged
H. Le et al. / Journal of Biot
utcome, and reveal key parameters (Buck et al., 2002; Charaniyat al., 2010; Coleman and Block, 2006). Among these multivariatenalysis approaches, PLSR and SVR appear to be well-suited to han-le the various challenges associated with bioprocess data, namelyigh-dimensionality and co-linearity between various parameters.
Among the important contributors to differentiating betweenigh- and low-productivity runs of a cell culture process are param-ters related to lactate metabolism, including pH, base addition,smolarity, dissolved CO2, and lactate concentration (Charaniyat al., 2010). Excessive lactate accumulation has long been knowno be an impediment to achieving high cell concentration and supe-ior productivity (Glacken et al., 1986; Hu et al., 1987). Introducingetabolic shifts (i.e., controlling lactate production at low levels
r, to a further extent, inducing lactate consumption) has beenchieved through various strategies. These approaches includeynamic feeding to control glucose at low levels (Cruz et al., 1999;hou et al., 1997), using alternative carbon sources (Altamiranot al., 2006; Wlaschin and Hu, 2007), knocking down LDH-A (Chent al., 2001; Kim and Lee, 2007a), and enhancing glucose carbonux into the TCA cycle (Irani et al., 1999; Kim and Lee, 2007b).nderstanding the linkage between lactate metabolism and highroductivity thus offers the opportunity to discover the metabolicignatures of these high-performing processes.
In this study, we employed support vector regression (SVR) andartial least square regression (PLSR) methods to predict the finalrocess outcome using process data from 243 production runs at
Genentech manufacturing facility. This dataset comprises 134emporal parameters acquired online and offline throughout thenoculum train (80 L, 400 L, and 2000 L) and the production-scaleioreactors (12,000 L). Parameters pivotal to prediction accuracyere assessed based on two criteria: the frequency of occurrence
f) in the best parameter sets for SVR models and the magnitude ofhe regression coefficient (ˇ) in the optimal PLSR models. Amonghese pivotal parameters, various aspects of the lactate consump-ion phenomenon at the production scale in high-titer runs wereurther investigated.
. Methods
.1. Data pre-processing and organization
Process data from 243 production runs of a recombinant IgGolecule, produced using the same Chinese hamster ovary (CHO)
ell line, were used for analysis. The same batch process was appliedor all seed cultures (80 L, 400 L, and 2000 L). At the productioncale (12,000 L), a fed-batch mode with glucose and medium feed-ng was used. Across these scales, temperature, pH, and dissolvedxygen were maintained at 37 ◦C, 7.0, and 30% of air saturation,espectively. A temperature shift to 33 ◦C at approximately 70 host-inoculation was performed at the 12,000 L scale.
The data were pre-processed as described previously (Charaniyat al., 2010) with minor modifications. Briefly, online data acquiredt each of the four scales (80 L, 400 L, 2000 L, and 12,000 L) weremoothed using a moving window average method with a timeindow of 100 min. Offline data were linearly interpolated and/or
xtrapolated every 20 h. Furthermore, specific rates of lactateroduction, glucose consumption, and cell growth were derivedrom these measured parameters and smoothed using third-orderolynomials. In total, time-series data of 134 temporal processarameters across all scales, including 33 parameters at each of thehree inoculum scales and 35 parameters at the production scale,
ere used (Table 1).Process data from all scales were organized into eight individualnd seven cumulative datasets as shown in Table 2. The first datasetomprised process data from the 80 L scale bioreactors. The second
Total gas spargedVessel temperature
dataset contained data from the next scale of 400 L, and so on. Sincethe run time at the production scale (260 h) was much longer com-pared to that at each of the inoculum scales (70 h), it was segregatedinto several stages: up to 70 h, 120 h, 170 h, 220 h, and 260 h. Inaddition to these eight individual datasets, process data were alsoaccumulated across scales with the largest dataset compiling datafrom 80 L, 400 L, 2000 L, and up to 260 h of the 12,000 L scale.
2.2. Model training and evaluation using 10-fold cross-validation
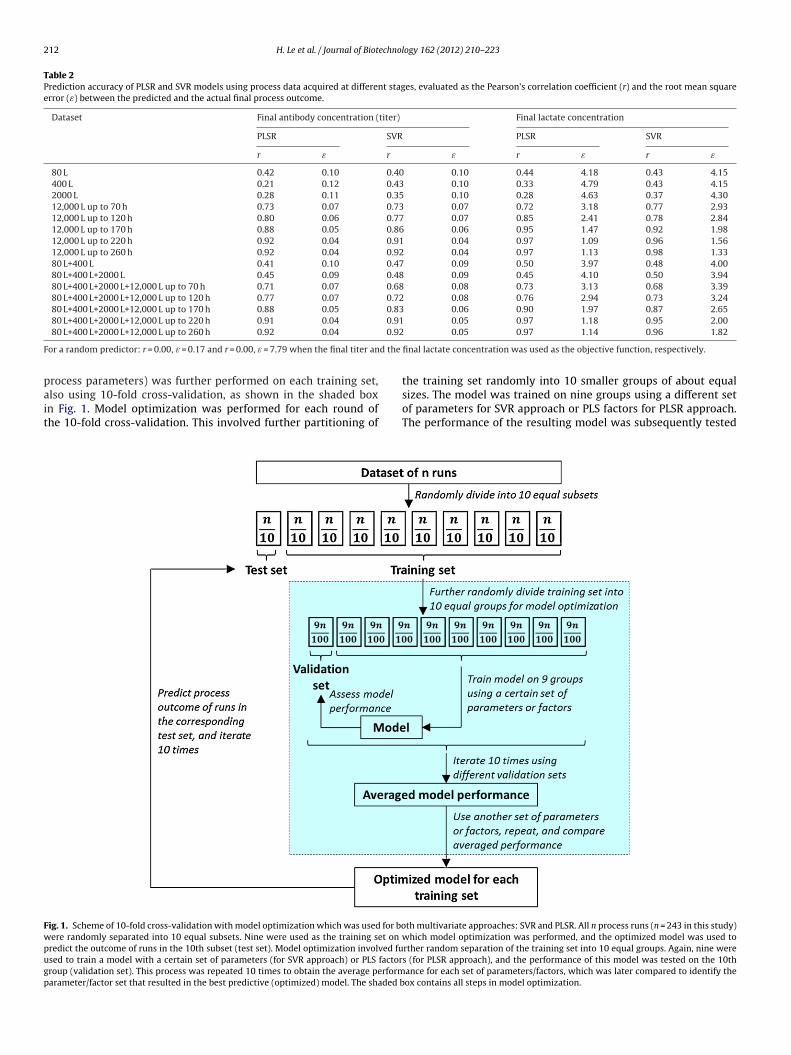
A 10-fold cross-validation scheme as shown in Fig. 1 was usedfor training and evaluation of both support vector regression (SVR)and partial least square regression (PLSR) models. Process data from243 runs in each of the 15 datasets described above were randomlydivided into ten subsets of approximately equal sizes. During eachround of cross-validation, nine of the ten subsets were used as thetraining set on which model optimization was performed. The bestperforming model on each training set was used to predict processoutcome of runs in the corresponding, unseen test set (the 10thsubset). This process was repeated 10 times on different pairs oftraining and test subsets. Model performance was evaluated usingthe Pearson’s correlation coefficient (r) r and the root mean squareerror (ε) between the predicted and the actual final process out-come:
r =∑n
i=1yif (xi) − (∑n
i=1yi
∑ni=1f (xi))/n√
(∑n
i=1y2i
− (∑n
i=1yi)2/n)(
∑ni=1f (xi)
2 − (∑n
i=1f (xi))2/n)
(1)
ε =√∑n
i=1(yi − f (xi))2
n(2)
where n is the number of runs, and yi and f(xi) are the actual andthe predicted titer values of run i, respectively. The model perfor-mance was averaged across the 10 folds. As a baseline for evaluating
model performance, a random predictor with one million simula-tions of randomized final process outcome was generated.To get a better estimate of the generalization error of the con-structed models, model optimization (i.e. selection of model and
212 H. Le et al. / Journal of Biotechnology 162 (2012) 210– 223
Table 2Prediction accuracy of PLSR and SVR models using process data acquired at different stages, evaluated as the Pearson’s correlation coefficient (r) and the root mean squareerror (ε) between the predicted and the actual final process outcome.
Dataset Final antibody concentration (titer) Final lactate concentration
PLSR SVR PLSR SVR
r ε r ε r ε r ε
80 L 0.42 0.10 0.40 0.10 0.44 4.18 0.43 4.15400 L 0.21 0.12 0.43 0.10 0.33 4.79 0.43 4.152000 L 0.28 0.11 0.35 0.10 0.28 4.63 0.37 4.3012,000 L up to 70 h 0.73 0.07 0.73 0.07 0.72 3.18 0.77 2.9312,000 L up to 120 h 0.80 0.06 0.77 0.07 0.85 2.41 0.78 2.8412,000 L up to 170 h 0.88 0.05 0.86 0.06 0.95 1.47 0.92 1.9812,000 L up to 220 h 0.92 0.04 0.91 0.04 0.97 1.09 0.96 1.5612,000 L up to 260 h 0.92 0.04 0.92 0.04 0.97 1.13 0.98 1.3380 L+400 L 0.41 0.10 0.47 0.09 0.50 3.97 0.48 4.0080 L+400 L+2000 L 0.45 0.09 0.48 0.09 0.45 4.10 0.50 3.9480 L+400 L+2000 L+12,000 L up to 70 h 0.71 0.07 0.68 0.08 0.73 3.13 0.68 3.3980 L+400 L+2000 L+12,000 L up to 120 h 0.77 0.07 0.72 0.08 0.76 2.94 0.73 3.2480 L+400 L+2000 L+12,000 L up to 170 h 0.88 0.05 0.83 0.06 0.90 1.97 0.87 2.6580 L+400 L+2000 L+12,000 L up to 220 h 0.91 0.04 0.91 0.05 0.97 1.18 0.95 2.00
0.92
F d the
pait
Fwpugp
80 L+400 L+2000 L+12,000 L up to 260 h 0.92 0.04
or a random predictor: r = 0.00, ε = 0.17 and r = 0.00, ε = 7.79 when the final titer an
rocess parameters) was further performed on each training set,
lso using 10-fold cross-validation, as shown in the shaded boxn Fig. 1. Model optimization was performed for each round ofhe 10-fold cross-validation. This involved further partitioning ofig. 1. Scheme of 10-fold cross-validation with model optimization which was used for boere randomly separated into 10 equal subsets. Nine were used as the training set on
redict the outcome of runs in the 10th subset (test set). Model optimization involved fused to train a model with a certain set of parameters (for SVR approach) or PLS factorroup (validation set). This process was repeated 10 times to obtain the average performarameter/factor set that resulted in the best predictive (optimized) model. The shaded b
0.05 0.97 1.14 0.96 1.82
final lactate concentration was used as the objective function, respectively.
the training set randomly into 10 smaller groups of about equal
sizes. The model was trained on nine groups using a different setof parameters for SVR approach or PLS factors for PLSR approach.The performance of the resulting model was subsequently testedth multivariate approaches: SVR and PLSR. All n process runs (n = 243 in this study)which model optimization was performed, and the optimized model was used torther random separation of the training set into 10 equal groups. Again, nine weres (for PLSR approach), and the performance of this model was tested on the 10thance for each set of parameters/factors, which was later compared to identify theox contains all steps in model optimization.
echnol
irauebi
2
uT1stmdtat
obbfir
X
X
y
gPoutavopP
atwet(1awttp
2
apet1
H. Le et al. / Journal of Biot
n the 10th group, called the validation set. This procedure wasepeated 10 times for each set of parameters or PLS factors. Theverage performance of the model over these inner 10 folds wassed to determine the optimal set of parameters or PLS factors forach round of the outer 10-fold cross-validation. Subsequently, theest model was selected and used to predict the outcome of runs
n the corresponding, unseen test set.
.3. Construction of partial least square regression (PLSR) models
Partial least square regression (PLSR) models were constructedsing the SIMPLS algorithm (Chong and Jun, 2005; de Jong, 1993).ime-series data for each process parameter were extracted every0 h, resulting in multiple discrete “variables” originating from theame parameter. These variables were concatenated over the runime of each scale into a data matrix (X). Data in each column of this
atrix were further autoscaled to a mean of zero and a standardeviation of one to give a new matrix X0. A similar transforma-ion was also performed on the response vector (y) to obtain theutoscaled final process outcome (y0) (either antibody titer or lac-ate concentration at the end of the 12,000 L cultures).
The autoscaled data matrix (X0) was projected onto mutuallyrthogonal PLS factors (XS), each of which is a weighted linear com-ination of the original variables in X0. A set of these PLS factors cane used to construct a regression function to predict the autoscalednal process outcome in y0. The SIMPLS algorithm for a univariateesponse in y0 can be simplified in the following equations:
Sn×a = X0n×p · Wp×a (3)
0n×p = XSn×a · XLTp×a + XEn×p (4)
0n×1 = XSn×a · ˇa×1 + yen×1 (5)
such that the covariance between X0 and y0 is maximized.In these equations, XS, X0, and W are the matrix of ortho-
onal PLS factors, the autoscaled data matrix, and the matrix ofLS weights, respectively. The matrices XL and XE contain loadingsf the PLS factors and the residuals when factorizing X0 into a prod-ct of XS and XLT, respectively. The vectors y0, �, and ye comprisehe autoscaled response, the regression coefficients of y0 using XS,nd the residuals when regressing y0 using XS, respectively. Theariables n, p, and a are the number of process runs, the numberf variables (in this case, a product between the number of processarameters m and the number of time points t), and the number ofLS factors used for regression, respectively.
The plsregress subroutine, an implementation of the SIMPLSlgorithm in the Matlab’s statistics toolbox, was used for construc-ing the PLSR models. For each of the 15 datasets, a PLSR modelas constructed and optimized as described in model training and
valuation using 10-fold cross-validation. The number of PLS fac-ors in each model was varied from one to the maximum possiblewhich is the rank of the data matrix X0). For each fold of the outer0-fold cross-validation, an optimal set of PLS factors, and thus vari-bles, could be identified. Furthermore, as each original parameteras discretized into multiple variables, the average magnitude of
he regression coefficients of all variables which originated fromhe same parameter was used to assess the importance of thatarameter.
.4. Construction of support vector regression (SVR) models
LIBSVM (Chang and Lin, 2001), an implementation of the SVRlgorithm in C, was used to construct �-SVR models as described
reviously (Charaniya et al., 2010) with several modifications. Forach individual parameter, the Euclidean distance between anywo runs i and j was computed and scaled to a range from 0 to. This scaled distance (dij) was converted into a similarity valueogy 162 (2012) 210– 223 213
(sij = 1 − dij) and organized into a matrix for all pairwise compar-isons of runs (n × n, where n is the number of runs). The similaritymatrices of all parameters were linearly combined to form a finalsimilarity matrix, which was used as a pre-defined kernel in the�-SVR algorithm. Upon combination, each parameter was eithergiven equal weights of 1/m (where m is the number of processparameters) or weighted according to how well it correlates tothe final process outcome as described previously (Charaniya et al.,2010). Thus all entries in the final similarity matrix were main-tained between 0 and 1. The objective function (y), either the finaltiter or the final lactate concentration, was also scaled to the samerange of 0–1.
�-SVR models were constructed and optimized for each of theeight individual datasets as described in model training and evalua-tion using 10-fold cross-validation and in Section 2.5. For the sevencumulative datasets, due to computational constraints imposed bythe large number of parameters, SVR models were built using thebest performing sets of parameters obtained for the correspond-ing individual datasets. In addition, a simple grid search within therange of 0–1 with 0.1 intervals was performed on the cost func-tion. The best value was used in the subsequent step of modeloptimization to identify pivotal process parameters.
2.5. Identification of pivotal process parameters using SVRapproach
A greedy parameter selection approach based on the wrapperfeature-selection method (Liu and Hiroshi, 1998) was used to findthe best performing set of parameters for the SVR models. Thisapproach determined the suitability of a set of features (i.e., pro-cess parameters) by first building an SVR model using these featuresand then assessing its performance on a subset of the data that wasnot used for training (i.e., validation set). The set of features whosemodel achieved the best performance on the validation set becamethe set of selected parameters. Since each of the eight individualdatasets contains either 33 parameters at the inoculum scales or35 parameters at the production scale, a direct application of thewrapper feature-selection method will require an evaluation of233 − 1 or 235 − 1 (excluding the null set) possible parameter sub-sets, which is prohibitively large. For this reason, we employed agreedy strategy that only considers a substantially smaller numberof parameter subsets.
In this approach, the different parameter subsets were orga-nized into a lattice structure, whose ith level contained all thesubsets of size (m − i) where m is the number of parameters. Allnodes at each level were connected to the nodes of the precedinglevel that were its supersets. The algorithm started by evaluatingthe performance of the subsets at levels 0 and 1 (i.e., the entire setof m parameters and the m subsets that were obtained by remov-ing one parameter, respectively). Among the m subsets at level 1,N subsets whose models achieved the best performance on thevalidation set were retained. The algorithm then proceeded to eval-uate the performance of subsets at level 2 that are descendantsof at least one of the N nodes retained at level 1. Among thosesubsets, it also retained the N best performing ones. This processcontinued until the last level of the lattice. Note that, by settingN to a small value (in our experiments, N = {5, 15, 25, 35}) and byconsidering only subsets whose supersets were among the N bestperforming subsets of the previous level, the total number of sub-sets being considered became computationally feasible. In addition,since the subsets that were pruned are those that did not perform
well, this approach could still identify good performing parametersubsets.Since 10-fold cross-validation was performed, each fold gener-ated an optimal set of parameters. Thus the occurrence frequency
214 H. Le et al. / Journal of Biotechnology 162 (2012) 210– 223
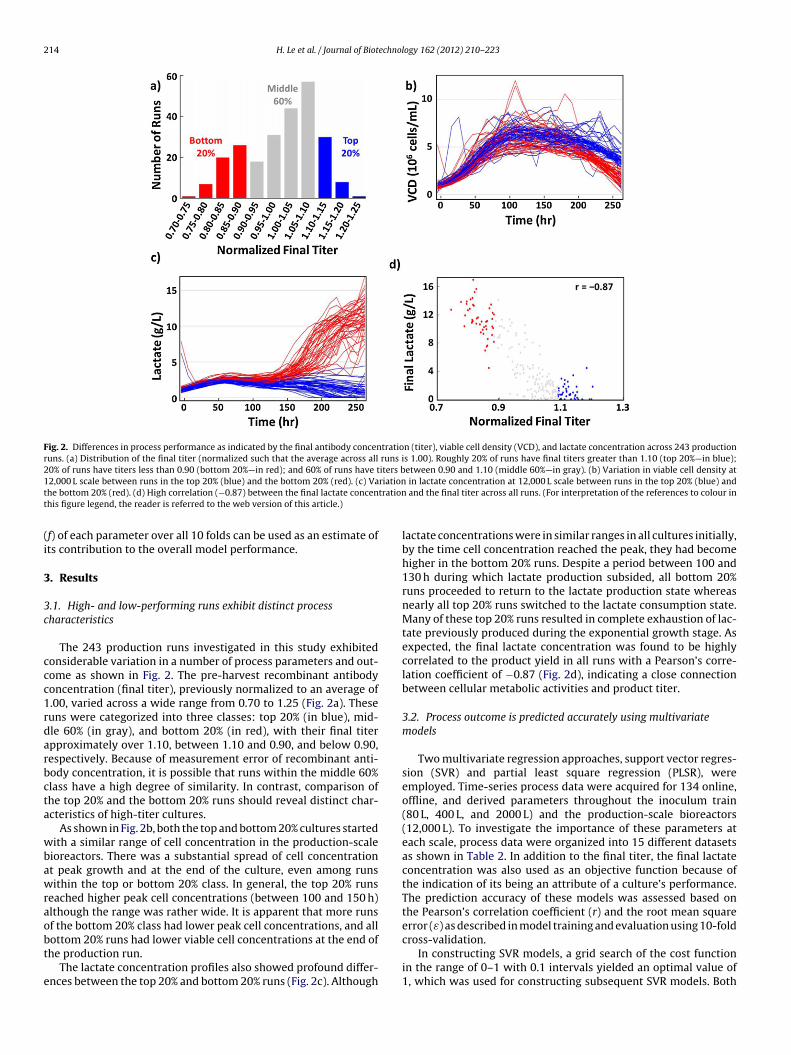
Fig. 2. Differences in process performance as indicated by the final antibody concentration (titer), viable cell density (VCD), and lactate concentration across 243 productionruns. (a) Distribution of the final titer (normalized such that the average across all runs is 1.00). Roughly 20% of runs have final titers greater than 1.10 (top 20%—in blue);20% of runs have titers less than 0.90 (bottom 20%—in red); and 60% of runs have titers between 0.90 and 1.10 (middle 60%—in gray). (b) Variation in viable cell density at1 riationt trationt
(i
3
3c
ccc1rdarbcta
wbawraobt
e
2,000 L scale between runs in the top 20% (blue) and the bottom 20% (red). (c) Vahe bottom 20% (red). (d) High correlation (−0.87) between the final lactate concenhis figure legend, the reader is referred to the web version of this article.)
f) of each parameter over all 10 folds can be used as an estimate ofts contribution to the overall model performance.
. Results
.1. High- and low-performing runs exhibit distinct processharacteristics
The 243 production runs investigated in this study exhibitedonsiderable variation in a number of process parameters and out-ome as shown in Fig. 2. The pre-harvest recombinant antibodyoncentration (final titer), previously normalized to an average of.00, varied across a wide range from 0.70 to 1.25 (Fig. 2a). Theseuns were categorized into three classes: top 20% (in blue), mid-le 60% (in gray), and bottom 20% (in red), with their final titerpproximately over 1.10, between 1.10 and 0.90, and below 0.90,espectively. Because of measurement error of recombinant anti-ody concentration, it is possible that runs within the middle 60%lass have a high degree of similarity. In contrast, comparison ofhe top 20% and the bottom 20% runs should reveal distinct char-cteristics of high-titer cultures.
As shown in Fig. 2b, both the top and bottom 20% cultures startedith a similar range of cell concentration in the production-scale
ioreactors. There was a substantial spread of cell concentrationt peak growth and at the end of the culture, even among runsithin the top or bottom 20% class. In general, the top 20% runs
eached higher peak cell concentrations (between 100 and 150 h)lthough the range was rather wide. It is apparent that more runsf the bottom 20% class had lower peak cell concentrations, and all
ottom 20% runs had lower viable cell concentrations at the end ofhe production run.The lactate concentration profiles also showed profound differ-nces between the top 20% and bottom 20% runs (Fig. 2c). Although
in lactate concentration at 12,000 L scale between runs in the top 20% (blue) and and the final titer across all runs. (For interpretation of the references to colour in
lactate concentrations were in similar ranges in all cultures initially,by the time cell concentration reached the peak, they had becomehigher in the bottom 20% runs. Despite a period between 100 and130 h during which lactate production subsided, all bottom 20%runs proceeded to return to the lactate production state whereasnearly all top 20% runs switched to the lactate consumption state.Many of these top 20% runs resulted in complete exhaustion of lac-tate previously produced during the exponential growth stage. Asexpected, the final lactate concentration was found to be highlycorrelated to the product yield in all runs with a Pearson’s corre-lation coefficient of −0.87 (Fig. 2d), indicating a close connectionbetween cellular metabolic activities and product titer.
3.2. Process outcome is predicted accurately using multivariatemodels
Two multivariate regression approaches, support vector regres-sion (SVR) and partial least square regression (PLSR), wereemployed. Time-series process data were acquired for 134 online,offline, and derived parameters throughout the inoculum train(80 L, 400 L, and 2000 L) and the production-scale bioreactors(12,000 L). To investigate the importance of these parameters ateach scale, process data were organized into 15 different datasetsas shown in Table 2. In addition to the final titer, the final lactateconcentration was also used as an objective function because ofthe indication of its being an attribute of a culture’s performance.The prediction accuracy of these models was assessed based onthe Pearson’s correlation coefficient (r) and the root mean squareerror (ε) as described in model training and evaluation using 10-fold
cross-validation.In constructing SVR models, a grid search of the cost functionin the range of 0–1 with 0.1 intervals yielded an optimal value of1, which was used for constructing subsequent SVR models. Both
echnol
d2emf
Fct(t
H. Le et al. / Journal of Biot
ifferential and equal weighting schemes as described in Section
.4 were employed to combine all similarity matrices. Since thequal weighting scheme resulted in slightly better model perfor-ance (data not shown), it was used for the subsequent step ofeature selection. A wrapper-based feature selection algorithm as
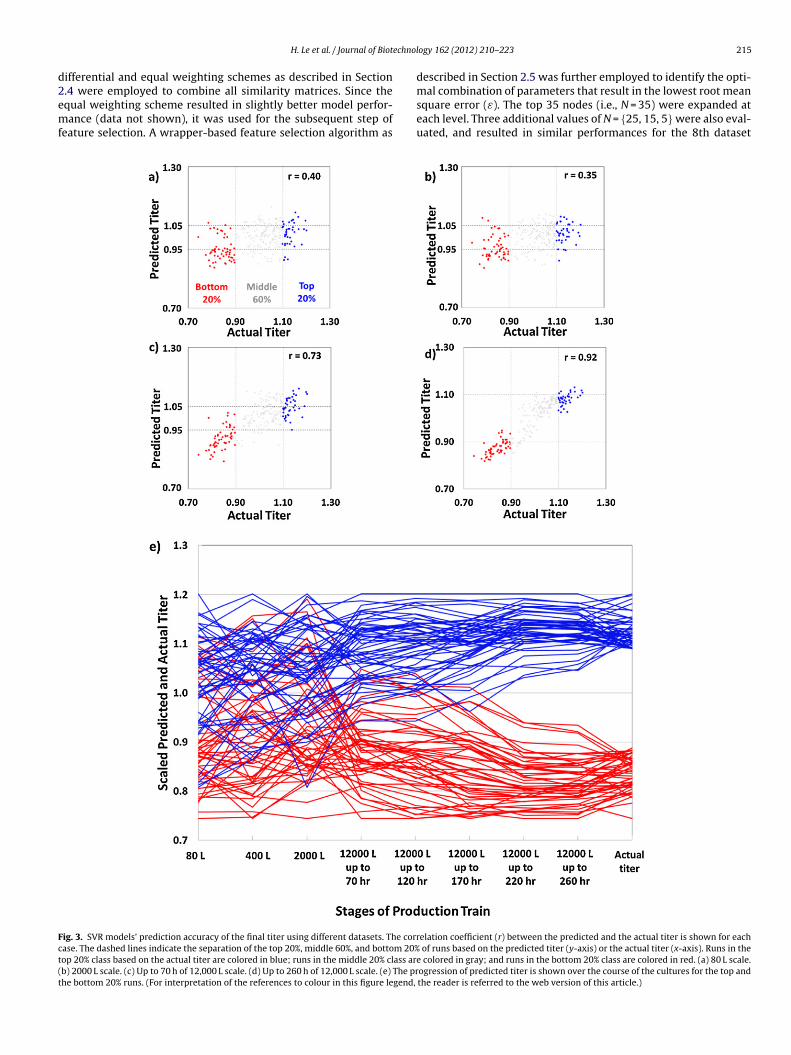
ig. 3. SVR models’ prediction accuracy of the final titer using different datasets. The corrase. The dashed lines indicate the separation of the top 20%, middle 60%, and bottom 20%op 20% class based on the actual titer are colored in blue; runs in the middle 20% class arb) 2000 L scale. (c) Up to 70 h of 12,000 L scale. (d) Up to 260 h of 12,000 L scale. (e) The prhe bottom 20% runs. (For interpretation of the references to colour in this figure legend,
ogy 162 (2012) 210– 223 215
described in Section 2.5 was further employed to identify the opti-
mal combination of parameters that result in the lowest root meansquare error (ε). The top 35 nodes (i.e., N = 35) were expanded ateach level. Three additional values of N = {25, 15, 5} were also eval-uated, and resulted in similar performances for the 8th datasetelation coefficient (r) between the predicted and the actual titer is shown for each of runs based on the predicted titer (y-axis) or the actual titer (x-axis). Runs in the
e colored in gray; and runs in the bottom 20% class are colored in red. (a) 80 L scale.ogression of predicted titer is shown over the course of the cultures for the top andthe reader is referred to the web version of this article.)
2 echnology 162 (2012) 210– 223
(ma
vopafoc
wasHPmmfiluyccsft0rc
wc(oftdTccm(oa
tsgAw0raatradrfpsbr
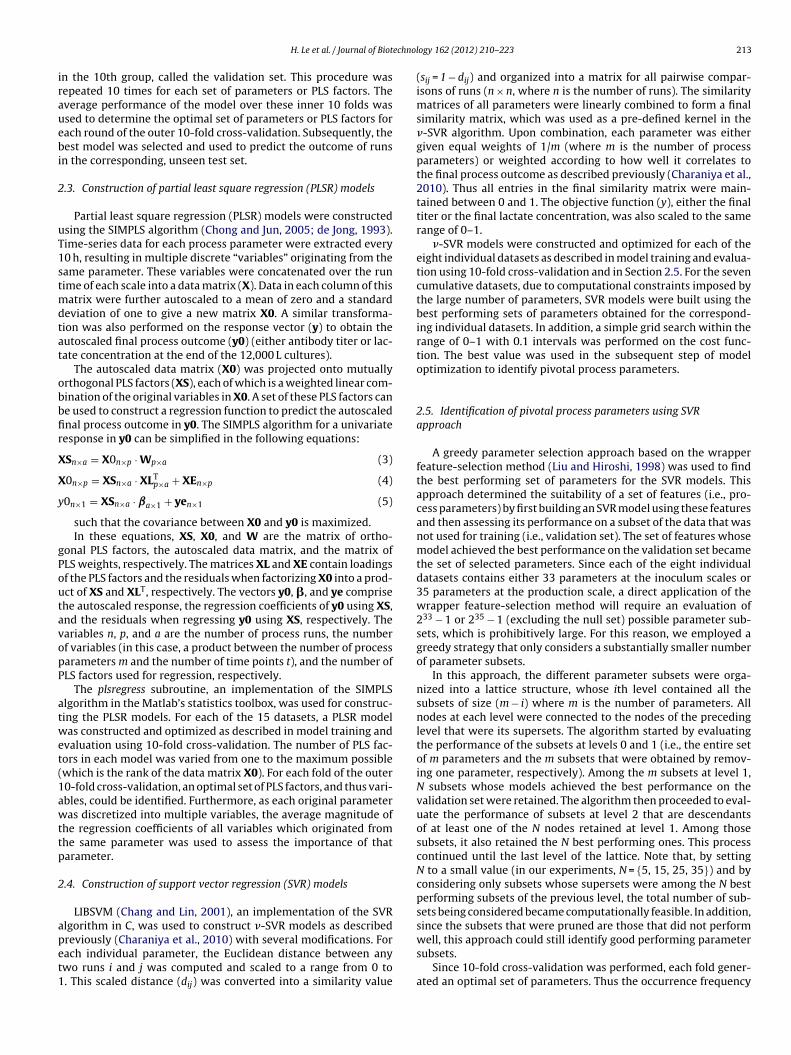
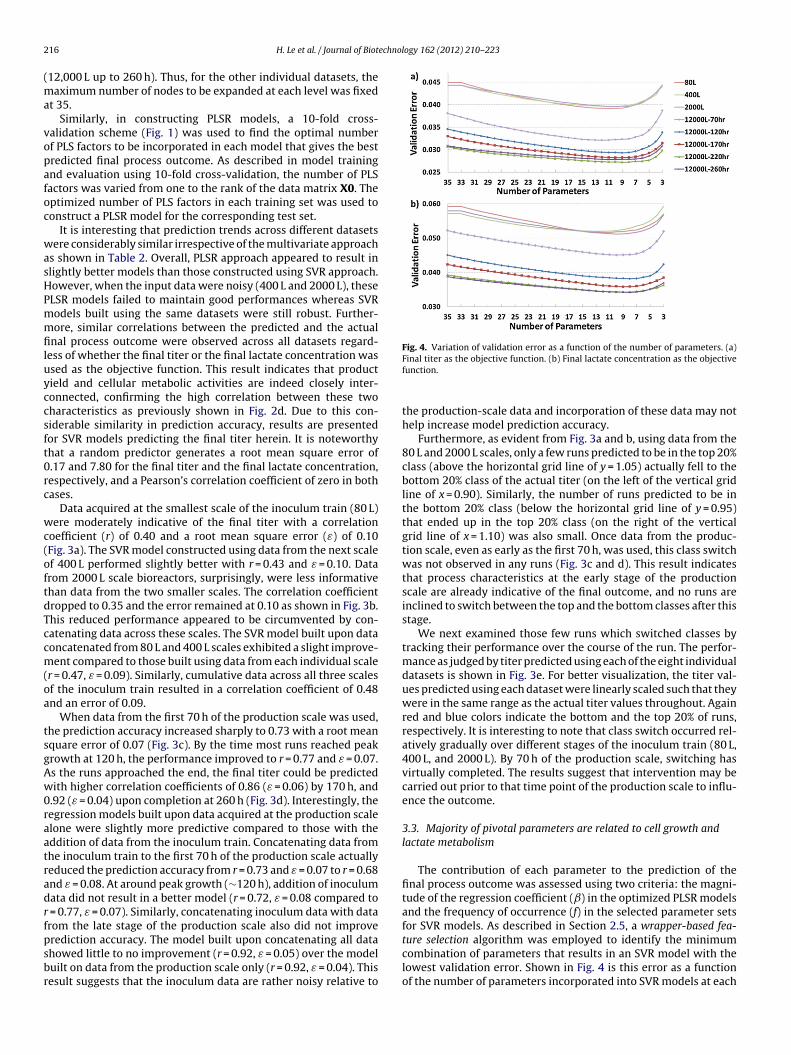
Fig. 4. Variation of validation error as a function of the number of parameters. (a)
16 H. Le et al. / Journal of Biot
12,000 L up to 260 h). Thus, for the other individual datasets, theaximum number of nodes to be expanded at each level was fixed
t 35.Similarly, in constructing PLSR models, a 10-fold cross-
alidation scheme (Fig. 1) was used to find the optimal numberf PLS factors to be incorporated in each model that gives the bestredicted final process outcome. As described in model trainingnd evaluation using 10-fold cross-validation, the number of PLSactors was varied from one to the rank of the data matrix X0. Theptimized number of PLS factors in each training set was used toonstruct a PLSR model for the corresponding test set.
It is interesting that prediction trends across different datasetsere considerably similar irrespective of the multivariate approach
s shown in Table 2. Overall, PLSR approach appeared to result inlightly better models than those constructed using SVR approach.owever, when the input data were noisy (400 L and 2000 L), theseLSR models failed to maintain good performances whereas SVRodels built using the same datasets were still robust. Further-ore, similar correlations between the predicted and the actual
nal process outcome were observed across all datasets regard-ess of whether the final titer or the final lactate concentration wassed as the objective function. This result indicates that productield and cellular metabolic activities are indeed closely inter-onnected, confirming the high correlation between these twoharacteristics as previously shown in Fig. 2d. Due to this con-iderable similarity in prediction accuracy, results are presentedor SVR models predicting the final titer herein. It is noteworthyhat a random predictor generates a root mean square error of.17 and 7.80 for the final titer and the final lactate concentration,espectively, and a Pearson’s correlation coefficient of zero in bothases.
Data acquired at the smallest scale of the inoculum train (80 L)ere moderately indicative of the final titer with a correlation
oefficient (r) of 0.40 and a root mean square error (ε) of 0.10Fig. 3a). The SVR model constructed using data from the next scalef 400 L performed slightly better with r = 0.43 and ε = 0.10. Datarom 2000 L scale bioreactors, surprisingly, were less informativehan data from the two smaller scales. The correlation coefficientropped to 0.35 and the error remained at 0.10 as shown in Fig. 3b.his reduced performance appeared to be circumvented by con-atenating data across these scales. The SVR model built upon dataoncatenated from 80 L and 400 L scales exhibited a slight improve-ent compared to those built using data from each individual scale
r = 0.47, ε = 0.09). Similarly, cumulative data across all three scalesf the inoculum train resulted in a correlation coefficient of 0.48nd an error of 0.09.
When data from the first 70 h of the production scale was used,he prediction accuracy increased sharply to 0.73 with a root meanquare error of 0.07 (Fig. 3c). By the time most runs reached peakrowth at 120 h, the performance improved to r = 0.77 and ε = 0.07.s the runs approached the end, the final titer could be predictedith higher correlation coefficients of 0.86 (ε = 0.06) by 170 h, and
.92 (ε = 0.04) upon completion at 260 h (Fig. 3d). Interestingly, theegression models built upon data acquired at the production scalelone were slightly more predictive compared to those with theddition of data from the inoculum train. Concatenating data fromhe inoculum train to the first 70 h of the production scale actuallyeduced the prediction accuracy from r = 0.73 and ε = 0.07 to r = 0.68nd ε = 0.08. At around peak growth (∼120 h), addition of inoculumata did not result in a better model (r = 0.72, ε = 0.08 compared to
= 0.77, ε = 0.07). Similarly, concatenating inoculum data with datarom the late stage of the production scale also did not improve
rediction accuracy. The model built upon concatenating all datahowed little to no improvement (r = 0.92, ε = 0.05) over the modeluilt on data from the production scale only (r = 0.92, ε = 0.04). Thisesult suggests that the inoculum data are rather noisy relative toFinal titer as the objective function. (b) Final lactate concentration as the objectivefunction.
the production-scale data and incorporation of these data may nothelp increase model prediction accuracy.
Furthermore, as evident from Fig. 3a and b, using data from the80 L and 2000 L scales, only a few runs predicted to be in the top 20%class (above the horizontal grid line of y = 1.05) actually fell to thebottom 20% class of the actual titer (on the left of the vertical gridline of x = 0.90). Similarly, the number of runs predicted to be inthe bottom 20% class (below the horizontal grid line of y = 0.95)that ended up in the top 20% class (on the right of the verticalgrid line of x = 1.10) was also small. Once data from the produc-tion scale, even as early as the first 70 h, was used, this class switchwas not observed in any runs (Fig. 3c and d). This result indicatesthat process characteristics at the early stage of the productionscale are already indicative of the final outcome, and no runs areinclined to switch between the top and the bottom classes after thisstage.
We next examined those few runs which switched classes bytracking their performance over the course of the run. The perfor-mance as judged by titer predicted using each of the eight individualdatasets is shown in Fig. 3e. For better visualization, the titer val-ues predicted using each dataset were linearly scaled such that theywere in the same range as the actual titer values throughout. Againred and blue colors indicate the bottom and the top 20% of runs,respectively. It is interesting to note that class switch occurred rel-atively gradually over different stages of the inoculum train (80 L,400 L, and 2000 L). By 70 h of the production scale, switching hasvirtually completed. The results suggest that intervention may becarried out prior to that time point of the production scale to influ-ence the outcome.
3.3. Majority of pivotal parameters are related to cell growth andlactate metabolism
The contribution of each parameter to the prediction of thefinal process outcome was assessed using two criteria: the magni-tude of the regression coefficient (ˇ) in the optimized PLSR modelsand the frequency of occurrence (f) in the selected parameter setsfor SVR models. As described in Section 2.5, a wrapper-based fea-
ture selection algorithm was employed to identify the minimumcombination of parameters that results in an SVR model with thelowest validation error. Shown in Fig. 4 is this error as a functionof the number of parameters incorporated into SVR models at each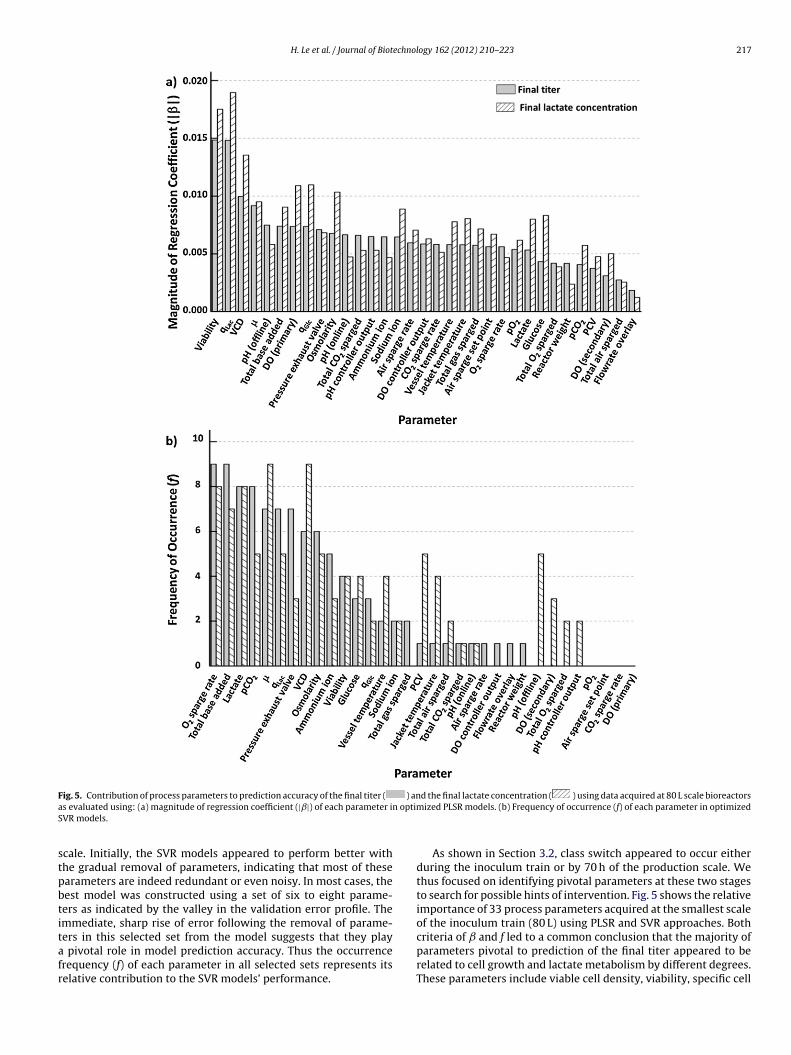
H. Le et al. / Journal of Biotechnology 162 (2012) 210– 223 217
F ) ana n optimS
stpbtitafr
ig. 5. Contribution of process parameters to prediction accuracy of the final titer (
s evaluated using: (a) magnitude of regression coefficient (|ˇ|) of each parameter iVR models.
cale. Initially, the SVR models appeared to perform better withhe gradual removal of parameters, indicating that most of thesearameters are indeed redundant or even noisy. In most cases, theest model was constructed using a set of six to eight parame-ers as indicated by the valley in the validation error profile. Themmediate, sharp rise of error following the removal of parame-
ers in this selected set from the model suggests that they playpivotal role in model prediction accuracy. Thus the occurrencerequency (f) of each parameter in all selected sets represents itselative contribution to the SVR models’ performance.
d the final lactate concentration ( ) using data acquired at 80 L scale bioreactorsized PLSR models. (b) Frequency of occurrence (f) of each parameter in optimized
As shown in Section 3.2, class switch appeared to occur eitherduring the inoculum train or by 70 h of the production scale. Wethus focused on identifying pivotal parameters at these two stagesto search for possible hints of intervention. Fig. 5 shows the relativeimportance of 33 process parameters acquired at the smallest scaleof the inoculum train (80 L) using PLSR and SVR approaches. Both
criteria of and f led to a common conclusion that the majority ofparameters pivotal to prediction of the final titer appeared to berelated to cell growth and lactate metabolism by different degrees.These parameters include viable cell density, viability, specific cell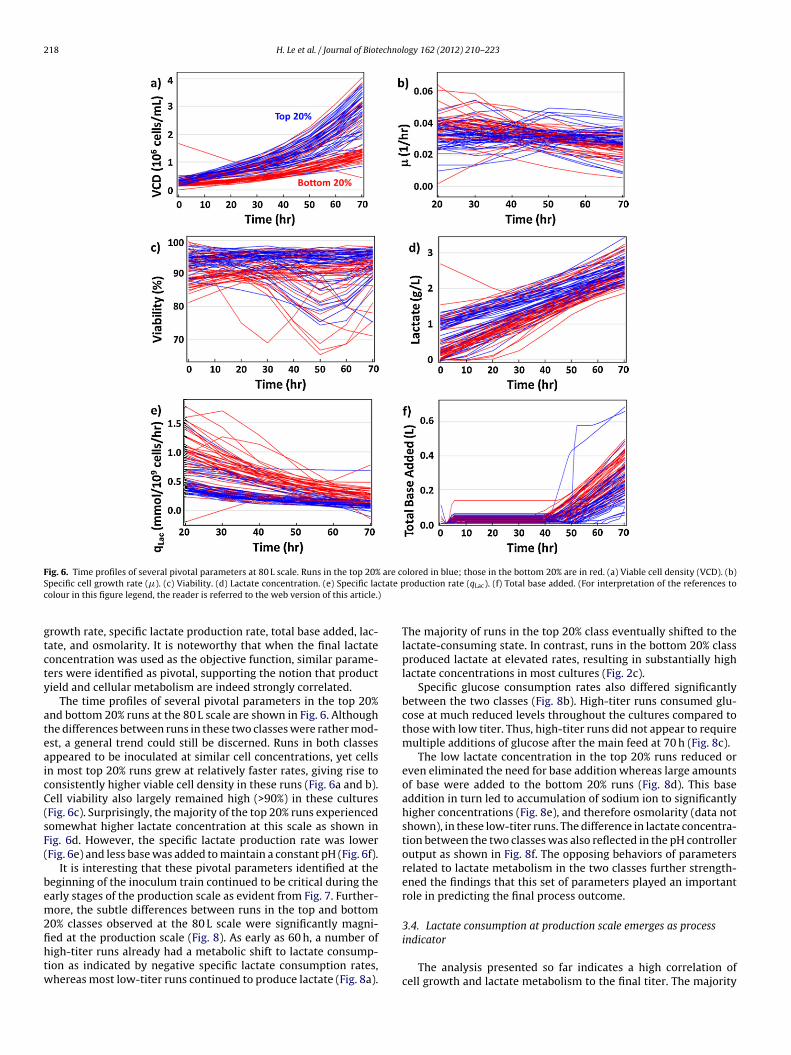
218 H. Le et al. / Journal of Biotechnology 162 (2012) 210– 223
Fig. 6. Time profiles of several pivotal parameters at 80 L scale. Runs in the top 20% are colored in blue; those in the bottom 20% are in red. (a) Viable cell density (VCD). (b)S tate pc
gtcty
ateaicC(sF(
bem2fihtw
pecific cell growth rate (�). (c) Viability. (d) Lactate concentration. (e) Specific lacolour in this figure legend, the reader is referred to the web version of this article.)
rowth rate, specific lactate production rate, total base added, lac-ate, and osmolarity. It is noteworthy that when the final lactateoncentration was used as the objective function, similar parame-ers were identified as pivotal, supporting the notion that productield and cellular metabolism are indeed strongly correlated.
The time profiles of several pivotal parameters in the top 20%nd bottom 20% runs at the 80 L scale are shown in Fig. 6. Althoughhe differences between runs in these two classes were rather mod-st, a general trend could still be discerned. Runs in both classesppeared to be inoculated at similar cell concentrations, yet cellsn most top 20% runs grew at relatively faster rates, giving rise toonsistently higher viable cell density in these runs (Fig. 6a and b).ell viability also largely remained high (>90%) in these culturesFig. 6c). Surprisingly, the majority of the top 20% runs experiencedomewhat higher lactate concentration at this scale as shown inig. 6d. However, the specific lactate production rate was lowerFig. 6e) and less base was added to maintain a constant pH (Fig. 6f).
It is interesting that these pivotal parameters identified at theeginning of the inoculum train continued to be critical during thearly stages of the production scale as evident from Fig. 7. Further-ore, the subtle differences between runs in the top and bottom
0% classes observed at the 80 L scale were significantly magni-
ed at the production scale (Fig. 8). As early as 60 h, a number ofigh-titer runs already had a metabolic shift to lactate consump-ion as indicated by negative specific lactate consumption rates,hereas most low-titer runs continued to produce lactate (Fig. 8a).roduction rate (qLac). (f) Total base added. (For interpretation of the references to
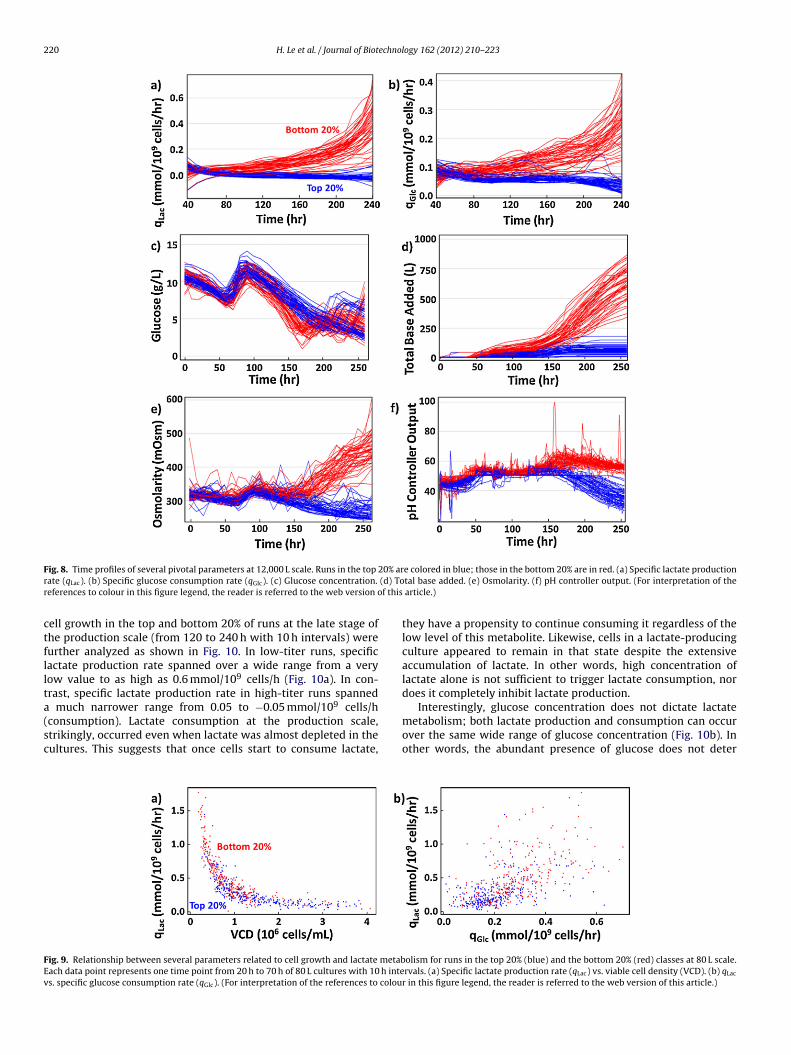
The majority of runs in the top 20% class eventually shifted to thelactate-consuming state. In contrast, runs in the bottom 20% classproduced lactate at elevated rates, resulting in substantially highlactate concentrations in most cultures (Fig. 2c).
Specific glucose consumption rates also differed significantlybetween the two classes (Fig. 8b). High-titer runs consumed glu-cose at much reduced levels throughout the cultures compared tothose with low titer. Thus, high-titer runs did not appear to requiremultiple additions of glucose after the main feed at 70 h (Fig. 8c).
The low lactate concentration in the top 20% runs reduced oreven eliminated the need for base addition whereas large amountsof base were added to the bottom 20% runs (Fig. 8d). This baseaddition in turn led to accumulation of sodium ion to significantlyhigher concentrations (Fig. 8e), and therefore osmolarity (data notshown), in these low-titer runs. The difference in lactate concentra-tion between the two classes was also reflected in the pH controlleroutput as shown in Fig. 8f. The opposing behaviors of parametersrelated to lactate metabolism in the two classes further strength-ened the findings that this set of parameters played an importantrole in predicting the final process outcome.
3.4. Lactate consumption at production scale emerges as process
indicatorThe analysis presented so far indicates a high correlation ofcell growth and lactate metabolism to the final titer. The majority
H. Le et al. / Journal of Biotechnology 162 (2012) 210– 223 219
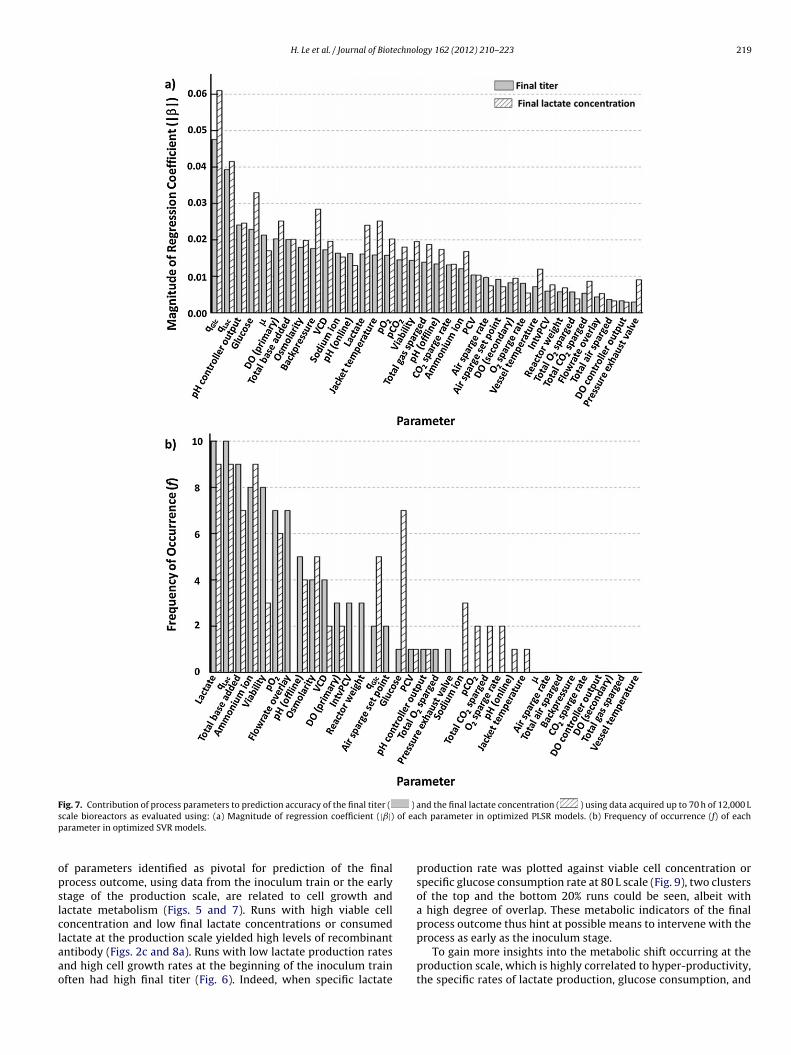
Fig. 7. Contribution of process parameters to prediction accuracy of the final titer ( ) and the final lactate concentration ( ) using data acquired up to 70 h of 12,000 Ls of eap
opslclaao
cale bioreactors as evaluated using: (a) Magnitude of regression coefficient (|ˇ|)arameter in optimized SVR models.
f parameters identified as pivotal for prediction of the finalrocess outcome, using data from the inoculum train or the earlytage of the production scale, are related to cell growth andactate metabolism (Figs. 5 and 7). Runs with high viable celloncentration and low final lactate concentrations or consumed
actate at the production scale yielded high levels of recombinantntibody (Figs. 2c and 8a). Runs with low lactate production ratesnd high cell growth rates at the beginning of the inoculum trainften had high final titer (Fig. 6). Indeed, when specific lactatech parameter in optimized PLSR models. (b) Frequency of occurrence (f) of each
production rate was plotted against viable cell concentration orspecific glucose consumption rate at 80 L scale (Fig. 9), two clustersof the top and the bottom 20% runs could be seen, albeit witha high degree of overlap. These metabolic indicators of the finalprocess outcome thus hint at possible means to intervene with the
process as early as the inoculum stage.To gain more insights into the metabolic shift occurring at theproduction scale, which is highly correlated to hyper-productivity,the specific rates of lactate production, glucose consumption, and
220 H. Le et al. / Journal of Biotechnology 162 (2012) 210– 223
F 20% arr (d) Tor f this
ctfllta(sc
FEv
ig. 8. Time profiles of several pivotal parameters at 12,000 L scale. Runs in the top
ate (qLac). (b) Specific glucose consumption rate (qGlc). (c) Glucose concentration.
eferences to colour in this figure legend, the reader is referred to the web version o
ell growth in the top and bottom 20% of runs at the late stage ofhe production scale (from 120 to 240 h with 10 h intervals) wereurther analyzed as shown in Fig. 10. In low-titer runs, specificactate production rate spanned over a wide range from a veryow value to as high as 0.6 mmol/109 cells/h (Fig. 10a). In con-rast, specific lactate production rate in high-titer runs spanned
much narrower range from 0.05 to −0.05 mmol/109 cells/h
consumption). Lactate consumption at the production scale,trikingly, occurred even when lactate was almost depleted in theultures. This suggests that once cells start to consume lactate,ig. 9. Relationship between several parameters related to cell growth and lactate metabach data point represents one time point from 20 h to 70 h of 80 L cultures with 10 h intes. specific glucose consumption rate (qGlc). (For interpretation of the references to colou
e colored in blue; those in the bottom 20% are in red. (a) Specific lactate productiontal base added. (e) Osmolarity. (f) pH controller output. (For interpretation of the
article.)
they have a propensity to continue consuming it regardless of thelow level of this metabolite. Likewise, cells in a lactate-producingculture appeared to remain in that state despite the extensiveaccumulation of lactate. In other words, high concentration oflactate alone is not sufficient to trigger lactate consumption, nordoes it completely inhibit lactate production.
Interestingly, glucose concentration does not dictate lactate
metabolism; both lactate production and consumption can occurover the same wide range of glucose concentration (Fig. 10b). Inother words, the abundant presence of glucose does not deterolism for runs in the top 20% (blue) and the bottom 20% (red) classes at 80 L scale.rvals. (a) Specific lactate production rate (qLac) vs. viable cell density (VCD). (b) qLac
r in this figure legend, the reader is referred to the web version of this article.)

H. Le et al. / Journal of Biotechnology 162 (2012) 210– 223 221
Fig. 10. Relationship among several parameters related to cell growth and lactate metabolism for runs in the top 20% (blue) and the bottom 20% (red) classes in the late stageof the production scale. Each data point represents one time point from 120 h to 240 h of 12,000 L cultures with 10 h intervals. The dashed line represents qLac = 0. (a) Specificlactate production rate (qLac) vs. lactate concentration. (b) qLac vs. glucose concentration. (c) qLac vs. specific glucose consumption rate (q ). (d) q vs. glucose concentration.( erenca
lo0mtaFclbtK
sigcmcvtcgc
e) qLac vs. specific cell growth rate (�). (f) qGlc vs. �. (For interpretation of the refrticle.)
actate consumption. It is evident that lactate consumption occursnly when the specific glucose consumption rate is low (below.07–0.1 mmol/109 cells/h) (Fig. 10c). There also seems to be ainimum specific glucose consumption rate that cells sustain, as
he value never reaches zero. Furthermore, glucose concentrationlone does not determine glucose consumption, as can be seen inig. 10d. There is virtually no difference in the range of glucoseoncentration between metabolically shifted cultures (qLac ≤ 0 andow qGlc) and “typical” cultures (high qLac and high qGlc). It shoulde noted that the glucose concentrations in all cultures were main-ained at more than 3 g/L, substantially higher than the reportedm of the GLUT1 transporter for glucose (approximately 0.18 g/L).
It is interesting to observe that lactate consumption is nottrongly dependent on how much cell growth slowed down dur-ng the late stage of the production scale (Fig. 10e). The specificrowth rate spans over a wide and similar range for both lactate-onsuming and lactate-producing cultures, although somewhatore frequent occurrence of slower growth rates is seen in lactate-
onsuming cultures. Likewise, the glucose consumption rate canary greatly regardless of specific cell growth rate (Fig. 10f). Taken
ogether, these observations indicate that the potential of cells toonsume lactate in the late stage is largely a function of reducedlycolytic flux rather than of glucose or lactate concentration orell growth.Glc Glc
es to colour in this figure legend, the reader is referred to the web version of this
4. Discussion
The immense volume of cell culture bioprocess data in historicalarchives certainly holds valuable insights into manufacturing pro-cesses and product characteristics. This resource has begun to beexplored to generate process insights using multivariate data anal-ysis tools. This study employed two such tools, SVR and PLSR, toinvestigate process data from more than two hundred production-scale cultures. Both methods could predict process performancewith similar high accuracies if data from the production bioreac-tors were used with the objective function being either the finaltiter or the final lactate concentration.
Data acquired at the inoculum train alone (80, 400 and 2000 Lreactors) were somewhat less predictive of the final processoutcome compared to the production-scale data. The difference inprediction accuracy between these two sets of data is largely dueto the difference in their culturing mode. The duration in each seedtrain reactor is shorter (3–4 d) and the cell concentration achievedis lower when compared to the production culture. The values ofprocess parameters which can be used for prediction are lower,
and so are the differences in parameter values between high-and low-performing runs. Thus, data acquired from the seed trainare not as accurate in predicting the final titer as the productiondata. Although the seed run data do not provide a highly accurate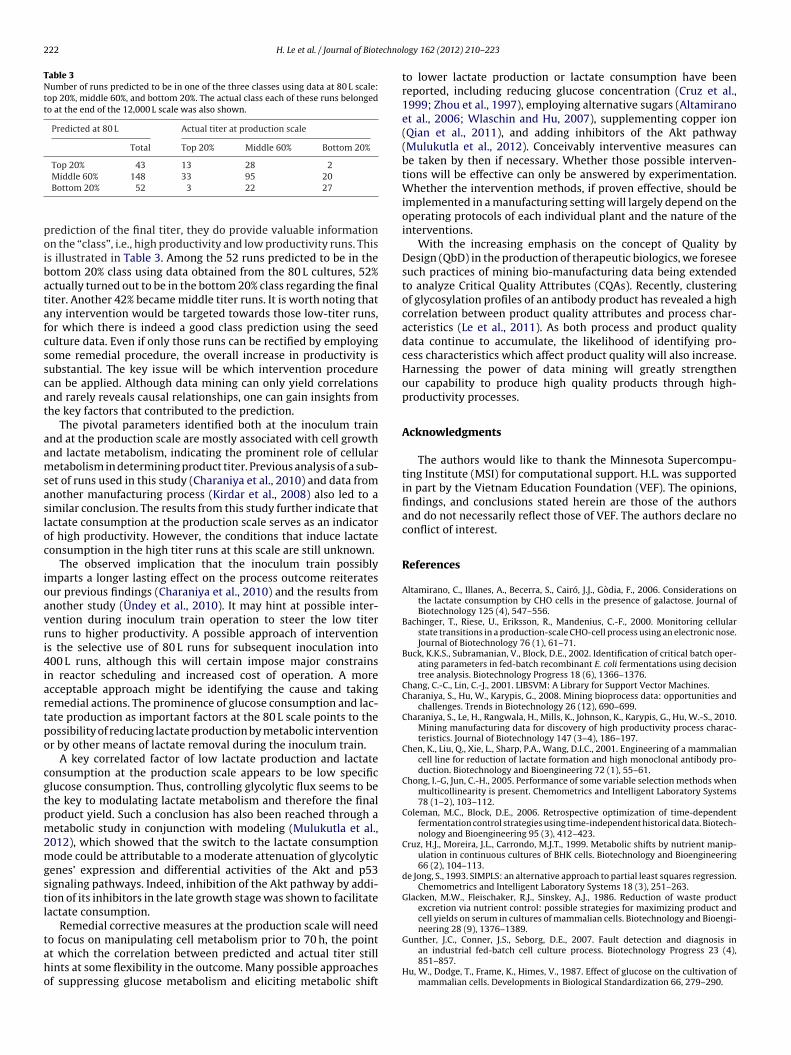
222 H. Le et al. / Journal of Biotechnol
Table 3Number of runs predicted to be in one of the three classes using data at 80 L scale:top 20%, middle 60%, and bottom 20%. The actual class each of these runs belongedto at the end of the 12,000 L scale was also shown.
Predicted at 80 L Actual titer at production scale
Total Top 20% Middle 60% Bottom 20%
Top 20% 43 13 28 2
poibatafcsscat
aamsasloc
ioavri4iartpo
cgtpm2mgstl
taho
Middle 60% 148 33 95 20Bottom 20% 52 3 22 27
rediction of the final titer, they do provide valuable informationn the “class”, i.e., high productivity and low productivity runs. Thiss illustrated in Table 3. Among the 52 runs predicted to be in theottom 20% class using data obtained from the 80 L cultures, 52%ctually turned out to be in the bottom 20% class regarding the finaliter. Another 42% became middle titer runs. It is worth noting thatny intervention would be targeted towards those low-titer runs,or which there is indeed a good class prediction using the seedulture data. Even if only those runs can be rectified by employingome remedial procedure, the overall increase in productivity isubstantial. The key issue will be which intervention procedurean be applied. Although data mining can only yield correlationsnd rarely reveals causal relationships, one can gain insights fromhe key factors that contributed to the prediction.
The pivotal parameters identified both at the inoculum trainnd at the production scale are mostly associated with cell growthnd lactate metabolism, indicating the prominent role of cellularetabolism in determining product titer. Previous analysis of a sub-
et of runs used in this study (Charaniya et al., 2010) and data fromnother manufacturing process (Kirdar et al., 2008) also led to aimilar conclusion. The results from this study further indicate thatactate consumption at the production scale serves as an indicatorf high productivity. However, the conditions that induce lactateonsumption in the high titer runs at this scale are still unknown.
The observed implication that the inoculum train possiblymparts a longer lasting effect on the process outcome reiteratesur previous findings (Charaniya et al., 2010) and the results fromnother study (Ündey et al., 2010). It may hint at possible inter-ention during inoculum train operation to steer the low titeruns to higher productivity. A possible approach of interventions the selective use of 80 L runs for subsequent inoculation into00 L runs, although this will certain impose major constrains
n reactor scheduling and increased cost of operation. A morecceptable approach might be identifying the cause and takingemedial actions. The prominence of glucose consumption and lac-ate production as important factors at the 80 L scale points to theossibility of reducing lactate production by metabolic interventionr by other means of lactate removal during the inoculum train.
A key correlated factor of low lactate production and lactateonsumption at the production scale appears to be low specificlucose consumption. Thus, controlling glycolytic flux seems to behe key to modulating lactate metabolism and therefore the finalroduct yield. Such a conclusion has also been reached through aetabolic study in conjunction with modeling (Mulukutla et al.,
012), which showed that the switch to the lactate consumptionode could be attributable to a moderate attenuation of glycolytic
enes’ expression and differential activities of the Akt and p53ignaling pathways. Indeed, inhibition of the Akt pathway by addi-ion of its inhibitors in the late growth stage was shown to facilitateactate consumption.
Remedial corrective measures at the production scale will need
o focus on manipulating cell metabolism prior to 70 h, the pointt which the correlation between predicted and actual titer stillints at some flexibility in the outcome. Many possible approachesf suppressing glucose metabolism and eliciting metabolic shiftogy 162 (2012) 210– 223
to lower lactate production or lactate consumption have beenreported, including reducing glucose concentration (Cruz et al.,1999; Zhou et al., 1997), employing alternative sugars (Altamiranoet al., 2006; Wlaschin and Hu, 2007), supplementing copper ion(Qian et al., 2011), and adding inhibitors of the Akt pathway(Mulukutla et al., 2012). Conceivably interventive measures canbe taken by then if necessary. Whether those possible interven-tions will be effective can only be answered by experimentation.Whether the intervention methods, if proven effective, should beimplemented in a manufacturing setting will largely depend on theoperating protocols of each individual plant and the nature of theinterventions.
With the increasing emphasis on the concept of Quality byDesign (QbD) in the production of therapeutic biologics, we foreseesuch practices of mining bio-manufacturing data being extendedto analyze Critical Quality Attributes (CQAs). Recently, clusteringof glycosylation profiles of an antibody product has revealed a highcorrelation between product quality attributes and process char-acteristics (Le et al., 2011). As both process and product qualitydata continue to accumulate, the likelihood of identifying pro-cess characteristics which affect product quality will also increase.Harnessing the power of data mining will greatly strengthenour capability to produce high quality products through high-productivity processes.
Acknowledgments
The authors would like to thank the Minnesota Supercompu-ting Institute (MSI) for computational support. H.L. was supportedin part by the Vietnam Education Foundation (VEF). The opinions,findings, and conclusions stated herein are those of the authorsand do not necessarily reflect those of VEF. The authors declare noconflict of interest.
References
Altamirano, C., Illanes, A., Becerra, S., Cairó, J.J., Gòdia, F., 2006. Considerations onthe lactate consumption by CHO cells in the presence of galactose. Journal ofBiotechnology 125 (4), 547–556.
Bachinger, T., Riese, U., Eriksson, R., Mandenius, C.-F., 2000. Monitoring cellularstate transitions in a production-scale CHO-cell process using an electronic nose.Journal of Biotechnology 76 (1), 61–71.
Buck, K.K.S., Subramanian, V., Block, D.E., 2002. Identification of critical batch oper-ating parameters in fed-batch recombinant E. coli fermentations using decisiontree analysis. Biotechnology Progress 18 (6), 1366–1376.
Chang, C.-C., Lin, C.-J., 2001. LIBSVM: A Library for Support Vector Machines.Charaniya, S., Hu, W., Karypis, G., 2008. Mining bioprocess data: opportunities and
challenges. Trends in Biotechnology 26 (12), 690–699.Charaniya, S., Le, H., Rangwala, H., Mills, K., Johnson, K., Karypis, G., Hu, W.-S., 2010.
Mining manufacturing data for discovery of high productivity process charac-teristics. Journal of Biotechnology 147 (3–4), 186–197.
Chen, K., Liu, Q., Xie, L., Sharp, P.A., Wang, D.I.C., 2001. Engineering of a mammaliancell line for reduction of lactate formation and high monoclonal antibody pro-duction. Biotechnology and Bioengineering 72 (1), 55–61.
Chong, I.-G, Jun, C.-H., 2005. Performance of some variable selection methods whenmulticollinearity is present. Chemometrics and Intelligent Laboratory Systems78 (1–2), 103–112.
Coleman, M.C., Block, D.E., 2006. Retrospective optimization of time-dependentfermentation control strategies using time-independent historical data. Biotech-nology and Bioengineering 95 (3), 412–423.
Cruz, H.J., Moreira, J.L., Carrondo, M.J.T., 1999. Metabolic shifts by nutrient manip-ulation in continuous cultures of BHK cells. Biotechnology and Bioengineering66 (2), 104–113.
de Jong, S., 1993. SIMPLS: an alternative approach to partial least squares regression.Chemometrics and Intelligent Laboratory Systems 18 (3), 251–263.
Glacken, M.W., Fleischaker, R.J., Sinskey, A.J., 1986. Reduction of waste productexcretion via nutrient control: possible strategies for maximizing product andcell yields on serum in cultures of mammalian cells. Biotechnology and Bioengi-neering 28 (9), 1376–1389.
Gunther, J.C., Conner, J.S., Seborg, D.E., 2007. Fault detection and diagnosis inan industrial fed-batch cell culture process. Biotechnology Progress 23 (4),851–857.
Hu, W., Dodge, T., Frame, K., Himes, V., 1987. Effect of glucose on the cultivation ofmammalian cells. Developments in Biological Standardization 66, 279–290.

echnol
I
K
K
K
L
H. Le et al. / Journal of Biot
rani, N., Wirth, M., van den Heuvel, J., Wagner, R., 1999. Improvement ofthe primary metabolism of cell cultures by introducing a new cytoplas-mic pyruvate carboxylase reaction. Biotechnology and Bioengineering 66 (4),238–246.
im, S., Lee, G., 2007a. Down-regulation of lactate dehydrogenase-A by siRNAs forreduced lactic acid formation of Chinese hamster ovary cells producing throm-bopoietin. Applied Microbiology and Biotechnology 74 (1), 152–159.
im, S., Lee, G., 2007b. Functional expression of human pyruvate carboxylase forreduced lactic acid formation of Chinese hamster ovary cells (DG44). AppliedMicrobiology and Biotechnology 76 (3), 659–665.
irdar, A.O., Green, K.D., Rathore, A.S., 2008. Application of multivariate data analysisfor identification and successful resolution of a root cause for a bioprocessingapplication. Biotechnology Progress 24 (3), 720–726.
e, H., Castro-Melchor, M., Hakemeyer, C., Jung, C., Szperalski, B., Karypis, G., Hu,W.-S., 2011. Mining bioprocess data for discovery of key parameters influencinghigh productivity and quality. In: Proceedings of the 22nd Annual Meeting ofthe European Society for Animal Cell Technology (ESACT), Vienna, Austria, May15–18. Springer.
ogy 162 (2012) 210– 223 223
Liu, H., Hiroshi, M., 1998. Feature Selection for Knowledge Discovery and Data Min-ing. Springer, Norwell, 244 pp.
Mulukutla, B.C., Gramer, M., Hu, W.-S., 2012. On metabolic shift to lactate con-sumption in fed-batch culture of mammalian cells. Metabolic Engineering 14(2), 138–149.
Qian, Y., Khattak, S.F., Xing, Z., He, A., Kayne, P.S., Qian, N.-X., Pan, S.-H., Li, Z.J., 2011.Cell culture and gene transcription effects of copper sulfate on Chinese hamsterovary cells. Biotechnology Progress 27 (4), 1190–1194.
Ündey, C., 2004. Intelligent real-time performance monitoring and quality predic-tion for batch/fed-batch cultivations. Journal of Biotechnology 108 (1), 61–77.
Ündey, C., Ertunc , S., Mistretta, T., Looze, B., 2010. Applied advanced process analyt-ics in biopharmaceutical manufacturing: challenges and prospects in real-timemonitoring and control. Journal of Process Control 20 (9), 1009–1018.
Wlaschin, K., Hu, W., 2007. Engineering cell metabolism for high-density cell culturevia manipulation of sugar transport. Journal of Biotechnology 131 (2), 168–176.
Zhou, W., Chen, C.-C., Buckland, B., Aunins, J., 1997. Fed-batch culture of recombinantNS0 myeloma cells with high monoclonal antibody production. Biotechnologyand Bioengineering 55 (5), 783–792.