Embed Size (px)
Citation preview
Methodology and Statistics 1
Multivariate Multivariate ANOVA &ANOVA &Repeated Measures Repeated Measures
Hanneke Loerts
April 16, 2008
Methodology and Statistics 2
OutlineOutline
• Introduction
• Multivariate ANOVA (MANOVA)
• Repeated Measures ANOVA
• Some data and analyses
Methodology and Statistics 3
IntroductionIntroduction
• When comparing two groups� T-test
• When comparing three or more groups� ANOVA
Methodology and Statistics 4
MANOVAMANOVA
• Multivariate Analysis of Variance– Compares 3 or more groups– Compares variation between groups with
variation within groups
• Difference: MANOVA is used when we have 2 or more dependent variables
Methodology and Statistics 5
An exampleAn example
• Test effect of a new antidepressant (=IV)– Half of patients get the real drug– Half of patients get a placebo
• Effect is tested with BDI (=DV)– Beck Depression Index scores (a self-rated
depression inventory)
• In this case � T-test
6
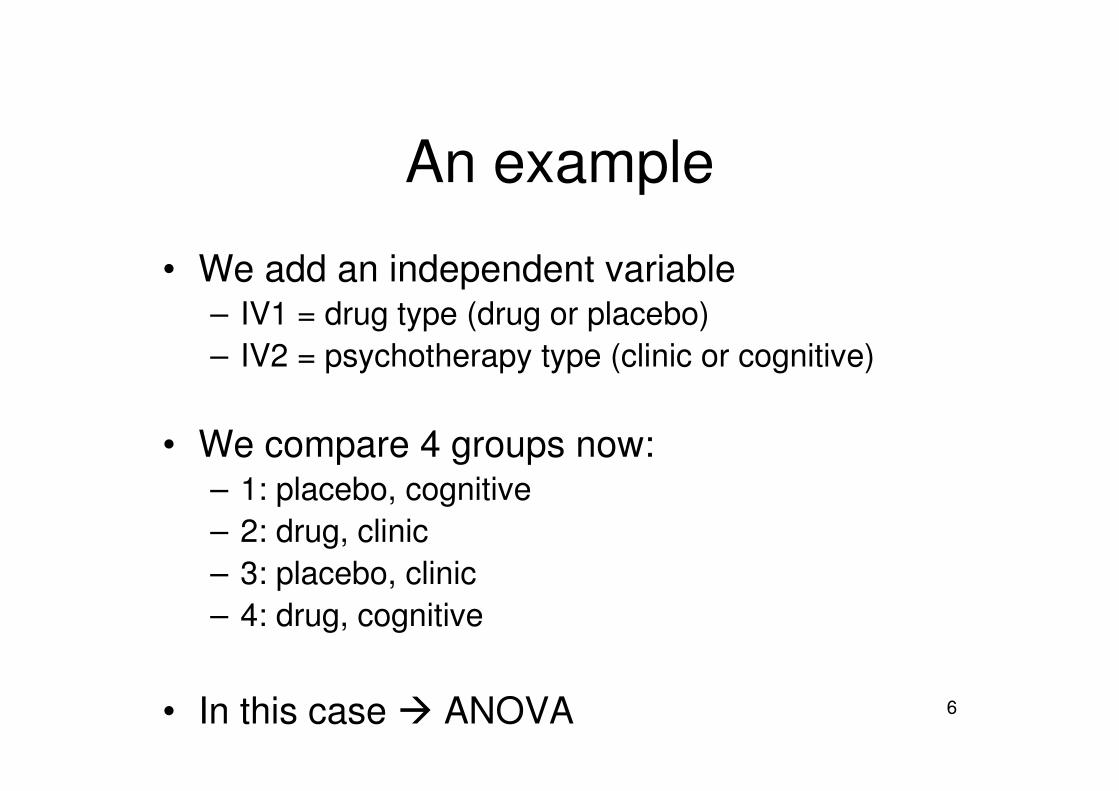
An example
• We add an independent variable– IV1 = drug type (drug or placebo)– IV2 = psychotherapy type (clinic or cognitive)
• We compare 4 groups now:– 1: placebo, cognitive– 2: drug, clinic– 3: placebo, clinic– 4: drug, cognitive
• In this case � ANOVA
Methodology and Statistics 7
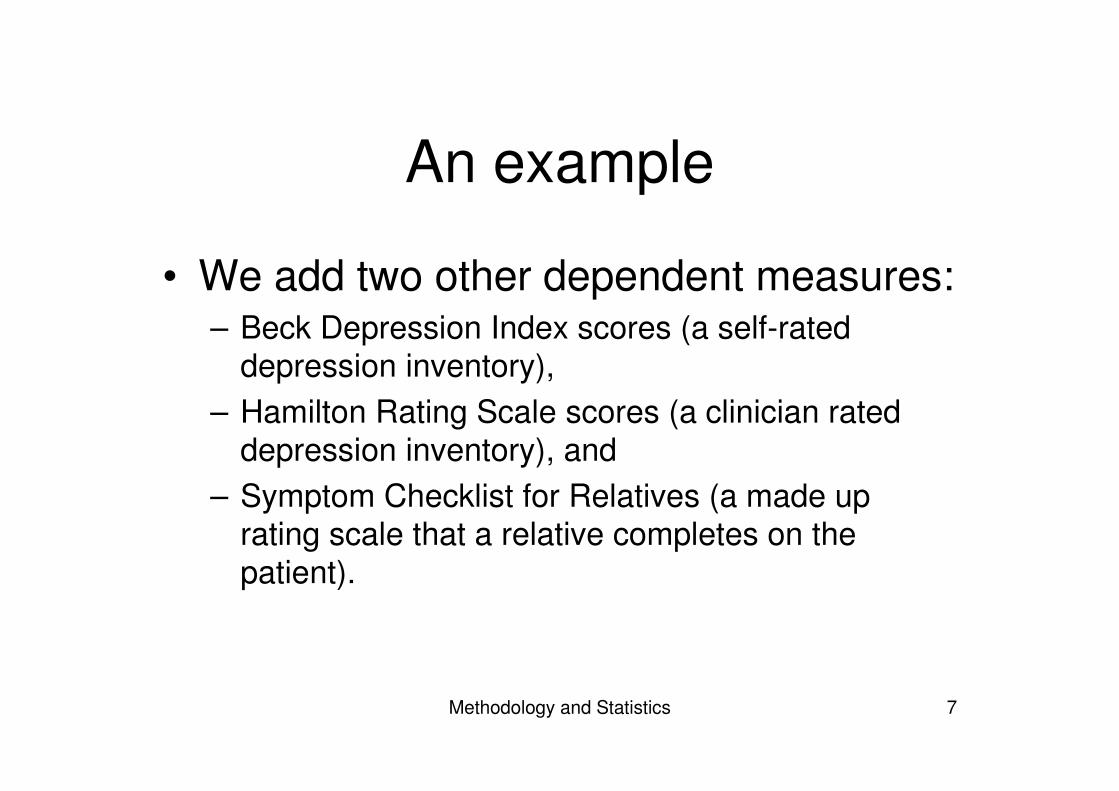
An example
• We add two other dependent measures:– Beck Depression Index scores (a self-rated
depression inventory),– Hamilton Rating Scale scores (a clinician rated
depression inventory), and – Symptom Checklist for Relatives (a made up
rating scale that a relative completes on the patient).
8
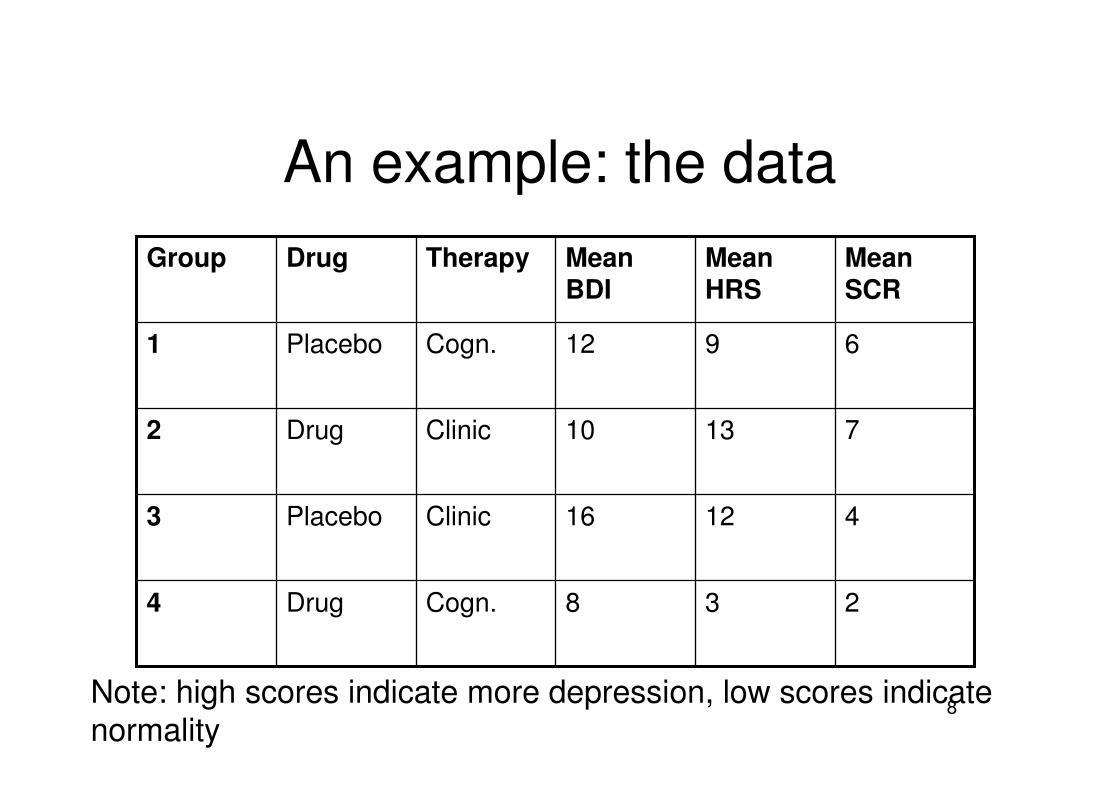
An example: the data
238Cogn.Drug 4
41216ClinicPlacebo3
71310ClinicDrug2
6912Cogn.Placebo1
MeanSCR
MeanHRS
MeanBDI
TherapyDrugGroup
Note: high scores indicate more depression, low scores indicate normality
Methodology and Statistics 9
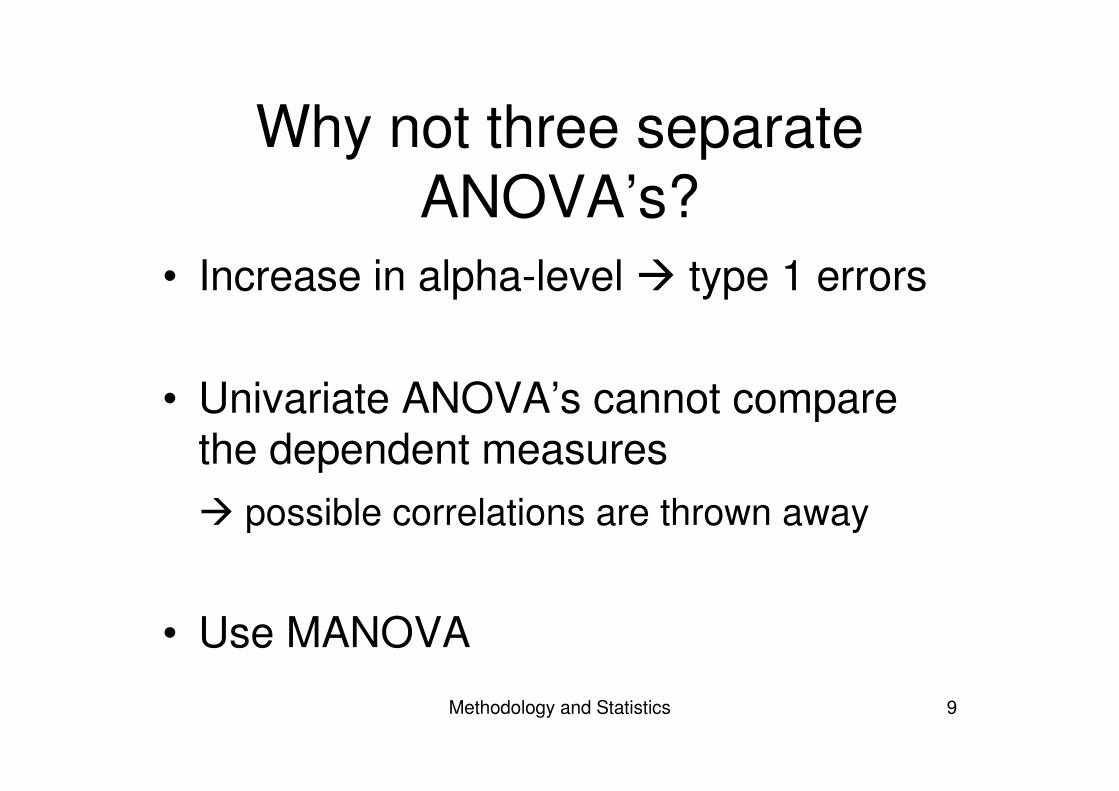
Why not three separate ANOVA’s?
• Increase in alpha-level � type 1 errors
• Univariate ANOVA’s cannot compare the dependent measures� possible correlations are thrown away
• Use MANOVA
Methodology and Statistics 10
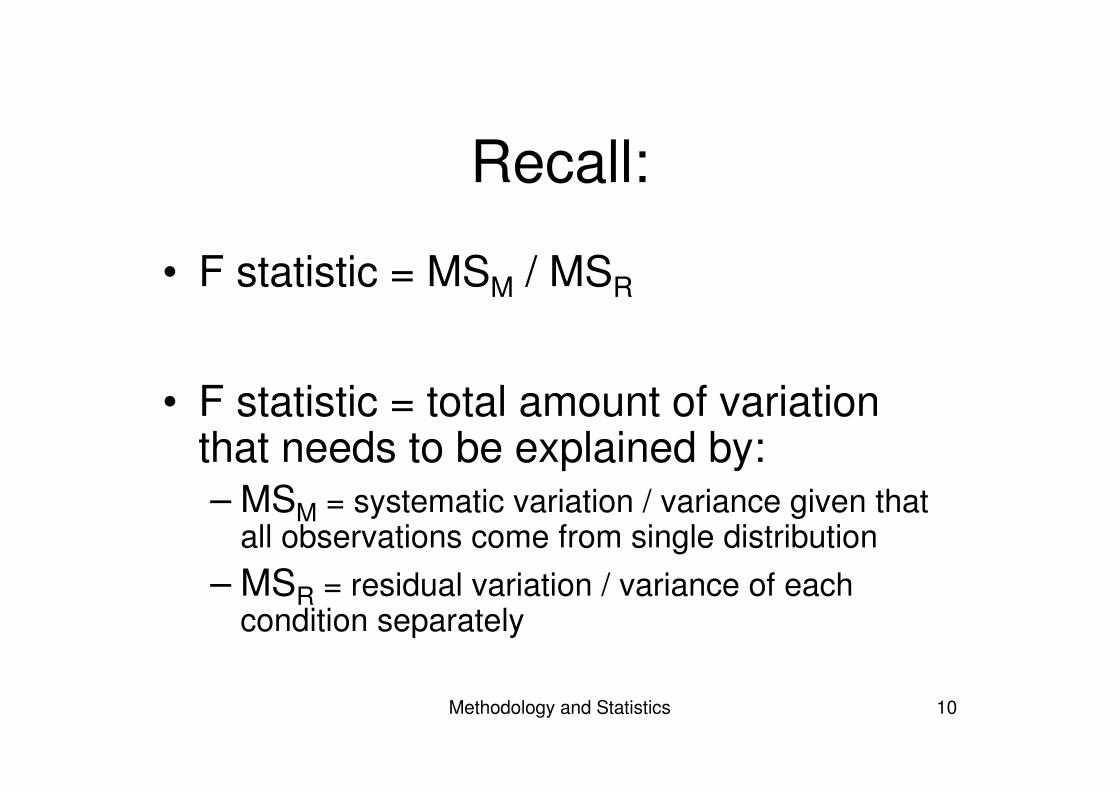
Recall:
• F statistic = MSM / MSR
• F statistic = total amount of variation that needs to be explained by:– MSM = systematic variation / variance given that
all observations come from single distribution– MSR = residual variation / variance of each
condition separately
Methodology and Statistics 11
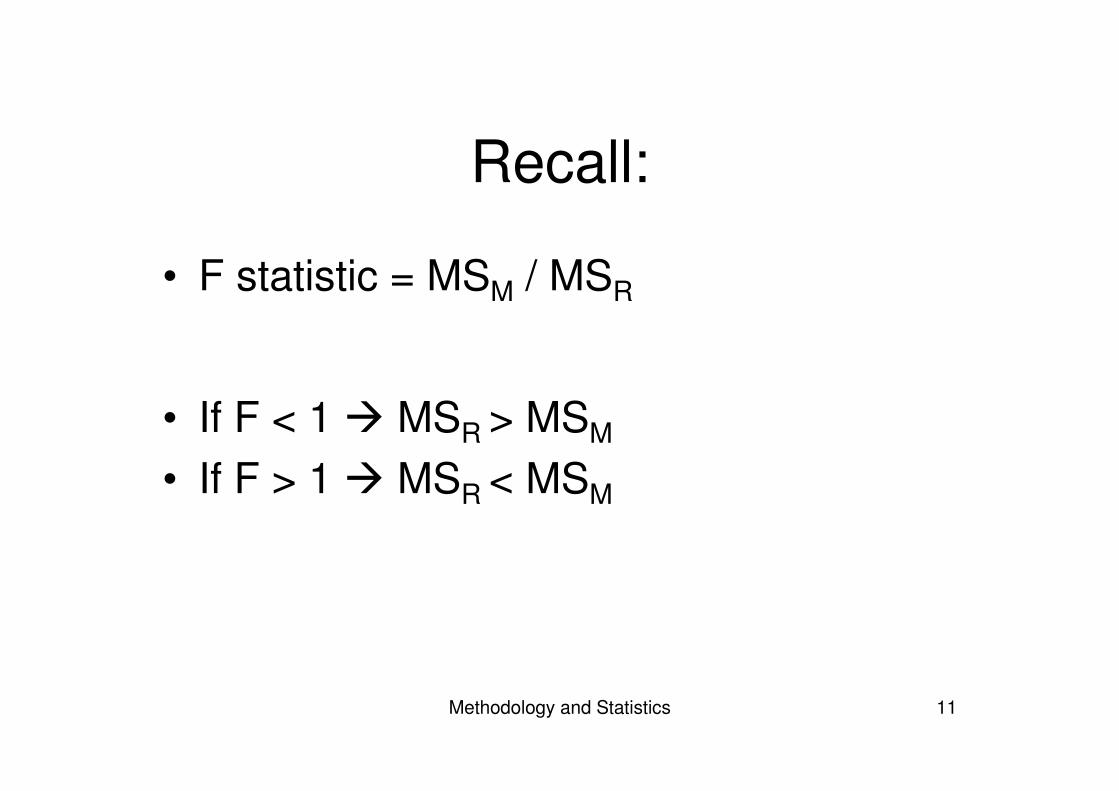
Recall:
• F statistic = MSM / MSR
• If F < 1 � MSR > MSM
• If F > 1 � MSR < MSM
Methodology and Statistics 12
MANOVA
• Univariate ANOVA for every DependentVariable
• But: we also want to know about the correlations between the DV’s
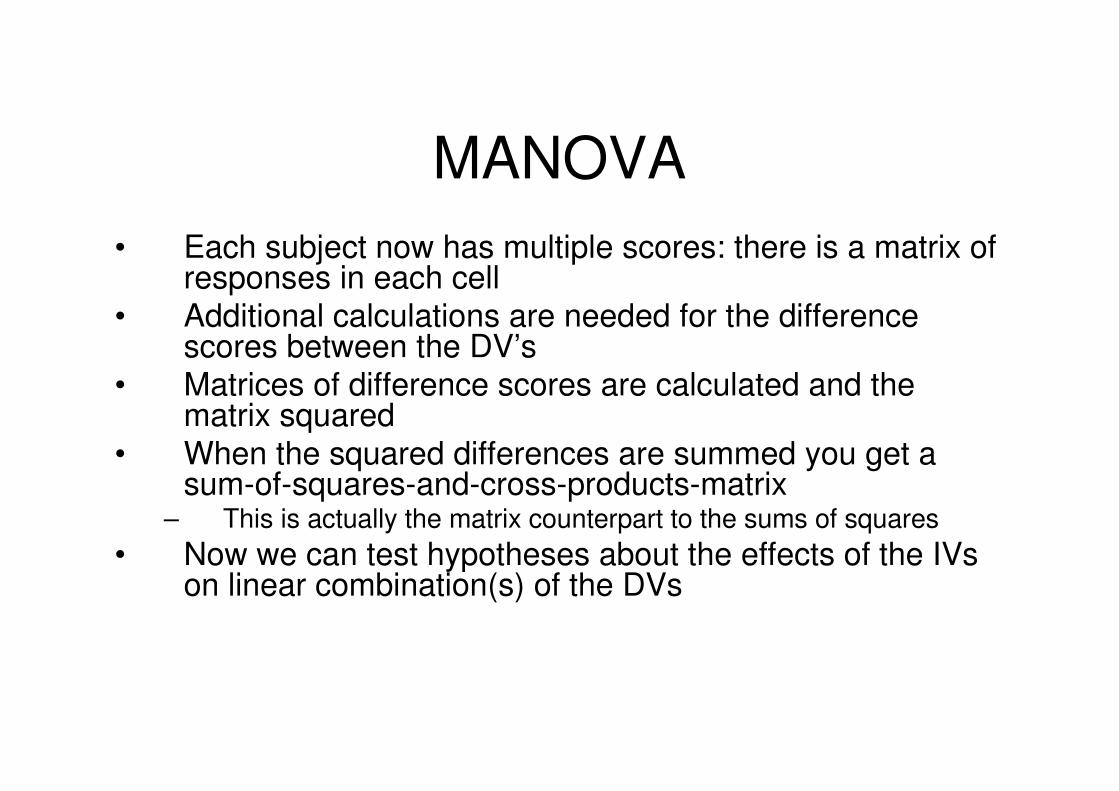
MANOVA• Each subject now has multiple scores: there is a matrix of
responses in each cell• Additional calculations are needed for the difference
scores between the DV’s• Matrices of difference scores are calculated and the
matrix squared• When the squared differences are summed you get a
sum-of-squares-and-cross-products-matrix – This is actually the matrix counterpart to the sums of squares
• Now we can test hypotheses about the effects of the IVs on linear combination(s) of the DVs
Methodology and Statistics 14
MANOVA
• Tests used for MANOVA:– Pillai’s– Wilks’– Hotelling’s
Methodology and Statistics 15
Hypotheses MANOVA
• H0: There is no difference between the levels of a factor
• Ha: There is a difference between at least one level and the others
Methodology and Statistics 16
Assumptions MANOVA
• Independence of observations• Multivariate normality
– For dependent variables– For linear combinations
• Equality of covariance matrices (similar to homogeneity of variance)
Methodology and Statistics 17
Back to the example
• The effect of drug (IV1) and psychotherapy(IV2) on depression measures
• Now we add measurement points– Before the treatment– 1 week after the treatment– 2 weeks after the treatment– Etc.
Methodology and Statistics 18
Repeated measures
• When the same variable is measured more than once for each subject
• Reduces unsystematic variability in the design � greater power to detect effects
Methodology and Statistics 19
Repeated measures
• Violates the independence assumption– One subject is measured repeatedly
• Assumption of sphericity– relationship between pairs of experimental
conditions is similar � level of dependence is roughly equal
Methodology and Statistics 20
Repeated measures
• Sphericity assumption �• Holds when:
variance A-B = variance A-C = variance B-C
• Measured by Mauchly’s test in SPSS• If significant then there are differences
and sphericity assumption is not met
Methodology and Statistics 21
MANOVA vs Repeated Measures
• In both cases: sample members are measured on several occasions, or trials
• The difference is that in the repeated measures design, each trial represents the measurement of the same characteristic under a different condition
Methodology and Statistics 22
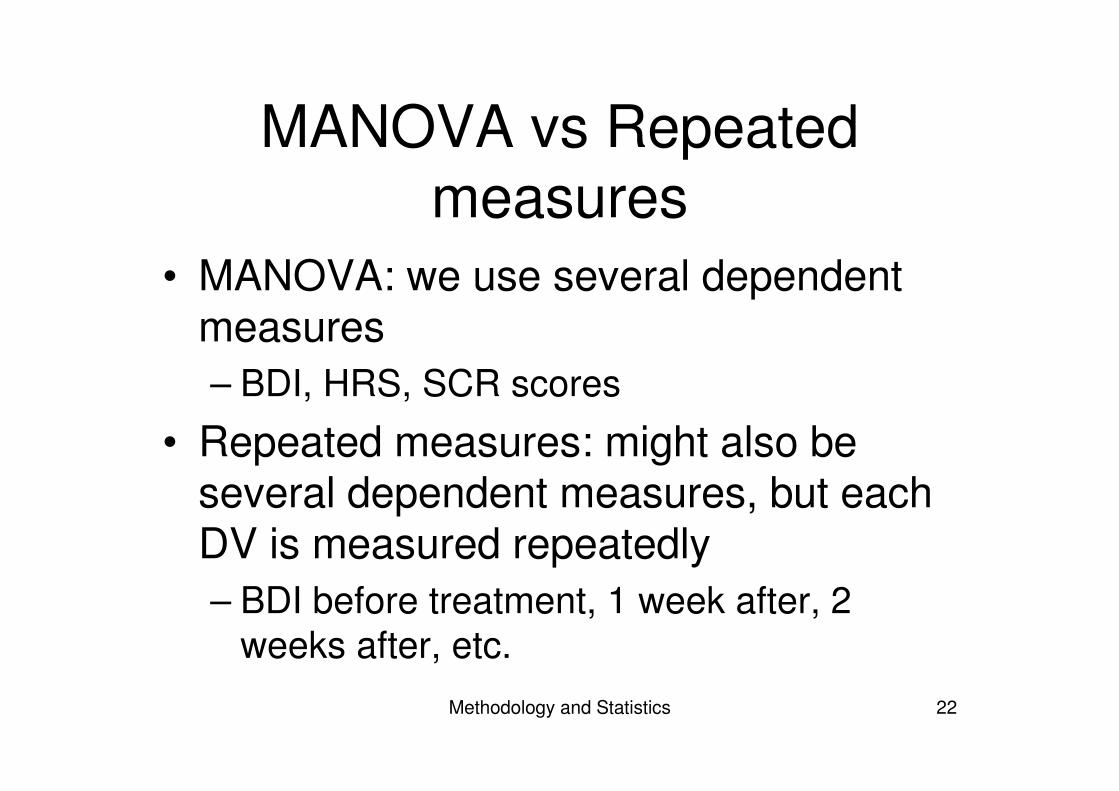
MANOVA vs Repeated measures
• MANOVA: we use several dependent measures – BDI, HRS, SCR scores
• Repeated measures: might also be several dependent measures, but each DV is measured repeatedly– BDI before treatment, 1 week after, 2
weeks after, etc.
Methodology and Statistics 23
An An experiment experiment using using Repeated MeasuresRepeated Measures
• ERP: event-related brain potentials– Changes of voltage in the brain that can be time-
locked to a specific (linguistic) stimulus
• ERP:– Provides a timeline of processing– Can tell us at which point certain aspects of
language are processed in the brain
Methodology and Statistics 24
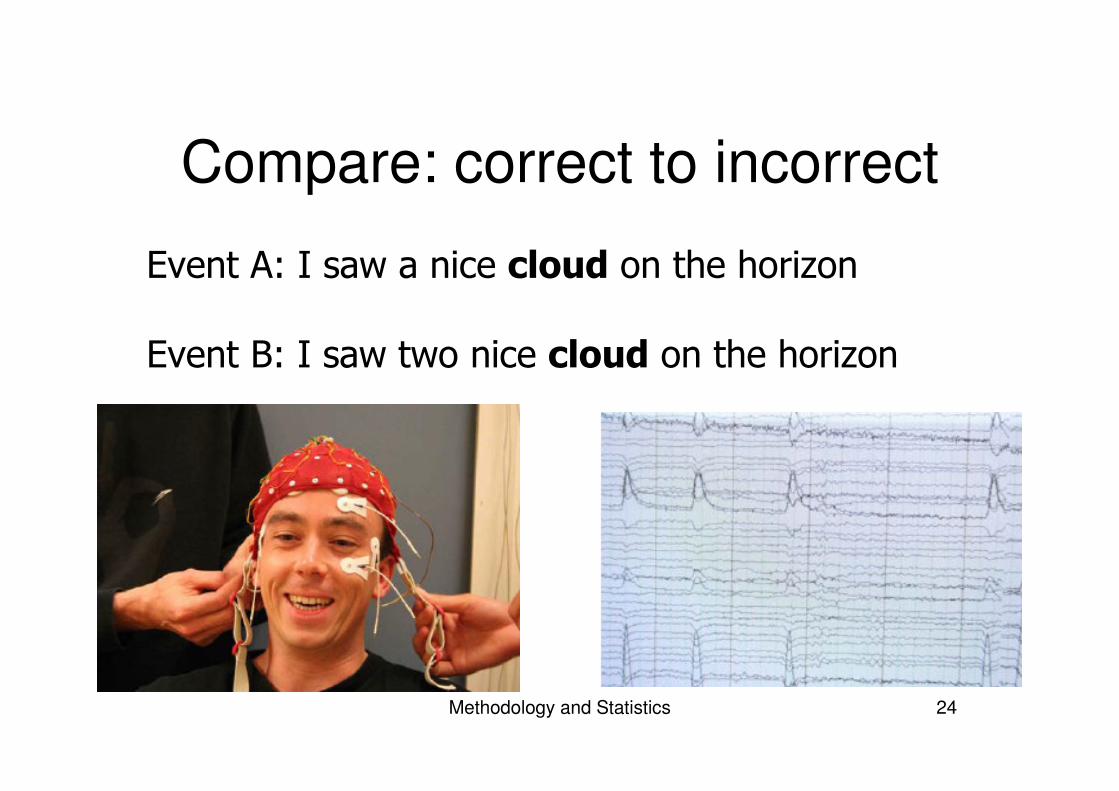
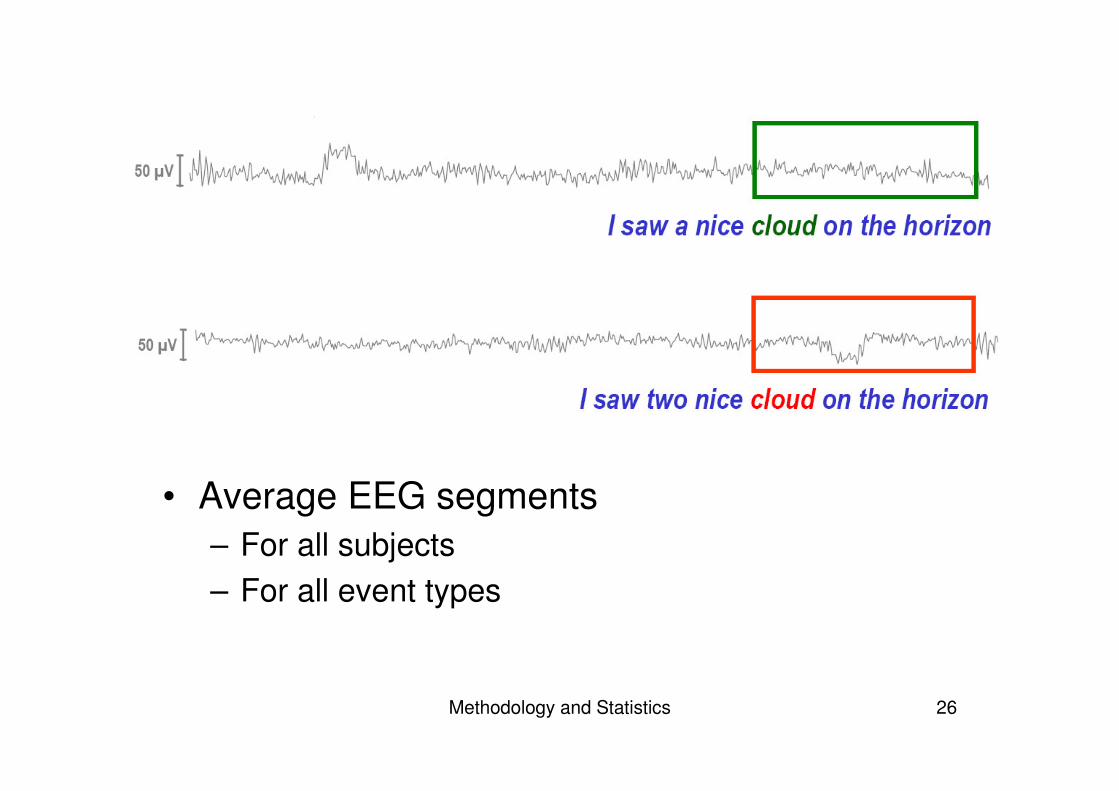
Compare: correct to incorrect
����� ��������� �������� �� ������� ����
����� ������������ �������� �� ������� ���
Methodology and Statistics 25
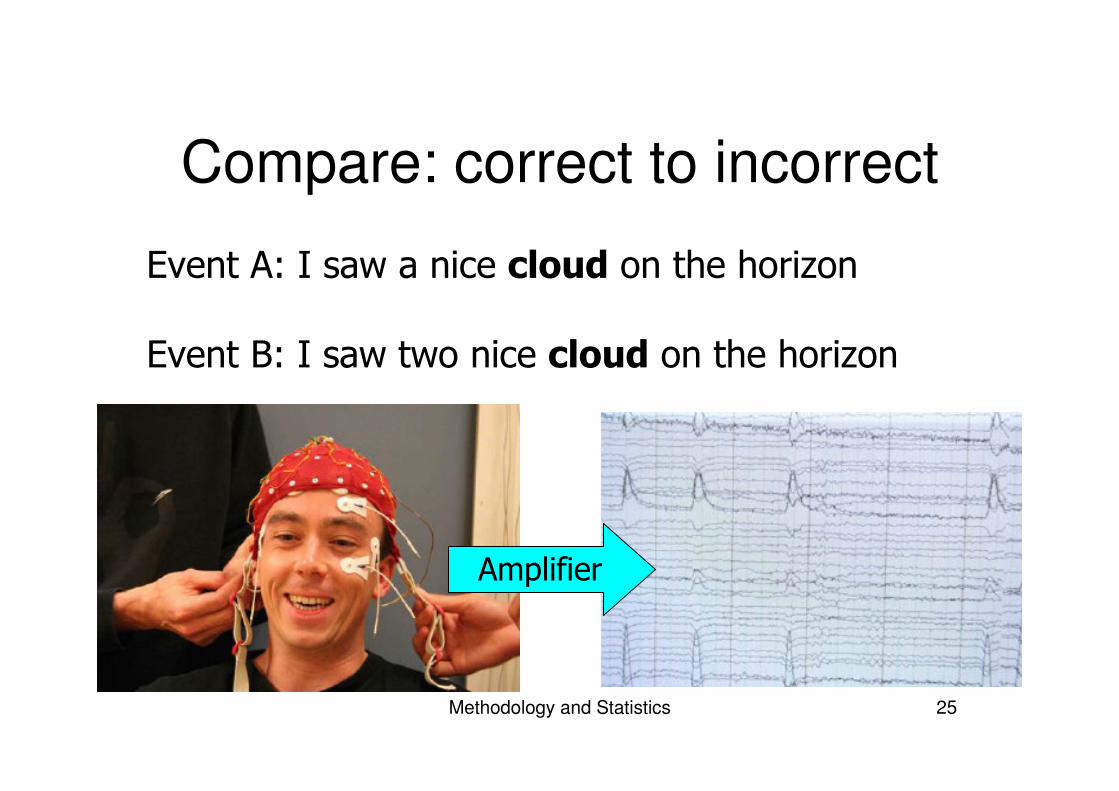
Compare: correct to incorrect
����� ��������� �������� �� ������� ����
����� ������������ �������� �� ������� ���
���� � ��
Methodology and Statistics 26
• Average EEG segments – For all subjects– For all event types
Methodology and Statistics 27
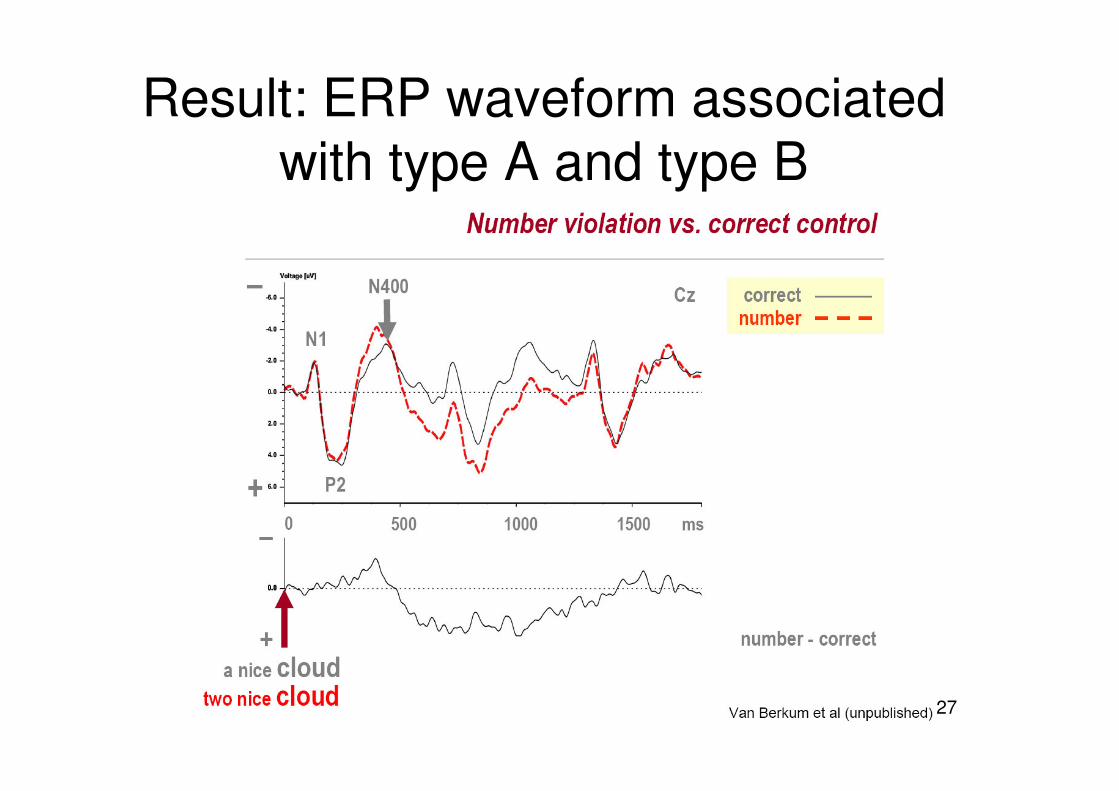
Result: ERP waveform associated with type A and type B
Methodology and Statistics 28
What does this mean?
• Basic assumption: difficult condition elicits more activation
• Difference between two conditions reveals when the particular aspect (violation) is processed
Methodology and Statistics 29
This experiment
• Effect of word frequency– High versus low
• Effect of grammaticality– Grammatical versus ungrammatical
• 2 x 2 design
Methodology and Statistics 30
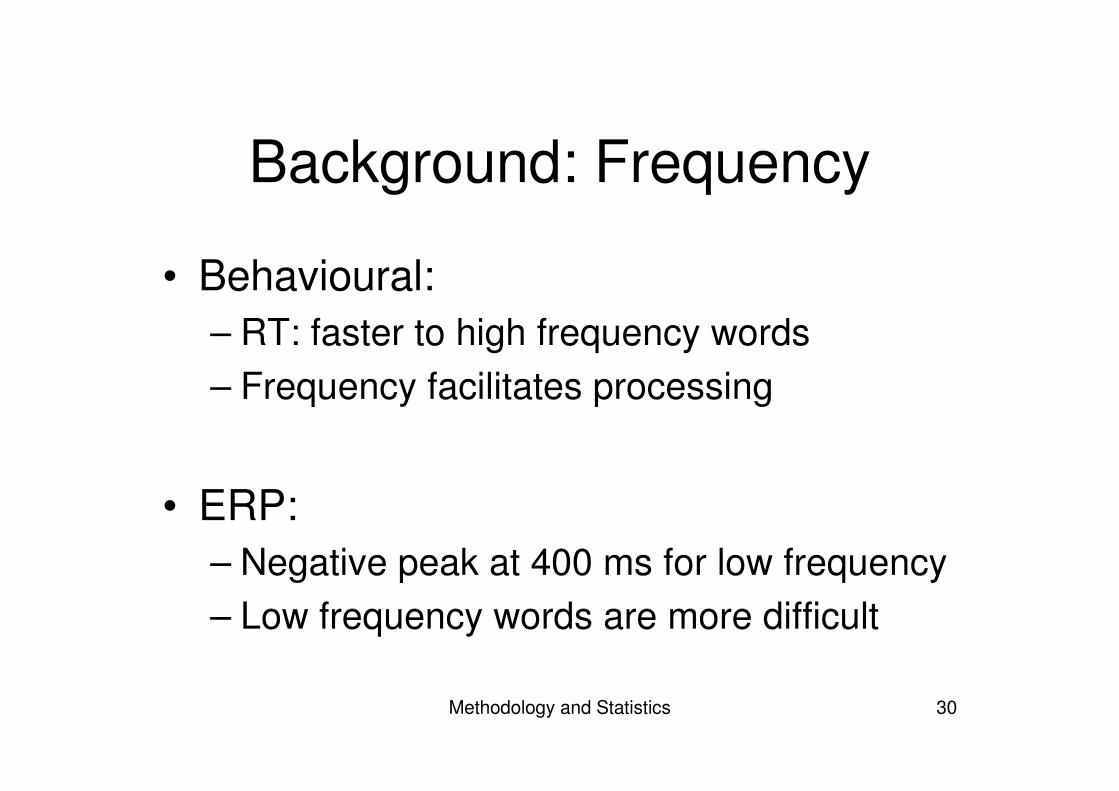
• Behavioural:– RT: faster to high frequency words– Frequency facilitates processing
• ERP:– Negative peak at 400 ms for low frequency– Low frequency words are more difficult
Background: Frequency
Methodology and Statistics 31
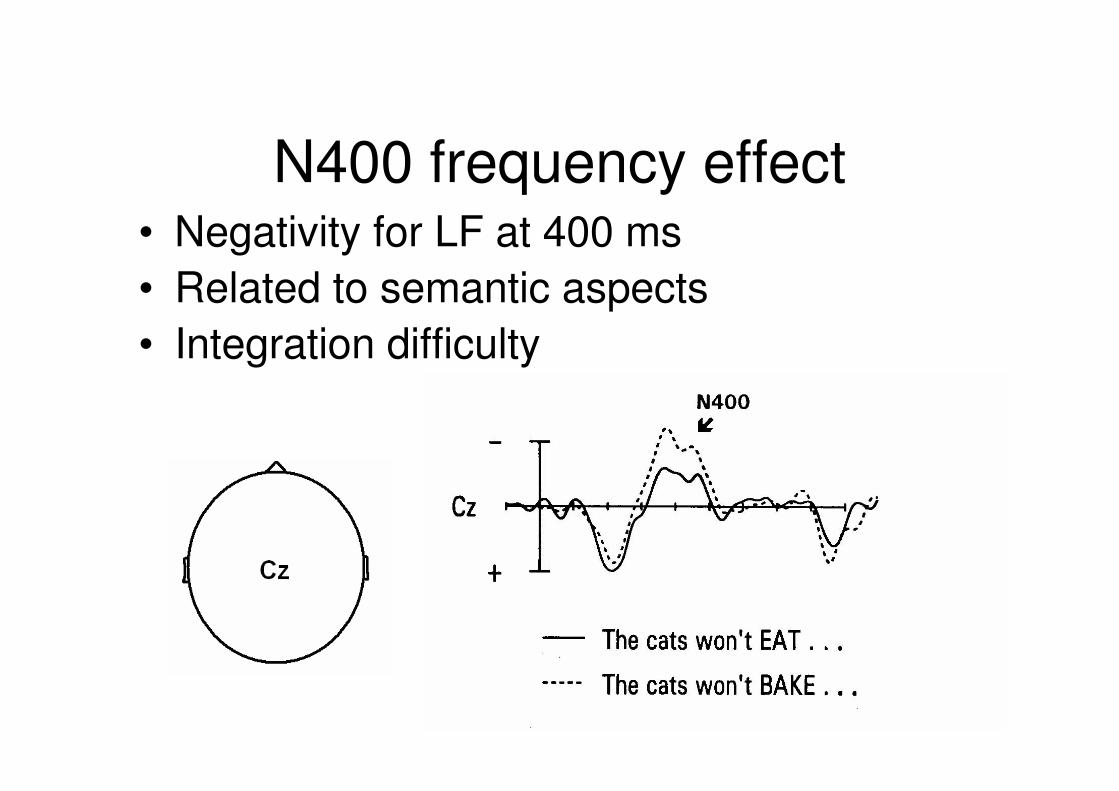
N400 frequency effect• Negativity for LF at 400 ms• Related to semantic aspects• Integration difficulty
Methodology and Statistics 32
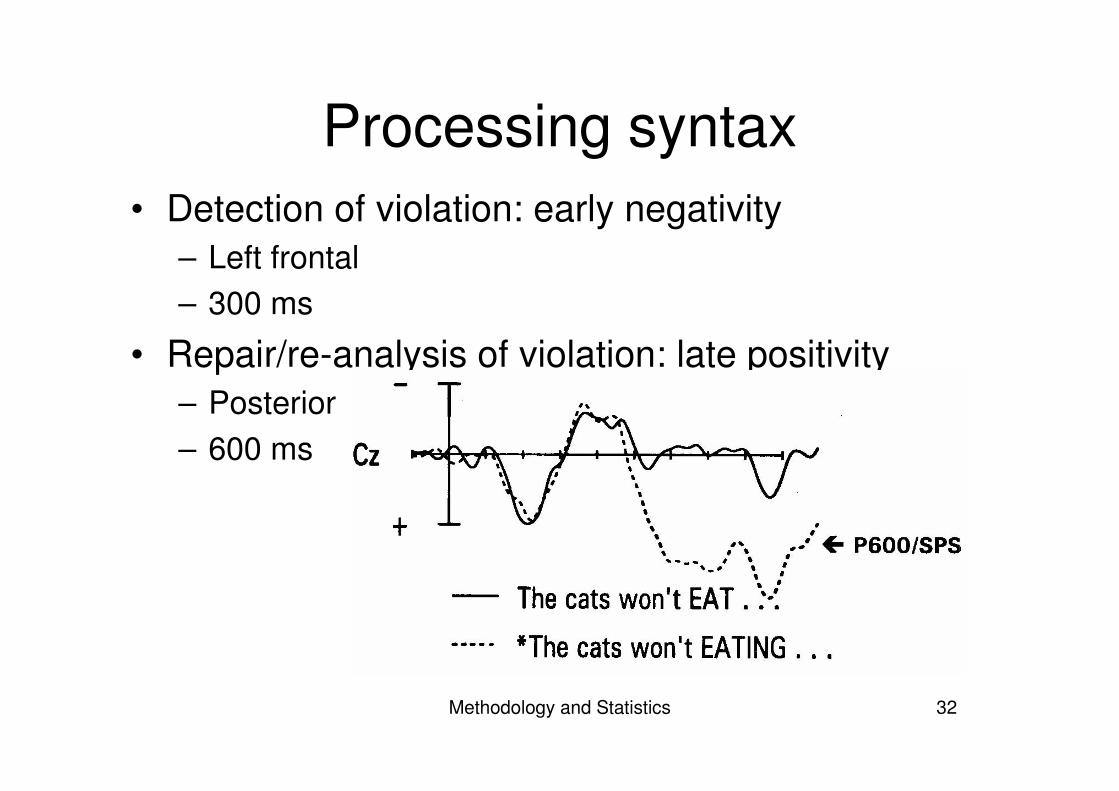
Processing syntax• Detection of violation: early negativity
– Left frontal– 300 ms
• Repair/re-analysis of violation: late positivity– Posterior– 600 ms
Methodology and Statistics 33
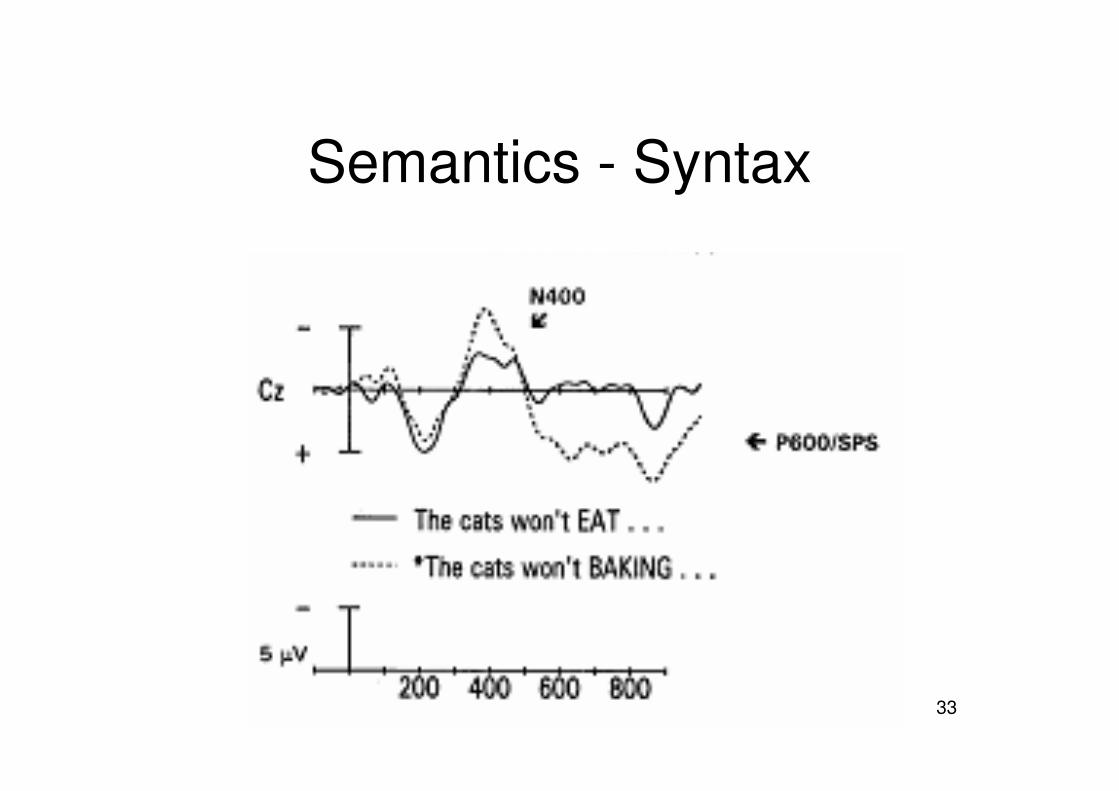
Semantics - Syntax
Methodology and Statistics 34
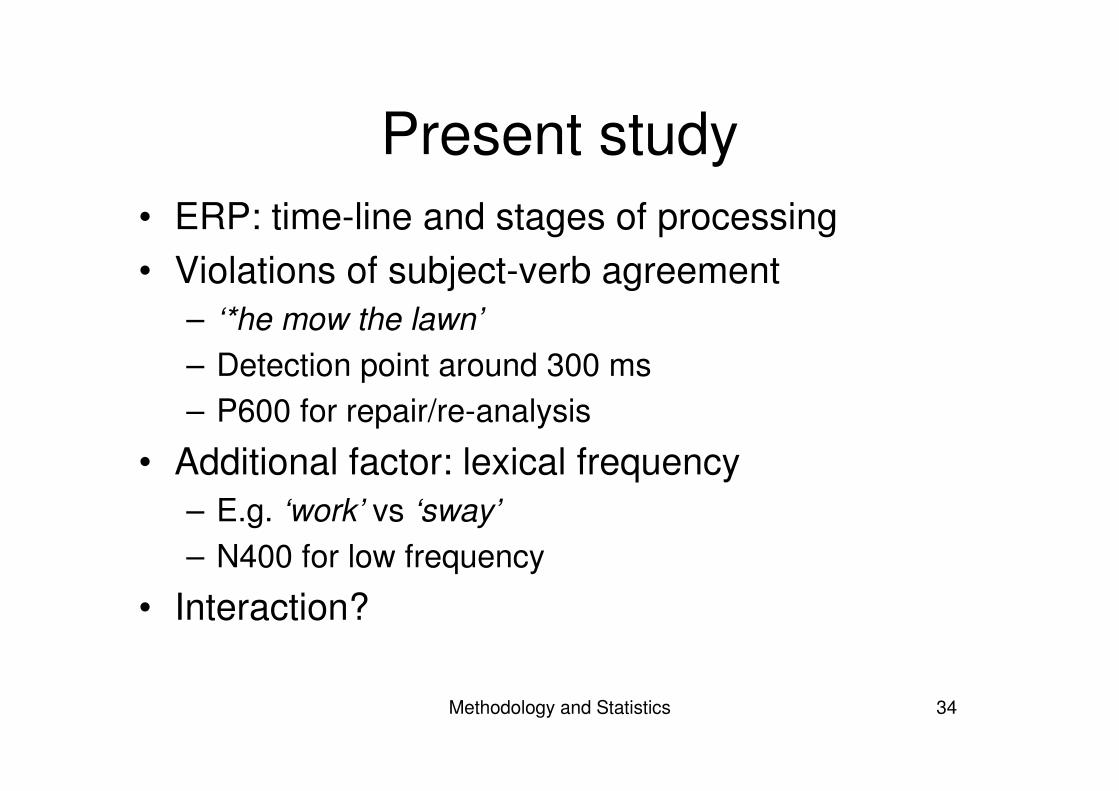
• ERP: time-line and stages of processing• Violations of subject-verb agreement
– ‘*he mow the lawn’– Detection point around 300 ms– P600 for repair/re-analysis
• Additional factor: lexical frequency– E.g. ‘work’ vs ‘sway’– N400 for low frequency
• Interaction?
Present study
Methodology and Statistics 35
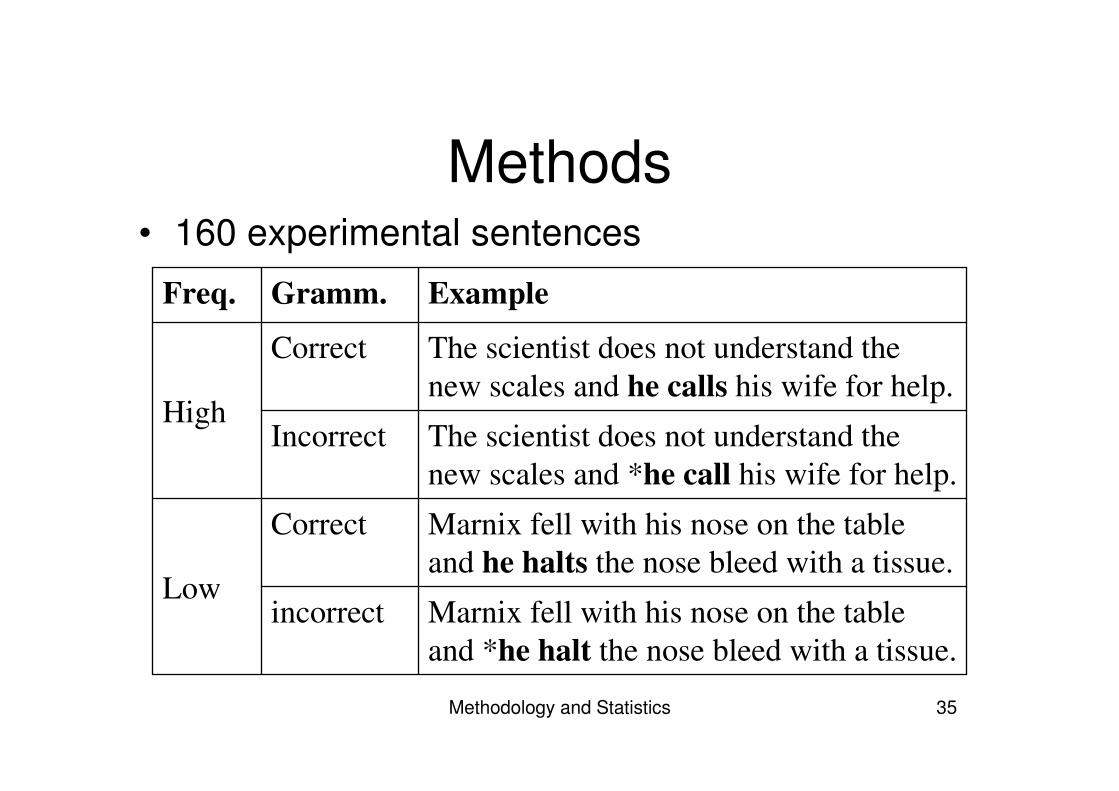
Methods• 160 experimental sentences
Marnix fell with his nose on the tableand *he halt the nose bleed with a tissue.
incorrect
Marnix fell with his nose on the tableand he halts the nose bleed with a tissue.
Correct
Low
The scientist does not understand thenew scales and *he call his wife for help.
Incorrect
The scientist does not understand thenew scales and he calls his wife for help.
Correct
High
ExampleGramm.Freq.
Methodology and Statistics 36
Methods• Matched on plausibility• Matched on complexity• Matched on frequency of surrounding
words• Matched on length of surrounding words• Different lists • Fillers: 224• Questions in between
Methodology and Statistics 37
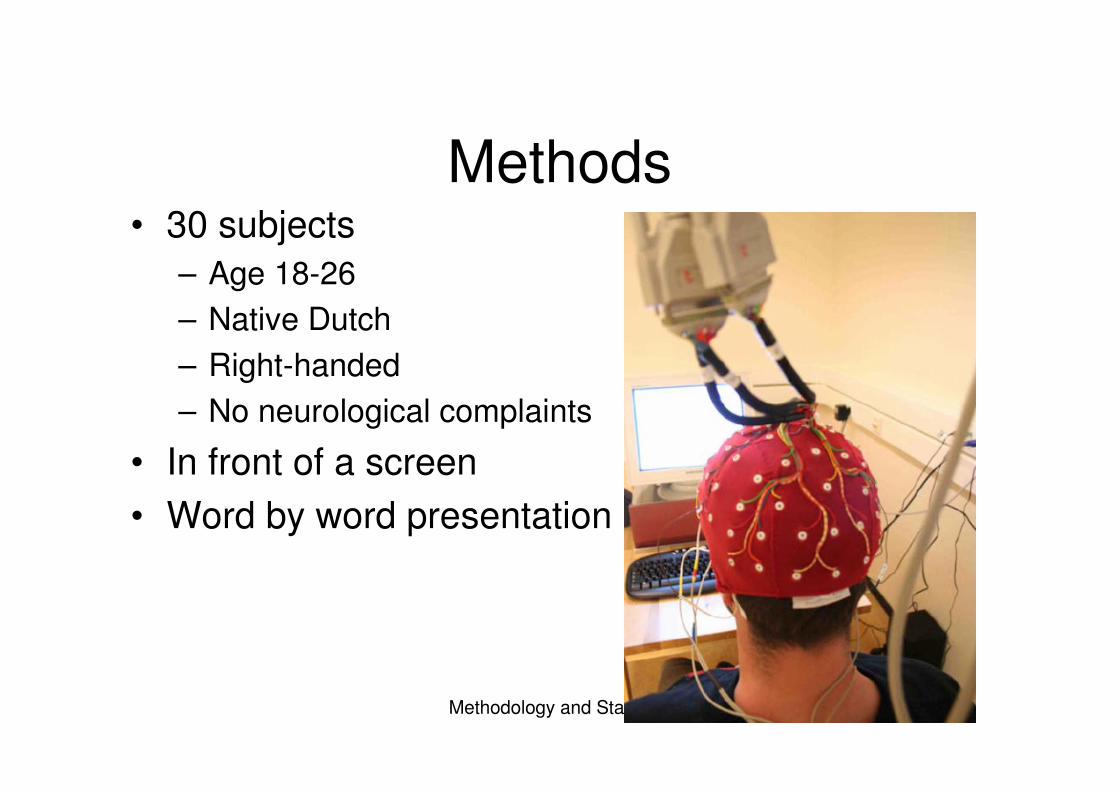
Methods• 30 subjects
– Age 18-26– Native Dutch– Right-handed– No neurological complaints
• In front of a screen• Word by word presentation
Methodology and Statistics 38
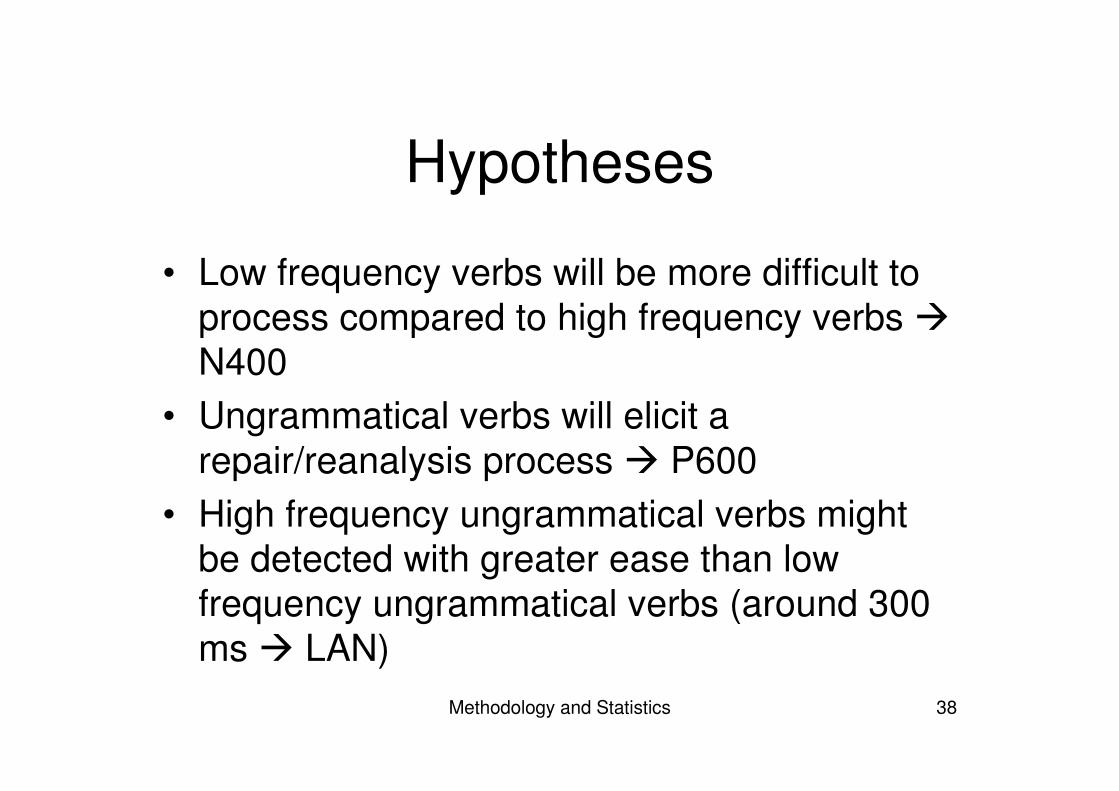
Hypotheses
• Low frequency verbs will be more difficult to process compared to high frequency verbs �N400
• Ungrammatical verbs will elicit a repair/reanalysis process � P600
• High frequency ungrammatical verbs might be detected with greater ease than low frequency ungrammatical verbs (around 300 ms � LAN)
Methodology and Statistics 39
Statistical analysis
• Repeated measures ANOVA– Subjects are confronted with both
grammaticality and frequency repeatedly
• Test equality of means• Mean raw amplitude scores in SPSS
Methodology and Statistics 40
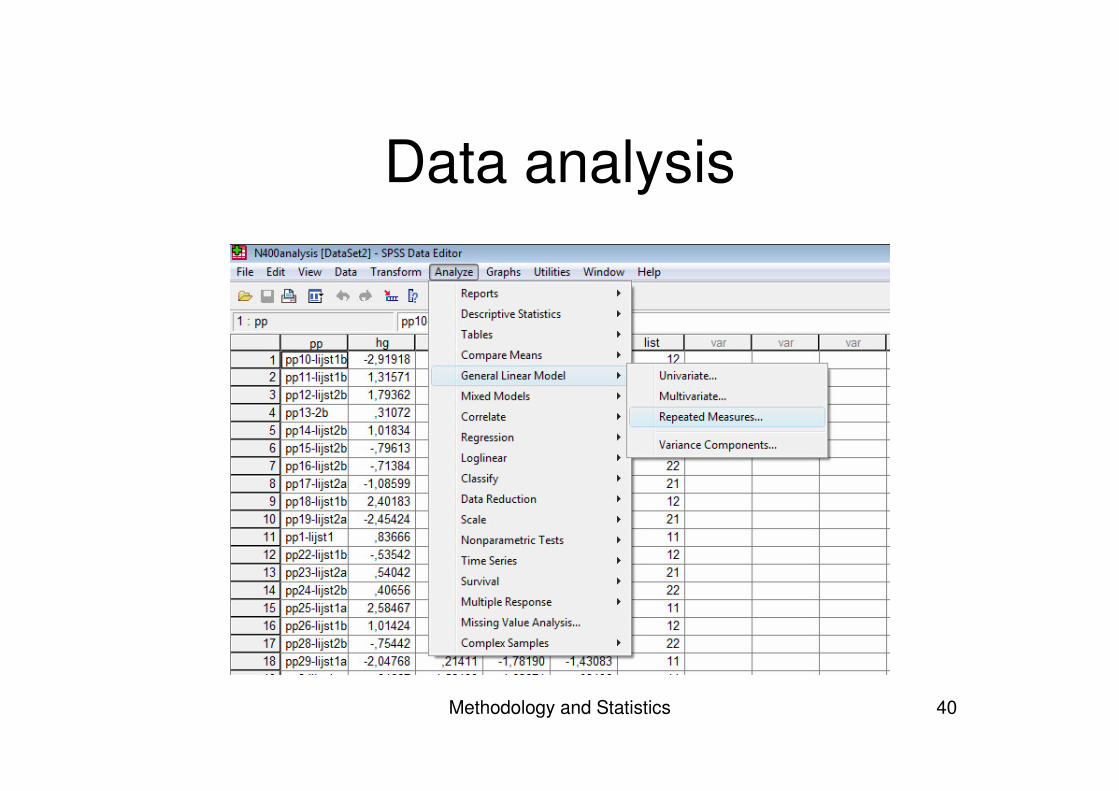
Data analysis
Methodology and Statistics 41
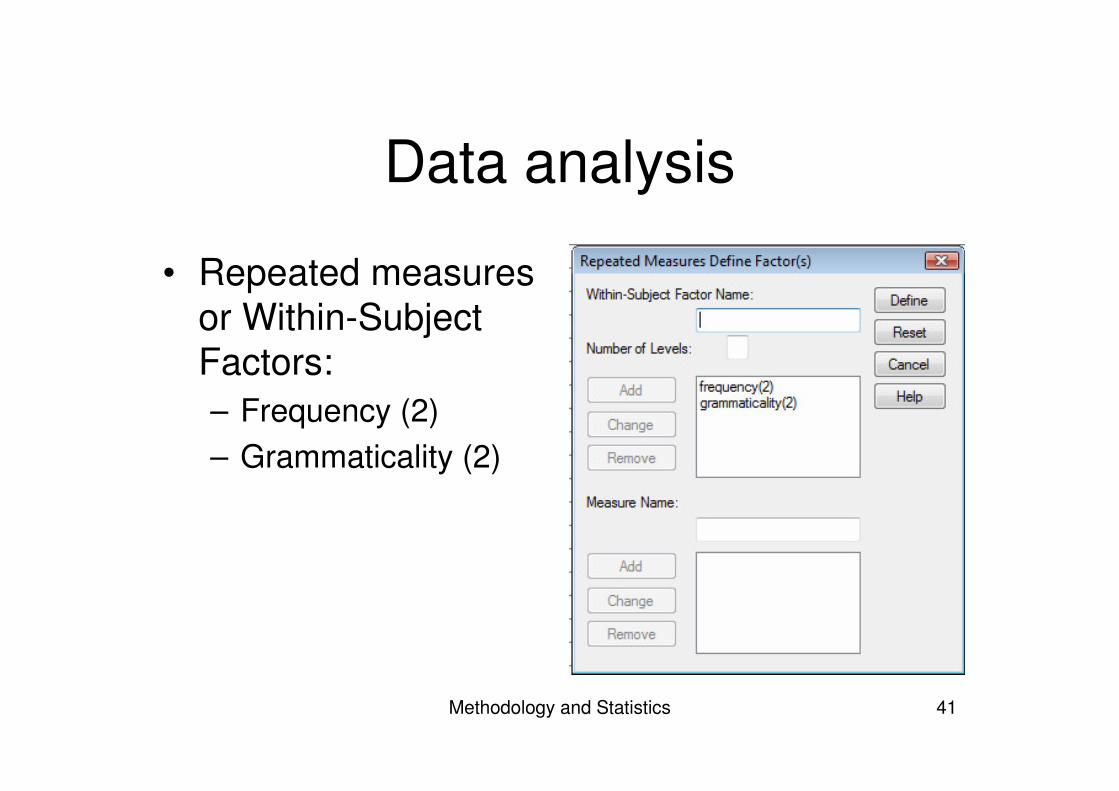
Data analysis
• Repeated measures or Within-Subject Factors:– Frequency (2)– Grammaticality (2)
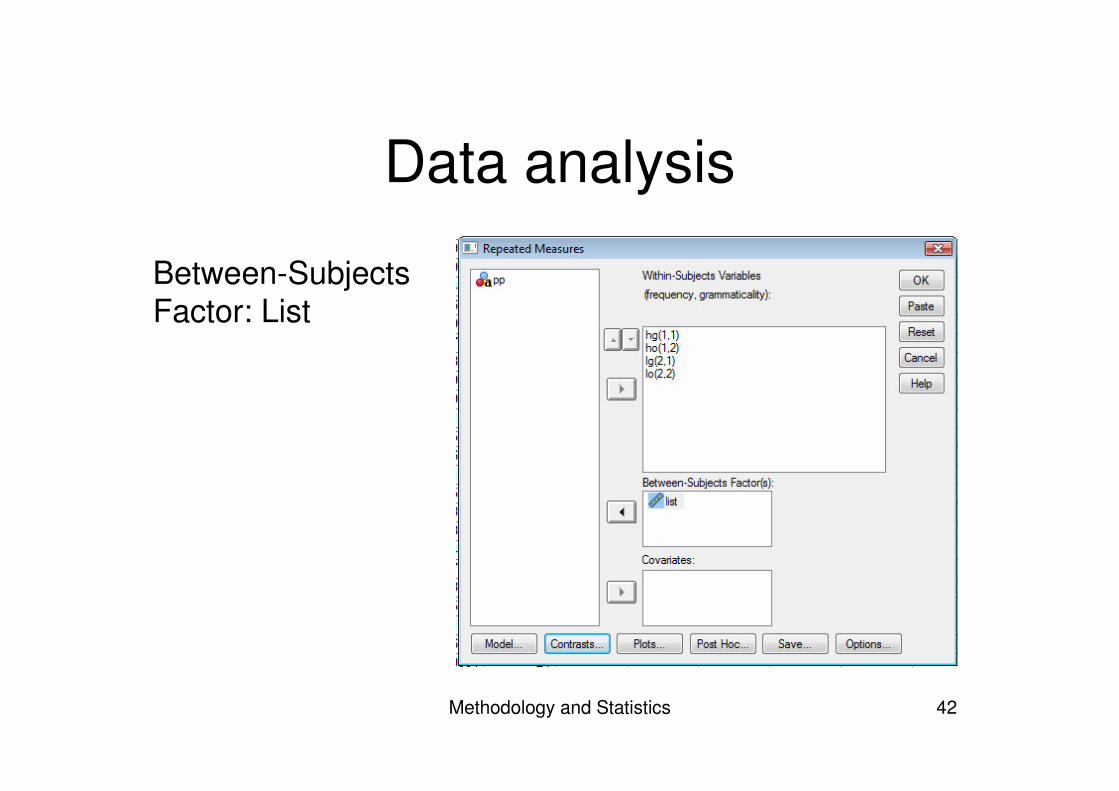
Methodology and Statistics 42
Data analysis
Between-Subjects Factor: List
Methodology and Statistics 43
What we expected:
• Frequency effect � N400• Grammaticality effect � P600• Difference in detection � interaction
Methodology and Statistics 44
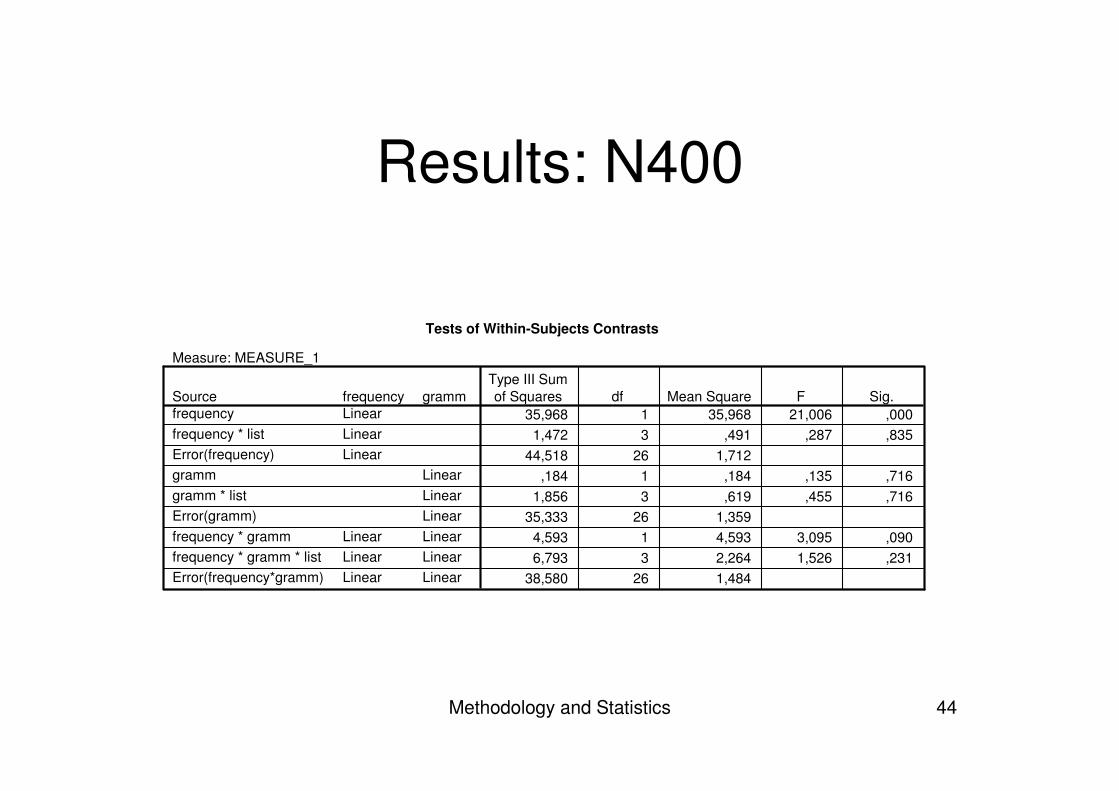
Results: N400
Tests of Within-Subjects Contrasts
Measure: MEASURE_1
35,968 1 35,968 21,006 ,0001,472 3 ,491 ,287 ,835
44,518 26 1,712,184 1 ,184 ,135 ,716
1,856 3 ,619 ,455 ,71635,333 26 1,359
4,593 1 4,593 3,095 ,0906,793 3 2,264 1,526 ,231
38,580 26 1,484
gramm
LinearLinearLinearLinearLinearLinear
frequencyLinearLinearLinear
LinearLinearLinear
Sourcefrequencyfrequency * listError(frequency)grammgramm * listError(gramm)frequency * grammfrequency * gramm * listError(frequency*gramm)
Type III Sumof Squares df Mean Square F Sig.
Methodology and Statistics 45
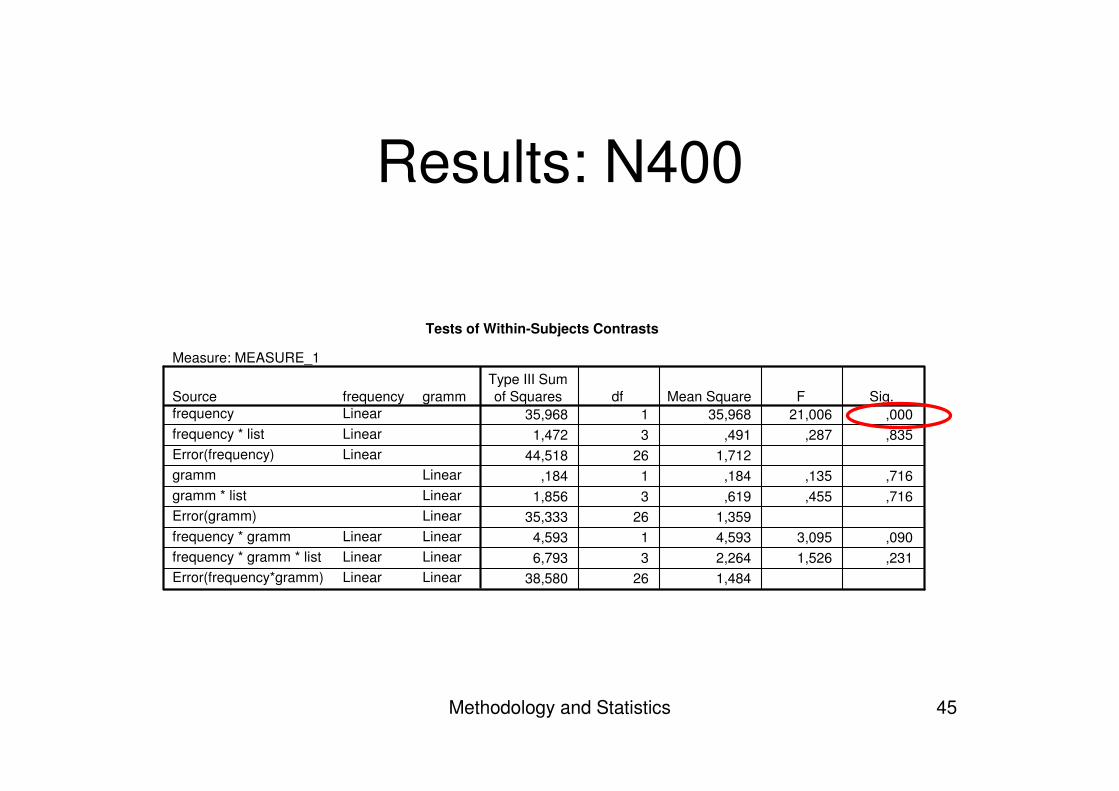
Results: N400
Tests of Within-Subjects Contrasts
Measure: MEASURE_1
35,968 1 35,968 21,006 ,0001,472 3 ,491 ,287 ,835
44,518 26 1,712,184 1 ,184 ,135 ,716
1,856 3 ,619 ,455 ,71635,333 26 1,359
4,593 1 4,593 3,095 ,0906,793 3 2,264 1,526 ,231
38,580 26 1,484
gramm
LinearLinearLinearLinearLinearLinear
frequencyLinearLinearLinear
LinearLinearLinear
Sourcefrequencyfrequency * listError(frequency)grammgramm * listError(gramm)frequency * grammfrequency * gramm * listError(frequency*gramm)
Type III Sumof Squares df Mean Square F Sig.
Methodology and Statistics 46
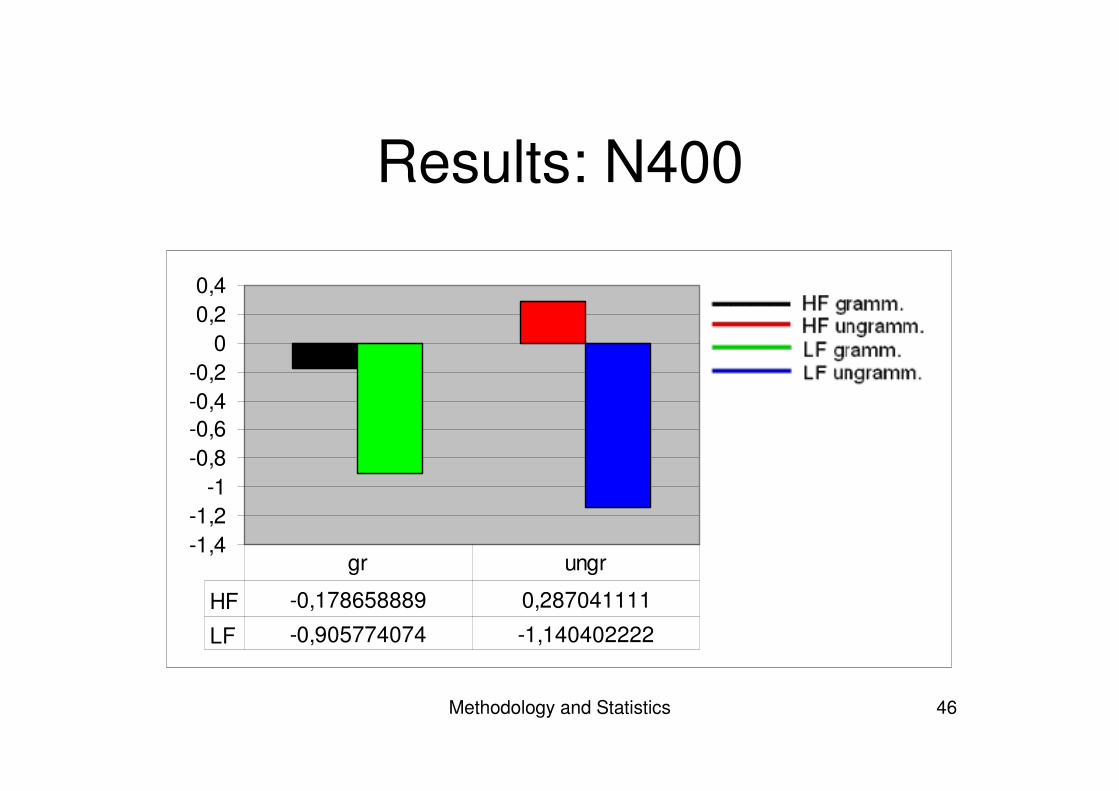
Results: N400
-1,4-1,2
-1-0,8-0,6-0,4-0,2
00,20,4
HF -0,178658889 0,287041111
LF -0,905774074 -1,140402222
gr ungr
Methodology and Statistics 47
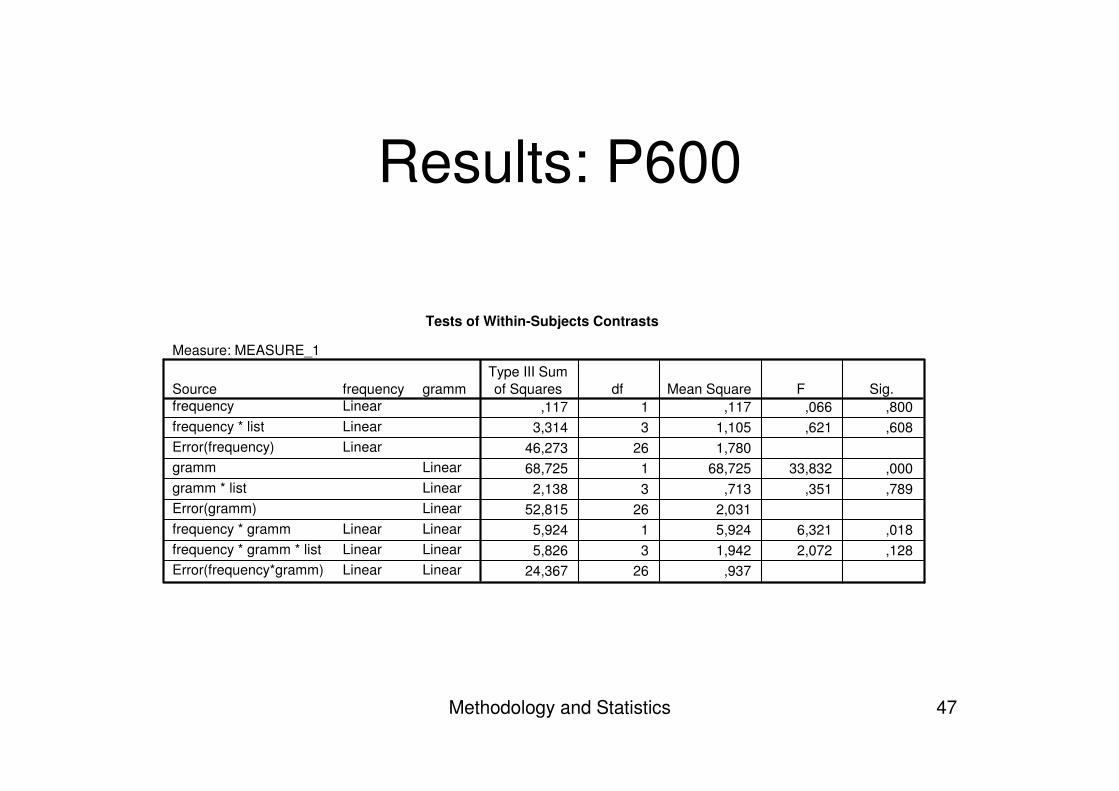
Results: P600
Tests of Within-Subjects Contrasts
Measure: MEASURE_1
,117 1 ,117 ,066 ,8003,314 3 1,105 ,621 ,608
46,273 26 1,78068,725 1 68,725 33,832 ,000
2,138 3 ,713 ,351 ,78952,815 26 2,031
5,924 1 5,924 6,321 ,0185,826 3 1,942 2,072 ,128
24,367 26 ,937
gramm
LinearLinearLinearLinearLinearLinear
frequencyLinearLinearLinear
LinearLinearLinear
Sourcefrequencyfrequency * listError(frequency)grammgramm * listError(gramm)frequency * grammfrequency * gramm * listError(frequency*gramm)
Type III Sumof Squares df Mean Square F Sig.
Methodology and Statistics 48
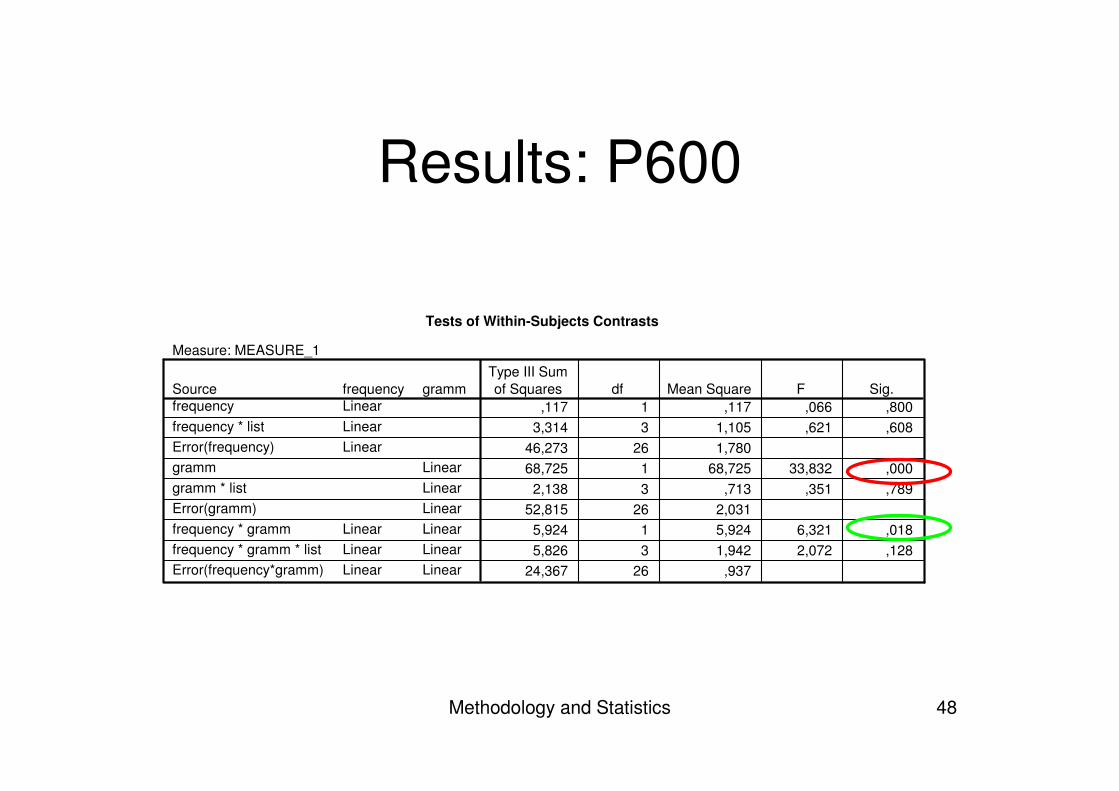
Results: P600
Tests of Within-Subjects Contrasts
Measure: MEASURE_1
,117 1 ,117 ,066 ,8003,314 3 1,105 ,621 ,608
46,273 26 1,78068,725 1 68,725 33,832 ,000
2,138 3 ,713 ,351 ,78952,815 26 2,031
5,924 1 5,924 6,321 ,0185,826 3 1,942 2,072 ,128
24,367 26 ,937
gramm
LinearLinearLinearLinearLinearLinear
frequencyLinearLinearLinear
LinearLinearLinear
Sourcefrequencyfrequency * listError(frequency)grammgramm * listError(gramm)frequency * grammfrequency * gramm * listError(frequency*gramm)
Type III Sumof Squares df Mean Square F Sig.
Methodology and Statistics 49
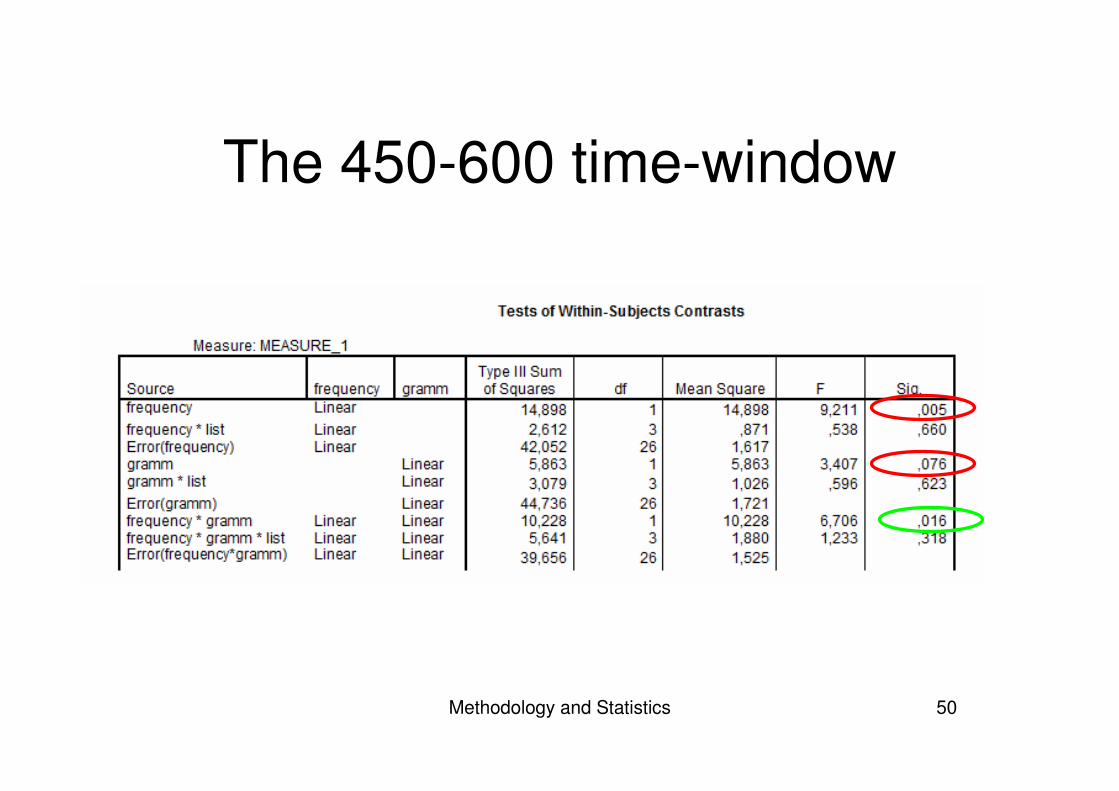
Interaction?
• The end-effect of the N400?• Split up the time-windows:
– 450-600 for the onset– 600-1000 for the ‘real’ P600
• Look at the effects separately
Methodology and Statistics 50
The 450-600 time-window
Methodology and Statistics 51
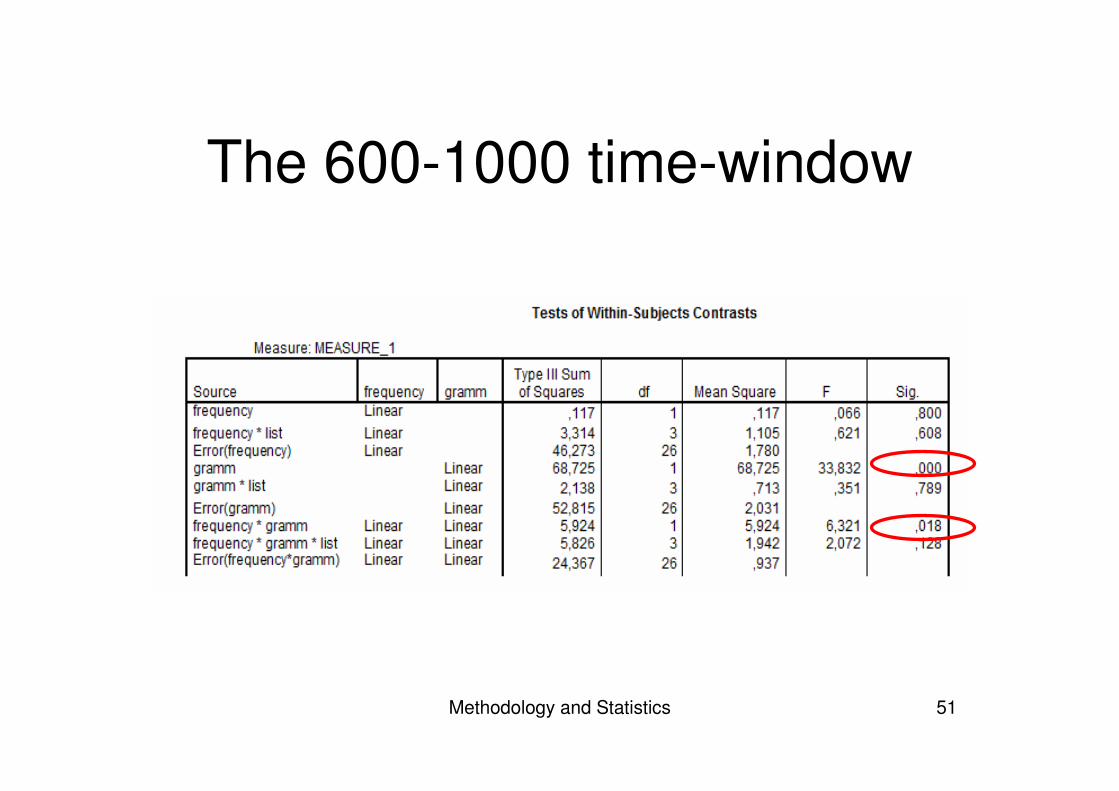
The 600-1000 time-window
Methodology and Statistics 52
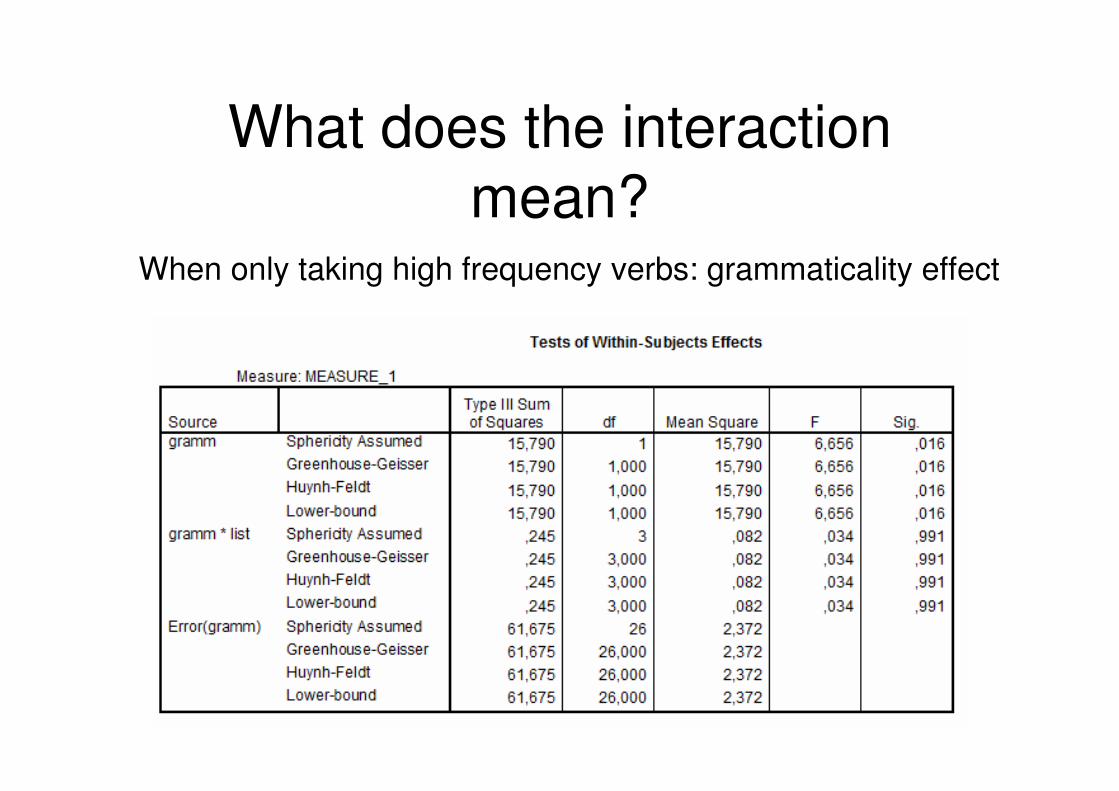
What does the interaction mean?
• We expected a difference in the detection around 300 ms
• Instead there seems to be a difference in the onset of the P600 (based on raw data)
• To find out what the onset difference is � separate ANOVA’s for high and low frequency verbs
Methodology and Statistics 53
What does the interaction mean?
When only taking high frequency verbs: grammaticality effect
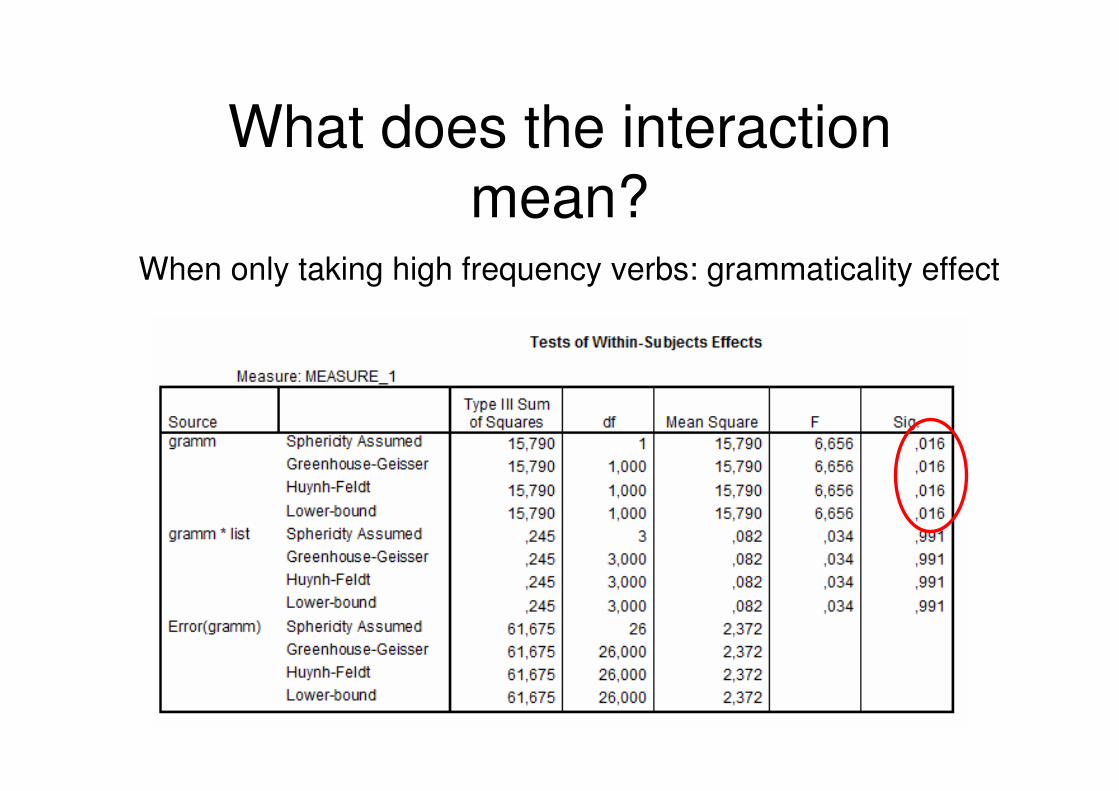
Methodology and Statistics 54
What does the interaction mean?
When only taking high frequency verbs: grammaticality effect
Methodology and Statistics 55
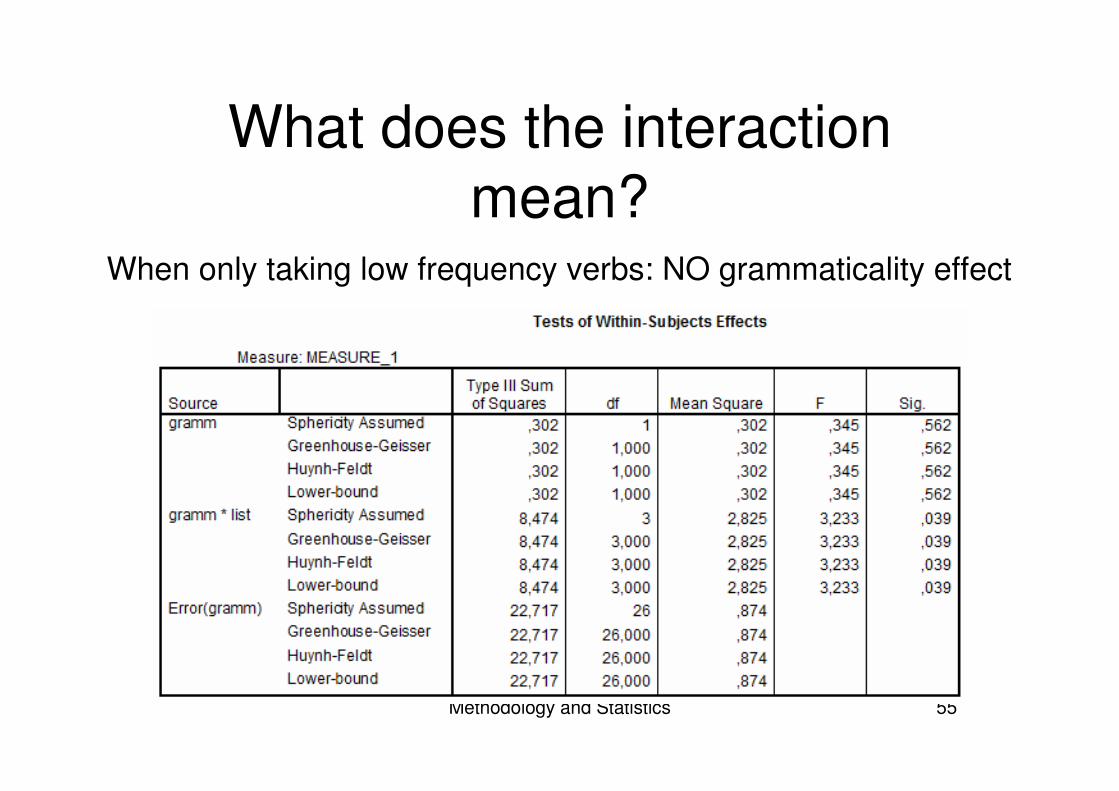
What does the interaction mean?
When only taking low frequency verbs: NO grammaticality effect
Methodology and Statistics 56
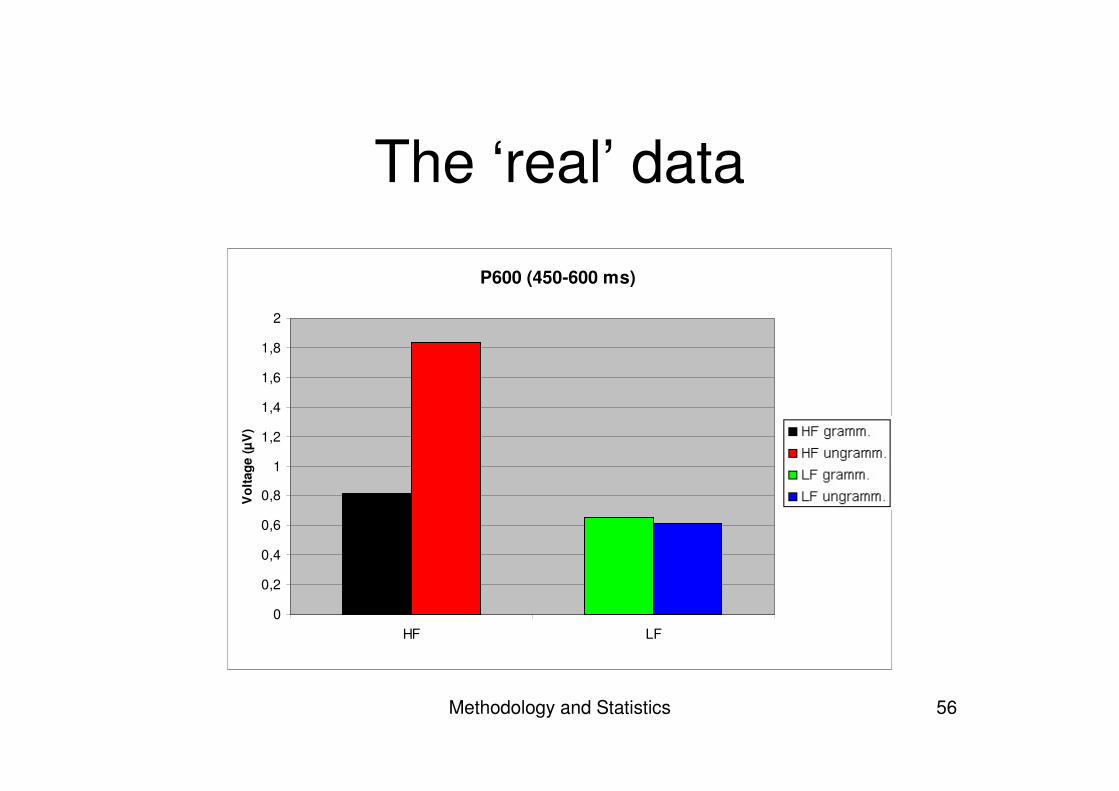
The ‘real’ data
P600 (450-600 ms)
0
0,2
0,4
0,6
0,8
1
1,2
1,4
1,6
1,8
2
HF LF
Vol
tage
(µV
)
Methodology and Statistics 57
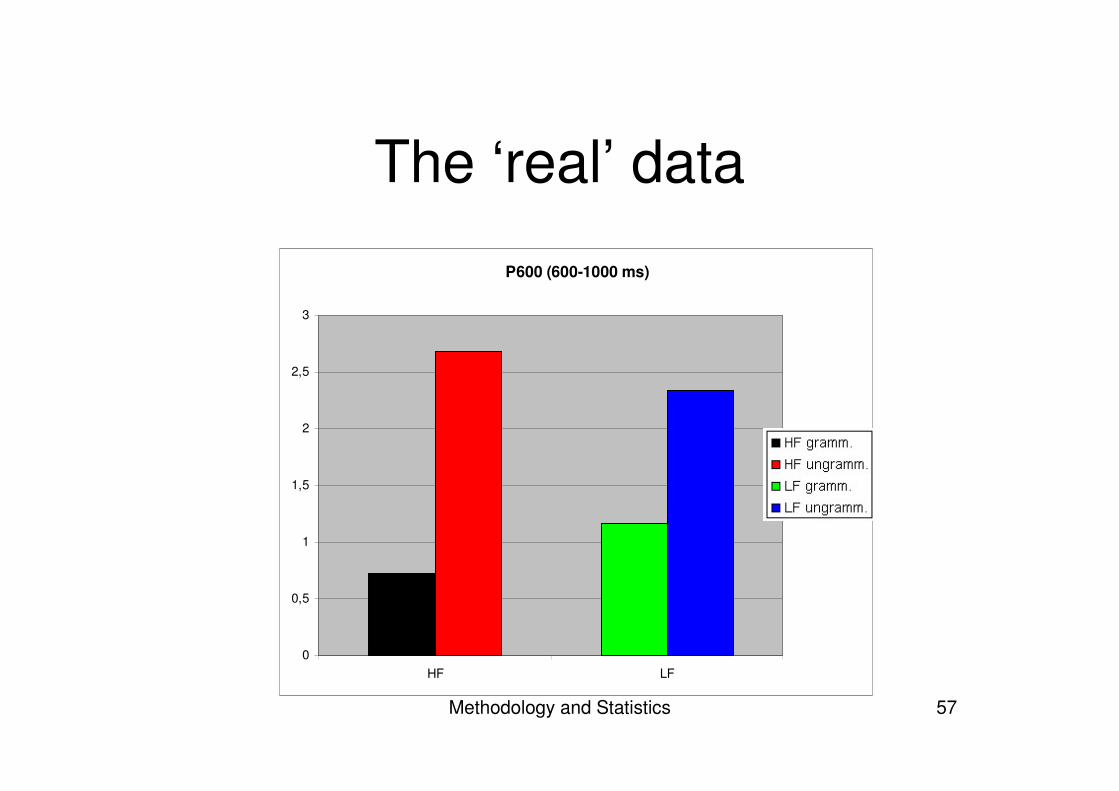
The ‘real’ data
P600 (600-1000 ms)
0
0,5
1
1,5
2
2,5
3
HF LF
gramm.
ungramm.
Methodology and Statistics 58
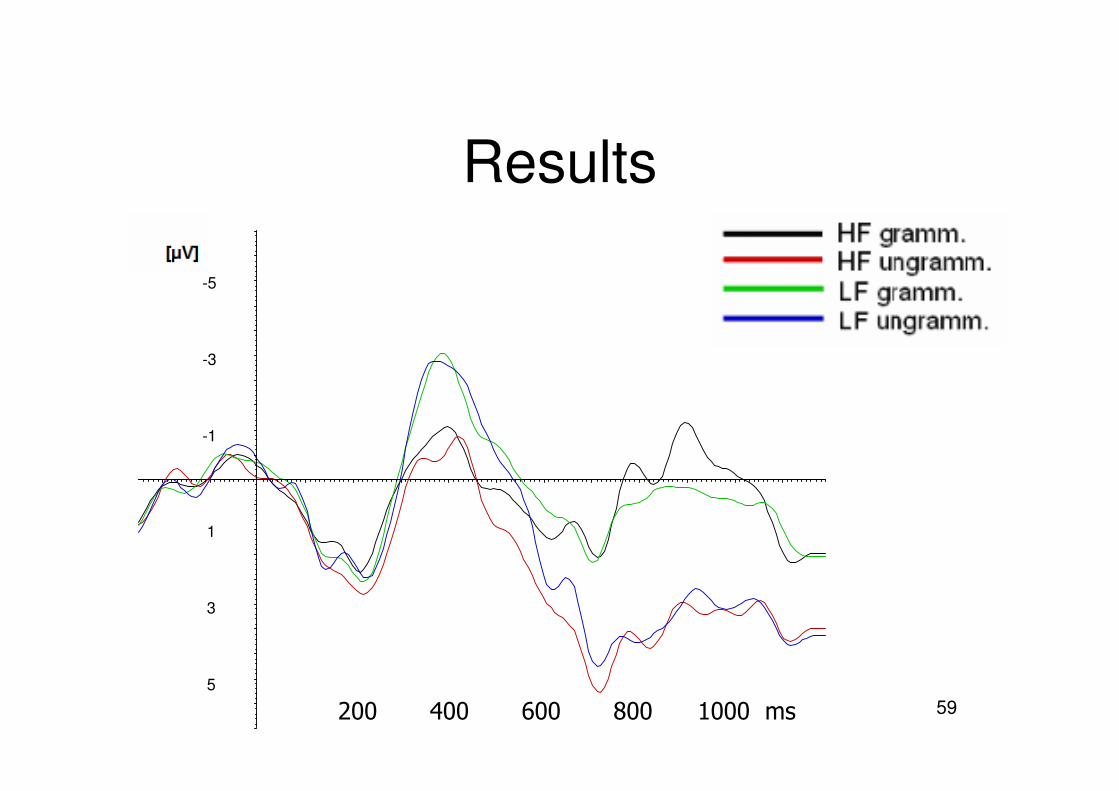
Results
• When comparing high and low frequency– N400: negativity for low frequency
• When contrasting grammaticality– P600: positivity for ungrammatical– But: no early detection around 300 ms
Methodology and Statistics 59
ResultsPz
-5
-3
-1
1
3
5
��������������������������������������������
Methodology and Statistics 60
Discussion: Why no detection?
• Due to rules of different languages– ‘(…) he mows/*mow the lawn’– ‘(…) hij roept/*hij roep (he calls/*call)– Word order issue?
• Due to strictness of violated rule– ‘The scientist criticized Max’s of proof…’– More obvious: earlier detection?
Methodology and Statistics 61
Conclusion
• Frequency and grammaticality elicitdifferent brain responses
• High frequency verbs are more easily processed than low frequency verbs
• People initialize a repair process after 600 ms when confronted with subject-verb agreement violations
Methodology and Statistics 62
Conclusion
• The repair process can be initialized earlier when the ungrammatical verb is a high frequency one compared to a low frequency