Embed Size (px)
Citation preview
1Bonn, 22. Oktober 2007 Eckhard von Toerne
Multivariate Methods in Statistical Data Analysis
– Web-Site: http://tmva.sourceforge.net/– See also: "TMVA - Toolkit for Multivariate Data Analysis , A. Hoecker, P.
Speckmayer, J. Stelzer, J. Therhaag, E. von Toerne, H. Voss et al., arXiv:physics/0703039v5 [physics.data-an]
Eckhard von Toerne
2
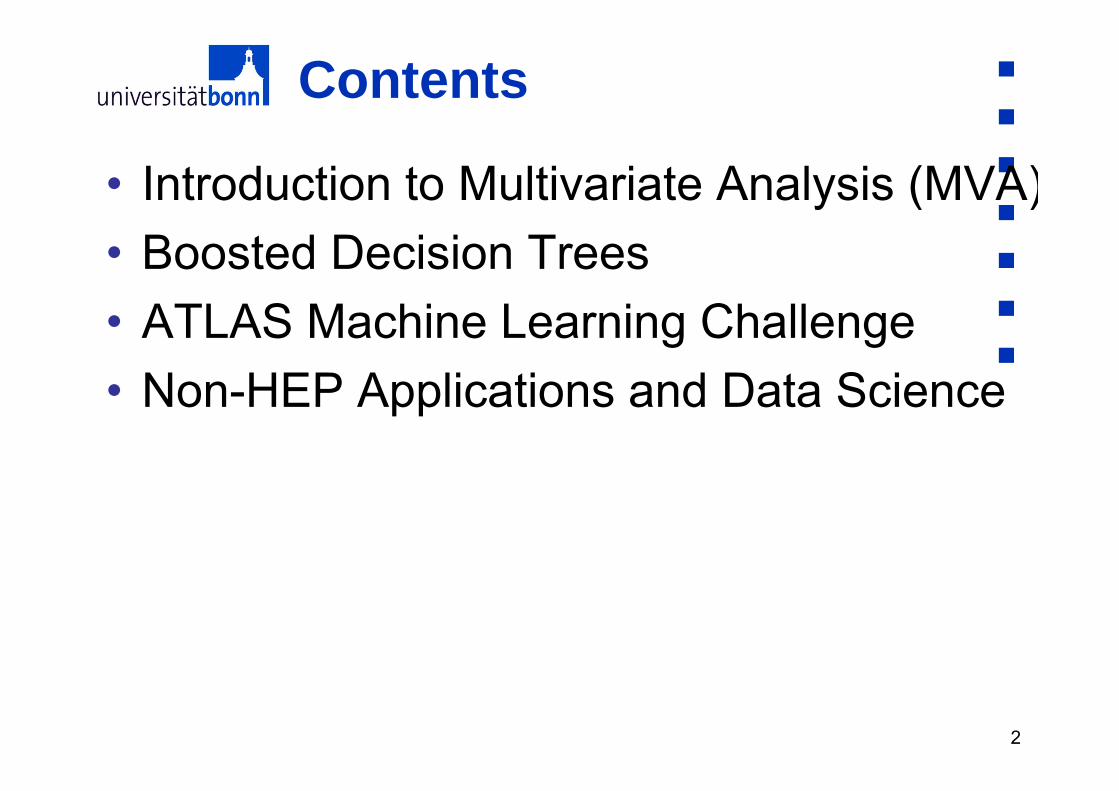
Contents
• Introduction to Multivariate Analysis (MVA)• Boosted Decision Trees• ATLAS Machine Learning Challenge• Non-HEP Applications and Data Science

3
Introduction to
Multi-variate Analysis
Eckhard von Toerne
4
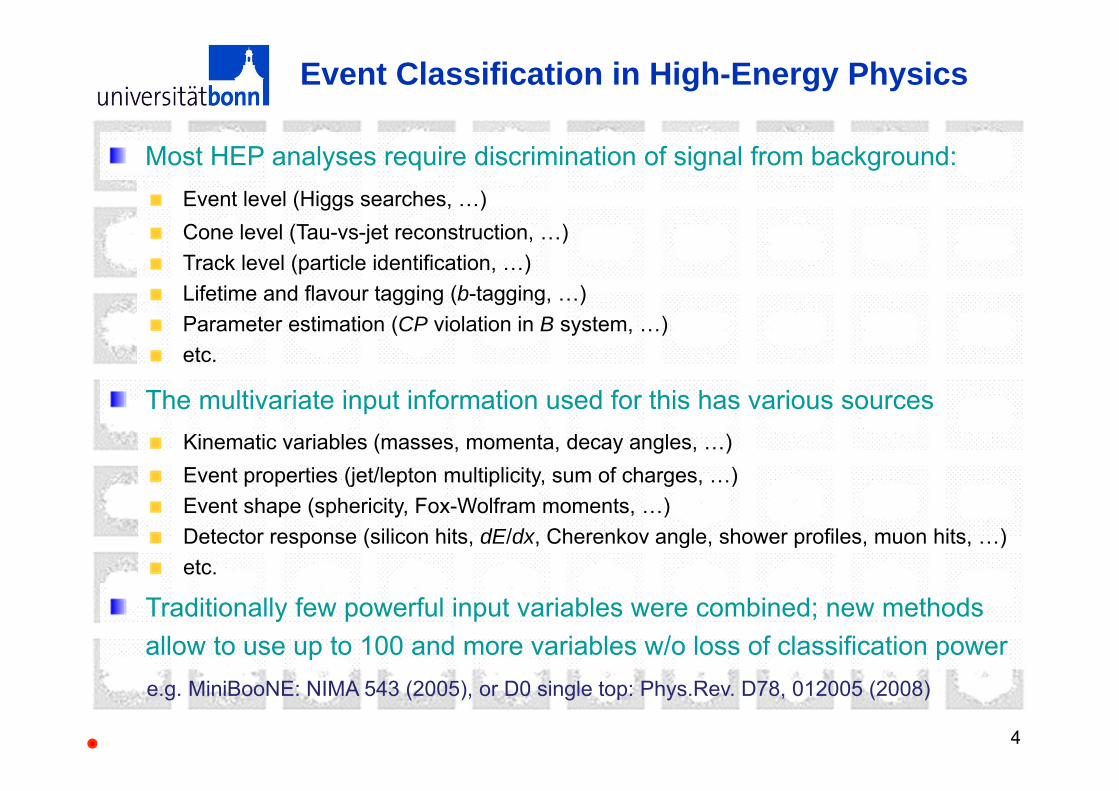
Event Classification in High-Energy Physics
Most HEP analyses require discrimination of signal from background:Event level (Higgs searches, …) Cone level (Tau-vs-jet reconstruction, …)Track level (particle identification, …) Lifetime and flavour tagging (b-tagging, …)Parameter estimation (CP violation in B system, …)etc.
The multivariate input information used for this has various sources Kinematic variables (masses, momenta, decay angles, …) Event properties (jet/lepton multiplicity, sum of charges, …)Event shape (sphericity, Fox-Wolfram moments, …)Detector response (silicon hits, dE/dx, Cherenkov angle, shower profiles, muon hits, …)etc.
Traditionally few powerful input variables were combined; new methods allow to use up to 100 and more variables w/o loss of classification powere.g. MiniBooNE: NIMA 543 (2005), or D0 single top: Phys.Rev. D78, 012005 (2008)
5
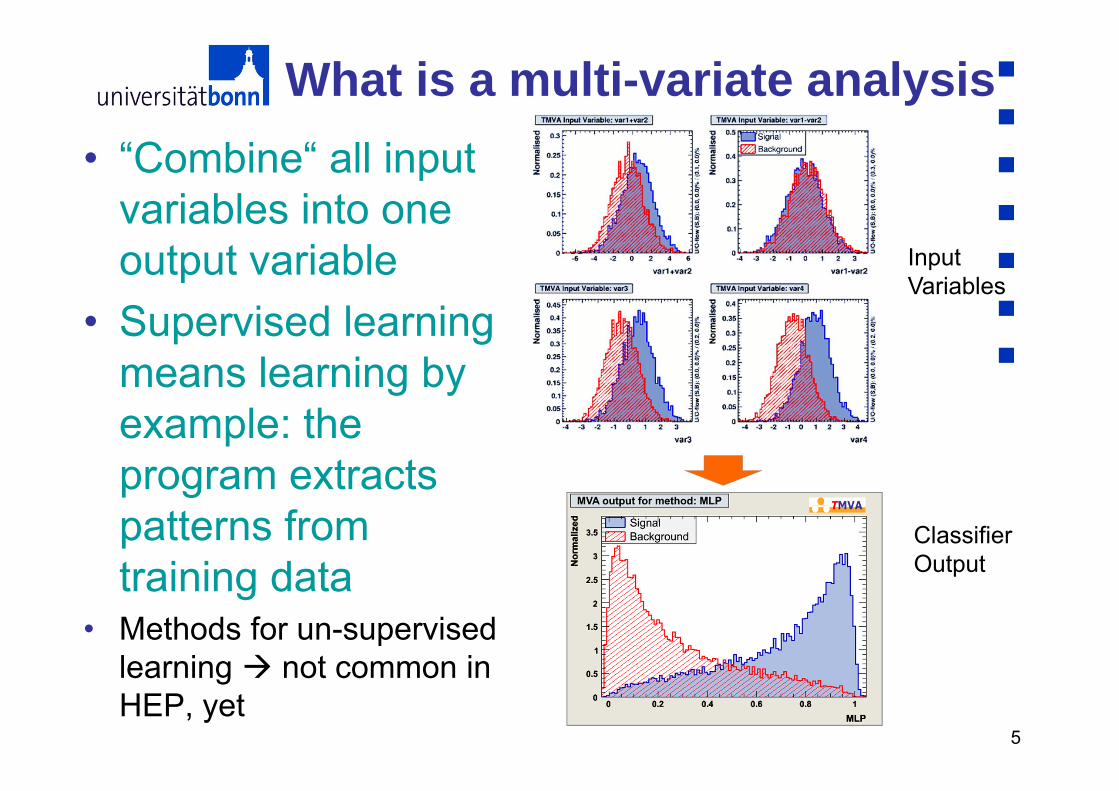
What is a multi-variate analysis• “Combine“ all input
variables into oneoutput variable
• Supervised learningmeans learning byexample: theprogram extractspatterns fromtraining data
• Methods for un-supervisedlearning not common in HEP, yet
Input Variables
Classifier Output
6
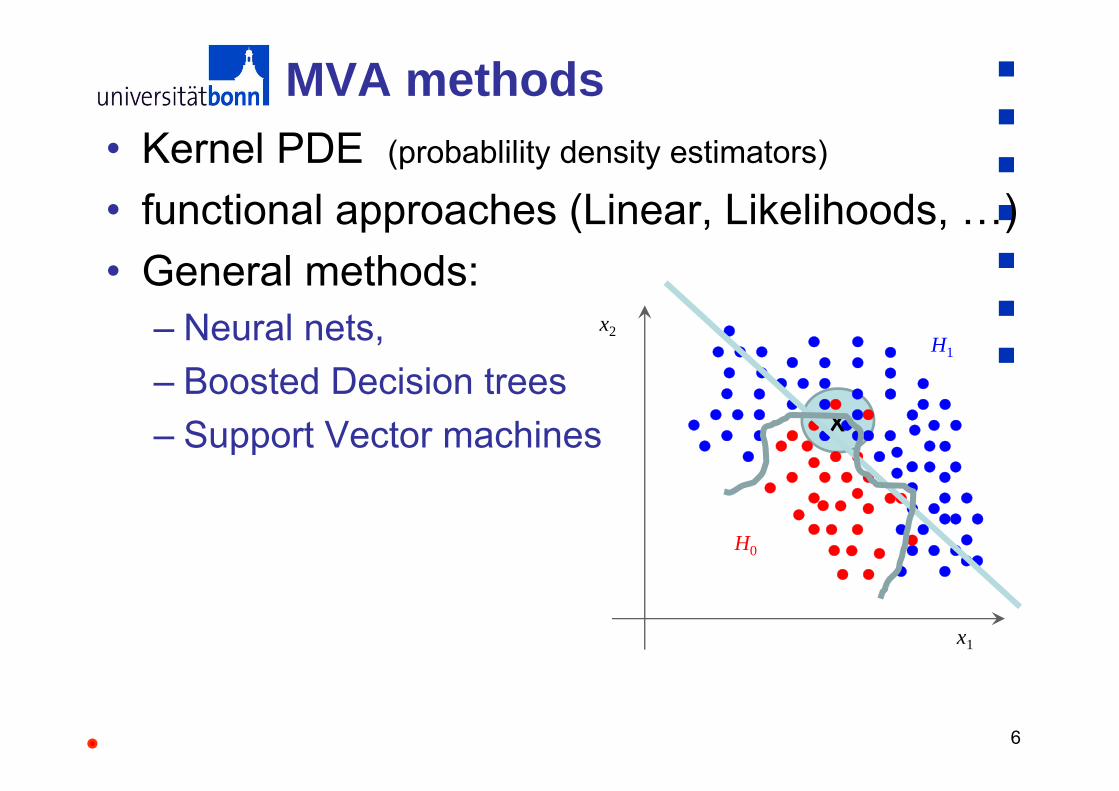
MVA methods• Kernel PDE (probablility density estimators)
• functional approaches (Linear, Likelihoods, …) • General methods:
– Neural nets, – Boosted Decision trees– Support Vector machines
H1
H0
x1
x2
X
7
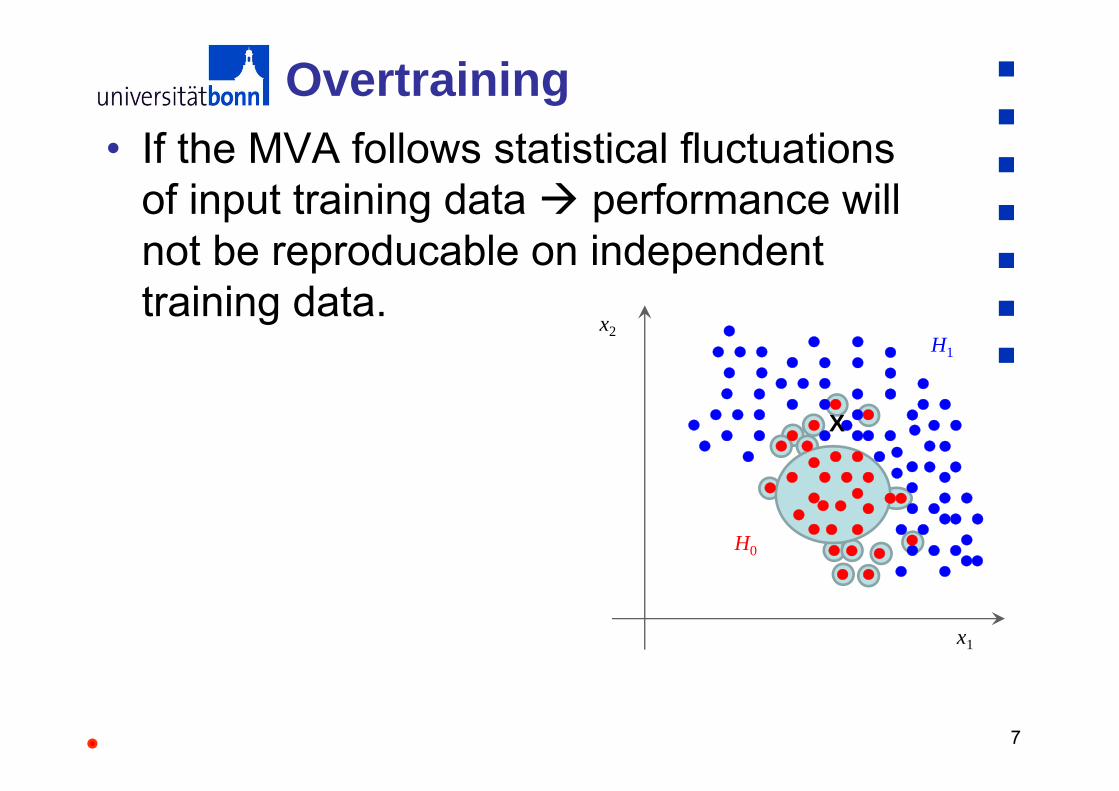
Overtraining• If the MVA follows statistical fluctuations
of input training data performance will not be reproducable on independenttraining data.
H1
H0
x1
x2
X
8
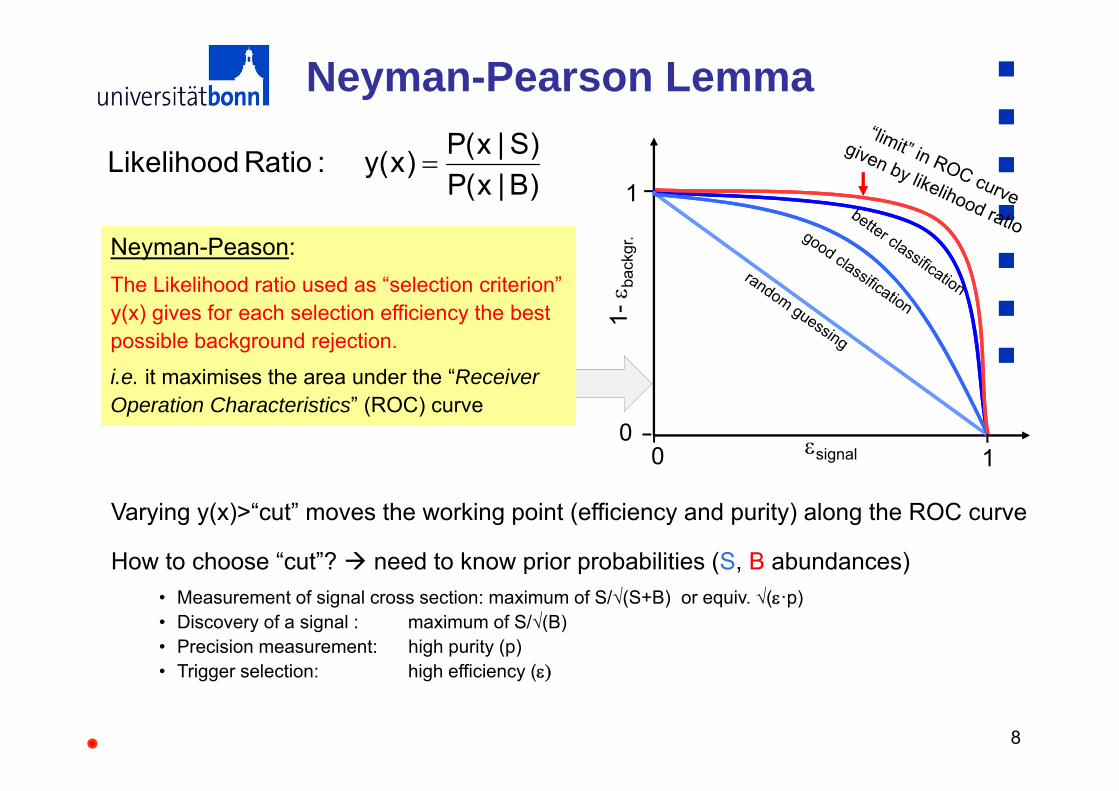
Neyman-Pearson Lemma
Neyman-Peason:The Likelihood ratio used as “selection criterion” y(x) gives for each selection efficiency the best possible background rejection.
i.e. it maximises the area under the “Receiver Operation Characteristics” (ROC) curve
Neyman-Peason:The Likelihood ratio used as “selection criterion” y(x) gives for each selection efficiency the best possible background rejection.
i.e. it maximises the area under the “Receiver Operation Characteristics” (ROC) curve
Varying y(x)>“cut” moves the working point (efficiency and purity) along the ROC curve
How to choose “cut”? need to know prior probabilities (S, B abundances) • Measurement of signal cross section: maximum of S/√(S+B) or equiv. √(·p)• Discovery of a signal : maximum of S/√(B)• Precision measurement: high purity (p)• Trigger selection: high efficiency (
P(x | S)Likelihood Ratio : y(x)P(x | B)
0 1
1
0
1- b
ackg
r.
signal
9
Toolkit for MultiVariate Analysis (TMVA)
10
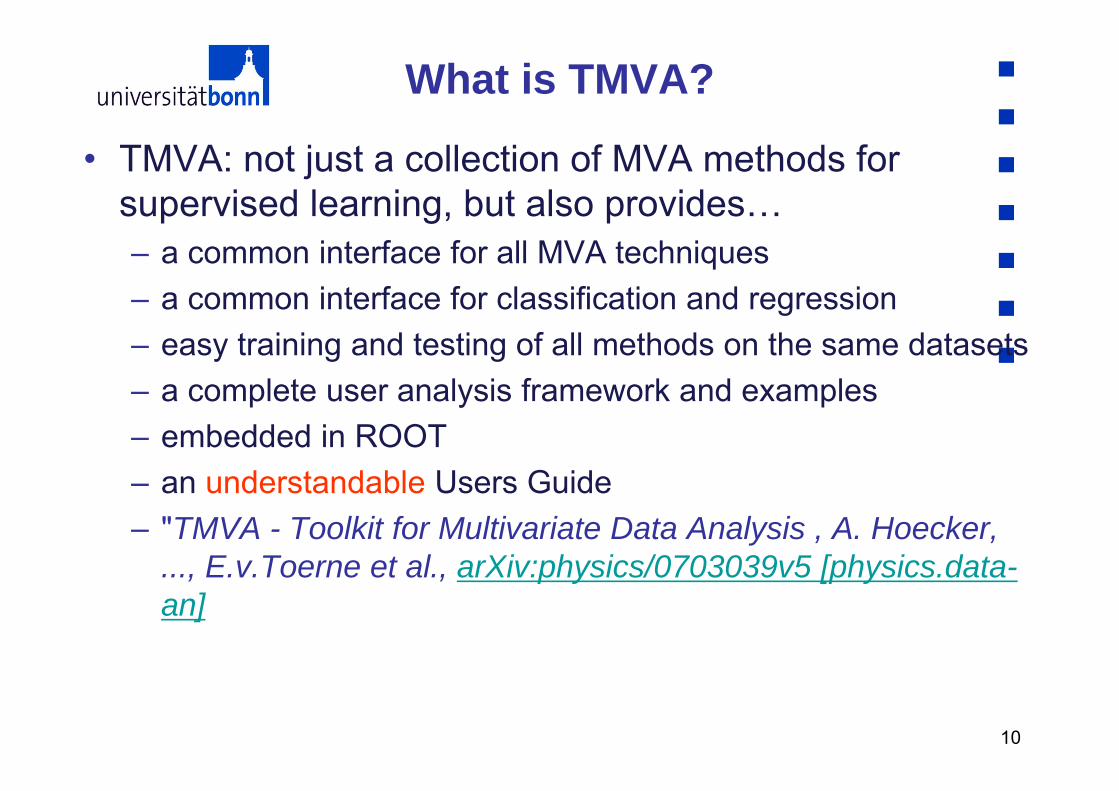
• TMVA: not just a collection of MVA methods forsupervised learning, but also provides…– a common interface for all MVA techniques– a common interface for classification and regression– easy training and testing of all methods on the same datasets– a complete user analysis framework and examples– embedded in ROOT– an understandable Users Guide– "TMVA - Toolkit for Multivariate Data Analysis , A. Hoecker,
..., E.v.Toerne et al., arXiv:physics/0703039v5 [physics.data-an]
What is TMVA?
11
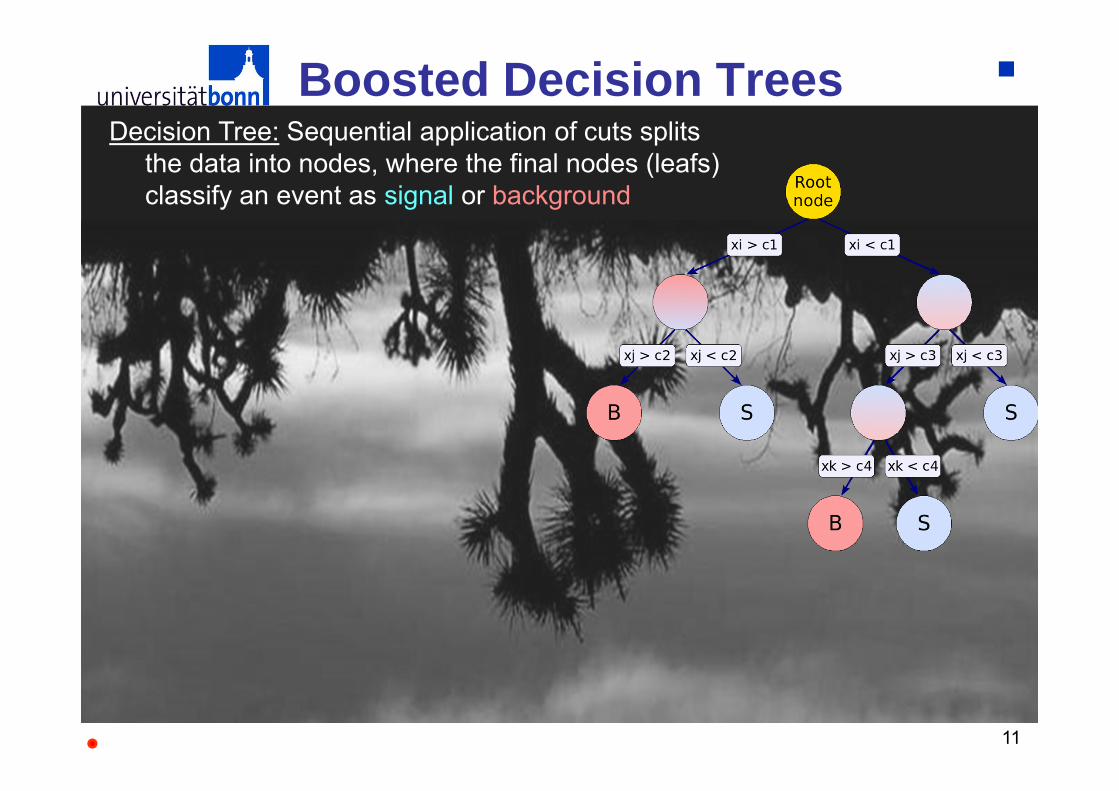
Boosted Decision TreesDecision Tree: Sequential application of cuts splits
the data into nodes, where the final nodes (leafs) classify an event as signal or background
12
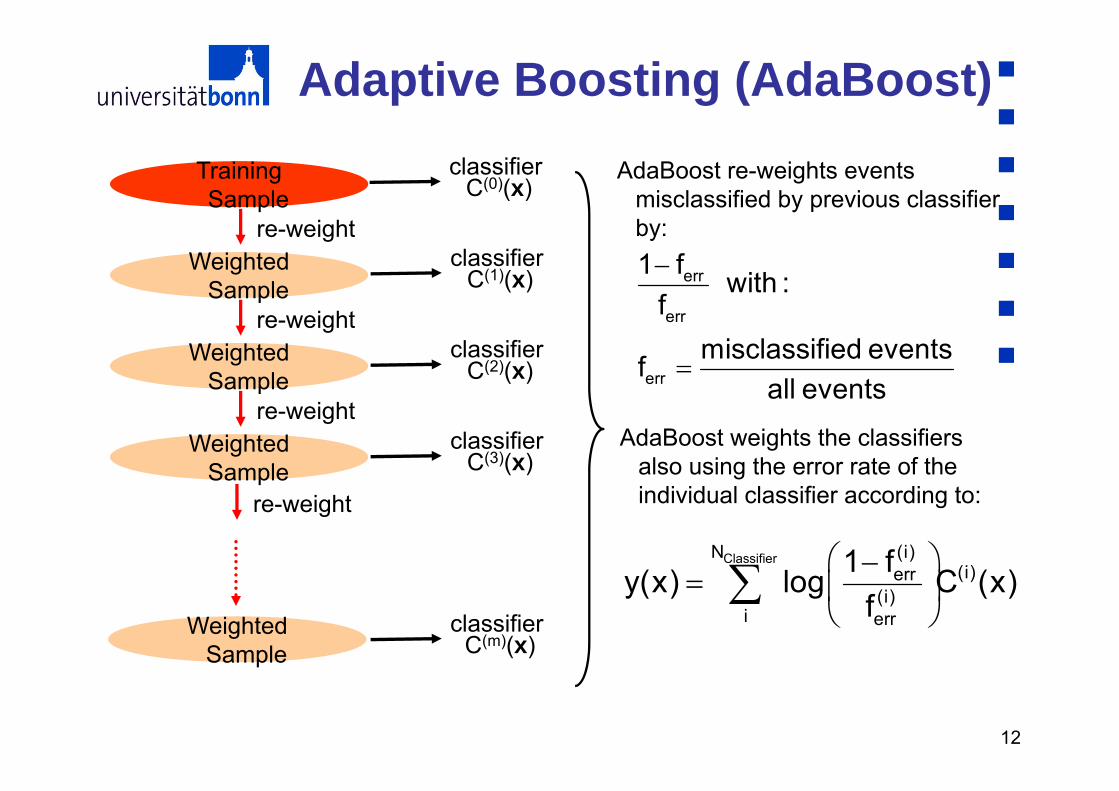
Adaptive Boosting (AdaBoost)Training Sample
classifier C(0)(x)
Weighted Sample
re-weightclassifier
C(1)(x)
Weighted Sample
re-weightclassifier
C(2)(x)
Weighted Sample
re-weight
Weighted Sample
re-weight
classifier C(3)(x)
classifier C(m)(x)
err
err
err
1 f with :f
misclassified eventsfall events
ClassifierN (i)(i)err
(i)i err
1 fy(x) log C (x)f
AdaBoost re-weights events misclassified by previous classifier by:
AdaBoost weights the classifiers also using the error rate of the individual classifier according to:
13
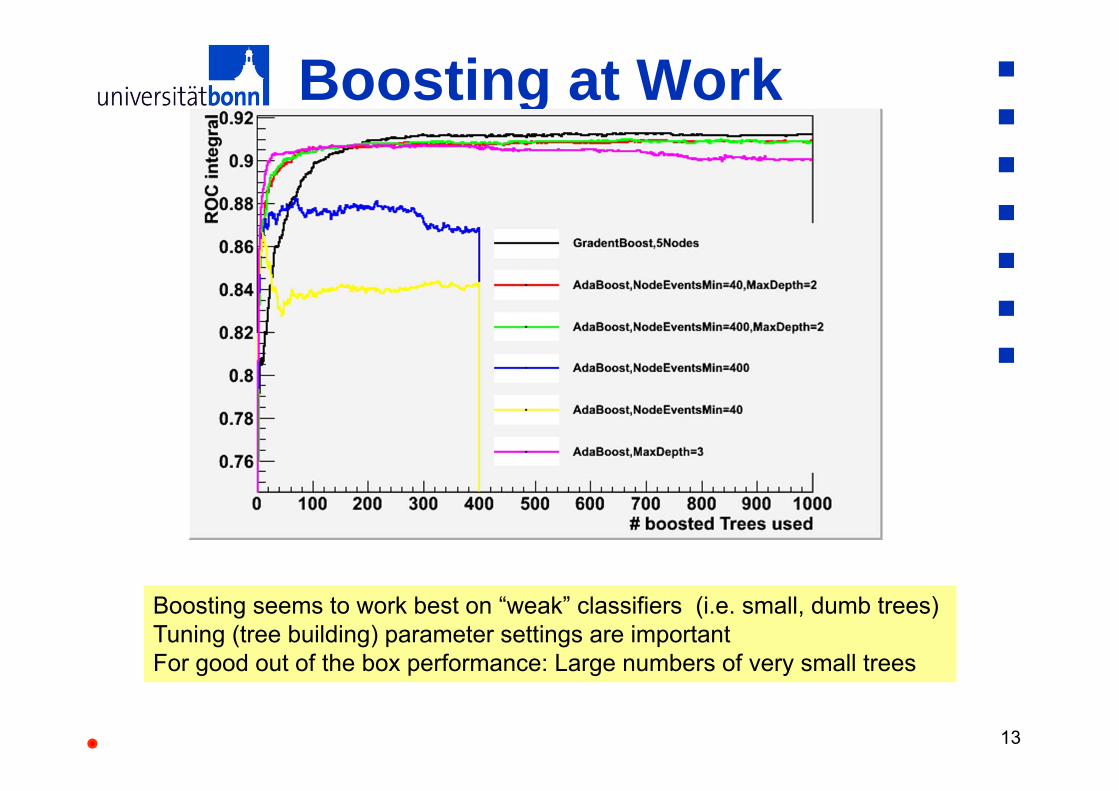
Boosting at Work
Boosting seems to work best on “weak” classifiers (i.e. small, dumb trees)Tuning (tree building) parameter settings are important For good out of the box performance: Large numbers of very small trees

14
The ATLAS HiggsMachine Learning
Challenge
Eckhard von Toerne

15
• Hosted on kaggle• training data in VBF
H (~ 30 var)• Publicly available: 250k
training events• 550k evaluation data with
hidden truth-tag. • Participants submit tag
list for evaluation data• Evaluation feed-back
in two-step process
16
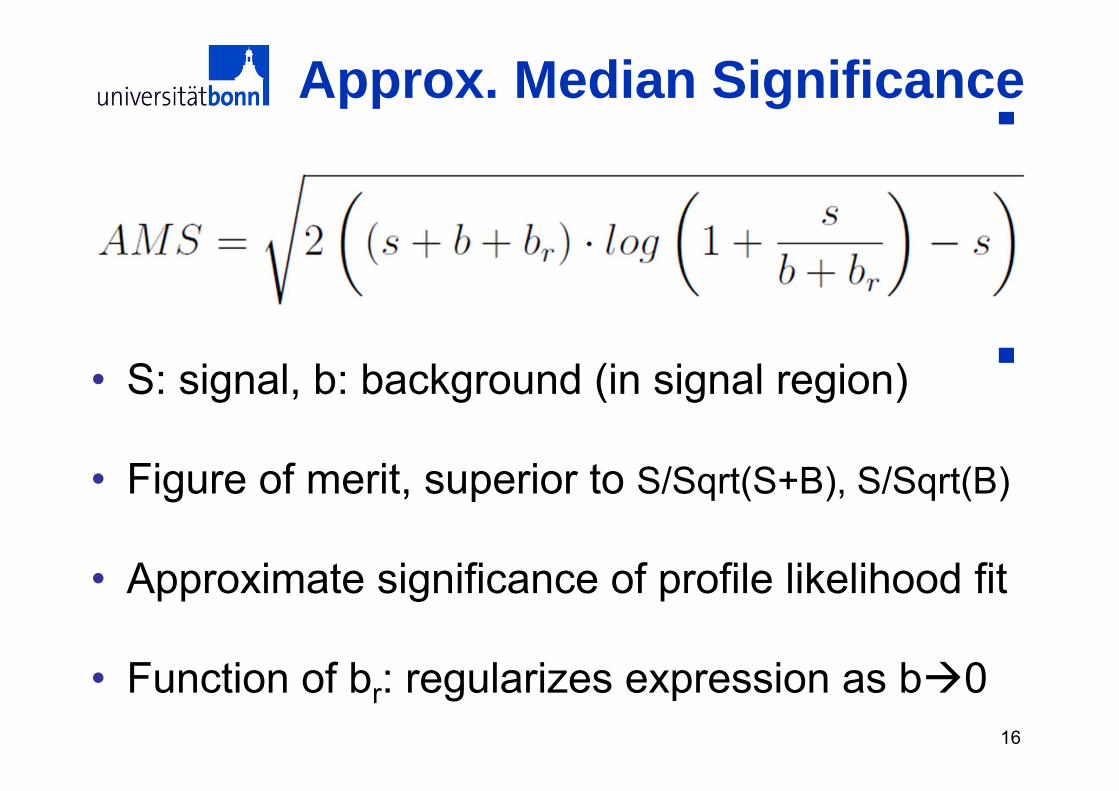
Approx. Median Significance
• S: signal, b: background (in signal region)
• Figure of merit, superior to S/Sqrt(S+B), S/Sqrt(B)
• Approximate significance of profile likelihood fit
• Function of br: regularizes expression as b0
17
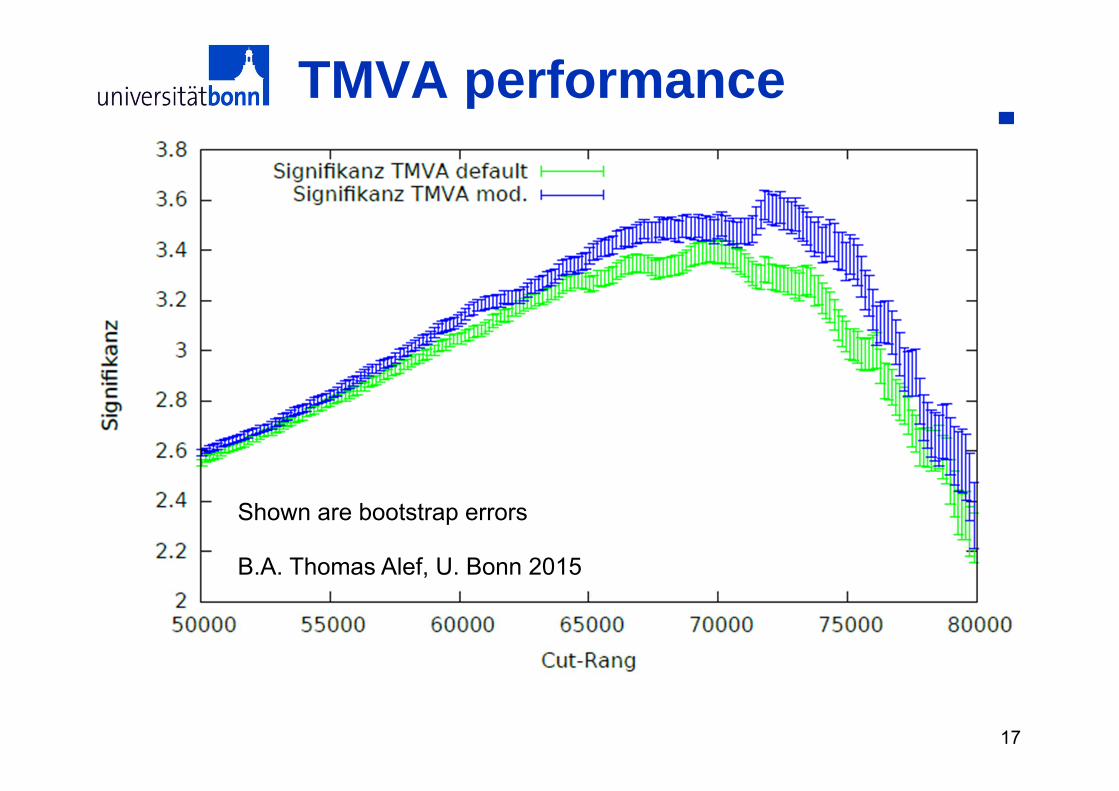
TMVA performance• Simpl
B.A. Thomas Alef, U. Bonn 2015
Shown are bootstrap errors
18
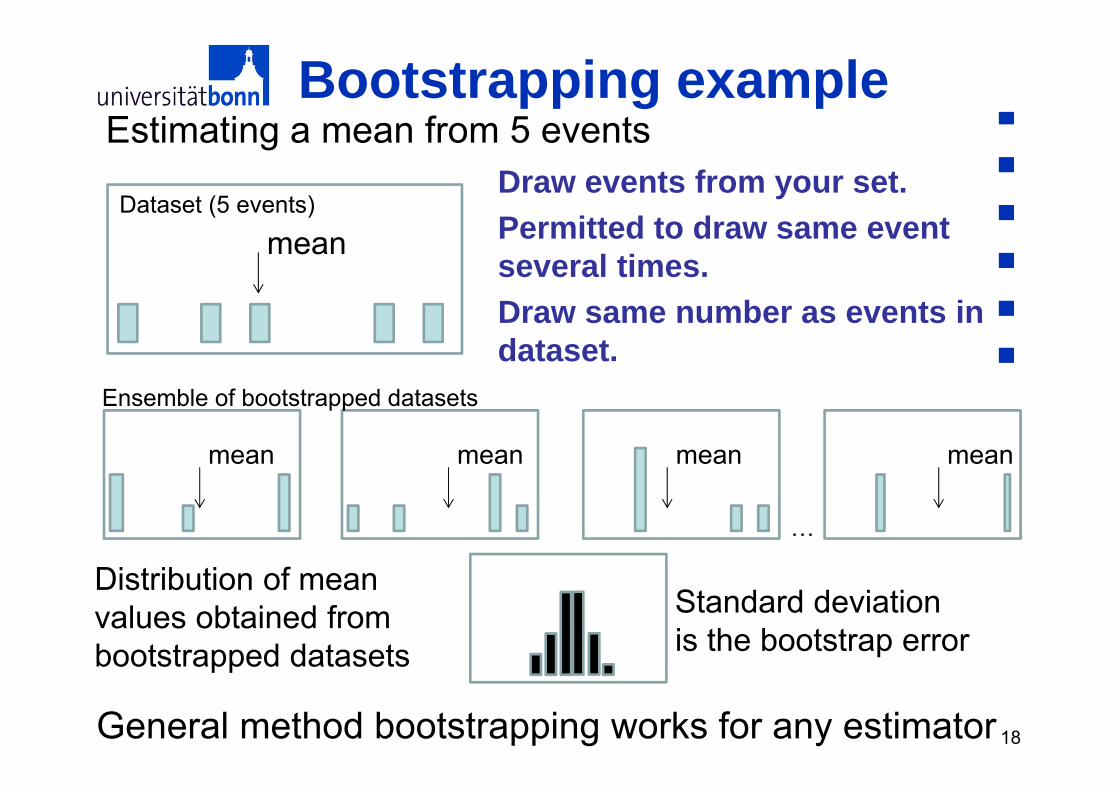
Bootstrapping exampleEstimating a mean from 5 events
Dataset (5 events)
Ensemble of bootstrapped datasets
mean
mean mean mean mean
Standard deviationis the bootstrap error
…
Distribution of meanvalues obtained frombootstrapped datasets
General method bootstrapping works for any estimator
Draw events from your set.Permitted to draw same eventseveral times. Draw same number as events in dataset.
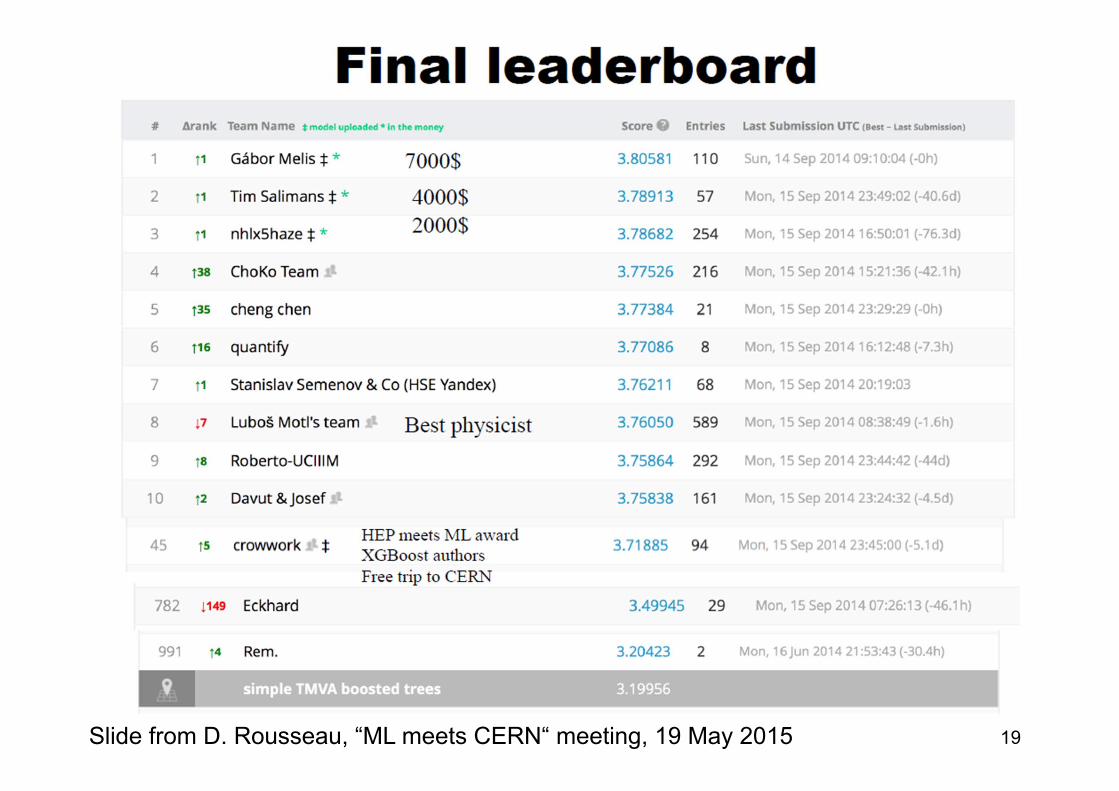
19Bonn, 22. Oktober 2007 Eckhard von ToerneSlide from D. Rousseau, “ML meets CERN“ meeting, 19 May 2015

20Bonn, 22. Oktober 2007 Eckhard von Toerne
https://www.kaggle.com/c/higgs-boson
21
Lessons learned• There are many tools out there apart from TMVA. • BDTs did well compared to neural nets
(winner Gabor Melis expressed only slightpreference for NN)
• Cross validation very important to fight overtrainingand statistical fluctuations
• Why challenge results are not directly transferable to ATLAS analyses– optimal working point with systematics differs strongly
from bare w.p.– Things get easier with sufficient M.C. stat.
22
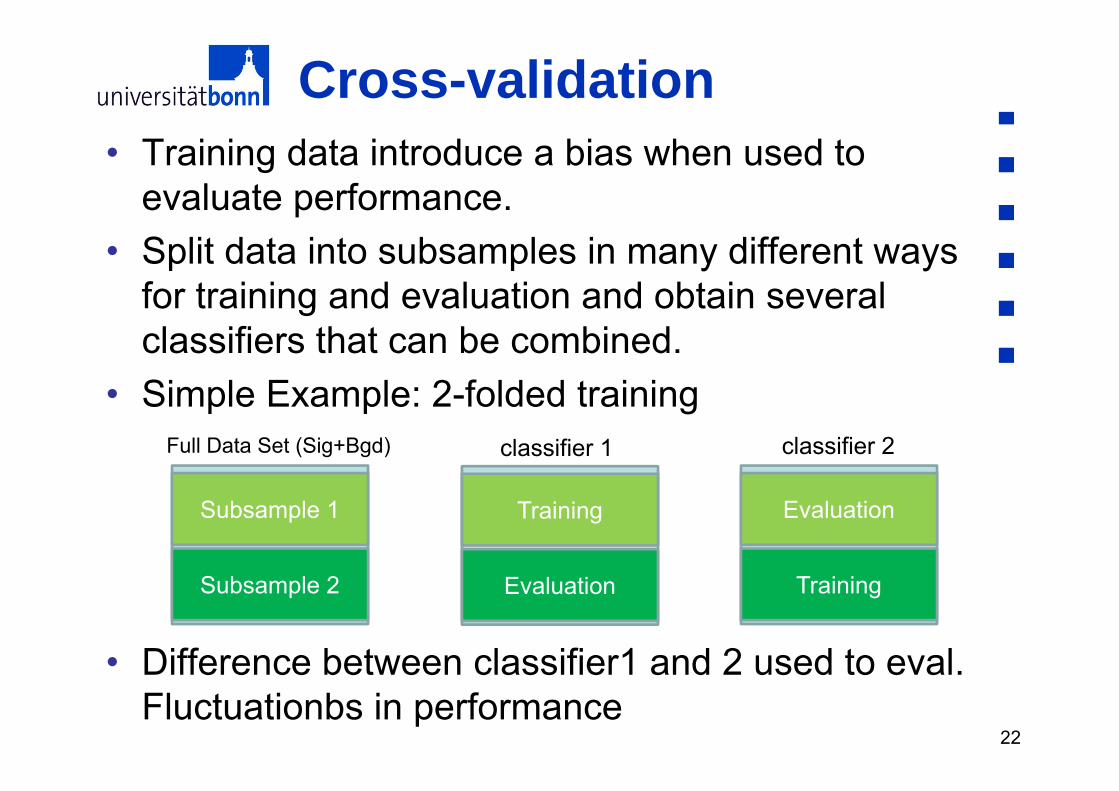
Cross-validation• Training data introduce a bias when used to
evaluate performance. • Split data into subsamples in many different ways
for training and evaluation and obtain severalclassifiers that can be combined.
• Simple Example: 2-folded training
• Difference between classifier1 and 2 used to eval. Fluctuationbs in performance
Subsample 1
Subsample 2
Full Data Set (Sig+Bgd)
Training
Evaluation
classifier 1
Evaluation
Training
classifier 2

232323TU Dresden Seminar 2017 Eckhard v. Toerne Multivariate Methods in Statistical Data Analysistest
Non-HEP applications ofMachine Learning
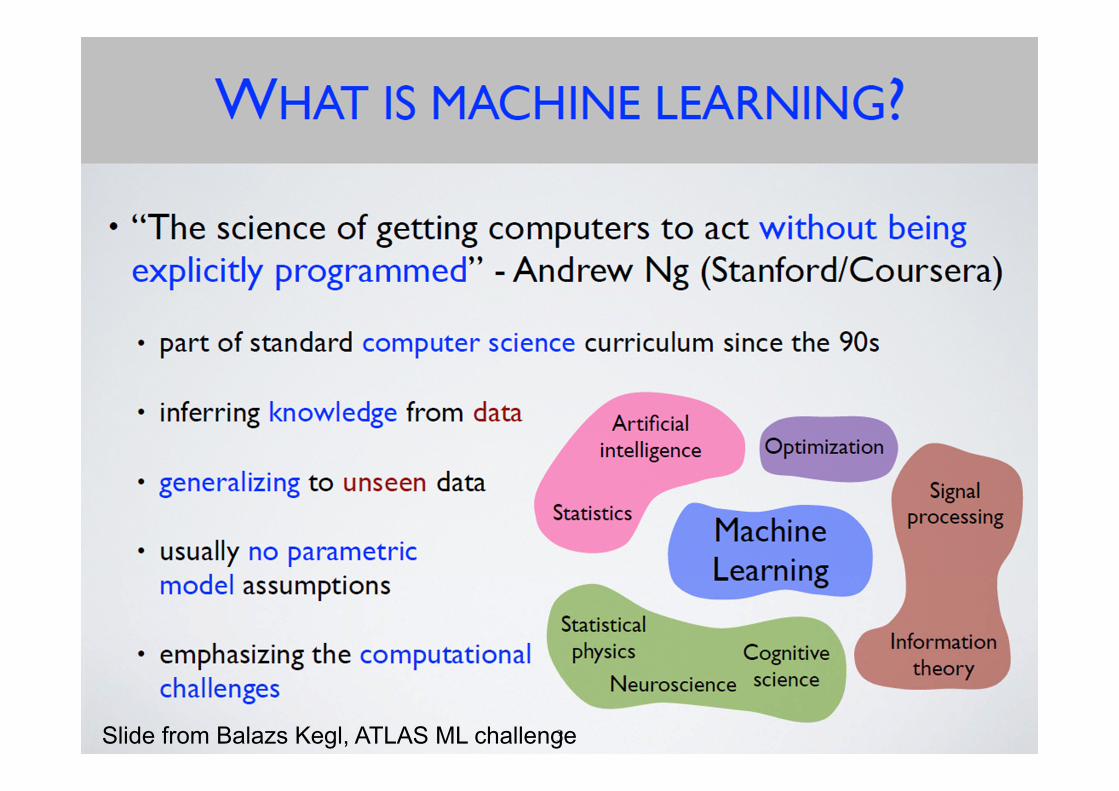
24Bonn, 22. Oktober 2007 Eckhard von ToerneSlide from Balazs Kegl, ATLAS ML challenge
252525TU Dresden Seminar 2017 Eckhard v. Toerne Multivariate Methods in Statistical Data Analysis
A simple non-HEP examplefor a multi-variateclassification task
262626TU Dresden Seminar 2017 Eckhard v. Toerne Multivariate Methods in Statistical Data Analysis
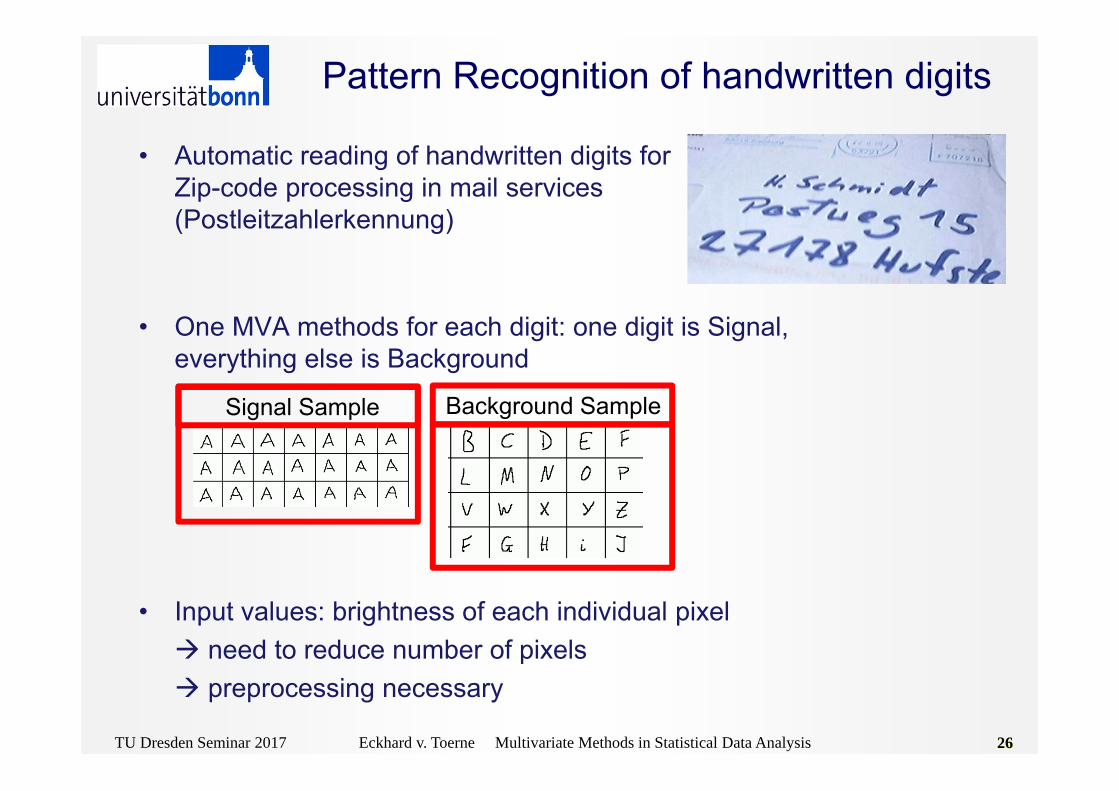
• Automatic reading of handwritten digits for Zip-code processing in mail services (Postleitzahlerkennung)
• One MVA methods for each digit: one digit is Signal, everything else is Background
• Input values: brightness of each individual pixel need to reduce number of pixels preprocessing necessary
Pattern Recognition of handwritten digits
Signal Sample Background Sample
272727TU Dresden Seminar 2017 Eckhard v. Toerne Multivariate Methods in Statistical Data Analysis
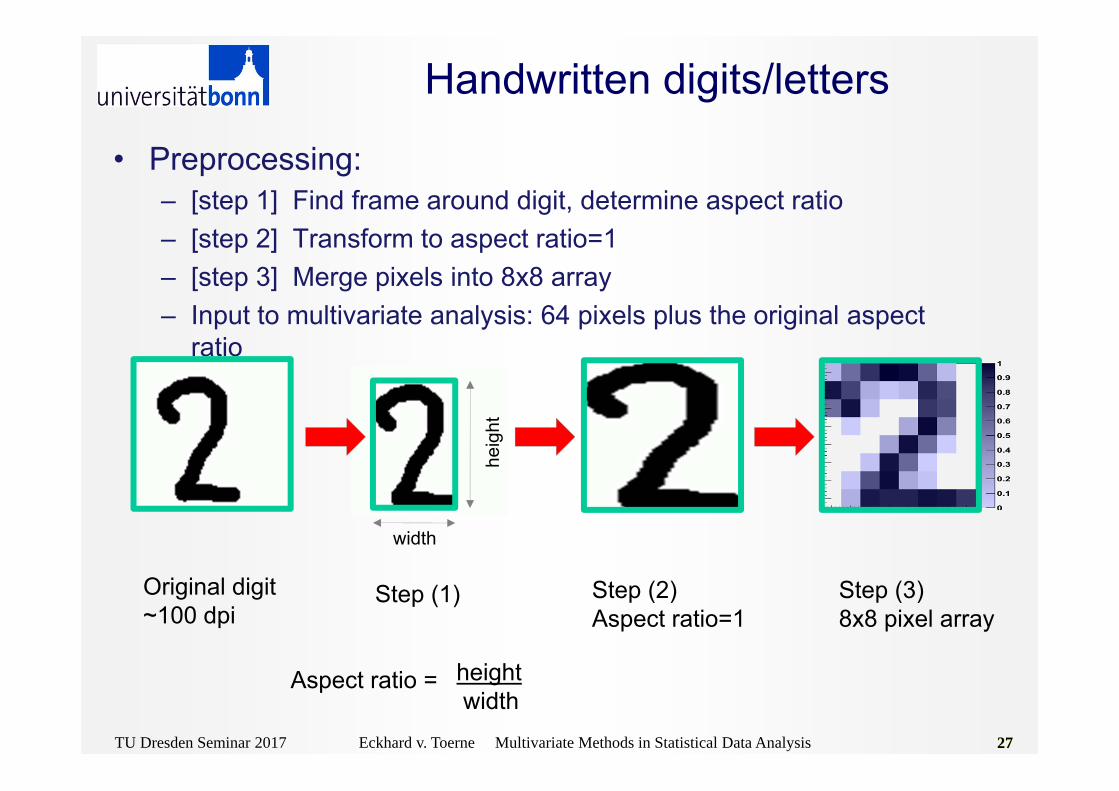
• Preprocessing: – [step 1] Find frame around digit, determine aspect ratio – [step 2] Transform to aspect ratio=1 – [step 3] Merge pixels into 8x8 array– Input to multivariate analysis: 64 pixels plus the original aspect
ratio
Handwritten digits/letters
width
heig
ht
Original digit~100 dpi
Step (1) Step (2)Aspect ratio=1
Step (3)8x8 pixel array
Aspect ratio = heightwidth
282828TU Dresden Seminar 2017 Eckhard v. Toerne Multivariate Methods in Statistical Data Analysis
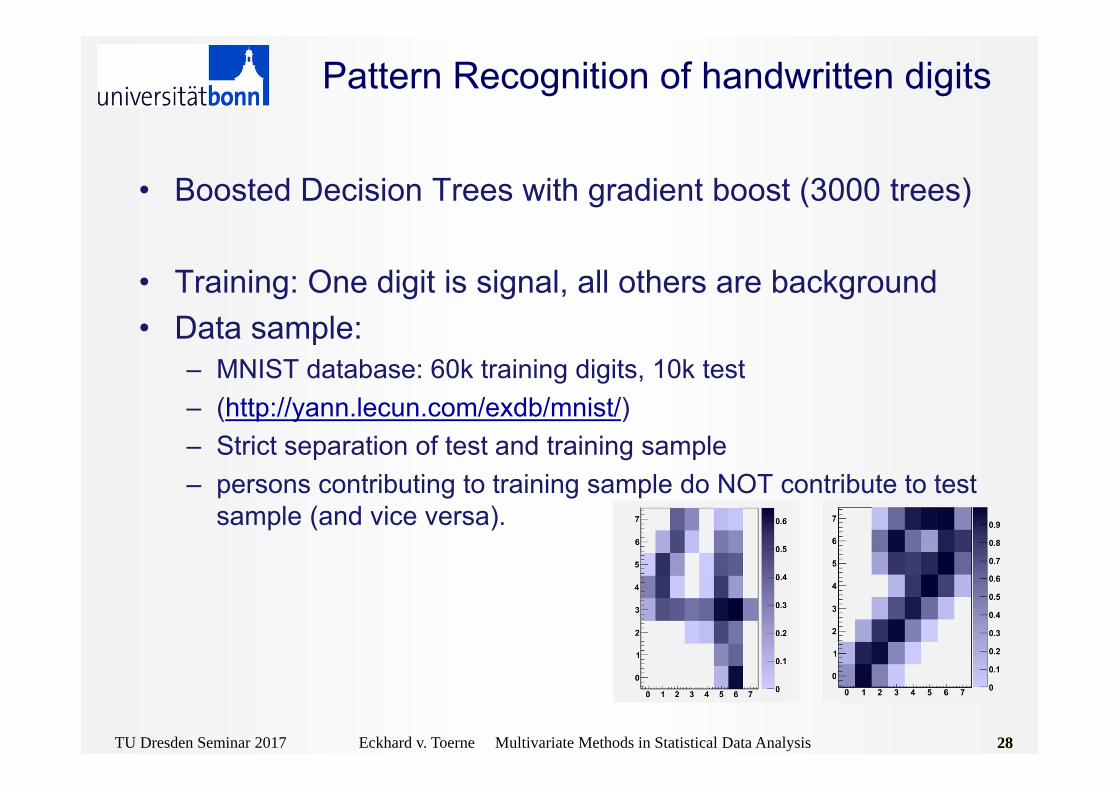
• Boosted Decision Trees with gradient boost (3000 trees)
• Training: One digit is signal, all others are background• Data sample:
– MNIST database: 60k training digits, 10k test– (http://yann.lecun.com/exdb/mnist/)– Strict separation of test and training sample– persons contributing to training sample do NOT contribute to test
sample (and vice versa).
Pattern Recognition of handwritten digits
292929TU Dresden Seminar 2017 Eckhard v. Toerne Multivariate Methods in Statistical Data Analysis
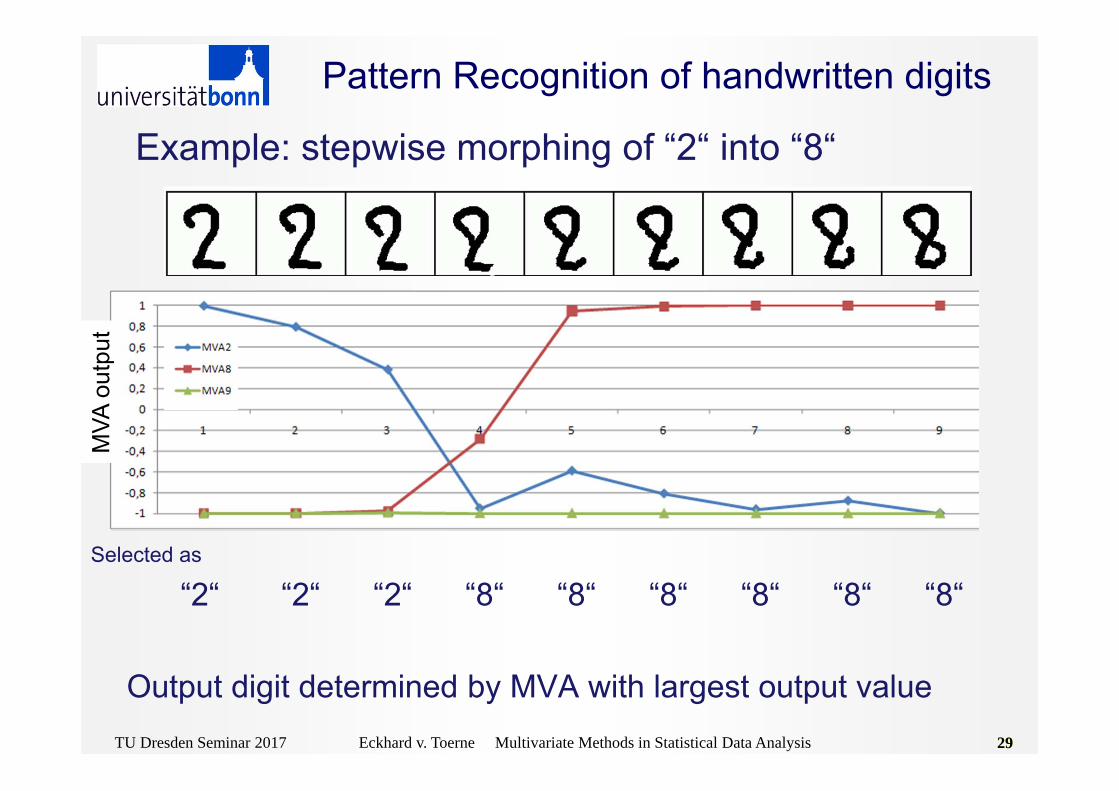
Example: stepwise morphing of “2“ into “8“
Selected as
“2“ “2“ “2“ “8“ “8“ “8“ “8“ “8“ “8“
Output digit determined by MVA with largest output value
Pattern Recognition of handwritten digitsM
VA o
utpu
t
303030TU Dresden Seminar 2017 Eckhard v. Toerne Multivariate Methods in Statistical Data Analysis
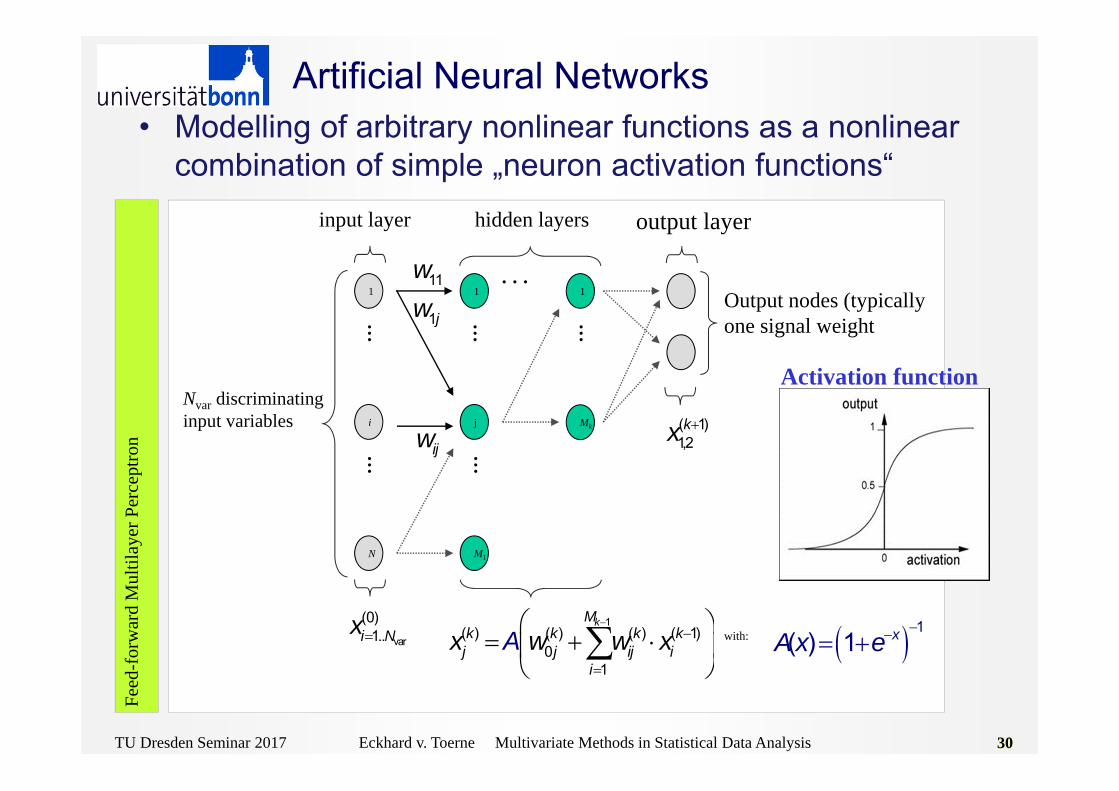
Artificial Neural Networks
1( ) 1 xA x e
1
i
. . .
N
input layer hidden layers output layer
1
j
M1
. . .
. . .1
. . .
Mk
Output nodes (typically one signal weight
Nvar discriminating input variables
11w
ijw
1jw. . . . . .
1( ) ( ) ( ) ( 1)
01
kMk k k kj j ij i
ix w w xA
var
(0)1..i Nx
( 1)1,2kx
Activation function
with:
Feed
-for
war
d M
ultil
ayer
Per
cept
ron
• Modelling of arbitrary nonlinear functions as a nonlinearcombination of simple „neuron activation functions“
31
Deep Neural Nets• Neural nets in HEP work with ~2 internal layers.• For decades deeper (Ninternal >> 2) nets would
perform worse• New ideas for training deep architectures emerged
in last 10 years.– New training techniques to fight saturation effects– Feature learning (unsupervised pre-training)– New regularization effects to suppress noise– Clever combination of several nets
32