Embed Size (px)
Citation preview

ORIGINAL ARTICLE
Multivariate prediction of skeletal Class II growth
David J. Rudolph, DDS, MS, PhD,a Stewart E. White, DDS,b and Peter M. Sinclair, DDS, MSDc
Los Angeles and Santa Barbara, Calif.
Prediction of craniofacial growth is one of the keys to successful orthodontic treatment andstability. Despite numerous attempts at growth forecasting, our ability to accurately predict growthis limited. The present study outlines a possible new approach to prediction of craniofacial growththat differs from any previous attempt because of both the methods used and type of patientsstudied. The purpose of this study is to create and test prediction equations for forecastingfavorable or unfavorable patterns of growth in skeletal Class II preadolescents. The subjects for thisstudy include 19 females and 12 males from the Bolton growth center in Cleveland, Ohio. Thepatients were all untreated orthodontically, had lateral cephalometric headfilms taken biannuallyfrom the ages of 6 through 18 and had a Class II skeletal relationship at age 8. Twenty-six skeletaland dental landmarks were identified and digitized, and 48 linear, angular, and proportionalmeasurements were calculated. The subjects were divided into two groups based on anterior-posterior changes in the relationship between the maxilla and mandible. Eleven patients were in thefavorable growth group, with an average improvement of 4.13° in the ANB angle; 20 patients werein the unfavorable growth group with an average increase of 0.16° in the ANB angle. The followingprediction formula was created with Bayes theorem and assuming a multivariate Gaussiandistribution:
P(Good ? Fn) 5 ke2(0.5) ? Fn 2 mng ? Sg21 ? Fn 2 mng ? T
The equation’s sensitivity and specificity was calculated from serial cephalometric data from ages6, 8, 10, and 12. The results obtained with this equation indicate 82.2% sensitivity, 95% specificitywith a overall positive predictive value of 91%. This corresponds to 17.8% of patients beingincorrectly identified as Poor Growers and only 5% of our patients were incorrectly identified asGood Growers. We conclude that this prediction formula improves the ability to predict favorable orunfavorable patterns of growth in this sample of skeletal Class II preadolescents. (Am J OrthodDentofacial Orthop 1998;114:283-91.)
Growth of the craniofacial complex inboth magnitude and direction has long been re-garded as a key factor for successful orthodontictreatment.1,2 Accurate prediction of future facialgrowth would assist the orthodontist in formulatinga treatment plan to achieve the best possible resultand long-term stability.3,4 This ability would be mostuseful when previous experience suggests that futurefacial growth of a patient is unpredictable yet criticalfor the successful completion of a treatment plan.5Numerous models and formulae have been designedfor predicting growth, however, our ability to cor-
rectly forecast variations of normal growth is stilllimited because of the complexity of the prob-lem.6,7
The theory that individual patterns of craniofa-cial growth are established at a young age, and onceachieved do not change, was popularized by Brodieet al.8-10 If this idea were correct, then attempts atprediction of future growth as a clinical aid would beof little importance. However, a significant amountof evidence exists that indicates that craniofacialgrowth patterns do change over time with respect toboth amount and direction.11-13 These findings vali-date the search for a solution to the problem offorecasting an person’s future craniofacial growth.
Initial attempts at growth prediction focused ona few key craniofacial characteristics. The mandib-ular plane angle,5,14 the Y axis,2 and the occlusalplane angle15 are several variables on which predic-tions of growth were based. These measurementsmay provide some indication of an person’s pastpattern of growth; however, they do not significantlyimprove the orthodontist’s ability to predict specificamounts of future facial skeletal growth.16 Another
This article is based on research submitted by Dr. White in partialfulfillment of the requirements for a certificate in Orthodontics, Depart-ment of Orthodontics, University of California at Los Angeles, School ofDentistry.aAssistant Professor, UCLA Department of Orthodontics.bOrthodontist in private practice, Santa Barbara, Calif.cChairman, USC Department of Orthodontics.Reprint requests to: David Rudolph, University of California at LosAngeles, School of Dentistry, Center for the Health Sciences, Box 951668,10833 Le Conte Avenue, Los Angeles, CA 90095-1668Copyright © 1998 by the American Association of Orthodontists.0889-5406/98/$5.00 1 0 8/1/83880
283

difficulty arises in trying to differentiate the contri-bution of some of these initial predictors whenchanges due to growth and changes due to treat-ment were confounded.
Subsequent studies used various cephalometriccriteria and procedures such as mesh diagrams,17
grids,18 arcial growth evaluations,19 and craniofacialtemplates20 in an effort to add incremental amountsto a current stage of development to predict futurechanges. In addition, multivariate regression meth-ods21,22 and mathematical formulae23 were used topredict future cephalometric craniofacial landmarkpositions and dimensions based on their spatialrelationships from a previous cephalometric radio-graph. These attempts also failed to achieve aclinically acceptable method of growth prediction,which is not surprising if one understands the crite-ria that must be met for an accurate facial growthprediction model.6
Recently, parental cephalometric data have beenexamined in an attempt to predict future craniofa-cial growth trends for offspring.24 Results have beenfavorable and more research using parental cranio-facial form, as well as examining other geneticfactors to predict growth, is indicated.
The majority of these previous studies haveattempted to predict exact incremental and direc-tional amounts of craniofacial growth on samplescomposed of more than one skeletal classification ofpatients. Predicting growth patterns21 for a specificclassification of patient,25,26 rather than using amixed sample to predict final hard tissue dimensionsand locations, may be a more realistic approach tothe growth prediction problem. Skeletal Class IIpre-adolescents are one type of patient whose futurepattern of favorable or unfavorable growth, if pre-dictable, could greatly affect the initial orthodontictreatment plan, future mechanics, and final result.To date the literature does not contain an accuratemethod of predicting future growth on skeletal ClassII preadolescents. Recognition of the limited suc-cess at solving the growth forecasting problemleads us to try to develop a new prediction methodfor this specific type of patient. Therefore thepurpose of this study is to create and test predic-tion equations for forecasting patterns of growthin skeletal Class II preadolescents with an un-treated sample.
MATERIAL AND METHODS
Two types of Class II skeletal patients were studied,those that grew favorably from age 8 to 18 (good growers),and those that did not (poor growers). This sample ofpatients was obtained from the Bolton Longitudinalgrowth study in Cleveland, Ohio and initially consisted of45 skeletal Class II subjects (27 females, 18 males) ofNorthwestern European descent who were untreated or-
thodontically and had serial headfilms taken biannuallyfrom the ages of 6 through 18. The sample was reducedand divided into two groups on the basis of the followinginclusion criteria.
Group 1 (Poor Growers)
1. ANB angles between 5.5° and 9° (moderate skele-tal Class II) at age 8.
2. Mandibular plane angle (GoGnSN) of 33° 6 5°.3. Experienced less than 1° of improvement in the
ANB angle from age 8 to 18 years.
Group 2 (Good Growers)
1. Same as group 1.2. Same as group 1.3. Experienced an improvement in the ANB discrep-
ancy of greater than 3° from age 8 to 18 years.
Thirty-one patients made up the final sample with 20 ofthe patients (12 females, 8 males) filling the group 1criterion (poor growers) and 11 patients (7 females, 4males) into group 2 (good growers). Fourteen patients (8females, 6 males) possessed initial measurements thatsatisfied the first criteria but were excluded because theyhad an ANB improvement of between 1° and 3° (12patients) or had a mandibular plane value (GoGnSN) ofgreater than 38° or less than 28° (6 patients). The 155cephalograms analyzed from these 31 patients at ages 6, 8,10, 12, and 18 years were traced by the same investigatoron cephalometric 8 3 01 inch tracing acetate using a 0.3mm lead pencil. Twenty-six skeletal and dental landmarkswere identified on each film and then digitized with aNumonics “lightbox” scanner linked to a Macintosh Per-forma 6115CD computer. Digitization of these landmarkswas used to insure accuracy and to facilitate the calcula-tion of the 48 cephalometric variables needed for dataanalysis. A customized software program was used toorient the landmark input and calculate the cephalometricmeasurements. The measurements were linear, angular, orproportional, and were separated into four categories: skel-etal A-P, skeletal vertical, dental, and miscellaneous skeletaland dental. These variables were taken from existing analy-ses that included: Ricketts,27 McNamara and Bruden,28
Jacobsen,29 Downs,2 and Steiner.30 These 48 measurementsat ages 6, 8, 10, and 12 years comprise the 192 feature valuesused by the growth prediction formulas.
The following craniofacial growth prediction formulaswere created by using Bayes’ theorem and assuming amultivariate Gaussian distribution:
P~Good ? Fn! 5
k1e 2 ~0.5! ? Fn 2 mng ?Sg2 1 ? Fn 2 mng ? T (1)
P(Good ? Fn) is the probability of predicting a good growergiven the set of 192 feature values (Fn). Features takenfrom all patients that were good growers were used to
American Journal of Orthodontics and Dentofacial OrthopedicsSeptember 1998
284 Rudolph, White, and Sinclair
estimate the mean feature values (mng) and the covariancematrices (Sg) of good growers. Like Equation 1 theprobability of being a poor grower can be calculated fromEquation 2:
P~Poor ? Fn! 5
k2e 2 ~0.5! ? Fn 2 mnp ? Sp2 1 ? Fn 2 mnp ? T (2)
where mnp are the mean feature values and Ep thecovariance matrices of the poor growers. The “k” are anormalization constant and can be determined by assum-ing P(Good/Fn) 1 P(Poor/Fn) 3 100 5 100%. “E” is thenatural logarithm and is equal to 2.303. Two equations areneeded in this study because the constant k needs to becalculated. The 192 variables for each of the 31 patientsstudied were then transferred to a Sun Sparc 20 workstation where the mean feature values and the covariancematrices of both the good and poor growers were calcu-lated. Then the prediction equations were applied to eachpatient to determine each individual’s probability of beinga good grower and poor grower between the ages of 12and 18. Once these probabilities were found, each patientwas classified as being either a good or poor growerdepending on a classification probability cutoff level.
Sensitivity, or the ability to correctly identify disease(poor growers) when present, specificity, or the ability toidentify the normal (good growers) correctly, and thepredictive value (overall accuracy) of the prediction equa-tions were determined. The sensitivity, specificity, andoverall predictive values could be adjusted by varying theclassification probability cutoff levels at which patientswere classified as good or poor growers. For example, theclassification probability level could be set at 60%, whichmeans that the probability of being a poor grower must begreater than or equal to 60% in order for the patient to beclassified as a poor grower. If the computed probability isless than 60% the patient would be classified as a goodgrower. If 75% was chosen as the cutoff probability level,then some patients would be classified differently. Thesensitivity value can be improved at the expense ofreducing the specificity value, or the specificity can beincreased with a resultant decrease in the sensitivity.
Error analysis
Cephalograms of 10 subjects (5 good growers and 5poor growers) were selected at random and redigitized ona different day by the same investigator. Dahlberg’s31
formula was then used to calculate the error standarddeviations for each of the variables in the analysis. TheInterincisal Angle had a SDE of 1.62°, with the majority(15 of 18) of the remaining angular measures under 1°.The largest linear error was the Nasion Perpendicular toPogonion measurement with a SDE of 0.892 mm; thelinear measures had a average SDE of around 0.6 mm.The largest proportional measurement error was that ofArticulare to Gonion/Gonion to Gnathion, which had aSDE of 1.32%. The results of this error study are withinthe expected range of previously reported estimates oftechnical error,32,33 and support the digitization methodsused in this study.
RESULTS
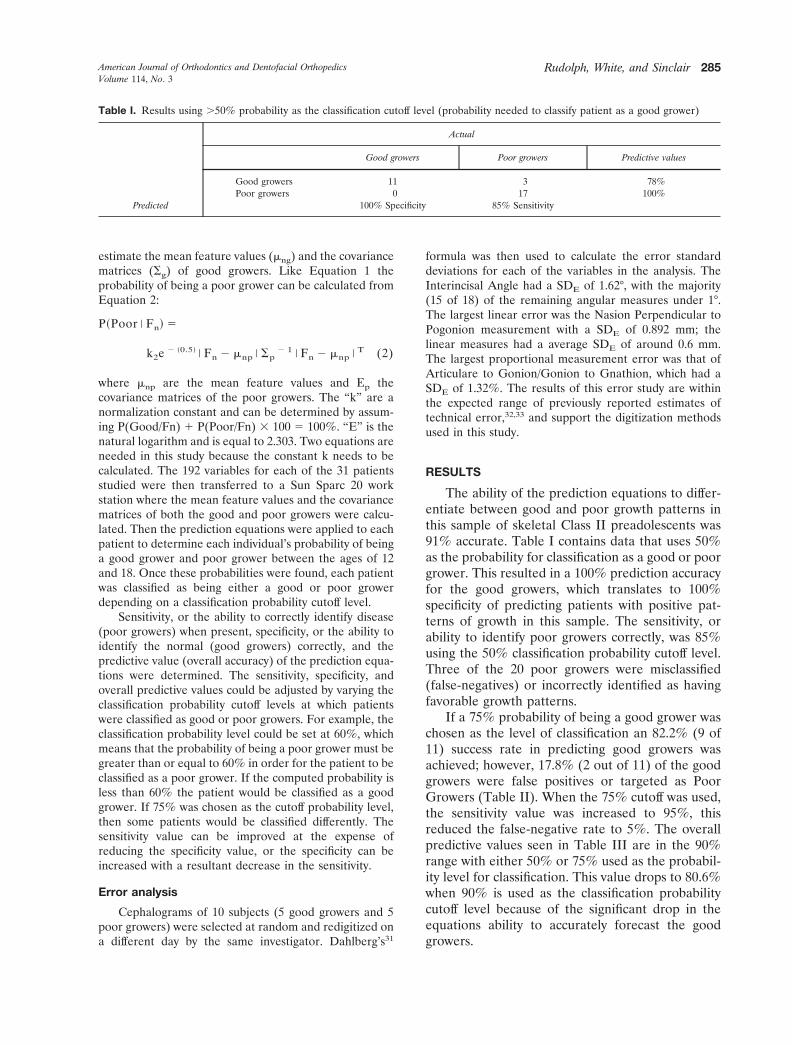
The ability of the prediction equations to differ-entiate between good and poor growth patterns inthis sample of skeletal Class II preadolescents was91% accurate. Table I contains data that uses 50%as the probability for classification as a good or poorgrower. This resulted in a 100% prediction accuracyfor the good growers, which translates to 100%specificity of predicting patients with positive pat-terns of growth in this sample. The sensitivity, orability to identify poor growers correctly, was 85%using the 50% classification probability cutoff level.Three of the 20 poor growers were misclassified(false-negatives) or incorrectly identified as havingfavorable growth patterns.
If a 75% probability of being a good grower waschosen as the level of classification an 82.2% (9 of11) success rate in predicting good growers wasachieved; however, 17.8% (2 out of 11) of the goodgrowers were false positives or targeted as PoorGrowers (Table II). When the 75% cutoff was used,the sensitivity value was increased to 95%, thisreduced the false-negative rate to 5%. The overallpredictive values seen in Table III are in the 90%range with either 50% or 75% used as the probabil-ity level for classification. This value drops to 80.6%when 90% is used as the classification probabilitycutoff level because of the significant drop in theequations ability to accurately forecast the goodgrowers.
Table I. Results using .50% probability as the classification cutoff level (probability needed to classify patient as a good grower)
Actual
Predicted
Good growers Poor growers Predictive values
Good growers 11 3 78%Poor growers 0 17 100%
100% Specificity 85% Sensitivity
American Journal of Orthodontics and Dentofacial OrthopedicsVolume 114, No. 3
Rudolph, White, and Sinclair 285

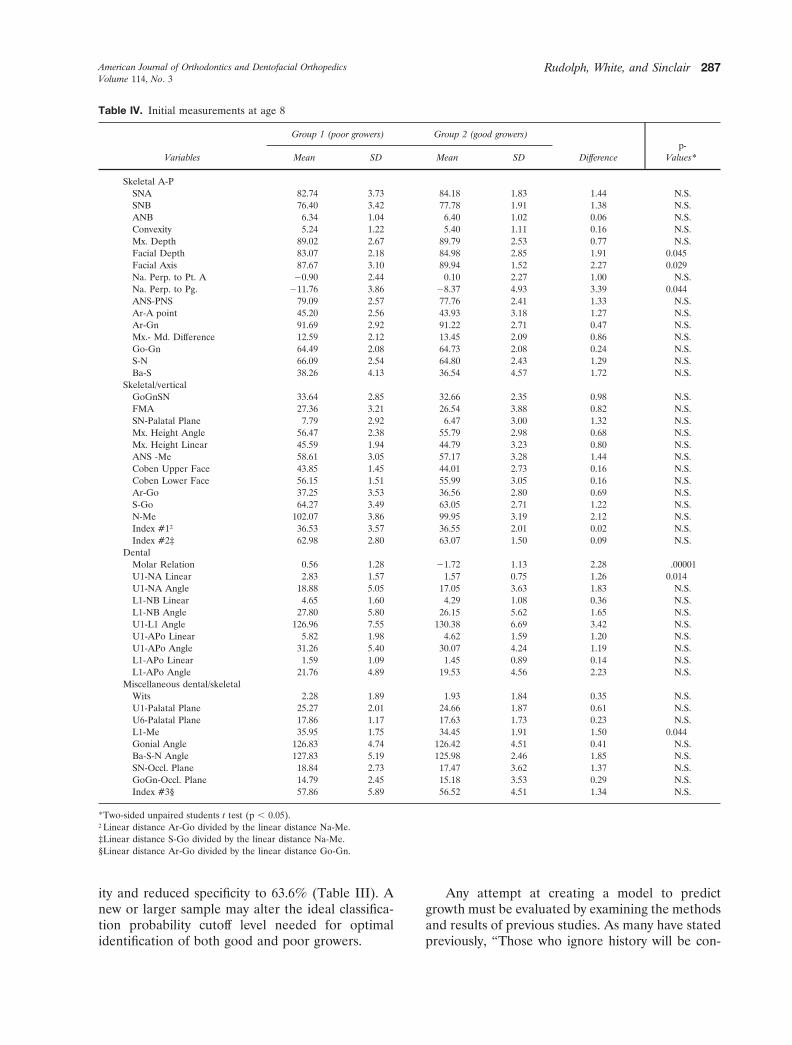
The mean values and standard deviations for allthe measurements of both groups at age 8 are listedin Table IV. From this data it can be seen that bothgroups were very similar with respect to averageinitial ANB and mandibular plane angles. The poorgrowers displayed a slightly more retrognathic man-dible which can be seen by the facial depth, andnasion perpendicular to pogonion measurements.Dentally, the poor growers possessed a more ClassII molar relationship and an upper incisor that wasmore forward in relation to the nasion to A-pointline as compared with the good growers. Interest-ingly, there were no significant differences betweengroups for the skeletal vertical measurements.
The mean values and standard deviations for allthe measurements of both groups at age 18 arelisted in Table V. As expected there were significantdifferences in skeletal anterior-posterior (A-P) mea-surements. Dentally, the final molar relationshipwas more Class I in the good growers with the upperincisors showing less dental compensation whencompared with the poor grower’s very upright rela-tionship of the upper incisors. Interestingly, therewere no significant differences in the skeletal verti-cal measurements between the good and poor grow-ers at age 18 including the mandibular plane angle.Table VI shows the difference in growth betweenthe good and poor growers from age 8 to 18 years.The mean ANB value increased slightly for the poorgrowers (0.016°) where the ANB of the good grow-ers decreased an average of 4.13°. In addition, theconvexity and wits values for the two groups showedhighly significant differences that relate to the im-provement in the A-P jaw discrepancy demonstrated
by the good growers. The skeletal A-P difference ingrowth was primarily the result of more forwardgrowth of the maxilla in the poor growers, with onlya slight difference between groups in the growth ofthe mandible (Ar-Gn). The SNA, maxillary depthand, articulare to A-point measurements were allsignificantly increased in the poor growers.
DISCUSSION
Before initiating treatment on a growing skeletalClass II patient, knowledge of how the future growthpattern will contribute to changing an A-P skeletaldiscrepancy would significantly benefit the clinicianin formulating a treatment plan. These results indi-cate that this is, indeed, possible by combining theprediction equations presented in this article withdata from four (ages 6, 8, 10, and 12) lateralcephalometric head films taken before initiatingtreatment. The 91% accuracy reported in this studyalso suggests that this method may be useful inpredicting growth in the other skeletal classificationsof patients. These equations enable the clinician toadjust both the sensitivity and specificity of theirgrowth predictions by varying the classification cut-off levels. Increasing the sensitivity (ability to iden-tify poor growers) with a resultant slight reduction inspecificity (ability to identify good growers), in ouropinion, optimizes the clinical practicality of theequation. Reducing the number of false-negativeresults in order to allow the practitioner to correctlyidentify poor growers in whom growth modificationwould be absolutely indicated, is clinically morerelevant than positively identifying the good grow-ers. Attempting growth modification techniques on(good growers) patients with false-positive resultswould be less harmful than incorrectly identifyingthe poor growers, and could possibly improve thegood growers final result. Sensitivity was increasedto 95% with the use of a higher probability level forclassification cutoff (i.e., 75% instead of 50%), how-ever, this came at a cost of reduced specificity. Inour sample, choosing 90% as the level for theclassification cutoff did not increase overall sensitiv-
Table II. Results using .75% probability as the classification cutoff level (probability needed to classify patient as a good grower)
Actual
Predicted
Good growers Poor growersPredictive
values
Good growers 9 1 90%Poor growers 2 19 91%
82.2% Specificity 95% Sensitivity
Table III. Effects of classification probability cutoff level(probability needed to classify patient as a good grower) onspecificity, sensitivity and overall predictive value
Classificationlevel Specificity Sensitivity
Overall predictivevalue
.50% 100.0% 85.0% 90.3%
.75% 82.2% 95.0% 90.3%
.90% 63.6% 95.0% 80.6%
American Journal of Orthodontics and Dentofacial OrthopedicsSeptember 1998
286 Rudolph, White, and Sinclair
ity and reduced specificity to 63.6% (Table III). Anew or larger sample may alter the ideal classifica-tion probability cutoff level needed for optimalidentification of both good and poor growers.
Any attempt at creating a model to predictgrowth must be evaluated by examining the methodsand results of previous studies. As many have statedpreviously, “Those who ignore history will be con-
Table IV. Initial measurements at age 8
Variables
Group 1 (poor growers) Group 2 (good growers)
Differencep-
Values*Mean SD Mean SD
Skeletal A-PSNA 82.74 3.73 84.18 1.83 1.44 N.S.SNB 76.40 3.42 77.78 1.91 1.38 N.S.ANB 6.34 1.04 6.40 1.02 0.06 N.S.Convexity 5.24 1.22 5.40 1.11 0.16 N.S.Mx. Depth 89.02 2.67 89.79 2.53 0.77 N.S.Facial Depth 83.07 2.18 84.98 2.85 1.91 0.045Facial Axis 87.67 3.10 89.94 1.52 2.27 0.029Na. Perp. to Pt. A 20.90 2.44 0.10 2.27 1.00 N.S.Na. Perp. to Pg. 211.76 3.86 28.37 4.93 3.39 0.044ANS-PNS 79.09 2.57 77.76 2.41 1.33 N.S.Ar-A point 45.20 2.56 43.93 3.18 1.27 N.S.Ar-Gn 91.69 2.92 91.22 2.71 0.47 N.S.Mx.- Md. Difference 12.59 2.12 13.45 2.09 0.86 N.S.Go-Gn 64.49 2.08 64.73 2.08 0.24 N.S.S-N 66.09 2.54 64.80 2.43 1.29 N.S.Ba-S 38.26 4.13 36.54 4.57 1.72 N.S.
Skeletal/verticalGoGnSN 33.64 2.85 32.66 2.35 0.98 N.S.FMA 27.36 3.21 26.54 3.88 0.82 N.S.SN-Palatal Plane 7.79 2.92 6.47 3.00 1.32 N.S.Mx. Height Angle 56.47 2.38 55.79 2.98 0.68 N.S.Mx. Height Linear 45.59 1.94 44.79 3.23 0.80 N.S.ANS -Me 58.61 3.05 57.17 3.28 1.44 N.S.Coben Upper Face 43.85 1.45 44.01 2.73 0.16 N.S.Coben Lower Face 56.15 1.51 55.99 3.05 0.16 N.S.Ar-Go 37.25 3.53 36.56 2.80 0.69 N.S.S-Go 64.27 3.49 63.05 2.71 1.22 N.S.N-Me 102.07 3.86 99.95 3.19 2.12 N.S.Index #1† 36.53 3.57 36.55 2.01 0.02 N.S.Index #2‡ 62.98 2.80 63.07 1.50 0.09 N.S.
DentalMolar Relation 0.56 1.28 21.72 1.13 2.28 .00001U1-NA Linear 2.83 1.57 1.57 0.75 1.26 0.014U1-NA Angle 18.88 5.05 17.05 3.63 1.83 N.S.L1-NB Linear 4.65 1.60 4.29 1.08 0.36 N.S.L1-NB Angle 27.80 5.80 26.15 5.62 1.65 N.S.U1-L1 Angle 126.96 7.55 130.38 6.69 3.42 N.S.U1-APo Linear 5.82 1.98 4.62 1.59 1.20 N.S.U1-APo Angle 31.26 5.40 30.07 4.24 1.19 N.S.L1-APo Linear 1.59 1.09 1.45 0.89 0.14 N.S.L1-APo Angle 21.76 4.89 19.53 4.56 2.23 N.S.
Miscellaneous dental/skeletalWits 2.28 1.89 1.93 1.84 0.35 N.S.U1-Palatal Plane 25.27 2.01 24.66 1.87 0.61 N.S.U6-Palatal Plane 17.86 1.17 17.63 1.73 0.23 N.S.L1-Me 35.95 1.75 34.45 1.91 1.50 0.044Gonial Angle 126.83 4.74 126.42 4.51 0.41 N.S.Ba-S-N Angle 127.83 5.19 125.98 2.46 1.85 N.S.SN-Occl. Plane 18.84 2.73 17.47 3.62 1.37 N.S.GoGn-Occl. Plane 14.79 2.45 15.18 3.53 0.29 N.S.Index #3§ 57.86 5.89 56.52 4.51 1.34 N.S.
*Two-sided unpaired students t test (p , 0.05).†Linear distance Ar-Go divided by the linear distance Na-Me.‡Linear distance S-Go divided by the linear distance Na-Me.§Linear distance Ar-Go divided by the linear distance Go-Gn.
American Journal of Orthodontics and Dentofacial OrthopedicsVolume 114, No. 3
Rudolph, White, and Sinclair 287

demned to repeat it.” The problem of achieving anaccurate growth prediction is complex and can beaddressed with the use of alternative methods thatdiffer from those of the past. This investigationdiffers from previous attempts because of the meth-ods used and types of patients studied. By focusing
the study on a sample with a specific type of skeletalclassification, using multivariate data in combinationwith a unique prediction equation, and predicting anoverall pattern of growth, this study was able toobtain the favorable results presented.
The prediction equation in this study is unique
Table V. Final measurements at age 18
Variables
Group 1 (poor growers) Group 2 (good growers)
Difference p-Values*Mean SD Mean SD
Skeletal A-PSNA 85.30 3.71 83.72 2.40 1.58 N.S.SNB 78.80 3.40 81.45 2.26 2.65 0.024ANB 6.50 1.19 2.27 0.74 4.23 0.000000001Convexity 5.42 1.94 1.53 1.11 3.89 0.0000001Mx. Depth 90.75 2.99 88.59 1.81 2.16 0.03Facial Depth 85.52 2.67 87.08 1.59 1.56 N.S.Facial Axis 89.14 3.85 91.34 2.44 2.20 N.S.Na. Perp. to Pt. A 0.66 2.97 21.47 1.95 2.13 0.044Na. Perp. to Pg. 29.06 5.64 25.77 3.38 3.29 N.S.ANS-PNS 52.65 3.64 50.44 4.57 2.21 N.S.Ar-A point 92.16 4.31 87.79 4.00 4.37 0.01Ar-Gn 110.96 4.75 110.99 6.28 0.03 N.S.Mx.- Md. Difference 18.80 3.46 23.20 3.52 4.40 0.002Go-Gn 77.83 3.30 77.22 3.71 0.61 N.S.S-N 73.30 3.36 71.17 3.32 2.13 N.S.Ba-S 44.96 3.62 43.29 4.60 1.67 N.S.
Skeletal/verticalGoGnSN 29.96 4.46 29.54 2.69 0.42 N.S.FMA 24.56 4.58 24.68 2.56 0.12 N.S.SN-Palatal Plane 6.65 3.12 5.38 2.87 1.27 N.S.Mx. Height Angle 57.71 3.42 58.11 2.74 0.40 N.S.Mx. Height Linear 53.25 3.55 52.61 2.90 0.64 N.S.ANS -Me 68.09 6.13 65.44 5.04 2.65 N.S.Coben Upper Face 44.07 2.12 44.65 1.65 0.58 N.S.Coben Lower Face 55.93 1.87 55.35 1.59 0.58 N.S.Ar-Go 48.19 3.66 47.27 5.26 0.92 N.S.S-Go 79.85 5.36 78.21 6.38 1.64 N.S.N-Me 119.45 8.11 117.08 6.98 2.37 N.S.Index #1 40.40 2.78 40.29 2.79 0.11 N.S.Index #2 66.94 3.61 66.75 2.56 0.19 N.S.
DentalMolar Relation 20.59 1.43 22.20 0.928 1.61 0.0018U1-NA Linear 2.72 1.41 5.20 1.46 2.48 0.0000891-NA Angle 14.90 5.27 21.60 5.15 6.70 0.002L1-NB Linear 5.74 1.87 4.12 1.47 1.62 0.018L1-NB Angle 28.35 5.77 25.18 2.85 3.17 N.S.U1-L1 Angle 130.22 8.80 130.92 6.98 0.70 N.S.U1-APo Linear 5.50 2.54 5.49 1.84 0.01 N.S.U1-APo Angle 25.80 6.41 24.72 5.65 1.08 N.S.L1-APo Linear 1.59 1.39 1.97 1.33 0.38 N.S.L1-APo Angle 23.96 4.32 24.34 3.05 0.38 N.S.
Miscellaneous dental/skeletalWits 4.56 1.87 21.38 2.73 5.94 0.00000001U1-Palatal Plane 29.44 3.19 28.50 2.30 0.94 N.S.U6-Palatal Plane 23.85 2.02 22.83 2.89 1.02 N.S.L1-Me 42.00 3.49 39.90 3.72 2.10 N.S.Gonial Angle 121.85 5.26 124.48 4.25 2.63 N.S.Ba-S-N Angle 129.49 4.39 128.02 3.04 1.47 N.S.SN-Occl. Plane 14.34 3.85 14.19 4.58 0.15 N.S.GoGn-Occl. Plane 15.61 3.28 15.42 4.94 0.19 N.S.Index #3 61.95 4.43 61.18 5.97 0.77 N.S.
*Two sided unpaired students t test (p , 0.05).
American Journal of Orthodontics and Dentofacial OrthopedicsSeptember 1998
288 Rudolph, White, and Sinclair

and therefore significantly differentiates the meth-ods used in this study from other previous attemptsthat used mathematical models. The equation uses amultivariate statistical analysis approach that en-abled us to simultaneously use data from a person’s
serial lateral cephalometric radiographs in order topredict craniofacial growth. The majority of previ-ous attempts either tried to identify a few keycephalometric indicators,14,34 assumed growth to berelatively constant once a initial pattern was estab-
Table VI. Changes in feature values from age 8 to 18
Variables
Group 1 (poor growers) Group 2 (good growers)
Difference p-Values*
Changes from age 8 to 18 Changes from age 8 to 18
Mean SD Mean SD
Skeletal A-PSNA 12.56 1.71 20.46 2.06 3.02 .0001SNB 12.40 1.95 13.67 2.36 1.27 N.S.ANB 10.16 0.78 24.13 0.92 4.29 .0000000001Convexity 10.18 1.06 23.87 1.19 4.05 .0000001Mx. Depth 11.73 3.35 21.20 2.29 2.93 .015Facial Depth 12.45 3.08 12.10 2.32 0.35 N.S.Facial Axis 11.47 2.72 11.40 2.33 0.07 N.S.Na. Perp. to Pt. A 11.56 3.26 21.57 1.97 3.13 .0018Na. Perp. to Pg. 12.70 5.90 12.66 3.72 0.04 N.S.ANS-PNS 17.45 3.39 16.51 3.60 0.94 N.S.Ar-A point 113.07 3.14 110.03 3.00 3.04 .013Ar-Gn 119.27 5.40 119.77 4.69 0.50 N.S.Mx.- Md. Diff. 16.21 3.32 19.75 2.56 3.54 .0015Go-Gn 113.34 2.78 112.49 2.48 0.85 N.S.S-N 17.21 1.70 16.37 1.60 0.84 N.S.Ba-N 16.70 3.34 16.75 4.02 0.05 N.S.
Skeletal/verticalGoGnSN 23.68 3.81 23.12 2.85 0.56 N.S.FMA 22.80 3.86 21.86 2.82 0.94 N.S.SN-Palatal Plane 21.14 2.15 21.09 2.67 0.05 N.S.Mx. Height Angle 11.24 2.43 12.32 2.32 1.08 N.S.Mx. Height Linear 17.66 6.59 17.82 3.50 0.16 N.S.ANS-Me 19.48 4.29 18.27 3.10 1.21 N.S.Coben Upper Face 10.22 1.55 10.64 1.60 0.42 N.S.Coben Lower Face 20.22 1.66 20.64 2.04 0.42 N.S.Ar-Go 110.94 5.19 110.71 4.74 0.23 N.S.S-Go 115.58 4.59 115.16 5.06 0.42 N.S.N-Me 117.38 6.01 117.13 6.05 0.25 N.S.Index #1 13.87 3.92 13.74 2.87 0.13 N.S.Index #2 13.96 3.26 13.68 2.57 0.28 N.S.
DentalMolar Relation 21.15 1.47 20.48 0.91 0.67 N.S.U1-NA Linear 20.11 1.14 13.63 1.27 3.74 .0000001U1-NA Angle 23.98 2.93 14.55 4.72 8.53 .000001L1-NB Linear 11.09 1.44 20.17 0.86 1.26 .01L1-NB Angle 10.55 3.92 20.97 3.61 1.52 N.S.U1-L1 Angle 13.26 5.00 10.54 4.03 2.72 N.S.U1-APo Linear 20.32 1.79 10.87 1.18 1.19 N.S.U1-APo angle 25.46 3.88 25.35 3.23 0.09 N.S.L1-APo Linear 0.00 1.14 10.52 1.18 0.52 N.S.L1-APo Angle 12.20 3.89 14.81 3.16 2.61 N.S.
Miscellaneous dental/skeletalWits 12.28 1.80 23.31 2.15 5.59 .0000001U1-Palatal Plane 14.17 1.77 13.84 1.60 0.33 N.S.U6-Palatal Plane 15.99 1.76 15.20 3.05 0.79 N.S.L1-Me 16.05 2.85 15.45 1.99 0.60 N.S.Gonial Angle 24.98 3.95 21.94 4.54 3.04 N.S.Ba-S-N Angle 11.66 5.03 12.04 2.57 0.38 N.S.SN-Occl. Plane 24.50 2.21 23.28 4.56 1.22 N.S.GoGn-Occl. Plane 10.82 3.45 10.24 4.00 0.58 N.S.Index #3 14.09 6.61 14.64 5.28 0.55 N.S.
*Two sided unpaired students T-test (p , .05).
American Journal of Orthodontics and Dentofacial OrthopedicsVolume 114, No. 3
Rudolph, White, and Sinclair 289

lished,18,20,35 or used alternative mathematical equa-tions in combination with lateral headfilms.17,23
Predicting a pattern of growth, whether favor-able or unfavorable, and not attempting to forecastspecific final hard tissue landmark locations is an-other important element of this study that differen-tiates these methods and results from those ofprevious investigators.14,17-19,22,23,35 The goal of thisstudy was to answer the question “Will a particularClass II patient experience favorable or unfavorablegrowth?” as defined by the inclusion criteria pre-sented. In this study there are only two possibleoutcomes that are being identified. This significantlydiffers from the majority of previous attempts thattried to predict final incremental amounts and di-rections of growth of specific craniofacial hard tissuelandmarks. One can correctly argue that this predic-tion method does not provide the clinician withmaxillary or mandibular incremental growthamounts or directions. However, the predictionequation presented can assist the practitioner inanswering the question, “Should growth modifica-tion be initiated to assist in reducing a skeletal A-Pdiscrepancy?” If the prediction equation indicatesthe patient will have an unfavorable growth pattern,then the clinician must decide the skeletal compo-nent, maxilla or mandible, on which one wouldchoose to attempt growth modification.
The selection of a specific type of skeletal clas-sification of patient is another important consider-ation when comparing these results to those pre-sented previously. In the examination of therelationship of craniofacial components and futurepatterns of growth, it seems rational to study thegrowth process on a homogenous subpopulation,such as skeletal Class II preadolescents. An investi-gator cannot derive anything more than very generalconclusions from a mixed sample with all skeletalclassifications present. As Proffit and Fields26 states“Ideally, separate growth standards would be estab-lished for each of the major categories (such aspatients with skeletal Class I, Class II, or Class IIImalocclusions).” If a clinically useful growth predic-tion is to evolve, it is probable that it will result fromthe study of like subjects and an inspection of theinterrelationships of their growth variables.
Comparison of the two groups at age 8 yearsshowed that molar relationship was the only initialmeasurement that possessed a highly significant(, 0.01) p value (Table IV). The Good Growerstended to have a more class I molar relationship asevidenced by the -1.72 mm value at age 8 yearscompared with the 10.56 mm molar relationship
value for the poor growers at age 8 years. Two of 11good growers possessed positive molar relationshipvalues, and 8 of 20 poor growers possessed negativemolar relationship values, which reveals that molarrelation alone could not be used to accuratelydifferentiate between potential good and poor grow-ers. It does, however, suggest that having a betterthan end-on molar relationship will improve theprobability of experiencing a favorable pattern ofgrowth. Overall, the data indicate that there aremany pieces to the biologic puzzle that contribute tothe final answer to the question, “Will this patientgrow well or not?” Results of this study agree withprevious investigators as to the lack of one or severalsignificant indicators that alone can be used toaccurately predict how a patient will grow in thefuture.16,22,23
The most surprising A-P growth difference ob-served (Table VI) between the two groups in thisstudy can be found in the following three measure-ments; Ar-A point, Ar-Gn, and the SNA angle. Thepoor growers had more maxillary growth in the A-Pdimension in comparison to the good growers; thiswas the primary contributor to the minimal lack ofimprovement in their A-P skeletal discrepancy. Thegood growers did not experience the anticipatedfavorable growth of the mandible in either amountor direction (Ar-Gn, Facial Axis, GoGnSN) com-pared with the poor growers. The good growersexperienced a slight reduction in the SNA angle thatmay be due to either the less upright angulation ofthe upper incisors causing a slight posterior move-ment of A-Point or to a slight amount of A-P growthat nasion.
One must consider the large number of signifi-cant items tested in this study. The larger thenumber of significant test items, the more likely thata type I error could occur in which a positivesignificant item may have occurred by chance.1
Another limitation of this study is that the samesample was used to generate the feature means andcovariances as was used to test the equations. Fur-thermore, the sample studied was small. A lowsample size with a large number of features maylimit the accuracy of the prediction equation. A ruleof thumb is that the sample size should be 10 timesgreater than the number of features. Possibly pool-ing untreated skeletal Class II data from multiplegrowth centers could generate the new and largersample sizes needed to properly test the predictionequations. The use of a sex-specific sample may alsobe indicated to reduce variability that occurs whenboth males and females are combined in a data set.
American Journal of Orthodontics and Dentofacial OrthopedicsSeptember 1998
290 Rudolph, White, and Sinclair

The use of a younger final headfilm would allow theclinician to obtain the prediction results at an ageearlier than 12 years, allowing more time to takeadvantage of growth modification techniques. Fi-nally, this prediction technique could possibly beenhanced with the addition of parental cephalomet-ric24 and genetic data.36
The results from this study indicate that a reli-able growth prediction method might be clinicallyavailable in the near future.
CONCLUSIONS
1. The multivariate growth prediction equations pre-sented can be used to successfully predict patternsof growth in skeletal Class II patients.
2. These equations enable the clinician to adjust boththe sensitivity (ability to identify Poor Growers)and specificity (ability to identify Good Growers)of the growth prediction.
3. Given these successful results these predictionequations should be validated on a larger sex-specific sample using fewer pretreatment lateralcephalometric head films.
We would like to acknowledge Dr. Son Cao, Dr. HollyMoon, and Dr. Will Chen for their assistance.
REFERENCES
1. Bjork A. The significance of growth changes in facial pattern and their relationshipto changes in occlusion. Dent Record 1951;71:197-208.
2. Downs WB. Variation in facial relationships: their significance in treatmentandprognosis. Am J Orthod 1948;34:812-40.
3. Burstone CJ. Process of maturation and growth prediction. Am J Orthod 1963;49:907-19.
4. Houston WB. The current status of facial growth prediction: a review. Br J Orthod1979;6:11-7.
5. Ricketts RM. Planning treatment on the basis of the facial pattern and a estimateof its growth. Angle Orthod 1957;27:14-37.
6. Hirschfeld WJ, Moyers RE. Prediction of craniofacial growth: the state of the art.Am J Orthod 1971;60:435-44.
7. Hixon EH. Cephalometrics: a perspective. Angle Orthod 1972;42:200-11.
8. Brodie AG, Downs WB, Goldstein A, Myer E. Cephalometric appraisal oforthodontic results: a preliminary report. Angle Orthod 1938;8:261-5.
9. Brodie AG. On the growth pattern of the human head from the 3rd month to theeighth year of life. Am J Anat 1941;68:209-62.
10. Brodie AG. Facial patterns. Angle Orthod 1946;16:75-87.11. Bjork A. Variations in the growth of the human mandible: longitudinal
radiographic study by the implant method. J Dent Res 1963;42:400-11.12. Coben SE. The integration of facial skeletal variants. Am J Orthod 1955;49:97-119.13. Nanda RS. The rates of growth of several facial components measured from serial
cephalometric roentgenograms. Am J Orthod 1955;41:658-73.14. Tweed CH. The Frankfort mandibular plane angle in orthodontic diagnosis,
classification, treatment planning, and prognosis. Am J Orthod 1946;32:175-230.15. Ricketts RM. Cephalometric analysis and synthesis. Angle Orthod 196;31:141-56.16. Horowitz SL, Hixon EH. The nature of orthodontic diagnosis. St. Louis: Mosby Co;
1966. p. 303-24.17. Moorrees CFA, Lebret L. The mesh diagram and cephalometrics. Angle Orthod
1962;32:214-31.18. Johnston LE. A simplified approach to prediction. Am J Orthod 1975;67:252-7.19. Ricketts RM. A principle of arcial growth of the mandible. Angle Orthod
1972;42:368-85.20. Popovich F, Thompson GW: Craniofacial templates for orthodontic case analysis.
Am J Orthod 1977;71:406-20.21. Bhatia S, Wright G, Leighton B. A proposed multivariate model for prediction of
facial growth. Am J Orthod 1979;75:264-81.22. Johnston LE. A statistical evaluation of cephalometric prediction. Angle Orthod
1968;38:284-304.23. Todd JT, Leonard M. Issues related to the prediction of craniofacial growth. Am J
Orthod 1981;75:63-80.24. Suzuki A, Takahama Y. Parental data used to predict growth of craniofacial form.
Am J Orthod Dentofacial Orthop 1991;99:107-21.25. DeVries SO. A cephalometric study of craniofacial growth prediction of Class
II, Division I females. Ann Arbor: University of Michigan School of Dentistry;1966. p. 91-2.
26. Proffit WR, Fields W. Contemporary Orthodontics. St. Louis: Mosby–Year Book;1993. p. 249.
27. Ricketts RM. Perspectives in the clinical application of cephalometrics. AngleOrthod 1981;51:115-50.
28. McNamara JA Jr, Bruden WL. Orthodontic and orthopedic treatment in the mixeddentition. Ann Arbor: Needham; 1993. p. 13-38.
29. Jacobsen A. The “Wits” appraisal of jaw disharmony, Am J Orthod 1975;67:125-38.30. Steiner CC. The use of cephalometrics as an aid to planning and assessing
orthodontic treatment. Am J Orthod 1960;46:721-35.31. Dahlberg G. Statistical methods for medical and biological students. London:
George and Allen Unwind; 1940.32. Baumrind S, Frantz RC. The reliability of head film measurements: 2. Conven-
tional angular and linear measures. Am J Orthod 1971;60:505-17.33. Gravely JF, Benzies PM. The clinical significance of error in cephalometry. Br J
Orthod 1974;1:95-101.34. Ricketts RM. Foundations for cephalometric communication. Am J Orthod
1969;46:330-57.35. Hixon EH. Prediction of facial growth. Trans Eur Orthod Soc 1968. p. 127-39.36. Devor EJ. Transmission of human craniofacial dimensions. J Cranio Genet Dev
Biol 1987;7:95-106.
American Journal of Orthodontics and Dentofacial OrthopedicsVolume 114, No. 3
Rudolph, White, and Sinclair 291