Embed Size (px)
Citation preview
Multivariate Reduction in Wireless Sensor Networks
Orlando Silva Junior', Andre L. L. Aquino", Raquel A. F. Mini l , Carlos M. S. Figueiredo:'
1 Department of Computer Science - Pontifical Catholic University of Minas GeraisBelo Horizonte, MG, Brazil
2 Department of Computer Science - Federal University of Ouro PretoOuro Preto, MG, Brazil
3 FUCAPI - Research and Technological Innovation CenterManaus, AM, Brazil
Email: [email protected]@iceb.ufop.br ,[email protected],[email protected]
Abstract
In wireless sensor networks, energy consumption is generally associated with the amount ofsent data once communication is the activity of the network that consumes moreenergy. This work proposes an algorithm based on "Principal Component Analysis" to perform multivariate data reduction. It is considered air quality monitoring scenario ascase study. The results show that, using the proposed technique, we can reduce the data sent preserving its representativeness. Moreover, we show that the energy consumptionand delay are reduced proportionally to the amount of reduced data.
1 Introduction
A wireless sensor network (WSN) [1,3] is a special kindof ad-hoc network with capacity to collect, process and senddata to extern observers. The WSN s has some restrictions,such as energy and bandwidth. Thus, to send large amountof data can be problematic, causing excessive delay and diminishing the network lifetime. Due to these restrictions, itis necessary to adopt strategies to reduce the amount of datathat are transmitted in the network.
Considering the phenomena characteristics, it is important to distinguish the sensor data as univariate or multivariate. Univariate data represents a sample of same phenomena variable. Therefore, multivariate data represents samples of different phenomena variables. These samples areoriginated from: different sensors of a specific node; or the
978-1-4244-4671-1/09/$25.00 ©2009 IEEE
same sensor of different nodes.
A usual technique to process multivariate data is thePrincipal Component Analysis (PCA) [5]. Thus, this workproposes an algorithm for multivariate data reduction inWSN s and it uses air quality monitoring scenario as casestudy. The technique uses PCA to classify data, so that onlythe most relevant samples are propagated to the sink. Inaddition, through the reduction, it is possible to diminishthe energy consumption and the delay in the network, sincecommunication is the task that consumes more energy.
Some related works consider univariate data reductionand they use techniques such as data aggregation [10], adaptive sampling [7], or sensor stream reduction [2]. Considering multivariate data reduction, there are some proposals that consider discrete wavelet transformation, hierarchical clustering, sampling and singular value decompositiontechniques [8]. Specifically, the reduction based on PCA,we can find some contributions that apply PCA with prediction to improve the reduction [6]. Meanwhile, to providethe reduction in WSNs, it is necessary to evaluate some parameters in more details, such as the reduced data quality,energy consumption and delay. Differently of cited works,all of these aspects are focused and evaluated in this paper.
This paper is organized as follow. Section 2, we discussthe problem of multivariate reduction in WSNs. The proposed solution is presented in Section 3. The evaluation ofthe reduced data representativeness is shown in Section 4and the network behavior is presented in Section 5. Finally,Section 6 presents the conclusions and future directions ofthis work.
726
2 Problem Definition
The multivariate reduction problem in WSNs can bestated as follows: "Considering an application for air quality monitoring generating multivariate data, is it possibleto use a WSN infrastructure which reduces data based onPCA maintaining the data representativeness and reducingenergy consumption and delay on the network?"
To address this problem, the scope of this work considerthe following assumptions:
• Sensing moment reduction: The application needs toreduce the data only in sensing moment. In this case,there are sensors array devices which collect, simultaneously, different organic compounds. Such device,considered as sensor node, can reduce the multivariatedata after different environment samplings, avoidingunnecessary data traffic on the network.
• Maximum reduction supported: In this case, weneed to identify what is the maximum level of reduction supported in the air quality monitoring applicationwhere the data representativeness is not compromised.To identify the maximum reduction, we set empiricallyvalues for the reduction in n /2 and log n, where n isthe number of data collected by each sensor. It is important to emphasize that when considering other applications different values should be evaluated.
• Data representativeness: Each application has itsown requirements for quality, and so, for each application, different evaluation metrics can be employed.Considering application for the monitoring of air quality, we used hypotheses test and relative absolute error [4] since such test is suitable for this application.
Specifically, to data representativeness was used the hypothesis test Analysis of Variance (ANOVA), calculatedthrough statistical program R 1. The calculation is given byF == D~/D'tv, where D~ represents spread between setsand D'tv the spread within the joints. Based on this calculation, the p-value is used to determine if the null hypothesisH a must be accepted or rejected. In this case, to accept thenull hypothesis indicates that there is no significant difference between the variances of the two sets. By convention,tP will be used to indicate the use of this test.
The absolute relative error considers a comparison between the averages of original and reduced data. This erroris given by Y == lOOMax{I(X - y)/XI}, where X andYare the average of the original values and the reduced values, respectively. The Y -error is calculated for each sensorand only the highest of them, situation where the techniqueis the worst, will be used.
1The R Project for Statistical Computing - http://www.r-project.org/
978-1-4244-4671-1/09/$25.00 ©2009 IEEE
3 Multivariate Reduction
This section presents the PCA-based algorithm used toreduce multivariate data in air quality monitoring applications. The main goal is generating a new data collectionkeeping the original data set characteristics with minimalloss of information.
In our sample algorithm, initially, a data classificationis made based on the first principal component obtainedthrough PCA. This classification groups the data considering the biggest, smallest, and intermediate values of the firstprincipal component. Our sample algorithm uses only thebiggest values classified because the pollution levels identified in air monitoring applications, generally, consider thecomponents positively different to identify anomalous behaviors that indicate a higher pollutants concentration.
In order to illustrate multivariate generated data in thisapplication, consider the matrix X:: the input data, wheren > 0 represents the values monitored by each sensor andm 2:: 1 represents the sensors responsible for obtaining environmental information. Thus, to reduce X, it is possibleto consider three steps. The original set of sensory data Xis used to calculate the principal components C in step 1. Instep 2, first component C1 is selected and sorted. The positions of biggest values in C1 , representing data positivelydifferent from X are used to determine positions of the linesin X that will compose the reduced data Y. Reduced dataset Y containing the lines of X more representative for theapplication is obtained in step 3.
The pseudo-code is shown in Algorithm 1. In line 1,we have the calculation of the principal components. Thecomplexity order of PCA calculation can be estimated ino(m 2m ' +m2 n ), where m refers to original data dimension(number of sensors), m' is the reduced data dimension andn is the amount of generated data. According to [9], if m >m' and m > n, the complexity order can be estimated inO(m2
) . As in this case m == m' and m < n, we haveO(m2n).
Algorithm 1 Multivariate reductionRequire: X - input data, r - reduction sizeEnsure: Y - reduced data
1: 0 +- calculatePca(X)2: I +- sort(Ol) /* 01 is the first component of 0 */3: I +- sort(I, r) /* I are the more relevant values of 01 */4: for i +- 1 to r do5: Yi +- x.;6: end for
In line 2, first component C1 is sorted, where the indexI of the more relevant values are obtained. Its complexityorder is 0 (n log n), since IC11 == n. Line 3 has the sort ofvector I, considering only the r first index, to maintain thearrival order of the items chosen for Y. Complexity order
727
of sort is O(r logr). Lines 4 - 6 built the reduced outputdata, whose complexity order is O(r) . Relative absolute error
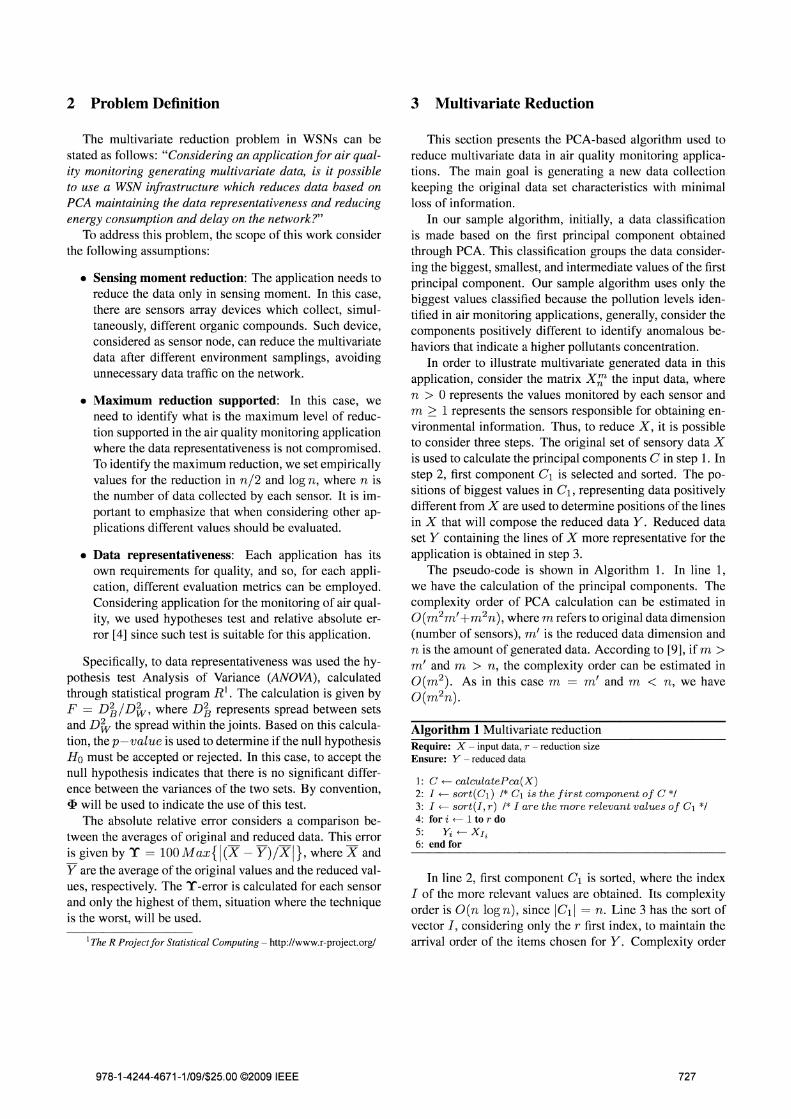
Figure 1. T -error with reduction in sensing
data also reduces the energy consumption. The network behavior study shows the benefits of reducing the amount ofdata in terms of energy consumption and delay to deliverdata to sink. It is important to emphasize that in the simulations we evaluated only the criteria identified as relevant toinvestigate the network behavior.
Regarding the simulation, the network behavior evaluation is performed through the Network Simulator 2 version2.33. The simulation was executed with 33 random topologies and the results are presented with symmetrical asymptotic confidence interval of 95%.
Considering the network topology, we used a flat network that uses a routing algorithm based on tree of smallerway and all nodes have the same hardware configuration.The trees are built only once before the traffic begins, andthe source nodes are randomly distributed in the air qualitysensory region.
The network size varies with density and is obtainedthrough nett = J7f a~ ISI /8, 4791, where ar is the radiorange and S the sensors number. The size of the queue supported by each node varies with the amount of sensory data.The time for simulation is 1100s and the rates of traffic of500s and 600s. The radio range is 50m, the bandwidth is250 Kbps and the initial energy is 1001.
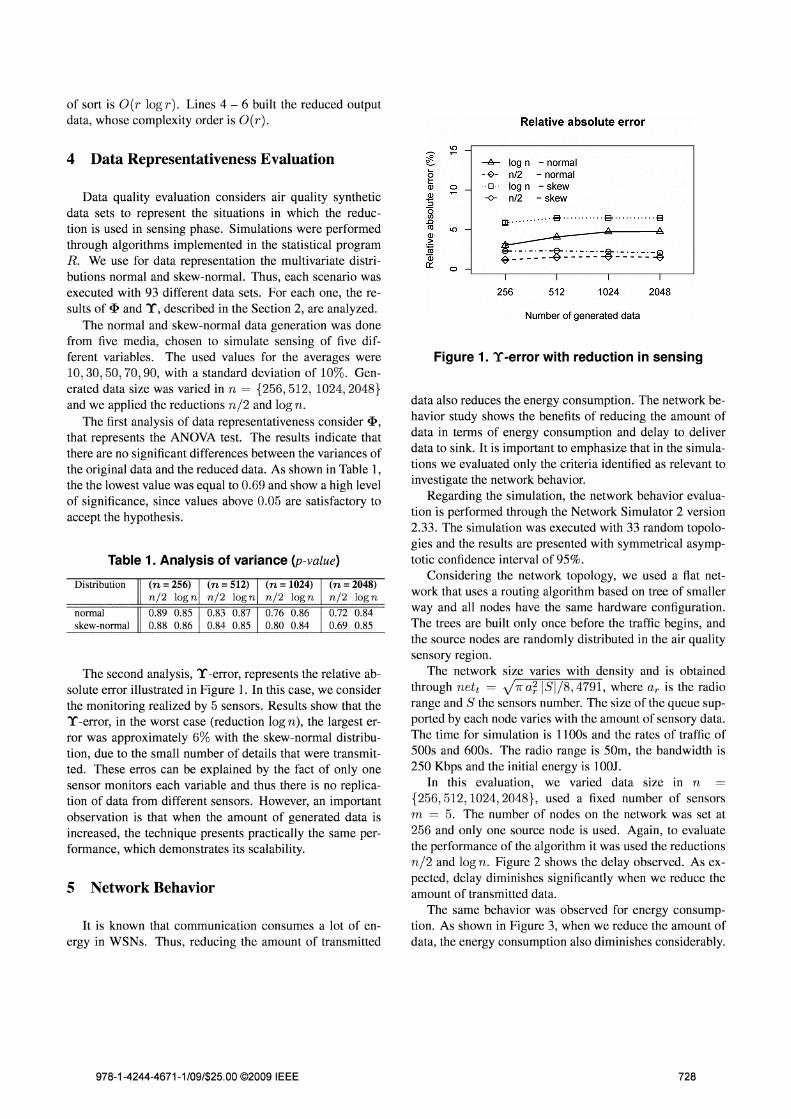
In this evaluation, we varied data size in n{256, 512,1024, 2048}, used a fixed number of sensorsm = 5. The number of nodes on the network was set at256 and only one source node is used. Again, to evaluatethe performance of the algorithm it was used the reductionsn /2 and log n. Figure 2 shows the delay observed. As expected, delay diminishes significantly when we reduce theamount of transmitted data.
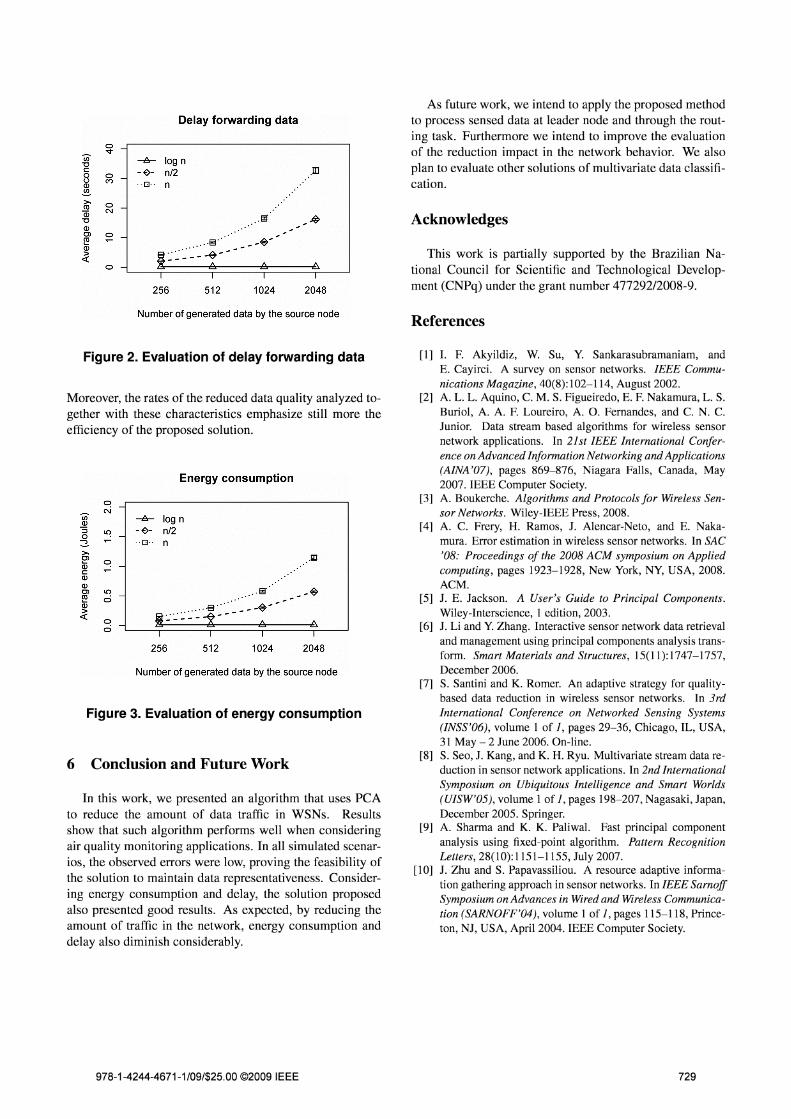
The same behavior was observed for energy consumption. As shown in Figure 3, when we reduce the amount ofdata, the energy consumption also diminishes considerably.
20481024512
Number of generated data
~._ ._ ._._~ ._ ._ ._ .-Q~-----~-----~-----~
m··.... ·· ·..e ··.. .. ·.. ..a ···.. ···.. ·B
A A
256
--A-- log n - normal- ~- n/2 - normal.. [3. . log n - skew. -0- n/2 - skew
o
Distribut ion (n = 256) (n - 512) (n-1024) (n= 2048)n /2 logn n /2 logn n /2 log n n /2 logn
normal 0.89 0.85 0.83 0.87 0.76 0.86 0.72 0.84skew-normal 0.88 0.86 0.84 0.85 0.80 0.84 0.69 0.85
It is known that communication consumes a lot of energy in WSNs . Thus, reducing the amount of transmitted
The second analysis, T -error, represents the relative absolute error illustrated in Figure 1. In this case, we considerthe monitoring realized by 5 sensors. Results show that theT -error, in the worst case (reduction log n), the largest error was approximately 6% with the skew-normal distribution, due to the small number of details that were transmitted. These erros can be explained by the fact of only onesensor monitors each variable and thus there is no replication of data from different sensors. However, an importantobservation is that when the amount of generated data isincreased, the technique presents practically the same performance, which demonstrates its scalability.
Table 1. Analysis of variance (p-value)
Data quality evaluation considers air quality syntheticdata sets to represent the situations in which the reduction is used in sensing phase. Simulations were performedthrough algorithms implemented in the statistical programR. We use for data representation the multivariate distributions normal and skew-normal. Thus, each scenario wasexecuted with 93 different data sets. For each one, the results of <I> and T, described in the Section 2, are analyzed .
The normal and skew-normal data generation was donefrom five media, chosen to simulate sensing of five different variables. The used values for the averages were10,30,50,70,90, with a standard deviation of 10%. Generated data size was varied in n = {256 ,512, 1024,2048}and we applied the reductions n /2 and log n .
The first analysis of data representativeness consider <I>,that represents the ANOYA test. The results indicate thatthere are no significant differences between the variances ofthe original data and the reduced data. As shown in Table 1,the the lowest value was equal to 0.69 and show a high levelof significance, since values above 0.05 are satisfactory toaccept the hypothesis.
5 Network Behavior
4 Data Representativeness Evaluation
978-1-4244-4671-1/09/$25.00 ©2009 IEEE 728
Delay forwarding data
0 -
"""(j) -A- log n"C<:
-~- n/2 m0 0 -U M<ll · ·0· · n
.!!?.>- 0ell -Qj N
"C . 00" , ~<llCl 0 -~ . . . . . . . .8 · ~'<ll -'
~~ .... - - ~,-
8 8-0 - - - - 8
I I I I
256 512 1024 2048
As future work , we intend to apply the proposed meth odto process sensed data at leader node and through the routing task. Furthermore we intend to improve the evaluat ionof the reduc tion impac t in the network behavior. We alsoplan to evaluate other solutions of mu ltivar iate data classifica tion.
Acknowledges
Th is work is partiall y supported by the Brazilian National Cou ncil for Scientific and Techn ological Development (CNPq) und er the grant number 477292/2008-9.
Number of generated data by the source node References
Number of generated data by the source node
Energy consumption
Figure 2. Evaluation of delay forwarding data
Figure 3. Evaluation of energy consumption
[I] 1. F. Akyildiz, W. Su, Y. Sankarasubramaniam, andE. Cayirci. A survey on sensor networks. IEEE Communications Magazine, 40(8):102-114, August 2002.
[2] A. L. L. Aquino, C. M. S. Figueiredo, E. F. Nakamura, L. S.Buriol, A. A. F. Loureiro, A. O. Fernandes, and C. N. C.Junior. Data stream based algorithms for wireless sensornetwork applications. In 21st IEEE International Conference on Advanced Information Networking and Applications(AlNA '07), pages 869-876, Niagara Falls, Canada, May2007 . IEEE Computer Society.
[3] A. Boukerche. Algorithms and Protocols f or Wireless Sensor Networks. Wiley-IEEE Press, 2008.
[4] A. C. Frery, H. Ramos, J. Alencar-Neto, and E. Nakamura. Error estimation in wireless sensor networks. In SAC'08: Proceedings of the 2008 ACM symposium on Appliedcomputing, pages 1923-1928, New York, NY, USA, 2008.ACM.
[5] J. E. Jackson. A User's Guide to Principal Components.Wiley-Interscience, 1 edition, 2003 .
[6] J. Li and Y. Zhang. Interactive sensor network data retrievaland management using principal components analysis transform. Smart Materials and Structures, 15(11 ):1747-1757,December 2006.
[7] S. Santini and K. Romer. An adaptive strategy for qualitybased data reduction in wireless sensor networks. In 3rdInternational Conference on Networked Sensing Systems(INSS'06), volume I of 1, pages 29-36, Chicago, IL, USA,31 May - 2 June 2006. On-line.
[8] S. Seo, J. Kang, and K. H. Ryu. Multivariate stream data reduction in sensor network applications. In 2nd InternationalSymposium on Ubiquitous Intelligence and Smart Worlds(UISW'05) , volume I of 1, pages 198-207, Nagasaki, Japan,December 2005. Springer.
[9] A. Sharma and K. K. Paliwal. Fast principal componentanalysis using fixed-point algorithm. Pattern RecognitionLetters, 28(10):1151-1 155, July 2007 .
[10] J. Zhu and S. Papavassiliou. A resource adaptive information gathering approach in sensor networks. In IEEE SarnoffSymposium on Advances in Wired and Wireless Communication (SARNOFF'04), volume I of 1, pages 115-11 8, Princeton, NJ, USA, April 2004 . IEEE Computer Society.
.111
I
20481024512
I I I
. , ~
. . . . .g - - -~ ,-
1 ~· :.: :.: :..-1--- 8
256
-A- log n-~- n/2· · 0·· n
0
(j)N
<ll:;
~0:2>-e' ~<ll<:<ll<llCl '"~ 0<ll>«
~0
In this work, we presented an algorithm that uses PCAto reduce the amount of data traffic in WSNs. Resultsshow that such algorithm per forms we ll when co nsideringair qual ity mon itor ing applications . In all simulated sce narios, the observed errors were low, proving the feas ibi lity ofthe solution to maintain data representative ness. Considering energy co nsumption and delay, the solution proposedalso presented good results. As expec ted, by reduci ng theamo unt of traffic in the network, energy consumption anddelay also diminish co nsiderably.
6 Conclusion and Future Work
Moreover, the rates of the reduce d data quality ana lyzed together with these characteris tics em phasize still more theefficiency of the prop osed so lution.
978-1-4244-4671-1/09/$25.00 ©2009 IEEE 729