Embed Size (px)
Citation preview

MPRAMunich Personal RePEc Archive
Dynamics of market share in themicrofinance industry in Bangladesh
Chowdhury Shameem Mahmoud and M. A. Baqui Khalily
and Syed Naimul Wadood
The Center for World Food Studies (SOW-VU), the Netherlands,Institute of Microfinance (InM), Dhaka, Bangladesh, Department ofEconomics, University of Dhaka, Dhaka , Bangladesh
10. July 2009
Online at http://mpra.ub.uni-muenchen.de/16172/MPRA Paper No. 16172, posted 12. July 2009 16:06 UTC

DYNAMICS OF MARKET SHARE IN THE MICROFINANCE INDUSTRY IN BANGLADESH Chowdhury Shameem Mahmoud1, M. A. Baqui Khalily2 and Syed Naimul Wadood3 Abstract We discuss evidence that the microcredit industry in Bangladesh has seen emergence of large variations in the size of the microfinance institutions operating in the market-- on the one hand, there are large national-level MFIs, while on the other hand, small localized MFIs operating only within the confines of a small area. Data from a recent survey of Pathrail union in Tangail district, a seasoned place for microcredit, reveals that within the local market competition is becoming more and more intense over time between established national-level MFIs and newly emerging local-level MFIs for market shares in terms of loan amount as well as borrowed members. Data reveals that there is market segmentation where some borrowers and MFIs opt for a package of low interest rates tied with low amount of loan disbursed and some other borrowers and MFIs settle for a package of high interest rates tied with high amount of loan disbursed. A Tobit regression estimation of member market shares in village micro credit market shows that size of the MFI, years of operation in the village, average loan size, deposit interest rates, loan amount disbursed for unique loan purposes (i.e., housing loan) are key determinants in determining MFI shares of a village microcredit market.
Key Words: Microcredit, Market Share, Product and Provider Characteristics of Microcredit
JEL Classification:
Draft Version: July 2009
Section 1: Introduction
In the industrial organization (IO) literature “market share” is a structure parameter. In parlance of IO, market structure indicators are important as these determine and define the scope for the firms to set their strategies, i.e. their conducts; upon which depends performance of a market structure, i.e. benefits or losses to the society emanating from such strategies. From society’s point of view what is of paramount importance is the existence of competition; as only in a perfectly competitive market structure an industry produces the socially optimal output. Possibility of competitive behavior among firms in turn depends on the lack of market power pertaining to any individual or a handful of firms operating within the industry. To be in an enviable position to command market power a firm or a handful of them must dominate the industry in terms of their shares in market output. Firms can exert market power also if they operate in a product differentiated segmented market. This is why studies of market share has had received much attention from the economists and had been subjected to studies for different industries (see Carlton and Perloff (2000)).
Microfinance industry has experienced considerable growth in the last three decades in different countries of the world. Although initially invented as a poverty alleviation tool by Mohammad Yunus in Bangladesh, in the last two decades in some parts of the world
1 Post Doctoral Fellow, The Center for World Food Studies (SOW-VU), the Netherlands 2 Executive Director, Institute of Microfinance (InM), Dhaka, Bangladesh 3 Assistant Professor, Department of Economics, University of Dhaka, Dhaka 1000, Bangladesh and Corresponding Author: Phone: +088-02-7113123, Email: [email protected]
1
microfinance has been carried as a pure profit-oriented business (see Roodman and Qureshi (2006)). Consequently, in addition to receiving funds from social investors (e.g. International Finance Corporation among others) -- microfinance industry has enjoyed access to private capital flow which has been primarily injected as investments to gain profit from this entire enterprise. Influx of capital from both private and public sources has led to increased competition among firms working in this industry.
Cross country experiences of development paths of microfinance industries are varied. Competition in the Latin American countries has taken a form where huge private capital has been attracted and injected into the microfinance firms. For example, in April 2007, Banco Compartamos of Mexico successfully offered Initial Public Offering (IPO) in which they sold 30 percent of the bank’s share with a over subscription of 13 times (Cull, Kunt and Morduch (2009)). However, the reason its shares were rendered attractive in the first place was because it proved its activities to be satisfactorily profitable. It charges astronomical figures for interest rates to its micro borrowers, for example, at the time of the IPO offer, the borrowers were being charged interest rates as high as 94 percent per year of loans (inclusive of 15 percent value added tax). The Banco Compartamos is now successfully competing with other commercial banks to attract private equity. Supporters of Banco Comparatamos version of microfinance opine that this industry can and should compete with mainstream commercial banks, competing for billions of dollars on global capital markets (op. cit.).
This type of microfinance banking in Latin America is diametrically opposite to what would be approved of by the microcredit pioneer Muhammad Yunus and his Grameen Bank in Bangladesh in the South Asia region (see Yunus (2007)). In Bangladesh competition in this industry has taken a shape where the microfinance institutions are largely in competition within themselves and not with banks or other financial institutions in attracting borrowers. The industry has enjoyed good influx of capital but from social investors, donor countries and the government only. In Bangladesh the dominant thinking is to view microfinance as a socially responsible business with an aim to alleviate poverty. That is why interest rates charged by different microfinance firms, albeit higher than commercial banks, is kept within a range not exceeding a level one third of that of the Banco Compartamos, for example. These two examples from two different regions of the world are representative of divergent paths being followed by microfinance institutions across the globe.
Even if we keep our focus within the kind of competition that is observed in Bangladesh, different ramifications are possible. For example, one possibility is that a handful of large microfinance institutions may consolidate themselves in the industry by driving out small ones. A second possibility is that in major areas both national level large and local level small microfinance firms may operate side by side where no single firm could maintain any considerable share of the market. Yet another possibility is that large NGOs aim at the poorest of the households while the localized and relatively small NGOs cater for a segmented market where they serve the most productive households only. We can think of few others. It is not obvious if any of them deserves unqualified approval.
Whether a specific form of competition should raise concerns for the industry and the society as a whole will depend not only on the nature of competition but also on the specific strategies pursued by the microfinance firms that led to a given market structure.4 In the current study we want to look into the driving forces that propelled the changes in market shares in the
4 Although perfect competition is a preferable market structure it is not unambiguously beneficial for all situations; any divergence, e.g., between social cost and marginal cost renders oucome sub-optimal.
2
microfinance industry in Bangladesh; this in turn facilitates our understanding as to whether the development we observe in Bangladesh microfinance industry is ominous or wholesome.
The organization of the paper is as follows. Section 2 sets the background and motivation, whilst Section 3 specifies the research question and Section 4 is an overview of relevant literature. Section 5 analyzes the data. Section 6 sets an econometric model and discusses estimations from the econometric exercise. Section 7 concludes the paper.
Section 2: Background and Motivation
Section 2.1: National-level Information from MRA
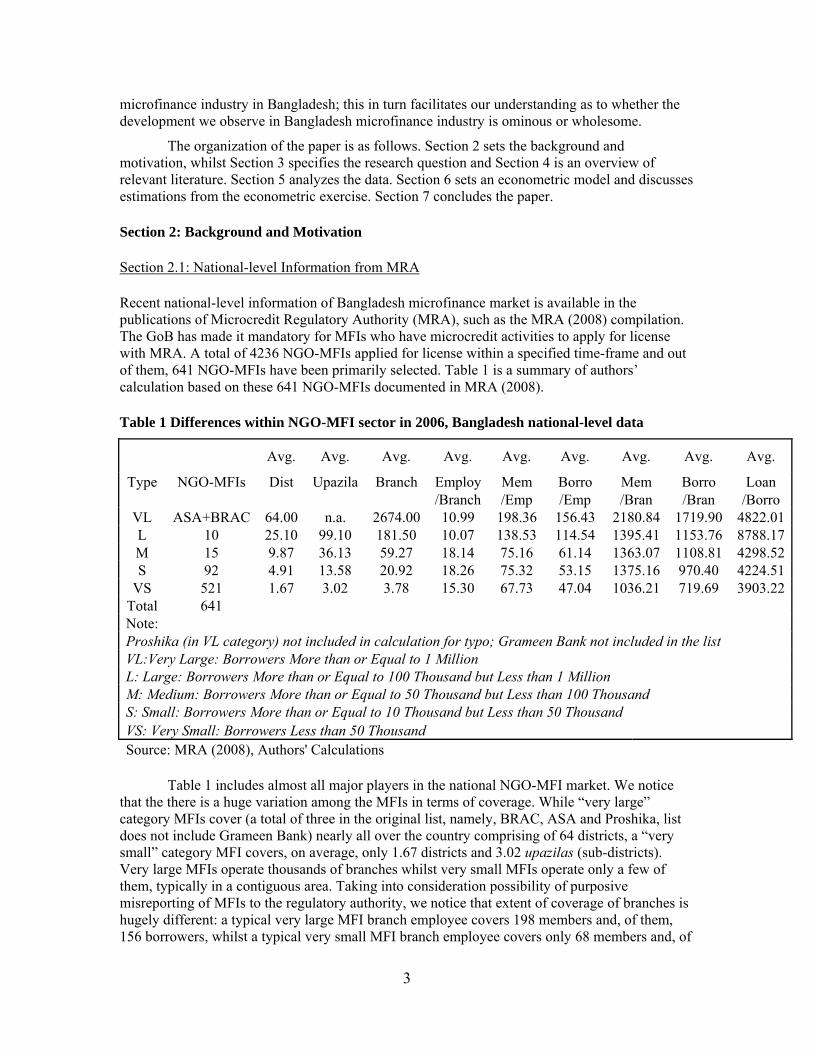
Recent national-level information of Bangladesh microfinance market is available in the publications of Microcredit Regulatory Authority (MRA), such as the MRA (2008) compilation. The GoB has made it mandatory for MFIs who have microcredit activities to apply for license with MRA. A total of 4236 NGO-MFIs applied for license within a specified time-frame and out of them, 641 NGO-MFIs have been primarily selected. Table 1 is a summary of authors’ calculation based on these 641 NGO-MFIs documented in MRA (2008).
Table 1 Differences within NGO-MFI sector in 2006, Bangladesh national-level data
Avg. Avg. Avg. Avg. Avg. Avg. Avg. Avg. Avg.
Type NGO-MFIs Dist Upazila Branch Employ Mem Borro Mem Borro Loan /Branch /Emp /Emp /Bran /Bran /Borro
VL ASA+BRAC 64.00 n.a. 2674.00 10.99 198.36 156.43 2180.84 1719.90 4822.01L 10 25.10 99.10 181.50 10.07 138.53 114.54 1395.41 1153.76 8788.17M 15 9.87 36.13 59.27 18.14 75.16 61.14 1363.07 1108.81 4298.52S 92 4.91 13.58 20.92 18.26 75.32 53.15 1375.16 970.40 4224.51
VS 521 1.67 3.02 3.78 15.30 67.73 47.04 1036.21 719.69 3903.22Total 641 Note: Proshika (in VL category) not included in calculation for typo; Grameen Bank not included in the list VL:Very Large: Borrowers More than or Equal to 1 Million L: Large: Borrowers More than or Equal to 100 Thousand but Less than 1 Million M: Medium: Borrowers More than or Equal to 50 Thousand but Less than 100 Thousand S: Small: Borrowers More than or Equal to 10 Thousand but Less than 50 Thousand VS: Very Small: Borrowers Less than 50 Thousand Source: MRA (2008), Authors' Calculations
Table 1 includes almost all major players in the national NGO-MFI market. We notice that the there is a huge variation among the MFIs in terms of coverage. While “very large” category MFIs cover (a total of three in the original list, namely, BRAC, ASA and Proshika, list does not include Grameen Bank) nearly all over the country comprising of 64 districts, a “very small” category MFI covers, on average, only 1.67 districts and 3.02 upazilas (sub-districts). Very large MFIs operate thousands of branches whilst very small MFIs operate only a few of them, typically in a contiguous area. Taking into consideration possibility of purposive misreporting of MFIs to the regulatory authority, we notice that extent of coverage of branches is hugely different: a typical very large MFI branch employee covers 198 members and, of them, 156 borrowers, whilst a typical very small MFI branch employee covers only 68 members and, of
3
them, 47 borrowers. This can be explained by possible constraints of very small MFIs on the demand side, or the supply side, or both. With regards to loan amount disbursement, while a very small local MFI (fifth category) offers a smaller loan amount compared to a large national-level MFI (second category), interestingly loan amount offers by very large MFIs (first category) are closer to those offered by the very small MFIs (fifth category).
Section 2.2: Local-level Information from PKSF-InM census in Pathrail union, Tangail
Palli Karma Shahayak Foundation (PKSF) and Institute of Microfinance (InM) jointly conducted a census of microcredit borrowers at Pathrail union in Delduar upazila of Tangail district in the months of March and April in 2007-- the objective of the census was to examine overlapping pattern among the microcredit borrowers. Only one union within the district was chosen in order to conduct a thorough census of the area under consideration. Pathrail union has 23 villages. All the villages had some microfinance programs conducted at varied extents. This district was chosen for census as this, as already mentioned, is one of the seasoned places in Bangladesh where microcredit program began as early as in the late 1970s. Although it is likely that the consolidation is far from complete in the microfinance industry here, given the fact that it has a long history of microfinance activity, through years of development, it has grown to certain maturity and therefore is likely to be indicative of where the microfinance industry is heading for; furthermore whatever development we observe here will possibly be followed in the rest of the country in course of time.
Section 3: Research Question
The objective of the paper is to examine nature of competition in the microfinance market in Bangladesh, as it is being evolved over time. The research question is: how the microfinance market is evolving over time, given that substantial differences exists among the NGO-MFIs in terms of overall size of organization, coverage of localities, members and borrowers, amount of loan being offered, nature of loan products that are being offered, etc.?
Section 4: Overview of Literature
We consult here papers and documents that deal with different aspects of microcredit market in Bangladesh in the 2000s.
Chaudhury and Matin (2002) studies overlapping phenomenon in the Tangail district. They conducted an exploratory study based on BRAC’s operations in 9 villages in 2 upazilas of Tangail on a sample of 240 households. From these households they collected NGO participation and loan related information for 3 consecutive years. The aim of the study was to find out reasons behind and consequences of overlapping by households. They conclude that occurrence of unexpected crisis is the main reason behind households looking for multiple loans from different MFIs. They found increased incidence of repayment irregularity by borrowers; however, defaults within their sample did not take alarming proportion; suggesting overlapping households managed to pay back their dues timely or with some delays. Given their findings regarding the cause of overlapping their conclusion was that MFIs needed to come up with risk-responsive loans so that borrowers would not be forced to borrow from multiple organizations to pay back their dues to the MFI they initially borrowed from.
4
Meyer (2002) discusses recent problems in Bangladesh microfinance market such as high dropout rates, exclusion and non-participation, evidence of unmet demand, delinquencies and defaults, overlap, inflexible product characteristics and product design, etc. He comments that a huge expansion of microfinance in Bangladesh has taken place which has led to intense competition for clients and some have commented that this will undermine the industry. Within the industry, repayment discipline is declining, as clients are increasingly willing to default with one MFI confident in the belief that a competing MFI will make a follow-on loan. Meyer points out that MFIs in Bangladesh must move beyond the first phase of “one size fits all” standardized microlending towards a second phase with more flexible financial policies and products to match with client demands and preferences.
Matin (undated) in a CGAP research brief provides some key observations on MFI competition in Bangladesh around the early 2000s. The most prominent feature of MFI competition that emerged is “overlapping”, a term used to imply “multiple microfinance membership at the level of the household”. Measurement of overlapping is difficult since most MFIs keep records at individual client levels, not at household levels; but overlapping occurs at household levels as well. Most MFI staff covered in the survey did not claim that overlapping led to any considerable drop in repayment rates, at least presently; yet they were worried about a long term relationship between overlapping and low repayments. They viewed overlapping to be principally caused by repayment difficulties of households or their needs to cross-finance and manage repayments or in some cases attempts by households for higher credit amount. Matin summarized interesting contrasts of large MFIs vis-à-vis small MFIs. Large national-level MFIs or some district-level MFIs often provided much larger first-time and more progressive loans, and gave quicker repeat loans; as compared to smaller MFIs. On the other hand, advantage of small MFIs was in employing local field staff, therefore enjoying comparative advantages in enforcing loan contracts and repayments. Both small and large MFIs made complaints regarding each other, while small ones complained that their long-term clients were being taken over by large ones; at the same time, large ones complained that their clients were being provided with additional loans by small ones, thereby causing problems of loan repayments. Matin made interesting observation about competition practices of later entrants into some already crowded areas: field staff was being handed over preset targets from head offices; this led to field staff’s aggressive marketing practices including consciously ignoring household’s debt obligation records.
Uddin (undated) is a note that summarizes experiences from the field of recent issues in microfinance industry. Uddin points out explanations for multiple memberships or overlapping issue. From the loan receivers’ side, overlapping is principally caused by mismatch of loan specifications demanded by loan receivers and those sanctioned by MFIs. From the supply side, overlapping is principally caused by formation of incompatible groups compared with availability of loan fund, unplanned expansion of the credit program at field level at the instruction of head office without conducting any feasibility study and a motive to mobilize high amount of savings to finance credit programs. All organizations want to concentrate in specific geographical areas with good communication facilities and financial robustness, and not many organizations are actually willing to expand their operations in remote areas since they may not have the required logistical support to operate there.
Charitonenko and Rahman (2002) analyze progress toward commercialization of Bangladesh’s relatively well-developed and diversified microfinance industry. The term commercialization implies “the application of market-based principles to microfinance”. At the micro level, commercialization implies institutional progress along a continuum, such as, firstly, adoption of for-profit orientation in administration and operation, such as developing diversified, demand-driven financial products applying cost-recovery interest rates; secondly, progression towards operational and financial self-sufficiency; thirdly, use of market-based, non-subsidized
5

sources for funds; and finally, operation as a for-profit, formal financial institution under regulation, and being able to attract equity investment. The report assesses that while general improvement of NGO-MFIs within the microfinance industry in terms of financial self-sufficiency are promising, this industry is far from reaching “potential benefits” of commercialization. Until there is adequate legal and regulatory framework and greater access to commercial sources for funds, MFIs may have few incentives to commercialize their operations further. The outcome of industry remaining not commercialized, the report suggests, is that MFIs’ growth will be limited, and client savings will remain at risk.
Zaman (2004) describes the factors that led to rapid expansion of the microcredit sector in Bangladesh based on an overview of experiences of last three decades, and lessons for other countries from this experience. These are as follows. Firstly, an “enabling environment” for microcredit where both interest rates and inflation rates were kept at reasonable level in the national macroeconomic level helped microcredit industry in the microeconomic level. Secondly, microcredit turned out to be more effective in reducing household vulnerability for the poorest when it was combined with other interventions. Thirdly, donor financial assistance particularly during the “infant” stage of a number of MFIs helped consolidate their organizational structure over time. Fourthly, a decentralized decision-making system combined with client feedback and program monitoring helped many MFIs in Bangladesh in building soild organizational structure. Fifthly, while an apex body for channeling funds into MFIs helped the industry; these funds needed to be synchronized with the needs of growing MFIs. Finally, since only four organizations were currently serving nearly ninety percent of microcredit borrowers, one lesson could be that a large number of MFIs are not required to be supported in order to reach a large proportion of poor people. Yet one need to consider probable repercussion regarding only a few MFIs being encouraged to operate-- in that situation, internal weaknesses in any one organization would translate into problems for the entire industry. Zaman points out that during the early years of microcredit in the country, the organizational model of a NGO-MFI in the industry was of a “franchise”-- virtually identical field offices with similar work pattern and product delivery, this could happen because relatively simple loan products and services were being offered at the beginning. Only when this rapid expansion phase was over, MFIs started to offer more diversified loan products and services targeting different niche markets.
Section 5: Data
Section 5.1 Structure of Data
We analyze data from the PKSF-InM jointly conducted census of Pathrail union microcredit borrowers. The census had four modules of questionnaire. The first module is administered for every single household in the union for listing purposes, asking basic information with regards to landholding, NGO-MFI membership status, etc. (Module 1: listing questionnaire). The second module is a village survey questionnaire, administered in focus group discussions held in each village in order to reach consensus opinion-- questions were mostly on physical infrastructure of the villages and distance from important locations, e.g., paved road, post office, union parishad headquarters, upazila parishad headquarters, school, bank, college, health center, bazaar, etc. (Module 2: village questionnaire). The third module is administered among branch managers and field workers of NGO-MFIs-- questions mostly on the issues of competition practices of MFIs and overlapping situation (Module 3: NGO-MFI questionnaire). The fourth module was a detailed household questionnaire, only for households who are members and/or borrowers of NGO-MFIs (Module 4: household questionnaire). A total of 4,496 household interviews were recorded with Module 4.
6
This fourth module includes listing of all NGO-MFIs and loan types that household members have taken loan from since inception of microcredit in this area in 1979. For every single NGO-MFI loan taken by the household, the questionnaire records details of loan amount demanded, loan amount disbursed, purpose of loan, utilization of loan, date of loan sanctioning, name of MFI-NGO from which loan has been taken, etc. Since Module 4 has NGO-MFI loan history of all the households in the village who ever participated in the microcredit market-- it is possible to construct a village-level panel data set from combining household information up to the village level. Since concerns may arise regarding correctness of long recall, we analyzed the data only within a specific time frame-- years 2000 to 2006 (household interviews were conducted on March-April of 2007, so this year was yet to get completed, therefore we did not include this year in our analysis).
The list from Module 4 includes formal sources such as banks and MFIs and informal sources such as commercial money lenders, neighbors and rich farmers in the village. We selected a total of 43 NGO-MFIs from among 65 numbers of sources of credit funds for household (not selected are categories outside the scope of microcredit market). We classified MFIs in three size categories: “large”, “medium” and “small”. We consulted PKSF documents for years 2000 to 2006 to ascertain which MFI would be placed in which category. We placed 7 MFIs as “large” ones (namely BRAC, ASA, Proshika, Grameen Bank, BRDB, PDBF and BURO Tangail); 2 MFIs as “medium” ones (namely SSS and SATU) and 34 MFIs as “small” ones (these did not receive funds from PKSF, and typically these were small in size and local in terms of microcredit operations). We defined “market share of borrowers” as the share of the village microcredit borrowers that went to a particular MFI in a given year; and we defined “market share of loan amount” as the share of the village total microcredit loan disbursed in a given year that went to a particular MFI. Combining all the market shares of a particular MFI across all the villages in terms of borrowers and loan amount disbursed, we have “grand total market share of borrowers” and “grand total market share of loan amount disbursed”, respectively for each year. We note that while we analyze data from 2000 to 2006, for econometric exercise, we use only data of 2006 (see Section 6.1).
Section 5.2 Analysis of Data
Section 5.2.1: Industry Concentration
Measure of industry concentration, such as the normalized Herfindahl index, for microcredit market of NGO-MFIs in villages of Pathrail during 2000 to 2006 exhibits that market concentration is gradually eroding over time (see Annex 1). Whereas in 2000, values of normalized Herfindahl index for market share of microcredit loans and microcredit borrowers of NGO-MFIs across all villages were 0.31 and 0.25 respectively; these values gradually declined to 0.14 and 0.13 respectively by the year 2006 (in a scale of 0 to 1). This implies that the microcredit market is becoming increasingly more competitive over time.
Section 5.2.2: Long term trends
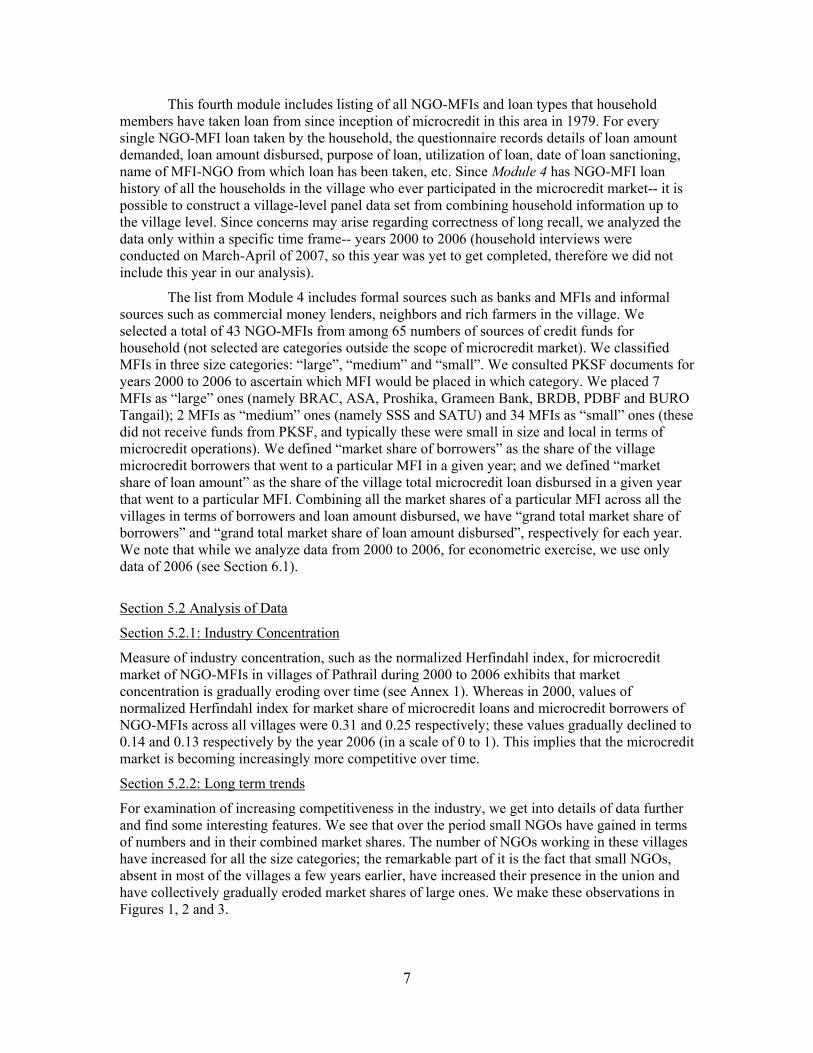
For examination of increasing competitiveness in the industry, we get into details of data further and find some interesting features. We see that over the period small NGOs have gained in terms of numbers and in their combined market shares. The number of NGOs working in these villages have increased for all the size categories; the remarkable part of it is the fact that small NGOs, absent in most of the villages a few years earlier, have increased their presence in the union and have collectively gradually eroded market shares of large ones. We make these observations in Figures 1, 2 and 3.
7

Figure 1 depicts the numbers of NGOs working in the Pathrail union since 1979, classified into three groups-- large, medium and small. It shows that it is the large NGOs (in fact it is Grameen Bank, which is technically a specialized bank) that started their activity first in the union in 1979. Medium NGOs did not start their credit activity regularly until 1990. Small localized NGOs showed up in the picture much later in 1994; ever since these small NGOs have gained in terms of numbers in the union. While in 1994 only one small NGO conducted its credit activity, during the time of census in 2007 their number increased to 33 in the entire union.
Figure 1 Numbers of NGOs working in the Pathrail union, NGO types, 1979-2007
Numbers of NGOs working in the Pathrail union by NGO types, 1979-2007
35 30 25 20 15 10 5
The numbers only, of the NGOs overtime, may be misleading in expressing the true extent and relative importance of these three size categories of NGOs. Figures 2 and 3 have been drawn to manifest market share distributions of these three groups of NGOs. Figure 2 depicts the combined market shares of the NGOs separated into three groups-- market shares are computed on the basis of loan disbursed by the NGOs. As we approach 2007, the market shares of the large group show a steady decline and contrary to that market share of the small group rises to almost 20 percent of the market. The same story can be read from Figure 3; which distinguishes itself from Figure 2 only by the fact that the market shares in this figure are computed on the basis of the numbers of active borrowing members in a year belonging to the respective group of NGOs. Here also moving towards 2007 manifests a continuous soaring of the small group market shares, at the expense of the large group.5
5 One weakness of the data used in Figures 1-3, is that they are based on recalls of the active borrowers
who still lived in the area in 2007; furthermore, some of the households may have left the area ever since micro lending started in the late 70s. None of the reasons is robust enough to change the pattern reflected in these figures though.
0 1979 1981 1983 1985 19871989 1991 1993 1995 1997 1999 2001 2003 2005 2007
large medium small
8
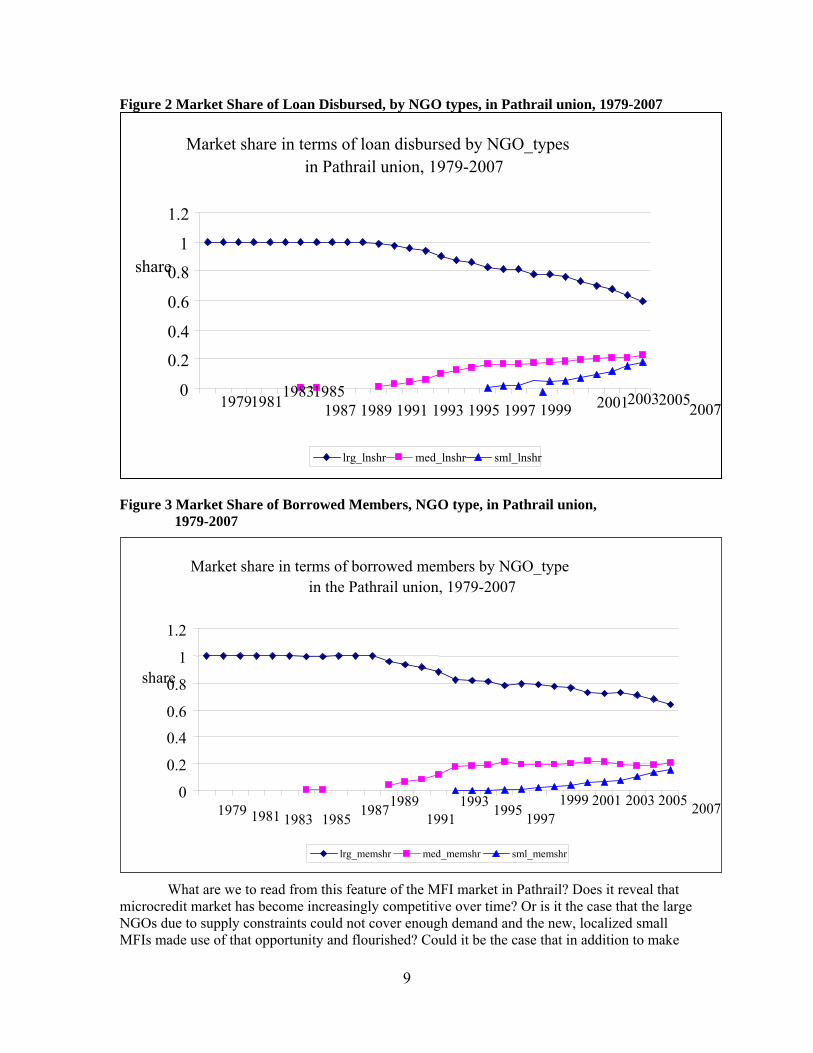
Figure 2 Market Share of Loan Disbursed, by NGO types, in Pathrail union, 1979-2007
Market share in terms of loan disbursed by NGO_types in Pathrail union, 1979-2007
1.2
1
0share .8
0.6
0.4
0.2
0
Figure 3 Market Share of Borrowed Members, NGO type, in Pathrail union, 1979-2007
What are we to read from this feature of the MFI market in Pathrail? Does it reveal that microcredit market has become increasingly competitive over time? Or is it the case that the large NGOs due to supply constraints could not cover enough demand and the new, localized small MFIs made use of that opportunity and flourished? Could it be the case that in addition to make
1979 1981 1983 19851987 1989 1991 1993 1995 1997 1999 2001 200320052007
lrg_lnshr med_lnshr sml_lnshr
Market share in terms of borrowed members by NGO_type in the Pathrail union, 1979-2007
1.2
0.8share 1
0.6
0.4
0.2
0 1999 2001 2003 200519871989 1993 20071979 19951981 1983 199719911985
lrg_memshr med_memshr sml_memshr
9
use of untouched potentials, small NGOs are working in a segmented market where their chief strategy is to allure the higher productive borrowers? In other words, is it the case that, as the market has gotten mature many small players have recognized scopes for pure-profit commercialization of the micro credit market and have encroached in it gradually?
These different scenarios have different implications. The particular growth of small lenders can be boon or bane for the microfinance industry as a whole depending on reasons that led to and the consequences that followed from the actions of these lenders. The growth can be regarded as innocuous if it took place mainly through tapping the unsaturated markets in the area by these small lenders. In that case it is just a case of efficient functioning of the market system. However, if the growth mainly depended on overlapping6 by the lenders then that can raise concern. That is so as indebtedness is a possible effect of overlapping and poses threat to the financial system through concomitant rise in portfolio risk. However, overlapping can also be a necessity and therefore wholesome if it was primarily due to filling the gap between insufficient sizes of individual loans provided by the large NGOs and corresponding correctly assessed demand for loan. If we find that household net worth is increasing over time and on a sustainable basis, even when this household overlaps, we may conclude that overlapping actually helped these households. In that case, we may say that overlapping can help borrowers taking higher productive activity by enlarging investments.
It is possible that the small MFIs are increasing their market share by targeting segmented markets; this way they are increasing their share by alluring the most productive borrowers. One way to accomplish this is by offering larger loan amount; this in turn helps the borrowers to invest in more productive assets or enable them to carry through larger expansion of their businesses.
Recognizing and treating micro credit as a business and providing loans with a pure profit motive with less strings attached may also help some MFIs gain in market shares.7 It may be mentioned that micro credit as a subsidized program competes with other public programs aimed at alleviating poverty. Seen from this perspective, if the lending rules incorporate such conviction, then lending becomes relatively less business oriented and constrained for the lending organization. For example, in that case a lending organization would aim at maximizing number of households rather than outstanding loan amount and stay away from overlapping; be it household- or membership overlap. The aim would be to reach as many poor households as possible, to help them graduate out of poverty than pursuing primarily financial goals of maximizing profit or return. Keeping the poverty alleviation aim in mind a lending organization would also keep away from market segmentation in the sense mentioned above.
Section 5.2.3: Characteristic differences between large and small NGOs
The fact that surfaces from the discussion of the previous subsection is that the large NGOs are facing increasing competition from the small NGOs to attract borrowers in the market. Yet the market is far away from consolidation. This we can be read from Table 2 which shows that the 6 Overlapping is defined in this paper in two ways, one is “household overlapping” and the other one is
“membership overlapping”. Any household with more than one member is termed an overlapping household. On the other hand, an individual having membership with more than one institution is termed as an overlapping member. Notice that membership overlapping is thus defined to be a subset of household overlapping, so it is always that case that in any village household overlapping number is higher as compared to membership overlapping.
7 Micro credit operations in rural areas traditionally come with a host of additional social responsibilities that the borrowers must adhere to. A pure profit motive business oriented micro credit business may make itself attractive by keeping such imperatives at bay.
10
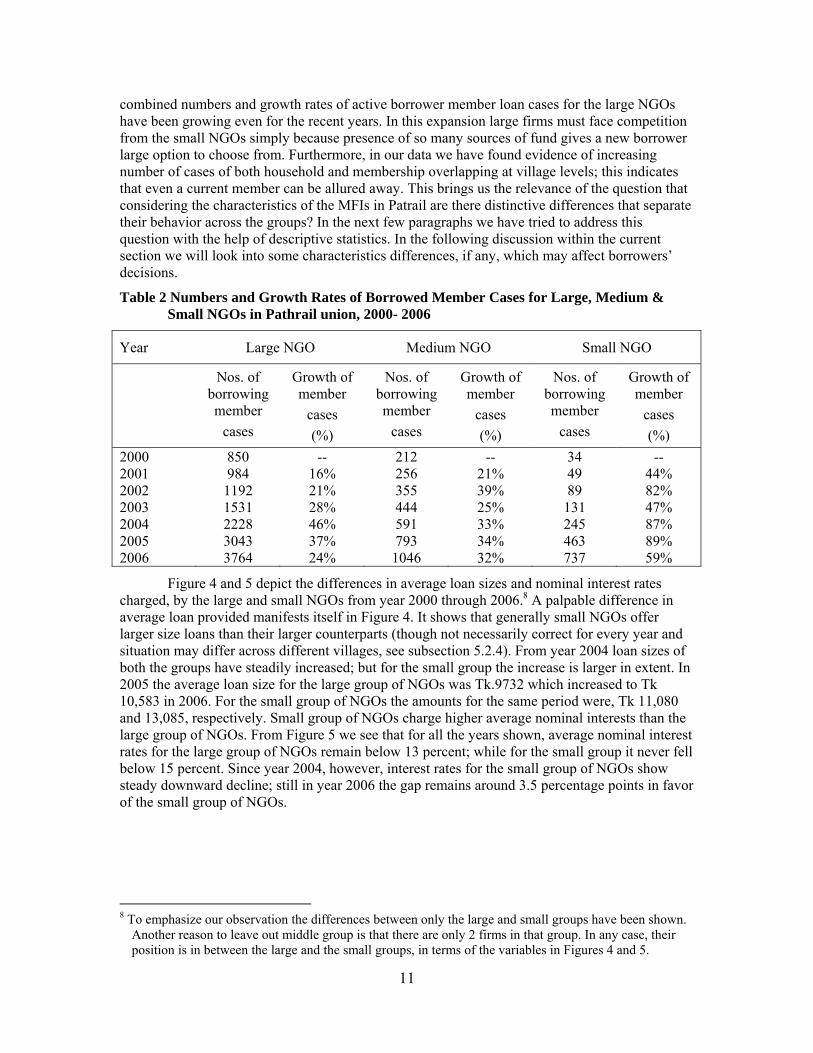
combined numbers and growth rates of active borrower member loan cases for the large NGOs have been growing even for the recent years. In this expansion large firms must face competition from the small NGOs simply because presence of so many sources of fund gives a new borrower large option to choose from. Furthermore, in our data we have found evidence of increasing number of cases of both household and membership overlapping at village levels; this indicates that even a current member can be allured away. This brings us the relevance of the question that considering the characteristics of the MFIs in Patrail are there distinctive differences that separate their behavior across the groups? In the next few paragraphs we have tried to address this question with the help of descriptive statistics. In the following discussion within the current section we will look into some characteristics differences, if any, which may affect borrowers’ decisions.
Table 2 Numbers and Growth Rates of Borrowed Member Cases for Large, Medium & Small NGOs in Pathrail union, 2000- 2006
Year Large NGO Medium NGO Small NGO
Nos. of borrowing member
cases
Growth of member
cases (%)
Nos. of borrowing member
cases
Growth of member
cases (%)
Nos. of borrowing member
cases
Growth of member
cases (%)
2000 850 -- 212 -- 34 -- 2001 984 16% 256 21% 49 44% 2002 1192 21% 355 39% 89 82% 2003 1531 28% 444 25% 131 47% 2004 2228 46% 591 33% 245 87% 2005 3043 37% 793 34% 463 89% 2006 3764 24% 1046 32% 737 59%
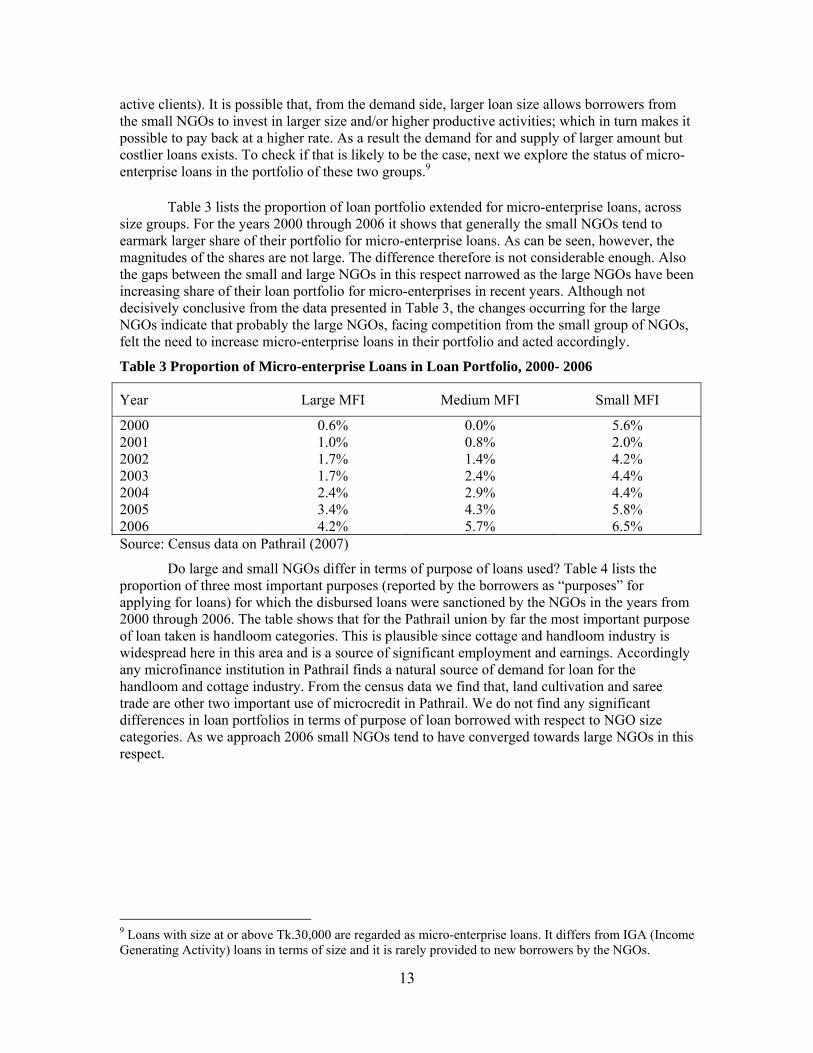
Figure 4 and 5 depict the differences in average loan sizes and nominal interest rates charged, by the large and small NGOs from year 2000 through 2006.8 A palpable difference in average loan provided manifests itself in Figure 4. It shows that generally small NGOs offer larger size loans than their larger counterparts (though not necessarily correct for every year and situation may differ across different villages, see subsection 5.2.4). From year 2004 loan sizes of both the groups have steadily increased; but for the small group the increase is larger in extent. In 2005 the average loan size for the large group of NGOs was Tk.9732 which increased to Tk 10,583 in 2006. For the small group of NGOs the amounts for the same period were, Tk 11,080 and 13,085, respectively. Small group of NGOs charge higher average nominal interests than the large group of NGOs. From Figure 5 we see that for all the years shown, average nominal interest rates for the large group of NGOs remain below 13 percent; while for the small group it never fell below 15 percent. Since year 2004, however, interest rates for the small group of NGOs show steady downward decline; still in year 2006 the gap remains around 3.5 percentage points in favor of the small group of NGOs.
8 To emphasize our observation the differences between only the large and small groups have been shown.
Another reason to leave out middle group is that there are only 2 firms in that group. In any case, their position is in between the large and the small groups, in terms of the variables in Figures 4 and 5.
11
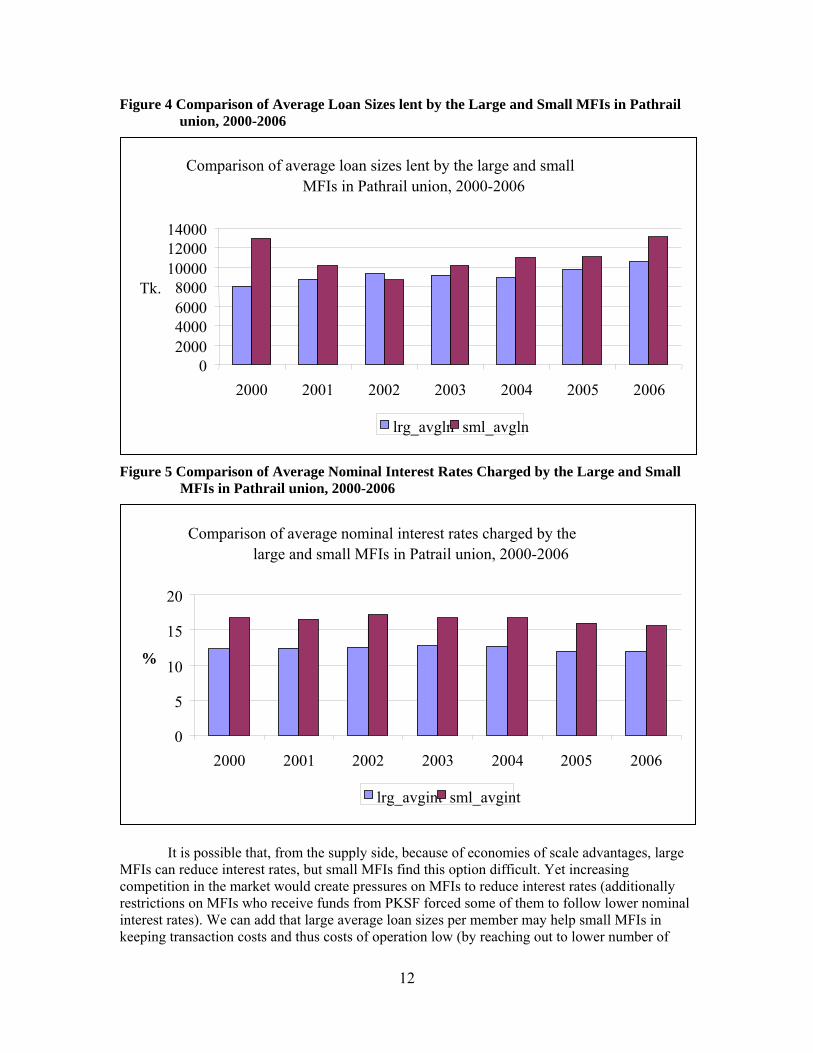
Figure 4 Comparison of Average Loan Sizes lent by the Large and Small MFIs in Pathrail union, 2000-2006
Comparison of average loan sizes lent by the large and small MFIs in Pathrail union, 2000-2006
Figure 5 Comparison of Average Nominal Interest Rates Charged by the Large and Small MFIs in Pathrail union, 2000-2006
It is possible that, from the supply side, because of economies of scale advantages, large MFIs can reduce interest rates, but small MFIs find this option difficult. Yet increasing competition in the market would create pressures on MFIs to reduce interest rates (additionally restrictions on MFIs who receive funds from PKSF forced some of them to follow lower nominal interest rates). We can add that large average loan sizes per member may help small MFIs in keeping transaction costs and thus costs of operation low (by reaching out to lower number of
0 2000 4000 6000 8000
10000 12000 14000
Tk.
2000 2001 2002 2003 2004 2005 2006
lrg_avgln sml_avgln
Comparison of average nominal interest rates charged by the large and small MFIs in Patrail union, 2000-2006
20
15
% 10
5
0 2000 2001 2002 2003 2004 2005 2006
lrg_avgint sml_avgint
12
active clients). It is possible that, from the demand side, larger loan size allows borrowers from the small NGOs to invest in larger size and/or higher productive activities; which in turn makes it possible to pay back at a higher rate. As a result the demand for and supply of larger amount but costlier loans exists. To check if that is likely to be the case, next we explore the status of micro-enterprise loans in the portfolio of these two groups.9
Table 3 lists the proportion of loan portfolio extended for micro-enterprise loans, across size groups. For the years 2000 through 2006 it shows that generally the small NGOs tend to earmark larger share of their portfolio for micro-enterprise loans. As can be seen, however, the magnitudes of the shares are not large. The difference therefore is not considerable enough. Also the gaps between the small and large NGOs in this respect narrowed as the large NGOs have been increasing share of their loan portfolio for micro-enterprises in recent years. Although not decisively conclusive from the data presented in Table 3, the changes occurring for the large NGOs indicate that probably the large NGOs, facing competition from the small group of NGOs, felt the need to increase micro-enterprise loans in their portfolio and acted accordingly.
Table 3 Proportion of Micro-enterprise Loans in Loan Portfolio, 2000- 2006
Source: Census data on Pathrail (2007)
Year Large MFI Medium MFI Small MFI
2000 0.6% 0.0% 5.6% 2001 1.0% 0.8% 2.0% 2002 1.7% 1.4% 4.2% 2003 1.7% 2.4% 4.4% 2004 2.4% 2.9% 4.4% 2005 3.4% 4.3% 5.8% 2006 4.2% 5.7% 6.5%
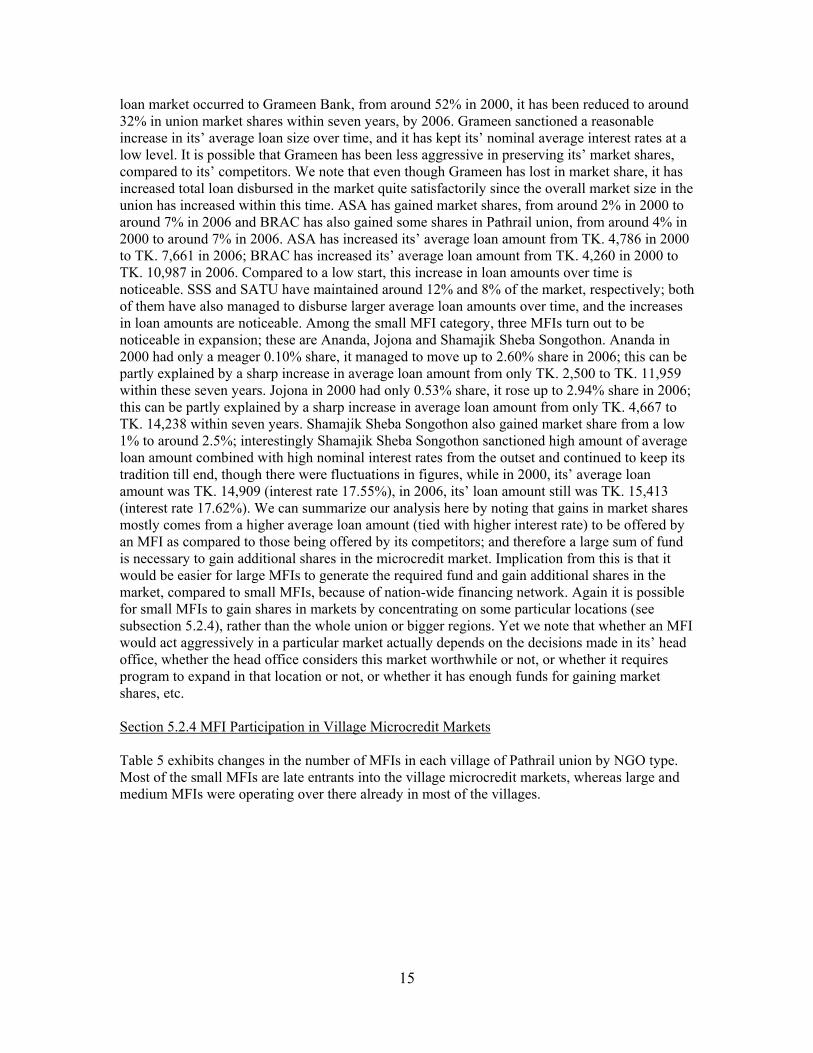
Do large and small NGOs differ in terms of purpose of loans used? Table 4 lists the proportion of three most important purposes (reported by the borrowers as “purposes” for applying for loans) for which the disbursed loans were sanctioned by the NGOs in the years from 2000 through 2006. The table shows that for the Pathrail union by far the most important purpose of loan taken is handloom categories. This is plausible since cottage and handloom industry is widespread here in this area and is a source of significant employment and earnings. Accordingly any microfinance institution in Pathrail finds a natural source of demand for loan for the handloom and cottage industry. From the census data we find that, land cultivation and saree trade are other two important use of microcredit in Pathrail. We do not find any significant differences in loan portfolios in terms of purpose of loan borrowed with respect to NGO size categories. As we approach 2006 small NGOs tend to have converged towards large NGOs in this respect.
9 Loans with size at or above Tk.30,000 are regarded as micro-enterprise loans. It differs from IGA (Income Generating Activity) loans in terms of size and it is rarely provided to new borrowers by the NGOs.
13
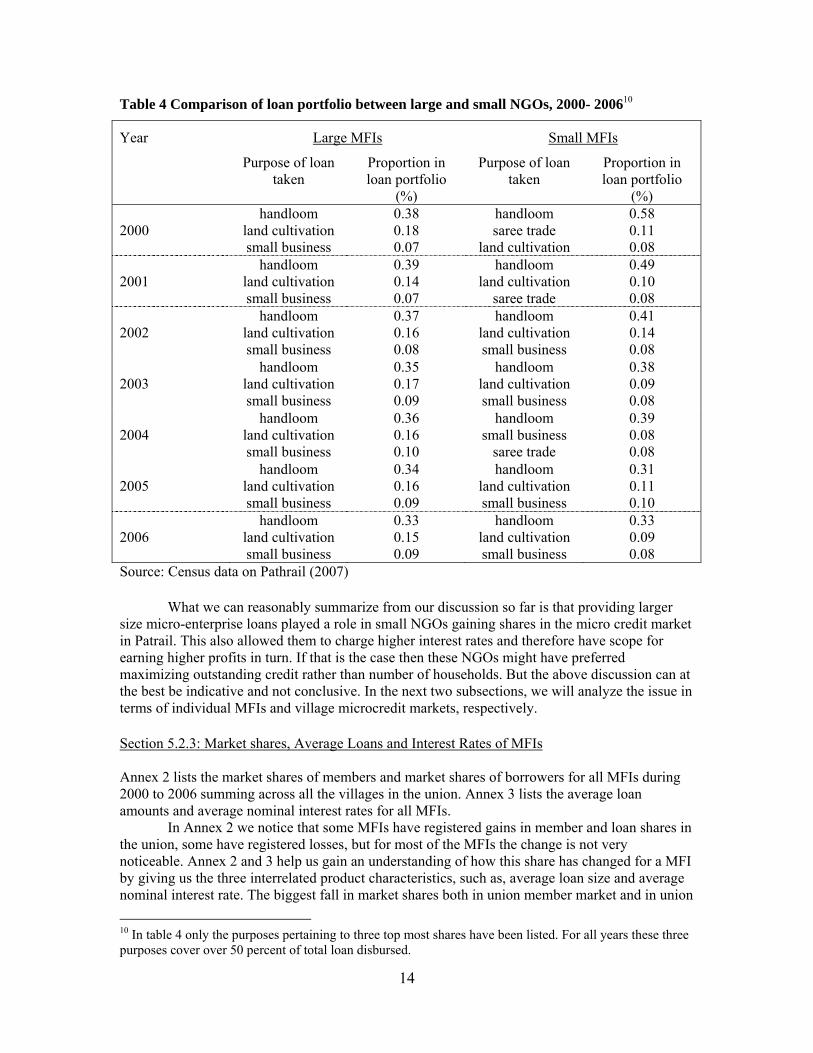
Table 4 Comparison of loan portfolio between large and small NGOs, 2000- 200610
Year Large MFIs Small MFIs
Purpose of loan taken
Proportion in loan portfolio
(%)
Purpose of loan taken
Proportion in loan portfolio
(%) handloom 0.38 handloom 0.58 2000 land cultivation 0.18 saree trade 0.11 small business 0.07 land cultivation 0.08 handloom 0.39 handloom 0.49 2001 land cultivation 0.14 land cultivation 0.10 small business 0.07 saree trade 0.08 handloom 0.37 handloom 0.41 2002 land cultivation 0.16 land cultivation 0.14 small business 0.08 small business 0.08 handloom 0.35 handloom 0.38 2003 land cultivation 0.17 land cultivation 0.09 small business 0.09 small business 0.08 handloom 0.36 handloom 0.39 2004 land cultivation 0.16 small business 0.08 small business 0.10 saree trade 0.08 handloom 0.34 handloom 0.31 2005 land cultivation 0.16 land cultivation 0.11 small business 0.09 small business 0.10 handloom 0.33 handloom 0.33 2006 land cultivation 0.15 land cultivation 0.09 small business 0.09 small business 0.08 Source: Census data on Pathrail (2007)
What we can reasonably summarize from our discussion so far is that providing larger size micro-enterprise loans played a role in small NGOs gaining shares in the micro credit market in Patrail. This also allowed them to charge higher interest rates and therefore have scope for earning higher profits in turn. If that is the case then these NGOs might have preferred maximizing outstanding credit rather than number of households. But the above discussion can at the best be indicative and not conclusive. In the next two subsections, we will analyze the issue in terms of individual MFIs and village microcredit markets, respectively.
Section 5.2.3: Market shares, Average Loans and Interest Rates of MFIs Annex 2 lists the market shares of members and market shares of borrowers for all MFIs during 2000 to 2006 summing across all the villages in the union. Annex 3 lists the average loan amounts and average nominal interest rates for all MFIs.
In Annex 2 we notice that some MFIs have registered gains in member and loan shares in the union, some have registered losses, but for most of the MFIs the change is not very noticeable. Annex 2 and 3 help us gain an understanding of how this share has changed for a MFI by giving us the three interrelated product characteristics, such as, average loan size and average nominal interest rate. The biggest fall in market shares both in union member market and in union 10 In table 4 only the purposes pertaining to three top most shares have been listed. For all years these three purposes cover over 50 percent of total loan disbursed.
14
loan market occurred to Grameen Bank, from around 52% in 2000, it has been reduced to around 32% in union market shares within seven years, by 2006. Grameen sanctioned a reasonable increase in its’ average loan size over time, and it has kept its’ nominal average interest rates at a low level. It is possible that Grameen has been less aggressive in preserving its’ market shares, compared to its’ competitors. We note that even though Grameen has lost in market share, it has increased total loan disbursed in the market quite satisfactorily since the overall market size in the union has increased within this time. ASA has gained market shares, from around 2% in 2000 to around 7% in 2006 and BRAC has also gained some shares in Pathrail union, from around 4% in 2000 to around 7% in 2006. ASA has increased its’ average loan amount from TK. 4,786 in 2000 to TK. 7,661 in 2006; BRAC has increased its’ average loan amount from TK. 4,260 in 2000 to TK. 10,987 in 2006. Compared to a low start, this increase in loan amounts over time is noticeable. SSS and SATU have maintained around 12% and 8% of the market, respectively; both of them have also managed to disburse larger average loan amounts over time, and the increases in loan amounts are noticeable. Among the small MFI category, three MFIs turn out to be noticeable in expansion; these are Ananda, Jojona and Shamajik Sheba Songothon. Ananda in 2000 had only a meager 0.10% share, it managed to move up to 2.60% share in 2006; this can be partly explained by a sharp increase in average loan amount from only TK. 2,500 to TK. 11,959 within these seven years. Jojona in 2000 had only 0.53% share, it rose up to 2.94% share in 2006; this can be partly explained by a sharp increase in average loan amount from only TK. 4,667 to TK. 14,238 within seven years. Shamajik Sheba Songothon also gained market share from a low 1% to around 2.5%; interestingly Shamajik Sheba Songothon sanctioned high amount of average loan amount combined with high nominal interest rates from the outset and continued to keep its tradition till end, though there were fluctuations in figures, while in 2000, its’ average loan amount was TK. 14,909 (interest rate 17.55%), in 2006, its’ loan amount still was TK. 15,413 (interest rate 17.62%). We can summarize our analysis here by noting that gains in market shares mostly comes from a higher average loan amount (tied with higher interest rate) to be offered by an MFI as compared to those being offered by its competitors; and therefore a large sum of fund is necessary to gain additional shares in the microcredit market. Implication from this is that it would be easier for large MFIs to generate the required fund and gain additional shares in the market, compared to small MFIs, because of nation-wide financing network. Again it is possible for small MFIs to gain shares in markets by concentrating on some particular locations (see subsection 5.2.4), rather than the whole union or bigger regions. Yet we note that whether an MFI would act aggressively in a particular market actually depends on the decisions made in its’ head office, whether the head office considers this market worthwhile or not, or whether it requires program to expand in that location or not, or whether it has enough funds for gaining market shares, etc. Section 5.2.4 MFI Participation in Village Microcredit Markets Table 5 exhibits changes in the number of MFIs in each village of Pathrail union by NGO type. Most of the small MFIs are late entrants into the village microcredit markets, whereas large and medium MFIs were operating over there already in most of the villages.
15
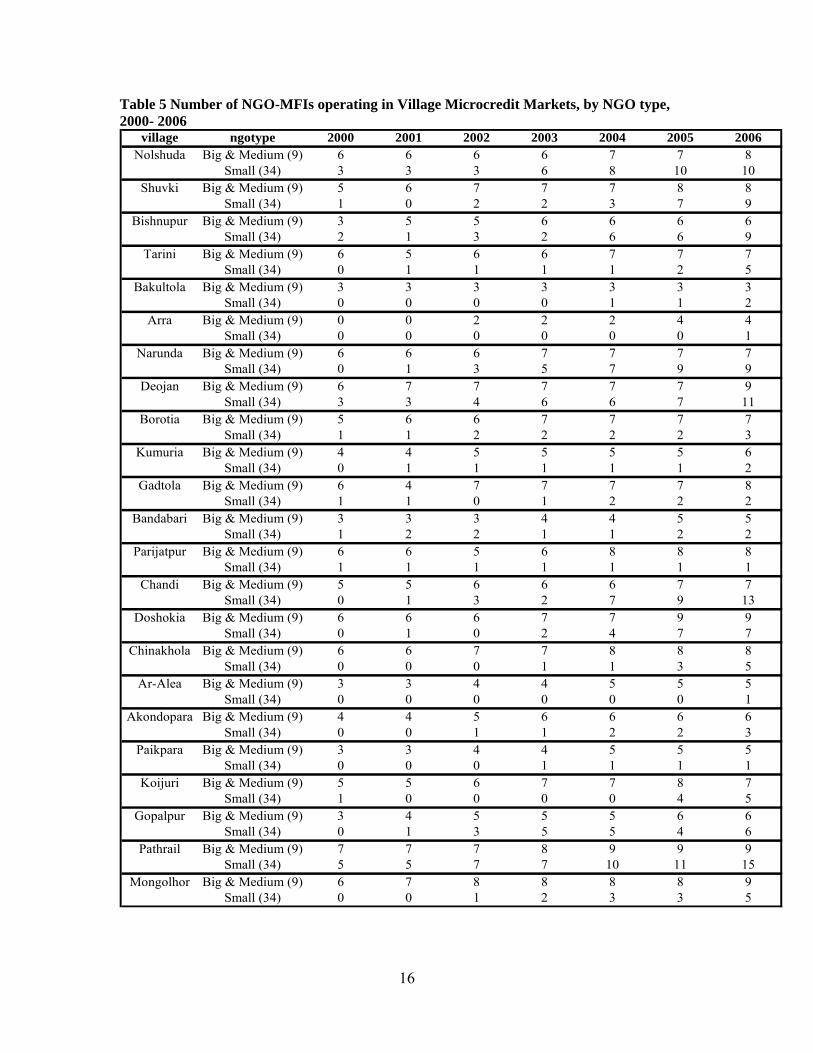
Table 5 Number of NGO-MFIs operating in Village Microcredit Markets, by NGO type, 2000- 2006
village ngotype 2000 2001 2002 2003 2004 2005 2006Nolshuda Big & Medium (9) 6 6 6 6 7 7 8
Small (34) 3 3 3 6 8 10 10Shuvki Big & Medium (9) 5 6 7 7 7 8 8
Small (34) 1 0 2 2 3 7 9Bishnupur Big & Medium (9) 3 5 5 6 6 6 6
Small (34) 2 1 3 2 6 6 9Tarini Big & Medium (9) 6 5 6 6 7 7 7
Small (34) 0 1 1 1 1 2 5Bakultola Big & Medium (9) 3 3 3 3 3 3 3
Small (34) 0 0 0 0 1 1 2Arra Big & Medium (9) 0 0 2 2 2 4 4
Small (34) 0 0 0 0 0 0 1Narunda Big & Medium (9) 6 6 6 7 7 7 7
Small (34) 0 1 3 5 7 9 9Deojan Big & Medium (9) 6 7 7 7 7 7 9
Small (34) 3 3 4 6 6 7 11Borotia Big & Medium (9) 5 6 6 7 7 7 7
Small (34) 1 1 2 2 2 2 3Kumuria Big & Medium (9) 4 4 5 5 5 5 6
Small (34) 0 1 1 1 1 1 2Gadtola Big & Medium (9) 6 4 7 7 7 7 8
Small (34) 1 1 0 1 2 2 2Bandabari Big & Medium (9) 3 3 3 4 4 5 5
Small (34) 1 2 2 1 1 2 2Parijatpur Big & Medium (9) 6 6 5 6 8 8 8
Small (34) 1 1 1 1 1 1 1Chandi Big & Medium (9) 5 5 6 6 6 7 7
Small (34) 0 1 3 2 7 9 13Doshokia Big & Medium (9) 6 6 6 7 7 9 9
Small (34) 0 1 0 2 4 7 7Chinakhola Big & Medium (9) 6 6 7 7 8 8 8
Small (34) 0 0 0 1 1 3 5Ar-Alea Big & Medium (9) 3 3 4 4 5 5 5
Small (34) 0 0 0 0 0 0 1Akondopara Big & Medium (9) 4 4 5 6 6 6 6
Small (34) 0 0 1 1 2 2 3Paikpara Big & Medium (9) 3 3 4 4 5 5 5
Small (34) 0 0 0 1 1 1 1Koijuri Big & Medium (9) 5 5 6 7 7 8 7
Small (34) 1 0 0 0 0 4 5Gopalpur Big & Medium (9) 3 4 5 5 5 6 6
Small (34) 0 1 3 5 5 4 6Pathrail Big & Medium (9) 7 7 7 8 9 9 9
Small (34) 5 5 7 7 10 11 15Mongolhor Big & Medium (9) 6 7 8 8 8 8 9
Small (34) 0 0 1 2 3 3 5
16
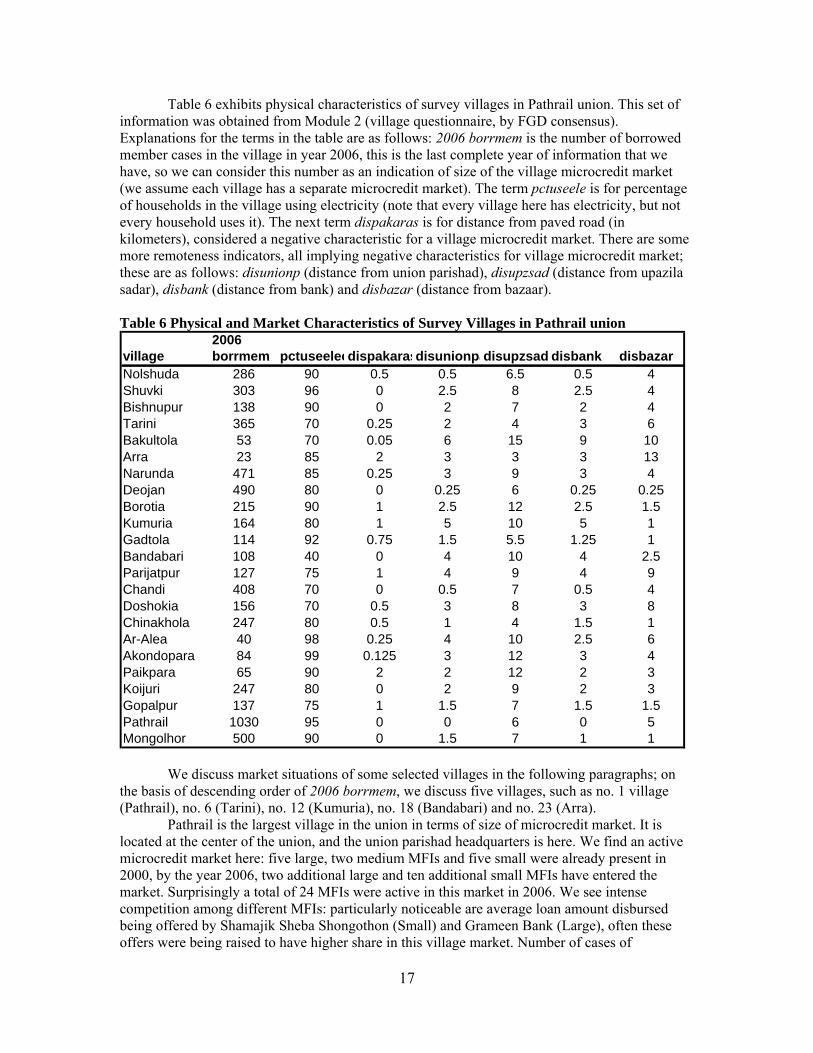
Table 6 exhibits physical characteristics of survey villages in Pathrail union. This set of information was obtained from Module 2 (village questionnaire, by FGD consensus). Explanations for the terms in the table are as follows: 2006 borrmem is the number of borrowed member cases in the village in year 2006, this is the last complete year of information that we have, so we can consider this number as an indication of size of the village microcredit market (we assume each village has a separate microcredit market). The term pctuseele is for percentage of households in the village using electricity (note that every village here has electricity, but not every household uses it). The next term dispakaras is for distance from paved road (in kilometers), considered a negative characteristic for a village microcredit market. There are some more remoteness indicators, all implying negative characteristics for village microcredit market; these are as follows: disunionp (distance from union parishad), disupzsad (distance from upazila sadar), disbank (distance from bank) and disbazar (distance from bazaar).
Table 6 Physical and Market Characteristics of Survey Villages in Pathrail union
2006village borrmem pctuseelecdispakarasdisunionpadisupzsad disbank disbazarNolshuda 286 90 0.5 0.5 6.5 0.5 4Shuvki 303 96 0 2.5 8 2.5 4Bishnupur 138 90 0 2 7 2 4Tarini 365 70 0.25 2 4 3 6Bakultola 53 70 0.05 6 15 9 10Arra 23 85 2 3 3 3 13Narunda 471 85 0.25 3 9 3 4Deojan 490 80 0 0.25 6 0.25 0.25Borotia 215 90 1 2.5 12 2.5 1.5Kumuria 164 80 1 5 10 5 1Gadtola 114 92 0.75 1.5 5.5 1.25 1Bandabari 108 40 0 4 10 4 2.5Parijatpur 127 75 1 4 9 4 9Chandi 408 70 0 0.5 7 0.5 4Doshokia 156 70 0.5 3 8 3 8Chinakhola 247 80 0.5 1 4 1.5 1Ar-Alea 40 98 0.25 4 10 2.5 6Akondopara 84 99 0.125 3 12 3 4Paikpara 65 90 2 2 12 2 3Koijuri 247 80 0 2 9 2 3Gopalpur 137 75 1 1.5 7 1.5 1.5Pathrail 1030 95 0 0 6 0 5Mongolhor 500 90 0 1.5 7 1 1
We discuss market situations of some selected villages in the following paragraphs; on the basis of descending order of 2006 borrmem, we discuss five villages, such as no. 1 village (Pathrail), no. 6 (Tarini), no. 12 (Kumuria), no. 18 (Bandabari) and no. 23 (Arra).
Pathrail is the largest village in the union in terms of size of microcredit market. It is located at the center of the union, and the union parishad headquarters is here. We find an active microcredit market here: five large, two medium MFIs and five small were already present in 2000, by the year 2006, two additional large and ten additional small MFIs have entered the market. Surprisingly a total of 24 MFIs were active in this market in 2006. We see intense competition among different MFIs: particularly noticeable are average loan amount disbursed being offered by Shamajik Sheba Shongothon (Small) and Grameen Bank (Large), often these offers were being raised to have higher share in this village market. Number of cases of
17
overlapping, of both household and membership variety, is much higher in this market compared to all-village averages. Even though number of additional MFIs entering into this market was the highest, the growth rate of number of borrowing member cases was slightly lower compared to an all-village average; may be this implies near saturation of this village’s microcredit market.
Tarini is no. 6 in terms of size of microcredit market; while it is nearly one-third of that of Pathrail in terms of 2006 borrmem. It is a comparatively large sized market, and it is close to the center in terms of distance. In terms of growth rates of numbers of borrower cases, it is an average active market compared to the all-village averages. Till 2005, small MFIs lagged behind large MFIs in terms of average loan amount disbursed, but in 2006, small MFIs overtook large MFIs, caused by much higher average loan amount being offered by Ananda (Small). There is a moderate falling tendency for nominal average interest rates, in some years, small MFI nominal average interest rates exceeded those of large MFIs and in other years it was the other way round.
Kumuria is no. 12 village in terms of size of microcredit market. It is a small sized market, away from the center. Two large and two medium MFIs were present in 2000, by 2006 two additional large and two small MFIs entered this market. Till 2004, large MFI average loan disbursed exceeded those offers by small MFI, but in 2005 there was a switch in favor of small MFIs which coincided with an upward jump of average loan disbursed offers by Ananda (Small).
Bandabari is no. 18 village in terms of size of microcredit market. It is a small sized market, away from the center. The number of MFIs operating in 2000 was four, whereas the number increased up to seven by 2006. Two medium and one small MFI entered into this market. Growth rate figures for number of borrowers are similar to all-village averages in this village. Small MFIs lagged behind large MFIs in terms of average loan disbursed in all years.
Arra is the smallest microcredit market in the union. This village is away from the center. There was no microcredit operation till 2001; first in 2002 a large MFI (Buro Tangail) and a medium MFI (SATU) entered into this market. Small MFIs lagged large MFIs in terms of average loan disbursed and their average nominal interest rate figures were higher as compared to those for large MFIs. Membership and household overlap numbers is lower in this village as compared to all-village averages.
Overall the union microcredit market sees intense competition among different MFIs, particularly in later years. Interestingly aspects of competition differ across villages. Some common observations are as follows: (a) average nominal interest rates are falling over time, (b) average loan disbursed offered by different MFIs differ widely and also across different
villages, (c) competition is more intense and entry of new firms are more common in more economically
prominent areas, whereas competition is less intense in economically less advanced areas and
(d) areas where competition is more prominent, we notice more cases of household and membership overlapping.
Section 6 Econometric Model and Estimation Results Section 6.1 Economic Model We want to analyze determinants of market share of MFIs in village microcredit markets. Particularly we would model shares of currently borrowing members in the village microcredit market that goes to a particular MFI. Here we will concentrate on data set for year 2006 only. By concentrating on 2006 data only we set aside issues of time series and panel data structures as well as recall data issues. This time we have a total of 989 observations (each of 43 MFIs in each of 23 villages, market share of a MFI in one particular village is zero if it does not participate in that village microcredit market, otherwise non-zero). Now we have a large number of zero observations (out of 989-- 757 observations are zero and 232 observations are non-zero; all
18
observations are by definition in between zero and one). With such a large number of zero observations (zero implies MFI did not participate, non-zero implies it did, this by itself a decision variable) -- we have to model our regression in terms of limited dependent variable literature, such as the Tobit model (see next section).
MFIs are competing for shares in the village microcredit market. Nature and outcome of this competition would depend on most importantly the characteristics of the product in question; that is the loan product as well as the characteristics of the loan provider or some combination of both. Characteristics of the loan product includes size of loan disbursed, nominal interest rate to be charged on loan in installments, deposit interest rate to be given on deposits, purpose of loan for which loan was approved, flexibility of loan approval process (i.e., how much percentage of loan demanded are being actually met for by the loan, amount of time and effort for loan sanction) as well as prospects of obtaining more loans in the future provided borrowed members do not default on this loan. Characteristics of the loan provider includes identity of the loan provider (incorporates goodwill, trustworthiness, previous records, overall reputation in the market, etc.) and institution size of the loan provider (whether large national, or small local), additionally number of years this loan provider is operating in this market (microcredit loans typically are provided in a serial basis, small loan graduating into large loan, current loan performance leading to scopes in the future). These two sets of characteristics would operate in the market to sort out how much share of the market would be achieved by which loan provider. In the extreme case of a monopoly market structure, loan provider MFI would not be much concerned about loan characteristics since competition is absent. But in a market with increasing competitiveness such as this one, loan provider MFI must keep pace with other loan providers in terms of specificity of loan products. More customer friendly loan specification is one way firms can earn higher share of the market; or long term association in the market would provide them with competitive edge over others. One additional way market shares can be increased is by providing some unique products in the market, which others do not provide.
We notice that two products can be considered ‘unique’ in the market by 2006, such as the housing loan (loan sanctioned for housing construction, repair or maintenance purposes) and the micro-enterprise loan (loan amount higher or equal to TK. 30,000 and provided to a micro-enterprise, by definition an enterprise with paid non-household labor). Summing over all villages in 2006, only 3.08% of total number of loans is sanctioned for housing purposes and in terms of total loan disbursed this amount is only 2.88% (average loan size for this is slightly lower compared to overall); at the same time, only 4.77% number of loans is sanctioned for micro-enterprise purpose and this comprises 22.48% of total loan disbursed (average loan size for this is much higher compared to overall). Not many MFIs provide this, whereas the second one requires considerable financial strength, the first one can be considered unconventional. MFIs that provide either or both of these should have competitive advantage in the market.
The product and provider characteristics that play a role in determination of market share include loan amount, interest rate charged, deposit interest rate provided, provision of housing and micro-enterprise loans, size of the MFI, years of operation of the MFI in that particular market, etc. Other unobserved characteristics that we do not have quantifiable data is customer relations of staff, rules regarding loan meetings and requirements of attendance, and savings schemes, whether strict conditions for peer monitoring exists, etc. Another set of variables are associated with specific context of the market, such as village characteristics, some of these are observed while some of them are not observed-- we can use dummy to capture these effects.
One more issue to explore is that some of the loan characteristics are co-determined, such as loan amount and interest rate charged on loan. Interest rates charged by an MFI do not vary by villages, but it varies across MFIs. Figure 6 is a scatter plot of this, and we do notice an upward-sloping pattern between average loan disbursed and
19
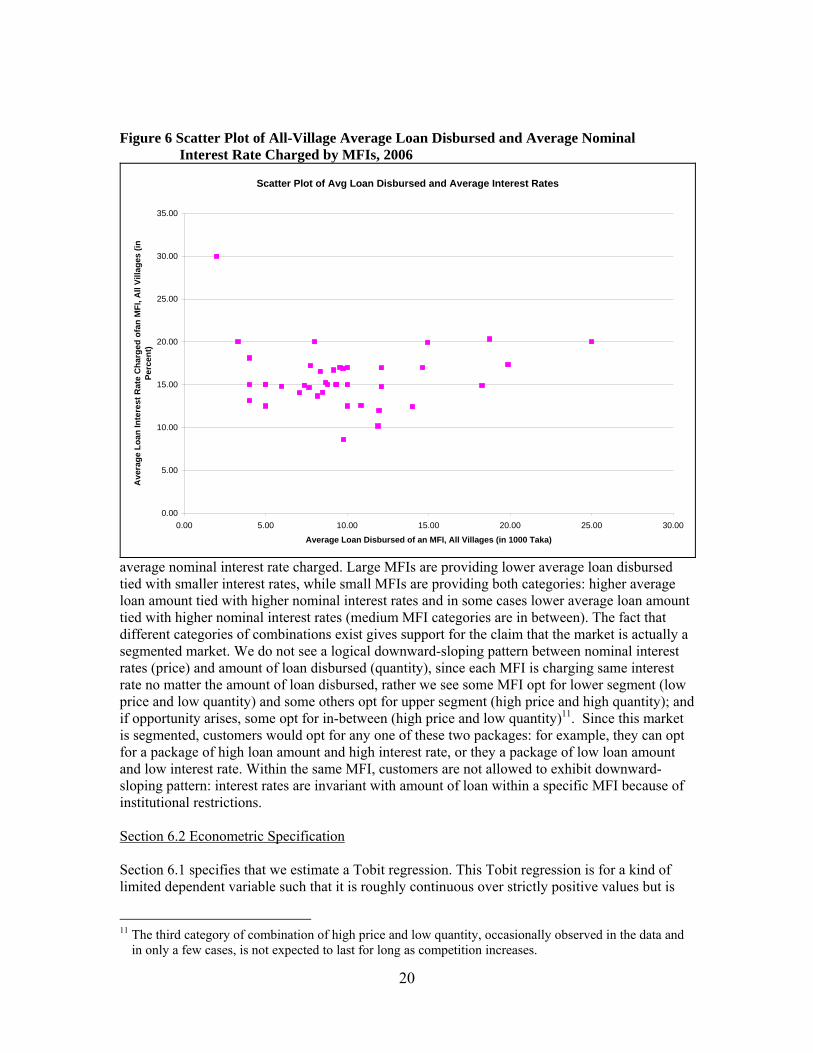
Figure 6 Scatter Plot of All-Village Average Loan Disbursed and Average Nominal
Interest Rate Charged by MFIs, 2006
Scatter Plot of Avg Loan Disbursed and Average Interest Rates
0.00
5.00
10.00
15.00
20.00
25.00
30.00
35.00
0.00 5.00 10.00 15.00 20.00 25.00 30.00
Average Loan Disbursed of an MFI, All Villages (in 1000 Taka)
Ave
rage
Loa
n In
tere
st R
ate
Cha
rged
ofa
n M
FI, A
ll Vi
llage
s (in
Pe
rcen
t)
average nominal interest rate charged. Large MFIs are providing lower average loan disbursed tied with smaller interest rates, while small MFIs are providing both categories: higher average loan amount tied with higher nominal interest rates and in some cases lower average loan amount tied with higher nominal interest rates (medium MFI categories are in between). The fact that different categories of combinations exist gives support for the claim that the market is actually a segmented market. We do not see a logical downward-sloping pattern between nominal interest rates (price) and amount of loan disbursed (quantity), since each MFI is charging same interest rate no matter the amount of loan disbursed, rather we see some MFI opt for lower segment (low price and low quantity) and some others opt for upper segment (high price and high quantity); and if opportunity arises, some opt for in-between (high price and low quantity)11. Since this market is segmented, customers would opt for any one of these two packages: for example, they can opt for a package of high loan amount and high interest rate, or they a package of low loan amount and low interest rate. Within the same MFI, customers are not allowed to exhibit downward-sloping pattern: interest rates are invariant with amount of loan within a specific MFI because of institutional restrictions. Section 6.2 Econometric Specification Section 6.1 specifies that we estimate a Tobit regression. This Tobit regression is for a kind of limited dependent variable such that it is roughly continuous over strictly positive values but is
11 The third category of combination of high price and low quantity, occasionally observed in the data and
in only a few cases, is not expected to last for long as competition increases.
20
zero for a nontrivial fraction of the population. Let y be a variable that is continuous over strictly positive values but that takes on zero with positive probability.
The Tobit model is defined as a latent variable model: y*= β0 + x β + u, u| x ~ Normal (0, σ2) …. …….. ………. ……….. …………………..(1) y = max (0, y*) …… …….. ……. …….. …….. …….. ……. …… …………………...(2)
The latent variable y* satisfies the classical linear model assumptions-- it has a normal, homoskedastic distribution with a linear conditional mean. From equation (2) we find that the observed variable y equals y* when y*≥0, but y=0 when y*<0. Since y* is normally distributed, y has a continuous distribution over strictly positive values (see Wooldridge (2000) and Greene (2000))12.
Based on discussion in Section 6.1, we propose the following specification for our model of market share of borrowed members: [Market share of borrowed members at village i by MFI j] = function of [{loan product characteristics of MFI j} + {loan provider characteristics of MFI j} + {village characteristics of village i}] ……. …….. …….. …….. ……… … (3)
In equation (3), the dependent variable is “market share of borrowed member in a village microcredit market in 2006”. Loan product characteristics can best be captured by a set of variables such as “average loan disbursed”, “loan interest rate” and “deposit interest rate”. Since average loan disbursed and loan interest rates can be considered as co-determined, we proceed with one of them, but not both. We thereby choose “average loan disbursed” and also a square term of “average loan disbursed”. MFIs can augment member shares in the market by providing larger loan amount, at the same time, this increase may not be linear throughout the entire range and we expect concave pattern to the curvature: MFIs can augment market shares by increasing average loan disbursed, but at a decreasing rate. Therefore expected sign of coefficient of average loan disbursed is positive and that of square of average loan disbursed is negative. Deposit interest rates are also included in this category, with expected positive sign for estimated coefficient. Loan provider characteristics include variables such as “size of MFI” (captured by dummies as “large” and “medium”, taking “small” as base) and “years of operations” (of the MFI in the village market). We take a square term of years of operation to capture curvature shape of the membership share graph with respect to MFI’s involvement in the local microcredit market. Being “large” and “medium” should help in gaining shares, since loan financing is easier with national-level MFIs and at the same time, they have gained considerable renown. With regards to loan product characteristics, there is a second set of variables which can also play some role in determining member market share, such as unique products of a MFI which few other MFI has matched in the market (i.e., loan for housing purposes and micro-enterprise loan). We do expect, providing these characteristics would help MFIs to gain in additional shares; however these gains need not be as prominent as direct gains from raising average loan size or deposit interest rates.
We proceed with following specification in Tobit regression: [market share of members of MFI j in village i, >0 to 1 if MFI j participates, 0=if not] = β0 + β1 [average loan disbursed by MFI j in village i] + β2 [square of average loan disbursed by MFI j in village i] + β3 [average deposit interest rates by MFI j in village i] + β4 [dummy for “large”, 1 if MFI j is a “large” MFI, otherwise 0] + β5 [dummy for “medium”, 1 if MFI j is a “medium” MFI, otherwise 0] + β6 [years of operation of MFI j in village i] + β7 [square of years of operation of MFI j in village i]
12 We use STATA version 10 for obtaining maximum likelihood estimates for Tobit model.
21
+ β8 [amount of total loan disbursed for housing purposes of MFI j in village i] + β9 [amount of total micro-enterprise loan disbursed in village i by MFI j] + ∑ βvill i [dummy for villages (a total of 22 dummies)] + error Section 6.3 Estimation Results Table 7 presents the regression estimation results. The Tobit specification incorporates the provision that not all MFIs operate in every single village micro credit market. In case a particular MFI does not participate, its’ share in the market for borrowed members is zero. The dependent variable is mktshr_mem (because of large number of observations at zero value, the mean value in data is small; it is 2.3% with a large standard deviation at 6.7%). The dummy independent variable large has a statistically significant coefficient; this is 0.051 with heteroskedasticity-robust standard error of 0.009 and p-value of 0.000. This implies that compared to the base case of a small MFI, a large MFI is estimated to have a 5.1% higher share of the village borrowed member market controlling for all other factors. We need to keep in mind that this region has been first targeted by large category MFIs and entry of small MFIs has been much later, thus there is still a statistically significant advantage of being a “large” MFI rather than being a “small” MFI. In contrast the dummy medium does not exhibit statistical significance, implying that the estimated gain from being a “medium” rather than a “small” one in terms of member share is not large. The value of the F-test for joint significant test of variables large and medium is 15.44 and p-value for the significance test is 0.000; this implies these variables are statistically jointly significant at 1% level. The second set of independent variables consists of yrsofop and yrsofopsq. We expect that as the time period of MFI participation grows in the market, so will grow the size of their respective client group through social networking among micro credit borrowers. Whereas a new MFI will find it difficult to get some borrowing members, an old MFI in a locality will have some reliable clients by the course of time. Nature of the micro credit product is such that relationships between client and provider firm is expected to last for a long time and is expected to create more and more opportunities for both sides as time progresses. Thus we expect a statistically significant positive sign for yrsofop and we keep a square term to check whether there is a quadratic pattern in this relationship. In the model estimation we find yrsofop to be statistically positively significant at 5% level, but yrsofopsq not to be significant; again we find joint statistical significance of these two variables together (the F-test value is 37.93 at p-value of 0.000). The estimated coefficient value for yrsofop is 0.006, thus implies that an additional year of operation in a village is estimated to increase share of borrowed members in the village for a typical MFI by 0.6%, and significant quadratic pattern does not exist. The third set of independent variables consists of avglndisbbyk, avglndisbbyksq and depint. Product characteristics terms such as average loan disbursed (in thousand taka) and deposit interest rates distinguish the micro credit product that is being offered by the MFI. We find average loan disbursed to be expectedly statistically positively significant with coefficient value at 0.027 and at p-value at 0.000. The square term of average loan disbursed is found to be and expectedly the sign of the coefficient is negative with value with very small value. The additional member market share that can be obtained by an additional 1,000 taka average loan size can be calculated as: ∆ mktshr_mem/ ∆ avglndisbbyk = 0.027 − 2× (0.001) × avglndisbbyk At mean value of avglndisbbyk (2.789), this amount is 0.021; therefore at mean value of average loan share an additional Tk. 1,000 average loan amount would increase member share of a typical MFI by 2.1% (there is a concave shape to it, so the slope is positive but increasing at a decreasing rate), holding all other variables constant. The joint significance test also gives evidence that these two terms are jointly statistically significant. The estimated coefficient for deposit interest
22
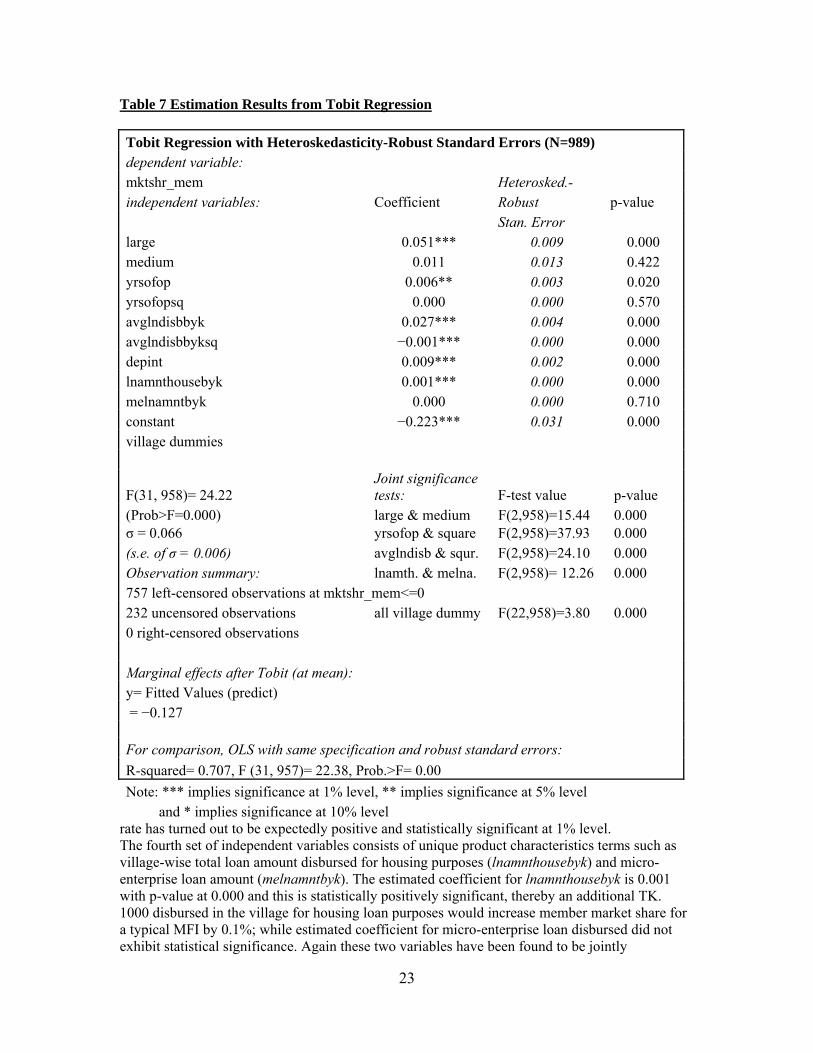
Table 7 Estimation Results from Tobit Regression Tobit Regression with Heteroskedasticity-Robust Standard Errors (N=989) dependent variable: mktshr_mem Heterosked.- independent variables: Coefficient Robust p-value Stan. Error large 0.051*** 0.009 0.000 medium 0.011 0.013 0.422 yrsofop 0.006** 0.003 0.020 yrsofopsq 0.000 0.000 0.570 avglndisbbyk 0.027*** 0.004 0.000 avglndisbbyksq −0.001*** 0.000 0.000 depint 0.009*** 0.002 0.000 lnamnthousebyk 0.001*** 0.000 0.000 melnamntbyk 0.000 0.000 0.710 constant −0.223*** 0.031 0.000 village dummies
F(31, 958)= 24.22 Joint significance tests: F-test value p-value
(Prob>F=0.000) large & medium F(2,958)=15.44 0.000 σ = 0.066 yrsofop & square F(2,958)=37.93 0.000 (s.e. of σ = 0.006) avglndisb & squr. F(2,958)=24.10 0.000 Observation summary: lnamth. & melna. F(2,958)= 12.26 0.000 757 left-censored observations at mktshr_mem<=0 232 uncensored observations all village dummy F(22,958)=3.80 0.000 0 right-censored observations Marginal effects after Tobit (at mean): y= Fitted Values (predict) = −0.127 For comparison, OLS with same specification and robust standard errors: R-squared= 0.707, F (31, 957)= 22.38, Prob.>F= 0.00 Note: *** implies significance at 1% level, ** implies significance at 5% level and * implies significance at 10% level
rate has turned out to be expectedly positive and statistically significant at 1% level. The fourth set of independent variables consists of unique product characteristics terms such as village-wise total loan amount disbursed for housing purposes (lnamnthousebyk) and micro-enterprise loan amount (melnamntbyk). The estimated coefficient for lnamnthousebyk is 0.001 with p-value at 0.000 and this is statistically positively significant, thereby an additional TK. 1000 disbursed in the village for housing loan purposes would increase member market share for a typical MFI by 0.1%; while estimated coefficient for micro-enterprise loan disbursed did not exhibit statistical significance. Again these two variables have been found to be jointly
23
statistically significant. Thus there is a scope for MFIs to increase member share by bringing in innovative product designs; interesting point is that actually housing loans are close to or even smaller than an average loan, but simply the loan sanction for this purpose has created difference in member shares of the market. The fifth set of independent variables is the village dummies (not reported). For some villages the p-values of estimated coefficient for dummies are less than 0.1, and for some others this is higher. If we conduct a joint significance test of all village dummies, we find that these dummies are jointly significant; village-specific characteristics are overall important in determination of MFI member shares. Section 7 Conclusion The discussion of a particular area for an in depth investigation for features of microcredit market is the central theme of the present paper. Through this exercise we wanted to observe the directions to which the microfinance industry in Bangladesh is heading for. Because of selection of a seasoned place for microcredit, actually this need not be taken for being representative for entire Bangladesh. The survey area is actually one old place for microcredit, and what we observe here may at most be taken as indicative of future directions of entire Bangladesh. While keeping these considerations, we conclude with some notes on the microcredit market, and these are as follows. Firstly, large and small MFIs are competing side by side in most of the places, not necessarily eliminating each other. Since the start of the 2000s, near monopoly of early years of only a few leading national-level MFIs have now been replaced by a plethora of MFIs working in the microcredit market. One feature of the market is that many new and small MFIs have started their operations very recently and competing successfully with more experienced MFIs. Secondly, MFIs are competing in some selected markets aggressively with instruments at their disposal, such as large loan offer, higher deposit interest rate, loans more responsive to local specifics, loans with unique characteristics such as housing and micro-enterprise loans, household overlapping, membership overlapping; while these same MFIs are not competing aggressively in some other markets-- this behavior pattern is based on decisions made in the respective head offices, financial strength and staff capacity of the MFIs, characteristics of the market, such as economic prospect and low distance from important locations, presence of other MFIs, etc. There is a tendency among MFIs to concentrate in some already proven territories (such as regions with overall satisfactory economic prospects or well-developed communication networks), whereas the reverse is true for economically backward and/or remote areas. Thirdly, overlapping is one instrument of competition in the microcredit market; regions of more intense competition are typically the same regions with more overlapping cases. Therefore the issue of overlapping needs to be analyzed within the broader framework of all the instruments of market competition in the microcredit market. Fourthly, if the geographic concentration into most economically prospective areas by the MFIs is found to be widespread throughout the whole country, there is a cause of concern for poverty alleviation objectives of microcredit movement. This would imply that economically backward regions would be intentionally overlooked by the MFIs in their desperate search for being competitive in the market (regional and/or national).
24
References Carlton, Dennis W. and Jeffrey M. Perloff (2000). “Modern Industrial Organization”, Addison-Wesley Longman, Inc., New York Cull, Robert, Asli Demirguc-Kunt, and Jonathan Morduch (2009). “Microfinance Meets the Market”, Journal of Economic Perspectives, Vol. 23, No. 1, Winter 2009, pp. 167–92 Iftekhar A. Chaudhury and Imran Matin (2002). “Dimensions and Dynamics of Microfinance Membership Overlap -- A Micro Study from Bangladesh”, Small Enterprise Development, Vol.13, No.2, June 2002 Matin, Imran (undated). “CGAP Note Book 1: Dimensions and Dynamics of MFI Competition in Bangladesh”, Research Brief, Consultative Group to Assist the Poor (CGAP), the World Bank, Washington D.C. Meyer, Richard L.(2002). “The Demand for Flexible Microfinance Products: Lessons from Bangladesh”, Journal of International Development, Vol. 14, pp. 351-368 Microcredit Regulatory Authority (2008).“NGO-MFIs in Bangladesh: Vol. III, June 2006”, Microcredit Regulatory Authority (MRA), Dhaka Roodman and Qureshi (2006). “Microfinance as Business”, Unpublished Working Paper, Center for Global Development, Washington D.C., November 2006 Yunus, Muhammad (2007). “Remarks by Muhammad Yunus, Managing Director, Grameen Bank”, Microcredit Summit E-News, Vol. 5, No. 1, July 2007, as cited in Cull, Kunt and Morduch (2009) Zaman, Hassan (2004). “The Scaling-Up of Microfinance in Bangladesh: Determinants, Impact, and Lessons”, World Bank Policy Research Working Paper, 3398, September 2004, The World Bank, Washington D.C. Charitonenko, Stephinie and S. M. Rahman (2002). “Commercialization of Microfinance: Bangladesh”, Asian Development Bank, Manila, September 2002 Uddin, Jashim (undated). “Overlapping -- a Crucial Issue of Microcredit”, Palli Karma Shahayak Foundation (PKSF), Dhaka Wooldridge, Jeffrey M. (2000). “Introductory Econometrics: A Modern Approach”, South-Western College Publishing, The Thomson Learning, United States Greene, William H. (2000). “Econometric Analysis”, Fourth Edition, Prentice Hall, Upper Saddle River, New Jersey
25

Annex
26
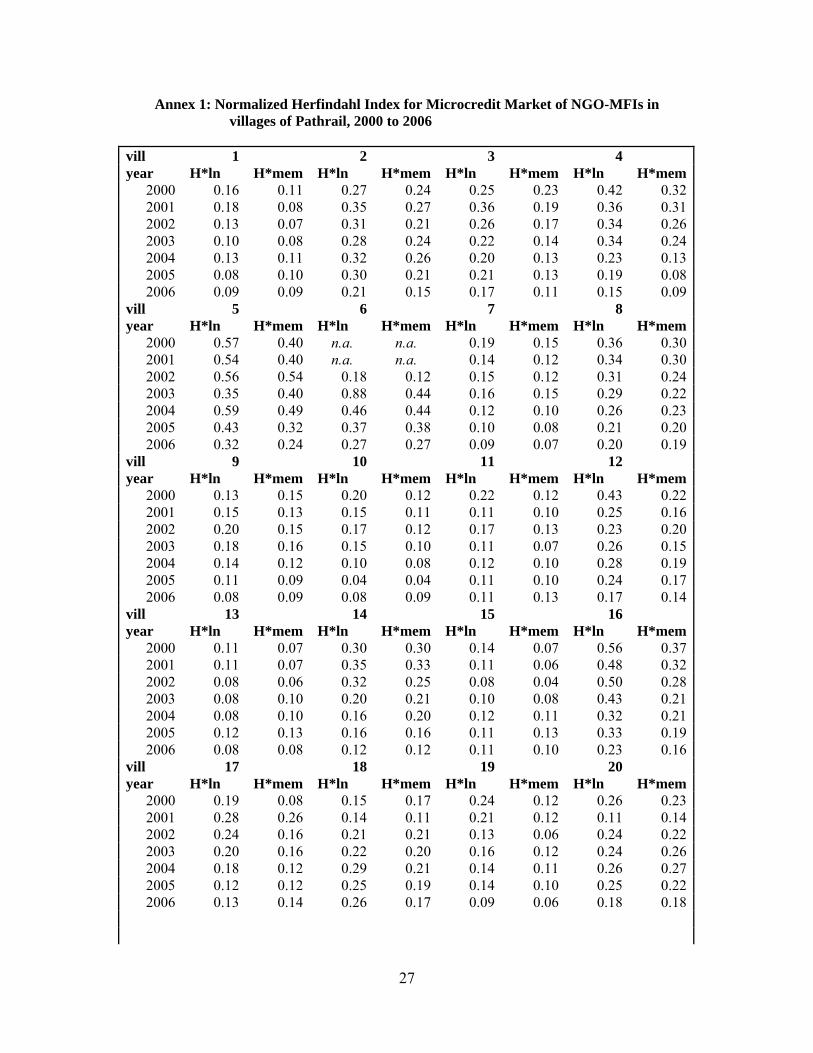
Annex 1: Normalized Herfindahl Index for Microcredit Market of NGO-MFIs in villages of Pathrail, 2000 to 2006 vill 1 2 3 4 year H*ln H*mem H*ln H*mem H*ln H*mem H*ln H*mem
2000 0.16 0.11 0.27 0.24 0.25 0.23 0.42 0.322001 0.18 0.08 0.35 0.27 0.36 0.19 0.36 0.312002 0.13 0.07 0.31 0.21 0.26 0.17 0.34 0.262003 0.10 0.08 0.28 0.24 0.22 0.14 0.34 0.242004 0.13 0.11 0.32 0.26 0.20 0.13 0.23 0.132005 0.08 0.10 0.30 0.21 0.21 0.13 0.19 0.082006 0.09 0.09 0.21 0.15 0.17 0.11 0.15 0.09
vill 5 6 7 8 year H*ln H*mem H*ln H*mem H*ln H*mem H*ln H*mem
2000 0.57 0.40 n.a. n.a. 0.19 0.15 0.36 0.302001 0.54 0.40 n.a. n.a. 0.14 0.12 0.34 0.302002 0.56 0.54 0.18 0.12 0.15 0.12 0.31 0.242003 0.35 0.40 0.88 0.44 0.16 0.15 0.29 0.222004 0.59 0.49 0.46 0.44 0.12 0.10 0.26 0.232005 0.43 0.32 0.37 0.38 0.10 0.08 0.21 0.202006 0.32 0.24 0.27 0.27 0.09 0.07 0.20 0.19
vill 9 10 11 12 year H*ln H*mem H*ln H*mem H*ln H*mem H*ln H*mem
2000 0.13 0.15 0.20 0.12 0.22 0.12 0.43 0.222001 0.15 0.13 0.15 0.11 0.11 0.10 0.25 0.162002 0.20 0.15 0.17 0.12 0.17 0.13 0.23 0.202003 0.18 0.16 0.15 0.10 0.11 0.07 0.26 0.152004 0.14 0.12 0.10 0.08 0.12 0.10 0.28 0.192005 0.11 0.09 0.04 0.04 0.11 0.10 0.24 0.172006 0.08 0.09 0.08 0.09 0.11 0.13 0.17 0.14
vill 13 14 15 16 year H*ln H*mem H*ln H*mem H*ln H*mem H*ln H*mem
2000 0.11 0.07 0.30 0.30 0.14 0.07 0.56 0.372001 0.11 0.07 0.35 0.33 0.11 0.06 0.48 0.322002 0.08 0.06 0.32 0.25 0.08 0.04 0.50 0.282003 0.08 0.10 0.20 0.21 0.10 0.08 0.43 0.212004 0.08 0.10 0.16 0.20 0.12 0.11 0.32 0.212005 0.12 0.13 0.16 0.16 0.11 0.13 0.33 0.192006 0.08 0.08 0.12 0.12 0.11 0.10 0.23 0.16
vill 17 18 19 20 year H*ln H*mem H*ln H*mem H*ln H*mem H*ln H*mem
2000 0.19 0.08 0.15 0.17 0.24 0.12 0.26 0.232001 0.28 0.26 0.14 0.11 0.21 0.12 0.11 0.142002 0.24 0.16 0.21 0.21 0.13 0.06 0.24 0.222003 0.20 0.16 0.22 0.20 0.16 0.12 0.24 0.262004 0.18 0.12 0.29 0.21 0.14 0.11 0.26 0.272005 0.12 0.12 0.25 0.19 0.14 0.10 0.25 0.222006 0.13 0.14 0.26 0.17 0.09 0.06 0.18 0.18
27
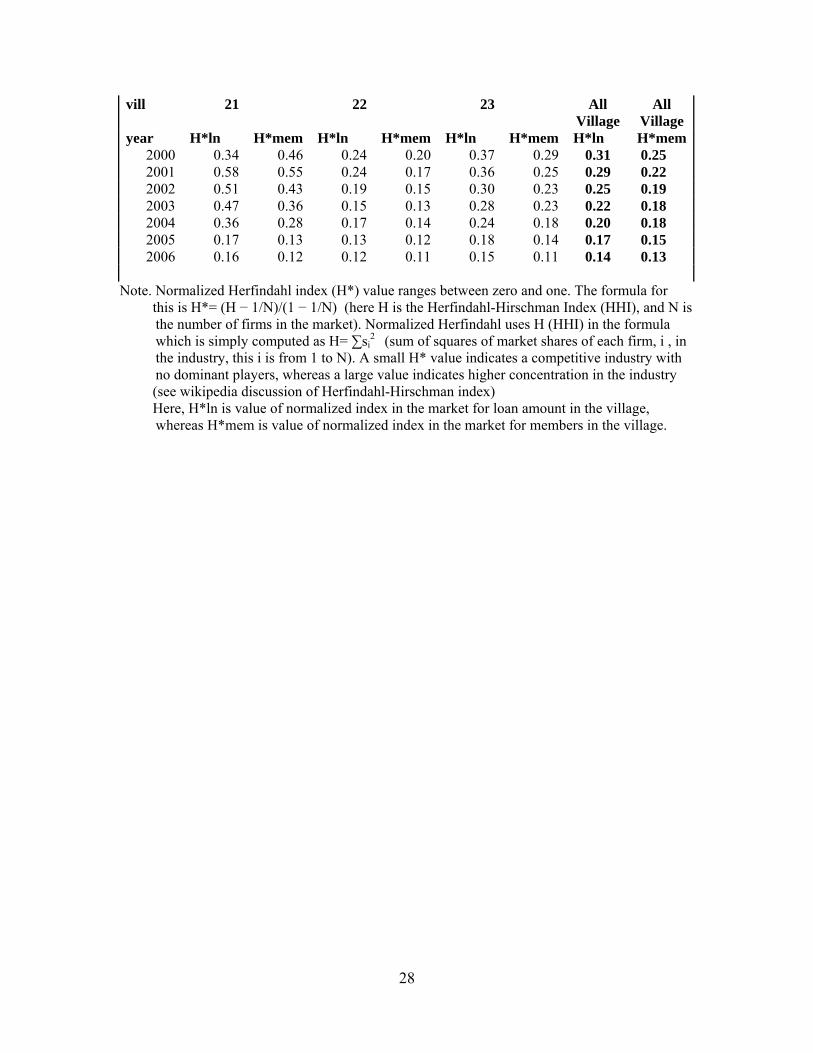
vill 21 22 23 All Village
All Village
year H*ln H*mem H*ln H*mem H*ln H*mem H*ln H*mem2000 0.34 0.46 0.24 0.20 0.37 0.29 0.31 0.25 2001 0.58 0.55 0.24 0.17 0.36 0.25 0.29 0.22 2002 0.51 0.43 0.19 0.15 0.30 0.23 0.25 0.19 2003 0.47 0.36 0.15 0.13 0.28 0.23 0.22 0.18 2004 0.36 0.28 0.17 0.14 0.24 0.18 0.20 0.18 2005 0.17 0.13 0.13 0.12 0.18 0.14 0.17 0.15 2006 0.16 0.12 0.12 0.11 0.15 0.11 0.14 0.13
Note. Normalized Herfindahl index (H*) value ranges between zero and one. The formula for this is H*= (H − 1/N)/(1 − 1/N) (here H is the Herfindahl-Hirschman Index (HHI), and N is
the number of firms in the market). Normalized Herfindahl uses H (HHI) in the formula which is simply computed as H= ∑si
2 (sum of squares of market shares of each firm, i , in the industry, this i is from 1 to N). A small H* value indicates a competitive industry with no dominant players, whereas a large value indicates higher concentration in the industry
(see wikipedia discussion of Herfindahl-Hirschman index) Here, H*ln is value of normalized index in the market for loan amount in the village,
whereas H*mem is value of normalized index in the market for members in the village.
28
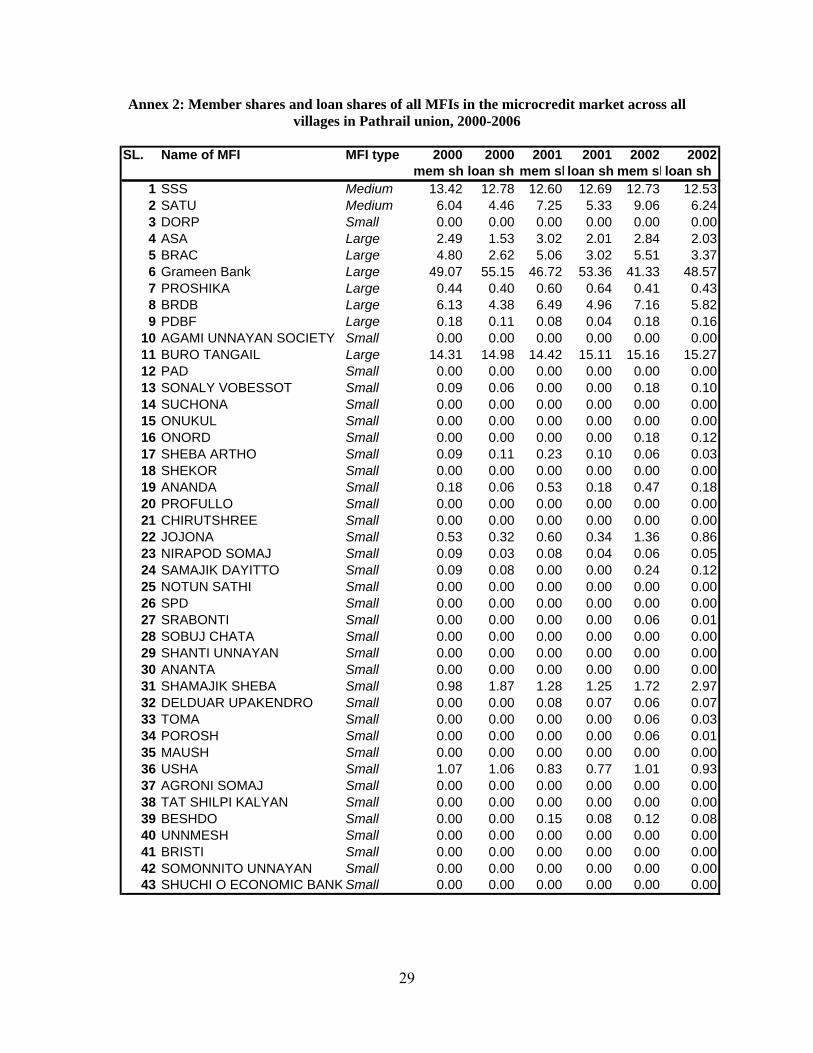
Annex 2: Member shares and loan shares of all MFIs in the microcredit market across all villages in Pathrail union, 2000-2006
SL. Name of MFI MFI type 2000 2000 2001 2001 2002 2002
mem sh loan sh mem shloan sh mem shloan sh1 SSS Medium 13.42 12.78 12.60 12.69 12.73 12.532 SATU Medium 6.04 4.46 7.25 5.33 9.06 6.243 DORP Small 0.00 0.00 0.00 0.00 0.00 0.004 ASA Large 2.49 1.53 3.02 2.01 2.84 2.035 BRAC Large 4.80 2.62 5.06 3.02 5.51 3.376 Grameen Bank Large 49.07 55.15 46.72 53.36 41.33 48.577 PROSHIKA Large 0.44 0.40 0.60 0.64 0.41 0.438 BRDB Large 6.13 4.38 6.49 4.96 7.16 5.829 PDBF Large 0.18 0.11 0.08 0.04 0.18 0.16
10 AGAMI UNNAYAN SOCIETY Small 0.00 0.00 0.00 0.00 0.00 0.0011 BURO TANGAIL Large 14.31 14.98 14.42 15.11 15.16 15.2712 PAD Small 0.00 0.00 0.00 0.00 0.00 0.0013 SONALY VOBESSOT Small 0.09 0.06 0.00 0.00 0.18 0.1014 SUCHONA Small 0.00 0.00 0.00 0.00 0.00 0.0015 ONUKUL Small 0.00 0.00 0.00 0.00 0.00 0.0016 ONORD Small 0.00 0.00 0.00 0.00 0.18 0.1217 SHEBA ARTHO Small 0.09 0.11 0.23 0.10 0.06 0.0318 SHEKOR Small 0.00 0.00 0.00 0.00 0.00 0.0019 ANANDA Small 0.18 0.06 0.53 0.18 0.47 0.1820 PROFULLO Small 0.00 0.00 0.00 0.00 0.00 0.0021 CHIRUTSHREE Small 0.00 0.00 0.00 0.00 0.00 0.0022 JOJONA Small 0.53 0.32 0.60 0.34 1.36 0.8623 NIRAPOD SOMAJ Small 0.09 0.03 0.08 0.04 0.06 0.0524 SAMAJIK DAYITTO Small 0.09 0.08 0.00 0.00 0.24 0.1225 NOTUN SATHI Small 0.00 0.00 0.00 0.00 0.00 0.0026 SPD Small 0.00 0.00 0.00 0.00 0.00 0.0027 SRABONTI Small 0.00 0.00 0.00 0.00 0.06 0.0128 SOBUJ CHATA Small 0.00 0.00 0.00 0.00 0.00 0.0029 SHANTI UNNAYAN Small 0.00 0.00 0.00 0.00 0.00 0.0030 ANANTA Small 0.00 0.00 0.00 0.00 0.00 0.0031 SHAMAJIK SHEBA Small 0.98 1.87 1.28 1.25 1.72 2.9732 DELDUAR UPAKENDRO Small 0.00 0.00 0.08 0.07 0.06 0.0733 TOMA Small 0.00 0.00 0.00 0.00 0.06 0.0334 POROSH Small 0.00 0.00 0.00 0.00 0.06 0.0135 MAUSH Small 0.00 0.00 0.00 0.00 0.00 0.0036 USHA Small 1.07 1.06 0.83 0.77 1.01 0.9337 AGRONI SOMAJ Small 0.00 0.00 0.00 0.00 0.00 0.0038 TAT SHILPI KALYAN Small 0.00 0.00 0.00 0.00 0.00 0.0039 BESHDO Small 0.00 0.00 0.15 0.08 0.12 0.0840 UNNMESH Small 0.00 0.00 0.00 0.00 0.00 0.0041 BRISTI Small 0.00 0.00 0.00 0.00 0.00 0.0042 SOMONNITO UNNAYAN Small 0.00 0.00 0.00 0.00 0.00 0.0043 SHUCHI O ECONOMIC BANK Small 0.00 0.00 0.00 0.00 0.00 0.00
29
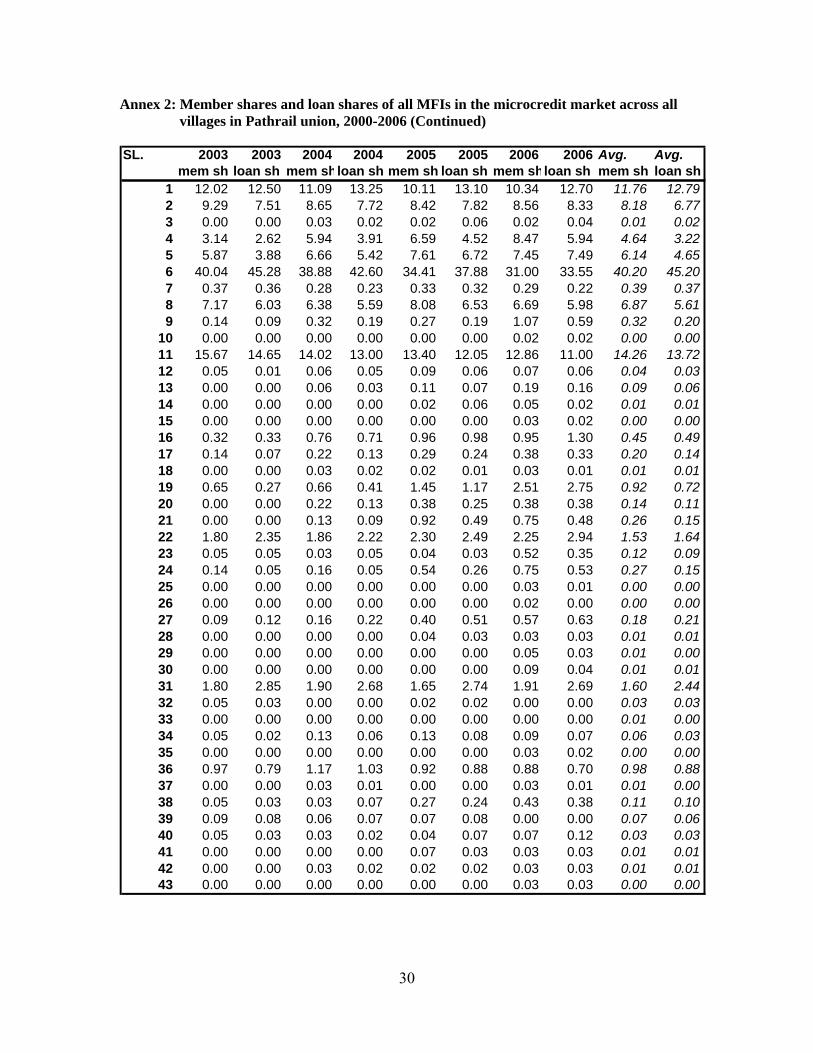
Annex 2: Member shares and loan shares of all MFIs in the microcredit market across all villages in Pathrail union, 2000-2006 (Continued)
SL. 2003 2003 2004 2004 2005 2005 2006 2006 Avg. Avg.
mem sh loan sh mem shloan sh mem sh loan sh mem shloan sh mem sh loan sh1 12.02 12.50 11.09 13.25 10.11 13.10 10.34 12.70 11.76 12.792 9.29 7.51 8.65 7.72 8.42 7.82 8.56 8.33 8.18 6.773 0.00 0.00 0.03 0.02 0.02 0.06 0.02 0.04 0.01 0.024 3.14 2.62 5.94 3.91 6.59 4.52 8.47 5.94 4.64 3.225 5.87 3.88 6.66 5.42 7.61 6.72 7.45 7.49 6.14 4.656 40.04 45.28 38.88 42.60 34.41 37.88 31.00 33.55 40.20 45.207 0.37 0.36 0.28 0.23 0.33 0.32 0.29 0.22 0.39 0.378 7.17 6.03 6.38 5.59 8.08 6.53 6.69 5.98 6.87 5.619 0.14 0.09 0.32 0.19 0.27 0.19 1.07 0.59 0.32 0.20
10 0.00 0.00 0.00 0.00 0.00 0.00 0.02 0.02 0.00 0.0011 15.67 14.65 14.02 13.00 13.40 12.05 12.86 11.00 14.26 13.7212 0.05 0.01 0.06 0.05 0.09 0.06 0.07 0.06 0.04 0.0313 0.00 0.00 0.06 0.03 0.11 0.07 0.19 0.16 0.09 0.0614 0.00 0.00 0.00 0.00 0.02 0.06 0.05 0.02 0.01 0.0115 0.00 0.00 0.00 0.00 0.00 0.00 0.03 0.02 0.00 0.0016 0.32 0.33 0.76 0.71 0.96 0.98 0.95 1.30 0.45 0.4917 0.14 0.07 0.22 0.13 0.29 0.24 0.38 0.33 0.20 0.1418 0.00 0.00 0.03 0.02 0.02 0.01 0.03 0.01 0.01 0.0119 0.65 0.27 0.66 0.41 1.45 1.17 2.51 2.75 0.92 0.7220 0.00 0.00 0.22 0.13 0.38 0.25 0.38 0.38 0.14 0.1121 0.00 0.00 0.13 0.09 0.92 0.49 0.75 0.48 0.26 0.1522 1.80 2.35 1.86 2.22 2.30 2.49 2.25 2.94 1.53 1.6423 0.05 0.05 0.03 0.05 0.04 0.03 0.52 0.35 0.12 0.0924 0.14 0.05 0.16 0.05 0.54 0.26 0.75 0.53 0.27 0.1525 0.00 0.00 0.00 0.00 0.00 0.00 0.03 0.01 0.00 0.0026 0.00 0.00 0.00 0.00 0.00 0.00 0.02 0.00 0.00 0.0027 0.09 0.12 0.16 0.22 0.40 0.51 0.57 0.63 0.18 0.2128 0.00 0.00 0.00 0.00 0.04 0.03 0.03 0.03 0.01 0.0129 0.00 0.00 0.00 0.00 0.00 0.00 0.05 0.03 0.01 0.0030 0.00 0.00 0.00 0.00 0.00 0.00 0.09 0.04 0.01 0.0131 1.80 2.85 1.90 2.68 1.65 2.74 1.91 2.69 1.60 2.4432 0.05 0.03 0.00 0.00 0.02 0.02 0.00 0.00 0.03 0.0333 0.00 0.00 0.00 0.00 0.00 0.00 0.00 0.00 0.01 0.0034 0.05 0.02 0.13 0.06 0.13 0.08 0.09 0.07 0.06 0.0335 0.00 0.00 0.00 0.00 0.00 0.00 0.03 0.02 0.00 0.0036 0.97 0.79 1.17 1.03 0.92 0.88 0.88 0.70 0.98 0.8837 0.00 0.00 0.03 0.01 0.00 0.00 0.03 0.01 0.01 0.0038 0.05 0.03 0.03 0.07 0.27 0.24 0.43 0.38 0.11 0.1039 0.09 0.08 0.06 0.07 0.07 0.08 0.00 0.00 0.07 0.0640 0.05 0.03 0.03 0.02 0.04 0.07 0.07 0.12 0.03 0.0341 0.00 0.00 0.00 0.00 0.07 0.03 0.03 0.03 0.01 0.0142 0.00 0.00 0.03 0.02 0.02 0.02 0.03 0.03 0.01 0.0143 0.00 0.00 0.00 0.00 0.00 0.00 0.03 0.03 0.00 0.00
30
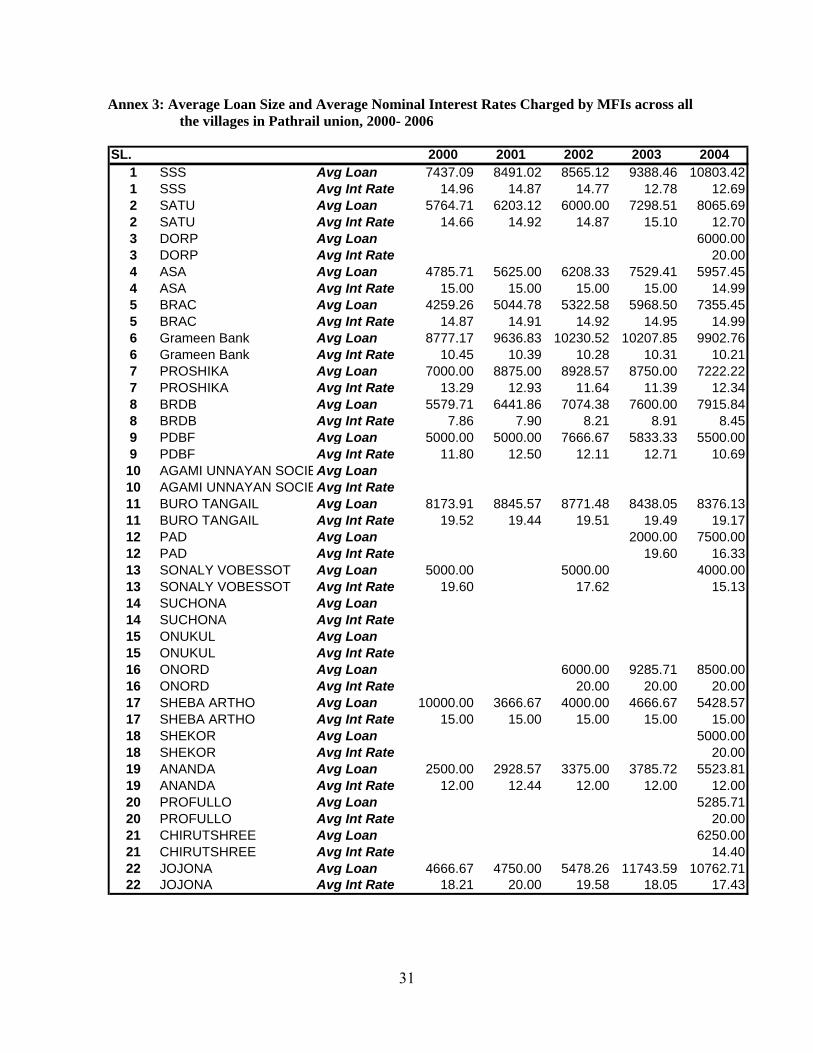
Annex 3: Average Loan Size and Average Nominal Interest Rates Charged by MFIs across all the villages in Pathrail union, 2000- 2006
SL. 2000 2001 2002 2003 2004
1 SSS Avg Loan 7437.09 8491.02 8565.12 9388.46 10803.421 SSS Avg Int Rate 14.96 14.87 14.77 12.78 12.692 SATU Avg Loan 5764.71 6203.12 6000.00 7298.51 8065.692 SATU Avg Int Rate 14.66 14.92 14.87 15.10 12.703 DORP Avg Loan 6000.003 DORP Avg Int Rate 20.004 ASA Avg Loan 4785.71 5625.00 6208.33 7529.41 5957.454 ASA Avg Int Rate 15.00 15.00 15.00 15.00 14.995 BRAC Avg Loan 4259.26 5044.78 5322.58 5968.50 7355.455 BRAC Avg Int Rate 14.87 14.91 14.92 14.95 14.996 Grameen Bank Avg Loan 8777.17 9636.83 10230.52 10207.85 9902.766 Grameen Bank Avg Int Rate 10.45 10.39 10.28 10.31 10.217 PROSHIKA Avg Loan 7000.00 8875.00 8928.57 8750.00 7222.227 PROSHIKA Avg Int Rate 13.29 12.93 11.64 11.39 12.348 BRDB Avg Loan 5579.71 6441.86 7074.38 7600.00 7915.848 BRDB Avg Int Rate 7.86 7.90 8.21 8.91 8.459 PDBF Avg Loan 5000.00 5000.00 7666.67 5833.33 5500.009 PDBF Avg Int Rate 11.80 12.50 12.11 12.71 10.69
10 AGAMI UNNAYAN SOCIEAvg Loan10 AGAMI UNNAYAN SOCIEAvg Int Rate11 BURO TANGAIL Avg Loan 8173.91 8845.57 8771.48 8438.05 8376.1311 BURO TANGAIL Avg Int Rate 19.52 19.44 19.51 19.49 19.1712 PAD Avg Loan 2000.00 7500.0012 PAD Avg Int Rate 19.60 16.3313 SONALY VOBESSOT Avg Loan 5000.00 5000.00 4000.0013 SONALY VOBESSOT Avg Int Rate 19.60 17.62 15.1314 SUCHONA Avg Loan14 SUCHONA Avg Int Rate15 ONUKUL Avg Loan15 ONUKUL Avg Int Rate16 ONORD Avg Loan 6000.00 9285.71 8500.0016 ONORD Avg Int Rate 20.00 20.00 20.0017 SHEBA ARTHO Avg Loan 10000.00 3666.67 4000.00 4666.67 5428.5717 SHEBA ARTHO Avg Int Rate 15.00 15.00 15.00 15.00 15.0018 SHEKOR Avg Loan 5000.0018 SHEKOR Avg Int Rate 20.0019 ANANDA Avg Loan 2500.00 2928.57 3375.00 3785.72 5523.8119 ANANDA Avg Int Rate 12.00 12.44 12.00 12.00 12.0020 PROFULLO Avg Loan 5285.7120 PROFULLO Avg Int Rate 20.0021 CHIRUTSHREE Avg Loan 6250.0021 CHIRUTSHREE Avg Int Rate 14.4022 JOJONA Avg Loan 4666.67 4750.00 5478.26 11743.59 10762.7122 JOJONA Avg Int Rate 18.21 20.00 19.58 18.05 17.43
31

Annex 3: Average Loan Size and Average Nominal Interest Rates Charged by MFIs across all the villages in Pathrail union, 2000- 2006 (Continued)
SL. 2005 2006 Mean Comments
1 Avg Loa 12996.69 13410.18 8886.62 Sharply increasing1 Avg Int R 12.70 12.49 12.03 Falling2 Avg Loa 9318.83 10634.41 6660.91 Sharply increasing2 Avg Int R 12.59 12.67 12.44 Falling3 Avg Loa 25000.00 25000.00 14000.75 Entry year was low amount, then very high lev3 Avg Int R 20.00 20.00 15.75 No fluctuations4 Avg Loa 6881.36 7660.53 5581.47 Increasing4 Avg Int R 14.76 14.79 13.57 Stable, slight fall in later years5 Avg Loa 8853.37 10986.28 5974.40 Sharply increasing5 Avg Int R 14.93 14.83 13.67 Stable6 Avg Loa 11045.09 11826.60 8954.10 Gradual increase6 Avg Int R 10.41 10.21 9.78 Stable, slight fall in later years7 Avg Loa 9666.67 8176.47 7328.24 Overall increasing trend, with fluctuations7 Avg Int R 13.67 13.68 11.99 Fluctuating tendency8 Avg Loa 8100.83 9773.32 6561.74 Increasing8 Avg Int R 8.57 8.62 8.32 Increasing, with fluctuations9 Avg Loa 7083.33 5983.87 5259.52 Fluctuations9 Avg Int R 10.27 11.16 11.28 Fluctuations10 Avg Loan 10000.00 5005.00 Observed once10 Avg Int Rate 12.50 11.25 Observed once11 Avg Loa 9027.50 9344.88 7623.57 Fluctuations, upward tendency in later years11 Avg Int R 15.23 15.02 17.30 Fluctuations, downward tendency in later year12 Avg Loa 6750.00 9750.00 5202.40 Sharply increasing12 Avg Int R 16.74 16.88 16.31 Falling13 Avg Loa 6400.00 9181.82 4932.47 Upward tendency in later years13 Avg Int R 15.53 16.70 16.26 Upward tendency in later years14 Avg Loa 25000.00 4000.00 9671.33 Fluctuations14 Avg Int R 3.96 15.00 10.99 Fluctuations15 Avg Loan 5000.00 2507.50 Observed once15 Avg Int Rate 15.00 15.00 Observed once16 Avg Loa 10232.56 14945.46 8163.29 Sharply increasing16 Avg Int R 19.93 19.95 19.31 Stable17 Avg Loa 8461.54 9318.18 5694.83 Fluctuations17 Avg Int R 15.00 15.00 15.25 Stable18 Avg Loa 4500.00 3300.00 3204.50 Falling18 Avg Int R 20.00 20.00 19.50 Stable19 Avg Loa 8084.62 11958.62 4771.92 Sharply increasing19 Avg Int R 12.03 12.07 12.94 Stable20 Avg Loa 6588.24 10818.18 5678.03 Sharply increasing20 Avg Int R 20.00 19.77 19.94 Stable21 Avg Loa 5414.63 7069.77 4688.85 Fluctuations21 Avg Int R 14.18 14.03 15.90 Falling22 Avg Loa 10883.49 14238.46 7818.15 Sharp increases, with fluctuations22 Avg Int R 15.17 14.87 18.16 Fluctuations
32
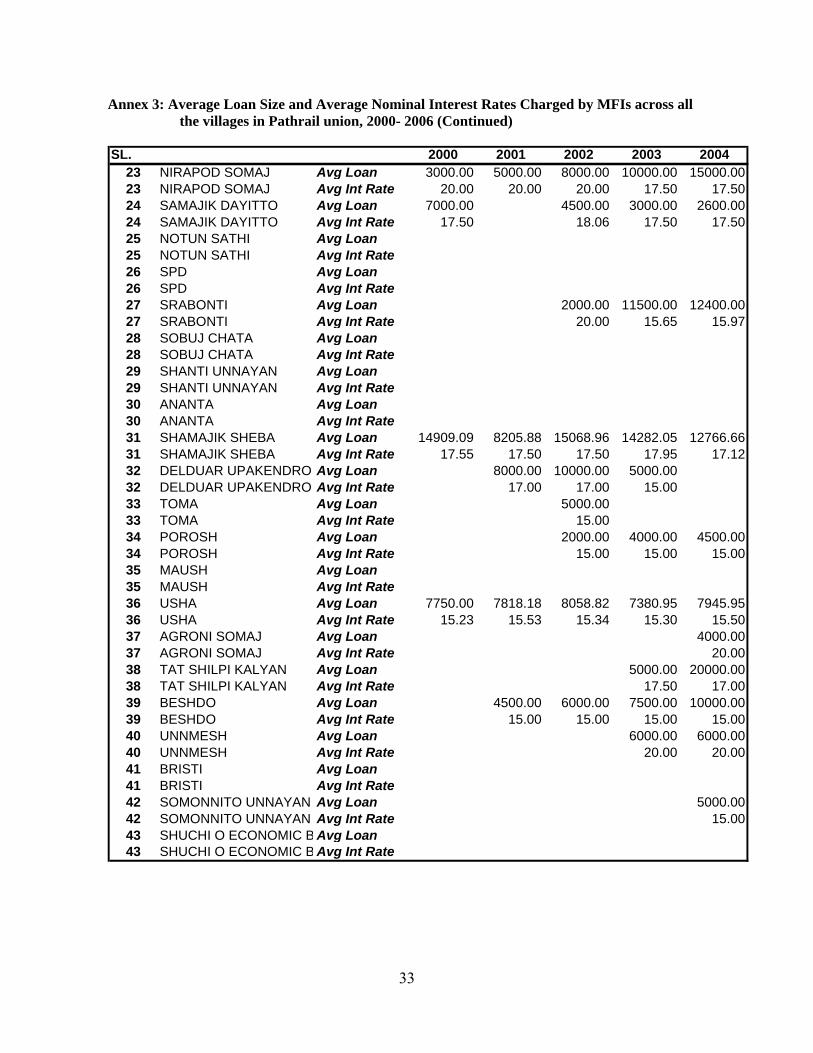
Annex 3: Average Loan Size and Average Nominal Interest Rates Charged by MFIs across all the villages in Pathrail union, 2000- 2006 (Continued)
SL. 2000 2001 2002 2003 2004
23 NIRAPOD SOMAJ Avg Loan 3000.00 5000.00 8000.00 10000.00 15000.0023 NIRAPOD SOMAJ Avg Int Rate 20.00 20.00 20.00 17.50 17.5024 SAMAJIK DAYITTO Avg Loan 7000.00 4500.00 3000.00 2600.0024 SAMAJIK DAYITTO Avg Int Rate 17.50 18.06 17.50 17.5025 NOTUN SATHI Avg Loan25 NOTUN SATHI Avg Int Rate26 SPD Avg Loan26 SPD Avg Int Rate27 SRABONTI Avg Loan 2000.00 11500.00 12400.0027 SRABONTI Avg Int Rate 20.00 15.65 15.9728 SOBUJ CHATA Avg Loan28 SOBUJ CHATA Avg Int Rate29 SHANTI UNNAYAN Avg Loan29 SHANTI UNNAYAN Avg Int Rate30 ANANTA Avg Loan30 ANANTA Avg Int Rate31 SHAMAJIK SHEBA Avg Loan 14909.09 8205.88 15068.96 14282.05 12766.6631 SHAMAJIK SHEBA Avg Int Rate 17.55 17.50 17.50 17.95 17.1232 DELDUAR UPAKENDRO Avg Loan 8000.00 10000.00 5000.0032 DELDUAR UPAKENDRO Avg Int Rate 17.00 17.00 15.0033 TOMA Avg Loan 5000.0033 TOMA Avg Int Rate 15.0034 POROSH Avg Loan 2000.00 4000.00 4500.0034 POROSH Avg Int Rate 15.00 15.00 15.0035 MAUSH Avg Loan35 MAUSH Avg Int Rate36 USHA Avg Loan 7750.00 7818.18 8058.82 7380.95 7945.9536 USHA Avg Int Rate 15.23 15.53 15.34 15.30 15.5037 AGRONI SOMAJ Avg Loan 4000.0037 AGRONI SOMAJ Avg Int Rate 20.0038 TAT SHILPI KALYAN Avg Loan 5000.00 20000.0038 TAT SHILPI KALYAN Avg Int Rate 17.50 17.0039 BESHDO Avg Loan 4500.00 6000.00 7500.00 10000.0039 BESHDO Avg Int Rate 15.00 15.00 15.00 15.0040 UNNMESH Avg Loan 6000.00 6000.0040 UNNMESH Avg Int Rate 20.00 20.0041 BRISTI Avg Loan41 BRISTI Avg Int Rate42 SOMONNITO UNNAYAN Avg Loan 5000.0042 SOMONNITO UNNAYAN Avg Int Rate 15.0043 SHUCHI O ECONOMIC B Avg Loan43 SHUCHI O ECONOMIC B Avg Int Rate
33
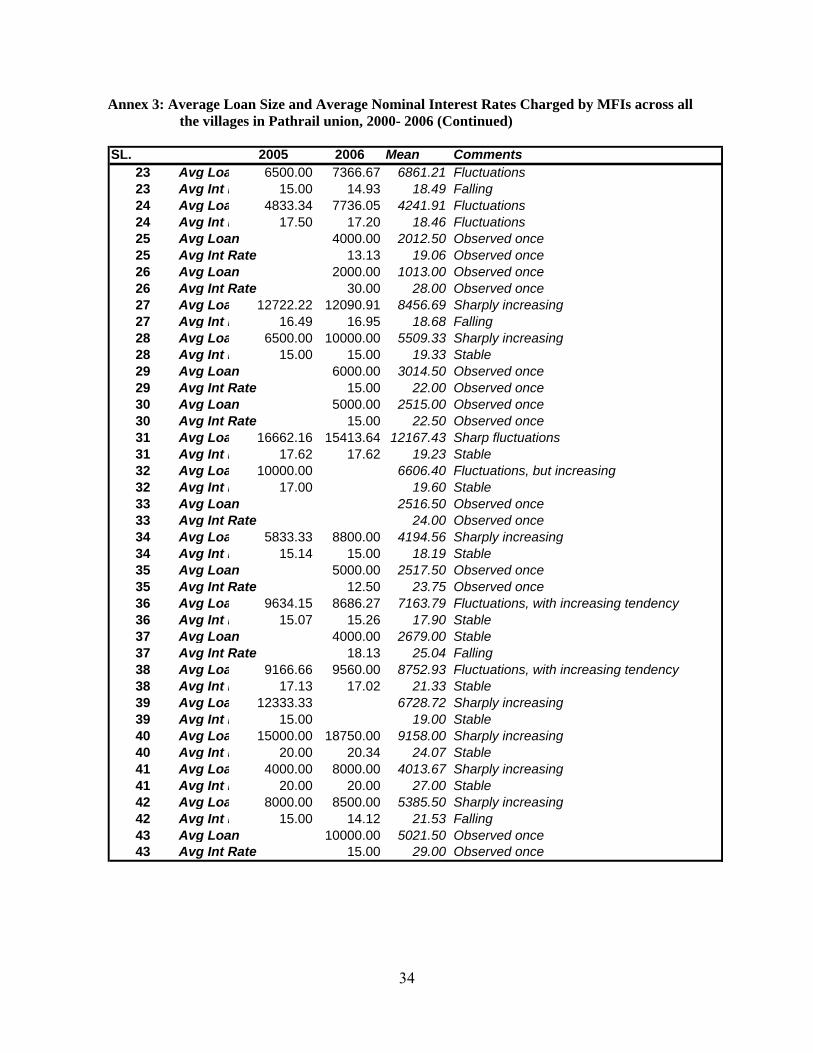
Annex 3: Average Loan Size and Average Nominal Interest Rates Charged by MFIs across all the villages in Pathrail union, 2000- 2006 (Continued)
SL. 2005 2006 Mean Comments
23 Avg Loa 6500.00 7366.67 6861.21 Fluctuations23 Avg Int R 15.00 14.93 18.49 Falling24 Avg Loa 4833.34 7736.05 4241.91 Fluctuations24 Avg Int R 17.50 17.20 18.46 Fluctuations25 Avg Loan 4000.00 2012.50 Observed once25 Avg Int Rate 13.13 19.06 Observed once26 Avg Loan 2000.00 1013.00 Observed once26 Avg Int Rate 30.00 28.00 Observed once27 Avg Loa 12722.22 12090.91 8456.69 Sharply increasing27 Avg Int R 16.49 16.95 18.68 Falling28 Avg Loa 6500.00 10000.00 5509.33 Sharply increasing28 Avg Int R 15.00 15.00 19.33 Stable29 Avg Loan 6000.00 3014.50 Observed once29 Avg Int Rate 15.00 22.00 Observed once30 Avg Loan 5000.00 2515.00 Observed once30 Avg Int Rate 15.00 22.50 Observed once31 Avg Loa 16662.16 15413.64 12167.43 Sharp fluctuations31 Avg Int R 17.62 17.62 19.23 Stable32 Avg Loa 10000.00 6606.40 Fluctuations, but increasing32 Avg Int R 17.00 19.60 Stable33 Avg Loan 2516.50 Observed once33 Avg Int Rate 24.00 Observed once34 Avg Loa 5833.33 8800.00 4194.56 Sharply increasing34 Avg Int R 15.14 15.00 18.19 Stable35 Avg Loan 5000.00 2517.50 Observed once35 Avg Int Rate 12.50 23.75 Observed once36 Avg Loa 9634.15 8686.27 7163.79 Fluctuations, with increasing tendency36 Avg Int R 15.07 15.26 17.90 Stable37 Avg Loan 4000.00 2679.00 Stable37 Avg Int Rate 18.13 25.04 Falling38 Avg Loa 9166.66 9560.00 8752.93 Fluctuations, with increasing tendency38 Avg Int R 17.13 17.02 21.33 Stable39 Avg Loa 12333.33 6728.72 Sharply increasing39 Avg Int R 15.00 19.00 Stable40 Avg Loa 15000.00 18750.00 9158.00 Sharply increasing40 Avg Int R 20.00 20.34 24.07 Stable41 Avg Loa 4000.00 8000.00 4013.67 Sharply increasing41 Avg Int R 20.00 20.00 27.00 Stable42 Avg Loa 8000.00 8500.00 5385.50 Sharply increasing42 Avg Int R 15.00 14.12 21.53 Falling43 Avg Loan 10000.00 5021.50 Observed once43 Avg Int Rate 15.00 29.00 Observed once
34