Embed Size (px)
Citation preview
MPRAMunich Personal RePEc Archive
Socio-economic conditions, inequalityand deprivation in North East India
Paranan Konwar
Sonari College
1 July 2015
Online at https://mpra.ub.uni-muenchen.de/65407/MPRA Paper No. 65407, posted 3 July 2015 14:22 UTC
1
Socio-economic Conditions, Inequality and
Deprivation in North East India
Paranan Konwar
Abstract: In spite of ample natural and human resources, the north east region of India that consists
of eight states is still lagging behind as compared to many states of India. People of these states are
deprived in different socio-economic indicators. The aim of the paper is to examine the inequalities in
socio-economic parameters of development, analyse inequality in the access to basic amenities, and
quantify the level of facility and socio-economic deprivations. It was found that Multi-dimensional
Poverty Index (MPI) value is highest in Assam but, inequality among the MPI Poor is high in
Meghalaya. In 2011-12, BPL population was highest in Manipur (46.7 %) followed by Assam (40.9
%) and Arunachal Pradesh (37.4 %) exceeding the all India level (29.5). It was observed that
inequality is high in growth rate of population (%) (among demographic indicators), Sanitation
Facilities (among the indicators of economic conditions), Rail Density (among indicators of
infrastructure), Average Years of Education, Per Capita Monthly Expenditure (Rs) and Population
Below Poverty Line. Analysis of access to basic amenities, namely, drinking water, toilet facility
and electricity reveals the existence of wide state-level variations. Inequality in access to
electricity is highest in urban sector as compared to the rural sector among the three basic services.
Among the states of NER, the maximum average deprivation in the basic facilities is located in
Meghalaya and the most Socio-Economic deprived state is Nagaland. Thus, it is recommended for
consistent and balanced development approach, expansion of capability, improvement in
infrastructure and diversification of agriculture across the eight states of North East India.
Key words: Socioeconomic conditions, Poverty, Inequality, Deprivation, Basic facilities, North
East India
1.Introduction
The saying ‘Southeast Asia begins where Northeast India ends’ indicates the socio-cultural,
genealogical, geographical and psychological bond or linkage of ethnic tribes of ‘North East
India’ with ‘South East Asia’. This north east region of India consisting of Arunachal
Pradesh, Assam, Manipur, Meghalaya, Mizoram, Nagaland, Sikkim, and Tripura occupies
2
7.98 % of India’s geographical area with 3.76 % of India’s total population. The Northeast
India constitutes 34% of the country’s water resources and 40% of India’s hydro power
potential covering nearly 90% India's international boundaries. As per census 2011, Dibang
valley district of Arunachal Pradesh has the lowest population (7,948) in the country.
Serchhip district in Mizoram records at highest literacy rate of 98.76% among all India
districts. Aizwal (Mizoram) is with highest literacy rate of 98.80% among the Indian cities.
Peter Townsend (2009:214), a pioneer on poverty and relative deprivation, defined
‘Deprivation’ as “a state of observable and demonstrable disadvantage, relative to the local
community or the wider society or nation to which an individual, family or groups belong.”
He mentioned ‘different forms’ of deprivation as “lack the types of diet, clothing, housing,
household facilities and fuel and environmental, educational, working and social conditions,
activities and facilities ……. in the societies to which they belong” (Townsend, 1987:126). It
means that ‘deprivation’ is multi-dimensional in the form of lack of basic necessities of diet
or clothing, or by virtue of the poor environment or social conditions in which they live.
Here, the term "deprivation" is used in place of "multiple deprivation" but focus is on the
later. According to the World Bank (2000:15), “poverty is pronounced deprivation in
wellbeing.” Wellbeing is ‘quality of life’ that is measured by income, health, education,
housing, assets, rights to speech etc. of an individual. For Townsend, the terms deprivation
and poverty are two sides of the same coin. Deprivation (outcome) is the result of poverty
(cause): “People are relatively deprived if they cannot obtain, at all or sufficiently, the
conditions of life – that is, the diets, amenities, standards and services …….. If they lack or
are denied resources to obtain access to these conditions of life and so fulfil membership of
society, they may be said to be in poverty” (Townsend, 1993:36). Sen (2010:15-16) makes
distinction between ‘feelings of deprivation’ and ‘conditions of deprivation’. Peter Townsend
(1974:25-26) said that ‘the latter would be a better usage’ and defined ‘relative deprivation’
as “situations where people possess less of some desired attribute, be it income, favourable
employment conditions or power, than do others.” Sen argued that “the choice of ‘conditions
of deprivation’ cannot be independent of ‘feelings of deprivation’ (Sen, 2010:16) and “In the
‘aggregation’ exercise the magnitude of absolute deprivation may have to be supplemented
by considerations of relative deprivation” (Sen, 2010:32). He said that “absolute deprivation
in terms of a person’s capabilities relates to relative deprivation in terms of commodities,
income and resources” (Sen, 1983: 153).
Recent and ongoing work into absolute poverty by researchers in the Townsend Centre uses
the human rights framework to develop a deprivation index measuring access to seven basic
3
needs: Clean water, Sanitation, Shelter, Education, Information, Food, and Health. If the
household or individual does not have access to a particular basic need, they are defined as
'deprived'. Those who are deprived of two or more of the seven basic need indicators are
defined as being in 'absolute poverty' (‘Defining and measuring poverty’, 2015).
The geographical location and lack of infrastructural development makes the NER states
isolated with the rest of the country (Agnihotri, 2004; Kumar, 2004). So, it needs to work
towards an integrated approach in transport, phone, irrigation and flood control, management
of forest resources and supply of food and essential commodities (Agnihotri, 2004). In spite
of immense natural and human resources, the NER is isolated geographically that has led to
deprivation of economic development (Cappellari & Jenkins, 2006). Thus, the study on
deprivation is not only crucial for the regional concern, but also important for establishment
of equity toward balanced development across the nation (Bhattacharya & Wang, 2011:35).
2. Objective
The study is planned to examine the socio-economic conditions and their inequalities among
the north-eastern states of India. Attempts have been made to analyse inequality in the access
to basic amenities. It is tried to quantify the level of facility deprivation and socioeconomic
deprivation.
3. Data and Methodology
The study is based on secondary sources of data. The data are collected from Central
Electricity Authority (M/o Power), Railway Board (M/o Railways), Transport Research Wing
(M/o Road Transport & Highways), Central Statistics Office (Ministry of Statistics &
Programme Implementation), Office of the Registrar General and Census Commissioner
(Ministry of Home Affairs), Ministry of Development of North Eastern Region, Ministry of
Women and Child Development. To measure inequality we use Coefficient of Variation
(CV), Gini Coefficient (Gini), and Concentration Coefficient (CC). Facility deprivation index
(FDI) is used to measure deprivations in three basic facilities, namely supply of safe drinking
water, electricity and sanitary facility. On the other hand, Socio-Economic Deprivation is
constructed and calculated based on selected twenty socio-economic indicators: Per cent of
Houseless Population, Per cent of Housing Shortage, Per cent of Slum Population, Poverty
Rate, Rural Poverty, Urban Poverty, Unemployment Rate, Rural Unemployment Rate, Urban
Unemployment Rate, Illiteracy Rate, Rural Illiteracy Rate, Urban Illiteracy Rate, Male
Illiteracy Rate, Female Illiteracy Rate, Percent of Scheduled Caste Population to Total
4
Population, Percent of Scheduled Tribe Population to Total Population, Household Size, Size
of Land Holdings in hectare, Population Growth and Population Density.
Gini Coefficient of Inequality is based on the Lorenz curve, a cumulative frequency curve
that compares the distribution of a specific variable (e.g., income, expenditure, assets) with
the uniform distribution that represents equality.
Formally, let be a point on the x-axis, and a point on the y-axis. Then,
Gini=1- - )( + ).
When there are N equal intervals on the x-axis, the equation simplifies to
Gini=1-
( + ). (Haughton and Khander,2010:104).
The paper uses 49th
& 65th
Roundsdata on housing conditions and amenities conducted in
2008-09 and 2012 by National Sample Survey Organization (NSSO), Ministry of
Statistics and Programme Implementation. This study considers an indicator of residential
crowding and three variables to represent household’s access to basic amenities. The
residential crowding is measured as per capita floor area in square feet. The variables
representing basic amenities are drinking water, toilet facility and electricity. The
concentration index estimates the degree of inequality by given a numeric measure of
inequality. It is defined as twice the area between the concentration curve and the
line of equality
C=
cov (h, r )
where
C = the concentration index,
h = the housing indicator variable,
r = the rank of the living standard variable and
µ = the average of the housing variable.
(Pal, Aneja & Nagpal, 2015: 5)
The term ‘facility deprivation’ is used to specify a particular dimension of deprivation. Thus,
the composite index is termed as ‘Facility Deprivation Index’ (FDI) in respect of three basic
facilities namely, supply of safe drinking water, electricity and sanitary facility. The source of
data for the study is based on “Ranking and Mapping of Districts based on Socio-economic
and Demographic Indicators” a report by Ram and Sekhar (2006), published by the
International Institute of Population Studies, Mumbai. For this purpose, first, we are to
5
calculate deprivation indicator (DI). Then, we are to calculate Facility Deprivation Index
(FDI). The Deprivation Indicator (DI) is measured as follows:
Where,
= the deprivation indicator (DI) for the kth facility in the jth district of the ith state
max the percentage of households in a given district which has the best coverage of
the kth facility (k = 1, 2, 3) in entire nation.
min the percentage of households in the district that has the worst coverage of the
kth facility (k = 1, 2, 3) in theentire nation.
= the percentage of households enjoying the kth facility in the jth district of the ith state
i= 1, 2, ..., 8 for those aforementioned eight states in NER
j= 1, 2, …,ni for the number of districts in the ith state is represented by ni,
k= 1, 2, 3 for the three basic necessities: safe drinking water (k =1), sanitary facility (k =2)
and electricity supply (k =3)
The value of varies from zero to one, where the value of 1 implies that the given district
is most deprived in comparison to the best district in the country in the kth facility. The
reverse is true for a value of 0.
The weighted index of deprivation (facility deprivation index) for the jth district of the ith
state is given by
= =1
Where,
= the weight associated with the kth basic facility (k = 1, 2, 3)
(Bhattacharjee& Wang, 2011:38-39).
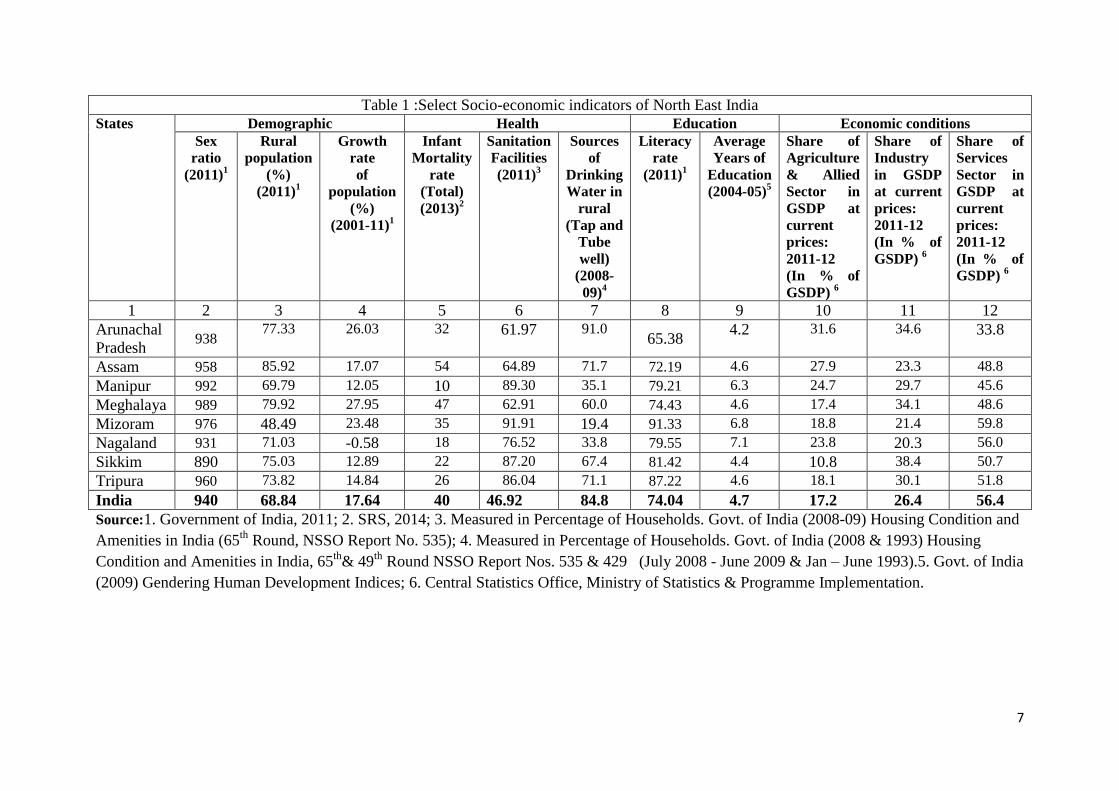
4. Results and Discussions
As per 2011 census, Sex ratio is highest in Manipur (992) followed by Meghalaya (989) and
Mizoram (976) and lowest in Sikkim (890). Percentage of population live in rural area is
highest in Assam (85.92) and lowest in Mizoram (48.49). Infant Mortality rate (Total)
recorded highest in Assam (54) followed by Meghalaya (47) and Mizoram (35). It is lowest
in Manipur (10).
A majority of India’s population does not have access to sanitation facilities in their
dwellings and lacks sanitation facilities. As per Census of India, if a household has access to
6
drinking water supplied from a tap or a hand pump/tube well situated within or outside the
premises, it is considered as having access to safe drinking water. Millions of people in the
country suffer from water borne diseases on account of lack of access to safe drinking water.
It is the poor who suffer from higher prevalence of diseases compared to the rich (Nayak,
2013:5). Sanitation Facilities are high in Mizoram (91.91) followed by Manipur (89.30) and
Sikkim (87.20); but, lowest in Arunachal Pradesh (61.97). Similarly, Sources of Drinking
Water in rural (Tap and Tube well) records highest in Arunachal Pradesh (91.0) followed by
Assam (71.7) and Tripura (71.1), but lowest in Mizoram (19.4).
Education is considered as a means to enhance capability, overcome constraints, enlarge
choices, and power to cope with resilience for standard of living. It bridges the gaps in
communication, and encourages people’s participation in social and political life. The
educational attainment has its positive impact on the people’s wellbeing and changes the
perceptions, aims, means and ability of an individual as well as community. It is the
determining factor of formation and application of new technologies. It lowers infant
mortality rates, improves the health of children and women; empowers weaker sections of
society, increses social mobility and political freedom (Nayak, 2013:3-4). Mizoram is the
state with highest literacy rate (91.33). Literacy rate of all north eastern states overcomes the
all India level (74.04) except Arunachal Pradesh (65.38) and Assam (72.19).
Among the NE states, shares of services to Gross State Domestic Product (GSDP) are high.
Next are industry and agriculture & allied sector. It is evident that Shares of Agriculture &
allied sector, industry and services in GSDP are highest in Arunachal Pradesh (31.6), Sikkim
(38.4) and Mizoram (59.8) respectively among the N E states.
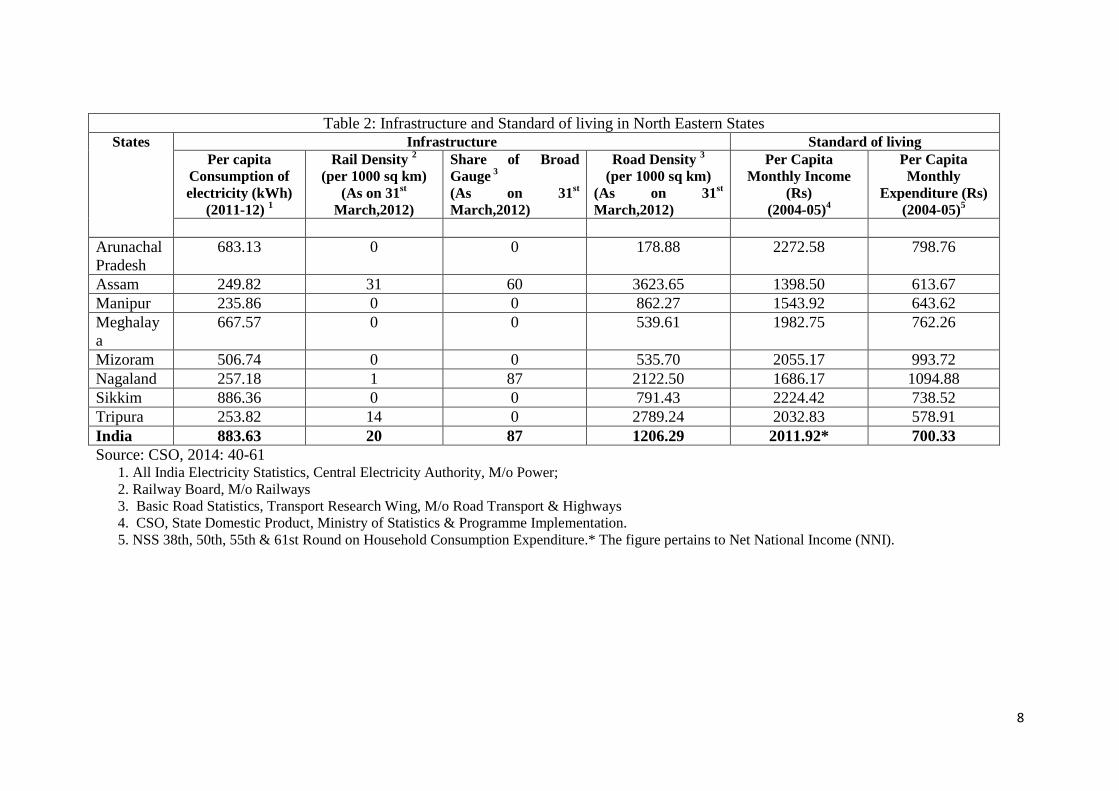
In case of Infrastructure, Assam is leading ahead among the NE states. Access to electricity
is a basic amenity and an index of industrialization (Nayak, 2013:5). The economic
backwardness of the state is evident from her low per capita income. Per capita monthly
consumption expenditure (PCMCE) is considered to be a better measure of economic well-
being of people than that of per capita monthly income measure for many obvious
reasons (Nayak, 2013:6). Per Capita Monthly Income is highest in Arunachal Pradesh
(2272.58) and lowest in Assam (1398.50). In contrast, Per Capita Monthly Expenditure is
high in Nagaland (1094.88) and lowest in Tripura (578.91).
7
Table 1 :Select Socio-economic indicators of North East India
States Demographic Health Education Economic conditions
Sex
ratio
(2011)1
Rural
population
(%)
(2011)1
Growth
rate
of
population
(%)
(2001-11)1
Infant
Mortality
rate
(Total)
(2013)2
Sanitation
Facilities
(2011)3
Sources
of
Drinking
Water in
rural
(Tap and
Tube
well)
(2008-
09)4
Literacy
rate
(2011)1
Average
Years of
Education
(2004-05)5
Share of
Agriculture
& Allied
Sector in
GSDP at
current
prices:
2011-12
(In % of
GSDP) 6
Share of
Industry
in GSDP
at current
prices:
2011-12
(In % of
GSDP) 6
Share of
Services
Sector in
GSDP at
current
prices:
2011-12
(In % of
GSDP) 6
1 2 3 4 5 6 7 8 9 10 11 12
Arunachal
Pradesh 938
77.33 26.03 32 61.97 91.0 65.38
4.2 31.6 34.6 33.8
Assam 958 85.92 17.07 54 64.89 71.7 72.19 4.6 27.9 23.3 48.8
Manipur 992 69.79 12.05 10 89.30 35.1 79.21 6.3 24.7 29.7 45.6
Meghalaya 989 79.92 27.95 47 62.91 60.0 74.43 4.6 17.4 34.1 48.6
Mizoram 976 48.49 23.48 35 91.91 19.4 91.33 6.8 18.8 21.4 59.8
Nagaland 931 71.03 -0.58 18 76.52 33.8 79.55 7.1 23.8 20.3 56.0
Sikkim 890 75.03 12.89 22 87.20 67.4 81.42 4.4 10.8 38.4 50.7
Tripura 960 73.82 14.84 26 86.04 71.1 87.22 4.6 18.1 30.1 51.8
India 940 68.84 17.64 40 46.92 84.8 74.04 4.7 17.2 26.4 56.4
Source:1. Government of India, 2011; 2. SRS, 2014; 3. Measured in Percentage of Households. Govt. of India (2008-09) Housing Condition and
Amenities in India (65th
Round, NSSO Report No. 535); 4. Measured in Percentage of Households. Govt. of India (2008 & 1993) Housing
Condition and Amenities in India, 65th
& 49th
Round NSSO Report Nos. 535 & 429 (July 2008 - June 2009 & Jan – June 1993).5. Govt. of India
(2009) Gendering Human Development Indices; 6. Central Statistics Office, Ministry of Statistics & Programme Implementation.
8
Table 2: Infrastructure and Standard of living in North Eastern States
States Infrastructure Standard of living
Per capita
Consumption of
electricity (kWh)
(2011-12) 1
Rail Density 2
(per 1000 sq km)
(As on 31st
March,2012)
Share of Broad
Gauge 3
(As on 31st
March,2012)
Road Density 3
(per 1000 sq km)
(As on 31st
March,2012)
Per Capita
Monthly Income
(Rs)
(2004-05)4
Per Capita
Monthly
Expenditure (Rs)
(2004-05)5
Arunachal
Pradesh
683.13 0 0 178.88 2272.58 798.76
Assam 249.82 31 60 3623.65 1398.50 613.67
Manipur 235.86 0 0 862.27 1543.92 643.62
Meghalay
a
667.57 0 0 539.61 1982.75 762.26
Mizoram 506.74 0 0 535.70 2055.17 993.72
Nagaland 257.18 1 87 2122.50 1686.17 1094.88
Sikkim 886.36 0 0 791.43 2224.42 738.52
Tripura 253.82 14 0 2789.24 2032.83 578.91
India 883.63 20 87 1206.29 2011.92* 700.33
Source: CSO, 2014: 40-61 1. All India Electricity Statistics, Central Electricity Authority, M/o Power;
2. Railway Board, M/o Railways
3. Basic Road Statistics, Transport Research Wing, M/o Road Transport & Highways
4. CSO, State Domestic Product, Ministry of Statistics & Programme Implementation.
5. NSS 38th, 50th, 55th & 61st Round on Household Consumption Expenditure.* The figure pertains to Net National Income (NNI).
9
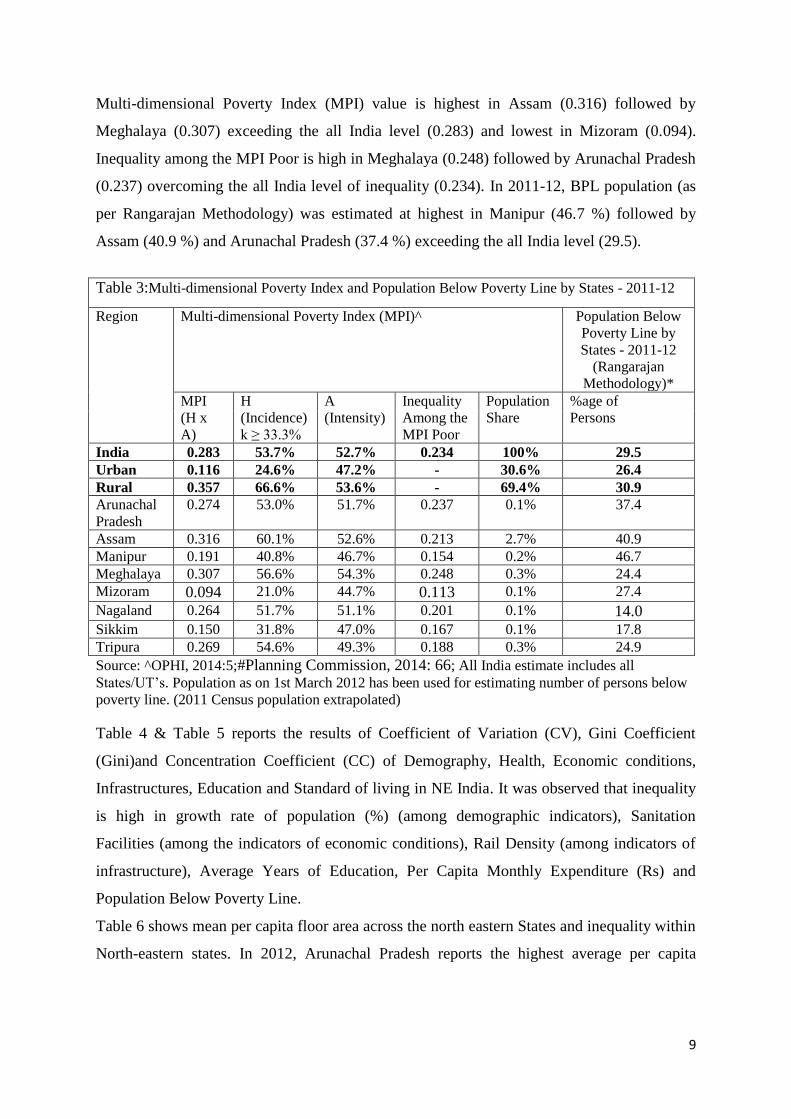
Multi-dimensional Poverty Index (MPI) value is highest in Assam (0.316) followed by
Meghalaya (0.307) exceeding the all India level (0.283) and lowest in Mizoram (0.094).
Inequality among the MPI Poor is high in Meghalaya (0.248) followed by Arunachal Pradesh
(0.237) overcoming the all India level of inequality (0.234). In 2011-12, BPL population (as
per Rangarajan Methodology) was estimated at highest in Manipur (46.7 %) followed by
Assam (40.9 %) and Arunachal Pradesh (37.4 %) exceeding the all India level (29.5).
Table 3:Multi-dimensional Poverty Index and Population Below Poverty Line by States - 2011-12
Region Multi-dimensional Poverty Index (MPI)^ Population Below
Poverty Line by
States - 2011-12
(Rangarajan
Methodology)*
MPI
(H x
A)
H
(Incidence)
k ≥ 33.3%
A
(Intensity)
Inequality
Among the
MPI Poor
Population
Share
%age of
Persons
India 0.283 53.7% 52.7% 0.234 100% 29.5
Urban 0.116 24.6% 47.2% - 30.6% 26.4
Rural 0.357 66.6% 53.6% - 69.4% 30.9
Arunachal
Pradesh
0.274 53.0% 51.7% 0.237 0.1% 37.4
Assam 0.316 60.1% 52.6% 0.213 2.7% 40.9
Manipur 0.191 40.8% 46.7% 0.154 0.2% 46.7
Meghalaya 0.307 56.6% 54.3% 0.248 0.3% 24.4
Mizoram 0.094 21.0% 44.7% 0.113 0.1% 27.4
Nagaland 0.264 51.7% 51.1% 0.201 0.1% 14.0
Sikkim 0.150 31.8% 47.0% 0.167 0.1% 17.8
Tripura 0.269 54.6% 49.3% 0.188 0.3% 24.9
Source: ^OPHI, 2014:5;#Planning Commission, 2014: 66; All India estimate includes all
States/UT’s. Population as on 1st March 2012 has been used for estimating number of persons below
poverty line. (2011 Census population extrapolated)
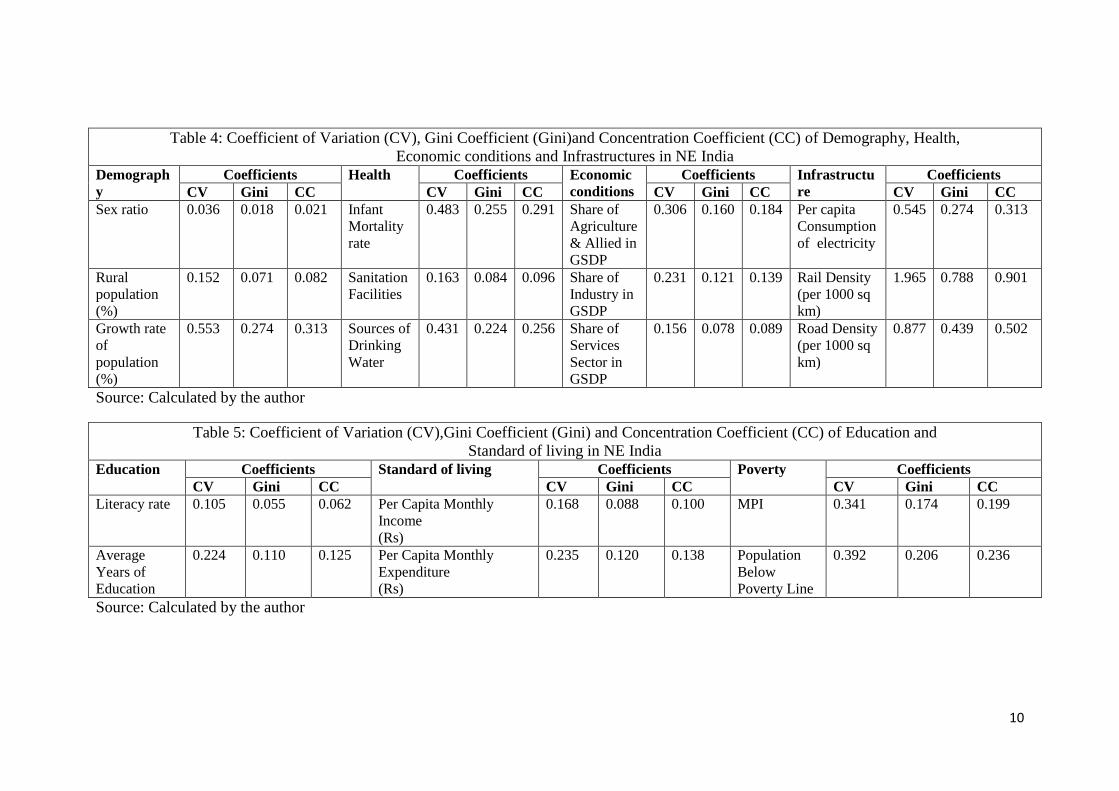
Table 4 & Table 5 reports the results of Coefficient of Variation (CV), Gini Coefficient
(Gini)and Concentration Coefficient (CC) of Demography, Health, Economic conditions,
Infrastructures, Education and Standard of living in NE India. It was observed that inequality
is high in growth rate of population (%) (among demographic indicators), Sanitation
Facilities (among the indicators of economic conditions), Rail Density (among indicators of
infrastructure), Average Years of Education, Per Capita Monthly Expenditure (Rs) and
Population Below Poverty Line.
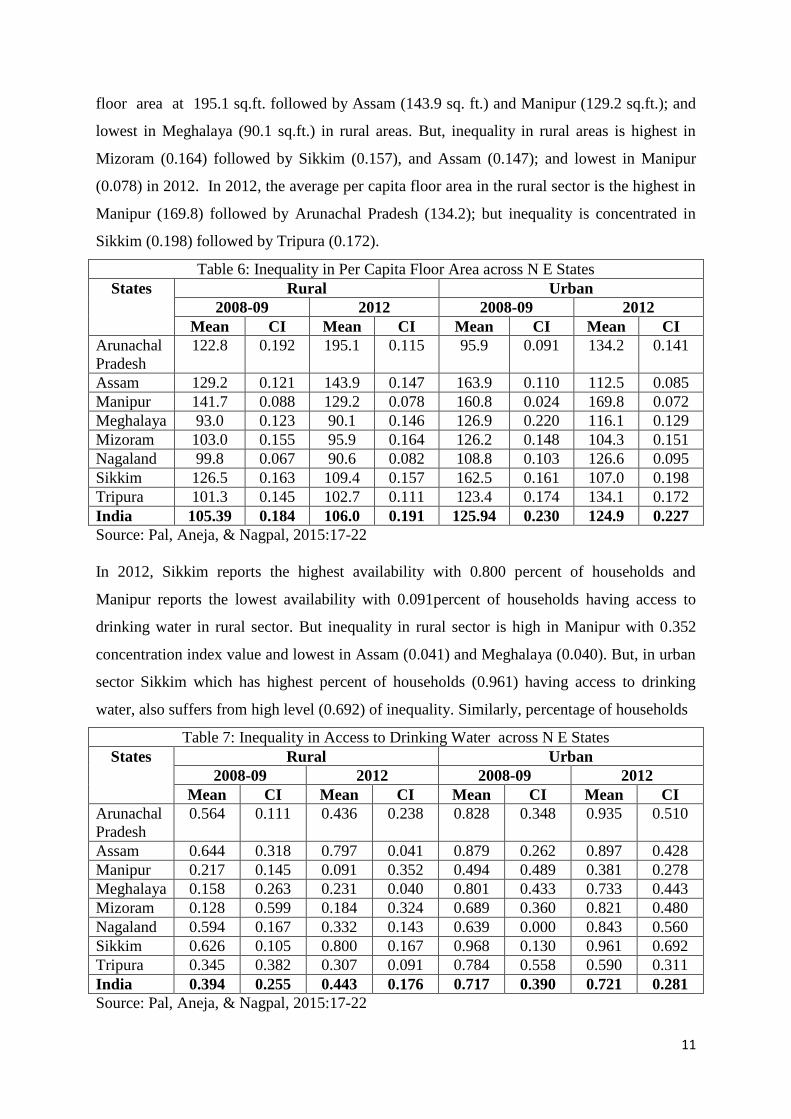
Table 6 shows mean per capita floor area across the north eastern States and inequality within
North-eastern states. In 2012, Arunachal Pradesh reports the highest average per capita
10
Table 4: Coefficient of Variation (CV), Gini Coefficient (Gini)and Concentration Coefficient (CC) of Demography, Health,
Economic conditions and Infrastructures in NE India
Demograph
y
Coefficients Health Coefficients Economic
conditions
Coefficients Infrastructu
re
Coefficients
CV Gini CC CV Gini CC CV Gini CC CV Gini CC
Sex ratio 0.036 0.018 0.021 Infant
Mortality
rate
0.483 0.255 0.291 Share of
Agriculture
& Allied in
GSDP
0.306 0.160 0.184 Per capita
Consumption
of electricity
0.545 0.274 0.313
Rural
population
(%)
0.152 0.071 0.082 Sanitation
Facilities
0.163 0.084 0.096 Share of
Industry in
GSDP
0.231 0.121 0.139 Rail Density
(per 1000 sq
km)
1.965 0.788 0.901
Growth rate
of
population
(%)
0.553 0.274 0.313 Sources of
Drinking
Water
0.431 0.224 0.256 Share of
Services
Sector in
GSDP
0.156 0.078 0.089 Road Density
(per 1000 sq
km)
0.877 0.439 0.502
Source: Calculated by the author
Table 5: Coefficient of Variation (CV),Gini Coefficient (Gini) and Concentration Coefficient (CC) of Education and
Standard of living in NE India
Education Coefficients Standard of living Coefficients Poverty Coefficients
CV Gini CC CV Gini CC CV Gini CC
Literacy rate 0.105 0.055 0.062 Per Capita Monthly
Income
(Rs)
0.168 0.088 0.100 MPI 0.341 0.174 0.199
Average
Years of
Education
0.224 0.110 0.125 Per Capita Monthly
Expenditure
(Rs)
0.235 0.120 0.138 Population
Below
Poverty Line
0.392
0.206 0.236
Source: Calculated by the author
11
floor area at 195.1 sq.ft. followed by Assam (143.9 sq. ft.) and Manipur (129.2 sq.ft.); and
lowest in Meghalaya (90.1 sq.ft.) in rural areas. But, inequality in rural areas is highest in
Mizoram (0.164) followed by Sikkim (0.157), and Assam (0.147); and lowest in Manipur
(0.078) in 2012. In 2012, the average per capita floor area in the rural sector is the highest in
Manipur (169.8) followed by Arunachal Pradesh (134.2); but inequality is concentrated in
Sikkim (0.198) followed by Tripura (0.172).
Table 6: Inequality in Per Capita Floor Area across N E States
States Rural Urban
2008-09 2012 2008-09 2012
Mean CI Mean CI Mean CI Mean CI
Arunachal
Pradesh
122.8 0.192 195.1 0.115 95.9 0.091 134.2 0.141
Assam 129.2 0.121 143.9 0.147 163.9 0.110 112.5 0.085
Manipur 141.7 0.088 129.2 0.078 160.8 0.024 169.8 0.072
Meghalaya 93.0 0.123 90.1 0.146 126.9 0.220 116.1 0.129
Mizoram 103.0 0.155 95.9 0.164 126.2 0.148 104.3 0.151
Nagaland 99.8 0.067 90.6 0.082 108.8 0.103 126.6 0.095
Sikkim 126.5 0.163 109.4 0.157 162.5 0.161 107.0 0.198
Tripura 101.3 0.145 102.7 0.111 123.4 0.174 134.1 0.172
India 105.39 0.184 106.0 0.191 125.94 0.230 124.9 0.227
Source: Pal, Aneja, & Nagpal, 2015:17-22
In 2012, Sikkim reports the highest availability with 0.800 percent of households and
Manipur reports the lowest availability with 0.091percent of households having access to
drinking water in rural sector. But inequality in rural sector is high in Manipur with 0.352
concentration index value and lowest in Assam (0.041) and Meghalaya (0.040). But, in urban
sector Sikkim which has highest percent of households (0.961) having access to drinking
water, also suffers from high level (0.692) of inequality. Similarly, percentage of households
Table 7: Inequality in Access to Drinking Water across N E States
States Rural Urban
2008-09 2012 2008-09 2012
Mean CI Mean CI Mean CI Mean CI
Arunachal
Pradesh
0.564 0.111 0.436 0.238 0.828 0.348 0.935 0.510
Assam 0.644 0.318 0.797 0.041 0.879 0.262 0.897 0.428
Manipur 0.217 0.145 0.091 0.352 0.494 0.489 0.381 0.278
Meghalaya 0.158 0.263 0.231 0.040 0.801 0.433 0.733 0.443
Mizoram 0.128 0.599 0.184 0.324 0.689 0.360 0.821 0.480
Nagaland 0.594 0.167 0.332 0.143 0.639 0.000 0.843 0.560
Sikkim 0.626 0.105 0.800 0.167 0.968 0.130 0.961 0.692
Tripura 0.345 0.382 0.307 0.091 0.784 0.558 0.590 0.311
India 0.394 0.255 0.443 0.176 0.717 0.390 0.721 0.281
Source: Pal, Aneja, & Nagpal, 2015:17-22
12
having access to drinking water is the lowest in Manipur with lowest level (0.278) of
inequality.(See Table 7).
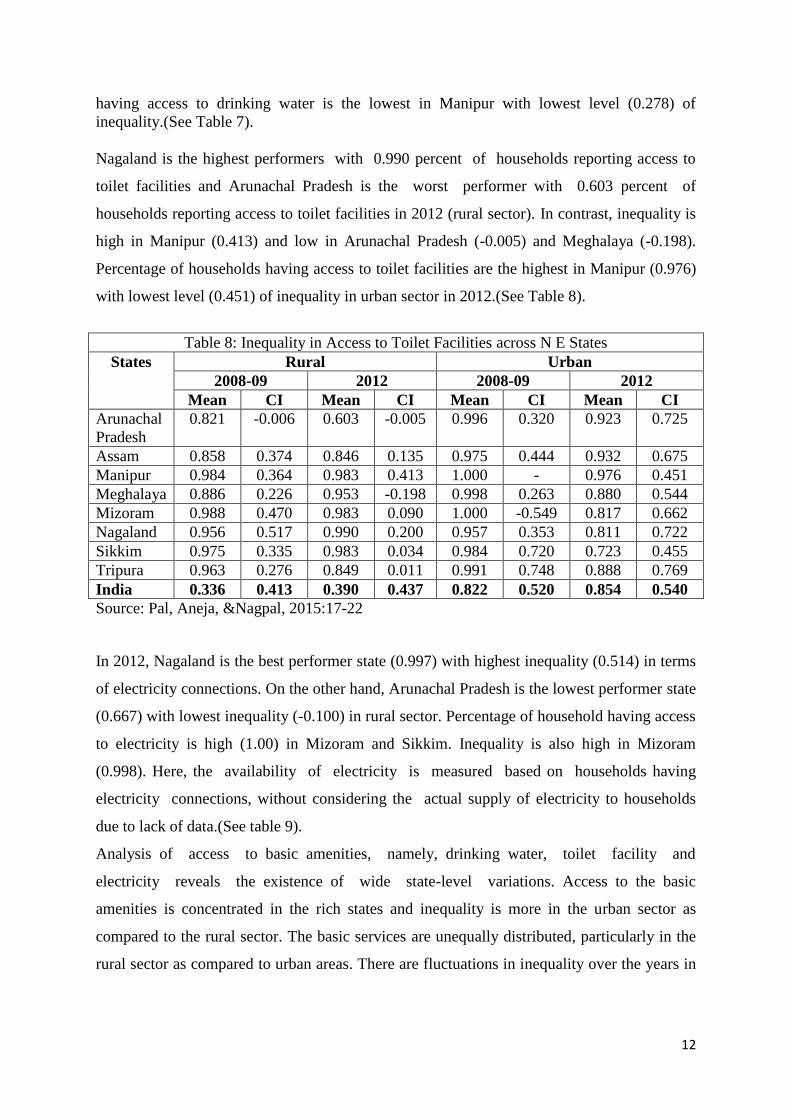
Nagaland is the highest performers with 0.990 percent of households reporting access to
toilet facilities and Arunachal Pradesh is the worst performer with 0.603 percent of
households reporting access to toilet facilities in 2012 (rural sector). In contrast, inequality is
high in Manipur (0.413) and low in Arunachal Pradesh (-0.005) and Meghalaya (-0.198).
Percentage of households having access to toilet facilities are the highest in Manipur (0.976)
with lowest level (0.451) of inequality in urban sector in 2012.(See Table 8).
Table 8: Inequality in Access to Toilet Facilities across N E States
States Rural Urban
2008-09 2012 2008-09 2012
Mean CI Mean CI Mean CI Mean CI
Arunachal
Pradesh
0.821 -0.006 0.603 -0.005 0.996 0.320 0.923 0.725
Assam 0.858 0.374 0.846 0.135 0.975 0.444 0.932 0.675
Manipur 0.984 0.364 0.983 0.413 1.000 - 0.976 0.451
Meghalaya 0.886 0.226 0.953 -0.198 0.998 0.263 0.880 0.544
Mizoram 0.988 0.470 0.983 0.090 1.000 -0.549 0.817 0.662
Nagaland 0.956 0.517 0.990 0.200 0.957 0.353 0.811 0.722
Sikkim 0.975 0.335 0.983 0.034 0.984 0.720 0.723 0.455
Tripura 0.963 0.276 0.849 0.011 0.991 0.748 0.888 0.769
India 0.336 0.413 0.390 0.437 0.822 0.520 0.854 0.540
Source: Pal, Aneja, &Nagpal, 2015:17-22
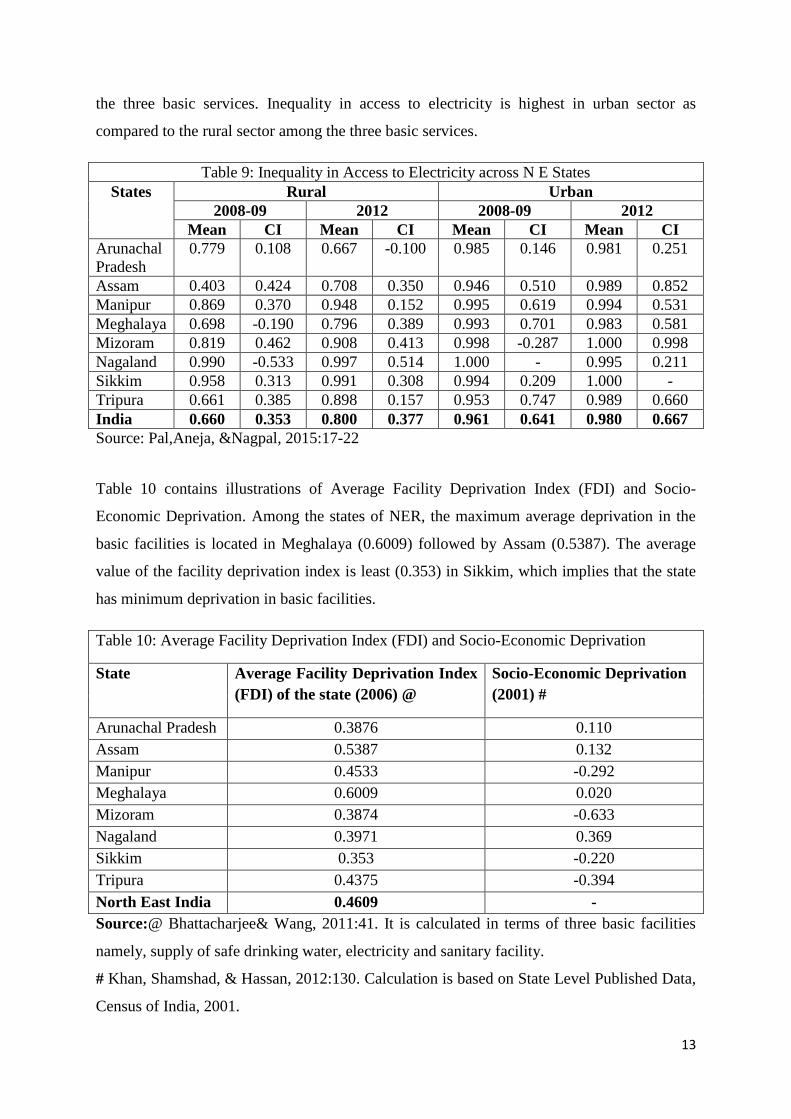
In 2012, Nagaland is the best performer state (0.997) with highest inequality (0.514) in terms
of electricity connections. On the other hand, Arunachal Pradesh is the lowest performer state
(0.667) with lowest inequality (-0.100) in rural sector. Percentage of household having access
to electricity is high (1.00) in Mizoram and Sikkim. Inequality is also high in Mizoram
(0.998). Here, the availability of electricity is measured based on households having
electricity connections, without considering the actual supply of electricity to households
due to lack of data.(See table 9).
Analysis of access to basic amenities, namely, drinking water, toilet facility and
electricity reveals the existence of wide state-level variations. Access to the basic
amenities is concentrated in the rich states and inequality is more in the urban sector as
compared to the rural sector. The basic services are unequally distributed, particularly in the
rural sector as compared to urban areas. There are fluctuations in inequality over the years in
13
the three basic services. Inequality in access to electricity is highest in urban sector as
compared to the rural sector among the three basic services.
Table 9: Inequality in Access to Electricity across N E States
States Rural Urban
2008-09 2012 2008-09 2012
Mean CI Mean CI Mean CI Mean CI
Arunachal
Pradesh
0.779 0.108 0.667 -0.100 0.985 0.146 0.981 0.251
Assam 0.403 0.424 0.708 0.350 0.946 0.510 0.989 0.852
Manipur 0.869 0.370 0.948 0.152 0.995 0.619 0.994 0.531
Meghalaya 0.698 -0.190 0.796 0.389 0.993 0.701 0.983 0.581
Mizoram 0.819 0.462 0.908 0.413 0.998 -0.287 1.000 0.998
Nagaland 0.990 -0.533 0.997 0.514 1.000 - 0.995 0.211
Sikkim 0.958 0.313 0.991 0.308 0.994 0.209 1.000 -
Tripura 0.661 0.385 0.898 0.157 0.953 0.747 0.989 0.660
India 0.660 0.353 0.800 0.377 0.961 0.641 0.980 0.667
Source: Pal,Aneja, &Nagpal, 2015:17-22
Table 10 contains illustrations of Average Facility Deprivation Index (FDI) and Socio-
Economic Deprivation. Among the states of NER, the maximum average deprivation in the
basic facilities is located in Meghalaya (0.6009) followed by Assam (0.5387). The average
value of the facility deprivation index is least (0.353) in Sikkim, which implies that the state
has minimum deprivation in basic facilities.
Table 10: Average Facility Deprivation Index (FDI) and Socio-Economic Deprivation
State Average Facility Deprivation Index
(FDI) of the state (2006) @
Socio-Economic Deprivation
(2001) #
Arunachal Pradesh 0.3876 0.110
Assam 0.5387 0.132
Manipur 0.4533 -0.292
Meghalaya 0.6009 0.020
Mizoram 0.3874 -0.633
Nagaland 0.3971 0.369
Sikkim 0.353 -0.220
Tripura 0.4375 -0.394
North East India 0.4609 -
Source:@ Bhattacharjee& Wang, 2011:41. It is calculated in terms of three basic facilities
namely, supply of safe drinking water, electricity and sanitary facility.
# Khan, Shamshad, & Hassan, 2012:130. Calculation is based on State Level Published Data,
Census of India, 2001.
14
In the entire NER, the least deprived state in terms of Socio-Economic conditions is Mizoram
and the most Socio-Economic deprived state is Nagaland. The states with mean Z-Score
values above 0.500 are categorized under the high level of socio-economic deprivation. The
states included in this category are Assam and Meghalaya. The mean Z-Score values of
medium category ranges from 0.500 to -0.500 score. Remaining six states are included in this
category. The states scoring the mean Z-Score values of less than -0.500, are grouped under
low level of socio-economic deprivation. No state is in this category.
5. Summary and Conclusions
In spite of ample natural and human resources, the north east region of India that comprises
eight states is still lagging behind as compared to many states of India. People of these states
are deprived in many socio-economic indicators. It is an important input to the production
process and raises the productivity of other sectors.
Multi-dimensional Poverty Index (MPI) value is highest in Assam but, inequality among the
MPI Poor is high in Meghalaya. In 2011-12, BPL population was highest in Manipur (46.7
%) followed by Assam (40.9 %) and Arunachal Pradesh (37.4 %) exceeding the all India
level (29.5). It was observed that inequality is high in growth rate of population (%) (among
demographic indicators), Sanitation Facilities (among the indicators of economic conditions),
Rail Density (among indicators of infrastructure), Average Years of Education, Per Capita
Monthly Expenditure (Rs) and Population Below Poverty Line. Analysis of access to basic
amenities, namely, drinking water, toilet facility and electricity reveals the existence of
wide state-level variations. Access to the basic amenities is concentrated in the rich states
and inequality is more in the urban sector as compared to the rural sector. The basic services
are unequally distributed, particularly in the rural sector as compared to urban areas. There
are fluctuations in inequality over the years in the three basic services. Inequality in access to
electricity is highest in urban sector as compared to the rural sector among the three basic
services. Among the states of NER, the maximum average deprivation in the basic facilities is
located in Meghalaya (0.6009) followed by Assam (0.5387). In the entire NER, the most
Socio-Economic deprived state is Nagaland. Thus, it is recommended for consistent and
balanced development approach across the eight states. ‘Human development’ (that is, well-
being of people as an ends of development) should be focused in place of ‘human resource
development’ (where human beings merely are considered as a means to a greater output and
treats people as "human capital“). Initiatives should be taken to expand capabilities
15
(opportunity freedoms) and to support people’s agency (process freedom) among weaker
sections of backward regions. Government should focus on economic infrastructure
(transport, communication and energy), social infrastructure (education, health, housing,
water supply, sanitation), and diversification of agriculture, such as diversification of crops
(shifting from single cropping system to multiple cropping) and diversification of productive
activity (divert resources from farm to non-farming activities like livestock, fisheries etc.).
References
Agnihotri, V. K. (2004). Socio-economic profile of Rural India: North East India. Mussoorie:
Lal Bahadur Shastri National Academy of Administration.
Bhattacharjee, D. & Wang, J. (2011). “Assessment of Facility Deprivation in the Households
of theNorth Eastern States of India”, Demography India, 40 (2): 35-54
Cappellari, L., & Jenkins, S. P. (2006). Summarizing multiple deprivation indicators. ISER
Working Paper 2006-40. Colchester: University of Essex.
CSO (2014). Infrastructure Statistics: 2014 (Third Issue, Vol. I). Central Statistics Office,
New Delhi: Ministry Of Statistics and Programme Implementation, Government
of India.
Defining and Measuring Poverty (2015). Retrieved from http://www.bristol.ac.uk/poverty/
definingandmeasuringpoverty.html dated 10th June 2015.
Government of India (2001): Census of India 2001. Office of the Registrar General and
Census Commissioner, New Delhi: Ministry of Home Affairs.
Government of India (2011).Census of India 2011. New Delhi: Office of the Registrar
General and Census Commissioner.
Govt. of India (2005): Household Consumption Expenditure, National Sample Survey Office.
New Delhi: Ministry of Statistics and Programme Implementation.
Govt. of India (2011): Human Development Report of North East States. New Delhi:
Ministry of Development of North Eastern Region.
Govt. of India (1999-2000 to 2008-09): State Domestic Product (State Series), Central
Statistical Organization, New Delhi: Ministry of Statistics & Programme
Implementation.
Govt. of India (2008 & 1993): Housing Condition and Amenities in India, 49th
& 65th
Round,
NSSO Report Nos. 429 & 535. New Delhi: Ministry of Statistics and Programme
Implementation.
16
Govt. of India (2009): Gendering Human Development Indices. New Delhi: Ministry of
Women and Child Development.
Haughton, Jonathan & Khander, S. R. (2010). Handbook on Poverty and Inequality. New
Delhi: Rawat Publications.
Khan, J. H., Shamshad, & Hassan, T. (2012, January). “Unemployment and Levels of Socio-
Economic Deprivation in India: A Regional Perspective”, British Journal of
Humanities and Social Sciences, 3(2): 126-140
Nayak, Purusottam(2013, October). Development and Deprivation in Meghalaya, MPRA
Paper No. 50821. Retrieved from http://mpra.ub.uni-muenchen.de/50821/ dated
28 June, 2013.
OPHI (2014). “India Country Briefing”, Multidimensional Poverty Index Data Bank. Oxford
Poverty and Human Development Initiative, University of Oxford.
Pal, R., Aneja, N., & Nagpal, D. (2015, January). “Inequality in Housing and Basic
Amenities in India,”MPRA Paper No. 61994, Retrieved from http://mpra.ub.uni-
muenchen.de/61994/ dated 7th
June, 2015
Planning Commission (2014).Report of the Expert Group to Review the Methodology for
Measurement of Poverty. Planning Commission: Government of India.
Ram, F. & Shekhar, Chander (2006).Ranking and Mapping of Districts: Based on Socio-
economic and Demographic Indicators. International Institute for Population
Sciences, Mumbai
Sen, A. (1983, July). “Poor, Relatively Speaking”, Oxford Economic Papers, New Series,
35(2):153-169.
Sen, A. (2010). Poverty and Famines. New Delhi: Oxford University Press.
SRS (2014, Sept).SRS Bulletin, Sample Registration System,. New Delhi, India: Registrar
General, Vol. 49 No.1
Townsend, P. (1974). “Poverty as Relative Deprivation: Resources and Styles of Living”. In
Wedderburn, D (Ed.)(1974). Poverty, Inequality and Class Structure. Cambridge:
University Press.
Townsend, P. (1987). Deprivation, Journal of Social Policy, 16 (1):125-146.
Townsend, P. (1993). The International Analysis of Poverty. London: Harvester Wheat sheaf.
Townsend, P. (2009). The Peter Townsend Reader. In David Gordon et al.(Ed.)(2009).
Bristol, UK: The Policy Press. In Bhattacharjee, D. & Wang, J. (2011).
“Assessment of Facility Deprivation in the Households of the North Eastern States
of India”, Demography India, 40 (2) : 35-54
World Bank (2000). World Development Report 2000/2001: Attacking Poverty. New York:
Oxford University Press