Embed Size (px)
Citation preview

MPRAMunich Personal RePEc Archive
How Do Trade, Foreign Investment, andTechnology Affect Employment Patternsin Organized Indian Manufacturing?
Jaya Prakash Pradhan
Gujarat Institute of Development Research
December 2005
Online at http://mpra.ub.uni-muenchen.de/19010/MPRA Paper No. 19010, posted 7. December 2009 03:08 UTC

1
[Pradhan, J.P. (2006) ‘How Does Trade, Foreign Investment, and Technology Affect Employment Patterns in Organized Indian Manufacturing?’, Indian Journal of Labour Economics, 49(2), pp. 249–272.]
How Do Trade, Foreign Investment, and Technology Affect Employment Patterns in Organized Indian Manufacturing?
Jaya Prakash Pradhan
Acknowledgement: This paper has been prepared as a part of the IDPAD research project, entitled: Globalisation and Informalisation: Consequences for Skill formation, Security and Gender conducted at the Gujarat Institute of Development Research, Ahmedabad. It represents a substantially improved version of the paper earlier presented at two seminars held in GIDR, Ahmedabad and the India International Center, New Delhi. I thank Jeemol Unni, Rakesh Basant, Ashok Mathur, T.S. Papola, R. Nagaraj, Sebastian Morris, Arup Mitra, Uma Rani, among other participants, for their helpful comments and feedback. I am also grateful to Amalendu Jyotishi for discussions and Archana Dwivedi for assistance in the preparation of dataset used in the study. Helpful suggestions from an anonymous referee of the journal are gratefully acknowledged.

2
How Do Trade, Foreign Investment, and Technology Affect Employment Patterns in Organized Indian Manufacturing?
___________________________________________________________________________ The present study investigates into the impact of trade, foreign investment, and technology on three different employment patterns in India’s organized manufacturing sector. These employment patterns cover three disadvantage categories of workers viz., women vis-à-vis men workers, contract vis-à-vis regular workers and unskilled vis-à-vis skilled workers. A conceptual and empirical framework has been developed linking these employment patterns to trade, foreign investment, and technology, and tested for a sample of Indian industries. The research suggests that trade has been employment promoting for women and unskilled workers while it has remain neutral between contract and regular workers. The impact of foreign investment has been observed to be negative for contract and unskilled workers. The overall impact of technology encompassing in-house R&D, foreign technology imports, and capital-intensity has been mostly negative for women and unskilled workers but positive for contract workers. JEL Classification: Employment Patterns; Trade; Foreign Investment; Technology Keywords : J21; J23; F10; F21; O30 ___________________________________________________________________________ 1. Introduction The Indian economy is passing through a phase of ‘jobless growth1’. The national output has
accelerated much ahead of employment constricting the employment generating effect of output
during the 1990s as compared to the past (Planning Commission 2001)2. Similar to the economy
wide trend, the Indian manufacturing has also exhibited a declining trend in employment growth
rate and elasticity. The rate of employment growth in manufacturing has marginally slowed
down from 2.14 percent in 1983-94 to 2.05 percent in 1994-20003. This decelerating trend in
employment generation has led to a general concern in India about the impact of economic
reforms on employment. It is widely held that the process of economic reforms including trade
liberalization implemented in the 1990s and withdrawal of state from many production activities
are the main factors for employment deceleration. The forces of competitive pressure generated
by free imports and entry of large number of foreign enterprises may have forced small sized
Indian firms to go out of the business and compelled large sized firms to improve their
productivity by shifting to capital-intensive and skilled biased technologies, consequently
reducing the scope for employment expansion. Therefore, the above view identified trade,
1 Indian Express (2004) ‘Unemployment threatens India’s economic boom’, April 19, 2004. 2 For each percent increase in national output, the employment has gone up by only about 0.15 percent during 1993-94 to 1999-2000, down from 0.41 witnessed during 1983 to 1993-94. Source: Table-3.1, pp-46, Report of the Task Force on Employment Opportunities, Planning Commission, Government of India, July 2001. 3 This measure of employment growth rate is based on usual principal and subsidiary status (UPSS). Ibid, Table-2.5, pp.22.

3
foreign investment and technical change as three important channels for lower employment
performance in Indian manufacturing. There have been several studies investigating the exact
impact of trade, technology and foreign investment on the level employment in Indian industries
like Singh and Agarwal (1999), Goldar (2002), Pradhan, Abraham and Sahoo (2004) and Banga
(2005). However, how these forces affect the patterns of employment is yet to receive any
attention.
Trade, technology or foreign investment, not only affect the level of employment performance
but also can change patterns of employment. The issue of employment must take into account
how the impact of trade, technology, or foreign investment is distributed among different groups
in the labour market. Do women workers suffer disproportionately from trade as compared to
men workers? Does trade result in more contractualization of employment? Or, how does trade
affect the non-skilled workers relative to the skilled workers? These questions can also be asked
for technology or foreign investments and have a critical bearing on employment problems in a
labour-surplus economy like India. The issues of employment opportunities for women, contract
and unskilled workers are also important because these groups are weakest group vis-à-vis their
counterparts in the labour market with a higher level of job insecurity, low wages, poor working
conditions and vulnerability to exploitation. An understanding of the impact of trade, technology
and FDI on such disadvantage category of workers is further useful for government policies
aimed at managing employment in an era of increasing globalization.
The objective of present study is to investigate the impact of trade, foreign investment and
technology on employment patterns in India’s organized manufacturing sectors in the reform
period. Section 2 examines the industrial distribution of various patterns of employment like
gender, contract, and unskilled workers. The theoretical link between employment patterns and
these three factors are explored in section 3. Then empirical models were developed and tested
for a sample of Indian organized industries in section 4. Section 5 includes a brief summary of
main findings from the study and policy implications.
2. Industrial Patterns of Employment Women Employment Pattern The industrial patterns of women employment in Indian organized manufacturing in the period
1995-96 to 2001-02 have been summarized in Table-1. Three stylized facts about women

4
employment can be discernable. First, it is characterized by a high degree of concentration. A
few leading sectors, at 3-digit level of industrial classification, accounted for rather a very high
disproportionate share of total women employment. The top three industries (out of a total of 37
industries) together make up for more than 70 percent of the total women employment in 2001-
2002. These industries are other food products (24 percent), tobacco products (23 percent) and
wearing apparel (23 percent). Other chemical products with 8 percent and spinning, weaving and
finishing of textiles with 7.6 percent of employment share are other industries contributing
significantly to female employment. Second, majority of these women-employment-contributing
industries (except other chemical products) are manufacturers of low-technology products based
on labour-intensive production processes. The international market for these products is highly
contested with competitiveness driven largely by low prices. Female workers with their low
bargaining power seem to have provided a source of competitiveness for industries based in a
labour abundant country like India. Third, industrial concentration in female employment has
increased since the late 1990s. Between 1995-96 and 2001-02 the employment share of top three
women-employment-contributing industries has increased by 16 percentage-points from 54
percent to 70 percent.
Compared to men, women make up a very low proportion in employment in the organized
manufacturing sector. For every 100 male workers employed, on an average, just 28 female
workers are employed in 2001-02. However, it is encouraging that female employment as a
percent of male employment has been growing and became more than doubled between 1995-96
and 2001-02 from 13 percent to 28 percent. Of the total 37 industries, there are just two
industries (tobacco products and wearing apparel) that employed more female workers than
male workers in 2001-02. Other industries have provided less employment opportunities to
women than men and in only three industries namely footwear, other food products and leather,
where women had at least half of the employment opportunities enjoyed by their male
counterparts.

5
Table-1 Inter-industry Patterns of Female Employment in Indian Organized Manufacturing, 1995-96 to 2001-02
As a Percent of Total Female Employment
As a percent of Male Employment NIC
1998 Industry 1995-96 2001-02
Difference (Column 4 minus 5)
1995-96 2001-02Difference(Column 7 minus 6)
151 Meat, fish, fruit, vegetables, oils 1.85 0.61 -1.24 13.98 16.35 2.37 152 Dairy products 0.19 0.16 -0.03 2.88 3.62 0.74
153 Grain mill products, starches and starch products 2.47 0.19 -2.28 9.88 8.56 -1.32
154 Other food products 19.06 23.88 4.82 30.06 52.52 22.46 155 Beverages 0.46 0.39 -0.07 9.62 8.64 -0.98 160 Tobacco products 19.55 23.47 3.92 150.37 375.73 225.36 171 Spinning, weaving and finishing of textiles 7.19 7.55 0.36 4.51 7.22 2.71 172 Other textiles 1.18 0.70 -0.48 12.88 16.95 4.07 181 Wearing apparel, 15.50 23.04 7.54 89.18 202.99 113.81 191 Leather; luggage, handbags saddlery 0.84 1.12 0.28 15.29 49.45 34.16 192 Footwear 3.46 3.30 -0.16 59.10 80.82 21.72 201 Saw milling and planning of wood 0.49 0.00 -0.49 6.75 6.43 -0.32 210 Paper and paper product 0.70 0.28 -0.42 4.36 3.14 -1.22 221 Publishing 0.69 0.05 -0.64 3.75 1.87 -1.88 231 Coke oven products 0.29 0.19 -0.1 4.01 9.19 5.18 241 Basic chemicals 0.28 0.09 -0.19 1.39 0.75 -0.64 242 Other chemical products 10.28 8.08 -2.2 28.86 44.65 15.79 243 Manmade fibers 0.01 0.01 0 0.17 0.44 0.27 251 Rubber products 0.32 0.38 0.06 2.63 4.95 2.32 252 Plastic products 0.61 0.32 -0.29 5.34 7.51 2.17 261 Glass and glass products 0.22 0.14 -0.08 3.63 3.67 0.04 269 Non-metallic mineral products n.e.c. 4.81 0.71 -4.1 15.03 4.73 -10.3 271 Basic Iron and steel 0.87 0.63 -0.24 1.28 2.28 1
281 Structural metal products, tanks, reservoirs and steam generators 0.51 0.02 -0.49 1.47 0.68 -0.79
291 General purpose machinery 0.47 0.19 -0.28 0.99 1.83 0.84 293 Domestic appliances n.e.c 0.31 0.16 -0.15 5.37 7.77 2.4 300 Office, accounting and computing machinery 0.37 0.17 -0.2 25.08 25.47 0.39 311 Electric motors, generators and transformers 1.05 0.14 -0.91 4.34 3.29 -1.05
321 Electronic valves and tubes and other electronic components 2.67 0.85 -1.82 25.50 34.41 8.91
331 Medical appliances and instruments and appliances for measuring 0.23 0.34 0.11 7.33 14.78 7.45
332 Optical instruments and photographic equipment 0.06 0.09 0.03 11.50 28.87 17.37
333 Watches and clocks 0.95 0.37 -0.58 46.16 38.41 -7.75 341 Motor vehicles 0.34 0.12 -0.22 1.39 1.57 0.18 351 Ships and boats 0.22 0.00 -0.22 0.88 0.08 -0.8 359 Transport equipment n.e.c. 0.25 0.13 -0.12 1.59 1.25 -0.34 361 Furniture 0.03 0.01 -0.02 1.22 0.94 -0.28 369 Manufacturing n.e.c 1.25 2.07 0.82 16.97 39.16 22.19 Total 100 100 0.00 13.01 28.39 15.38 Note: The employment data for 1995-96 is in terms of NIC 1987 and has been mapped into NIC 1998 using the concordance Table-1 provided in the appendix. Further, as the data for 1995-96 covers the factory sector unlike that for 2001-02 which covers the census sector, a caution has to be borne in mind. Nevertheless, since the census sector

6
constitutes about 60 percent of total factory sector employment (for 2001-02); the employment pattern between these years can be broadly compare keeping in mind the above limitation. Source: Computation based on (i) Annual Survey of Industries 1995-96, Volume-I (ii) Annual Survey of Industries 2001-2002 Statistics on Employment and Labour Cost in Census Sector. Contract Employment Pattern Similar the case of women employment, a concentrated pattern is observed in the industrial
distribution of contract workers. However, as compared to female employment, the nature of
concentration is relatively less in contract employment. Nearly 39 percent of total contractual
employment in Indian manufacturing is absorbed in one industry, namely, tobacco products in
2001-02 (Table-2). Non-metallic mineral products (7.2 percent), iron and steel (6.6 percent),
other food products (5.7 percent), spinning, weaving and finishing of textiles (5.6 percent) and
other chemical products (5.5 percent) are other industries that had contributed at least about
employment share of 5 percent. As in the case of women employment, low technology
industries are found to be major employers of contract workers in Indian organized
manufacturing. Further, the industrial concentration of contract employment has increased
between 1995-96 and 2001-02. The top three industries that accounted for 27 percent of
employment share in 1995-96 now claimed for more than 52 percent of total contract
employment in 2001-02. Remaining 48 percent share is distributed among a large number of
other industries.
As can be seen from Table-2, the contractual system of labour is widely prevalent among the
organized manufacturing industries. Indian manufacturing as a whole employed 27 contract
workers for every 100 regular workers in 2001-02. Between 1995-96 and 2001-02, the ratio of
contract workers to regular workers has grown from 17.7 percent to 27.2 percent. The use of
contract relative to regular workers has grown significantly between above periods for most of
the individual industries. The industry groups such as tobacco products and manufacturing of
meat, fish, fruit, vegetables and oils have, in particular, generated more jobs for contract workers
than regular workers. Other important contract-labour-intensive industries are office, accounting
and computing machinery, mill products, beverages, non-metallic mineral products and ships
and boats.
The increasing reliance of organized manufacturing on contractual employee arrangement may
be due to the labour restructuring process that Indian enterprises undertaken in response to an
intense competition in the 1990s. Large Indian enterprises in the organized sector realized that it

7
is possible to achieve maximum competitiveness just relying on a relatively small core group of
permanent or regular employees who will provide niche business functions covering technical,
managerial, human resource and business leadership. This core group is supported by another
group of temporary/contract workers who are employed to meet company’s changing demand
for labour. This strategy helped Indian enterprises to have greater flexibility in dealing with
labour in otherwise strict labour regulations existing in India. In addition, it has assisted them to
substantially reduce their costs as contract workers generally have lower wages and are not
eligible for medical, retirement and other benefits that accrue to regular workers.
Table-2 Inter-industry Patterns of Contract Employment in Indian Organized Manufacturing, 1995-96 to 2001-02
As a Percent of Total Contract Employment
As a percent of Regular Employment NIC
1998 Industry 1995-96 2001-02
Difference(Column 4 minus 5)
1995-96 2001-02 Difference(Column 7 minus 6)
151 Meat, fish, fruit, vegetables, oils 2.87 3.79 0.92 28.54 107.03 78.49 152 Dairy products 0.79 1.48 0.69 17.81 40.36 22.55
153 Grain mill products, starches and starch products 4.90 1.54 -3.36 26.82 78.04 51.22
154 Other food products 3.31 5.67 2.36 6.02 10.06 4.04 155 Beverages 0.87 2.43 1.56 25.26 60.39 35.13 160 Tobacco products 23.82 38.65 14.83 109.86 159.99 50.13 171 Spinning, weaving and finishing of textiles 16.87 5.62 -11.25 16.83 6.16 -10.67 172 Other textiles 0.66 0.83 0.17 9.65 21.12 11.47 181 Wearing apparel, 0.46 1.43 0.97 2.08 5.13 3.05 191 Leather; luggage, handbags saddlery 0.16 0.38 0.22 3.84 13.86 10.02 192 Footwear 0.57 0.86 0.29 9.14 14.31 5.17 201 Saw milling and planning of wood 0.58 0.00 -0.58 11.31 10.74 -0.57 210 Paper and paper product 2.46 3.34 0.88 22.09 43.97 21.88 221 Publishing 0.35 0.09 -0.26 2.76 4.55 1.79 231 Coke oven products 1.00 0.22 -0.78 19.64 11.94 -7.7 241 Basic chemicals 2.88 4.00 1.12 21.45 38.68 17.23 242 Other chemical products 4.64 5.50 0.86 15.17 25.85 10.68 243 Manmade fibers 0.30 0.58 0.28 7.21 20.58 13.37 251 Rubber products 0.56 0.73 0.17 6.69 11.14 4.45 252 Plastic products 0.78 1.03 0.25 9.68 27.74 18.06 261 Glass and glass products 0.68 0.88 0.2 16.49 27.97 11.48 269 Non-metallic mineral products n.e.c. 9.94 7.17 -2.77 40.59 56.35 15.76 271 Basic Iron and steel 10.53 6.59 -3.94 22.89 28.76 5.87
281 Structural metal products, tanks, reservoirs and steam generators 2.84 1.24 -1.6 12.17 45.19 33.02
291 General purpose machinery 2.07 1.01 -1.06 6.41 11.55 5.14 293 Domestic appliances n.e.c 0.46 0.20 -0.26 11.44 11.29 -0.15 300 Office, accounting and computing machinery 0.33 0.61 0.28 26.95 87.96 61.01 311 Electric motors, generators and transformers 0.98 0.51 -0.47 5.85 13.79 7.94
321 Electronic valves and tubes and other electronic components 0.58 0.33 -0.25 6.68 12.06 5.38

8
331 Medical appliances and instruments and appliances for measuring 0.06 0.13 0.07 2.51 6.08 3.57
332 Optical instruments and photographic equipment 0.01 0.01 0 2.16 3.95 1.79
333 Watches and clocks 0.04 0.03 -0.01 1.87 2.43 0.56 341 Motor vehicles 1.18 0.48 -0.7 7.16 7.31 0.15 351 Ships and boats 0.48 0.52 0.04 2.86 55.30 52.44 359 Transport equipment n.e.c. 0.49 0.97 0.48 4.52 11.37 6.85 361 Furniture 0.09 0.33 0.24 5.91 28.11 22.2 369 Manufacturing n.e.c 0.41 0.84 0.43 7.11 14.03 6.92 Total 100 100 0.00 17.60 27.21 9.61 Note: The employment data for 1995-96 is in terms of NIC 1987 and has been mapped into NIC 1998 using the concordance Table-1 provided in the appendix. Further, as the data for 1995-96 covers the factory sector unlike that for 2001-02 which covers the census sector, a caution has to be borne in mind. Nevertheless, since the census sector constitutes about 60 percent of total factory sector employment (for 2001-02); the employment pattern between these years can be broadly compare keeping in mind the above mentioned limitation. Source: Computation based on (i) Annual Survey of Industries 1995-96, Volume-I (ii) Annual Survey of Industries 2001-2002 Statistics on Employment and Labour Cost in Census Sector. Unskilled Employment Pattern Table-3 illustrates the industrial distribution of unskilled employment in Indian manufacturing.
This information has been calculated from the unit level NSSO (National Sample Survey) data,
50th and 55th round on employment/unemployment survey. In defining skill, all workers aged 15
to 64 years who have completed schooling of higher secondary and above are taken as skilled
workers and workers with below this specified education level are classified as unskilled
workers. It should be noted the data presented in Table-3 covers both organized and unorganized
sector, hence have a much larger coverage than the ASI.
Among all the three aspects of the employment pattern considered here, the unskilled
employment is the least concentrated at 3-digit level of NIC industrial groups. The employment
share of top three industries in total unskilled employment was just 35.4 percent in 1993-94 and
has declined to 31.6 percent in 1999-00. The unskilled employment pattern is dominated by such
industrial groups as spinning, weaving and finishing of textiles (16 percent), structural metal
products (8.5 percent), other food products (6.9 percent), wearing apparel (5.9 percent) and
tobacco products (5.1 percent).
In terms of relative employment generation, this is the only employment pattern where Indian
manufacturing has employed relatively more unskilled workers as compared to skilled workers.
For every 100 skilled workers, on average, 129 unskilled workers are employed in 1999-00. A
total of 19 industries out of 36 industries that had provided more number of employment to
9
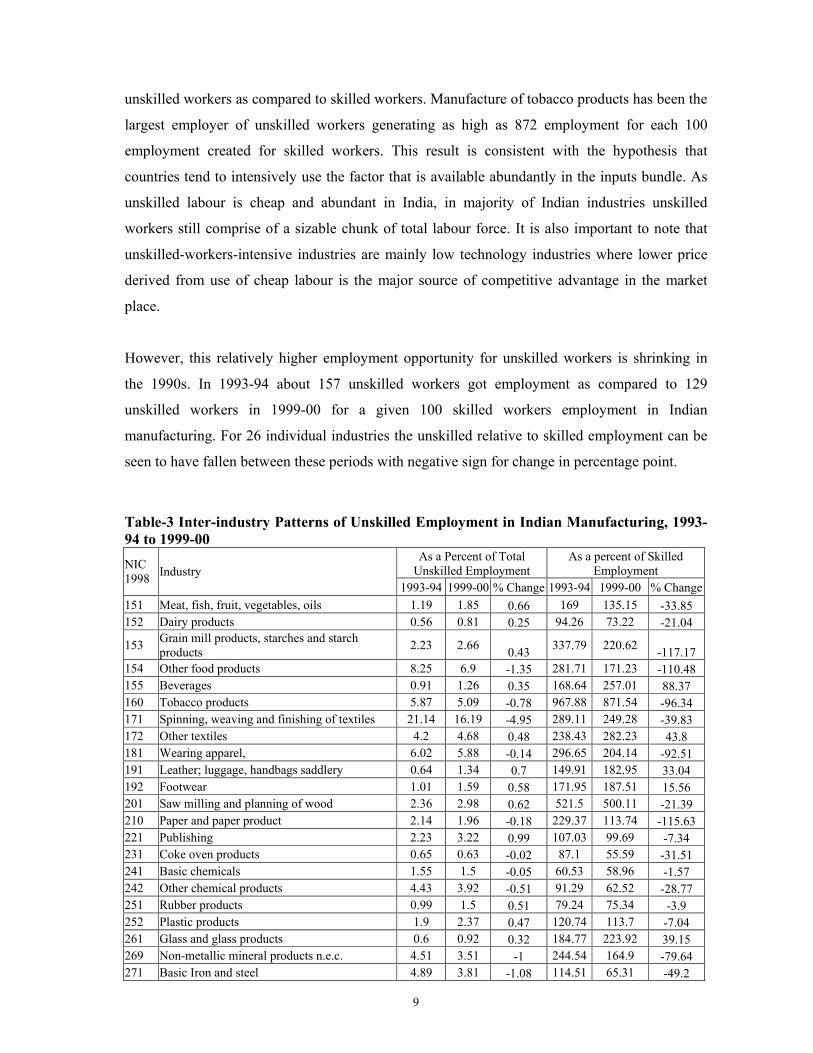
unskilled workers as compared to skilled workers. Manufacture of tobacco products has been the
largest employer of unskilled workers generating as high as 872 employment for each 100
employment created for skilled workers. This result is consistent with the hypothesis that
countries tend to intensively use the factor that is available abundantly in the inputs bundle. As
unskilled labour is cheap and abundant in India, in majority of Indian industries unskilled
workers still comprise of a sizable chunk of total labour force. It is also important to note that
unskilled-workers-intensive industries are mainly low technology industries where lower price
derived from use of cheap labour is the major source of competitive advantage in the market
place.
However, this relatively higher employment opportunity for unskilled workers is shrinking in
the 1990s. In 1993-94 about 157 unskilled workers got employment as compared to 129
unskilled workers in 1999-00 for a given 100 skilled workers employment in Indian
manufacturing. For 26 individual industries the unskilled relative to skilled employment can be
seen to have fallen between these periods with negative sign for change in percentage point.
Table-3 Inter-industry Patterns of Unskilled Employment in Indian Manufacturing, 1993-94 to 1999-00
As a Percent of Total Unskilled Employment
As a percent of Skilled Employment NIC
1998 Industry 1993-94 1999-00 % Change 1993-94 1999-00 % Change
151 Meat, fish, fruit, vegetables, oils 1.19 1.85 0.66 169 135.15 -33.85 152 Dairy products 0.56 0.81 0.25 94.26 73.22 -21.04
153 Grain mill products, starches and starch products 2.23 2.66 0.43 337.79 220.62 -117.17
154 Other food products 8.25 6.9 -1.35 281.71 171.23 -110.48 155 Beverages 0.91 1.26 0.35 168.64 257.01 88.37 160 Tobacco products 5.87 5.09 -0.78 967.88 871.54 -96.34 171 Spinning, weaving and finishing of textiles 21.14 16.19 -4.95 289.11 249.28 -39.83 172 Other textiles 4.2 4.68 0.48 238.43 282.23 43.8 181 Wearing apparel, 6.02 5.88 -0.14 296.65 204.14 -92.51 191 Leather; luggage, handbags saddlery 0.64 1.34 0.7 149.91 182.95 33.04 192 Footwear 1.01 1.59 0.58 171.95 187.51 15.56 201 Saw milling and planning of wood 2.36 2.98 0.62 521.5 500.11 -21.39 210 Paper and paper product 2.14 1.96 -0.18 229.37 113.74 -115.63 221 Publishing 2.23 3.22 0.99 107.03 99.69 -7.34 231 Coke oven products 0.65 0.63 -0.02 87.1 55.59 -31.51 241 Basic chemicals 1.55 1.5 -0.05 60.53 58.96 -1.57 242 Other chemical products 4.43 3.92 -0.51 91.29 62.52 -28.77 251 Rubber products 0.99 1.5 0.51 79.24 75.34 -3.9 252 Plastic products 1.9 2.37 0.47 120.74 113.7 -7.04 261 Glass and glass products 0.6 0.92 0.32 184.77 223.92 39.15 269 Non-metallic mineral products n.e.c. 4.51 3.51 -1 244.54 164.9 -79.64 271 Basic Iron and steel 4.89 3.81 -1.08 114.51 65.31 -49.2

10
281 Structural metal products, tanks, reservoirs and steam generators 5.35 8.47 3.12 121.94 134.11 12.17
291 General purpose machinery 4.41 3.75 -0.66 80.62 67.47 -13.15 293 Domestic appliances n.e.c 0.47 0.44 -0.03 35.36 68.33 32.97 300 Office, accounting and computing machinery 0.08 0.05 -0.03 25.92 8.05 -17.87 311 Electric motors, generators and transformers 1.81 3.85 2.04 58.17 65.81 7.64
321 Electronic valves and tubes and other electronic components 0.71 0.45 -0.26 28.6 27.15 -1.45
331 Medical appliances and instruments and appliances for measuring 0.08 0.04 -0.04 23.57 14.95 -8.62
332 Optical instruments and photographic equipment 0.08 0.08 0 65.27 144.62 79.35
333 Watches and clocks 0.23 0.07 -0.16 66.28 33 -33.28 341 Motor vehicles 0.72 1 0.28 64.38 47.47 -16.91 351 Ships and boats 0.62 0.01 -0.61 36.18 3.93 -32.25 359 Transport equipment n.e.c. 1.18 1.45 0.27 67.07 86.35 19.28 361 Furniture 1.23 1.26 0.03 290.73 227.12 -63.61 369 Manufacturing n.e.c 4.78 4.49 -0.29 297.37 183.55 -113.82 Total 100 100 0.00 157.36 128.84 -18.13 Source: Computation based on the individual records of the National Sample Survey Organisation, Employment and Unemployment Survey, 193-94 (50th Round) and 1999-00 (55th Round)
3. Trade, Foreign Investment, Technology and Patterns of Employment: Theoretical Linkages In the neoclassical labour markets based on perfect competition, workers are assumed to be
homogeneous. However, in real world situations, workers are basically non-homogeneous in
character. They vary by training, skill, experience, gender, and nature of employment. Given this
fact, three types of employment pattern are distinguished in the study. These are employment by
gender, by contract vis-à-vis regular workers and by skilled vis-à-vis unskilled workers.
Meaning of gender pattern is quite obvious in that it measure employment of women workers
relative to men workers. Contract workers are defined as all those who were not employed
directly by an employer but through the contractor. These workers include those employed with
the knowledge of the principal employer as well as without his knowledge. Regular workers are
persons directly employed by the employer. Hence, the ratio of contract workers to regular
workers measures the contractual employment patterns in Indian industries. Skilled/unskilled
workers are defined with reference to workers level of educational attainment. Skilled workers
include all workers aged 15 to 64 years who have completed schooling of higher secondary and
above. Worker falling below the specified level of educational qualifications are grouped as
unskilled workers. The ratio of unskilled to skilled workers has been taken to capture inter-
industry differences in skill patterns of employment.

11
In what follows, we are briefly discussing the impact of trade, foreign investment, and
technology on these patterns of employment.
3.1 Trade and Patterns of Employment As trade is increasingly becoming important component of national output, it can be expected to
affect the pattern of employment simply because demand for labour is a derived demand from
output. The liberalization measures undertaken by countries at multilateral, regional and bilateral
level over the past two decades have significantly improved the role of trade in labour market
outcomes. As far as gender pattern of employment is concerned trade is predicted to affect
employment of women differently than men. This is mainly because labour market behaviour of
women is different from men. As compared to men, women’s participation in the labour market
as paid workers is constrained by two major factors (Fontana 2003). They have a primary role in
reproductive process as mothers and caregivers to the family (resulting in time and space
constraints, e.g. maternity leave, time spend in child etc.) and also face socio-cultural barriers in
improving their competitive advantages as workers through skill and knowledge accumulation.
Women have disproportionately less access to education, health facilities, and less access to and
control over economic resources. As a result of these factors, women make up a greater
proportion among the less-skilled workers and that is also in few labour-intensive manufacturing
industries like textile, apparel, leather, toys, and food processing.
Trade may affect women employment relative to men employment in both positive and negative
ways. If trade results in increased import competition for women-intensive sectors including
small-scale and informal sectors, then women may suffer from disproportionately larger
employment losses. This may be true for Indian economy, as labour-intensive products
constitute a larger proportion of total exports that are facing increasing competition from least
developed countries. On the other hand, if trade results in expansion of export-oriented sectors,
which are labour-intensive in India according to Heckscher-Ohlin theory, then this may results
in more employment opportunities for women as they work for low wages and in poor working
conditions. If trade, both export promotion and import competition results in capital-intensive
and skill-biased production process then women are likely to loose employment as they have
low level of skill and knowledge. In another way import competition may lead to higher women
employment if enterprises replace male workers by female workers to reduce cost as latter work
for lower pay than former. A study based on two developed countries, Germany and Japan,
investigating the effects of manufacturing trade expansion on men and women's employment

12
found trade had a more negative effect on women's than men's manufacturing employment in
Japan and a roughly equal effect in Germany (Kucera 2001). Because trade involves positive
and negative outcomes on gender, the nature of overall impact on gender patterns of
employment is uncertain.
The impact of trade on unskilled workers relative to skilled workers can be argued to be largely
negative. As improving skill-base becomes a key competitive strategy of the firms’ to meet the
import challenges and to improve export performance, the likely result seems to be a shift in the
skill mix by the substitution of unskilled workers in favor of skilled workers. This phenomenon
is known as the trade induced skill-biased technological change. Earlier empirical results on the
impact of trade on relative demand for unskilled vis-à-vis skilled workers are however mixed.
While Lee and Schluter (1999) failed to find any role of trade in the changes in demand for
skilled and unskilled labor during 1972-92 in the case of the US, Revenga (1995) for Mexico
manufacturing and Oscarsson (2000) for Swedish manufacturing found that import
liberalization/competition did play a role. The reduction in Mexico’s tariff levels during the
period 1985-87 is observed to be associated with a slight shift in the skill mix in favor of non-
production workers (a proxy for skilled workers). The import competition during 1975-93 is
shown to have a significant negative effect on the employment of both labour groups in the
Swedish manufacturing sector but the effect was larger for non-production workers than for
production workers (a proxy for unskilled workers). In a recent study Sánchez-Páramo and
Schady (2003) for five Latin American countries (Argentina, Brazil, Chile, Colombia, and
Mexico), found strong evidence of increases in the demand for skilled workers exception being
Brazil. They identified trade as an important transmission mechanism for this increase in the
demand for the most skilled workers.
The trade can also change the composition of workers by contract vis-à-vis regular workers.
Usually cutting down the labour costs has been the firm’s immediate response to the
competition from abroad caused by the trade liberalization like import tariff reductions.
Replacing regular workers with contractual workers turn out to be the most preferred option as
the costs associated with regular workers are relatively higher as they are regulated by labor
market legislation. Regular workers are entitled to several benefits and employment security, as
compared to contractual workers who are not covered by the legal framework for social
protection. The study done by Currie and Harrison (1997) on Morocco shows that the
implementation of trade liberalization programme led to the hiring of more temporary workers
by Mexican firms.

13
3.2 Foreign Investment and Patterns of Employment Inward FDI can be an important contributing factor in changing the patterns of employment in a
host country. There are two reasons for this expectation. First, foreign affiliates are a different
group of firms than the domestic enterprises in terms of knowledge-intensiveness. The
traditional theory of industrial organization, as initially proposed by Hymer (1960) and extended
by many others, predicts that foreign investment in a host country occurs only when the overseas
firm has a set of firm-specific intangible assets like technology, skills, brand names, etc. These
assets provide some competitive advantages to the investing firms over the local enterprises
through local production rather than exporting or licensing. Studies have confirmed that foreign
firms typically are more productive, more capital intensive, employ more skilled workers, and
pay higher wages than otherwise their domestic plants (e.g. Agarwal 1976, Doms and Jensen
1998, Jenkins 1990). Given these differential behaviour, entry of foreign firms tends to produce
differential outcomes for different groups in the labour market. Foreign investment with its skill-
biased and capital-intensive technolgouies can be predicted to shift employment structure by
increasing the relative demand for skilled workers. Foreign firms also shift the employment
patterns via technology spillovers that they generates in the host country (Driffield and Taylor
2000). These spillovers in turn increase the relative demand for skilled workers in the domestic
firms, further strengthening the aggregate impact of FDI on employment pattern. In this context,
FDI can assumed to be a source of lesser employment opportunities for women relative to men
as women constitute a larger proportion of unskilled workers while male dominate skilled
workers. The high-skilled nature of production in foreign affiliates can further be inferred to
employ more of regular workers with required skills and pay higher to reduce cost of lossing
them.
3.3 Technology and Patterns of Employment Since last 70 years or so, technology is known to substitutes the workers in favour of physical
capital (labour-saving bias of technical change) especially in labour-scarce countries as well as
to disproportionately increase the demand for skilled workers (Acemoglu 2002, Berman, Bound
and Machin 1998, Berman and Machin 2000). Moreover, the physical capital and skill are
observed to be complementary in nature (e.g. Goldin and Katz 1998). Therefore, technological
changes in the forms of new capital goods or process and product innovation have redefined the
nature of skills required for works. The pattern of employment changes as new technologies
work to redesign workforce by varying the demand for different category of workers according
to their observed differences in knowledge intensiveness. In Indian context, Unni and Rani
14
(2005) have shown that technical change in the manufacturing sector has been skill-biased in the
period between 1993-94 and 1999-00 thus, increasing the relative demand for skilled worker.
Technical development is also gender specific and asymmetrically affect women and men in the
labor markets. Technological change tends to reduce work opportunities for women as they have
few skills to match the requirement of new production technologies. While women are slow in
acquisition and upgrading of skills due to the social bottlenecks they face and their
disproportionately greater role in the reproductive sector, technical change is likely to deskill
them in labour market by increasingly rendering their exiting skills irrelevant for new
employment opportunities. Technological change can also have strong impact on the pattern of
employment between regular and contract workers. The impacts can work in both positive and
negative way for contract workers. The emergence of flexible organization, production and
business practices based on new technologies is inherently pushing firms to keep their niche
business functions to a selected group of regular ‘knowledge workers’ while shifting other
production activities away from formal to informal workforce (directly or through contractor).
This phenomenon of increasing use of contract workers is further becoming a strengthening
trend for circumventing labour regulations and lowering labour costs. Technological change can
work in negative way for contract workers if it causes firms to employ more of regular workers
to ensure that skills and quality of human capital required by new technologies doesn’t migrate
to competitors. Okada (2004) in a case study of 50 component suppliers in Indian auto industry
noted a significant change in the patterns of skills employment and found that these firms are
increasingly choosing regular long-term employment practices over hiring casual workers on
account of introduction of new forms of work organization and for meeting the requirements of
improved products and process quality standards. Therefore, the nature of the aggregate impact
of technological change on contract pattern of employment can be positive or negative
depending on the relative strength of these rival effects.

15
4. Methodology of Analysis 4.1 The Empirical Framework The starting point of our empirical model is the fact that the changes in the pattern of
employment are an outcome of long-term employment strategy followed by business
enterprises. The composition of workers by skills, gender or nature (i.e. regular vis-à-vis
contractual type) may not be expected to change substantially in the short-run. In this context,
the impact of our causal variables like trade, foreign investment or technology can be assumed
to affect different patterns of employment in a cumulative manner. This assumption implies that
fluctuations in trade performance like export intensity on yearly basis doesn’t lead a firm to
change its composition of workers in a corresponding fashion.
Accordingly, the existing patterns of employment like the ratio of unskilled to skilled workers
for a particular year, say in 1999-2000, can be arguably a result of an inter-temporal labour
adjustment process that has taken place in Indian manufacturing for many preceding years
during 1990s. Technology, trade or foreign investment might have played significant role in that
process by shifting the relative labour demand function for one type of workers against another.
In particular, in our model we ask the question- do the past cumulative values of a causal
variable for a specified period can explain the current pattern of employment. For example, the
cumulative R&D intensity from 1990-91 to 1998-99 has been specified as an independent
variable for explaining the pattern of employment relating to the year 1999-2000. For
employment pattern of 2000-01 and 2001-02, the cumulative figures of R&D intensity from
1990-91 to 1999-00 and from 1990-91 to 2000-01 have been used respectively. Perhaps this is a
simple way to investigate whether the R&D activities in Indian industries during 1990s has
played any role in the patterns of employment that characterizes Indian industries today.
Apart from trade, foreign investment and technology, the relative differences in labor demand
between different types of workers (e.g. male and female workers) also depend on the relative
wage rate. The employment ratio of female to male workers may decrease if the wage rate of
female workers rises faster as compared to that of male workers. Given the feasibility and extent
of interchangeability between the two types of workers, firms may benefit substantially by
employing more of cheap male workers than costly female workers. Hence, we can predict a
negative relationship between the ratios of wage rate of female to male workers and the relative
employment of the two categories of workers.

16
Inter-industry differentials in the pattern of employment can also be related to the average size
and age of enterprise. As large size firms are leader in innovation and have sufficient financial
resources, they are likely to employ more of skilled workers per unskilled workers as well as
provide them with employment security (regular employment) and higher pay incentives
designed to minimize labor turnover. Women workers embodying relatively lower skills may be
negatively affected. The theoretical link between the age of firm and the skill pattern of
employment is clear in that a younger generation of firms employing new vintage of capital
goods and new organizational strategy are like to hire more of skilled workers than unskilled
workers. Thus, higher firm age is expected to favourably affect the unskilled to skilled
employment ratio. The new genre of younger firms can also be assumed to have relatively less
gender differences in employment than firms that have been in business for longer. This is partly
because of rising women literacy in recent years and lessening of social restrictions on women’s
participation in paid employment. Firm age may also play an important role in the contract
pattern of employment, as younger firms are likely to rely on more regular workers than contract
workers, as they are adopter of new technologies.
Table-4 lists together nine of our independent variables along with their hypothesized impact on
different kind of employment patterns. Trade has been split into two components namely exports
and import as a percent of value-added. Technology is represented by three variables such as in-
house R&D, foreign technology import and capital intensity. The in-house R&D expenditure
incurred as a percent of value-added is taken as a measure of the sector’s indigenous technology
acquisition. The technology payments made overseas for licenses, patents, knowhow, and
technical assistance as a percent of value-added is used as the measure of foreign technology
import. The capital to labour ratio is taken as an indicator of a sector’s embodied technology
acquisition. Foreign investment has been measured as the average share of foreign promoters in
total equity holding across firms in the industry. These independent variables, except the relative
wage rate and capital intensity, are introduced as one year lagged cumulative figure for a
specified period. Such a specification has double advantages. First, it removes any potential
causality that exists from the dependent variable to independent variables. Second, the
cumulative value of independent variable best captures its long-term impact on employment
pattern. In the empirical model, these seven independent variables are specified to linearly affect
the dependent variable, namely the ratio of one set of workers to another in a pattern of
employment (for example in the case of gender it is a ratio of female to male workers).

17
Table-4 List of Independent Variables Independent variable Proxy Hypothesized Effect on Employment Patterns
Import (IMP) • Ambiguous (?) for gender pattern • Negative (-) for unskilled pattern • Positive (+) for contract pattern
Trade
Exports (EXP) • Ambiguous (?) for gender pattern • Negative (-) for unskilled pattern • Negative (?) for contract pattern
In-house R&D (RDINT) • Negative (-) for gender pattern • Negative (-) for unskilled pattern • Ambiguous (?) for contract pattern
Foreign technology import (FTINT) • Negative (-) for gender pattern • Negative (-) for unskilled pattern • Ambiguous (?) for contract pattern
Technology
Capital-intensity (KLINT) • Negative (-) for gender pattern • Negative (-) for unskilled pattern • Ambiguous (?) for contract pattern
Foreign Investment Average Foreign Ownership (FDI) • Negative (-) for gender pattern • Negative (-) for unskilled pattern • Negative (-) for contract pattern
Firm Size Average Sales (SIZE) • Negative (-) for gender pattern • Negative (-) for unskilled pattern • Negative (-) for contract pattern
Firm Age Average Age in Years (AGE) • Negative (-) for gender pattern • Positive (+) for unskilled pattern • Positive (+) for contract pattern
Relative Wage Rate Relative Wage Rate (Wa/Wb) • Negative (-) for all patterns Note: Gender employment pattern is ratio of female to male workers. Unskilled employment pattern is the ratio of unskilled to skilled workers. Contract employment pattern is the ratio of contract to regular workers. The basic model used in the study takes the following specification:
Where the subscripts “a” and “b” stand for employment of two kinds of workers in the given
employment pattern (e.g. female and male workers in the case of gender pattern of
employment), “j” and “t” represent jth industry and tth year. “t*” stand for the cumulative years
up to ‘t-1’ year. L is the size of employment measured as the number of man-days worked. W is
the wage rate calculated as the wage cost per man-day worked. IMP and EXP respectively
denote the import and export as a percentage share of value-added. KLINT is the capital
intensity defined as fixed capital stock employed per unit of labour. RDINT and FTINT
respectively represent the percentage share of value added devoted to the in-house research and
)(98765
43210
***
****
AuWWAGESIZEFDIKLINT
FTINTRDINTEXPIMPLL
jtjtb
ajtjtjtjt
jtjtjtjtjtb
a
+
+++++
++++=
ααααα
ααααα

18
development (R&D) and importing foreign technology (measured as technology payments made
abroad). FDI is the average percentage share of foreign ownership in the total equity holding in
the industry. SIZE is the industry-wise value of average sales (Rs. Crore) and AGE is the
average age of firms in number of years.
Data Sources The data used in the empirical analysis originate from several sources. The industry level
average foreign ownership, R&D intensity, foreign technology import intensity, export intensity,
firm size and age were constructed from Prowess Database (2002) of the Centre for Monitoring
Indian Economy (CMIE). The database provides several firm-level financial indicators like
sales, R&D, value-added, etc., on about 4000 manufacturing enterprises. It also provides
industry-level aggregates but it has its own industrial classification markedly different from
standard industrial classification, namely NIC. This has led us to develop an industrial
concordance for mapping Prowess into NIC 1998 classification at 3-digit level. This
concordance assigns Prowess firms into different NIC category by utilizing the firm-level
‘economic activity’ classification available in the dataset at a more detailed level of dis-
aggregation. For some firms the activity classification was not reported in the Prowess and in
that case we relied on the Prowess industrial category to group them into the appropriate NIC
classification.
Information on employment (number of mandays worked) and wage rate (wages per manday
worked) for women, men, contract, and regular workers for 1999-2000, 2000-01 and 2001-02
has been taken from various reports of the Labour Bureau, Government of India, on Statistics on
Employment & Labour Cost in Census Sector. Data on skilled and unskilled employment
(number of mandays worked per week) and their wage rate (wages per manday worked in a
week) for 1993-94 and 1999-00 has been calculated from individual records of the Employment
and Unemployment Survey (50th and 55th Rounds) of the National Sample Survey Organisation
(NSSO)4. It is important to note that this information on skilled and unskilled employment relate
to the total manufacturing sector in India including unorganized sector. As the skill data is
separately not available for organized manufacturing sector we are constrained to use these
available information. However, as in the calculation of skill and unskilled employment we have
only included the regular workers excluding causal workers. As the casual workers form the
main chunk of employment in unorganized sector, exclusion of the same partially correct biases
4 I am thankful to Jeemol Unnni and Uma Rani for making available skill and unskilled employment data and providing trade-production concordance between HS and NIC.

19
due to the inclusion of unorganized sector in the survey in measurement of skill workers for
organized manufacturing.
The industry level capital intensity was taken from various ASI (Annual Survey of Industries)
reports of the Central Statistical Organization (CSO). Statistics on India’s import at 4 digit HS
(Harmonized System) classification were obtained from the India Trade database of the CMIE.
Using a trade-production concordance developed in-house at GIDR mapping HS 1996 into ISIC
Rev 3, the trade data were matched into production data. For calculating import intensity, the
industry-wise value-added taken from ASI reports of the CSO has been used as denominator.
4.2 Estimations and Results The specified model A is estimated separately for each of the three patterns of employment by
the pooled OLS method with robust standard errors correcting for heteroscedastic variance in the
residuals. Year-specific dummies are included in the estimation in order to control for any
intertemporal shifts. In every estimation, a few of the influential observations have been deleted
using Cook’s distance statistic (Cook 1977) which are above the cut-off point given by 4/n
where n is the number of observations. These data points unduly influence the magnitude and
significance of regression coefficients because of interactions between high leverage points and
their large residuals. Tests of multicollinearity in the form of variance inflating factor (VIF) has
been conducted among independent variables which reveals that it is not a problem in our
sample. Panel data estimation has not been attempted due to limited number of years, only three
years for gender (1999-2000 to 2001-02) and contract employment pattern and only two years
for skill pattern of employment (1993-94 and 1999-00).
Tables-5, 6 and 7 summarizes the findings of estimations for gender, contract and skill pattern of
employment. Along with the usual regression coefficients, fully standardized coefficients
(known as “beta” coefficients) are also furnished5. These scale-free standardized coefficients are
useful in comparing relative strength of different independent variables in explaining the
dependent variable. Overall all the estimated models for gender, contract and skill employment
patterns are significant by their individual F-statistics and respectively explain about 26, 24 and
51 percent of variations in the dependent variable. Considering the cross-sectional heterogeneity
5 These coefficients are obtained by running the model to the standardized dataset i.e., observations of all variables are subtracted from their respective sample mean and then are divided by their respective sample standard deviation.

20
in the data, these values of R-square appear to be reasonable. Employment patterns wise results
are discussed below.
Gender Pattern In explaining the gender pattern of employment the two trade variables, namely IMP and EXP
come up with a negative and positive signs respectively. While the coefficient for IMP remains
insignificant, that of EXP achieves a modest level of statistical significance. This suggests that
trade through export activities in Indian organized manufacturing is likely to generate more
employment opportunities for female workers as compared to male workers and hence tends to
be positively correlated with the female employment ratio. This result seems to corroborate the
prediction of the Heckscher-Ohlin theory as India’s export basket is heavily dominated by the
exports of labour-intensive goods. It appears that the expansion of these export-oriented sectors
in a relatively labour abundant country like India crucially depend upon the wage cost advantage
by employing more of women workers as compared to their male counterparts. The gender
pattern of employment seems to be insensitive to the import channel of trade.
All the three measures of technology, namely RDINT, FTINT and KLINT are observed to have
an adverse effect on the gender pattern of employment but only the impact of KLINT turns out
to be statistically significant. Therefore, technology in the form of mechanization of production
process is the single most important factor contributing towards lower female to male worker
ratio. Other things holding constant, higher fixed capital per workers has led to a lower scope for
female employment relative to male employment. The disembodied forms of technology
through in-house R&D and foreign technology import are generally not important factors
contributing to the gender gap in employment pattern in Indian manufacturing.
FDI has a predicted negative effect but it fails to reach an accepted level of statistical
significance. This would indicate that foreign investment does not affect the gender pattern of
employment in Indian manufacturing, once controlled for the impact of other factors. AGE has
got significantly negative impact on the gender pattern. Thus, this supports the prediction that
start-ups business enterprises provide relatively higher employment opportunities to women
relative to men workers than older enterprises. SIZE has a significantly positive influence on
gender pattern, differing from the postulated negative effect. It appears that larger firm in Indian
industries have followed a non-discriminatory approach in hiring policy as far as gender is
concerned and as compared to small size enterprises they seems to have provided more
employment opportunities to female workers relative to their male counterparts. The relative

21
wage rate comes up with a predicted negative sign and is statistically significant. This implies
that women and men workers are substitutable and firms are likely to employ less of women
workers when their wage rate ascends more rapidly than the wage rate of men workers.
Table-5 Impact of Trade, Technology, and Foreign Investment on Gender Pattern of Employment Dependent variable: Ratio of man-days worked by women to men worker
Independent Variable Coefficients (t-value)
Fully Standardized Coefficients
IMP -0.000025 (0.95) -0.0423
EXP 0.000457* (1.73) 0.1422
RDINT -0.000266 (0.02) -0.0014
FTINT -0.004516 (0.64) -0.0540
KLINT -0.807548*** (3.26) -0.2563
FDI -0.001584 (0.64) -0.0522
AGE -0.006732** (2.57) -0.2808
SIZE 0.000163* (1.81) 0.1502
Wa/Wb -0.202281***
(2.75) -0.2345
2001YDummy 0.019333 (0.52) 0.0475
2002YDummy 0.008825 (0.24) 0.0211
Constant 0.470488*** (4.15)
F(11, 125) 4.24 Prob > F 0.0000 R-squared 0.26 Observations 137 No. of Industries 48 Note: Robust t-statistics in parentheses; * significant at 10%; ** significant at 5%; *** significant at 1%; 2000 has been treated as base year in the estimation.
Therefore, the results established that the employment gap between women and men workers is
largely contributed by a set of five variables namely EXP, KLINT, AGE, SIZE and Wa/Wb with
their respective nature of influence. From policy perspective it is useful to know the relative
contribution of these variables to the existing gender gap in employment. In this case the
absolute values of standardized coefficients are quite helpful. AGE turns out to be the variable
accounting for the most variance in gender pattern, followed by KLINT, Wa/Wb, SIZE and EXP
22
Contract Pattern The estimates for IMP and EXP have respectively come up with a negative and positive signs.
However, none of these are statistically significant; suggesting that the contract pattern of
employment in Indian organized manufacturing is not significantly related to trade in either
form. Among three measures of technology, disembodied form like RDINT and FTINT have a
negative sign and the negative effect of the former turns out to be significant in statistical terms.
It suggests that technological activities in the form of in-house R&D tend to provide relatively
less employment opportunities for contract workers relative to regular workers. This
phenomenon is understandable because processing and production of technology-intensive
products necessitate that firms employ a group of regular skill workers. Further, R&D activities
require employment of scientists, engineer, and other technical manpower on a regular basis
altering the employment pattern. Unlike the impact of disembodied channel of technology, the
embodied channel measured by KLINT has a positive impact on the relative employment of
contract workers. It appear that more capital-intensive production processes may have made
possible for enterprises to keep the niche business functions with themselves through a group of
regular workers while outsource other functions to another set of workers on the basis of a
contractual arrangement.
FDI has performed as per the prediction and has a strong negative effect on contract
employment pattern. The entry of foreign firms, therefore, appears to be an important factor for
reducing relative employment opportunities for contract workers. The impact of AGE in
determining variations in the contract employment pattern turned out to be statistically
insignificant. SIZE has a predicted positive sign and is weakly significant. This implies that the
relative employment opportunities of contract workers shrink as the firm size expands. The
inter-industry variations in the ratio of contract to regular workers seem to be not related with
the differences in wage rates between these workers. Wa/Wb has a negative effect but it is not
significantly different from zero.

23
Table-6 Impact of Trade, Technology, and Foreign Investment on Contract Pattern of Employment Dependent variable: Ratio of man-days worked by contract to regular worker
Independent Variable Coefficients (t-value)
Fully Standardized Coefficients
IMP -0.000020 (1.09) -0.0396
EXP 0.000756 (1.04) 0.2042
RDINT -0.033578** (2.50) -0.1828
FTINT -0.000309 (0.04) -0.0037
KLINT 0.713627*** (3.97) 0.3786
FDI -0.005876* (1.66) -0.1944
AGE 0.001854 (0.73) 0.0785
SIZE -0.000028* (1.68) -0.1174
Wa/Wb -0.098395
(1.07) -0.1104
2001YDummy 0.046712 (1.49) 0.1149
2002YDummy 0.095986** (2.47) 0.2324
Constant 0.179587* (1.84)
F(11, 127) 17.73 Prob > F 0.0000 R-squared 0.24 Observations 139 No. of Industries 50 Note: Robust t-statistics in parentheses; * significant at 10%; ** significant at 5%; *** significant at 1%; 2000 has been treated as base year in the estimation. In the case of contract patterns a total of four factors- RDINT, KLINT, FDI and SIZE- are
observed to be the significant contributors. A comparison of absolute value of standardized
coefficients reveals that KLINT has been the strong predictor of the employment gap between
contract and regular workers. It is followed by FDI, RDINT and SIZE in that order.
Unskilled Pattern The relationship between trade and unskilled employment pattern is observed to be largely
positive for Indian organized manufacturing. Both the IMP and EXP turn out with a positive
sign and is significant for IMP. The performance of IMP contradicts the postulated negative
relationship. This positive role import competition suggests that Indian industries have relied
more on unskilled workers rather than skilled workers to meet the import challenges. The main

24
motivation may be to reap cost advantage, as wage rate of unskilled is far lower than that of
skilled workers. For 1999-00, unskilled worker had a weekly wage rate of Rs. 78.3 that is nearly
half of the wage rate of skilled workers (Rs. 164.2).
All the three measures of technology have predicted negative signs and are significant in the
case of FTINT and KLINT. This is an interesting result, which suggests indigenous
technological efforts in a labour-surplus economy like India may have least skill-bias
employment effect when compared to foreign technology imports and capital-intensity. The
main sources of the observed skill-biased technological change in Indian manufacturing by Unni
and Rani (2005) appear to have largely led by greater mechanization and imports of foreign
technologies rather by indigenous R&D.
Foreign investment seems to be a major factor in shifting employment pattern in favour of
skilled workers in organized section of Indian manufacturing. FDI has a predicted negative sign
and is statistically significant. It seems that foreign firms with their capital-and skill-intensive
technologies tend to employ more of skilled workers relative to unskilled workers. AGE also
emerged as another factor contributing significantly and positively to the unskilled pattern.
Other things being equal, increases in firm age increases relative employment of unskilled
workers. This result is consistent with the hypothesis that younger enterprises having new
technologies are likely to employ less of unskilled workers per skilled workers as compared to
older enterprises who may be slow in adopting the new technologies. SIZE, although has a
negative sign is statistically not different from zero.
The relationship between relative wage rate and unskilled pattern is observed to be positive and
significant which is not in accordance with prior postulation. This positive association might
have been due to two factors. First, Indian industries seems to have employed more of unskilled
workers even when their relative wage rate has increased marginally as there is still a large gap
between the wage rate of unskilled and skilled workers. Second, supply of unskilled workers is
near elastic in India whereas that of skilled workers is inelastic at a point of time and given the
shortages of skilled workers might have led industries employ more of unskilled workers
available abundantly. While these two factors may have contributed towards a positive
relationship between relative wage rate and skill pattern, further research is needed to fully
understand the issue.
For unskilled patterns a total of six variables are found to be significant predictors- IMP, FTINT,
KLINT, FDI, AGE and Wa/Wb. Among these variables, FTINT has been observed to possess the

25
largest absolute value in the standardized coefficient vector. Thus, the most of the variations in
unskilled to skilled employment ratio can be ascribed to imports of disembodied foreign
technology. In terms of relative contribution, AGE comes next followed by Wa/Wb, FDI, IMP
and KLINT.
Table-7 Impact of Trade, Technology, and Foreign Investment on Unskilled Pattern of Employment Dependent variable: Ratio of man-days worked by unskilled to skilled worker
Independent Variable Coefficients (t-value) Fully Standardized Coefficients
IMP 0.000984** (2.25) 0.1540
EXP 0.002635 (1.42) 0.1520
RDINT -0.108160 (1.55) -0.1268
FTINT -0.253208*** (2.80) -0.3154
KLINT -2.877667* (1.86) -0.1241
FDI -0.041266** (2.38) -0.2060
AGE 0.031066** (2.22) 0.3037
SIZE -0.001169 (0.92) -0.1033
Wa/Wb 0.578278**
(2.54) 0.2698
2000YDummy 0.073750 (0.39) 0.0455
Constant 0.830805** (2.21)
F(10, 47) 16.61 Prob > F 0.0000 R-squared 0.51 Observations 58 No. of Industries 31 Note: Robust t-statistics in parentheses; * significant at 10%; ** significant at 5%; *** significant at 1%; 1994 has been treated as base year in the estimation. 5. Concluding Remarks Employment pattern measuring disparity in employment opportunities among different groups
in the labour market has been a major policy issue across countries including India. With the
implementation of economic reforms since 1991, India’s openness to trade, foreign technology
and FDI has been increasing significantly. In this context of increasing globalization, analyzing
how the employment effects of trade, technology and FDI are distributed among different

26
groups like women vis-à-vis men workers, contract vis-à-vis regular workers and unskilled vis-
à-vis skilled workers has become particularly relevant.
The study begins by analyzing industrial distribution of different pattern of employment in
Indian organized manufacturing. Women employment is characterized by a high degree of
industrial concentration in a handful of industries. The magnitude of concentration has grown by
a considerable extent since late 1990s, with increasing number of women workers being
absorbed in those few sectors already over-representing them. When compared to employment
opportunities between women and men workers, Indian organized manufacturing has a very
high level of employment disparity with women workers getting just one-fourth of what their
men counterparts get, although this disparity is observed to be decreasing during recent years.
Contract workers in Indian organized manufacturing are observed to be heavily concentrated in
just one industry (tobacco products) but are widely spread among rest of the industries. As
observed in the case of women workers, there industrial concentration has been rising for
contract workers since late 1990s. The reliance of Indian industries on contract workers has
increased with increasing hiring of contract workers relative to regular workers between 1995-
96 and 2001-02. However, the gap between contract and regular workers in terms of number of
employment is still high with contract workers getting jobs just one-fourth of what regular
workers are receiving.
Unlike women workers and contract workers who show a high degree of concentration in a few
industries, unskilled workers are found more evenly distributed across industries. They form a
majority in total industrial workforce as well as in individual industries. In terms of relative
employment generation, there has been a tendency of Indian industries shedding unskilled
workers in favour of skilled workers in recent years.
After discussing the industrial pattern of different workers, we proceeded to examine the role of
trade, technology and FDI in affecting three chosen patterns of employment. An empirical
framework was developed which included six variables of our interest, two of them relate to
trade (export and import), three concerns to technology (R&D, foreign technology imports and
capital intensity), and one measuring foreign investment. Besides, the firm size, age and relative
wage rate has been integrated in the empirical framework. Then the model was estimated for a
sample of Indian industries and a number of interesting findings were obtained. Table-8
provides a summary of key findings on the role of different independent variables in affecting
employment patterns in Indian organized manufacturing.

27
Table-8 Summary results on independent variables explaining employment patterns Sign of coefficients and their significance level
Employment Patterns Independent variable Proxy Gender Contract Skill
Import (IMP) (-) (-) (+)** Trade Exports (EXP) (+)* (+) (+) In-house R&D (RDINT) (-) (-)** (-) Foreign technology import (FTINT) (-) (-) (-)*** Technology
Capital-intensity (KLINT) (-)*** (+)*** (-)* Foreign Investment Average Foreign Ownership (FDI) (-) (-)* (-)** Firm Age Average Age in Years (AGE) (-)** (+) (+)** Firm Size Average Sales (SIZE) (+)* (-)* (-) Relative Wage Rate Relative Wage Rate (Wa/Wb) (-)*** (-) (+)** Year Dummy 2000YDummy (+) Year Dummy 2001YDummy (+) (+) Year Dummy 2002YDummy (+) (+)** Note: * significant at 10%; ** significant at 5%; *** significant at 1%
As far as generating employment opportunity is concerned trade seems to have an overall
positive impact on women relative to men workers and unskilled relative to skilled workers.
While exports are behind increased women employment, imports are driving unskilled
employment. The segregation of workers between contract and regular appears to be least
affected by trade. Therefore, trade has been an important factor that has benefited two
vulnerable groups in Indian labour markets namely women and unskilled workers by relatively
improving their access to employment opportunities.
The analysis provides partial support for the argument that technology has a gender-bias in the
labour market. While none of the negative effects of indigenous R&D and foreign technology
imports were significant as explanators, capital intensity was significant with its negative sign.
This suggests that only in the form of automation that technological change affects women
workers unfavorably as compared to men workers. In the case of contract workers, technology
through indigenous R&D plays a negative role but through capital intensity it has perform
positively. Summing up both these negative and positive effect using their standardized
coefficients, which are respectively -0.1828 and 0.3786, results in a net positive effect of 0.1958.
Thus, the overall effect of technology seems to be positive for contract workers relative to
regular workers. For unskilled workers the impact of technology in the form of foreign
technology imports and capital intensity has been mostly negative.
The empirical findings on FDI are in tune with the predictions built in the analytical framework.
Foreign investment with its skill-biased technologies was found to have a negative role on the
contract and skill employment pattern in Indian organized manufacturing. Entry of foreign

28
firms, thus, can be seen to squeeze relative employment opportunities of contract as well as
unskilled workers.
Firm age has emerged as a crucial factor affecting the gender and skill patterns of employment.
Indian industries with older firms seem to have a lower preference to employ women as
compared to men workers. They also have a higher recruitment drive for unskilled workers
when compared to skilled workers. These results are in accordance with our prediction that start-
ups with their new vintage of capital equipments and management strategies have been more
dependent on skilled workers than unskilled workers. It may be that older firms are relatively
slow in replacing their old capital equipments and in adopting new management practices. Large
firm size is found to be associated with relatively higher employment opportunities for female
than male and with relatively lower jobs for contract workers than regular workers.
Relative wage rate has been an important contributing factor in the employment disparity
between female and male workers. Results indicate that Indian industries tends to employ more
female workers only when their wage rate get depressed further down than wage rate of their
male counterparts. This strongly support the hypothesis that women’s employability as a worker
rest significantly on low pay that they receive. However, increasing relative wage rate and
unskilled pattern have been positively related, suggesting that Indian industries continue to
employ more of unskilled workers even though they are becoming relatively costly compared to
skilled workers.
What are the likely policy implications that emerge from this study? India’s implementation of
economic reforms has generated vocal reactions from different trade unions, political groups
affiliated to both left and right ideologies (e.g. Swadeshi Jagaran Manch), and a section of
academic professionals alike. They had expressed concerns that reduction of import tariffs
signals dying of labour-intensive domestic firms and thus significant employment losses.
Particularly, weaker worker groups in the labour markets like women, contract and unskilled
workers are predicted with harmful future from import competition. This study shows that such
apprehensions have not become reality for these groups and in fact the net effect of trade has
been potentially beneficial for them at least in the case of organized sector of Indian
manufacturing.
Two of the disadvantaged workers groups namely women and unskilled workers seems to have
been negatively affected by specific modes of technological change. Promotion of in-house
R&D as a means of technological improvement appears to be the best strategy to ensure that

29
women and unskilled workers do not get negatively affected. Measures encouraging imports of
foreign technology and/or physical capital accumulation seems to have been detrimental for
women and/or unskilled workers. Therefore, India need to prepare an incentive-based
technology policy which favour indigenous R&D over technology imports from abroad or
capital goods accumulation to ensure that jobs environment for women and unskilled workers
does not turn hostile.
Foreign ownership has a strong negative impact on contract and unskilled workers. Hence,
government should identify sectors where levels of FDI are significant. Then the role of
government should specifically target contract and unskilled workers operating in such sectors
with a view to promote their skills through special training programmes and centers from them.
Enhancing the endowment of skills possessed by contract and unskilled workers is the best way
of ensuring that foreign investment does not produce a negative impact on their employment
opportunities.

30
Reference Acemoglu, D. (2002) ‘Directed Technical Change’, Review of Economic Studies, 69 (4), pp.
781-809. Agarwal, J. P. (1976) ‘Factor Proportions in Foreign and Domestic Owned Firms in Indian
Manufacturing’, Economic Journal, 86, pp. 529-595. Banga, R (2005) ‘Impact of liberalization on wages and employment in Indian manufacturing
industries’, ICRIER Working Paper, No. 153. Berman, E. and S. Machin (2000) ‘Skill-Biased Technology Transfer Around the World’,
Oxford Review of Economic Policy, 16(3), pp. 12-22. Berman, E., J. Bound, and S. Machin (1998) ‘Implications of Skill-Biased Technological
Change: International Evidence’, Quarterly Journal of Economics, 113 (4), pp. 1245-1280.
Cook, R. D. (1977) ‘Detection of influential observations in linear regression’, Technometrics, 19 (1), pp. 15–18.
Currie, J. and A. Harrison (1997) ‘Trade Reform and Labor Market Adjustment in Morocco’, Journal of Labor Economics, 15, pp. S44-S71.
Doms, M. and J. B. Jensen (1998) ‘Comparing Wages, Skills, and Productivity Between Domestically and Foreign-Owned Manufacturing Establishments in the United States’, in Baldwin, R. E., R. E. Lipsey, and J. D. Richardson, eds. (1998) Geography and Ownership as Bases for Economic Accounting, Chicago: University of Chicago Press.
Driffield, N. and K. Taylor (2000) ‘FDI and the Labour Market: A Review of the Evidence and Policy Implications’, Oxford Review of Economic Policy, 16 (3), pp. 90-103.
Feenstra, R. C. and G. H. Hanson (1999) ‘The Impact of Outsourcing and High-Technology Capital on Wages: Estimates for the United States 1979-1990’, Quarterly Journal of Economics, 114 (3), pp. 907-940.
Fontana, M. (2003) ‘The gender effects of trade liberalization in developing countries: a review of the literature’, Discussion Papers in Economics, No. DP 101, University of Sussex.
Goldar, B. (2002) ‘Trade liberalization and manufacturing employment: The case of India’, Employment Paper, No. 2002/34, ILO.
Goldin, C. and L.F. Katz (1998) ‘The Origins of Technology-Skill Complementarity’, Quarterly Journal of Economics, 113 (3), pp. 693-732.
Hymer, S. (1960) The international operations of national firms: a study of direct foreign investment. PhD Dissertation, Massachusetts Institute of Technology, Massachusetts: MIT Press (1976).
Jenkins, R (1990), “Comparing Foreign Subsidiaries and Local Firms in LDCs: Theoretical Issues and Empirical Evidences”, The Journal of Development Studies, 26, pp.205-228.
Kucera, D. (2001) ‘Foreign Trade of Manufactures and Men and Women's Employment and Earnings in Germany and Japan’, International Review of Applied Economics, 15(2), pp. 129-49.
Lawrence, R. Z. and M. J. Slaughter (1993) ‘International Trade and American Wages in the 1980s: Giant Sucking Sound or Small Hiccup?’, Brookings Papers on Economic Activity: Microeconomics, 2, pp. 161-210.
Lee, C and G. Schluter (1999) ‘Effect of Trade on the Demand for Skilled and Unskilled Workers’, Economic Systems Research, 11(1), pp. 49-65.

31
Okada, A. (2004) ‘Skills Development and Interfirm Learning Linkages under Globalization: Lessons from the Indian Automobile Industry’, World Development, 32 (7), pp. 1265–1288.
Oscarsson, E. (2000) ‘Trade, Employment and Wages in Sweden 1975-93’, Research Papers in Economics, No. 2000:8, Stockholm University, Department of Economics.
Pradhan, J.P., Abraham, V. and Sahoo, M. K. (2004) ‘Foreign Direct Investment and Labour: The Case of Indian Manufacturing’, Labour & Development, 10 (1), pp. 58-79.
Revenga, A. (1995) ‘Employment and wage effects of trade liberalization: the case of Mexican manufacturing’, Policy Research Working Papers, No. 1524, The World Bank.
Robertson, R. (2004) ‘Relative Prices and Wage Inequality: Evidence from Mexico’, Journal of International Economics, 64(2), pp. 387-409.
Sachs, Jeffrey D. and Howard J. Shatz (1994) ‘Trade and Jobs in U.S. Manufacturing’, Brookings Papers on Economic Activity, 1, pp. 1-84.
Sánchez-Páramo, C. and N. Schady (2003) ‘Off and Running? Technology, Trade, and the Rising Demand for Skilled Workers in Latin America’, Policy Research Working Paper, No. 3015, The World Bank.
Singh, S. P. and R. K. Agarwal (1999) ‘Trade technology employment interface: Evidence from Indian industries’, Indian Journal of Labour Economics, 42(4), pp. 919-934.
Unni, J and U. Rani (2005) ‘Technical change and workforce in India: skill biased growth?’, Indian Journal of Labour Economics, 47(4 ), pp. 683-692.

32
Appendix Table-1 Concordance between 3 Digit NIC 1998 and 3 Digit NIC 1987 1998 NIC (3 digit) NIC 1987 (3 digit) Description Code Code Meat,Fish,Fruits,Veg oil & Fats 151 200+202+203+210+211+212
Dairy Products 152 201 Grain Mill 153 204+217+218 Food Products 154 205+206+207+209+213+214+215+219 Beverages 155 216+220+221+222+223 Tobacco 160 225+226+227+228+229
Spinning,Weaving,Finishing 171 231+232+233+234+235+240+241+242244+245+247+250+251+252+253+254+255+256+236+243+246+248+
257+258+259 M Other textiles 172 261+262+263+264+267+268+269+260 Apparel 181 265+266+292+964+294+295+296 Leather Products 191 290+293+299 Footwear 192 291+311 Wood 201 270+271+272+273+274+275+277+279 Paper & Paper Products 210 280+281+282+283 Publishing & Recording 221 284+285+286+287+288+289 Petroleum Products and fuel 231 318+319+314+315+316+317 Basic chemicals 241 300+301+302 Other chemical products 242 208+303+304+305+307+308+309 Man-made fibers 243 306 Rubber Products 251 310+312 Plastic Products 252 313 Glass Products 261 321 Non-Metal Mineral Products 269 320+321+322+323+324+325+326+327+329 Basic Iron and Steel 271 330+331+332+333+334+335+336+338+339+337 Structural Metal Products 281 340+341+352+343+344+345+346+349
General Purpose Machinery 291 356+391+354+359+393+397+399+350+351+353+357+390+392
Domestic Appliance 293 355+364+388 Office Equipment 300 358+367 Electrical Machinery 311 360+395+361+362+363+369 TV, radio, video 321 368+365+396+366 Medical Appliances 331 380 Optical Instruments/Photograph equip
332 381
Watches - Clocks 333 382 Motor Vehicles 341 373+374 Ships, Rail, Air 351 370+371+372+377 Motor Cycle-carts 359 375+376+378+379 Furniture 361 276+277+342 Other Manufacturing 369 383+384+385+386+387+389